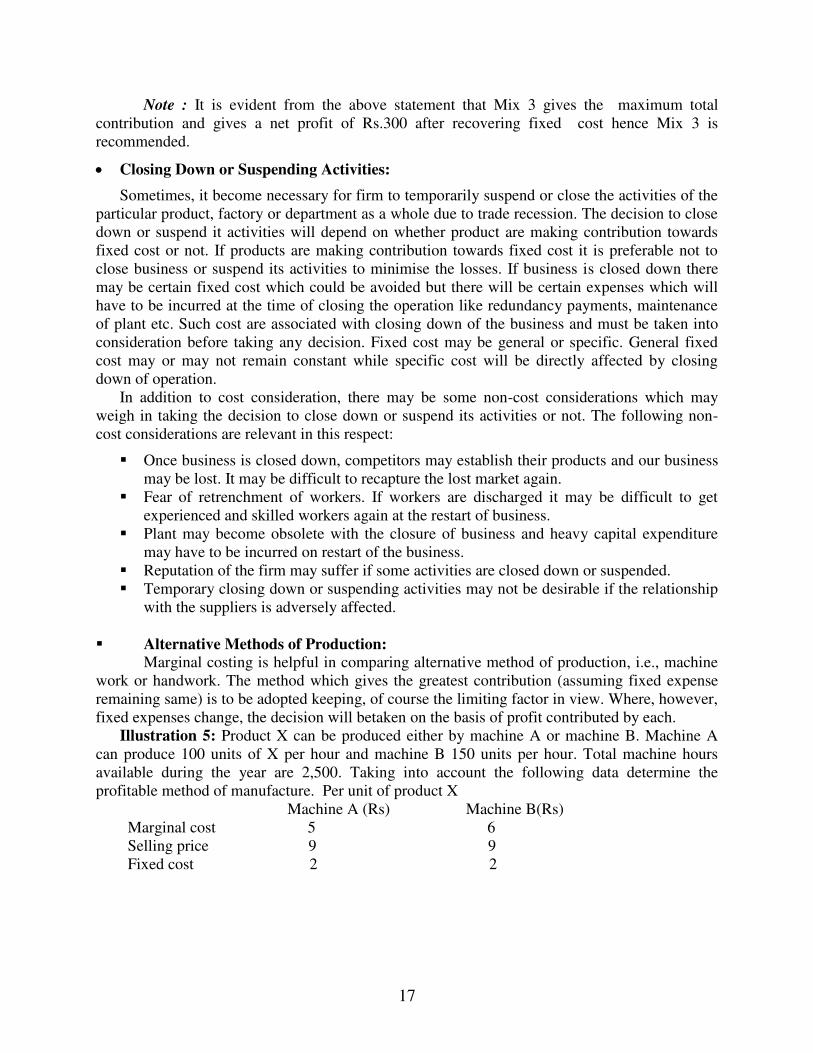
![Yazdani, G. - Ajanta. Part III [Cave VI,VII,IX,X,XI,XII,XV,XVI,XVII] (73p).pdf](https://static.fdocuments.us/doc/165x107/55cf969e550346d0338cb4fc/yazdani-g-ajanta-part-iii-cave-viviiixxxixiixvxvixvii-73ppdf.jpg)
Yazdani, G. - Ajanta. Part III [Cave VI,VII,IX,X,XI,XII,XV,XVI,XVII] (73p).pdf
Graduate Course
B.Com. (Hons.) III Year
Paper XVI : Management Accounting
Contents :
UNIT : 5
1. Management Decision Making
2. Marginal Costing and Decision Making
3. Differential Cost Analysis
UNIT : 6
1. Responsibility Accounting
2. Divisional Performance “Measurement : Financial Measures:
Editor :
Dr. N.K. Aggarwal
SCHOOL OF OPEN LEARNING UNIVERSITY OF DELHI
5, CAVALRY LANE
DELHI-110007
SESSION 2007-08 ( Copies)
© School of Open Leaning
Published by the Executive Director, School of Open Learning,
University of Delhi, 5 Cavalry Lane, Delhi-110007.
Laser typeset : S.O.L. Computer Centre
Printed at
1
UNIT 5
1
MANAGEMENT DECISION MAKING
Smriti Chawla Shri Ram College of Commerce
University of Delhi
Meaning of Decision Making
Decision-making is the process of choosing the best course of action from among
available alternative courses of action. Choice between alternative courses is an all pervading
managerial function. Managers of business concern discharge their functions only by making
decisions. Every manager regardless of level in which he operates is a decision maker. For
example cost of product is Rs.45 per unit. An export order is received at Rs. 40 per unit. Should
this order be accepted or not? The decision to be taken will be affected by cost and other factors
and cost accountant must use all information at his disposal to help management make right
decision.
Here, we are concerned with short term operating decisions such as whether to make a
component or buy it from outside supplier or whether or not to sell product at below cost. For
this marginal costing and differential cost analysis are two valuable techniques which are used
for short-term business decisions.
Steps Involved in Decision Making
The various steps involved in decision making process are:
Identify the problem or subject matter of decision:
A problem may be defined as a gap between existing or forecast condition and desired
condition. It may arise either because of an external event or an event purely internal to
business. Once the problem is known it becomes necessary to classify the same and
ascertain the relevant facts in order to make the right decision.
CHAPTER OBJECTIVES
Meaning of decision making Steps involved in Decision making Costs for Decision Making Decision making and Marginal Costing
o Fixation of Selling Prices o Effect of change in price o Maintaining a desired level of profit
(with Illustrations)
2
Identify alternative courses of action
There are various ways of achieving organisational objectives. Each of these is an
alternative. If for instance, profit is considered to be margin between sale price and cost,
the decision maker should not jump to conclusion that only way of increasing
profitability is to cut down costs. He must think of other alternatives to increase profits
such as change in product mix or make or buy a product or exploring new market etc.
The decision maker must make exhaustive list of all alternatives available.
Evaluation of alternatives
Identify the cost and benefit of each available alternative and make comparison between
them.
Selecting the best alternative and making it effective
Select the alternative which generates net maximum benefit. Moreover, people in the
organisation must be informed about the decision in order to make it effective.
Costs for Decision Making
The following are the important cost concepts used in decision-making:
(1) Relevant Costs: A relevant cost is a cost that is affected by a managerial decision.
Relevance means pertinent to decision in hand. Relevant costs for decision-making are
expected future costs that will differ under various alternatives. For example, if a decision
is to be taken whether idle capacity should be utilized or not. The costs that are relevant
in this decision are the additional cost that will be incurred for utilizing idle capacity. The
costs that are already incurred will be irrelevant costs and will be ignored for taking
decisions. Examples of relevant cost are marginal or variable cost, specific cost,
incremental costs, opportunity cost, out of pocket costs etc.
(2) Irrelevant Costs: Costs that are not affected by managerial decisions and hence are
ignored while taking decisions. Examples of irrelevant costs are general or absorbed
fixed cost, committed costs, sunk costs etc.
(3) Sunk Costs: Sunk Cost are historical costs incurred in past that cannot be changed and
over which management has no control. These costs are not relevant for decision making
about the future but they are frequently analysed in detail before decisions about future
courses of action are made. For example, in case of decision relating to replacement of a
machine, the written down value of existing machine is a sunk cost and therefore not
considered.
(4) Differential (Incremental and Decremental) Cost: It refers to the change (increase or
decrease) in total cost that occurs due to change in activity level, technology, process or
method of production etc. This cost is regarded as the difference in total cost resulting
from contemplated change.
(5) Marginal Cost: It is the additional cost of producing one additional unit and it is the
same thing as variable cost. Marginal costing is a technique of charging only variable
3
costs to products and helps in decisions like make or buy pricing of products, selection of
sales mix etc. Hence, this cost concept is of great relevance in managerial decision-
making.
(6) Imputed Costs: These are hypothetical costs which are specially computed outside the
accounting system for the purpose of decision-making. Interest on capital, rent of
premises payment for which is not actually made are examples of imputed cost.
(7) Opportunity costs: It is cost that measures the benefit that is lost or sacrificed when the
choice of one course of action requires that other alternative course of action be given up.
It is pure decision-making cost. For example, a company deposited Rs.1 lakh in bank at
10% p.a interest. Now it considers to invest this amount in debentures where yields is
17%. If company decides to invest in debentures it will have to forego bank interest of
Rs. 10000 p.a which is an opportunity cost.
(8) Replacement Cost: It is current market cost of replacing assets. For example: a
machinery purchased in 1990 at Rs. 10000 is discarded in 1998 and new machinery of
same type is purchased for Rs.15000. So, the replacement cost of machinery is Rs.15000.
(9) Out of pocket costs: out of pocket costs ate those costs that involve cash outlays which
may be either fixed or variable. It is frequently used as an aid in make or buy decisions,
price fixation during depression. Examples are wages, material cost, and insurance.
Depreciation on plant and machinery does not involve any cash outlay.
Decision Making and Marginal Costing
Marginal costing technique is used in providing assistance to the management in vital
decision making, especially in dealing with the problems requiring short-term decisions where
fixed costs are excluded. The following are important areas where managerial problems are
simplified by the use of the marginal costing.
Fixation of selling price
Effect of change in price
Maintaining desired level of profit
Key or Limiting Factor
Make or Buy Decision
Selection of Suitable product mix
Closing down or suspending activities
Alternative methods of production
Fixation of Selling Price
Although prices are more controlled by market conditions and other economic factors
than by decisions of management yet fixation of selling prices is one of the most important
functions of management. This function is to be performed:
a) Under normal circumstances
b) In times of competition
c) In times of trade depression
4
d) In accepting additional orders for utilizing idle capacity
e) In exporting and exploring new markets
In normal circumstances the price fixed must cover total cost, as otherwise profits cannot
be earned but under other circumstances, products may have to be sold at a price below total
cost, if such a step is necessary to meet the situation arising due to competition, trade depression,
additional orders for utilising spare capacity, exploring new markets etc. Thus, in special
circumstances, price may be below total cost and it should be equal to marginal cost plus certain
amount (if possible).
Pricing in Depression: Prices fall during depression and product may be sold below total
cost. In case there is serious but temporary fall in the demand on account of depression leading to
the need for a drastic reduction in prices temporarily, the minimum selling price should be equal
to marginal cost. If the selling price at which the goods can be sold is equal to marginal cost or
more than marginal cost the product should be continued. Fixed expenses will be incurred even if
product is discontinued during depression for a short period. If the product can be sold at a price
which is little more than marginal cost, loss on account of fixed expenses will reduce because
price will recover fixed expenses to some extent.
If the selling price is below the marginal cost, loss will be more than the fixed costs
because variable expenses will not be recovered fully. Hence, efforts should be made to sell the
product at a price which is equal to marginal cost or more than marginal cost. Production should
be discontinued if the price obtained is below the marginal cost so that loss may not be more than
the fixed costs.
Selling Price Below the Marginal Cost
In the following circumstances production may be continued even if the selling price is
below the marginal cost.
1. When a new product is introduced in the market.
2. When foreign market is to be explored to earn foreign exchange.
3. When concern has already purchased large quantities of materials.
4. When sales of one product at a price below the marginal cost will push up the sales of
other profitable products.
5. When employees cannot be retrenched.
6. When competitors are to be eliminated from the market.
7. When the goods are of perishable nature.
Accepting Additional Orders, Exploring Additional Markets and Exporting
When additional orders are accepted or additional markets explored at a price below
normal price to utilise idle capacity, it should be very carefully seen that they will not affect the
normal market and goodwill of the company. The order from local merchant should not be
accepted at a price below normal price because it will affect relationship of concern with other
customers purchasing the goods at normal price. In case of foreign markets, goods may be sold at
a price below normal price keeping in view the direct and indirect benefits of exporting such as
import quotas, subsidies of government.
Factors to be considered before Launching a Product in the New Market
(1) Whether the firm has surplus capacity to meet the new demand.
(2) The price offered by the new market or expected to be realised should fully recover
variable cost plus additional expenditure to be incurred in launching product in the new

5
market. Over and above this price should earn a profit margin considered appropriate by
the producer depending on market conditions and marketing strategy.
(3) Lower price charged in the new market, domestic or foreign, should not adversely affect
price or demand in existing market. Goods sold at lower price in the new market should
not be dumped back in the existing market.
Illustration 1: MM Company Limited produces a single product. Its selling price and
production cost per unit as under:
Output 40,000 units
Rs.
Material cost 4.00
Labour cost 4.00
Variable overhead 2.00
Fixed expense 4.00
Total Cost 14.00
Due to depression, the company is not able to sell at the existing selling price of Rs.16 per unit.
However, it is possible to sell the total output of 40,000 units at Rs.12 per unit.
You are required to advise whether the company should sell at Rs.12 per unit or close the
factory.
Solution:
Profit Statement if output is sold at Rs. 12 per unit
Sales : 40000 @ Rs. 12 per unit 4,80,000
Less : Variable cost @ Rs.10 per unit
(Rs.4 + Rs. 4 + Rs.2) 4,00,000
Contribution 80,000
Less : Fixed cost
(40,000 x Rs.4) 1,60,000
Loss (80000)
If company sells at Rs.12 per unit it will suffer a loss of Rs.80,000. However, if the
company discontinues the production it will suffer a loss of Rs.160,000 on account of fixed costs
which cannot be avoided during the period of closure of factory. It is therefore advantageous to
sell at Rs.12 per unit even though it is below the total cost of Rs.14 per unit Any price above the
marginal cost will reduce loss and therefore should be acceptable.
Illustration 2: The Everest Snow Company manufacturers and sells direct to customers
10,000 jars of ‘Everest Snow’ per month at Rs. 1.25 per jar. The company’s normal production
capacity is 20,000 jars and snow per month. Analysis is of cost for 10,000 jars show:
Direct Material 1,000
Direct Labour 2,475
Power 140
Misc. Expense 430
Jars 600
Fixed expenses of manufacturing,
Selling and administration 7,955
Total Rs. 12,600
6
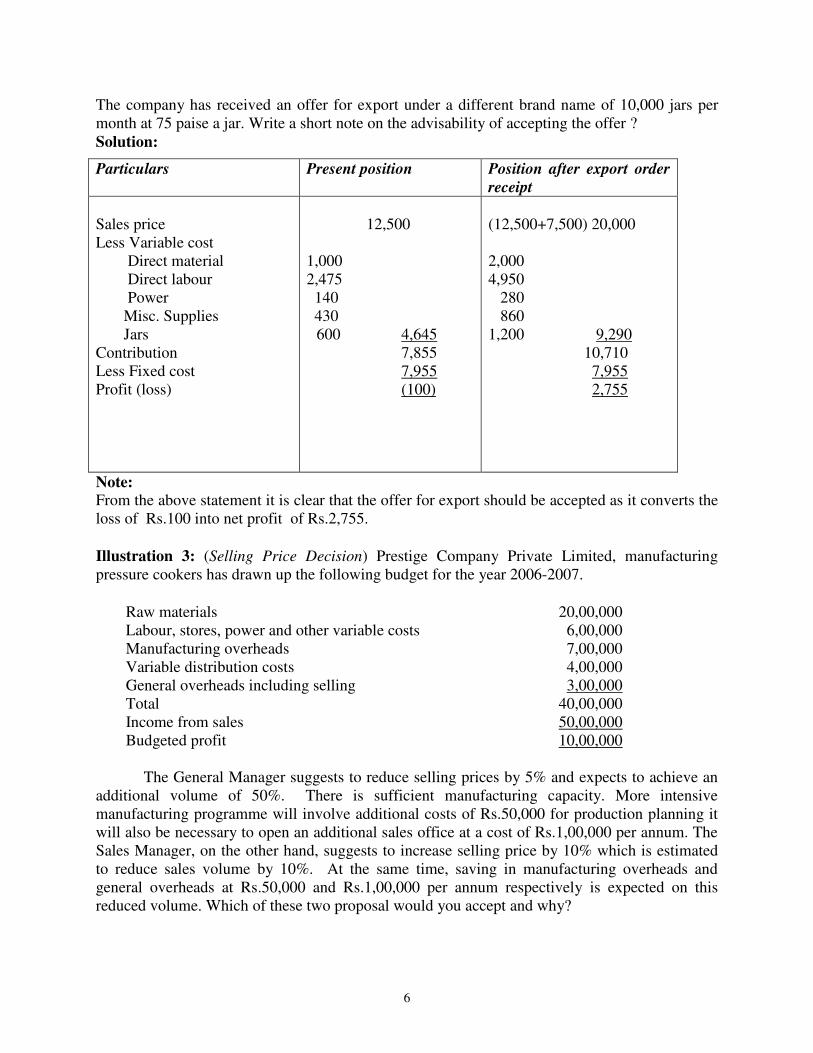
The company has received an offer for export under a different brand name of 10,000 jars per
month at 75 paise a jar. Write a short note on the advisability of accepting the offer ?
Solution:
Particulars
Present position
Position after export order
receipt
Sales price
Less Variable cost
Direct material
Direct labour
Power
Misc. Supplies
Jars
Contribution
Less Fixed cost
Profit (loss)
12,500
1,000
2,475
140
430
600 4,645
7,855
7,955
(100)
(12,500+7,500) 20,000
2,000
4,950
280
860
1,200 9,290
10,710
7,955
2,755
Note:
From the above statement it is clear that the offer for export should be accepted as it converts the
loss of Rs.100 into net profit of Rs.2,755.
Illustration 3: (Selling Price Decision) Prestige Company Private Limited, manufacturing
pressure cookers has drawn up the following budget for the year 2006-2007.
Raw materials 20,00,000
Labour, stores, power and other variable costs 6,00,000
Manufacturing overheads 7,00,000
Variable distribution costs 4,00,000
General overheads including selling 3,00,000
Total 40,00,000
Income from sales 50,00,000
Budgeted profit 10,00,000
The General Manager suggests to reduce selling prices by 5% and expects to achieve an
additional volume of 50%. There is sufficient manufacturing capacity. More intensive
manufacturing programme will involve additional costs of Rs.50,000 for production planning it
will also be necessary to open an additional sales office at a cost of Rs.1,00,000 per annum. The
Sales Manager, on the other hand, suggests to increase selling price by 10% which is estimated
to reduce sales volume by 10%. At the same time, saving in manufacturing overheads and
general overheads at Rs.50,000 and Rs.1,00,000 per annum respectively is expected on this
reduced volume. Which of these two proposal would you accept and why?

7
Solution:
Comparative Statement of Budgeted Profit
Proposal I
Rs.
Proposal II
Rs.
Sales 71,25,000 49,50,000
Cost of Sales:
Raw materials
Labour, stores, power and other variable costs
Manufacturing overheads
Variable distribution cost
General overheads including selling
Total
30,00,000 18,00,000
9,00,000 5,40,000
7,50,000 6,50,000
6,00,000 3,60,000
4,00,000 2,00,000
56,50,000 35,50,000
Profit (Sales – Cost of sales) 14,75,000 14,00,000
Conclusion: Proposal I gives a larger profit of Rs.14,75,000 and thus should be accepted.
Working Notes
Sales: Proposal I Rs. 50,00,000 x 000,25,71.Rs100
150x
100
95
II Rs. 50,00,000 x 000,50,49.Rs100
90x
100
110
Raw material: Proposal I Rs. 20,00,000 + 50% = Rs. 30,00,000
II Rs. 20,00,000 - 10% = Rs. 18,00,000
Labour etc.: Proposal I Rs.6,00,000 + 50% = Rs. 9,00,000
II Rs. 6,00,000 - 10% = Rs. 5,40,000
Effect of Change in Sales Price
Management is confronted with the problem of cut in prices of products from time to time
on account of competition, expansion programmes or government regulations. It is therefore
necessary to know the effect of a cut in selling price per unit will be that contribution per unit
will reduce.
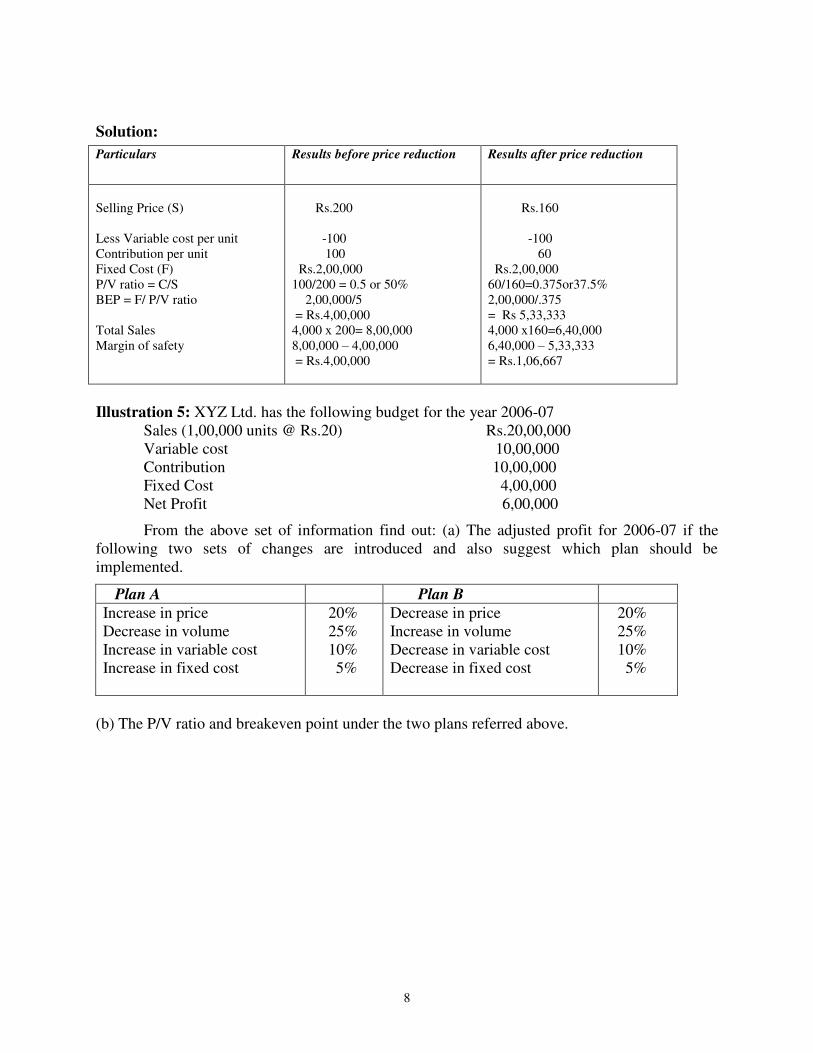
Illustration 4: The selling price of a product was Rs. 200 per unit, as against its variable
cost of Rs.100 per unit. Total fixed costs were Rs.2,00,000. Calculate the effect of a reduction in
price by Rs. 40 on the P/V ratio, break-even point and margin of safety, if 4000 units were
produced and sold.
8
Solution:
Particulars
Results before price reduction Results after price reduction
Selling Price (S)
Less Variable cost per unit
Contribution per unit
Fixed Cost (F)
P/V ratio = C/S
BEP = F/ P/V ratio
Total Sales
Margin of safety
Rs.200
-100
100
Rs.2,00,000
100/200 = 0.5 or 50%
2,00,000/5
= Rs.4,00,000
4,000 x 200= 8,00,000
8,00,000 – 4,00,000
= Rs.4,00,000
Rs.160
-100
60
Rs.2,00,000
60/160=0.375or37.5%
2,00,000/.375
= Rs 5,33,333
4,000 x160=6,40,000
6,40,000 – 5,33,333
= Rs.1,06,667
Illustration 5: XYZ Ltd. has the following budget for the year 2006-07
Sales (1,00,000 units @ Rs.20) Rs.20,00,000
Variable cost 10,00,000
Contribution 10,00,000
Fixed Cost 4,00,000
Net Profit 6,00,000
From the above set of information find out: (a) The adjusted profit for 2006-07 if the
following two sets of changes are introduced and also suggest which plan should be
implemented.
Plan A Plan B
Increase in price
Decrease in volume
Increase in variable cost
Increase in fixed cost
20%
25%
10%
5%
Decrease in price
Increase in volume
Decrease in variable cost
Decrease in fixed cost
20%
25%
10%
5%
(b) The P/V ratio and breakeven point under the two plans referred above.
9
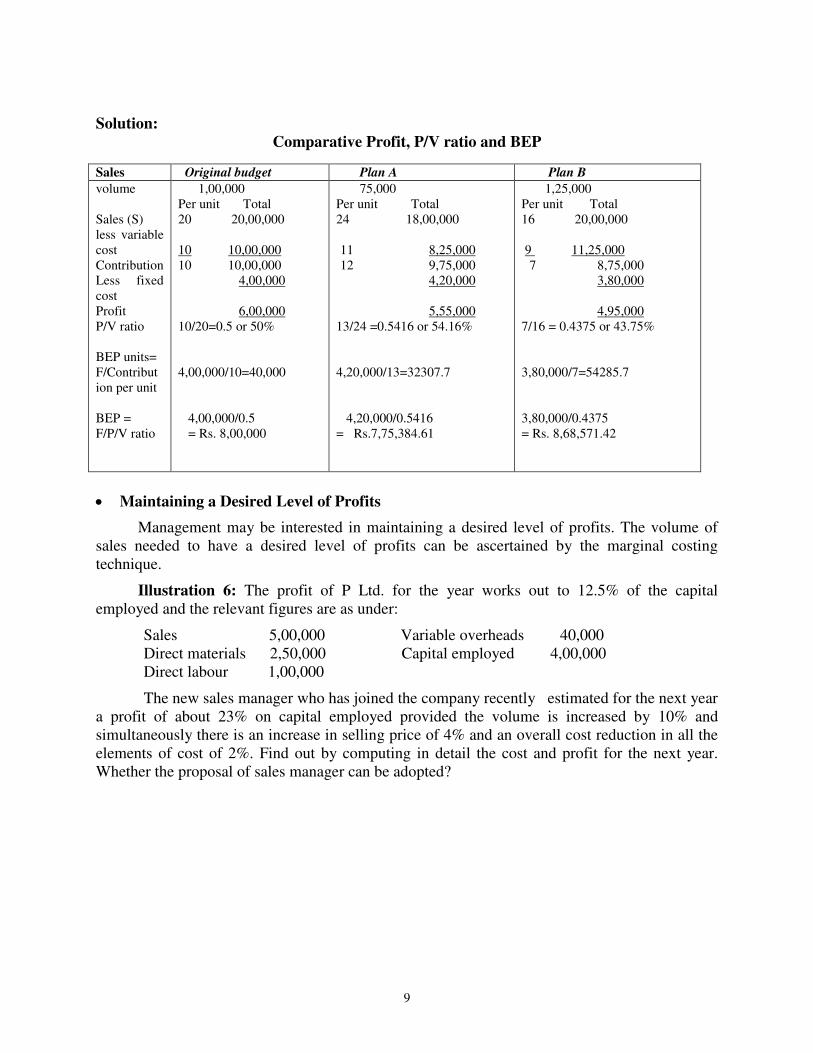
Solution:
Comparative Profit, P/V ratio and BEP
Maintaining a Desired Level of Profits
Management may be interested in maintaining a desired level of profits. The volume of
sales needed to have a desired level of profits can be ascertained by the marginal costing
technique.
Illustration 6: The profit of P Ltd. for the year works out to 12.5% of the capital
employed and the relevant figures are as under:
Sales 5,00,000 Variable overheads 40,000
Direct materials 2,50,000 Capital employed 4,00,000
Direct labour 1,00,000
The new sales manager who has joined the company recently estimated for the next year
a profit of about 23% on capital employed provided the volume is increased by 10% and
simultaneously there is an increase in selling price of 4% and an overall cost reduction in all the
elements of cost of 2%. Find out by computing in detail the cost and profit for the next year.
Whether the proposal of sales manager can be adopted?
Sales Original budget Plan A Plan B
volume
Sales (S)
less variable
cost
Contribution
Less fixed
cost
Profit
P/V ratio
BEP units=
F/Contribut
ion per unit
BEP =
F/P/V ratio
1,00,000
Per unit Total
20 20,00,000
10 10,00,000
10 10,00,000
4,00,000
6,00,000
10/20=0.5 or 50%
4,00,000/10=40,000
4,00,000/0.5
= Rs. 8,00,000
75,000
Per unit Total
24 18,00,000
11 8,25,000
12 9,75,000
4,20,000
5,55,000
13/24 =0.5416 or 54.16%
4,20,000/13=32307.7
4,20,000/0.5416
= Rs.7,75,384.61
1,25,000
Per unit Total
16 20,00,000
9 11,25,000
7 8,75,000
3,80,000
4,95,000
7/16 = 0.4375 or 43.75%
3,80,000/7=54285.7
3,80,000/0.4375
= Rs. 8,68,571.42
10
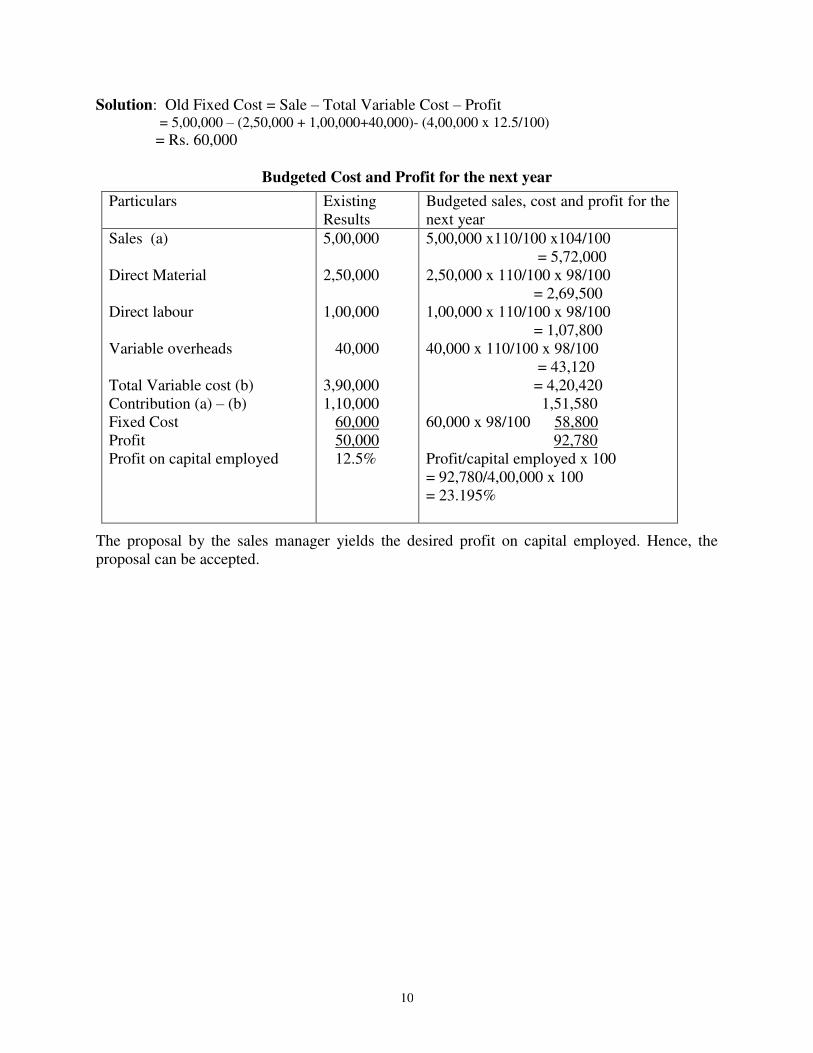
Solution: Old Fixed Cost = Sale – Total Variable Cost – Profit = 5,00,000 – (2,50,000 + 1,00,000+40,000)- (4,00,000 x 12.5/100)
= Rs. 60,000
Budgeted Cost and Profit for the next year
Particulars
Existing
Results
Budgeted sales, cost and profit for the
next year
Sales (a)
Direct Material
Direct labour
Variable overheads
Total Variable cost (b)
Contribution (a) – (b)
Fixed Cost
Profit
Profit on capital employed
5,00,000
2,50,000
1,00,000
40,000
3,90,000
1,10,000
60,000
50,000
12.5%
5,00,000 x110/100 x104/100
= 5,72,000
2,50,000 x 110/100 x 98/100
= 2,69,500
1,00,000 x 110/100 x 98/100
= 1,07,800
40,000 x 110/100 x 98/100
= 43,120
= 4,20,420
1,51,580
60,000 x 98/100 58,800
92,780
Profit/capital employed x 100
= 92,780/4,00,000 x 100
= 23.195%
The proposal by the sales manager yields the desired profit on capital employed. Hence, the
proposal can be accepted.
11
2
MARGINAL COSTING AND DECISION-MAKING
Smriti Chawla Shri Ram College of Commerce
University of Delhi
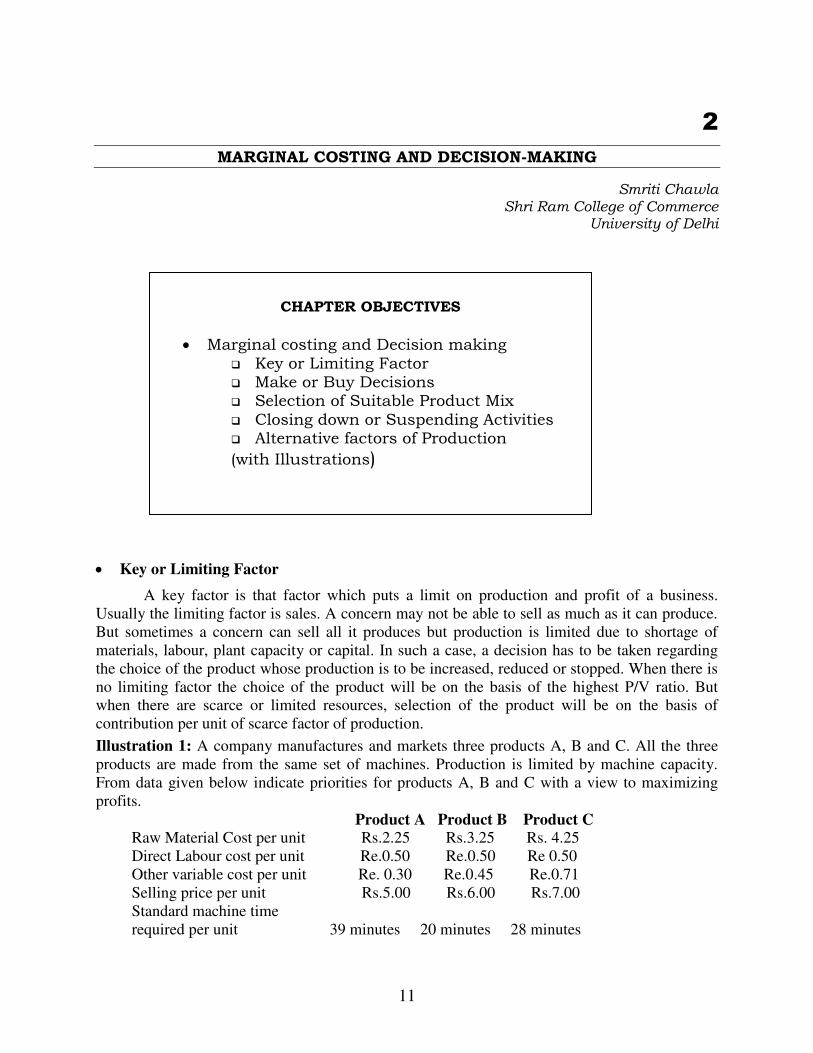
Key or Limiting Factor
A key factor is that factor which puts a limit on production and profit of a business.
Usually the limiting factor is sales. A concern may not be able to sell as much as it can produce.
But sometimes a concern can sell all it produces but production is limited due to shortage of
materials, labour, plant capacity or capital. In such a case, a decision has to be taken regarding
the choice of the product whose production is to be increased, reduced or stopped. When there is
no limiting factor the choice of the product will be on the basis of the highest P/V ratio. But
when there are scarce or limited resources, selection of the product will be on the basis of
contribution per unit of scarce factor of production.
Illustration 1: A company manufactures and markets three products A, B and C. All the three
products are made from the same set of machines. Production is limited by machine capacity.
From data given below indicate priorities for products A, B and C with a view to maximizing
profits.
Product A Product B Product C
Raw Material Cost per unit Rs.2.25 Rs.3.25 Rs. 4.25
Direct Labour cost per unit Re.0.50 Re.0.50 Re 0.50
Other variable cost per unit Re. 0.30 Re.0.45 Re.0.71
Selling price per unit Rs.5.00 Rs.6.00 Rs.7.00
Standard machine time
required per unit 39 minutes 20 minutes 28 minutes
CHAPTER OBJECTIVES
Marginal costing and Decision making Key or Limiting Factor Make or Buy Decisions Selection of Suitable Product Mix Closing down or Suspending Activities Alternative factors of Production
(with Illustrations)
12
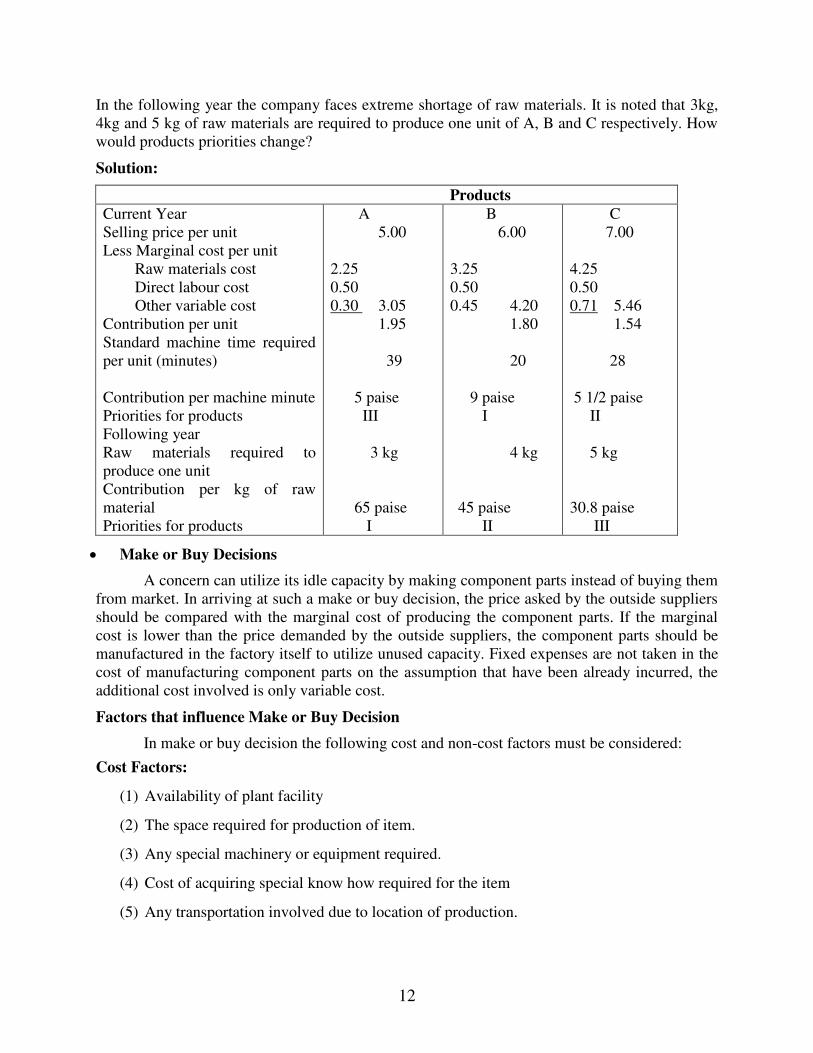
In the following year the company faces extreme shortage of raw materials. It is noted that 3kg,
4kg and 5 kg of raw materials are required to produce one unit of A, B and C respectively. How
would products priorities change?
Solution:
Products
Current Year
Selling price per unit
Less Marginal cost per unit
Raw materials cost
Direct labour cost
Other variable cost
Contribution per unit
Standard machine time required
per unit (minutes)
Contribution per machine minute
Priorities for products
Following year
Raw materials required to
produce one unit
Contribution per kg of raw
material
Priorities for products
A
5.00
2.25
0.50
0.30 3.05
1.95
39
5 paise
III
3 kg
65 paise
I
B
6.00
3.25
0.50
0.45 4.20
1.80
20
9 paise
I
4 kg
45 paise
II
C
7.00
4.25
0.50
0.71 5.46
1.54
28
5 1/2 paise
II
5 kg
30.8 paise
III
Make or Buy Decisions
A concern can utilize its idle capacity by making component parts instead of buying them
from market. In arriving at such a make or buy decision, the price asked by the outside suppliers
should be compared with the marginal cost of producing the component parts. If the marginal
cost is lower than the price demanded by the outside suppliers, the component parts should be
manufactured in the factory itself to utilize unused capacity. Fixed expenses are not taken in the
cost of manufacturing component parts on the assumption that have been already incurred, the
additional cost involved is only variable cost.
Factors that influence Make or Buy Decision
In make or buy decision the following cost and non-cost factors must be considered:
Cost Factors:
(1) Availability of plant facility
(2) The space required for production of item.
(3) Any special machinery or equipment required.
(4) Cost of acquiring special know how required for the item
(5) Any transportation involved due to location of production.
13
(6) As to labour factors like availability of required labour, sheet required and other must be
kept in view.
(7) As to overhead expenses, adoption of lease for apportioning them must be taken into
consideration including other factors.
Non-Cost Factors:
(1) In favour of making, the factors like:
Secrecy of company production
Ideal facility available
Tax considerations
Quality and stability of market supply
(2) In favour of buying factors:
Lack of capital required
Wide selection
Passing know how to suppliers or not
Uneven production of end product.
(3) The outside supplier should not be competitor.
(4) In case there are large fluctuation in demand, it is better to purchase from outside, but if
demand is likely to increase substantially own production may lead to lower cost latter.
Illustration 2: A radio manufacturing company finds that while it costs Rs.62.50 to make
component X 273 Q, the same is available in market at Rs. 57.50 each with an assurance of
continued supply. The break down of the cost is:
Cost per unit
Material 27.50
Labour 17.50
Variable overhead 5.00
Depreciation and other fixed costs 12.50
62.50
(a) Should the company make or buy the component?
(b) What would be your decision, if supplier offered the component at Rs. 48.50 each?
Solution: Compare the marginal cost of making the component with the cost of buying. It is
done below:
The marginal cost of manufacturing the component:
Material 27.50
Labour 17.50
Variable overhead 5.00
50.00
Cost of buying the component 57.50
Disadvantage in buying: Rs.57.50 – Rs.50 = Rs.7.50 per unit. Hence, the company should
make the component instead of buying. Here fixed cost are sunk cost and irrelevant for decision.
14
(b) If the component is available at Rs. 48.50 each then the option to buy will be profitable as it
will result in the saving of Rs. 1.50 per unit (Rs. 50 marginal cost of manufacture less Rs. 48.50
purchase price)
Illustration 3: (Make or Buy Decision) Auto Parts Ltd. has an annual production of
90,000 units for a motor component. The component cost structure is as below:
Materials Rs. 270 per unit
Labour (25% fixed) 180 per unit
Expenses:
Variable 90 per unit
Fixed 135 per unit
Total 675 per unit
(a) The purchase manager has an offer from a supplier who is willing to supply the component at
Rs.540. Should the component be purchased and production stopped?
(b) Assume the resources now used for this component's manufacture are to be used to produce
another new product for which the selling price is Rs.485.In the latter case the material price will
be Rs.200 per unit. 90,000 units of this product can be produced at the same cost basis as above
for labour and expenses. Discuss whether it would be advisable to divert the resources to
manufacture that new product, on the footing that the component presently being produced
would, instead of being produced, be purchased form the market.
Solution Rs.
Material 270
Labour (75% of Rs.180) 135
Variable expenses 90
Total variable cost when component is produced 495
Suppliers price 540
Excess of purchase price over variable cost = 540 – 495 = Rs.45 (a) Fixed expenses are
not affected whether the component is made or purchased. Thus company should make the
component itself because if purchased from outside it will have to pay Rs.45 per unit more and
on 90,000 units @ Rs.45 it comes to Rs.40,50,000.
(b) Cost implications of proposal to divert available production facilities for a new product:
15
Rs.
Selling price of per unit of new product 485
Less: Variable costs - Material 200
Labour 135
Expenses 90 425
Contribution per unit 60
Loss if present component is purchased = 540 – 495 = Rs.45.
If company diverts the resources for the production of a new product, it will benefit by
Rs.15 (i.e. Rs.60 – 45) per unit. On 90,000 units it will save @ Rs.15 i.e. Rs.13,50,000. Thus, it
is advisable to divert the production facilities in the manufacture of the new product and the
component presently being manufactured should be bought from outside. This will result in
additional profit of Rs.13,50,000.
Selection of Suitable product mix When a factory manufactures more than one product, a problem is faced by management as
to which product mix will give maximum profits. The best product mix is that which yields the
maximum contribution. The products which give the maximum contribution are to be retained
and their production should be increased. The products, which give comparatively less
contribution, should be reduced or closed down altogether. The effect of sales mix can also be
seen by comparing the P/V ratio and break even point. The new sales mix will be favourable if it
increases P/V ratio and reduced the break even point.
Illustration 4: A manufacturer with an overall capacity of one lakh machine hours
(interchangeable among products) has so far been producing a standard mix of 15,000 units of
product A, 10,000 units of Product B and C each. The total expenditure exclusive of fixed
charges is Rs. 2.09 lakhs and variable cost ratio among the products approximates
1:1.5:1.75respectively per unit. The fixed charges came to Rs. 2.00 per unit. When the unit
selling prices are Rs. 6.25 for A, Rs 7.50 for B and Rs. 10.50 for C, he incurs a loss. He desires
to change the product mix as under:
Mix 1 Mix 2 Mix 3
A
B
C
18,000
12,000
7,000
15,000
6,000
13,000
22,000
8,000
8,000
As an accountant what mix will you recommend ?
16
Solution:
(i) Computation of variable cost per unit
Total variable cost of Rs. 2,09,000 will be apportioned among the three products in the
following ratio:
A 15,000 x 1= Rs.15000: B 10,000 x 1.5 = Rs. 15000 C 10,000 x 1.75 = Rs. 17,500 or
6:6:7
Hence, total variable cost of each product will be
A : 2,09,000 x 6/19 = Rs.66,000
B : 2,09,000 x 6/19 = Rs.66,000
C : 2,09,000 x 7/19 = Rs.77,000
And per unit variable cost of each product:
A : 66,000/15000= Rs. 4.40 per unit
B : 66,000/10,000 = Rs.6.60 per unit
C : 77,000/ 10,000 = Rs. 7.70 per unit
(ii) Computation of contribution per unit of each product:
Product A Product B Product C
Selling price
Variable cost
Contribution
6.25
4.40
1.85
7.50
6.60
0.90
10.50
7.70
2.80
(iii) It is assumed that the fixed cost of Rs. 70,000 (35,000 unit of present mix at Rs. 2)
remains constant for all proposed mixes.
Comparative profitability statement to evaluate here product mixes.
Product
Contribu-
tion rate
per unit
Mix 1 Mix 2 Mix 3
Units Total
contribution
Units Total
contribution
Units Total
contribution
A
B
C
Contribution
Less fixed
charges
Profit(loss)
1.85
0.90
2.80
18,000 33,300
12,000 10,800
7,000 19,600
63,700
70,000
(6300)
15,000 27,750
6,000 5,400
13,000 36,400
69,550
70,000
(450)
22,000 40,700
8,000 7,200
8,000 22,400
70,300
70,000
300
17
Note : It is evident from the above statement that Mix 3 gives the maximum total
contribution and gives a net profit of Rs.300 after recovering fixed cost hence Mix 3 is
recommended.
Closing Down or Suspending Activities:
Sometimes, it become necessary for firm to temporarily suspend or close the activities of the
particular product, factory or department as a whole due to trade recession. The decision to close
down or suspend it activities will depend on whether product are making contribution towards
fixed cost or not. If products are making contribution towards fixed cost it is preferable not to
close business or suspend its activities to minimise the losses. If business is closed down there
may be certain fixed cost which could be avoided but there will be certain expenses which will
have to be incurred at the time of closing the operation like redundancy payments, maintenance
of plant etc. Such cost are associated with closing down of the business and must be taken into
consideration before taking any decision. Fixed cost may be general or specific. General fixed
cost may or may not remain constant while specific cost will be directly affected by closing
down of operation.
In addition to cost consideration, there may be some non-cost considerations which may
weigh in taking the decision to close down or suspend its activities or not. The following non-
cost considerations are relevant in this respect:
Once business is closed down, competitors may establish their products and our business
may be lost. It may be difficult to recapture the lost market again.
Fear of retrenchment of workers. If workers are discharged it may be difficult to get
experienced and skilled workers again at the restart of business.
Plant may become obsolete with the closure of business and heavy capital expenditure
may have to be incurred on restart of the business.
Reputation of the firm may suffer if some activities are closed down or suspended.
Temporary closing down or suspending activities may not be desirable if the relationship
with the suppliers is adversely affected.
Alternative Methods of Production:
Marginal costing is helpful in comparing alternative method of production, i.e., machine
work or handwork. The method which gives the greatest contribution (assuming fixed expense
remaining same) is to be adopted keeping, of course the limiting factor in view. Where, however,
fixed expenses change, the decision will betaken on the basis of profit contributed by each.
Illustration 5: Product X can be produced either by machine A or machine B. Machine A
can produce 100 units of X per hour and machine B 150 units per hour. Total machine hours
available during the year are 2,500. Taking into account the following data determine the
profitable method of manufacture. Per unit of product X
Machine A (Rs) Machine B(Rs)
Marginal cost 5 6
Selling price 9 9
Fixed cost 2 2

18
Solution:
Profitability Statement
Machine A (Rs.) Machine B (Rs.)
Selling price per unit 9 9
Less marginal cost 5 6
Contribution per unit 4 3
Output per hour 100 units 150 units
Contribution per hour 400 450
Machine hours per year 2500 2500
Annual contribution 10,00,000 11,25,000
Hence, production by machine B is more profitable.
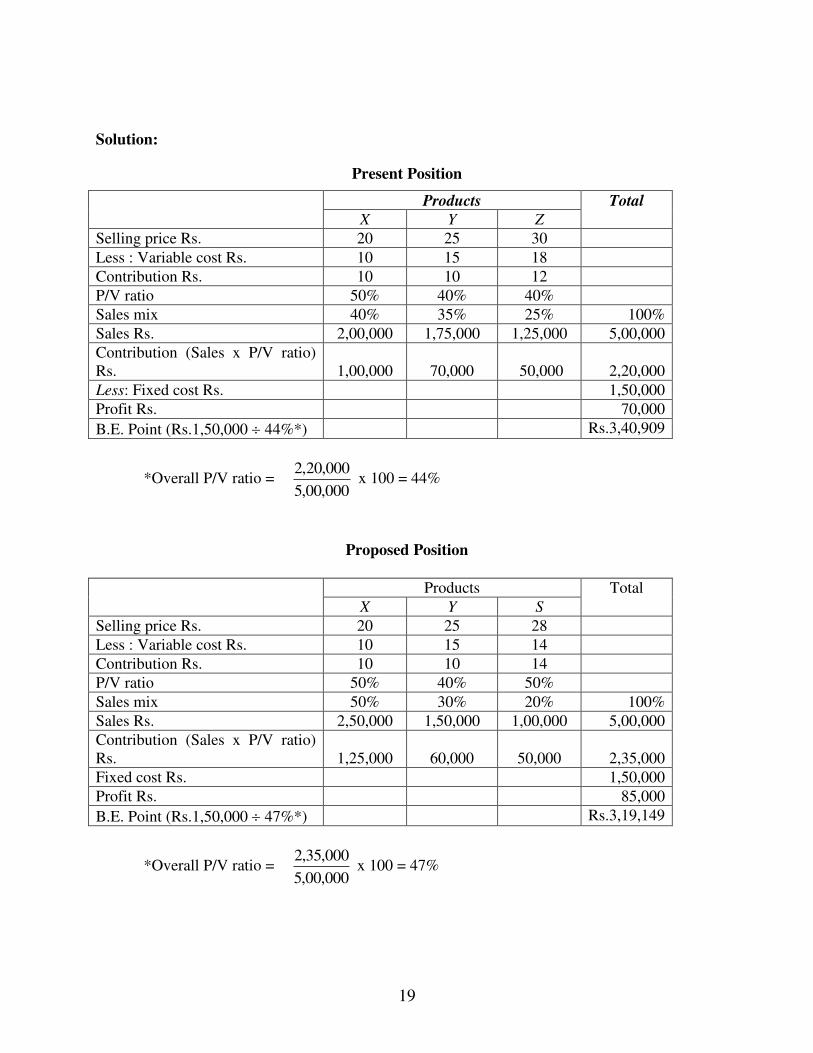
Illustration 6: (Sales Mix Decision). A multi-product company provides the following costs
and output data for the last year.
Products
X Y S
Sales mix 40% 35% 25%
Rs. Rs. Rs.
Selling price 20 25 30
Variable cost per unit 10 15 18
Total fixed cost 1,50,000
Total sales 5,00,000
The company proposes to replace Product Z by Product S. Estimated cost and output data are:
Products
X Y Z
Sales mix 50% 30% 20%
Rs. Rs. Rs.
Selling price 20 25 28
Variable cost per unit 10 15 14
Total fixed cost 1,50,000
Total sales 5,00,000
Analyses the proposed change and suggest what decision the Company should take.
19
Solution:
Present Position
Products Total
X Y Z
Selling price Rs. 20 25 30
Less : Variable cost Rs. 10 15 18
Contribution Rs. 10 10 12
P/V ratio 50% 40% 40%
Sales mix 40% 35% 25% 100%
Sales Rs. 2,00,000 1,75,000 1,25,000 5,00,000
Contribution (Sales x P/V ratio)
Rs.
1,00,000
70,000
50,000
2,20,000
Less: Fixed cost Rs. 1,50,000
Profit Rs. 70,000
B.E. Point (Rs.1,50,000 44%*) Rs.3,40,909
*Overall P/V ratio = 000,00,5
000,20,2 x 100 = 44%
Proposed Position
Products Total
X Y S
Selling price Rs. 20 25 28
Less : Variable cost Rs. 10 15 14
Contribution Rs. 10 10 14
P/V ratio 50% 40% 50%
Sales mix 50% 30% 20% 100%
Sales Rs. 2,50,000 1,50,000 1,00,000 5,00,000
Contribution (Sales x P/V ratio)
Rs.
1,25,000
60,000
50,000
2,35,000
Fixed cost Rs. 1,50,000
Profit Rs. 85,000
B.E. Point (Rs.1,50,000 47%*) Rs.3,19,149
*Overall P/V ratio = 000,00,5
000,35,2 x 100 = 47%
20
Conclusion: It may thus, be concluded that the proposed change should be acceptable
because replacement of Product Z by Product S will: (a) increase profit by Rs.15,000 (i.e.,
85,000 – 70,000); (b) bring down B.E. point from Rs.3,40,909 to Rs.3,19,149.
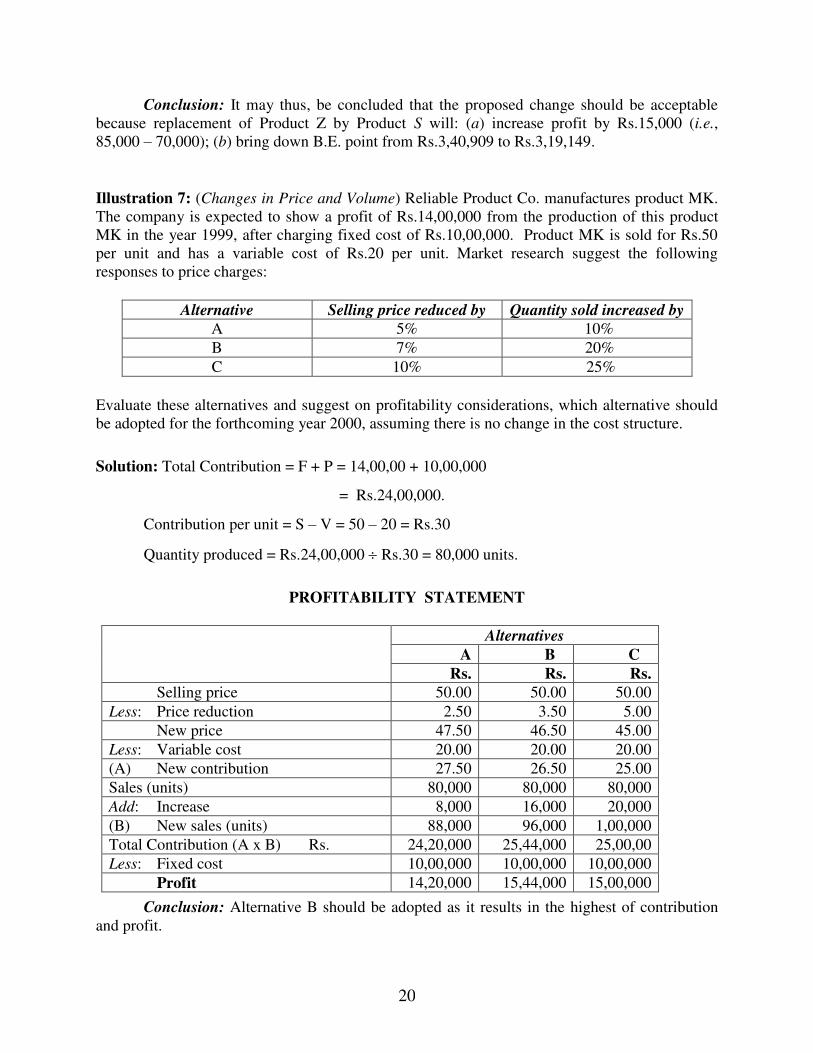
Illustration 7: (Changes in Price and Volume) Reliable Product Co. manufactures product MK.
The company is expected to show a profit of Rs.14,00,000 from the production of this product
MK in the year 1999, after charging fixed cost of Rs.10,00,000. Product MK is sold for Rs.50
per unit and has a variable cost of Rs.20 per unit. Market research suggest the following
responses to price charges:
Alternative Selling price reduced by Quantity sold increased by
A 5% 10%
B 7% 20%
C 10% 25%
Evaluate these alternatives and suggest on profitability considerations, which alternative should
be adopted for the forthcoming year 2000, assuming there is no change in the cost structure.
Solution: Total Contribution = F + P = 14,00,00 + 10,00,000
= Rs.24,00,000.
Contribution per unit = S – V = 50 – 20 = Rs.30
Quantity produced = Rs.24,00,000 Rs.30 = 80,000 units.
PROFITABILITY STATEMENT
Alternatives
A B C
Rs. Rs. Rs.
Selling price 50.00 50.00 50.00
Less: Price reduction 2.50 3.50 5.00
New price 47.50 46.50 45.00
Less: Variable cost 20.00 20.00 20.00
(A) New contribution 27.50 26.50 25.00
Sales (units) 80,000 80,000 80,000
Add: Increase 8,000 16,000 20,000
(B) New sales (units) 88,000 96,000 1,00,000
Total Contribution (A x B) Rs. 24,20,000 25,44,000 25,00,00
Less: Fixed cost 10,00,000 10,00,000 10,00,000
Profit 14,20,000 15,44,000 15,00,000
Conclusion: Alternative B should be adopted as it results in the highest of contribution
and profit.
21
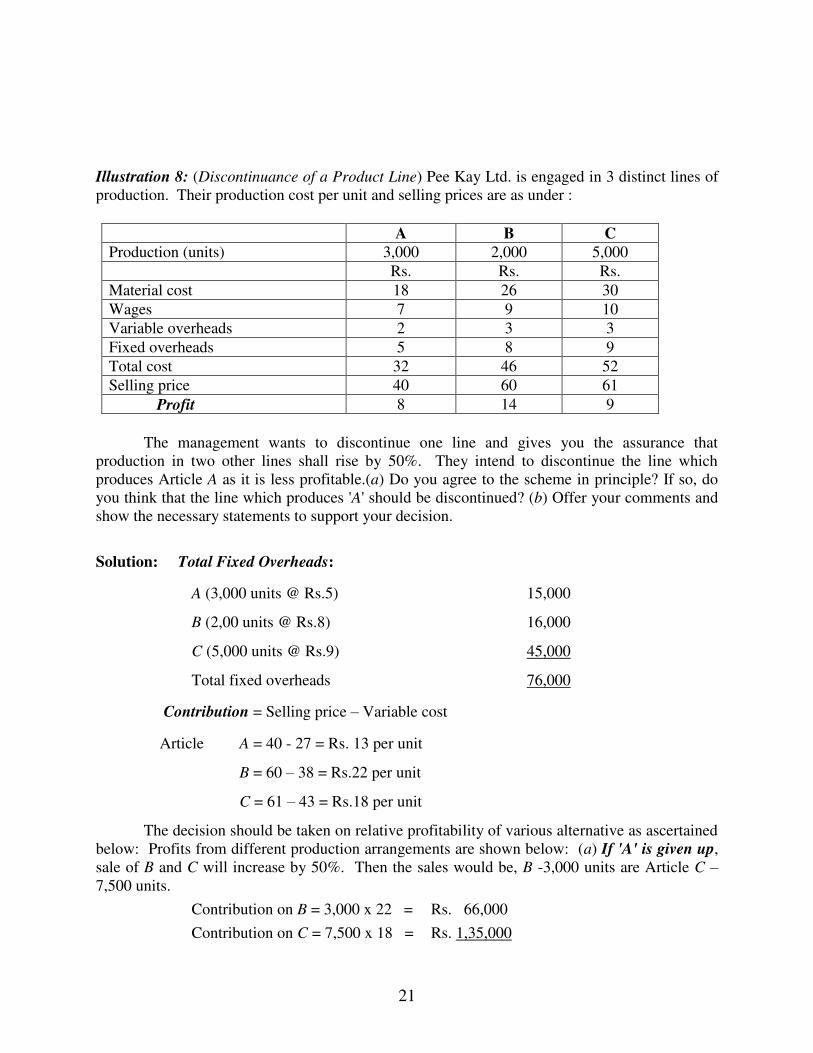
Illustration 8: (Discontinuance of a Product Line) Pee Kay Ltd. is engaged in 3 distinct lines of
production. Their production cost per unit and selling prices are as under :
A B C
Production (units) 3,000 2,000 5,000
Rs. Rs. Rs.
Material cost 18 26 30
Wages 7 9 10
Variable overheads 2 3 3
Fixed overheads 5 8 9
Total cost 32 46 52
Selling price 40 60 61
Profit 8 14 9
The management wants to discontinue one line and gives you the assurance that
production in two other lines shall rise by 50%. They intend to discontinue the line which
produces Article A as it is less profitable.(a) Do you agree to the scheme in principle? If so, do
you think that the line which produces 'A' should be discontinued? (b) Offer your comments and
show the necessary statements to support your decision.
Solution: Total Fixed Overheads:
A (3,000 units @ Rs.5) 15,000
B (2,00 units @ Rs.8) 16,000
C (5,000 units @ Rs.9) 45,000
Total fixed overheads 76,000
Contribution = Selling price – Variable cost
Article A = 40 - 27 = Rs. 13 per unit
B = 60 – 38 = Rs.22 per unit
C = 61 – 43 = Rs.18 per unit
The decision should be taken on relative profitability of various alternative as ascertained
below: Profits from different production arrangements are shown below: (a) If 'A' is given up,
sale of B and C will increase by 50%. Then the sales would be, B -3,000 units are Article C –
7,500 units.
Contribution on B = 3,000 x 22 = Rs. 66,000
Contribution on C = 7,500 x 18 = Rs. 1,35,000
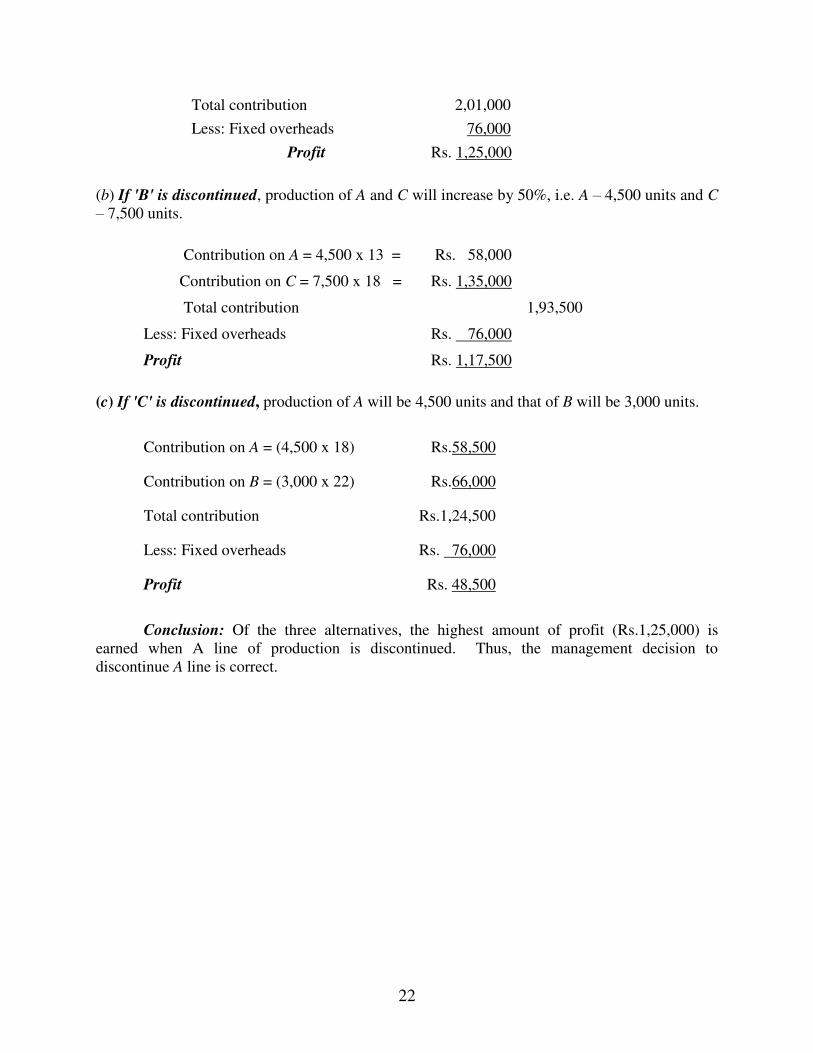
22
Total contribution 2,01,000
Less: Fixed overheads 76,000
Profit Rs. 1,25,000
(b) If 'B' is discontinued, production of A and C will increase by 50%, i.e. A – 4,500 units and C
– 7,500 units.
Contribution on A = 4,500 x 13 = Rs. 58,000
Contribution on C = 7,500 x 18 = Rs. 1,35,000
Total contribution 1,93,500
Less: Fixed overheads Rs. 76,000
Profit Rs. 1,17,500
(c) If 'C' is discontinued, production of A will be 4,500 units and that of B will be 3,000 units.
Contribution on A = (4,500 x 18) Rs.58,500
Contribution on B = (3,000 x 22) Rs.66,000
Total contribution Rs.1,24,500
Less: Fixed overheads Rs. 76,000
Profit Rs. 48,500
Conclusion: Of the three alternatives, the highest amount of profit (Rs.1,25,000) is
earned when A line of production is discontinued. Thus, the management decision to
discontinue A line is correct.

23

23
3
DIFFERENTIAL COST ANALYSIS
Smriti Chawla Shri Ram College of Commerce
University of Delhi
Meaning
Differential cost is the change in the costs which may take place due to increase or
decrease in output, change in sales volume, alternate method of production, make or buy
decisions, change in product mix etc. So, differential cost is the result of an alternative course
of action. For example, difference in costs may arise because of replacement of labour by
machinery and difference in costs of two alternative courses of action will be the differential
cost.
If change in cost occurs due to change in level of activity, differential cost is referred to
as incremental cost in case of increase in output and decremental cost in case of decrease in
output.
In differential cost analysis costs are calculated on the basis of absorption or total
costing technique, but in marginal costing technique, costs are calculated on the basis of
variable costs only and fixed costs are not taken. But if the alternate course of action does not
CHAPTER OBJECTIVES
Meaning
Characteristics of Differential Cost
Difference between Differential Cost Analysis and Marginal Costing
Practical Applications of Differential Cost Analysis Determination of Optimum level of
production Accept or Reject Decision Adding or Dropping a Product line Make or buy decisions Sell or process decisions Introduction of Additional shift
(with Illustrations)
24
involve any extra fixed costs change in variable costs will become differential costs and there
will be no difference between marginal costs and differential costs.
Differential cost is the change in cost which may result from the adoption of an alternate
course of action or change in the level of activity. Change in cost may take place due to change
in fixed costs and variable costs, so differential cost is the aggregate of changes in fixed costs
and variable costs which take place due to the adoption of an alternate course of action or
change in the level of output.
Characteristics of Differential Cost
The following are the essential characteristics of differential costs:
1. Differential cost analysis is not made within the accounting records rather it is made
outside the accounting records. Differential costs may, however, be incorporated in the
flexible budgets because they budget costs at various levels of activity.
2. Total differential costs are considered in differential cost analysis. Cost per unit is not
taken into consideration.
3. Total differential revenues are compared with total differential costs before advocating
an alternate course of action. A change in course of action is recommended only if
differential revenues exceed differential costs.
4. The items of cost which do not change for the alternatives under consideration are
ignored, only the difference in items of costs are considered because differential costs
analysis is concerned with changes in costs.
5. The changes in costs are measured from a common base point which may be a present
course of action or present level of production.
6. Differential cost analysis is related to the future course of action or future level of
output, so it deals with future costs. Historical costs or standard cots may be used but
they should be suitably adjusted to future conditions.
7. For making a choice among the various alternatives, the alternative which gives the
maximum difference between the incremental revenue and incremental cost is
recommended to be adopted.
Difference Between Differential Cost Analysis and Marginal Costing
Differential costs are often confused with marginal costs; so it is better to compare the
two to remove the confusion. The points of similarity and difference between the two are
summarized as follows:
25
Similarity
1. Both are techniques of cost analysis and cost presentation.
2. Both are used for taking managerial decisions such as effect on profits by following
changes in sales volume, product mix, price or method of production.
3. Marginal costs and differential costs are the same when there is no change in fixed costs on
account of increase or decrease in output.
Difference
1. Under marginal costing technique, fixed costs are not added to get the marginal cost of a
product whereas differential cost analysis takes into consideration changes in fixed costs
due to change in output.
2. Differential cost analysis is helpful in taking the managerial decisions and is not
incorporated in accounting records. In other words, differential costs are calculated
separately as analysis statements. On the other hand, marginal costs may be incorporated
in the accounting records.
3. Marginal costs are calculated on the basis of contribution approach whereas differential
costs may be ascertained on the basis of both absorption costing as well as marginal
costing.
4. In marginal costing, margin of contribution, contribution per unit of limiting factor and
profit-volume ratio are the main yardsticks for evaluating the managerial decisions
whereas in differential cost analysis, differential costs are compared with the differential
revenues of determine whether alternate course of action should be followed or not.
Practical Applications of Differential Costs
Many managerial decisions involving problems of alternative choices are made with the
help of differential cost analysis. Such decisions include the following:
(1) Determination of the Optimum Level of Production
The optimum level is that level of production where profit is the maximum. In order to
arrive at a decision of this type, the differential costs are compared with incremental revenue at
various levels of output. So long as the incremental revenue exceeds differential costs, it is
profitable to increase the output. But as soon as the differential cost equals or exceeds
increments revenue, it is no more profitable to increase the volume of output.
Illustration 1: A company has a capacity of producing 1,00,000 units of a certain product in a
month. The sales department reports that the following schedule of sale prices is possible:
26
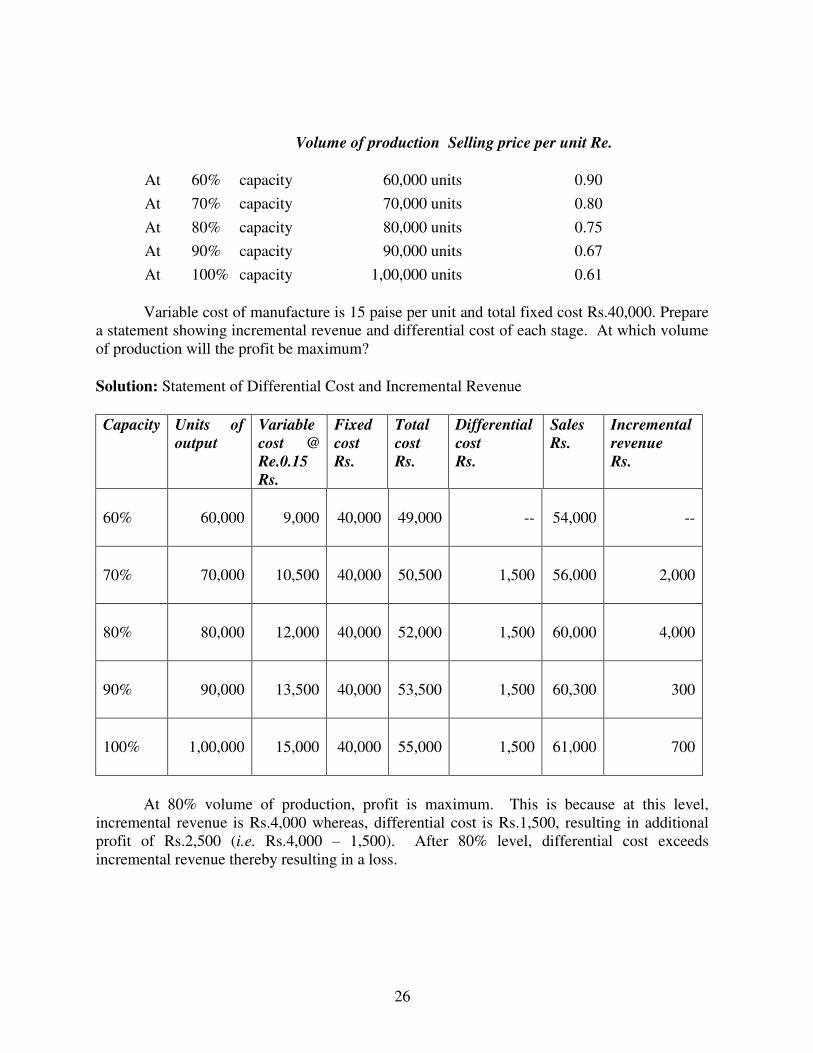
Volume of production Selling price per unit Re.
At 60% capacity 60,000 units 0.90
At 70% capacity 70,000 units 0.80
At 80% capacity 80,000 units 0.75
At 90% capacity 90,000 units 0.67
At 100% capacity 1,00,000 units 0.61
Variable cost of manufacture is 15 paise per unit and total fixed cost Rs.40,000. Prepare
a statement showing incremental revenue and differential cost of each stage. At which volume
of production will the profit be maximum?
Solution: Statement of Differential Cost and Incremental Revenue
Capacity Units of
output
Variable
cost @
Re.0.15
Rs.
Fixed
cost
Rs.
Total
cost
Rs.
Differential
cost
Rs.
Sales
Rs.
Incremental
revenue
Rs.
60% 60,000 9,000 40,000 49,000 -- 54,000 --
70% 70,000 10,500 40,000 50,500 1,500 56,000 2,000
80% 80,000 12,000 40,000 52,000 1,500 60,000 4,000
90% 90,000 13,500 40,000 53,500 1,500 60,300 300
100% 1,00,000 15,000 40,000 55,000 1,500 61,000 700
At 80% volume of production, profit is maximum. This is because at this level,
incremental revenue is Rs.4,000 whereas, differential cost is Rs.1,500, resulting in additional
profit of Rs.2,500 (i.e. Rs.4,000 – 1,500). After 80% level, differential cost exceeds
incremental revenue thereby resulting in a loss.
27
(2) Accept or Reject Decision
Sometimes a concern may receive special offers from its regular customers to sell its
regular products. Special offers may be received from the home customers for one time
quantity sales or sales to foreign customers. Such offers generally are received at lesser prices
than the usual customary prices. The decision to accept or reject special offers is based entirely
on differential cost and the contribution margin approach. The point to be considered is
whether incremental revenue is more than the differential costs to be incurred. The use of
absorption costing is not preferred as it may show misleading results. While deciding about
special offers rejection or acceptance the following factors should be taken into consideration:
(i) The impact on future earnings of temporarily reduction in he selling price.
(ii) The effect of reducing selling prices on the existing customers when it comes to their
knowledge.
(iii) The possibility of selling additional units to the new customers beyond the special offer.
(iv) The reliability of cost estimates associated with the offer.
(v) The effect on current and future capacity in terms of an expansion of plant, personnel,
financial requirements and other capacity constraints.
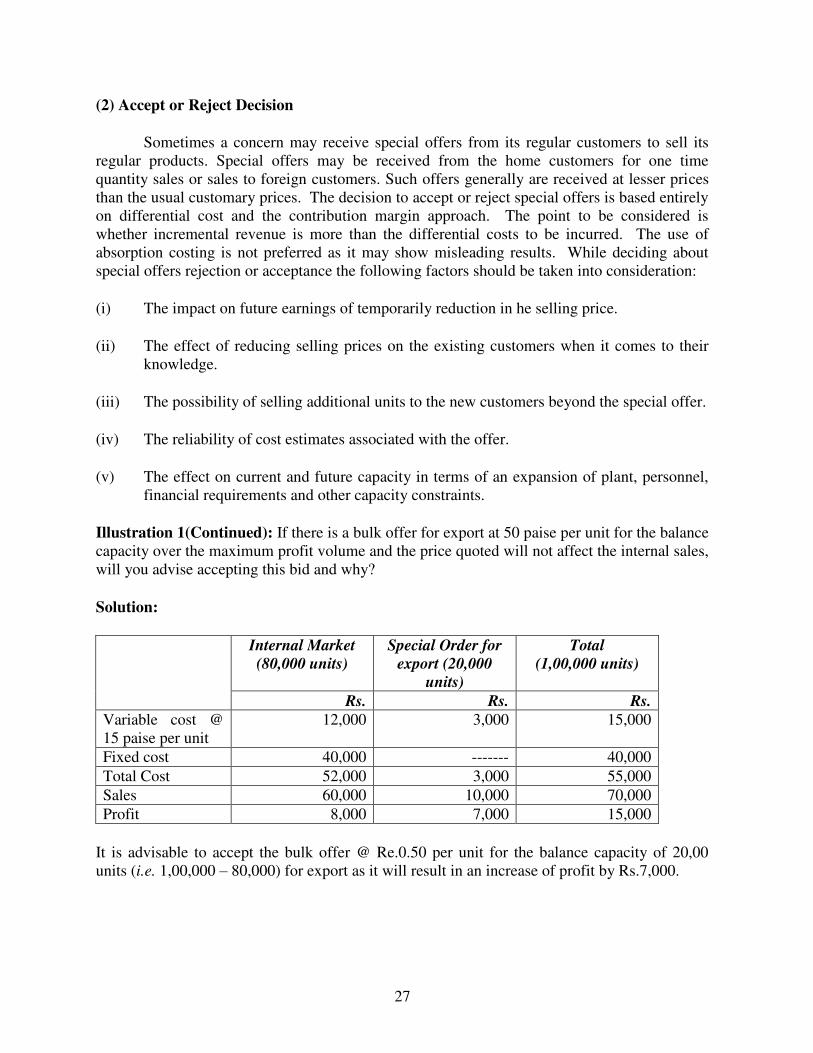
Illustration 1(Continued): If there is a bulk offer for export at 50 paise per unit for the balance
capacity over the maximum profit volume and the price quoted will not affect the internal sales,
will you advise accepting this bid and why?
Solution:
Internal Market
(80,000 units)
Special Order for
export (20,000
units)
Total
(1,00,000 units)
Rs. Rs. Rs.
Variable cost @
15 paise per unit
12,000 3,000 15,000
Fixed cost 40,000 ------- 40,000
Total Cost 52,000 3,000 55,000
Sales 60,000 10,000 70,000
Profit 8,000 7,000 15,000
It is advisable to accept the bulk offer @ Re.0.50 per unit for the balance capacity of 20,00
units (i.e. 1,00,000 – 80,000) for export as it will result in an increase of profit by Rs.7,000.
28
(3) Adding or Dropping a Product Line
In a multi-product company, the management may have to decide on adding or
dropping a product line. When a new product line is added, its sales and certain costs will also
be increased and reverse will happen when a product line is dropped. In order to arrive at such a
decision, the management should compare the differential cost and incremental revenue and
study its effect on the overall profit position of the company.
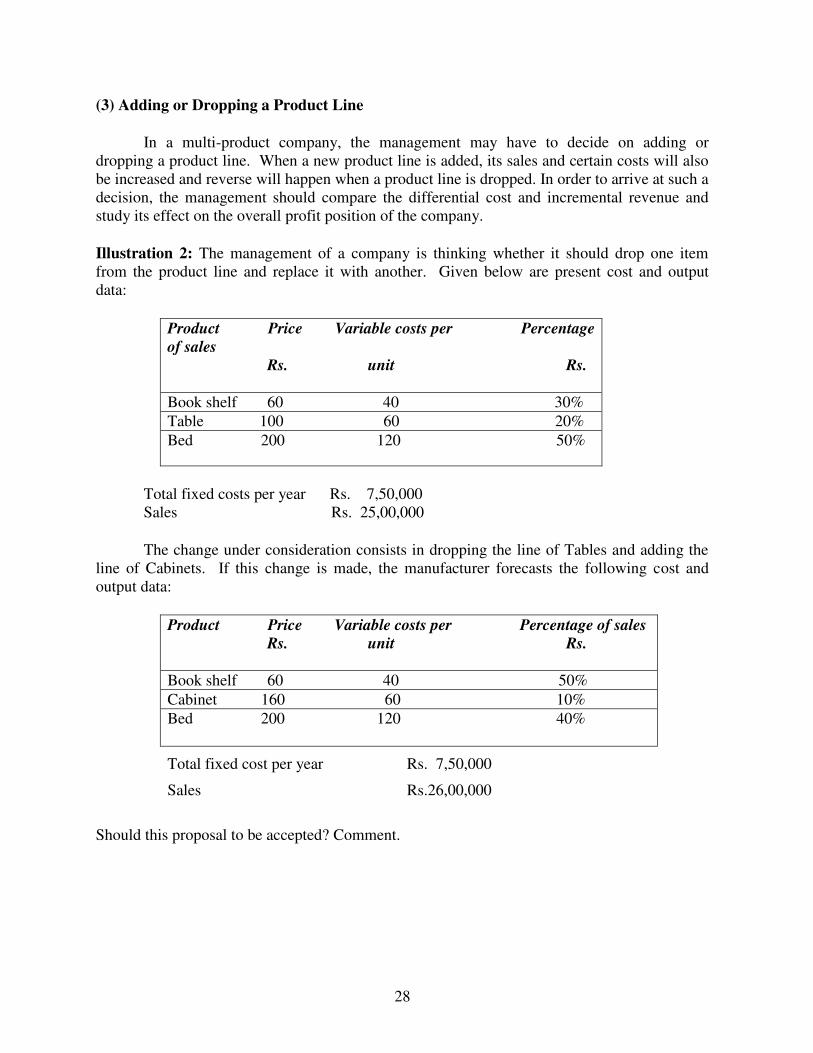
Illustration 2: The management of a company is thinking whether it should drop one item
from the product line and replace it with another. Given below are present cost and output
data:
Product Price Variable costs per Percentage
of sales
Rs. unit Rs.
Book shelf 60 40 30%
Table 100 60 20%
Bed 200 120 50%
Total fixed costs per year Rs. 7,50,000
Sales Rs. 25,00,000
The change under consideration consists in dropping the line of Tables and adding the
line of Cabinets. If this change is made, the manufacturer forecasts the following cost and
output data:
Product Price Variable costs per Percentage of sales
Rs. unit Rs.
Book shelf 60 40 50%
Cabinet 160 60 10%
Bed 200 120 40%
Total fixed cost per year Rs. 7,50,000
Sales Rs.26,00,000
Should this proposal to be accepted? Comment.
29
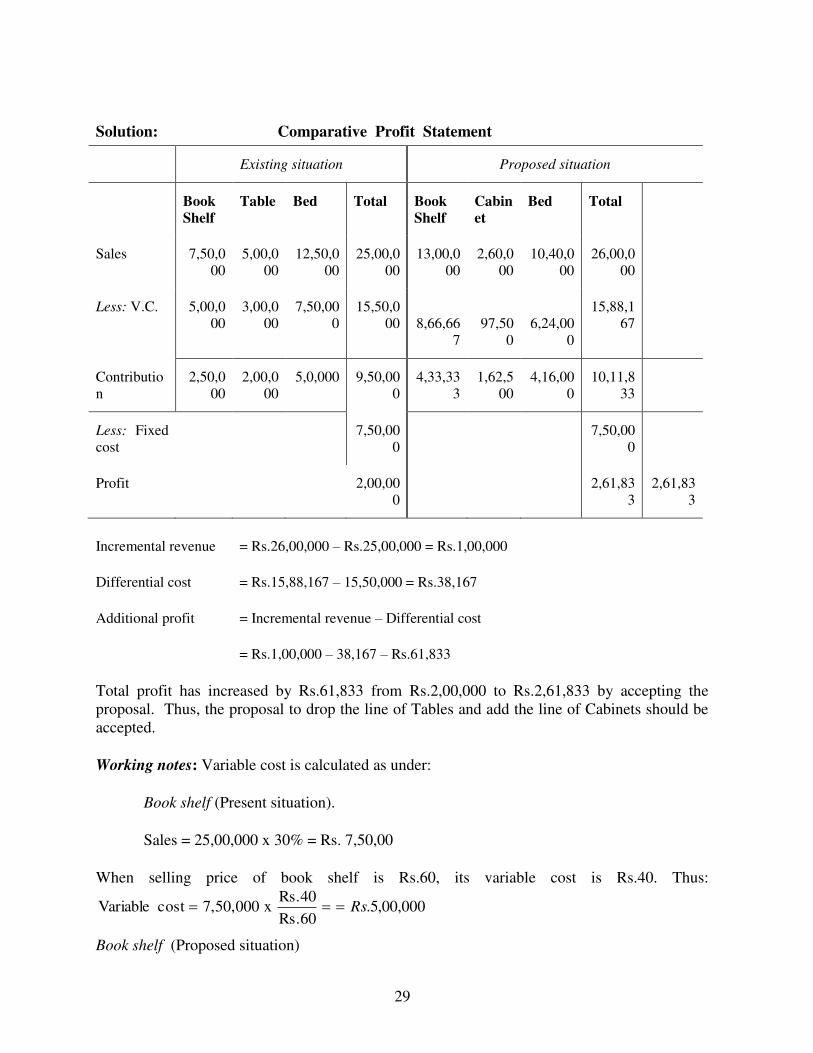
Solution: Comparative Profit Statement
Existing situation Proposed situation
Book
Shelf
Table Bed Total Book
Shelf
Cabin
et
Bed Total
Sales 7,50,0
00
5,00,0
00
12,50,0
00
25,00,0
00
13,00,0
00
2,60,0
00
10,40,0
00
26,00,0
00
Less: V.C. 5,00,0
00
3,00,0
00
7,50,00
0
15,50,0
00
8,66,66
7
97,50
0
6,24,00
0
15,88,1
67
Contributio
n
2,50,0
00
2,00,0
00
5,0,000 9,50,00
0
4,33,33
3
1,62,5
00
4,16,00
0
10,11,8
33
Less: Fixed
cost
7,50,00
0
7,50,00
0
Profit 2,00,00
0
2,61,83
3
2,61,83
3
Incremental revenue = Rs.26,00,000 – Rs.25,00,000 = Rs.1,00,000
Differential cost = Rs.15,88,167 – 15,50,000 = Rs.38,167
Additional profit = Incremental revenue – Differential cost
= Rs.1,00,000 – 38,167 – Rs.61,833
Total profit has increased by Rs.61,833 from Rs.2,00,000 to Rs.2,61,833 by accepting the
proposal. Thus, the proposal to drop the line of Tables and add the line of Cabinets should be
accepted.
Working notes: Variable cost is calculated as under:
Book shelf (Present situation).
Sales = 25,00,000 x 30% = Rs. 7,50,00
When selling price of book shelf is Rs.60, its variable cost is Rs.40. Thus:
000,00,5.Rs.60
Rs.40x7,50,000costVariable Rs
Book shelf (Proposed situation)
30
Sales = 26,00,000 x 50% = Rs.13,00,000
667,66,8.Rs.60
Rs.40x,00,00031costVariable Rs
Similar calculations are made for other lines of products.
(4) Make or Buy Decisions
In assembly type concerns, different components parts are assembled in order to
manufacture the product. Such component parts can be manufactured in the concern or these
can be purchased from external suppliers. If the concern has idle capacity and idle workers that
can be used to make component parts, it is preferable to make and realize cost savings. If there
is no idle capacity, the parts can be purchased from the outside. The other uses of idle capacity
should be examined before reaching a final decision as the available facilities have to be put to
best utilisation. Differential costing technique an be used for solving make or buy problem.
Costs associated with buying and making is to be compared. The sum of purchase price plus
transportation, insurance and ordering cost represents the amount applicable to the buying
alternative. On the other hand costs associated with the make alternative include the
differential variables to make the component parts such as materials, labour and variable
overheads. Allocated fixed costs remain unchanged in aggregate when components are made,
cannot be relevant to make or buy decisions. While making decision not only the present cost
but projections for future costs are to be taken into consideration.
In addition to the quantitative factors discussed above, the qualitative factors which are
taken into consideration to influence the make or buy decision are as follows:
(i) Quality of goods supplied by the supplier.
(ii) Uninterrupted supply by the supplier meeting the delivery dates.
(iii) If secrecy is to be maintained and manufacturing know-how is not to be passed on to the
supplier of the component part, the decision will be to manufacture part even though the
manufacturing cost may be more than the price to be charged by the supplier.
(iv) Any adverse effect on labour relations if it is decided to buy from outside instead of
making.
(v) The facility of wider selection in case of buy-decision.
(5) Sell or Process Decisions
A product can be sold by a company when it has been partially processed or of
processing it further and then selling it. When a product passes through a series of
manufacturing operations, it may be a saleable product at a number of different points along the
way. Thus a company has an option to sell he product at various physical stages of completion.
31
For example in petroleum refinery, the refinement of oil can be stopped a several points during
the process and can be sold as fuel oil, diesel oil, kerosene or gasoline as market exists or all
these intermediate semi-manufactured products. In sell or process decision incremental
analysis provides the solution. In all alternatives incremental revenue is to be compared with
incremental costs after the decision point as all costs incurred before the sell or process further
decision must be treated as sunk costs. The alternative which gives more benefit (incremental
revenue – incremental cost) must be adopted.
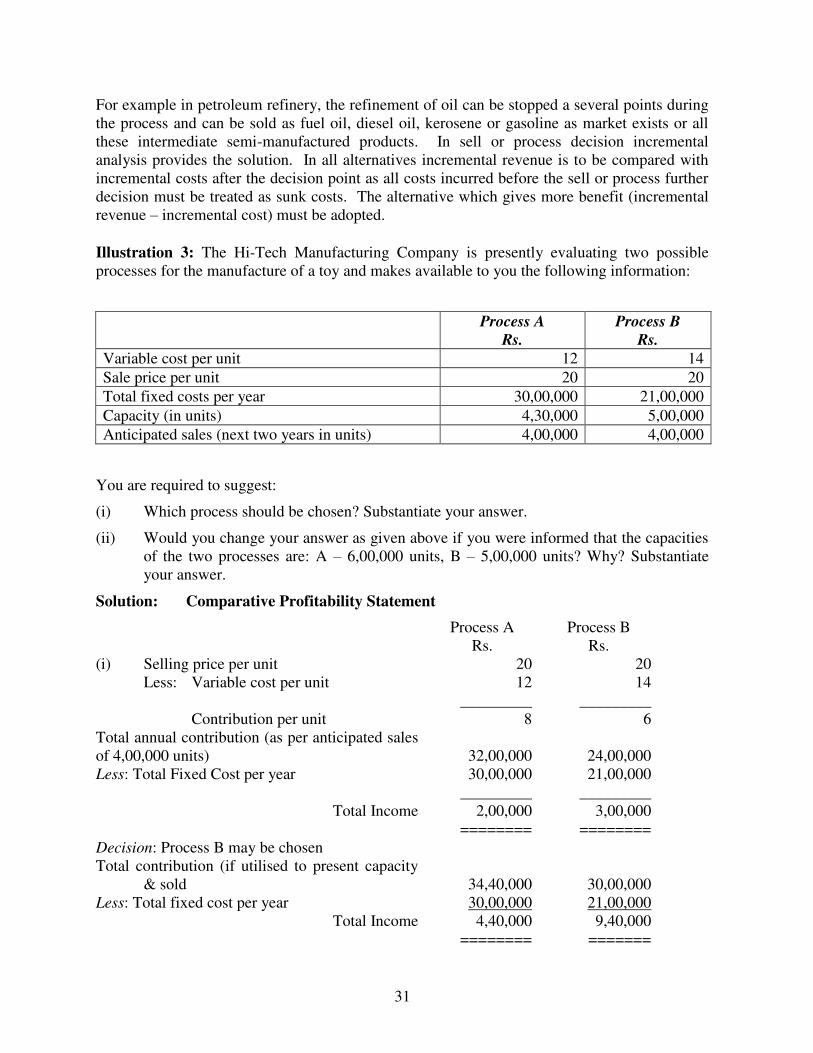
Illustration 3: The Hi-Tech Manufacturing Company is presently evaluating two possible
processes for the manufacture of a toy and makes available to you the following information:
You are required to suggest:
(i) Which process should be chosen? Substantiate your answer.
(ii) Would you change your answer as given above if you were informed that the capacities
of the two processes are: A – 6,00,000 units, B – 5,00,000 units? Why? Substantiate
your answer.
Solution: Comparative Profitability Statement
Process A
Rs.
Process B
Rs.
(i) Selling price per unit
Less: Variable cost per unit
Contribution per unit
Total annual contribution (as per anticipated sales
of 4,00,000 units)
Less: Total Fixed Cost per year
Total Income
20
12
_________
8
32,00,000
30,00,000
_________
2,00,000
20
14
_________
6
24,00,000
21,00,000
_________
3,00,000
======== ========
Decision: Process B may be chosen
Total contribution (if utilised to present capacity
& sold
Less: Total fixed cost per year
34,40,000
30,00,000
30,00,000
21,00,000
Total Income 4,40,000 9,40,000
======== =======
Process A
Rs.
Process B
Rs.
Variable cost per unit 12 14
Sale price per unit 20 20
Total fixed costs per year 30,00,000 21,00,000
Capacity (in units) 4,30,000 5,00,000
Anticipated sales (next two years in units) 4,00,000 4,00,000
32
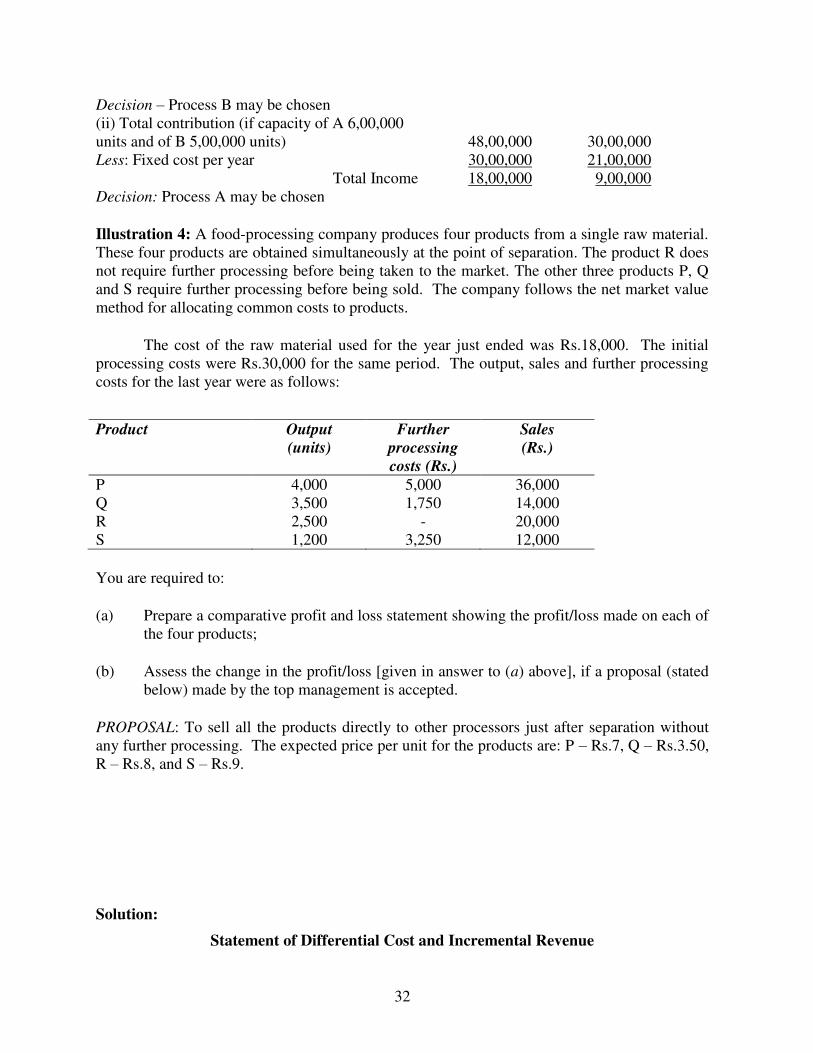
Decision – Process B may be chosen
(ii) Total contribution (if capacity of A 6,00,000
units and of B 5,00,000 units)
Less: Fixed cost per year
48,00,000
30,00,000
30,00,000
21,00,000
Total Income 18,00,000 9,00,000
Decision: Process A may be chosen
Illustration 4: A food-processing company produces four products from a single raw material.
These four products are obtained simultaneously at the point of separation. The product R does
not require further processing before being taken to the market. The other three products P, Q
and S require further processing before being sold. The company follows the net market value
method for allocating common costs to products.
The cost of the raw material used for the year just ended was Rs.18,000. The initial
processing costs were Rs.30,000 for the same period. The output, sales and further processing
costs for the last year were as follows:
Product Output
(units)
Further
processing
costs (Rs.)
Sales
(Rs.)
P 4,000 5,000 36,000
Q 3,500 1,750 14,000
R 2,500 - 20,000
S 1,200 3,250 12,000
You are required to:
(a) Prepare a comparative profit and loss statement showing the profit/loss made on each of
the four products;
(b) Assess the change in the profit/loss [given in answer to (a) above], if a proposal (stated
below) made by the top management is accepted.
PROPOSAL: To sell all the products directly to other processors just after separation without
any further processing. The expected price per unit for the products are: P – Rs.7, Q – Rs.3.50,
R – Rs.8, and S – Rs.9.
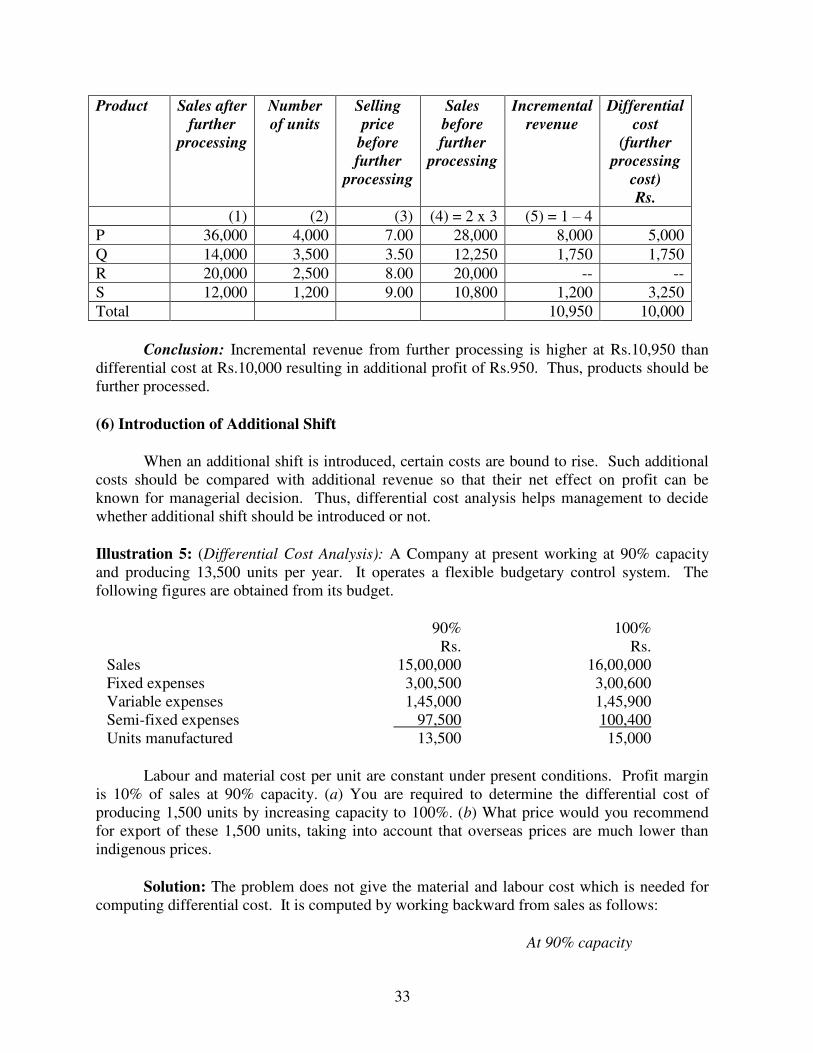
Solution:
Statement of Differential Cost and Incremental Revenue
33
Product Sales after
further
processing
Number
of units
Selling
price
before
further
processing
Sales
before
further
processing
Incremental
revenue
Differential
cost
(further
processing
cost)
Rs.
(1) (2) (3) (4) = 2 x 3 (5) = 1 – 4
P 36,000 4,000 7.00 28,000 8,000 5,000
Q 14,000 3,500 3.50 12,250 1,750 1,750
R 20,000 2,500 8.00 20,000 -- --
S 12,000 1,200 9.00 10,800 1,200 3,250
Total 10,950 10,000
Conclusion: Incremental revenue from further processing is higher at Rs.10,950 than
differential cost at Rs.10,000 resulting in additional profit of Rs.950. Thus, products should be
further processed.
(6) Introduction of Additional Shift
When an additional shift is introduced, certain costs are bound to rise. Such additional
costs should be compared with additional revenue so that their net effect on profit can be
known for managerial decision. Thus, differential cost analysis helps management to decide
whether additional shift should be introduced or not.
Illustration 5: (Differential Cost Analysis): A Company at present working at 90% capacity
and producing 13,500 units per year. It operates a flexible budgetary control system. The
following figures are obtained from its budget.
90%
Rs.
100%
Rs.
Sales
Fixed expenses
Variable expenses
Semi-fixed expenses
Units manufactured
15,00,000
3,00,500
1,45,000
97,500
13,500
16,00,000
3,00,600
1,45,900
100,400
15,000
Labour and material cost per unit are constant under present conditions. Profit margin
is 10% of sales at 90% capacity. (a) You are required to determine the differential cost of
producing 1,500 units by increasing capacity to 100%. (b) What price would you recommend
for export of these 1,500 units, taking into account that overseas prices are much lower than
indigenous prices.
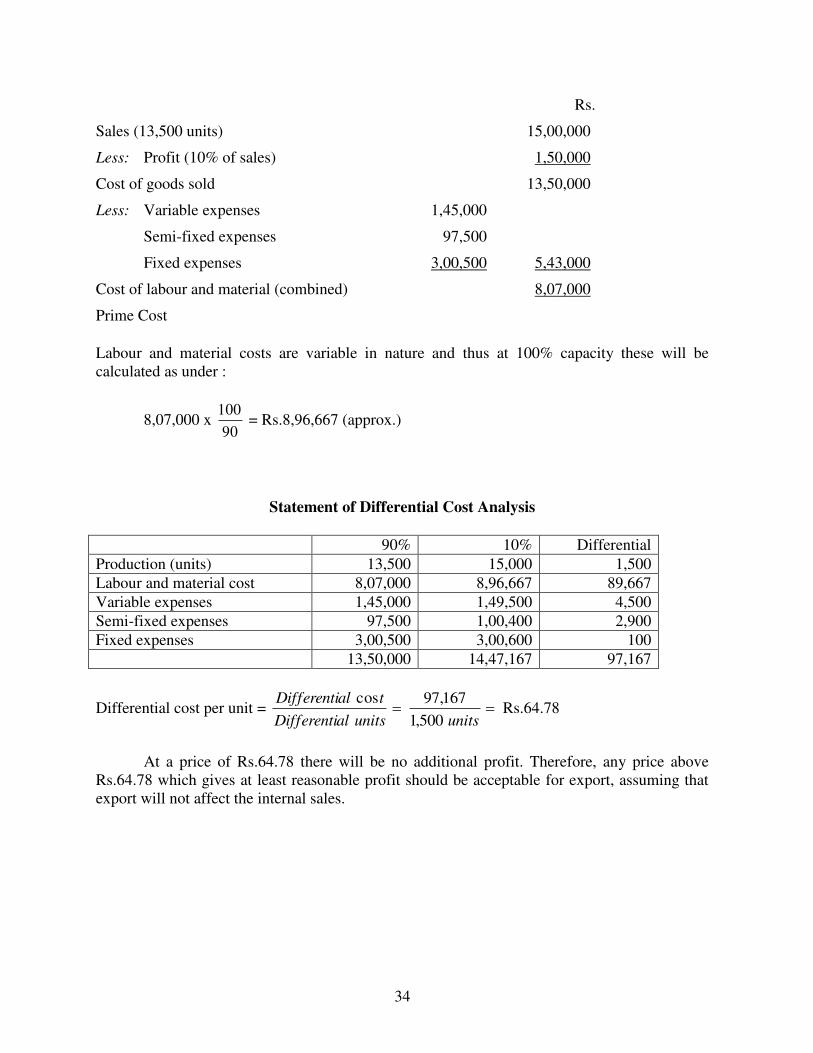
Solution: The problem does not give the material and labour cost which is needed for
computing differential cost. It is computed by working backward from sales as follows:
At 90% capacity
34
Rs.
Sales (13,500 units) 15,00,000
Less: Profit (10% of sales) 1,50,000
Cost of goods sold 13,50,000
Less: Variable expenses 1,45,000
Semi-fixed expenses 97,500
Fixed expenses 3,00,500 5,43,000
Cost of labour and material (combined) 8,07,000
Prime Cost
Labour and material costs are variable in nature and thus at 100% capacity these will be
calculated as under :
8,07,000 x 90
100 = Rs.8,96,667 (approx.)
Statement of Differential Cost Analysis
90% 10% Differential
Production (units) 13,500 15,000 1,500
Labour and material cost 8,07,000 8,96,667 89,667
Variable expenses 1,45,000 1,49,500 4,500
Semi-fixed expenses 97,500 1,00,400 2,900
Fixed expenses 3,00,500 3,00,600 100
13,50,000 14,47,167 97,167
Differential cost per unit = unitsunitsalDifferenti
talDifferenti
500,1
167,97cosRs.64.78
At a price of Rs.64.78 there will be no additional profit. Therefore, any price above
Rs.64.78 which gives at least reasonable profit should be acceptable for export, assuming that
export will not affect the internal sales.
35
UNIT 6
1
RESPONSIBILITY ACCOUNTING
Smriti Chawla Shri Ram College of Commerce
University of Delhi
Meaning and Definition of Responsibility Accounting
One of the fundamental functions of management accounting is facilitating managerial
control. Various devices are used by the management in performing this important function.
Responsibility accounting is one of the most recent developments in this field. The concept of
responsibility accounting is closely related to the systems of budgetary control and standard
costing.
Responsibility accounting is a system of control where responsibility is assigned for the
control of costs. The persons are made responsible for the control of costs. Proper authority is
given to the persons so that they are able to keep up their performance. In case the performance
is not according to the predetermined standards then the persons who are assigned this duty will
be personally responsible for it. In responsibility accounting the emphasis is on men rather than
on systems.
CHAPTER OBJECTIVES
Meaning and Definition of Responsibility Accounting
Essential Features of Responsibility Accounting Steps involved in Responsibility Accounting
Advantages of Responsibility Accounting Limitations of Responsibility Accounting Responsibility Centres
Types of Responsibility Centres o Cost Centre o Profit Centre
o Revenue Centre o Investment Centre
Transfer Prices Lets Sum Up Questions
36
Charles T. Hongreen. “Responsibility accounting is a system of accounting that recognizes various decision centres throughout an organization and traces costs to the individual
managers who are primarily responsible for making decisions about the costs in question”. Louderback and Dominiak, “Responsibility accounting is the name given to that
respect of the managerial process dealing with the reporting of information to facilitate control of
operations and evaluation of performance.”
Institute of Cost and Works Accountants of India, “Responsibility Accounting is a system of management accounting under which accountability is established according to the
responsibility delegated to various levels of management and a management information and
reporting system instituted to give adequate feedback in terms of delegated responsibility. Under
this system divisions or units of an organization under a specified authority in a person are
developed responsibility centres and evaluated individually for their performance.”
Hence, responsibility accounting focuses main attention on responsibility centres. The
managers of different activity centres are responsible for controlling the costs of their centres.
Information about costs incurred for different activities is supplied to the persons incharge of
various centre. The performance is constantly compared to the standards set and this process is
very useful in exercising cost control. Responsibility accounting is different from cost
accounting is different from cost accounting in the sense that the future lays emphasis on cost
control whereas the latter lays emphasis on cost ascertainment.
Essential Features of Responsibility Accounting
An analysis of the definitions given above reveals the following important features or
fundamental aspects of responsibility accounting-
(a) Inputs and outputs or Costs and Revenues: The implementation and maintenance of
responsibility accounting system is based upon information relating to inputs and
outputs. The physical resources utilized in an organization such quantity of raw material
used, labour hours consumed are termed as inputs. These inputs expressed in monetary
terms are known as costs. Similarly output expressed in monetary terms are called
revenue.
(b) Planned and Actual Information or Use of Budgeting: Effective responsibility
accounting requires both planned and actual financial information. It is not only
historical cost and revenue data but also planned future data which is essential for
implementation of responsibility accounting system. It is through budgets that
responsibility for implementing plans is communicated to each level of management.
(c) Identification of Responsibility Centres: The responsibility centres represent the sphere
of authority or decision points in an organisation. However, for effective control a large
firm is divided into meaningful segments, departments or divisions, which are called
responsibility centres. A responsibility center is under the control of an individual who is
responsible for control of activities of that sub unit of the organisation.
(d) Relationship Between Organisation Structure and Responsibility Accounting System:
Responsibility accounting system must be so designed as to suit the organization
structure of organization. It must be founded upon existing authority responsibility
relationship in organization. In fact, responsibility accounting system should parallel the
37
organisation structure and provide financial information to evaluate actual results of each
individual responsible for a function.
(e) Performance Reporting: Responsibility accounting is a control device. A control
system to be effective should be such that deviations from the plans must be reported at
earliest so as to take corrective action for future. The deviations can be known only when
performance is reported. Thus, responsibility accounting system is focused on
performance reports also known as ‘responsibility reports’, prepared for each responsibility unit.
(f) Participative Management: The function of responsibility accounting system becomes
more effective if participative style of management is followed, wherein, the plans are
laid according to mutual consent and decisions reached after consulting the subordinates.
It provides motivation to workers by ensuring their participation and self imposed goals.
(g) Management by Exception: An effective responsibility accounting system must provide
for management by exception i.e, it should focus attention of management on significant
deviations and not burden them with all kinds of routine matters, rather condensed
reports requiring their attention must be sent to them particularly at higher levels of
management.
(h) Human Aspect of Responsibility Accounting. To ensure success of responsibility
accounting system it must look into human aspect also by considering needs of
subordinates, developing mutual interests, providing information about control measures
and adjusting according to requirements.
(i) Transfer Pricing Policy: In a large-scale enterprise having decentralised divisions, there
is common practice of transfering goods and services from one segment of organization
to other. In such situations, there is a need to determine the price at which the transfer
should take place so that costs and revenues could be properly assigned. The significance
of the transfer price can well be judged from the fact that for the transfering division it
will be source of revenue, whereas for division to which transfer is made it will be
element of cost. Hence, there is need of having proper transfer policy for successful
implementation of responsibility accounting system.
Steps involved in Responsibility Accounting
Responsibility accounting is used as a control device. The aim of responsibility is to help
management in achieving organisational goals. The following steps are involved in responsibility
accounting:
1. The organisation is divided into various responsibility centres. Each responsibility
centre is put under charge of responsibility manager. The managers are responsible
for the performance of their departments.
2. The targets of each responsibility centre are set in. The targets are set in consultation
with manager of responsibility centre so that he may be able to give full information
about his department. The goals of the responsibility centres are properly
communicated to them.
38
3. The actual performance of each responsibility centre is recorded and communicated
to executive concerned and actual performance is compared with goals set and it
helps in assessing the work of these centres.
4. If the actual performance of a department is less than the standard set, then variances
are conveyed to the top management.
5. Timely action is taken to take necessary corrective measures so that work does not
suffer in future. The directions of top-level management are communicated to
concerned responsibility centre so that corrective measures are initiated at earliest.
Significance of Responsibility Accounting
Responsibility is very important in every type of business. The following are some of the
advantages of responsibility accounting.
1. Assigning of Responsibility: Each and every individual in organisation is assigned some
responsibility and they are accountable for their work. Everybody knows what is
expected of him. No body can shift responsibility to anybody else if something goes
wrong. So, under this system responsibility is assigned individually.
2. Improves Performance: The persons incharge for different activities know that their
performance will be reported to top management. They will try to improve their
performance. On the other hand, it acts as a deterrent for low performance also because
persons know that they are accountable for their work and they will have to explain for
their low performance.
3. Helpful in cost planning: Under system of responsibility accounting full information is
collected about costs and revenues. This data is helpful in planning of future costs and
revenues, fixing of standards and preparing of budgets.
4. Delegation and Control: This system enables the management to delegate authority
while retaining overall control. The authority is delegated according to requirements of
tasks assigned. On other hand responsibility of various persons is fixed which is helpful
in controlling their work. The control remains with top management because
performance of every cost centre is regularly reported to it. So, management is able to
delegate authority and at the same time to retain control.
5. Helpful in Decision-making: The information collected under this system is helpful to
management in planning its future actions. The past performance of various cost centre
also helps in fixing their future targets. So this system enables management to take
important decisions.
Limitation of Responsibility Accounting
A system of responsibility accounting provides a built in means of evaluating a manager’s performance. Timely reports of performance ensure prompt corrective action directed towards
deviations from the budgeted performance. Inspite of these advantages, responsibility accounting
suffers from following limitations.
1. Individual interest may come into conflict with interest of organisation.
2. It is difficult to establish a sound organisation structure with clearly defined authority and
responsibility. This is so owing to inter dependent nature of many departments.
39
3. It is equally difficult to match the responsibility centres and chart of accounts for
collecting costs by such centres.
4. The system does not take into consideration the relations of those who are involved in it.
5. The system may not work well unless it has support of people who operate system. Since
the person who incurs costs is to be held responsible for each item of cost, he should
willingly accept responsibility for deviations.
6. The system requires continuous consideration of reactions of segmental managers.
Responsibility Centres
In the words of Deakin and Maher, “a responsibility centre is a specific unit of an organisation assigned to a manager who is held responsible for its operations and resources”.
Types of Responsibility Centres : The Responsibility centres are classified into five categories:
1. Cost or Expense Centre
2. Profit Centre
3. Investment Centre.
4. Revenue Centre
5. Contribution Centre
1. Cost or Expense Centre: “Cost centres are segments in which the managers are responsible for costs incurred but have no revenue responsibilities”. However, when we can measure only the expenses or costs incurred and not revenue earned from
responsibility centre, it is known as cost or Expense Centre. Generally, a company has
production and service departments. The output of production departments can be
measured whereas service departments incur only expenses and their output is not
measured. It may not be either feasible or necessary to measure output of some service
departments. Such centres are called expense cost centre. The performance of cost centre
is measured in terms of quantity of inputs used in producing a given output. A
comparison between actual input used and predetermined budgeted inputs is made to
determine variances which represent efficiency of cost centre.
2. Profit Centre: Responsibility centres may have both inputs and outputs. The inputs are
taken as cost and outputs are revenues. The difference between the revenue earned and
cost incurred will be profit. When a responsibility centre gets revenue from output, it will
be called profit centre. For example, if a business has a number of processes and output
of one process is transferred to next process. When transfer from one process to another
is only on cost, then these processes will not be profit centres. On the other hand, if
management decides to transfer the output from one process to other at a profit then the
process will become profit centre. Internal transfers at profit do not increase company
assets whereas sales to outsides will increase assets of company. The income statement of
a profit centre is used as a control device. The profits of a responsibility centre will
enable in evaluating the performance of manager of that centre.
3. Investment Centre: “An investment centre is a segment in which manager can control
not only revenue and costs, but also investment”. The manager of a responsibility centre is made responsible for properly utilising the assets in his centre and is expected to earn a
fair return on the amount employed in assets in his centre. The CIMA Terminology
defines investment centre as “a profit centre whose performance is measured by its return

40
on capital employed.” The manager of investment centre exercises control not only on production and marketing but also on decisions relating to working capital management,
capital structure and capitalisation. His performance is measured in terms of profit as
related to the capital base. As a result he has to take longer term view of operations under
his direct control so that he can achieve steadily growing rate of return on investment.
4. Revenue Centre: Here the manager is responsible only for revenues. Revenue centres are
those locations where revenue is generated. For example, the sales department of an
organisation is a revenue centre because sales manager is responsible only for revenues.
His departments budget would lay emphasis on revenue.
5. Contribution Centre: It is a segment of activity for which both revenues and variable
costs are accumulated. Fixed costs, even those directly identified with the centre are
excluded because they do not reflect on current efficiency level. CIMA defines
contribution centre as “ a profit centre whose expenditure is reported on a marginal or direct cost basis.” The manager of contribution centre aims at maximizing the
contribution. Higher contribution is indicative of higher efficiency and vice versa.
Transfer Prices
“A transfer price is a price used to measure the price of goods or services furnished by a profit centre to other responsibility centres within a company.”
In a large-scale enterprise having decentralised divisions, there is a common practice of
transfering goods and services from one segment of organisation to another. In such situation,
there is a need to determine the price at which the transfer should take place so that costs and
revenues could be properly assigned. The significance of transfer price can well be judged from
the fact that for transfering division it will be source of revenue whereas for division to which
transfer is made it will be element of cost. Hence, there is a need of having a proper transfer
policy for successful implementation of responsibility accounting system.
There are various transfer pricing method in use. These methods are based on either (a) cost or
(b) market price. The following are important types of Intra-company transfer price.
1. Cost Price: According to this method, goods and services are transferred from one
segment of company to another on basis of unit cost of production of transferring
division. The cost could either be taken to be actual cost of production or standard cost of
production. The advantage of this method of transfer pricing is that it is very simple and
convenient to operate. But, it distorts the profit figures of the various responsibility
centres in the sense that the profit of the transferring centre shall be underestimated and
that of centre to which transfer is made would be over estimated In fact, this method is
inappropriate for profit centre analysis.
2. Cost Plus a Normal Mark-up: To overcome the shortcomings of simple cost price
method, many companies add to the cost a margin of profit say, 15% of the cost, to
determine the transfer price. Thus, in this method the buying division is charged the
actual unit cost of production of transferring department, whatsoever it may be plus a
mark up for the profit. The merit of this method is again simplicity and convenience, but
this method is also not appropriate method for profit center analysis.
3. Incremental Cost: Incremental cost can be computed in two ways depending upon
circumstances. In case entire production is transferred to another division within same
41
company, incremental cost will be the total of variable cost of transferring centre plus
any fixed costs that are directly attributable to that centre. The incremental cost so
calculated suffers from same defects as that of cost price method. The second approach
may be used when goods and services are sold to outside customers as well as transferred
within same company. In such a case, incremental cost may be taken as opportunity cost
in the form of loss of revenue which the transferring division would have charged from
the outside customers. The second approach is similar to the market price basis and is
more useful for profit centre analysis.
4. Shared Profit Relative to the Cost: According to this method no price is charged for the
intra company transfers. Rather out of the total sales revenue of the company the
aggregate cost of various divisions is deducted to find out the profit for the company as a
whole and then the profit is shared by various profit centres relative to the cost basis of
each centre, as below:
Share of Profit of Particular Profit centre = Profit of the company x Cost of
Particular Profit Centre/Total Cost
Thus, in this method profit is shared according to the cost of each division.
5. Market Price: In this method, the prices charged for intra-company transfers are
determined on basis of market price and not on the cost basis. There are three ways of
computing market price. Firstly, the prevailing market price, after making adjustment for
discounts and other selling costs may be taken as transfer price if there is an active
market for goods and services transferred between divisions of the same company.
Secondly where active market does not exist or where market price is not available, cost
plus a normal profit may be taken as reasonable market price. But then inefficiencies of
one division will be transferred to another division. Thirdly, a company could invite bids
from the market so as to determine market price. The lowest bid may be accepted as the
market price for transfer. However, the problem may arise because of false bidding or no
bidding at all.
6. Standard Price: Transfer prices can also be fixed on predetermined standard price basis.
The standard price may be determined on the basis of cost of production and prevailing
market conditions. Thus, division working at less than desired efficiency will show lesser
profit as compared to efficient divisions. However, difficulties may arise in fixing
standard price agreeable to different divisions.
7. Negotiated Price: The intra-company transfer price can also be determined on the basis
of negotiations between buying and transferring division. The price arrived at after
negotiation will be mutually agreed price. Such a pricing method will be advantageous to
both the divisions as well as company as a whole.
8. Dual or Two–way Price: According to this method, the transferring division is allowed
or give credit at one price, whereas the buying division is charged at a different price. It
enables better evaluation of profit centres and avoids conflict among them on account of
transfer prices. However, the total profits of the various segments would differ from the
actual profit of the company as a whole. But it poses no problems for the company as
transfer prices are meant for internal purposes of performance evaluation only.
42
Selection of Transfer Pricing Method
The following general criteria should be kept in mind while determining the transfer
price.
(a) the transfer price should be objectively determined.
(b) the transfer price should compensate the transferring division and charge the buying
division commensurate with value of the goods/services exchanged.
(c) It should contribute to congruence between goals of divisions and goals of organisation.
(d) It should provide for profit centre evaluation.
(e) It should maximise the efforts towards achievement of organisational goals.
Lets Sum Up
Responsibility accounting is a system of accounting in which costs and revenues are
accumulated and reported to managers on the basis of the manager’s control over these costs and revenues. The managerial accounting system that ties budgeting and
performance reporting to a decentralised organisation is called responsibility accounting.
The Essential features of responsibility accounting are inputs and outputs, planned and
actual information, identification of responsibility centers, relationship between
organisation structure and responsibility accounting system, transfer pricing policy,
performance reporting, participative management and human aspect of responsibility
accounting.
A responsibility center is a specific unit of an organisation assigned to a manager who is
held responsible for its operations and resources.
Different responsibility centers are cost centre, profit centre, investment centre, revenue
centre and contribution centre.
QUESTIONS
1. Define a responsibility centre. Why are responsibility centers created? Explain the
various kinds of responsibility centers. 2. “Responsibility Accounting is an important device for control”. Discuss. 3. Explain the essential ingredients of a system of responsibility Accounting?
4. “Responsibility Accounting ties the accounting, budgeting and reporting to organisation
and responsibilities.” Explain?
43
2
DIVISIONAL PERFORMANCE MEASUREMENT:
FINANCIAL MEASURES
Smriti Chawla Shri Ram College of Commerce
University of Delhi
Introduction
A division is defined as:
“A company unit headed by a man fully responsible for profitability of its operations, including planning, production, financial and accounting, activities, and who usually, has his
own sales force. The division may be unit of parent company it may be wholly or partially
owned subsidiary.” The work of all the divisions must be conducted in such a manner that the work of no
division comes in the way of profitability of other divisions or the profitability of company as a
whole. The essence of divisional performance measurement is that all divisions must be so
motivated as to maximise the profit of the company and not merely of division itself.
Significance of Measurement of Divisional Manager’s Performance Measuring divisional manager’s performance is important in the following ways:
1. It directs top management’s supervision and assistance where it is most needed and
where it will be most productive.
CHAPTER OBJECTIVES
Introduction Significance of Measurement Divisional Performance
Requirements of Divisional Performance Measurement Difficulty in Measurement of Divisional Manager’s
performance
Financial Methods for evaluation of Divisional Performance Performance Measure of a Cost Centre
Performance Measures of a Profit Centre Performance Measures of an Investment Centre
Responsibility Performance Reporting Lets Sum Up Questions
44
2. It provides the objective factual foundation for sound executive compensation.
3. It gives job-satisfaction directly by letting the executives know how they are doing.
4. It directs the activity of executives towards high scores on the aspects of performance on
which they are measured and judged.
5. It indicates to the executive concerned the manner in which he ought to do his work-
accomplishment of goals and objectives and also, along with it the way in which these
goals and objectives are achieved.
6. It shapes the future executive team by indicating whom to promote whom to retain and
whom to remove.
Requirements for Divisional Performance Measurement
To measure in quantitative terms the performance of divisional manager, the following
requirements are essential: -
1. A clear-cut system of transfer pricing should be prescribed so that one department does
not become overburden on the other.
2. There should be foolproof, clear and uniform system of accounting to measure the
profits.
3. Realistic standards of profit and profitability should be evolved to compare against
actuals.
4. The profit centre viz, the division should be clearly identified.
5. There should be system of rewards to provide incentives for the executives to attain
higher levels of performance.
When an individual joins an organisation he has a certain amount of enthusiasm to prove his
abilities and he sincerely wishes these abilities to be recognized. From time to time he expects to
be rewarded in one form or the other which may not necessarily be money. As a human being, he
wishes to become part of the organisation and get feeling of belonging. He is willing to adapt
himself to the organisation and become part of its management process. This adaptation and
involvement of individuals at various levels in decision-making, build up of the workforce etc.
create a sense of satisfaction and achievement which normal monetary gains do not provide. To
motivate an individual there is a clear need for satisfying his human wants which have number of
aspects such as economic, social, moral, political, psychological etc. Among these, generally the
economic aspect predominates. However, over a period of time that spectrum keeps on changing
and some aspects become more important than others. The top management in the organization
has to recognize changes and adopt ways and means to act in manner that would motivate these
working individuals to become a part of the organization and derive satisfaction from various
activities besides merely getting money for doing work. The relative strength of various factors
as well as their limitations must be fully recognized. To arrive at optimal behaviour of a number
of individuals within an organization, the top management has to work continuously and keep
the problem of recognizing changes in various needs of individuals within focus. The ultimate
point achieved is a compromise among the personal aspirations of all individuals within an
organization.
Difficulty in Measurement of Divisional Manager’s Performance
It is undesirable to fix targets for performance in respect of divisional managers in
quantitative terms only. For instance, the cordial personnel relationship within division may
contribute a great deal to the organisation’s productivity and hence profitability. Thus, the
45
problems in measurement of executive performance are twofold viz, the difficulty of expressing
in quantifiable terms certain objectives like quality control, safety, industrial peace etc. The
second one is to keep in view the long-term objective while measuring performance in the short
run.
Most of the objectives ultimately will have their bearing on the profitability of the
division. Hence, profitability is used as a measure of divisional performance.
Financial Methods for Evaluation of Divisional Performance
The following are the financial measures for divisional performance evaluation.
1. Return on Investment: It is most popular measure of performance. Under this
method, for each divisional manager a target rate of return on capital placed at his disposal is
determined beforehand and later, this is compared with actual rate of return. It is quite possible
that target for one division may be different from that of others, taking into account the special
circumstances of each case. For example, if a new venture has been created for purpose it would
obviously be not proper to expect same rate of return in initial years as is being earned by other
well-established divisions.
The rate of return is connected with firm’s cost of capital but it is not that rate of return must be equal to cost of capital even for firm as whole. There is such a thing as opportunity cost
and firm should able to earn from use of funds at least that much as they would have earned by
using funds in some other manner.
However, from practical point of view, ROI is an imperfect measure because of different
capital base and income computation and hence should be used with caution and in conjunction
with other performance measures.
100xemployedCapital
ProfitROI
or, ROI = 100xInvestmentDivisonal
IncomeNetDivisional
Illustration 1: Hospitality Inns India has two motels one in Agra and other in Chandigarh. The
sales revenue operating profit and capital employment in each division are as under: -
Division Net Sales Revenue Operating Profit Capital Employed
Agra 12,00,000 2,40,000 10,00,000
Chandigarh 16,00,000 3,00,000 20,00,000
You are required to calculate following ratios for each division
1. Capital turn over Ratio
2. Profit Ratio
3. Return on Investment (ROI)
1. Capital turnover ration = employedCapital
Sales
Chandigarh = 2.11000000
1200000
46
Agra = 80.02000000
1600000
2.Profit Ratio = 100xSales
Profit
Chandigarh = 2,40,000/12,00,000 = 20%
Agra = %75.18100x1600000
300000
3. Return on Investment
100xemployedCapital
Profit
Chandigarh = %24100x1000000
2400000
or, 1.2 x 20% = 24%
Agra = %15100x2000000
300000
or, 0.80 x 18.75% = 15%
2. Residual Income (RI)
It is operating income minus an imputed charge for invested capital. Imputed charge is
the minimum targeted return on investment in a division which is generally the cost of capital of
the company. Any amount over and above targeted charge represents the residual income of
division. Generally, higher the residual income better performance of the division.
Illustration 2: Hospitality India having motels in Chandigarh and Agra with invested capital of
Rs. 10 lakhs, and 20 lakhs an operating income of Rs. 2.4 lakhs, 3 lakhs respectively, takes into
consideration 10% imputed charge on invested capital, their residual income in each case will be
arrived at as shown below:
Motel Operating
income
Imputed charges on investment Residual
Income
Chandigarh 2,40,000 1,00,000 (10% of Rs. 10,00,000) 1,40,000
Agra 3,00,000 2,00,000 (10% of Rs. 20,00,000) 1,00,000
In above example, given 10% imputed charge Chandigarh motel is performing best in
terms of residual income.
The objective of maximising residual income assumes that as long as the division earns a
rate on investment in excess of the imputed charge for invested capital the division should
expand. Some firms prefer the residual income approach because in a given period maximisation
of an absolute amount is favoured.
3. Net Profit
Some organisations consider divisional net profit as measure of its performance. It is easy
to calculate and understand. The main limitation of this measure is that net profit is arrived at
after deducting the apportioned head office expenses, which at times are arbitrarily charged to
the division. Further these expenses are beyond the control of the divisional head. However, the
main reason in favour of using net profit as a measure of divisional performance is that divisional
47
head becomes aware of total cost of operating the division. To the extent, divisional head is not
demotivated by lower net profit due to high charge of apportioned overheads not under his
control, net profit as a measure of divisional performance may be acceptable.
4. Contribution Margin
It is calculated by deducting only variable cost from divisional sales revenue. If there
exist some fixed costs, which are under the control of divisional head, this method may not be
found satisfactory by management for evaluation of divisional performance. However, it is well
known that contribution margin approach is widely used in decision-making. Hence, divisional
head may be tempted that his division’s performance may be evaluated on the basis of contribution made by it.
5. Direct profit/controllable profit
In view of limitation of contribution margin as measure of divisional performance,
division’s direct profit or division’s controllable profit may be found comparatively better profit indices from measurement of divisional performance. Divisions direct profit is ascertained by
deducting direct costs of division from division revenue. Division’s controllable profit is computed by deducting total controllable costs – various as well as fixed – from revenue of
division.
A suitable measure for reflecting on the efficiency of a cost center will be different from
that for a profit center or an investment center.
Performance Measures of a Cost Centre
One or more of the following measures can be used for evaluating performance of a cost
centre:
(1) Target Cost: A target cost is determined for each product or process. Actual cost is
compared with the target cost. If it is lower, the performance is better than targeted. If it
is higher, an investigation is required regarding the reasons for increase in cost.
(2) Prime Cost to Sales: For each product percentage of prime cost to sales can be pre-
determined and compared with the actual percentage. A higher percentage of prime cost
is indicative of inefficiency in the use of direct material, direct labour or factory
overheads which should be ascertained by further analysis.
(3) Overhead to Sales: In the same way percentage of factory overheads to sales and office
overheads to sales for each product should be predetermined and compared with the
actual to ascertain the degree of efficiency or in efficiency in performance.
(4) Cost of Production to Sales: The percentage of cost of production to sales gives the
aggregative picture of performance of a cost centre. A lower percentage indicates
economy in cost.
Performance Measures of a Profit Centre
Financial performance of a profit centre, which is responsible both for production and sale,
can be evaluated with the help of one or more of the following measures:
(1) Sales to Gross Assets: Higher the net sales to gross assets, better is the utilization of
installed facilities and vice-versa.
48
(2) Sales to Net Assets: In case some of the assets have become substantially worn out with
significantly reduced earning capacity, better measure would be net sales to net assets.
(3) Operating Profit to Sales: Operating profit is profit before interest and tax excluding all
non-operating gains and losses. Higher operating profit to net sales is indicative of better
performance and vice versa.
(4) Operating Profit to Net Assets: A higher ratio indicates more efficient utilization of net
assets committed to the profit centre.
Performance Measures of an Investment Centre
(1) Return on Investment (ROI): The ratio is net income to net assets of the investment
centre. Higher the ratio, better it is.
(2) Gross Margin to Capital Employed: In this ratio before depreciation, interest and tax to
capital employed is taken for measuring financial performance. Capital employed
includes both equity capital and borrowed capital.
(3) Profit Before Interest and Tax (PBIT) to Capital employed: Higher PBIT to capital
employed reflects higher profitability.
(4) Net Profit to Net Worth: Net profit is calculated after deducting all expenses including
interest and tax. Net worth is sum total of shareholder’s funds invested in the investment centre. It comprises of equity capital, plus all accumulated surpluses, minus accumulated
losses. The ratio gives profit earning on shareholders funds. Higher the ratio better off
are the shareholders.
(5) Target Profit: The head office may determine target profit, or target EBIT to capital
employed or target ROI. Earnings in excess of the target shows better than expected
performance and that below target require explanation from the management of the
investment centre. The technique can also be called ‘Residual Income of Performance Measure’
In addition to financial measures of performance, comparison also use non-financial
measure of performance. Important non-financial measures are
1. Customer Service
2. Product Quality
3. Safety Record of manufacturing plants.
Responsibility Performance Reporting
Responsibility Accounting is a control device. A control system to be effective should be
such that deviations from the plans must be reported at the earliest so as to take corrective action
for the future. The deviations can be known only when performance is reported. Thus,
responsibility accounting system is focused on performance reports also known as ‘responsibility reports’, prepared for each responsibility unit. Unlike authority which flows from top to bottom, reporting flows from bottom to top. These reports should be addressed to appropriate persons in
respective responsibility centers. The reports should contain information in comparative form as
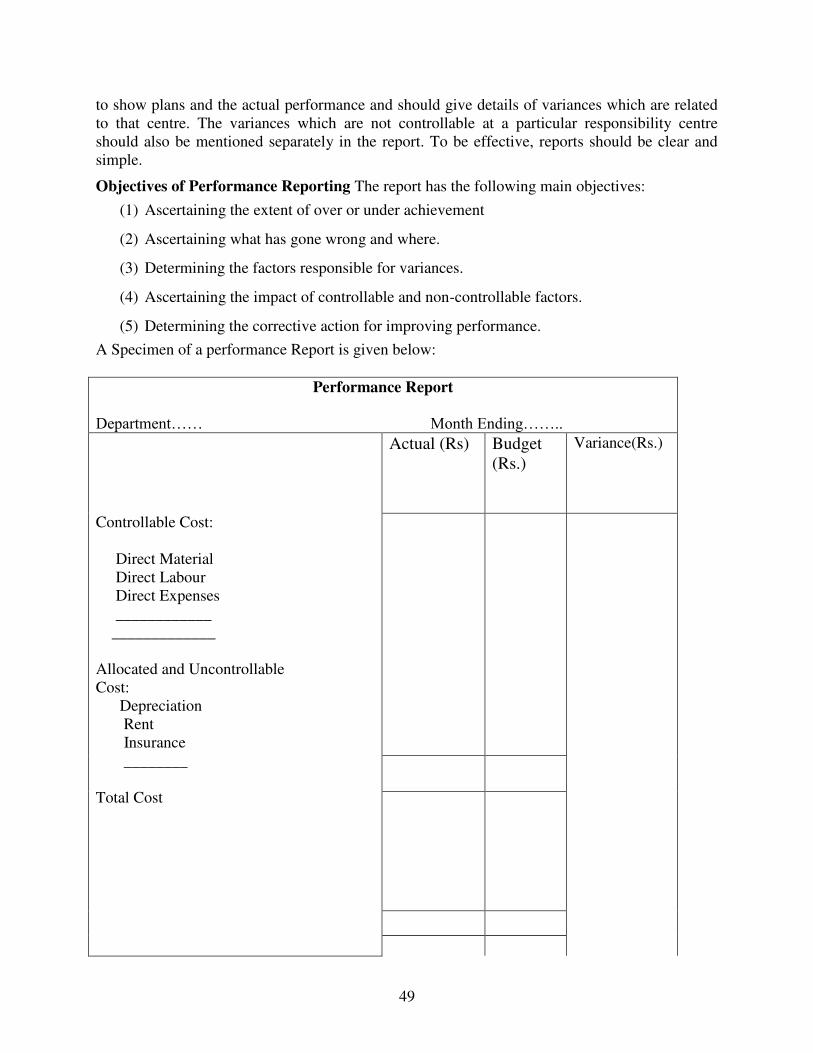
49
to show plans and the actual performance and should give details of variances which are related
to that centre. The variances which are not controllable at a particular responsibility centre
should also be mentioned separately in the report. To be effective, reports should be clear and
simple.
Objectives of Performance Reporting The report has the following main objectives:
(1) Ascertaining the extent of over or under achievement
(2) Ascertaining what has gone wrong and where.
(3) Determining the factors responsible for variances.
(4) Ascertaining the impact of controllable and non-controllable factors.
(5) Determining the corrective action for improving performance.
A Specimen of a performance Report is given below:
Performance Report
Department…… Month Ending……..
Controllable Cost:
Direct Material
Direct Labour
Direct Expenses
____________
_____________
Allocated and Uncontrollable
Cost:
Depreciation
Rent
Insurance
________
Total Cost
Actual (Rs)
Budget
(Rs.)
Variance(Rs.)
50
Lets Sum Up
The division may be unit of a parent company or it may be a wholly or partially owned
subsidiary.
The essence of divisional performance measurement is that all divisions must be so
motivated as to maximize the profit of the company and not merely of the division itself.
Financial methods of evaluation of divisional performance are (a) Rate of Return on
Investment (b) Residual Income (c) Net Profit (d) Contribution Margin (e) Direct
profit/controllable profit.
Performance Measures of a Cost Centre, Performance Measures of a Profit Centre and
Performance Measures of an Investment Centre
are also determined.
Responsibility Accounting is a control device. A control system to be effective should be
such that deviations from the plans must be reported at the earliest so as to take corrective
action for the future. The deviations can be known only when performance is reported.
Thus, responsibility accounting system is focused on performance reports also known as
‘responsibility reports’, prepared for each responsibility unit.
QUESTIONS
1. Discuss briefly the various financial measures of divisional performance measurement?
2. How is residual income defined?
3. Write short note on return on investment (ROI) and residual income methods of
divisional performance measurement.
4. Write short note on Responsibility Performance Reporting?