Gradient Vowel Harmony in Oceanic - Simon Fraser...
28
Language and Linguistics 17(6) 769–796 © The Author(s) 2016 Reprints and permissions: sagepub.co.uk/journalsPermissions.nav DOI: 10.1177/1606822X16660960 lin.sagepub.com Featured Article * We are grateful to Robert Blust, Ashley Farris-Trimble, and Paul Tupper for their comments on an earlier version of this article, two anonymous reviewers from Language and Linguistics, Kim Myrhold, who helped organize our data, and Holly Wilbee, who assisted with data visualization. We alone are responsible for any errors that remain. Gradient Vowel Harmony in Oceanic* John Alderete 1 and Sara Finley 2 Simon Fraser University 1 Pacific Lutheran University 2 This article contributes to the understanding of gradient phonological patterns by investigating graded vowel co-occurrence in Oceanic languages. In particular, vowel co-occurrence patterns in disyllabic stems are investigated in four languages: Samoan, Tongan, Hawaiian, and Fijian, as well as reconstructed forms in Proto-Oceanic and Proto-Malayo-Polynesian. With some variation in degree, all languages exhibit an over- representation of identical vowel pairs (e.g. i–i), an under-representation of similar vowel pairs (i–e), and no special restrictions on dissimilar vowel pairs (e.g. i–o). These graded restrictions are also subject to order effects in all languages because the dissimilar > similar inequality in frequency is only found in certain orders. Our focus is on documenting the patterns supporting these generalizations so that future theoretical analysis will rest on strong empirical ground. In addition, we propose one such analysis using gradient constraints on parasitic vowel harmony. Key words: Austronesian, gradient patterns, parasitic harmony, vowel harmony 1. Introduction As a convenient idealization, vowel harmony is often characterized as the categorical require- ment that vowels share the same value of a specified feature, such as [back] or [round]. This type of requirement is standardly treated as across-the-board spreading from stems to affixes, or some other mechanism for ensuring featural agreement. Neutral vowels, that is vowels that do not un- dergo spreading, may complicate the picture, but straightforward assumptions about feature speci- fication in autosegmental phonology seem to handle most cases, accounting for why transparent vowels are inactive and opaque vowels are active. While vowel harmony is traditionally characterized as a morpho-phonological process, that is one that primarily affects affixes and specific form classes, there are reasons to believe that vowel harmony can also be applied to a model of phonotactics. First, vowel harmony is a phonetically motivated process (Archangeli & Pulleyblank 1994), suggesting that vowel harmony may become ‘phonologized’ on par with other phonotactic processes. Second, the same constraint-based mecha- nisms that are used to characterize vowel harmony generally apply without reference to morpho- logical structure. This means that vowel harmony can be analyzed both as a morpho-phonological
Transcript of Gradient Vowel Harmony in Oceanic - Simon Fraser...
Language and Linguistics 17(6) 769–796© The Author(s) 2016Reprints and permissions: sagepub.co.uk/journalsPermissions.nav DOI: 10.1177/1606822X16660960lin.sagepub.com
Featured Article
* We are grateful to Robert Blust, Ashley Farris-Trimble, and Paul Tupper for their comments on an earlier version of this article, two anonymous reviewers from Language and Linguistics, Kim Myrhold, who helped organize our data, and Holly Wilbee, who assisted with data visualization. We alone are responsible for any errors that remain.
Gradient Vowel Harmony in Oceanic*
John Alderete1 and Sara Finley2
Simon Fraser University1
Pacific Lutheran University2
This article contributes to the understanding of gradient phonological patterns by investigating graded vowel co-occurrence in Oceanic languages. In particular, vowel co-occurrence patterns in disyllabic stems are investigated in four languages: Samoan, Tongan, Hawaiian, and Fijian, as well as reconstructed forms in Proto-Oceanic and Proto-Malayo-Polynesian. With some variation in degree, all languages exhibit an over- representation of identical vowel pairs (e.g. i–i), an under-representation of similar vowel pairs (i–e), and no special restrictions on dissimilar vowel pairs (e.g. i–o). These graded restrictions are also subject to order effects in all languages because the dissimilar > similar inequality in frequency is only found in certain orders. Our focus is on documenting the patterns supporting these generalizations so that future theoretical analysis will rest on strong empirical ground. In addition, we propose one such analysis using gradient constraints on parasitic vowel harmony.
Key words: Austronesian, gradient patterns, parasitic harmony, vowel harmony
1. Introduction
As a convenient idealization, vowel harmony is often characterized as the categorical require-ment that vowels share the same value of a specified feature, such as [back] or [round]. This type of requirement is standardly treated as across-the-board spreading from stems to affixes, or some other mechanism for ensuring featural agreement. Neutral vowels, that is vowels that do not un-dergo spreading, may complicate the picture, but straightforward assumptions about feature speci-fication in autosegmental phonology seem to handle most cases, accounting for why transparent vowels are inactive and opaque vowels are active.
While vowel harmony is traditionally characterized as a morpho-phonological process, that is one that primarily affects affixes and specific form classes, there are reasons to believe that vowel harmony can also be applied to a model of phonotactics. First, vowel harmony is a phonetically motivated process (Archangeli & Pulleyblank 1994), suggesting that vowel harmony may become ‘phonologized’ on par with other phonotactic processes. Second, the same constraint-based mecha-nisms that are used to characterize vowel harmony generally apply without reference to morpho-logical structure. This means that vowel harmony can be analyzed both as a morpho-phonological

770
John Alderete and Sara Finley
and phonotactic process. Third, vowel harmony has been incorporated into probabilistic models of phonotactics (see e.g. Goldsmith & Riggle 2012), showing that even long-distance phonological patterns can be analyzed using probability distributions over vowel co-occurrences. The analysis of vowel harmony using probabilistic constraints has exciting implications for the analysis of a wide range of vowel harmony patterns, including patterns that only resemble vowel harmony.
Most vowel harmony systems exhibit non-systematic behavior that cannot be straightforwardly explained using categorical representations of features and feature spreading. Many languages with rich affix morphology have invariant affixes that do not participate in harmony, for example Hungarian (Vago 1980). And most vowel harmony systems have a set of disharmonic roots that are more than just random exceptions to harmony generalizations. In Turkish roots, for example, /i e a o u/ may all co-occur freely, violating [back] and [round] harmony fundamental to the system, but /y ø ɨ/ must obey this harmony (Clements & Sezer 1982). Vowel harmony systems may also have pockets of irregularity that seem to be influenced by lexical distributions, as shown for back-neutral vowel sequences in Hungarian (Hayes & Londe 2006), and vowel co-occurrence patterns may exhibit language particular patterns that buck the usual trends predicted by generative phonology (Archangeli et al. 2012a, 2012b; see Harrison 1999 for a host of other factors leading to non- systematic vowel harmony). The existence of these non-categorical patterns, within seemingly categorical vowel harmony systems, suggests a range of vowel harmony patterns: from highly categorical to highly gradient. With the advent of models that make use of probability and gradience, it is now possible to analyze patterns that may be too weak to be categorized as vowel harmony under traditional assumptions in the same manner as one would analyze vowel harmony patterns that fall on the more traditional categorical side of the spectrum.
This article approaches graded vowel co-occurrence in certain Oceanic languages from this perspective. Oceanic languages do not have rich affix morphology, and very few have morphopho-nemic vowel harmony. Many of them, however, have stem co-occurrence restrictions that suggest an analysis involving gradient vowel harmony (see e.g. Krupa 1971). We exemplify the restrictions of interest in Table 1 with vowel co-occurrence data from Samoan (Alderete & Bradshaw 2013). Vowel combinations are standardized using Observed/Expected values, which is a common measure used to assess over- (greater than 1.0) and under-representation (less than 1.0) in the lexicon (Pierrehumbert 1993). O/E for all pairs containing the low vowel a approaches 1.0, suggesting that the distribution of these pairs is not restricted. Non-low vowels, however, exhibit a gradient co-occurrence pattern in which pairs of identical vowels are significantly over-represented, similar vowel pairings are under-represented, and dissimilar vowels are intermediate on this scale. For example, i–i and e–e have O/E values above 2, but the non-identical pairs i–e and e–i have O/Es of 0.28 and 0.68, respectively, a clear contrast.
These patterns of over- and under-representation of V–V pairs give rise to the ‘checkerboard’ patterns depicted in Figure 1, which visualizes the grades of these vowel sequences. We see the same patterns of over- and under-representation in the co-occurrence of /o u/, as shown in the bottom 2 × 2 region in the right-hand corner of Figure 1. However, when we combine front vowels with back vowels, we only find an attenuated checkerboard pattern with combinations of front and back vowels, as shown in the upper right-hand corner of this figure.
771
Language and Linguistics 17(6)
Table 1: Observed/Expected in V–Vs in Samoan disyllabic stems
i e a o ui 2.18 0.28 0.69 1.19 0.59e 0.68 2.28 1.00 0.50 0.86a 0.78 0.93 1.16 1.04 0.97o 0.81 0.99 0.75 1.92 0.54u 0.97 0.93 1.14 0.14 1.90
Figure 1: Heat map of Samoan V–Vs
While Samoan does not have active alternations producing these grades, it is possible to analyze the systematicity of the vowel co-occurrence facts as a product of a gradient form of vowel harmony. For example, the patterns of over- and under-representation above can be accounted for if the grammar of Samoan somehow formalizes a scale of acceptability such that identical vowel pairs are ‘good’, dissimilar pairs ‘okay’, and similar pairs are ‘bad’, e.g. i–i > i–o > i–e. One of the themes of this article is to show that these patterns resemble directional parasitic vowel harmony systems that exhibit both directionality effects and assimilation contingent on shared features (à la Cole & Trigo 1989). Another theme is to illustrate the gradient nature of these patterns, and make the point that, like other types of non-systematic behavior (Frisch 1996), it is difficult to separate core (regular) patterns from exceptional (irregular) ones. We document gradient vowel harmony patterns like that illustrated above in four Oceanic languages, namely Samoan, Tongan, Hawaiian, and Fijian to establish an empirical basis for the gradient patterns. We also endeavor to examine the same patterns in reconstructed forms from Proto-Oceanic and Proto-Malayo-Polynesian, in order to support historical investigation of the potential source of these patterns. Our hope is that this historical and comparative perspective places our formal analysis on firm empirical ground.

772
John Alderete and Sara Finley
The remainder of this article is organized as follows. In the next section, we investigate Samoan stem phonotactics further, and use this system to illustrate the methods employed for the phonotactic systems that follow. Section 3 provides some historical background for subsequent analysis, discussing the vowel systems of two ancestor languages and some phonological develop-ments that are relevant to the analysis. Section 4 goes on to explore the stem phonotactics of three additional Oceanic languages, Tongan, Hawaiian, and Fijian. In section 5, we investigate vowel co-occurrence in Proto-Oceanic (POC) and Proto-Malayo-Polynesian (PMP), looking for the same phonotactic patterns to determine whether the co-occurrence patterns have been inherited. Section 6 gives a summary of the core facts across languages in order to sharpen the analytical focus. In section 7, we analyze the gradient patterns of parasitic harmony drawing upon constraints from Feature Spreading 2.0 (Jurgec 2011), formalized in Harmonic Grammar (Legendre et al. 1992; Pater 2009; Smolensky et al. 1992). In the conclusion, we sketch some of the ways in which the core analysis may relate to harmony patterns found both within and outside the Austronesian language family.
2. Illustration of quantitative methods
This section explains the methods we use to extract generalizations about vowel co-occurrence by illustrating these methods for Samoan. In particular, we explain our methods for constructing stem lists, how contingency tables are constructed and analyzed from these lists, and the statistical tests used to establish the core generalizations.
The source for the Samoan data is Milner’s (1966) lexicon. We extracted 1,871 content morphemes, namely nouns, verbs, and a small number of adjectives, from this source. Bound roots, adjectives, and words with diphthongs were excluded, producing a list of 1,512 nouns and verbs, of which 1,031 were disyllabic. We excluded adjectives and bound roots because we wanted a relatively homogenous set of word classes, and these exclusions did not significantly reduce the list. Further, diphthongs are excluded because we focus here on the distribution of simple vowels across syllables. The diphthongs of Samoan (ei eu ai au ou oi ui) complicate these simple vowel pairs because the two components of the diphthongs introduce locality issues that we wish to factor out. The focus on disyllabic stems is also prudent because prior research, for example Krupa (1971), used primarily disyllabic stems, so exclusion of stems that are not disyllabic allows us to compare results. Furthermore, stems are canonically disyllabic and stressed on the penultimate syllable in Oceanic, so longer stems often have unknown morphological complexity and introduce uncontrolled stress differences. Lastly, we note that Samoan is typical of Oceanic languages in having several homophones. We do include many homophones when they represent lexemes with a distinct etymol-ogy. However, a member of a set of homophones is excluded if it has only a slightly different meaning from other members of the set or differs only in part of speech, the idea being that these stems do not really constitute distinct lexemes, hence they are not distinct observations.1
1 The full stem lists for Samoan and the other languages examined here are available from the first author’s datasets webpage, which is: http://www.anderei.net/datasets/.

773
Language and Linguistics 17(6)
The co-occurrence of vowels in disyllabic words (or ‘V–Vs’ below) is given in the two sub-tables in Table 2. The rows in each table indicate the simple vowel of the first syllable, and columns indicate the vowel of the second syllable. Table 2a gives the raw frequencies, and Table 2b gives the Observed/Expected values, a standardized measure that allows us to compare the frequency of one cell relative to row and column totals. O/E values that greatly exceed 1.0 are over-represented in the lexicon, and values that fall far below 1.0 are under-represented. Thus, the cells in Table 2b enable us to make observations like ‘i–i sequences are far greater than expected (2.18 > 1.0), compared to stems that contain i in the initial syllable, and stems that contain i in the second syllable’.
Table 2: Raw frequencies and O/E for Samoan disyllabic stems
2a. 2b.i e a o u i e a o u
i 52 5 26 30 12 2.18 0.28 0.69 1.19 0.59e 13 33 30 10 14 0.68 2.28 1.00 0.50 0.86a 52 47 122 73 55 0.78 0.93 1.16 1.04 0.97o 28 26 41 70 16 0.81 0.99 0.75 1.92 0.54u 33 24 61 5 55 0.97 0.93 1.14 0.14 1.90
In addition to O/E values, we also use inferential statistics to determine the reliability of the differences in frequencies. Following standard practice (Chomsky & Halle 1968), we form natural classes of vowels using three distinctive features: [back], [high], [low]. These features define three similarity classes of vowels of interest: identical (share three feature values), similar (share two feature values), and dissimilar (share one feature value). Since we do not examine the low vowel a in any of these tests, we do not compare any vowels that have no feature values in common at all. For the non-low vowels, two additional distinctions in natural class are relevant: front versus back, and high versus mid. In Table 3, we show different counts of identical versus similar vowels, aggregated by different feature classes. For example, there are 85 instances of identical front vowel pairs (52 i–i + 33 e–e) and 18 instances of similar front vowel pairs (13 e–i + 5 i–e) in the first row of Table 3a.
Two chi-square tests are reported in these tables: a one-way goodness of fit (GoF) test and a chi-square on the entire contingency table (CT).2 Since the rows represent simple two-way contrasts, we can assume that, all else being equal, the two classes of vowel sequences should have a 50/50 split.3 The GoF test looks at each row and assesses how well this 50/50 statistical model accounts for the data. The GoF tests are significant in all rows in Table 3, indicating that the 50/50 split model can be rejected for all contrasts. For example, the 50/50 split model can be rejected as a good
2 All tests were two-tailed and have one degree of freedom. The CT test used Yates’s correction.3 One might object to the assumption that the two classes should have a 50/50% split because a single low
frequency vowel might on its own lead to rejecting the null hypothesis. We checked for this by conducting a CT test on the inputs to the GoF tests, e.g. [55, 5; 13, 33] for Samoan /i e/, and found that all of the results were the same, except that two of 48 tests in the article were marginal rather than significant.

774
John Alderete and Sara Finley
predictor of the distributions of identical front vowels and similar front vowels, which are 85 and 18 respectively. The rationale here is that these classes deviate significantly from the 50/50 split, which requires explanation.
The CT test on the entire contingency table tests for an association between the categories indicated in the rows and columns. In Table 3a, for example, the CT test looks for an association between the front/back contrast and similarity (identical versus similar). Is the contrast between identical and similar vowel sequences (V–Vs henceforth) only found in one front-back class, for example, or are there different contrasts for front vowels and back vowels? The CT test in Table 3a is not significant (P = 0.6283), so there is no association between tongue-advancement and similar-ity. Looking at the broader results, Tables 3a and 3b show strong differences in the similarity classes, but no association with the feature classes [back] or [high] in either CT test. Thus, identical front vowel pairs in Table 3a outnumber similar pairs by close to a 4:1 ratio in Table 3a, and approximately a 3:1 ratio in Table 3b, which supports the rejection of the hypothesis that the two similarity classes have a roughly equal distribution. However, this difference between identical and similar V–Vs is not associated with a particular [αback] class, because the CT test is not significant. The same is true of the similarity effect sorted by height classes reported in Table 3b.
Table 3: Chi-square tests for effect of similarity, counts by feature classes
3a. Similarity, front/back Test χ2(1) P
Identical Similar CT 0.23 0.6283Front 85 (ii + ee) 18 (ie + ei) GoF 43.58 < 0.001 *Back 125 (uu + oo) 21 (uo + ou) GoF 74.08 < 0.001 *
Totals 210 39 GoF 117.43 < 0.001 *
3b. Similarity, high/mid Test χ2(1) P
Identical Similar CT 0.33 0.5662High 107 (ii + uu) 45 (iu + ui) GoF 25.29 < 0.001 *Mid 103 (ee + oo) 36 (eo + oe) GoF 32.30 < 0.001 *
Totals 210 81 GoF 57.19 < 0.001 *
We also examined the difference between pairs of similar and dissimilar vowels, that is vowels that share the value for two features (similar) or just one (dissimilar). These tests are motivated by the clear effect of order we find in vowel sequences: back-front V–Vs are much more common than front-back, and the similarity effect seems to be sensitive to the order of height classes. Table 4 applies the same statistical tests from above to similar-dissimilar classes. We find here clear asso-ciations with the two order classes. That is, the contrast between similar and dissimilar V–Vs is affected by order. Thus, similar and dissimilar pairs have a 1:2 ratio in front-back vowel pairs, that is i–u and e–o versus i–o and e–u, but the opposite order has a roughly equal distribution (Table 4a). Likewise, dissimilar pairs occur much more frequently than dissimilar pairs in high-mid sequences, but this is not so for mid-high sequences, again showing an association with the order of height classes (Table 4b).

775
Language and Linguistics 17(6)
Table 4: Chi-square tests for effect of similarity, counts by order classes
a. Similarity, front/back order classes Test χ2(1) P
Similar Dissimilar CT 5.78 0.0162 *Front–back 22 (iu + eo) 44 (io + eu) GoF 7.33 0.0068 *Back–front 59 (ui + oe) 52 (oi + ue) GoF 0.44 0.51
Totals 81 96 GoF 1.27 0.26
b. Similarity, high/mid order classes Test χ2(1) P
Similar Dissimilar CT 9.23 0.0024 *High–mid 10 (ie + uo) 54 (io + ue) GoF 30.25 < 0.001 *Mid–high 29 (ei + ou) 42 (oi + eu) GoF 2.38 0.12
Totals 39 96 GoF 24.07 < 0.001 *
In sum, there are clear differences between the occurrence of identical and similar, on the one hand, and similar and dissimilar, on the other, vowel pairs. However, the latter difference is only statisti-cally significant in certain orders, namely front-back and high-mid orders.
These relationships and associations are visualized in Figure 2, which plots O/E over the similarity classes for specific vowel pairs. Pairs of identical vowels are clearly over-represented, occurring much more frequently than pairs of both similar and dissimilar vowels. Pairs of dissimi-lar vowels approach an O/E of 1.0, suggesting that they are neither over- nor under-represented. With the exception of u–i and o–e, pairs of similar vowels are under-represented, with many falling drastically below 1.0. By comparing the specific V–Vs in the similar column, we can also see the order effect. Thus, for similar vowels only, there seems to be a preference for mid-high sequences; compare vowels on the left of the ‘2’ SharedFeature column. Likewise, there is a preference for back-front V–Vs (right side). The magnitude of both of the order effects is about a 0.3–0.4 difference in O/E.
Figure 2: Similarity avoidance and order effects in Samoan
776
John Alderete and Sara Finley
In §4 and §5, we examine data collected in essentially the same way and perform these same tests, both to provide additional support for these empirical generalizations and to compare how they apply across languages.
3. Historical background
Below we provide some historical perspective on the vowel co-occurrence patterns, examining vowel developments from PMP, vowel harmony in the larger Austronesian language family, and some conditioned phonological developments that are relevant to the central empirical claims.
Guided by prior research, Blust (2009[2013]) reconstructs the following vowel systems for PMP and POC. The four synchronic vowel systems we investigate are within the Central Pacific subgroup-ing, which is in turn grouped within Oceanic. An awareness of the ancestral vowel systems of PMP and POC may therefore provide some perspective on these present-day languages.
Table 5: PMP and POC reconstructed vowels
PMP POC
*a *a*ə *o*i *i*u *u
*–ay *e*–aw *o*–uy *i*–iw *i
PMP *ə is the least stable vowel and has many reflexes in Malayo-Polynesian languages other than POC *o. In contrast, the vowels *a, *i, and *u tend to be rather stable and have been preserved in at least some environments in all languages. While ‘diphthongs’ are rather rare in our PMP dataset, they did lead to some mid vowels in POC, as shown above. These developments raise the question of whether the under-represented V–Vs derive directly from the low frequency of vowels in an ancestor language. After all, all of the significantly under-represented V–Vs contain mid vowels, which are the reflexes of secondary vowels in PMP, that is *ə or diphthongs. It could just be that the V–Vs in question are under-represented because the secondary vowels were under-represented in POC and PMP. We investigate vowel co-occurrence in both POC and PMP in §5, but it is useful to quickly examine the raw frequencies of these vowels in these proto-languages to address this issue.
The frequencies of the five simple vowels of PMP, POC, and Samoan are given below (data sources are given in §2 for Samoan, and §5.1 and §5.2 for POC and PMP respectively; see also Chrétien 1965, Table 3, for data from Proto-Austronesian that are broadly similar to the PMP data below). It turns out that this historical perspective is really only useful in contextualizing e, which clearly had a low frequency in POC (the reconstructed sources in PMP for e are too complex to represent here, but they would presumably show the same point). On the other hand, the frequency of the mid vowel o, and its main source from PMP, *ə, are comparable with the frequency of all
777
Language and Linguistics 17(6)
other non-low vowels. It is even the second most frequent vowel in Samoan, which rules out a simple historical account of o.
Table 6: Vowel frequencies in PMP, POC, and Samoan disyllabic stems, sorted by stem position (1st/2nd syllable)
i e a o u1st 2nd 1st 2nd 1st 2nd 1st 2nd 1st 2nd
PMP 20.02 (omitted) 32.97 (*ə) 19.45 27.56 % total353 317 551 551 382 268 418 503
POC 16.85 4.48 34.31 19.84 24.52 % total118 130 17 49 268 237 133 159 200 161
Samoan 16.24 12.59 33.71 19.77 17.68 % total125 178 100 135 349 280 181 188 178 152
The crucial point, however, is that this historical account of e does not diminish the importance of its over- and under-representation in the vowel co-occurrence patterns we examine. In our chi-square tests, the frequencies never dip below the threshold for a valid test, and, more to the point, the frequencies are standardized, and so they give relative measures of vowel co-occurrence. For example, Samoan i–e has a low Observed/Expected value of 0.27 (see data from §2), because the observed number of actual forms is low, relative to the frequencies of CiCVC and CVCeC stems. Likewise, while there are only 33 CeCeC stems, the O/E for e–e is quite high at 2.28 because this is far above the expected vowel for such stems. It seems clear in the Samoan case, therefore, and even in POC and PMP systems discussed below in §5, that the behavior of both mid vowels calls out for an analysis.
While none of the languages examined here have morphophonemic vowel harmony, such rules are attested, albeit rarely, in the language family (see Blust 2009[2013]:257 ff.). A quick survey of these rules and certain harmony-like phonotactic generalizations is therefore useful to our under-standing of vowel co-occurrence in the family generally. A handful of languages exhibit prefixes that harmonize with the first vowels of the stem, including a few languages in which prefix vowels assimilate completely to the stem vowel, for example Balatank (eastern Celebic) maŋa-wawau ‘to do’, meŋe-memeli ‘to cool’, etc. (Busentiz & Busenitz 1991). Total assimilation of this kind is also attested in Kapampangan (Philippine, central Luzon) and Seediq (Formosan, Atayalic), and similar patterns with a subset of prefix vowels are documented in Banggai (eastern Celebic). Again, while rare, progressive harmony from a prefix or particle may also lead to alternations in stems, as in Chamorro fronting harmony: i gimaʔ ‘the house’, cf. gumaʔ.
Many Austronesian languages also exhibit co-occurrence restrictions that avoid disharmonic vowel sequences, like our Oceanic case studies here. For example, Sabah languages avoid oCa sequences, usually favoring aCa (Kroeger 1992), and Northern Sarawak languages have a strong tendency to avoid [+high] + [–high] vowel sequences when the two vowels agree in [back] (Blust 2009[2013]), a well-known type of height harmony. These alternations and static restrictions provide perspective on our results here. For example, the restriction against *high-mid vowels in Northern Sarawak languages is particularly interesting because we find the exact same order effect in Oceanic languages; see §2 and the discussion below.
778
John Alderete and Sara Finley
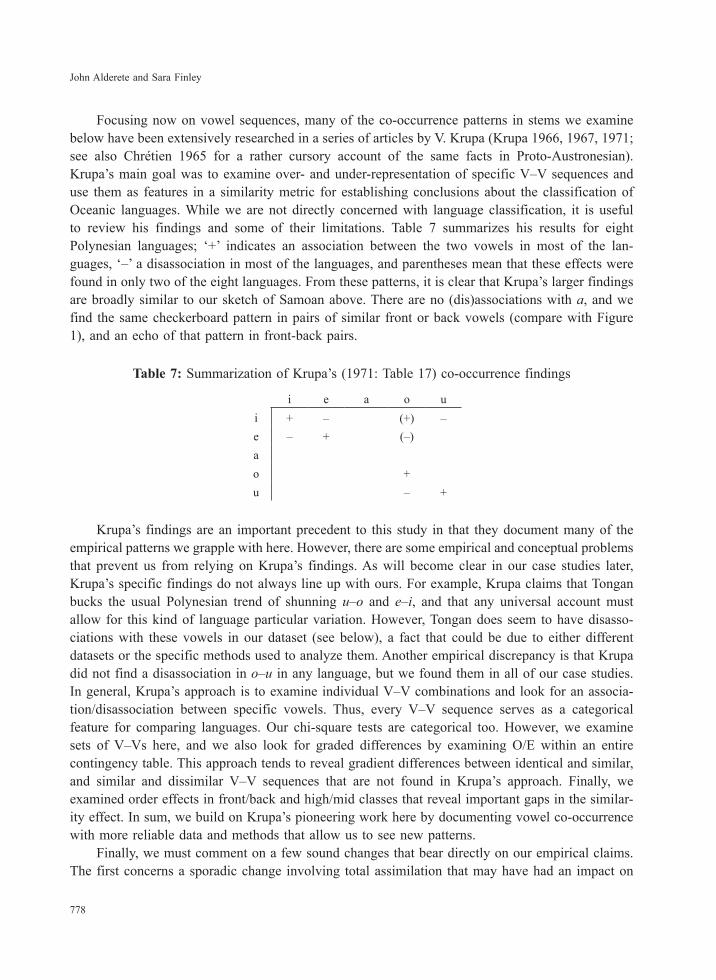
Focusing now on vowel sequences, many of the co-occurrence patterns in stems we examine below have been extensively researched in a series of articles by V. Krupa (Krupa 1966, 1967, 1971; see also Chrétien 1965 for a rather cursory account of the same facts in Proto-Austronesian). Krupa’s main goal was to examine over- and under-representation of specific V–V sequences and use them as features in a similarity metric for establishing conclusions about the classification of Oceanic languages. While we are not directly concerned with language classification, it is useful to review his findings and some of their limitations. Table 7 summarizes his results for eight Polynesian languages; ‘+’ indicates an association between the two vowels in most of the lan-guages, ‘–’ a disassociation in most of the languages, and parentheses mean that these effects were found in only two of the eight languages. From these patterns, it is clear that Krupa’s larger findings are broadly similar to our sketch of Samoan above. There are no (dis)associations with a, and we find the same checkerboard pattern in pairs of similar front or back vowels (compare with Figure 1), and an echo of that pattern in front-back pairs.
Table 7: Summarization of Krupa’s (1971: Table 17) co-occurrence findings
i e a o ui + – (+) –e – + (–)ao +u – +
Krupa’s findings are an important precedent to this study in that they document many of the empirical patterns we grapple with here. However, there are some empirical and conceptual problems that prevent us from relying on Krupa’s findings. As will become clear in our case studies later, Krupa’s specific findings do not always line up with ours. For example, Krupa claims that Tongan bucks the usual Polynesian trend of shunning u–o and e–i, and that any universal account must allow for this kind of language particular variation. However, Tongan does seem to have disasso-ciations with these vowels in our dataset (see below), a fact that could be due to either different datasets or the specific methods used to analyze them. Another empirical discrepancy is that Krupa did not find a disassociation in o–u in any language, but we found them in all of our case studies. In general, Krupa’s approach is to examine individual V–V combinations and look for an associa-tion/disassociation between specific vowels. Thus, every V–V sequence serves as a categorical feature for comparing languages. Our chi-square tests are categorical too. However, we examine sets of V–Vs here, and we also look for graded differences by examining O/E within an entire contingency table. This approach tends to reveal gradient differences between identical and similar, and similar and dissimilar V–V sequences that are not found in Krupa’s approach. Finally, we examined order effects in front/back and high/mid classes that reveal important gaps in the similar-ity effect. In sum, we build on Krupa’s pioneering work here by documenting vowel co-occurrence with more reliable data and methods that allow us to see new patterns.
Finally, we must comment on a few sound changes that bear directly on our empirical claims. The first concerns a sporadic change involving total assimilation that may have had an impact on
779
Language and Linguistics 17(6)
identical V–Vs. Elbert (1953) created a cognate list of 202 words from 20 Polynesian languages and found many instances of total vowel assimilation in which a sequence of two non-identical vowels in Proto-Polynesian (PPN) developed into a sequence of identical vowels, for example PPN *keli > Tikopia kere ‘dig’. In particular, Elbert found 33 cases of total assimilation in at least one language in the 202 word cognate list. It is not possible from Elbert’s dataset to calculate the percentage of total assimilations in any particular language, but these sound changes relate directly to our research focus because they may account for the over-representation of identical V–Vs. Scrutiny of the attested forms, however, suggests that this is unlikely. First, the percentage of total assimilations in any particular language is exceedingly low. Second, the input and output V–Vs do not seem to pattern with the vowel co-occurrence data we find in the daughter languages. For example, the ‘most marked’ pattern, that is the input V–V that undergoes total assimilation the most often, is a–o, accounting for 10 of the 33 cases; and 18 of the 33 cases, roughly half, contain a as either the first or second vowel. But V–Vs with a are not under-represented in any language. Furthermore, a–a is the most common output pattern of total assimilation, accounting for 11 of the 33 cases, compared with 10 outputs for u–u, 6 for o–o, 5 for e–e, and 3 for i–i. Thus, we have many sporadic total assimilations with a, and comparatively fewer with non-low vowels, which is the opposite of what we expect from Krupa’s work and our sketch of Samoan above. Clearly, additional factors are at work.
There also seem to be several widespread sound changes in Austronesian languages that actu-ally reduce the frequency of identical V–Vs. One is low vowel dissimilation, a conditioned change in some Oceanic languages that raises a when another a occurs in the following syllable (Blust 1996; Lynch 2003). This change had the effect of reducing a–a in stems. Oceanic languages also had sporadic fronting of *u to i, for example PPN *qumu > Hawaiian imu ‘earth oven’ (Blust 1970), which reduced the overall frequency of u–u sequences. Finally, in a host of conditioned changes in Austronesian languages, *ə has been reflected as i, u, o, and a in penultimate and ultimate syllables (Blust 2009[2013]), which affects stems that would have otherwise developed into o–o. We have not examined the impact of all of these in the languages we examine, but we believe that taken together these sound changes must have had the effect of reducing identical V–Vs in Oceanic. This conclusion makes the observation that they are over-represented in the lexicons of many languages all the more interesting.
4. Case studies: Synchronic systems
In this section we explore the same vowel co-occurrence patterns in three additional Oceanic languages, Tongan (Polynesian, Tongic), Hawaiian (Nuclear Polynesian), and Fijian (East Fijian-Polynesian). These languages and Samoan belong to the Central Pacific sub-grouping within Oceanic. The languages were selected because they have reasonably good dictionaries and they represent discrete systems within Central Pacific.
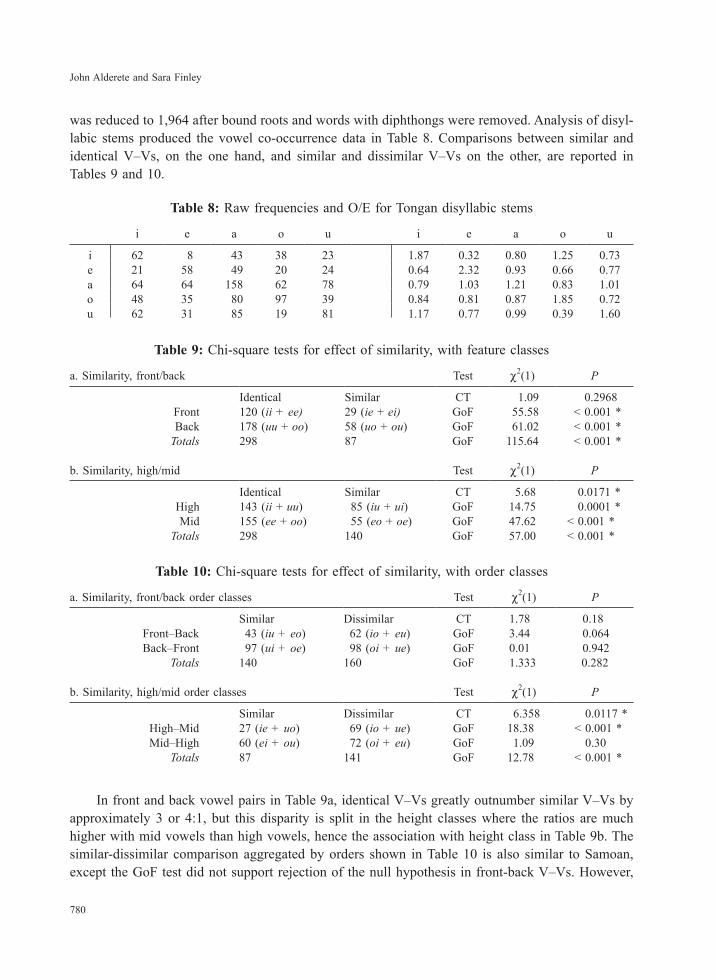
4.1 Tongan
The methods for extracting Tongan stems are essentially the same as those used above for Samoan. An initial list of 2,190 content words was compiled from Churchward (1959), and this list
780
John Alderete and Sara Finley
was reduced to 1,964 after bound roots and words with diphthongs were removed. Analysis of disyl-labic stems produced the vowel co-occurrence data in Table 8. Comparisons between similar and identical V–Vs, on the one hand, and similar and dissimilar V–Vs on the other, are reported in Tables 9 and 10.
Table 8: Raw frequencies and O/E for Tongan disyllabic stems
i e a o u i e a o u
i 62 8 43 38 23 1.87 0.32 0.80 1.25 0.73e 21 58 49 20 24 0.64 2.32 0.93 0.66 0.77a 64 64 158 62 78 0.79 1.03 1.21 0.83 1.01o 48 35 80 97 39 0.84 0.81 0.87 1.85 0.72u 62 31 85 19 81 1.17 0.77 0.99 0.39 1.60
Table 9: Chi-square tests for effect of similarity, with feature classes
a. Similarity, front/back Test χ2(1) P
Identical Similar CT 1.09 0.2968Front 120 (ii + ee) 29 (ie + ei ) GoF 55.58 < 0.001 *Back 178 (uu + oo) 58 (uo + ou) GoF 61.02 < 0.001 *
Totals 298 87 GoF 115.64 < 0.001 *
b. Similarity, high/mid Test χ2(1) P
Identical Similar CT 5.68 0.0171 *High 143 (ii + uu) 85 (iu + ui) GoF 14.75 0.0001 *Mid 155 (ee + oo) 55 (eo + oe) GoF 47.62 < 0.001 *
Totals 298 140 GoF 57.00 < 0.001 *
Table 10: Chi-square tests for effect of similarity, with order classes
a. Similarity, front/back order classes Test χ2(1) P
Similar Dissimilar CT 1.78 0.18Front–Back 43 (iu + eo) 62 (io + eu) GoF 3.44 0.064Back–Front 97 (ui + oe) 98 (oi + ue) GoF 0.01 0.942
Totals 140 160 GoF 1.333 0.282
b. Similarity, high/mid order classes Test χ2(1) P
Similar Dissimilar CT 6.358 0.0117 *High–Mid 27 (ie + uo) 69 (io + ue) GoF 18.38 < 0.001 *Mid–High 60 (ei + ou) 72 (oi + eu) GoF 1.09 0.30
Totals 87 141 GoF 12.78 < 0.001 *
In front and back vowel pairs in Table 9a, identical V–Vs greatly outnumber similar V–Vs by approximately 3 or 4:1, but this disparity is split in the height classes where the ratios are much higher with mid vowels than high vowels, hence the association with height class in Table 9b. The similar-dissimilar comparison aggregated by orders shown in Table 10 is also similar to Samoan, except the GoF test did not support rejection of the null hypothesis in front-back V–Vs. However,
781
Language and Linguistics 17(6)
the patterns are in line with Samoan, with a significant result for high-mid V–Vs and the same trend as Samoan in front-back pairs. These results support the claim that there is a graded continuum among identical, dissimilar, and similar V–Vs, and the order effects are in the same direction, favor-ing back-front and mid-high orders.
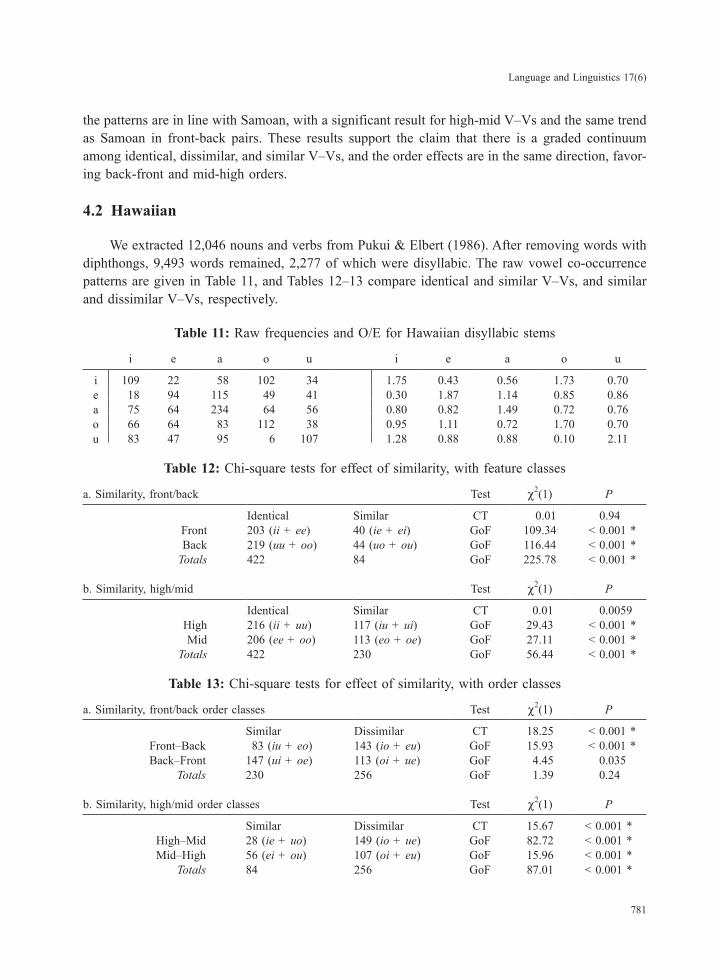
4.2 Hawaiian
We extracted 12,046 nouns and verbs from Pukui & Elbert (1986). After removing words with diphthongs, 9,493 words remained, 2,277 of which were disyllabic. The raw vowel co-occurrence patterns are given in Table 11, and Tables 12–13 compare identical and similar V–Vs, and similar and dissimilar V–Vs, respectively.
Table 11: Raw frequencies and O/E for Hawaiian disyllabic stems
i e a o u i e a o u
i 109 22 58 102 34 1.75 0.43 0.56 1.73 0.70e 18 94 115 49 41 0.30 1.87 1.14 0.85 0.86a 75 64 234 64 56 0.80 0.82 1.49 0.72 0.76o 66 64 83 112 38 0.95 1.11 0.72 1.70 0.70u 83 47 95 6 107 1.28 0.88 0.88 0.10 2.11
Table 12: Chi-square tests for effect of similarity, with feature classes
a. Similarity, front/back Test χ2(1) P
Identical Similar CT 0.01 0.94Front 203 (ii + ee) 40 (ie + ei) GoF 109.34 < 0.001 *Back 219 (uu + oo) 44 (uo + ou) GoF 116.44 < 0.001 *
Totals 422 84 GoF 225.78 < 0.001 *
b. Similarity, high/mid Test χ2(1) P
Identical Similar CT 0.01 0.0059High 216 (ii + uu) 117 (iu + ui) GoF 29.43 < 0.001 *Mid 206 (ee + oo) 113 (eo + oe) GoF 27.11 < 0.001 *
Totals 422 230 GoF 56.44 < 0.001 *
Table 13: Chi-square tests for effect of similarity, with order classes
a. Similarity, front/back order classes Test χ2(1) P
Similar Dissimilar CT 18.25 < 0.001 *Front–Back 83 (iu + eo) 143 (io + eu) GoF 15.93 < 0.001 *Back–Front 147 (ui + oe) 113 (oi + ue) GoF 4.45 0.035
Totals 230 256 GoF 1.39 0.24
b. Similarity, high/mid order classes Test χ2(1) P
Similar Dissimilar CT 15.67 < 0.001 *High–Mid 28 (ie + uo) 149 (io + ue) GoF 82.72 < 0.001 *Mid–High 56 (ei + ou) 107 (oi + eu) GoF 15.96 < 0.001 *
Totals 84 256 GoF 87.01 < 0.001 *

782
John Alderete and Sara Finley
Like Samoan and Tongan, identical V–Vs greatly outnumber similar by about 5:1 when sorted by front/back classes (Table 12a), and 2:1 sorted by height classes (Table 12b). Dissimilar pairs outnumber similar ones only in front-back V–Vs; back-front V–Vs actually have the opposite inequality, where similar V–Vs outnumber dissimilar (Table 13a). However, dissimilar V–Vs greatly outnumber similar V–Vs across the board when ordered by height categories (Table 13b). Apparently, Hawaiian does not have as strong a preference for mid-high orders as other languages examined here.
4.3 Fijian
A list of 3,720 content words from Capell (1941[1968]) was reduced to 3,311 after exclusions. Of these, 2,142 are disyllabic, and their vowel co-occurrence patterns are tabulated in Tables 14, 15, and 16.
Table 14: Raw frequencies and O/E for V–Vs in Fijian disyllabic stems
i e a o u i e a o u
i 114 12 96 55 12 1.95 0.27 1.04 1.19 0.25e 37 118 75 14 37 0.65 2.71 0.83 0.31 0.81a 130 71 249 86 90 1.03 0.73 1.24 0.86 0.88o 72 75 122 147 39 0.78 1.07 0.84 2.02 0.53u 60 40 112 25 155 0.76 0.66 0.89 0.40 2.43
Table 15: Chi-square tests for effect of similarity, with feature classes
a. Similarity, front/back Test χ2(1) P
Identical Similar CT 0.01 0.9203Front 232 (ii + ee) 49 (ie + ei) GoF 119.18 < 0.001 *Back 302 (uu + oo) 64 (uo + ou) GoF 146.33 < 0.001 *
Totals 534 113 GoF 273.94 < 0.001 *
b. Similarity, high/mid Test χ2(1) P
Identical Similar CT 1.36 0.2435High 269 (ii + uu) 72 (iu + ui) GoF 113.81 < 0.001 *Mid 265 (ee + oo) 89 (eo + oe) GoF 87.5 < 0.001 *
Totals 534 161 GoF 200.19 < 0.001 *
Table 16: Chi-square tests for effect of similarity, with order classes
a. Similarity, front/back order classes Test χ2(1) P
Similar Dissimilar CT 33.1 < 0.001 *Front–Back 26 (iu + eo) 92 (io + eu) GoF 36.92 < 0.001 *Back–Front 135 (ui +oe) 112 (oi + ue) GoF 2.14 0.1433
Totals 161 204 GoF 5.07 0.0244 *
b. Similarity, high/mid order classes Test χ2(1) P
Similar Dissimilar CT 5.16 0.0231High–Mid 37 (ie + uo) 95 (io + ue) GoF 25.49 < 0.001 *Mid–High 76 (ei + ou) 109 (oi + eu) GoF 5.89 0.0153 *
Totals 113 204 GoF 26.12 < 0.001 *
783
Language and Linguistics 17(6)
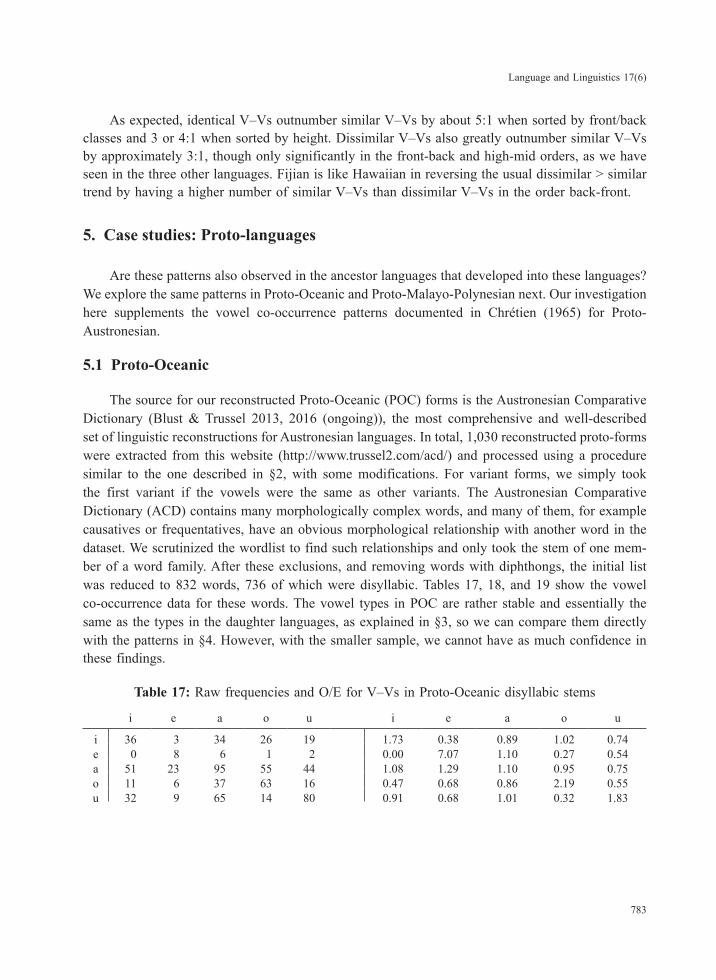
As expected, identical V–Vs outnumber similar V–Vs by about 5:1 when sorted by front/back classes and 3 or 4:1 when sorted by height. Dissimilar V–Vs also greatly outnumber similar V–Vs by approximately 3:1, though only significantly in the front-back and high-mid orders, as we have seen in the three other languages. Fijian is like Hawaiian in reversing the usual dissimilar > similar trend by having a higher number of similar V–Vs than dissimilar V–Vs in the order back-front.
5. Case studies: Proto-languages
Are these patterns also observed in the ancestor languages that developed into these languages? We explore the same patterns in Proto-Oceanic and Proto-Malayo-Polynesian next. Our investigation here supplements the vowel co-occurrence patterns documented in Chrétien (1965) for Proto- Austronesian.
5.1 Proto-Oceanic
The source for our reconstructed Proto-Oceanic (POC) forms is the Austronesian Comparative Dictionary (Blust & Trussel 2013, 2016 (ongoing)), the most comprehensive and well-described set of linguistic reconstructions for Austronesian languages. In total, 1,030 reconstructed proto-forms were extracted from this website (http://www.trussel2.com/acd/) and processed using a procedure similar to the one described in §2, with some modifications. For variant forms, we simply took the first variant if the vowels were the same as other variants. The Austronesian Comparative Dictionary (ACD) contains many morphologically complex words, and many of them, for example causatives or frequentatives, have an obvious morphological relationship with another word in the dataset. We scrutinized the wordlist to find such relationships and only took the stem of one mem-ber of a word family. After these exclusions, and removing words with diphthongs, the initial list was reduced to 832 words, 736 of which were disyllabic. Tables 17, 18, and 19 show the vowel co-occurrence data for these words. The vowel types in POC are rather stable and essentially the same as the types in the daughter languages, as explained in §3, so we can compare them directly with the patterns in §4. However, with the smaller sample, we cannot have as much confidence in these findings.
Table 17: Raw frequencies and O/E for V–Vs in Proto-Oceanic disyllabic stems
i e a o u i e a o u
i 36 3 34 26 19 1.73 0.38 0.89 1.02 0.74e 0 8 6 1 2 0.00 7.07 1.10 0.27 0.54a 51 23 95 55 44 1.08 1.29 1.10 0.95 0.75o 11 6 37 63 16 0.47 0.68 0.86 2.19 0.55u 32 9 65 14 80 0.91 0.68 1.01 0.32 1.83

784
John Alderete and Sara Finley
Table 18: Chi-square tests for effect of similarity, with feature classes
a. Similarity, front/back Test χ2(1) P
Identical Similar CT 2.67 0.1023Front 44 (ii + ee) 3 (ie + ei) GoF 35.77 < 0.001 *4
Back 143 (uu + oo) 30 (uo + ou) GoF 73.81 < 0.001 *Totals 187 33 GoF 107.8 < 0.001 *
b. Similarity, high/mid Test χ2(1) P
Identical Similar CT 12.52 0.0004 *High 116 (ii + uu) 51 (iu + ui) GoF 25.3 < 0.001 *Mid 71 (ee + oo) 7 (eo + oe) GoF 52.51 < 0.001 *
Totals 187 58 GoF 67.92 < 0.001 *
Table 19: Chi-square tests for effect of similarity, with order classes
a. Similarity, front/back order classes Test χ2(1) P
Similar Dissimilar CT 5.11 0.0238 *Front–Back 20 (iu + eo) 28 (io + eu) GoF 1.33 0.2482Back–Front 38 (ui + oe) 20 (oi + ue) GoF 5.59 0.0181 *
Totals 58 48 GoF 0.94 0.3314
b. Similarity, high/mid order classes Test χ2(1) P
Similar Dissimilar CT 3.02 0.082High–Mid 17 (ie + uo) 35 (io + ue) GoF 6.23 0.012 *Mid–High 16 (ei + ou) 13 (oi + eu) GoF 0.31 0.5775
Totals 33 48 GoF 2.78 0.095
The results show significant overlap with the four daughter languages, with an interesting wrinkle. Identical V–Vs significantly outnumber similar V–Vs by about 6:1 when sorted by front/back classes (Table 18a) and 3:1 when sorted by height classes (Table 18b). There is an association with height classes in this last table, where the identical-to-similar ratio is much larger for mid vowels, but this is similar to what was found in Tongan (§4.1). As for the differences in frequencies of similar and dissimilar V–Vs, the POC data show the expected pattern when this comparison is sorted by high/mid orders (19b), but we actually find an important inequality in back-front orders (19a). Similar back-front V–Vs outnumber back-front dissimilar V–Vs by 2:1, a significant difference that may explain the same trends in Hawaiian and Fijian.
The conclusion we can draw from these patterns is that the graded differences between identi-cal, dissimilar, and similar V–Vs found in the daughter languages were present in POC. One of the order effects was found, namely dissimilar > similar in high-mid orders only, so it is reasonable to expect that this was continued in the daughter languages. Interestingly, the preference for back-front
4 This result should be taken with a grain of salt, because the value for front similar V–Vs drops below the threshold for a chi-square test, and e is rather rare in POC in general. Still, the fact that e–e has the highest overall frequency for stems with e in the initial syllable is telling.
785
Language and Linguistics 17(6)
orders over front-back seems to be stronger in POC, so much so that we have a significant inequal-ity going in the opposite direction from the one expected. While this makes sense of the suggestive patterns in Hawaiian and Fijian, we did not find a dissimilar > similar inequality in front-back orders. Finally, these findings confirm our conjecture from §3 that the sporadic total assimilations docu-mented by Elbert in PPN are unlikely to be the primary cause of the vowel co-occurrence data documented here. They seem to have largely been inherited.
5.2 Proto–Malayo–Polynesian
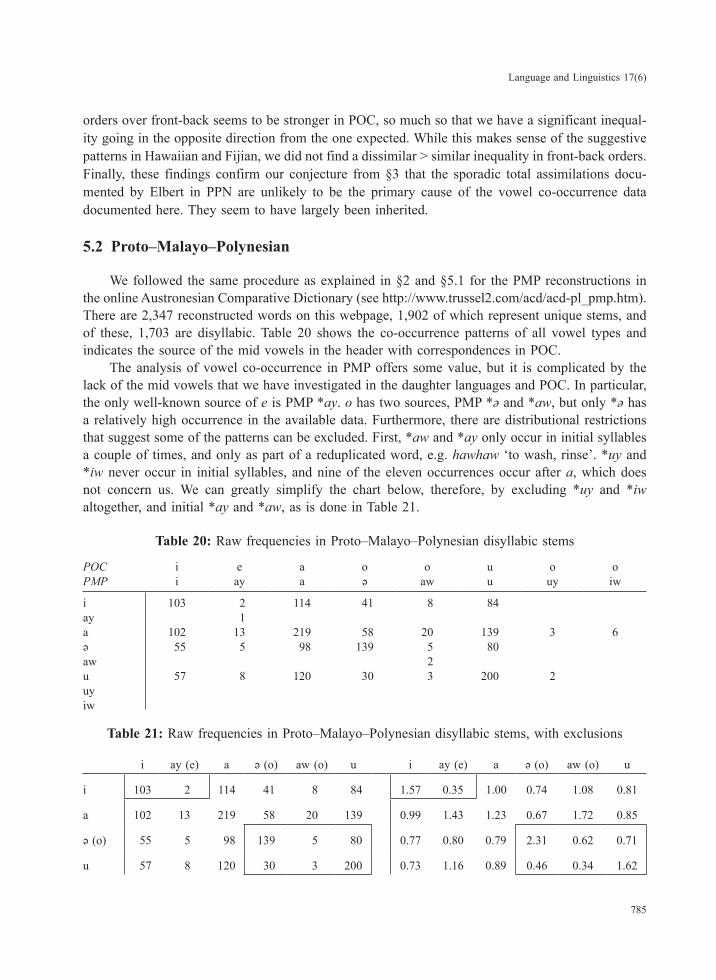
We followed the same procedure as explained in §2 and §5.1 for the PMP reconstructions in the online Austronesian Comparative Dictionary (see http://www.trussel2.com/acd/acd-pl_pmp.htm). There are 2,347 reconstructed words on this webpage, 1,902 of which represent unique stems, and of these, 1,703 are disyllabic. Table 20 shows the co-occurrence patterns of all vowel types and indicates the source of the mid vowels in the header with correspondences in POC.
The analysis of vowel co-occurrence in PMP offers some value, but it is complicated by the lack of the mid vowels that we have investigated in the daughter languages and POC. In particular, the only well-known source of e is PMP *ay. o has two sources, PMP *ə and *aw, but only *ə has a relatively high occurrence in the available data. Furthermore, there are distributional restrictions that suggest some of the patterns can be excluded. First, *aw and *ay only occur in initial syllables a couple of times, and only as part of a reduplicated word, e.g. hawhaw ‘to wash, rinse’. *uy and *iw never occur in initial syllables, and nine of the eleven occurrences occur after a, which does not concern us. We can greatly simplify the chart below, therefore, by excluding *uy and *iw altogether, and initial *ay and *aw, as is done in Table 21.
Table 20: Raw frequencies in Proto–Malayo–Polynesian disyllabic stems
POC i e a o o u o oPMP i ay a ə aw u uy iw
i 103 2 114 41 8 84ay 1a 102 13 219 58 20 139 3 6ə 55 5 98 139 5 80aw 2u 57 8 120 30 3 200 2uyiw
Table 21: Raw frequencies in Proto–Malayo–Polynesian disyllabic stems, with exclusions
i ay (e) a ə (o) aw (o) u i ay (e) a ə (o) aw (o) u
i 103 2 114 41 8 84 1.57 0.35 1.00 0.74 1.08 0.81
a 102 13 219 58 20 139 0.99 1.43 1.23 0.67 1.72 0.85
ə (o) 55 5 98 139 5 80 0.77 0.80 0.79 2.31 0.62 0.71
u 57 8 120 30 3 200 0.73 1.16 0.89 0.46 0.34 1.62

786
John Alderete and Sara Finley
Given these limitations on vowel co-occurrence, we cannot perform all of the chi-square tests we carried out above. For example, it is clear there is a difference between i–i and i–ay, which became i–e (see their boxed O/E values in Table 21), but we do not have a sufficient number of observations. We also note we do not know all of the sources of e in the daughter languages, so the low O/E of i–ay may be misleading. We can proceed with a bit more confidence with the sources of back vowels, namely *ə, *aw, and *u, though we only have a handful of cases with *aw. These seem to show the same patterns we have found in other languages: identical V–Vs are over- represented, and similar ones under-represented. Thus, if we sum the two available identical V–Vs (ə–ə and u–u) and compare that with the rest of the boxed back values in Table 21, we get 344 versus 113 observations, which is a significant contrast (GoF chi-square = 116.764, P < 0.001). We also note that the same trend in order relative to height categories is observed, where high-mid u–o order is less frequent than the mid-high o–u order: 0.37 versus 0.58, though this difference is less marked than what we find in the daughter languages. To sum up, while the PMP vowel co-occurrence data are difficult to compare with the rest of the data, the patterns for sources of back vowels are certainly consistent with our findings in POC.
For the sake of comparison, these findings are also consistent with the findings in Chrétien (1965), who documents vowel co-occurrence of *i, *a, *ə, and *u in Proto-Austronesian (see his Table 11), using reconstructed vocabulary from Dempwolff (1938). Chrétien documented over-representation of identical vowels (using a different metric), which in his data have a mean O/E of 1.74; however, only ə–ə, with an O/E of 2.45, is exceedingly high: compare 1.31 for i–i and 1.46 for u–u. Similar V–Vs are under-represented, with a mean O/E of 0.72, though there are not enough data to compare them with dissimilar V–Vs. The lowest O/E in Chrétien’s dataset is 0.40 for u–ə, which is very close to the corresponding measurement above for PMP.
6. Summary and analytical focus
We recap the fundamental results in the summary table below, which shows mean O/E for the three V–V types and the results of all our chi-square tests, that is the GoF and CT tests; ‘*’ indicates a significant test result.
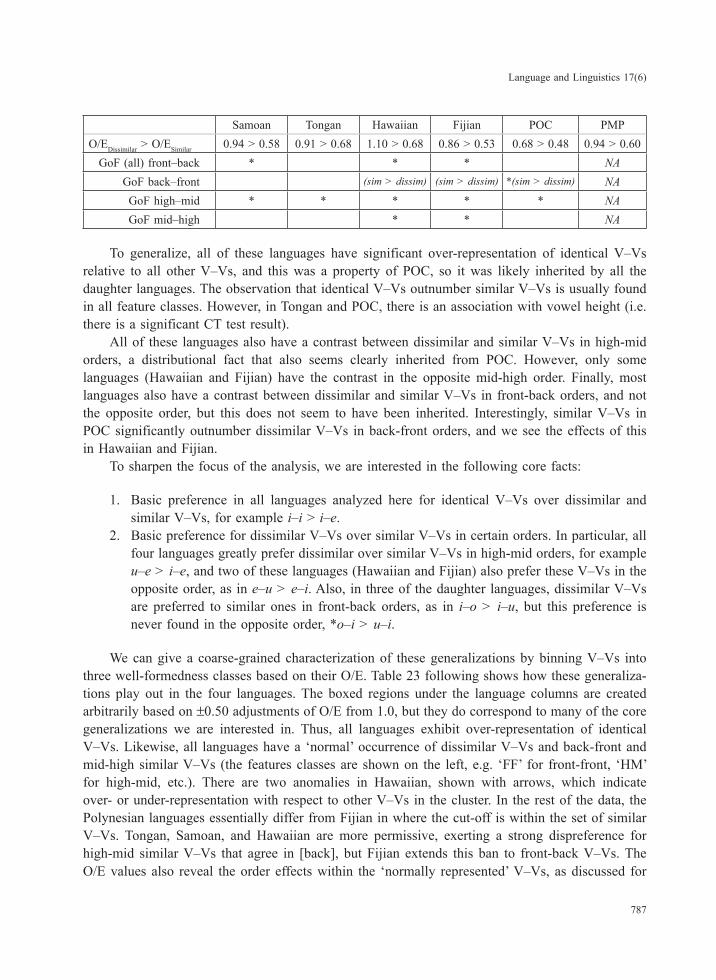
Table 22: Summary of vowel co-occurrence data
Samoan Tongan Hawaiian Fijian POC PMPO/EIdentical > O/ESimilar 2.06 > 0.94 1.91 > 0.91 1.86 > 1.10 2.27 > 0.86 3.20 > 0.68 1.83 > 0.94
GoF front * * * * * *?GoF back * * * * * *?
CT front/back NAGoF high * * * * * NAGoF mid * * * * * NA
CT height * * NA
787
Language and Linguistics 17(6)
Samoan Tongan Hawaiian Fijian POC PMPO/EDissimilar > O/ESimilar 0.94 > 0.58 0.91 > 0.68 1.10 > 0.68 0.86 > 0.53 0.68 > 0.48 0.94 > 0.60
GoF (all) front–back * * * NAGoF back–front (sim > dissim) (sim > dissim) *(sim > dissim) NAGoF high–mid * * * * * NAGoF mid–high * * NA
To generalize, all of these languages have significant over-representation of identical V–Vs relative to all other V–Vs, and this was a property of POC, so it was likely inherited by all the daughter languages. The observation that identical V–Vs outnumber similar V–Vs is usually found in all feature classes. However, in Tongan and POC, there is an association with vowel height (i.e. there is a significant CT test result).
All of these languages also have a contrast between dissimilar and similar V–Vs in high-mid orders, a distributional fact that also seems clearly inherited from POC. However, only some languages (Hawaiian and Fijian) have the contrast in the opposite mid-high order. Finally, most languages also have a contrast between dissimilar and similar V–Vs in front-back orders, and not the opposite order, but this does not seem to have been inherited. Interestingly, similar V–Vs in POC significantly outnumber dissimilar V–Vs in back-front orders, and we see the effects of this in Hawaiian and Fijian.
To sharpen the focus of the analysis, we are interested in the following core facts:
1. Basic preference in all languages analyzed here for identical V–Vs over dissimilar and similar V–Vs, for example i–i > i–e.
2. Basic preference for dissimilar V–Vs over similar V–Vs in certain orders. In particular, all four languages greatly prefer dissimilar over similar V–Vs in high-mid orders, for example u–e > i–e, and two of these languages (Hawaiian and Fijian) also prefer these V–Vs in the opposite order, as in e–u > e–i. Also, in three of the daughter languages, dissimilar V–Vs are preferred to similar ones in front-back orders, as in i–o > i–u, but this preference is never found in the opposite order, *o–i > u–i.
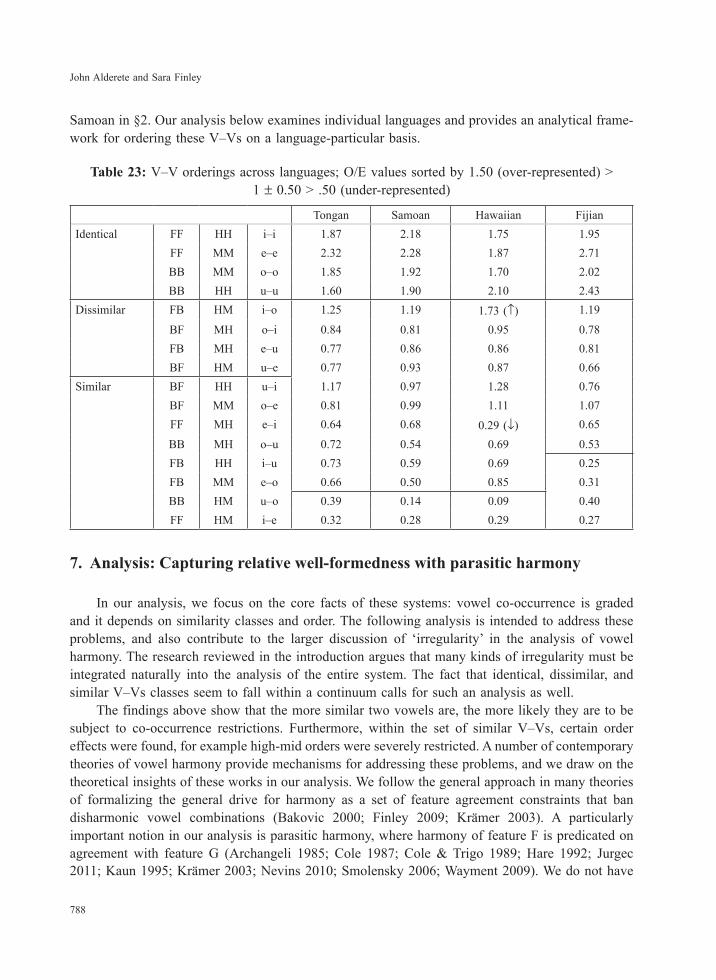
We can give a coarse-grained characterization of these generalizations by binning V–Vs into three well-formedness classes based on their O/E. Table 23 following shows how these generaliza-tions play out in the four languages. The boxed regions under the language columns are created arbitrarily based on ±0.50 adjustments of O/E from 1.0, but they do correspond to many of the core generalizations we are interested in. Thus, all languages exhibit over-representation of identical V–Vs. Likewise, all languages have a ‘normal’ occurrence of dissimilar V–Vs and back-front and mid-high similar V–Vs (the features classes are shown on the left, e.g. ‘FF’ for front-front, ‘HM’ for high-mid, etc.). There are two anomalies in Hawaiian, shown with arrows, which indicate over- or under-representation with respect to other V–Vs in the cluster. In the rest of the data, the Polynesian languages essentially differ from Fijian in where the cut-off is within the set of similar V–Vs. Tongan, Samoan, and Hawaiian are more permissive, exerting a strong dispreference for high-mid similar V–Vs that agree in [back], but Fijian extends this ban to front-back V–Vs. The O/E values also reveal the order effects within the ‘normally represented’ V–Vs, as discussed for
788
John Alderete and Sara Finley
Samoan in §2. Our analysis below examines individual languages and provides an analytical frame-work for ordering these V–Vs on a language-particular basis.
Table 23: V–V orderings across languages; O/E values sorted by 1.50 (over-represented) > 1 ± 0.50 > .50 (under-represented)
Tongan Samoan Hawaiian FijianIdentical FF HH i–i 1.87 2.18 1.75 1.95
FF MM e–e 2.32 2.28 1.87 2.71BB MM o–o 1.85 1.92 1.70 2.02BB HH u–u 1.60 1.90 2.10 2.43
Dissimilar FB HM i–o 1.25 1.19 1.73 (↑) 1.19
BF MH o–i 0.84 0.81 0.95 0.78FB MH e–u 0.77 0.86 0.86 0.81BF HM u–e 0.77 0.93 0.87 0.66
Similar BF HH u–i 1.17 0.97 1.28 0.76BF MM o–e 0.81 0.99 1.11 1.07FF MH e–i 0.64 0.68 0.29 (↓) 0.65
BB MH o–u 0.72 0.54 0.69 0.53FB HH i–u 0.73 0.59 0.69 0.25FB MM e–o 0.66 0.50 0.85 0.31BB HM u–o 0.39 0.14 0.09 0.40FF HM i–e 0.32 0.28 0.29 0.27
7. Analysis: Capturing relative well-formedness with parasitic harmony
In our analysis, we focus on the core facts of these systems: vowel co-occurrence is graded and it depends on similarity classes and order. The following analysis is intended to address these problems, and also contribute to the larger discussion of ‘irregularity’ in the analysis of vowel harmony. The research reviewed in the introduction argues that many kinds of irregularity must be integrated naturally into the analysis of the entire system. The fact that identical, dissimilar, and similar V–Vs classes seem to fall within a continuum calls for such an analysis as well.
The findings above show that the more similar two vowels are, the more likely they are to be subject to co-occurrence restrictions. Furthermore, within the set of similar V–Vs, certain order effects were found, for example high-mid orders were severely restricted. A number of contemporary theories of vowel harmony provide mechanisms for addressing these problems, and we draw on the theoretical insights of these works in our analysis. We follow the general approach in many theories of formalizing the general drive for harmony as a set of feature agreement constraints that ban disharmonic vowel combinations (Bakovic 2000; Finley 2009; Krämer 2003). A particularly important notion in our analysis is parasitic harmony, where harmony of feature F is predicated on agreement with feature G (Archangeli 1985; Cole 1987; Cole & Trigo 1989; Hare 1992; Jurgec 2011; Kaun 1995; Krämer 2003; Nevins 2010; Smolensky 2006; Wayment 2009). We do not have

789
Language and Linguistics 17(6)
any particular commitment to the formalization of parasitic harmony, but note that Jurgec’s Feature Spreading 2.0 model is up to the challenge posed by the empirical patterns we find here because of its parameterization of similarity and directionality effects.
The constraints given in Table 24 are from this theory, augmented with an AB/BA parameter for directionality. Feature Spreading 2.0 does not use this specific parameter, but we feel this theory is well suited to the problem of directionality for the following reason. In Feature Spreading 2.0, each agreement constraint contains two parameters for adjacent root successive nodes X1 and X2, paraphrased as follows.
Assign a violation mark if:(i) X1 is associated with Feature F, but X2 is not associated with F(ii) X1 is not associated with F, but X2 is associated with F.
Condition (i) requires agreement of X1 with X2, and (ii) requires agreement of X2 with X1. This is in essence a directionality effect: (i) is left-to-right agreement, and (ii) is right-to-left agreement. In our adapted system below, AB constraints require left-to-right agreement via (i), and BA constraints require right-to-left agreement (ii). It is important to note, however, that Feature Spreading 2.0 requires featural alignment, which we do not discuss here. In some ways, therefore, the present analysis is also similar to the directionality effects formalized in Hayes & Londe (2006), who treat back harmony in Hungarian as the result of *[+back][–back] to get the directionality effect.
Table 24: Agree constraints, modelled after Feature Spreading 2.0 constraints
AgreeAB[αhigh]–[+BAck] If two vowels are associated with the same [αhigh], then if A is associated with [+back], then B must also be associated with [+back].
AgreeBA[αhigh]–[+BAck] If two vowels are associated with the same [αhigh], then if B is associated with [+back], then A must also be associated with [+back].
AgreeAB[αBAck]–[+high] If two vowels are associated with the same [αback], then if A is associated with [+high], then B must also be associated with [+high].
AgreeBA[αBAck]–[+high] If two vowels are associated with the same [αback], then if B is associated with [+high], then A must also be associated with [+high].
Agreehigh Vowels agree in [αhigh].AgreeBAck Vowels agree in [αback].
With these four basic parasitic harmony constraints, and two general harmony constraints, it is a rather simple matter to establish the markedness relations implied by the frequency data with weight assignments from Harmonic Grammar (Legendre et al. 1992; Pater 2009; Smolensky et al. 1992). With the weights given in Table 25 below, harmony scales rather well with the O/E values. There are many possible weight assignments that are consistent with the Samoan data, but these are chosen to give the largest amount of transparency within the tableau for the various effects of constraint violation.

790
John Alderete and Sara Finley
Table 25: O/E scales by harmony, Samoan (compares with Tongan and Hawaiian)
Ag
ree
AB
[h
igh
]–B
Ac
k
Ag
ree
BA
[h
igh
]–B
Ac
k
Ag
ree
AB
[B
Ac
k]–
hig
h
Ag
ree
BA
[B
Ac
k]–
hig
h
Ag
ree
hig
h
Ag
ree
BA
ck
–50 –250 –450 –250 –50 –50 harmony O/Eidentical i–i 0 2.18
e–e 0 2.28o–o 0 1.92u–u 0 1.9
dissimilar i–o 1 1 –100 1.19o–i 1 1 –100 0.81e–u 1 1 –100 0.86u–e 1 1 –100 0.93
similar BF u–i 1 1 –100 0.97o–e 1 1 –100 0.99
similar MH e–i 1 1 –300 0.68o–u 1 1 –300 0.54
similar FB i–u 1 1 –300 0.59e–o 1 1 –300 0.5
similar HM u–o 1 1 –500 0.14i–e 1 1 –500 0.28
Because we are dealing with static phonotactic restrictions, we do not provide an analysis of the mappings from underlying forms to outputs. The differences in harmony values are posited as a way of structuring the data so that less frequent forms have lower overall harmony. In the literature on gradient phonotactics (see Hayes & Wilson 2008), these differences in harmony are expected to correlate with differences in native speaker intuitions of gradient well-formedness. This predicts that native speakers should rate words with lower O/E values (and therefore lower harmony scores) as having lower levels of acceptability. While this is a question for future research, previous research has shown a connection between nonce-word ratings and O/E (Frisch et al. 2000). Nonetheless, we do conjecture a role for faithfulness constraints in input-to-output mappings to account for some of the oddball V–Vs patterns discussed below.
In addition to giving us the relative harmony values for classifying the data in Samoan, this analysis seems to extend well to the other languages. The same basic constraint system and weight assignments will apply to the data in Tongan, as the cut-offs in O/E values are very similar (see Table 23). Fijian, however, presents an interesting difference. Both high-mid and front-back V–Vs are severely under-represented in this language, unlike Samoan and Tongan. By increasing the negative weight of AgreeBA[αhigh]–[+BAck] from –250 to –450, these two shunned V–Vs receive the same high harmony score of –500, as shown in Table 26 next.

791
Language and Linguistics 17(6)
Table 26: O/E scales by harmony, Fijian
Ag
ree
AB
[h
igh
]–B
Ac
k
Ag
ree
BA
[h
igh
]–B
Ac
k
Ag
ree
AB
[B
Ac
k]–
hig
h
Ag
ree
BA
[B
Ac
k]–
hig
h
Ag
ree
hig
h
Ag
ree
BA
ck
–50 –450 –450 –250 –50 –50 harmony O/Eidentical i–i 0 1.95
e–e 0 2.71o–o 0 2.02u–u 0 2.43
dissimilar i–o 1 1 –100 1.19o–i 1 1 –100 0.78e–u 1 1 –100 0.81u–e 1 1 –100 0.66
similar BF u–i 1 1 –100 0.76o–e 1 1 –100 1.07
similar MH e–i 1 1 –300 0.65o–u 1 1 –300 0.53
similar FB i–u 1 1 –500 0.25e–o 1 1 –500 0.31
similar HM u–o 1 1 –500 0.40i–e 1 1 –500 0.27
Hawaiian V–Vs are interesting in that they present some challenges to the basic system sketched in Table 25, but there seem to be tractable ways of extending it to Hawaiian as well. One immedi-ate problem is that e–i is roughly equal to i–e in Hawaiian, which really sets Hawaiian apart from the other three daughter languages. With an O/E of .29, both V–Vs seem relegated to the lower ranks of the system. One idea for this case is to unify the constraints banning these V–Vs by remov-ing the AB/BA parameter (or using the conjoined constraint from Jurgec (2011)), that is a general Agree[αBAck]–[+high] constraint, and assigning the unified constraint a higher negative weight. This move will have the effect of assigning greater markedness to o–u, but an alternative tack may be applicable in this case. Another fact of interest in Hawaiian is the relatively high O/E of i–o, as well as the unusually low O/E of u–o. Indeed, i–o compares with identical V–Vs. While we have sidestepped the analysis of mappings so far, one idea would be that i–o has higher than expected O/E because it is the output of a mapping that takes u–o as input and results in i–o, that is fronting of u before a syllable containing o. It is not obvious what independent evidence there is for such a mapping, but it could give i–o the needed boost to account for these differences. In sum, Hawaiian seems to require some extensions of our core Samoan system, but ones that do seem tractable.

792
John Alderete and Sara Finley
8. Conclusion
We have shown above how parasitic harmony constraints can provide the foundations of an analysis of similarity and directionality effects in the vowel co-occurrence patterns. How do the constraints in this analysis relate to tried-and-true constraints in other harmony systems? In other words, what is the appeal for these constraints in other Austronesian languages and more broadly? The constraints employed above are general constraints for parasitic vowel harmony, and we are essentially arguing that the same constraints employed for [back], [high], and [round] parasitic harmony are active in Oceanic stem phonotactics. [back] harmony predicated on similarity in height, and height harmony predicated on sameness in [back] are routinely encountered in typologies of vowel harmony, and so they do not need to be invoked here. Indeed, we find evidence for the operative constraints within Austronesian: Northern Sarawak languages exhibit height harmony triggered by shared [back] specifications, effectively banning high-mid V–Vs and producing the effects similar to that predicted by AgreeAB[αBAck]–[+high]. We are confident therefore that the constraints above relate the Oceanic data to other languages. However, given the problems docu-mented above for Hawaiian, we do not yet know how far these cross-linguistic parallels can be drawn. For example, if the analysis of Hawaiian sketched above involving unfaithful mappings is unsuccessful, then we may have to resort to constraints that target specific V–Vs, for example e–i, which starts to have less cross-linguistic appeal. We hope that future work documenting native speaker intuitions of vowel co-occurrence can help sort out whether these specific patterns can be resolved with more general or language-particular constraints.
References
Alderete, John, & Mark Bradshaw. 2013. Samoan root phonotactics: digging deeper into the data. Linguistic Discovery 11.1:1–21.
Archangeli, Diana. 1985. Yokuts harmony: evidence for coplanar representation in nonlinear phonol-ogy. Linguistic Inquiry 16.3:335–372.
Archangeli, Diana, & Douglas Pulleyblank. 1994. Grounded Phonology. Cambridge: MIT Press.Archangeli, Diana, Jeff Mielke, & Douglas Pulleyblank. 2012a. From sequence frequencies to condi-
tions in Bantu vowel harmony: building a grammar from the ground up. McGill Working Papers in Linguistics 22.1:1–26.
Archangeli, Diana, Jeff Mielke, & Douglas Pulleyblank. 2012b. Greater than noise: frequency effects in Bantu height harmony. Phonological Explorations: Empirical, Theoretical and Diachronic Issues, ed. by Bert Botma & Roland Noske, 191–222. Berlin & Boston: De Gruyter.
Bakovic, Eric. 2000. Harmony, Dominance, and Control. New Brunswick: Rutgers University dissertation.
Blust, Robert A. 1970. i and u in the Austronesian languages. Working Papers in Linguistics 2.6:113–145.
Blust, Robert A. 1996. Low vowel dissimilation in Ere. Oceanic Linguistics 35.1:96–112.Blust, Robert A. 2009[2013]. The Austronesian Languages. Canberra: Pacific Linguistics.

793
Language and Linguistics 17(6)
Blust, Robert A., & Stephen Trussel. 2013. The Austronesian comparative dictionary: a work in progress. Oceanic Linguistics 52.2:493–523.
Blust, Robert A., & Stephen Trussel. 2016 (ongoing). Austronesian Comparative Dictionary, web edition. Available at http://www.trussel2.com/acd/ (accessed 18 January 2016).
Busentiz, Robert L., & Marilyn J. Busenitz. 1991. Balantak phonology and morphophonemics. Studies in Sulawesi Linguistics, Part II, ed. by James N. Sneddon, 29–47. Jakarta: Atma Jaya Catholic University.
Capell, Arthur. 1941[1968]. A New Fijian Dictionary. Sydney: Australasian Medical Publishing Co.Chomsky, Noam, & Morris Halle. 1968. The Sound Pattern of English. New York: Harper & Row.Chrétien, C. Douglas. 1965. The statistical structure of the Proto-Austronesian morph. Lingua 14:243–
270.Churchward, C. Maxwell. 1959. Tongan Dictionary: Tongan-English and English-Tongan. London:
Oxford University Press.Clements, G. N., & Engin Sezer. 1982. Vowel and consonant disharmony in Turkish. The Structure of
Phonological Representations, ed. by Harry van der Hulst & Norval Smith, 213–255. Dordrecht: Foris.
Cole, Jennifer. 1987. Planar Phonology and Morphology. Cambridge: MIT dissertation.Cole, Jennifer, & Loren Trigo. 1989. Parasitic harmony. Features, Segmental Structure and Harmony
Processes, ed. by Harry van der Hulst & Norval Smith, 19–38. Dordrecht: Foris.Dempwolff, Otto. 1938. Vergleichende Lautlehre des Austronesischen Wortschatzes, Band 3:
Austronesisches Wörterverzeichnis (Beihefte zur Zeitschrift für Eingeborenen-Sprachen 19). Berlin: Dietrich Reimer.
Elbert, Samuel H. 1953. Internal relationships of Polynesian languages and dialects. Southwestern Journal of Anthropology 9.2:147–173.
Finley, Sara. 2009. Formal and Cognitive Restrictions on Vowel Harmony. Baltimore: Johns Hopkins University dissertation.
Frisch, Stefan. 1996. Similarity and Frequency in Phonology. Evanston: Northwestern University dissertation.
Frisch, Stefan A., Nathan R. Large, & David B. Pisoni. 2000. Perception of wordlikeness: effects of segment probability and length on the processing of nonwords. Journal of Memory and Language 42.4:481–496.
Goldsmith, John, & Jason Riggle. 2012. Information theoretic approaches to phonological structure: the case of Finnish vowel harmony. Natural Language and Linguistic Theory 30.3:859–896.
Hare, Mary. 1992. The role of similarity in Hungarian vowel harmony: a connectionist account. Con-nectionist Natural Language Processing, ed. by Noel Sharkey, 295–322. Dordrecht: Springer.
Harrison, K. David. 1999. Vowel harmony and disharmony in Tuvan and Tofa. Paper presented at the 2nd Asian GLOW, September 19–22, 1999. Nagoya: Nanzan University.
Hayes, Bruce, & Zsuzsa Cziráky Londe. 2006. Stochastic phonological knowledge: the case of Hungarian vowel harmony. Phonology 23.1:59–104.
Hayes, Bruce, & Colin Wilson. 2008. A maximum entropy model of phonotactics and phonotactic learning. Linguistic Inquiry 39.3:379–440.
Jurgec, Peter. 2011. Feature Spreading 2.0: A Unified Theory of Assimilation. Tromsø: University of Tromsø dissertation.
794
John Alderete and Sara Finley
Kaun, Abigail Rhoades. 1995. The Typology of Rounding Harmony: An Optimality Theoretic Account. Los Angeles: UCLA dissertation.
Krämer, Martin. 2003. Vowel Harmony and Correspondence Theory. Berlin: De Gruyter Mouton.Kroeger, Paul R. 1992. Vowel harmony systems in three Sabahan languages. Shifting Patterns of
Language Use in Borneo: Proceedings of the Second Biennial International Conference, ed. by Peter W. Martin, 279–296. Kota Kinabalu: Borneo Research Council.
Krupa, Viktor. 1966. The phonemic structure of bi-vocalic morphemic forms in Oceanic languages. Journal of the Polynesian Society 75.4:458–497.
Krupa, Viktor. 1967. On phonemic structure of morpheme in Samoan and Tongan. Beiträge zur Linguistik und Informationsverarbeitung 12:72–83.
Krupa, Viktor. 1971. The phonotactic structure of the morph in Polynesian languages. Language 47.3:668–684.
Legendre, Géraldine, Yoshiro Miyata, & Paul Smolensky. 1992. Can connectionism contribute to syntax? Harmonic grammar, with an application. CLS 26: Papers from the 26th Regional Meeting of the Chicago Linguistic Society, ed. by Michael Ziolkowski, Manuela Noske & Karen Deaton, 237–252. Chicago: Chicago Linguistic Society.
Lynch, John D. 2003. Low vowel dissimilation in Vanuatu languages. Oceanic Linguistics 42:359–406.
Milner, George Bertram. 1966. Samoan Dictionary: Samoan-English, English-Samoan. London: Oxford University Press.
Nevins, Andrew. 2010. Locality in Vowel Harmony. Cambridge: MIT Press.Pater, Joe. 2009. Weighted constraints in generative linguistics. Cognitive Science 33.6:999–1035.Pierrehumbert, Janet. 1993. Dissimilarity in the Arabic verbal roots. Proceedings of the North East
Linguistic Society 23, University of Ottawa, ed. by Amy J. Schafer, 367–381. Amherst: GLSA.Pukui, Mary Kawena, & Samuel H. Elbert. 1986. Hawaiian Dictionary: Hawaiian-English, English-
Hawaiian. Honolulu: University of Hawaii Press.Smolensky, Paul. 2006. Optimality in phonology II: harmonic completeness, local constraint conjunc-
tion, and feature domain markedness. The Harmonic Mind: From Neural Computation to Optimality-Theoretic Grammar, Volume 2: Linguistic and Philosophical Implications, ed. by Paul Smolensky & Géraldine Legendre, 27–157. Cambridge: MIT Press.
Smolensky, Paul, Géraldine Legendre, & Yoshiro Miyata. 1992. Principles for an integrated connec-tionist/symbolic theory of higher cognition; CU-CS-600-92. Computer Science Technical Reports, Paper 575. Available at http://scholar.colorado.edu/csci_techreports/575 (accessed 20 January 2016).
Vago, Robert M. 1980. The Sound Pattern of Hungarian. Washington, D.C.: Georgetown University Press.
Wayment, Adam. 2009. Assimilation as Attraction: Computing Distance, Similarity, and Locality in Phonology. Baltimore: Johns Hopkins University dissertation.

795
Language and Linguistics 17(6)
[Received 22 October 2015; revised 23 January 2016; accepted 26 January 2016]
John Alderete (corresponding author)Department of Linguistics Simon Fraser UniversityBurnaby, B.C. V5A 1S6Canada [email protected]
Sara FinleyDepartment of PsychologyPacific Lutheran University12180 Park Avenue S.Tacoma, WA [email protected]
796
John Alderete and Sara Finley
海洋語系漸層式元音和諧
John Alderete1 Sara Finley2
西門菲莎大學1
太平洋路德大學2
本文通過探討原海洋語系的漸次共現元音以進一步了解漸層式的音韻規律。本文尤
其研究薩摩亞語、湯加語、夏威夷語、斐濟語,以及重構過的原海洋語和原馬來–波里尼
西亞語裡雙音節詞所呈現的共現元音規律。調查發現,一般來說相同的元音偶對
(如 *i–i*)有過量的樣本,相近的元音偶對(如 *i–e*)有不足量的樣本,而不相同的
元音偶對(如 *i–o*)則沒有特定的規限。另外,各語言的元音線性次序亦影響著這些漸
層式的限制,因為不相等的頻繁率(不相近偶對 > 相近偶對)只出現在某些線性次序。
本研究著重收錄這些共現元音規律的樣本,以使將來的理論研究能夠建立於穩健的數據
基礎。本文亦提出利用寄生性元音和諧的漸層式限制作出理論性的分析。
關鍵詞:元音和諧,南島語系,漸層式規律,寄生性和諧