
Grade 8 Science MCA-III Item Sampler Teacher...
25
Grade 8 Science MCA Item Sampler Teacher Guide Overview of Item Samplers Item samplers are one type of student resource provided to help students and educators prepare for test administration. While standardized tests are familiar to almost all students, each assessment has its own layout and ways students interact with it. The item samplers should be used to familiarize students and educators with how the content is assessed by providing examples of the format and item types students could encounter on the MCA. Other Resources While this Teacher Guide provides detailed information about the item samplers, the student tutorial is the resource that should be used to familiarize students and educators with the general functionality of the online test, including navigation, tools, and examples of all item types. For further information about the student tutorial and using student resources, refer to the Purposes of Student Resources on the Item Samplers page of PearsonAccess Next (PearsonAccess Next > Preparing for Testing > Item Samplers). Please contact [email protected] for any questions about the MCA or resources for testing. Contents of this Teacher Guide The Teacher Guides provide supplementary information for the items in the online item samplers, including: • An answer key* • Item images • Rationales for correct and incorrect answer options • Benchmarks the sample items align to from the test specifications • Cognitive complexity (indicated as Depth of Knowledge or DOK) from the test specifications • Data on the percentage of student response for each answer option, for science items that were previously administered on the MCA For detailed information on benchmarks and cognitive complexity levels, see the test specifications on the MDE website (Districts, Schools and Educators > Statewide Testing > Test Specifications). *All items in the paper item samplers (12-point, 18-point, 24-point, and braille test books) are also represented in this Teacher Guide. However, the simulation is not included in the paper accommodated samplers so item numbers in the key must be adjusted when used with these materials. Student Responses Upon completion of the online item samplers, a report is displayed, which provides student responses for some item types. This report can be printed for use in conjunction with the information in this Teacher’s Guide on how the student responded to those items. The overall score on the report is not a predictor of performance on the MCA; it is simply a total of correct responses. Note: student responses for multiple-choice and multiple-response items will display the student’s response followed by an underscore and additional text (e.g., A_A). Please ignore the information after the underscore.
Transcript of Grade 8 Science MCA-III Item Sampler Teacher...
Grade 8 Science MCA Item Sampler Teacher Guide
Overview of Item Samplers
Item samplers are one type of student resource provided to help students and educators prepare for test administration. While standardized tests are familiar to almost all students, each assessment has its own layout and ways students interact with it. The item samplers should be used to familiarize students and educators with how the content is assessed by providing examples of the format and item types students could encounter on the MCA.
Other Resources
While this Teacher Guide provides detailed information about the item samplers, the student tutorial is the resource that should be used to familiarize students and educators with the general functionality of the online test, including navigation, tools, and examples of all item types.
For further information about the student tutorial and using student resources, refer to the Purposes of Student Resources on the Item Samplers page of PearsonAccess Next (PearsonAccess Next > Preparing for Testing > Item Samplers). Please contact [email protected] for any questions about the MCA or resources for testing.
Contents of this Teacher Guide
The Teacher Guides provide supplementary information for the items in the online item samplers, including:
• An answer key* • Item images • Rationales for correct and incorrect answer options • Benchmarks the sample items align to from the test specifications • Cognitive complexity (indicated as Depth of Knowledge or DOK) from the test specifications • Data on the percentage of student response for each answer option, for science items that were previously
administered on the MCA
For detailed information on benchmarks and cognitive complexity levels, see the test specifications on the MDE website (Districts, Schools and Educators > Statewide Testing > Test Specifications).
*All items in the paper item samplers (12-point, 18-point, 24-point, and braille test books) are also represented in this Teacher Guide. However, the simulation is not included in the paper accommodated samplers so item numbers in the key must be adjusted when used with these materials.
Student Responses Upon completion of the online item samplers, a report is displayed, which provides student responses for some item types. This report can be printed for use in conjunction with the information in this Teacher’s Guide on how the student responded to those items. The overall score on the report is not a predictor of performance on the MCA; it is simply a total of correct responses. Note: student responses for multiple-choice and multiple-response items will display the student’s response followed by an underscore and additional text (e.g., A_A). Please ignore the information after the underscore.
Section 1
Scenario: Lake Superior
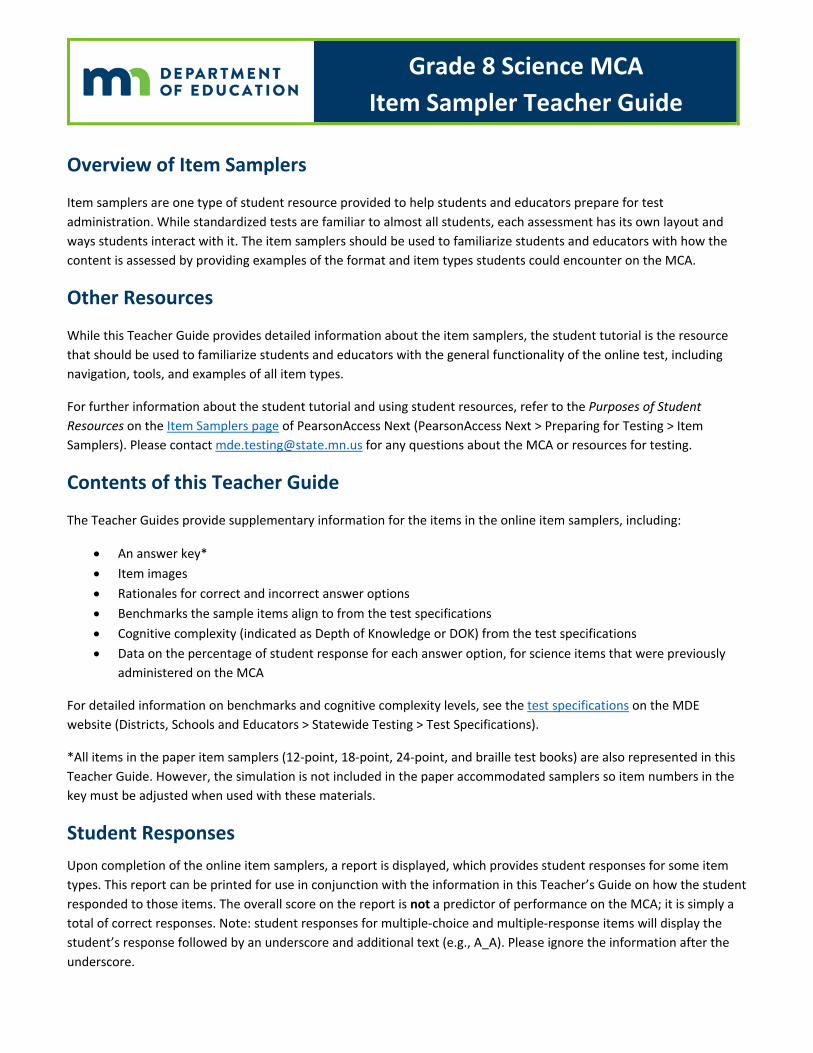
Question 1
Benchmark: 8.3.1.2.2
Explain the role of weathering, erosion, and glacial activity in shaping Minnesota's current landscape.
DOK: 2
Answer option Rationale Percent of student responses
A Fossils can occur without glaciers.
13%
B Wind erosion is not due to glaciers.
8%
C Chemical weathering can occur without glaciers.
28%
Correct: D Striations are a direct result of glaciers moving over exposed rock.
51%
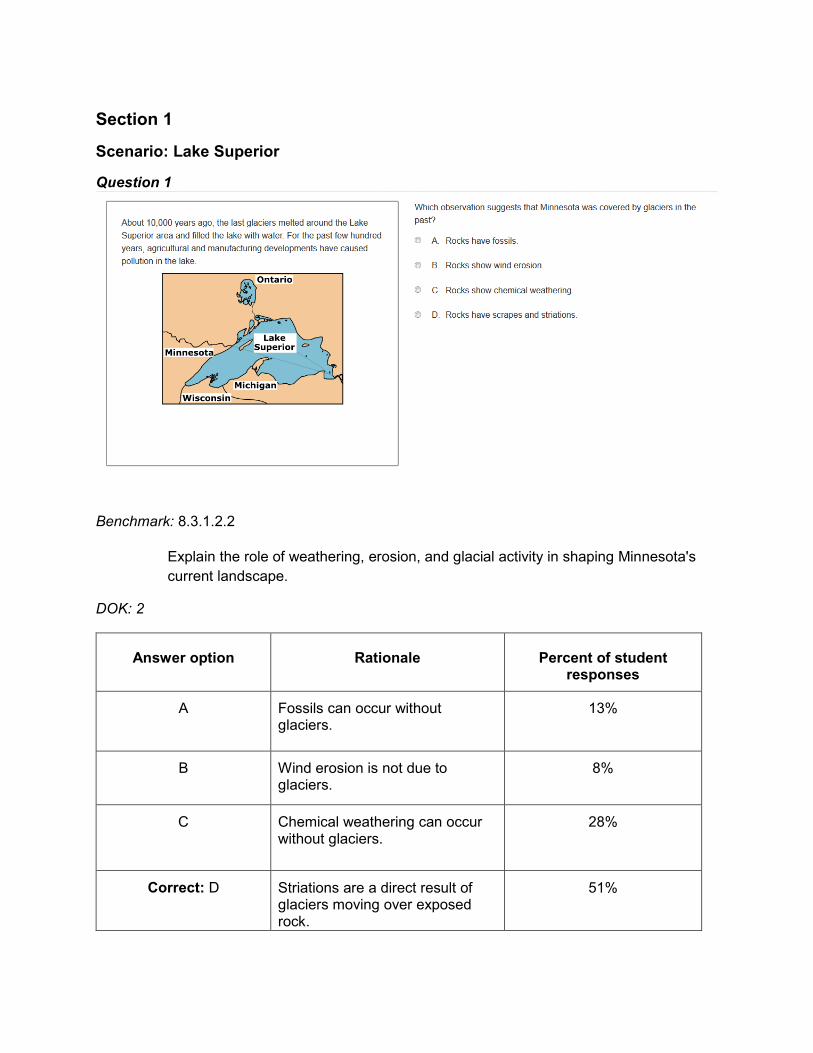
Question 2
Benchmark: 8.3.2.2.2
Analyze changes in wind direction, temperature, humidity and air pressure and relate them to fronts and pressure systems.
DOK: 2
Answer option Rationale Percent of student responses
Correct: Student selects Fair weather and Cirrus clouds
The student understands that high pressure systems are associated with cirrus clouds and fair weather.
20%
Incorrect: All other responses
Strong winds, stratus clouds, and heavy rains are not associated with an established high pressure system.
80%

Question 3
Benchmark: 7.1.1.2.1
Generate and refine a variety of scientific questions and match them with appropriate methods of investigation, such as field studies, controlled experiments, reviews of existing work and development of models.
DOK: 2
Answer option Rationale Percent of student responses
A Only the type of pollutant was measured. This gives no information about the source.
19%
Correct: B Only the type of pollutant was measured.
46%
C Only the type of pollutant was measured. This gives no information about the length of time the pollutants have been present.
9%
D Only the type of pollutant was measured. This gives no information about the effect on the lake ecosystem.
25%
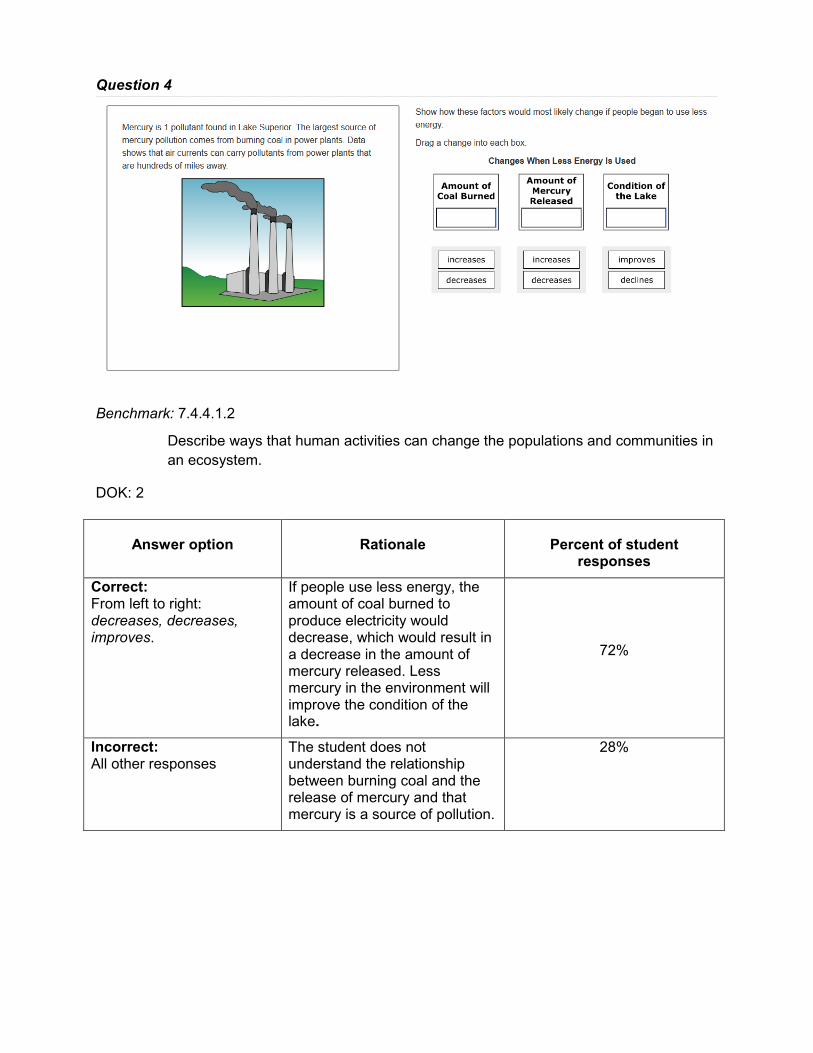
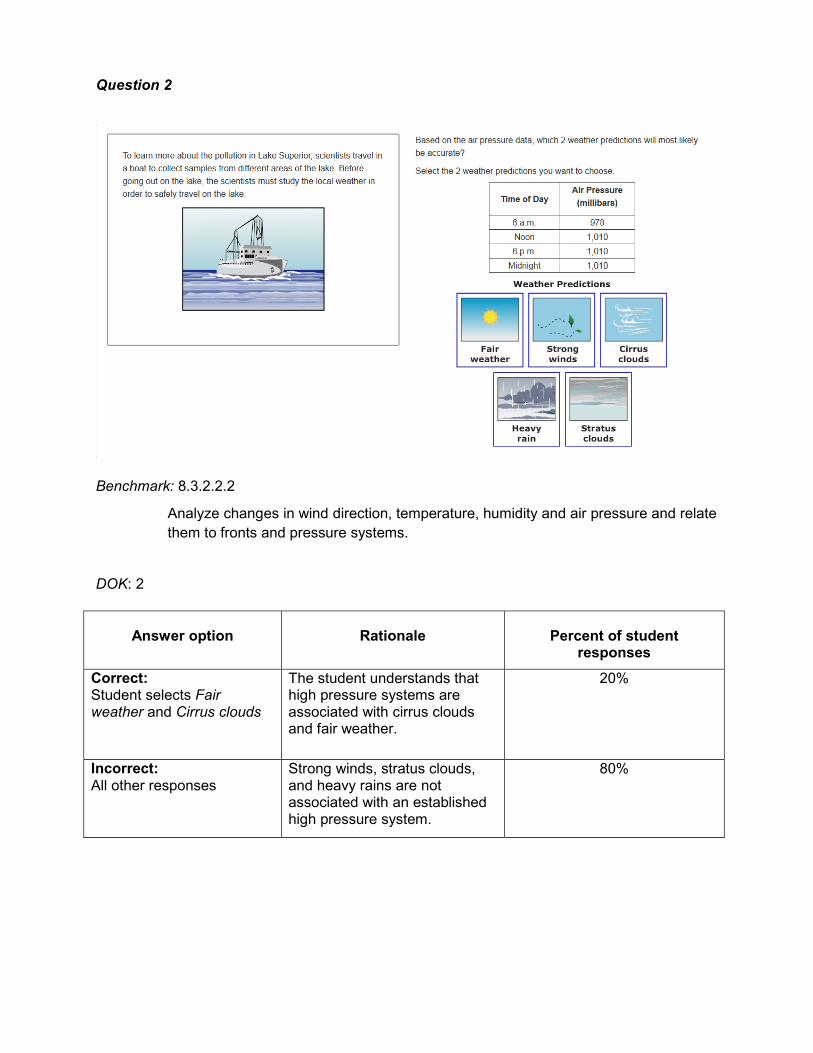
Question 4
Benchmark: 7.4.4.1.2
Describe ways that human activities can change the populations and communities in an ecosystem.
DOK: 2
Answer option Rationale Percent of student responses
Correct: From left to right: decreases, decreases, improves.
If people use less energy, the amount of coal burned to produce electricity would decrease, which would result in a decrease in the amount of mercury released. Less mercury in the environment will improve the condition of the lake.
72%
Incorrect: All other responses
The student does not understand the relationship between burning coal and the release of mercury and that mercury is a source of pollution.
28%
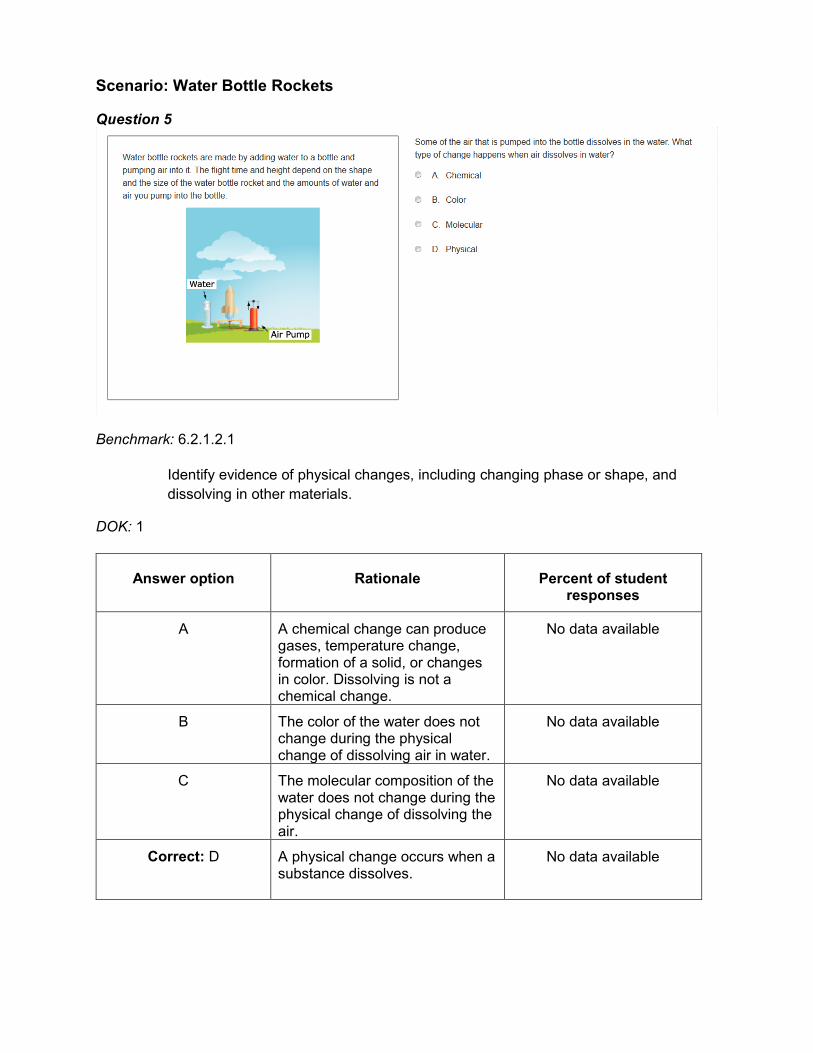
Scenario: Water Bottle Rockets
Question 5
Benchmark: 6.2.1.2.1
Identify evidence of physical changes, including changing phase or shape, and dissolving in other materials.
DOK: 1
Answer option Rationale Percent of student responses
A A chemical change can produce gases, temperature change, formation of a solid, or changes in color. Dissolving is not a chemical change.
No data available
B The color of the water does not change during the physical change of dissolving air in water.
No data available
C The molecular composition of the water does not change during the physical change of dissolving the air.
No data available
Correct: D A physical change occurs when a substance dissolves.
No data available
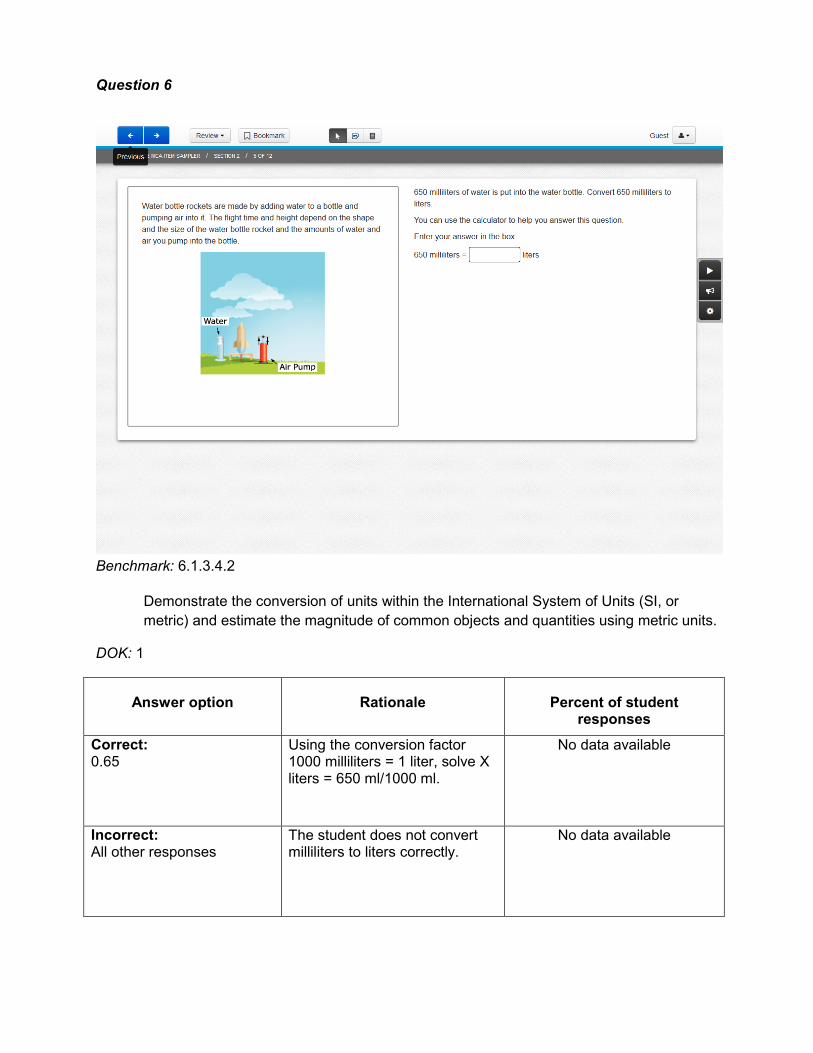
Question 6
Benchmark: 6.1.3.4.2
Demonstrate the conversion of units within the International System of Units (SI, or metric) and estimate the magnitude of common objects and quantities using metric units.
DOK: 1
Answer option Rationale Percent of student responses
Correct: 0.65
Using the conversion factor 1000 milliliters = 1 liter, solve X liters = 650 ml/1000 ml.
No data available
Incorrect: All other responses
The student does not convert milliliters to liters correctly.
No data available
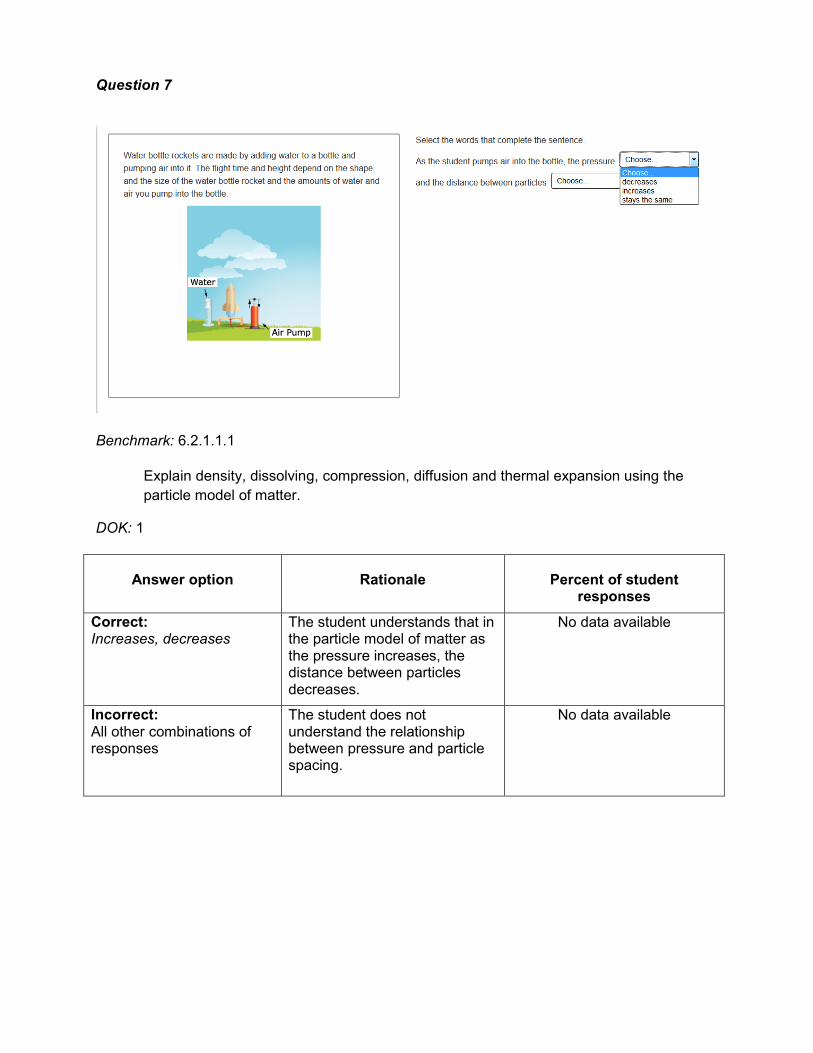
Question 7
Benchmark: 6.2.1.1.1
Explain density, dissolving, compression, diffusion and thermal expansion using the particle model of matter.
DOK: 1
Answer option Rationale Percent of student responses
Correct: Increases, decreases
The student understands that in the particle model of matter as the pressure increases, the distance between particles decreases.
No data available
Incorrect: All other combinations of responses
The student does not understand the relationship between pressure and particle spacing.
No data available
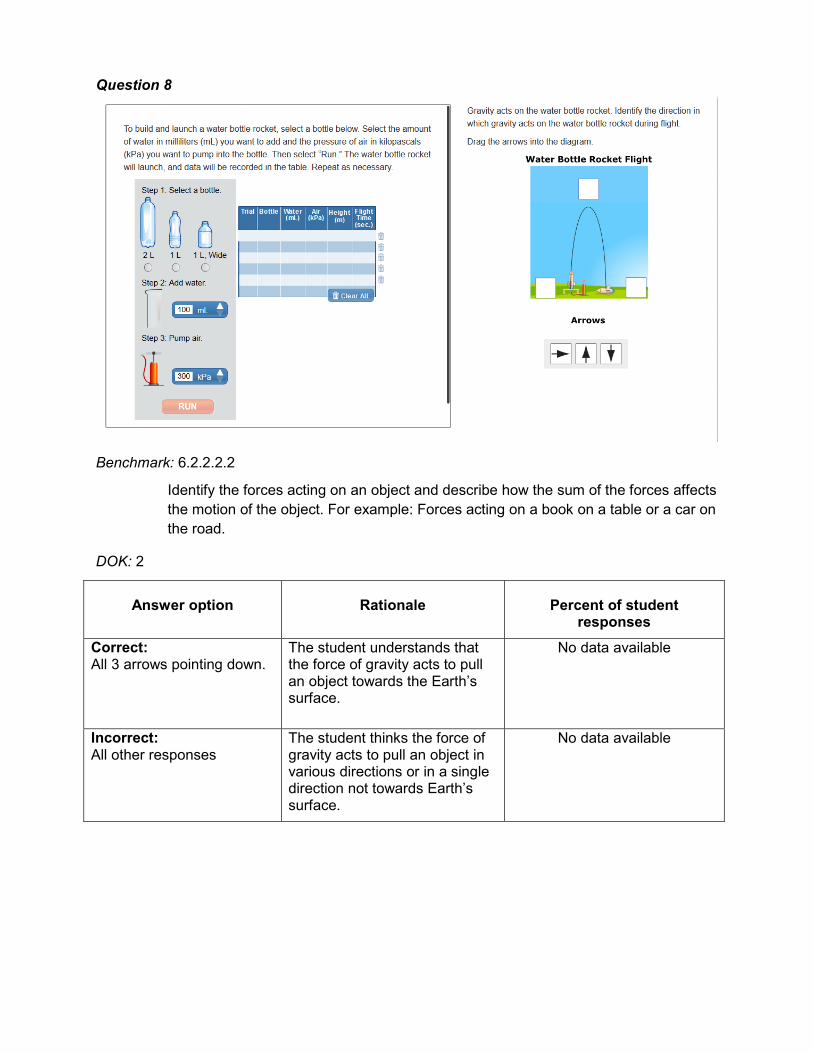
Question 8
Benchmark: 6.2.2.2.2
Identify the forces acting on an object and describe how the sum of the forces affects the motion of the object. For example: Forces acting on a book on a table or a car on the road.
DOK: 2
Answer option Rationale Percent of student responses
Correct: All 3 arrows pointing down.
The student understands that the force of gravity acts to pull an object towards the Earth’s surface.
No data available
Incorrect: All other responses
The student thinks the force of gravity acts to pull an object in various directions or in a single direction not towards Earth’s surface.
No data available

Question 9
Benchmark: 6.2.2.1.1
Measure and calculate the speed of an object that is traveling in a straight line.
DOK 1
Answer option Rationale Percent of student responses
Correct: A The rocket would have a speed of 20 meters/5 seconds or 4m/s.
No data available
B This answer was obtained by students if they subtract the time from the distance.
No data available
C This answer was obtained by students if they add the time and the distance.
No data available
D This answer was obtained by students if they multiply the time with the distance.
No data available
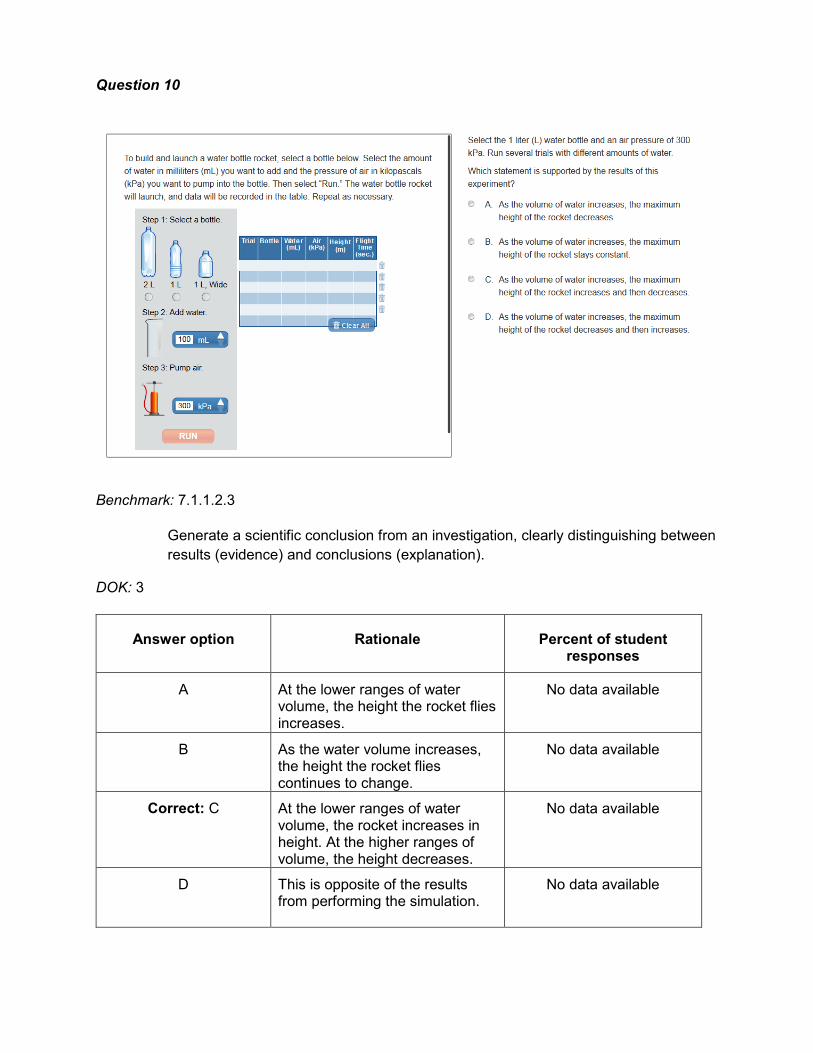
Question 10
Benchmark: 7.1.1.2.3
Generate a scientific conclusion from an investigation, clearly distinguishing between results (evidence) and conclusions (explanation).
DOK: 3
Answer option Rationale Percent of student responses
A At the lower ranges of water volume, the height the rocket flies increases.
No data available
B As the water volume increases, the height the rocket flies continues to change.
No data available
Correct: C At the lower ranges of water volume, the rocket increases in height. At the higher ranges of volume, the height decreases.
No data available
D This is opposite of the results from performing the simulation.
No data available
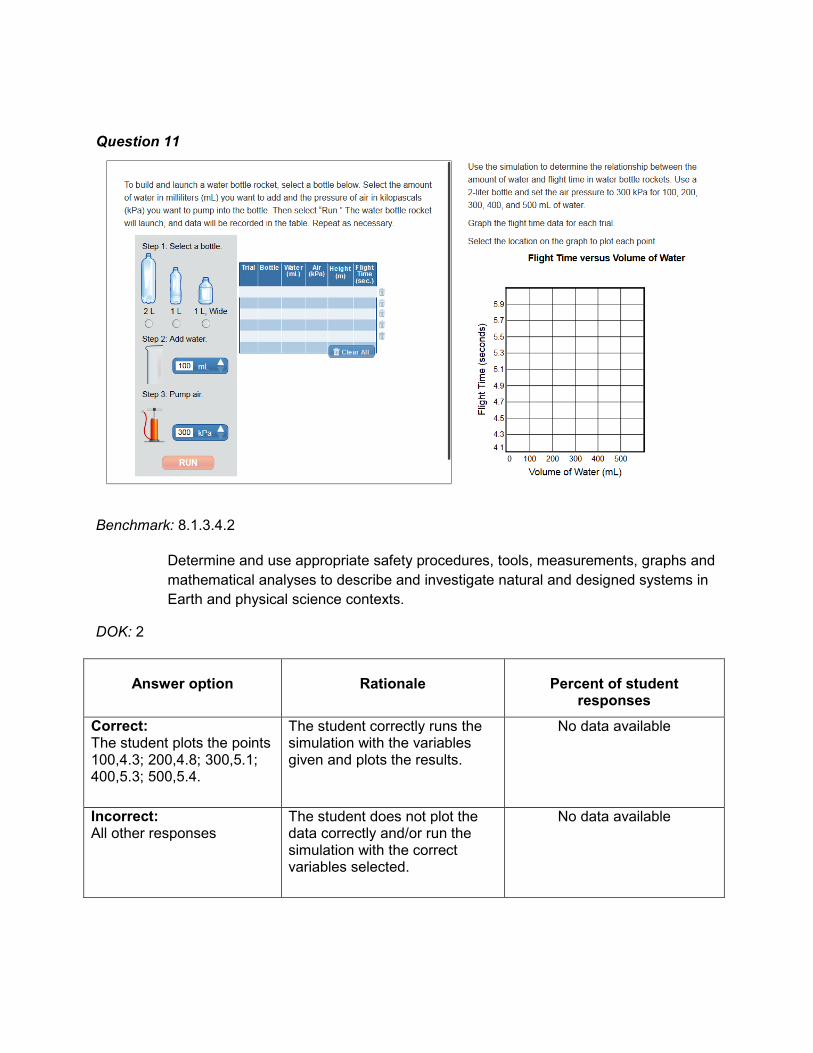
Question 11
Benchmark: 8.1.3.4.2
Determine and use appropriate safety procedures, tools, measurements, graphs and mathematical analyses to describe and investigate natural and designed systems in Earth and physical science contexts.
DOK: 2
Answer option Rationale Percent of student responses
Correct: The student plots the points 100,4.3; 200,4.8; 300,5.1; 400,5.3; 500,5.4.
The student correctly runs the simulation with the variables given and plots the results.
No data available
Incorrect: All other responses
The student does not plot the data correctly and/or run the simulation with the correct variables selected.
No data available
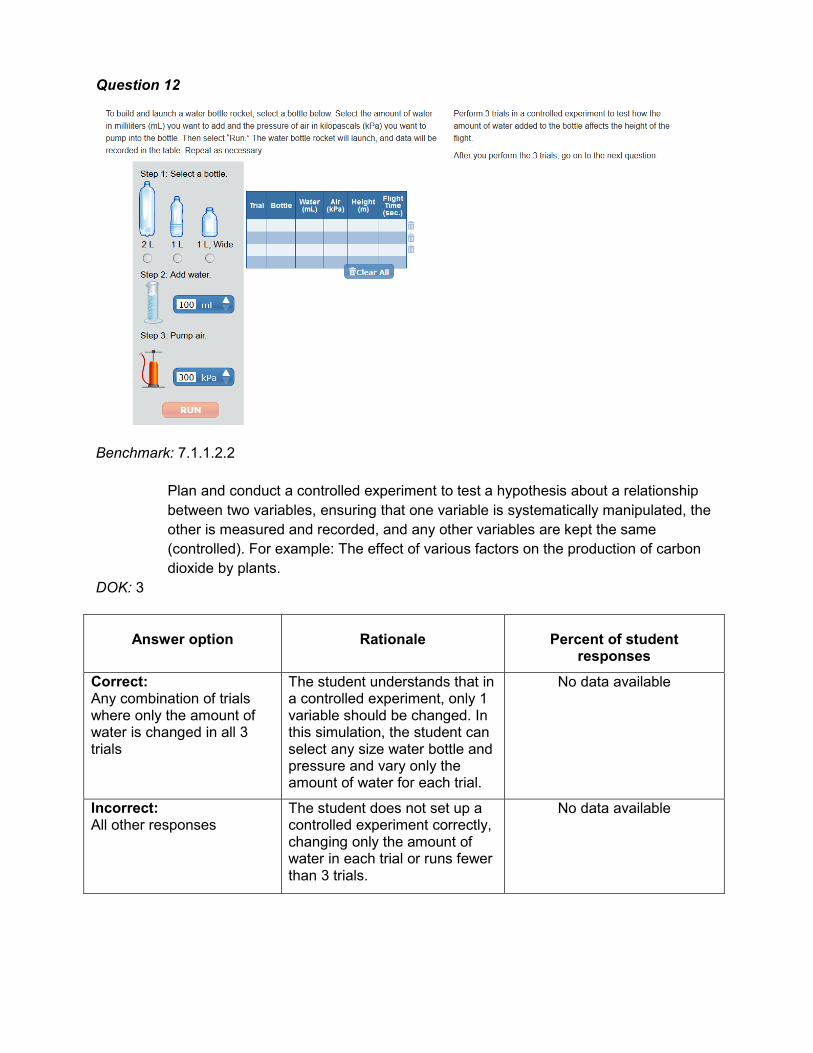
Question 12
Benchmark: 7.1.1.2.2
Plan and conduct a controlled experiment to test a hypothesis about a relationship between two variables, ensuring that one variable is systematically manipulated, the other is measured and recorded, and any other variables are kept the same (controlled). For example: The effect of various factors on the production of carbon dioxide by plants.
DOK: 3
Answer option Rationale Percent of student responses
Correct: Any combination of trials where only the amount of water is changed in all 3 trials
The student understands that in a controlled experiment, only 1 variable should be changed. In this simulation, the student can select any size water bottle and pressure and vary only the amount of water for each trial.
No data available
Incorrect: All other responses
The student does not set up a controlled experiment correctly, changing only the amount of water in each trial or runs fewer than 3 trials.
No data available
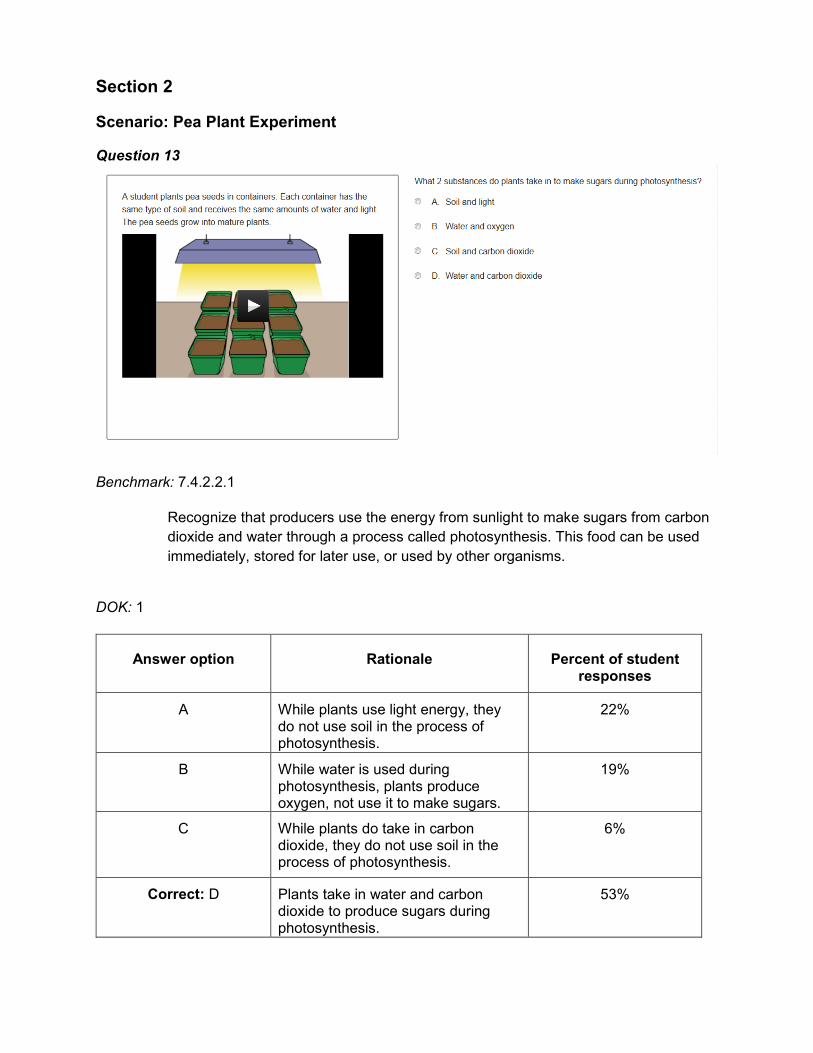
Section 2
Scenario: Pea Plant Experiment
Question 13
Benchmark: 7.4.2.2.1
Recognize that producers use the energy from sunlight to make sugars from carbon dioxide and water through a process called photosynthesis. This food can be used immediately, stored for later use, or used by other organisms.
DOK: 1
Answer option Rationale Percent of student responses
A While plants use light energy, they do not use soil in the process of photosynthesis.
22%
B While water is used during photosynthesis, plants produce oxygen, not use it to make sugars.
19%
C While plants do take in carbon dioxide, they do not use soil in the process of photosynthesis.
6%
Correct: D Plants take in water and carbon dioxide to produce sugars during photosynthesis.
53%
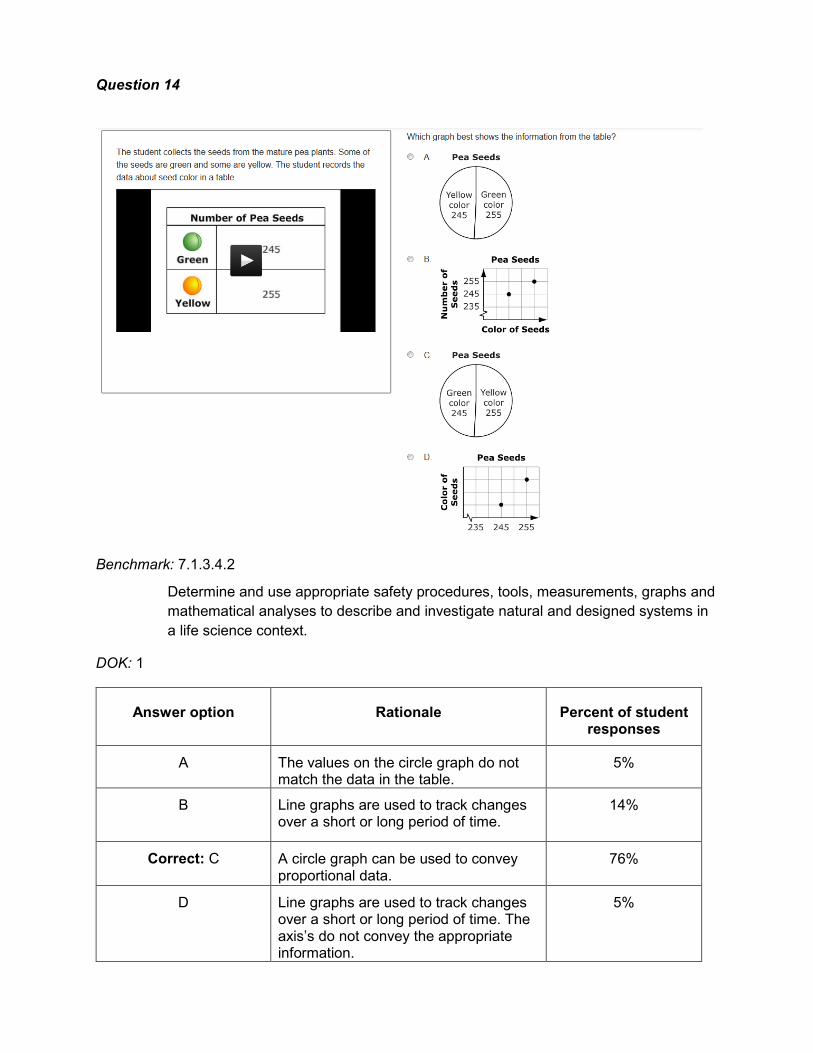
Question 14
Benchmark: 7.1.3.4.2
Determine and use appropriate safety procedures, tools, measurements, graphs and mathematical analyses to describe and investigate natural and designed systems in a life science context.
DOK: 1
Answer option Rationale Percent of student responses
A The values on the circle graph do not match the data in the table.
5%
B Line graphs are used to track changes over a short or long period of time.
14%
Correct: C A circle graph can be used to convey proportional data.
76%
D Line graphs are used to track changes over a short or long period of time. The axis’s do not convey the appropriate information.
5%
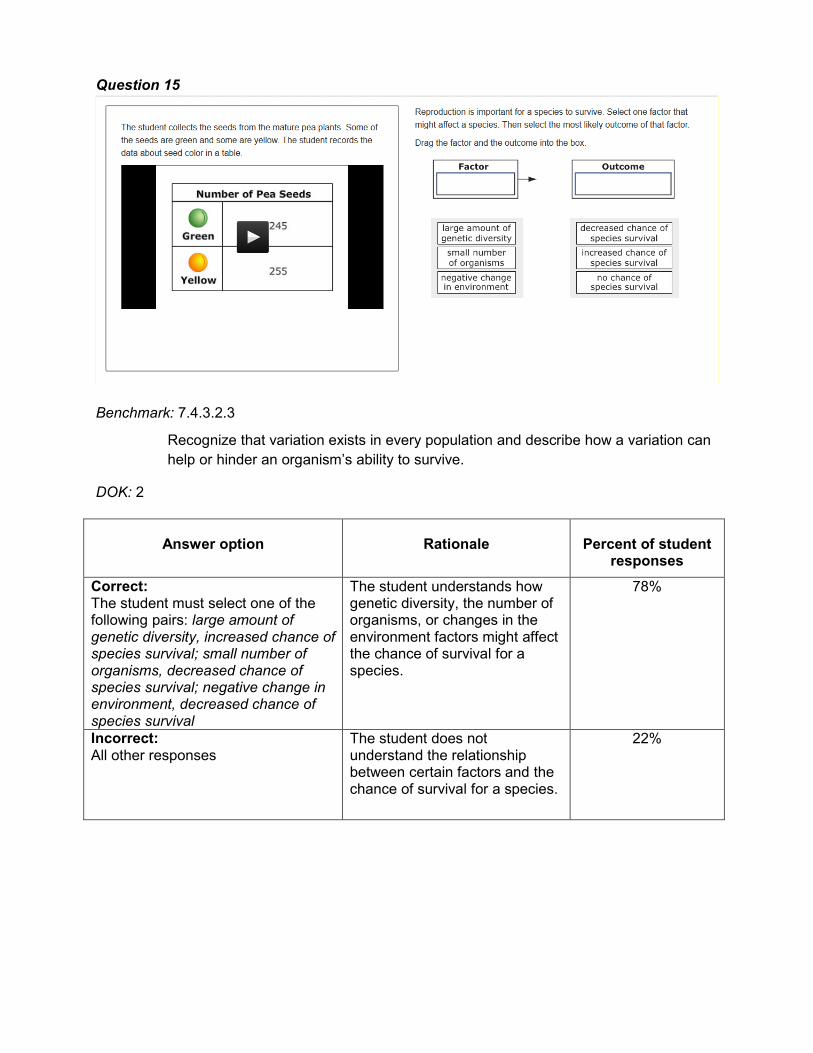
Question 15
Benchmark: 7.4.3.2.3
Recognize that variation exists in every population and describe how a variation can help or hinder an organism’s ability to survive.
DOK: 2
Answer option Rationale Percent of student responses
Correct: The student must select one of the following pairs: large amount of genetic diversity, increased chance of species survival; small number of organisms, decreased chance of species survival; negative change in environment, decreased chance of species survival
The student understands how genetic diversity, the number of organisms, or changes in the environment factors might affect the chance of survival for a species.
78%
Incorrect: All other responses
The student does not understand the relationship between certain factors and the chance of survival for a species.
22%

Question 16
Benchmark: 7.1.1.2.2
Plan and conduct a controlled experiment to test a hypothesis about a relationship between two variables, ensuring that one variable is systematically manipulated, the other is measured and recorded, and any other variables are kept the same (controlled). For example: The effect of various factors on the production of carbon dioxide by plants.
DOK: 2
Answer option Rationale Percent of student responses
Correct: Variable(s) Changed: Amount of water Variable(s) Measured: Height of plant Variable(s) Kept the Same: Size of container and Amount of light
The student understands that in this controlled experiment, only the amount of water was changed, and the height of the plant was measured. All other variables were kept the same.
50%
Incorrect: All other responses
The student does not understand which variables are changed, measured or kept the same in this controlled experiment.
50%
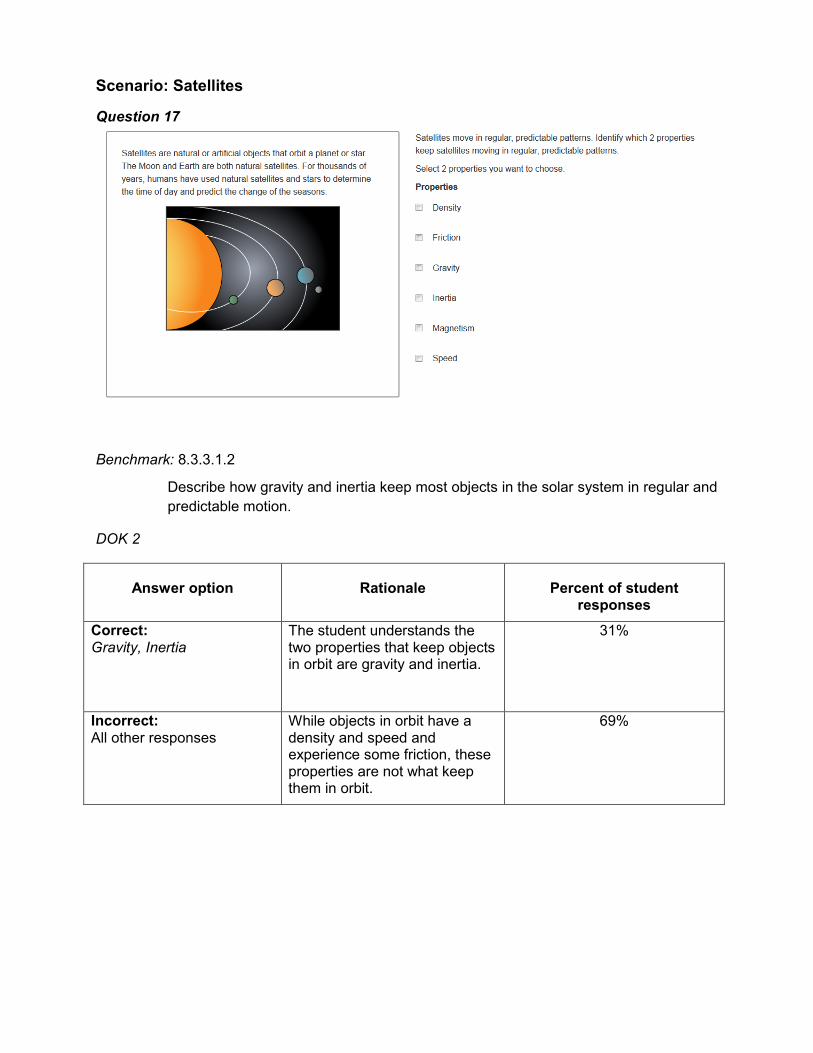
Scenario: Satellites
Question 17
Benchmark: 8.3.3.1.2
Describe how gravity and inertia keep most objects in the solar system in regular and predictable motion.
DOK 2
Answer option Rationale Percent of student responses
Correct: Gravity, Inertia
The student understands the two properties that keep objects in orbit are gravity and inertia.
31%
Incorrect: All other responses
While objects in orbit have a density and speed and experience some friction, these properties are not what keep them in orbit.
69%
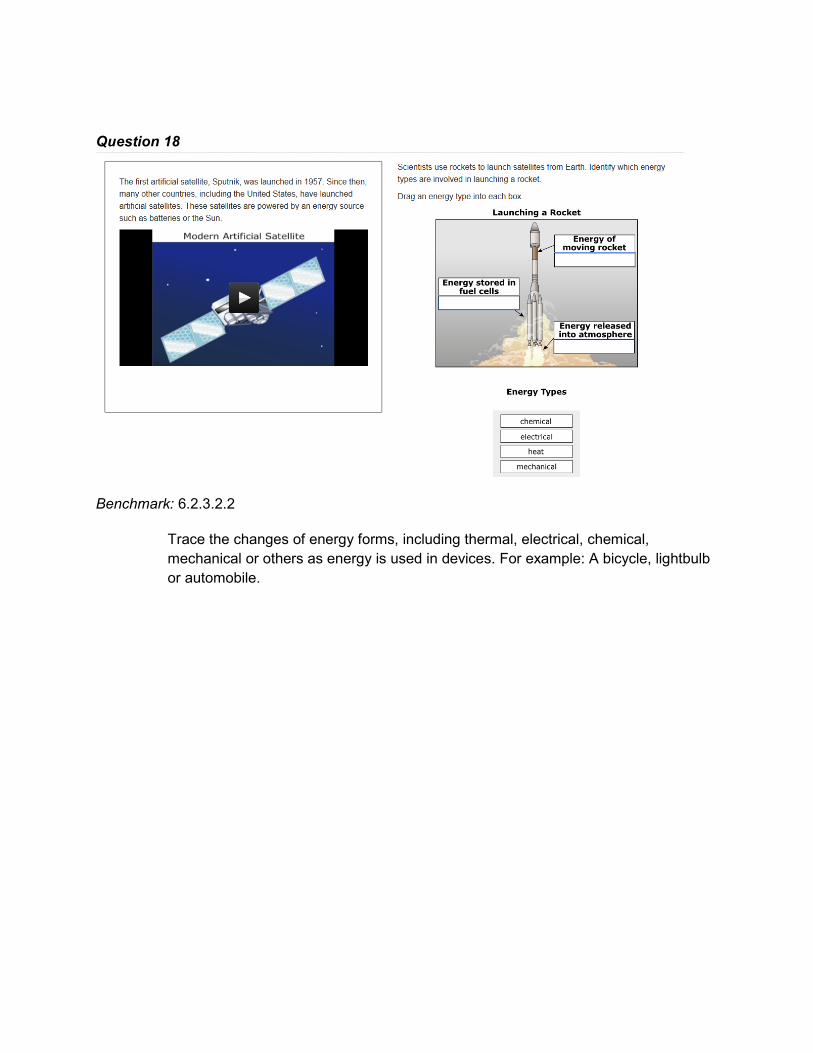
Question 18
Benchmark: 6.2.3.2.2
Trace the changes of energy forms, including thermal, electrical, chemical, mechanical or others as energy is used in devices. For example: A bicycle, lightbulb or automobile.
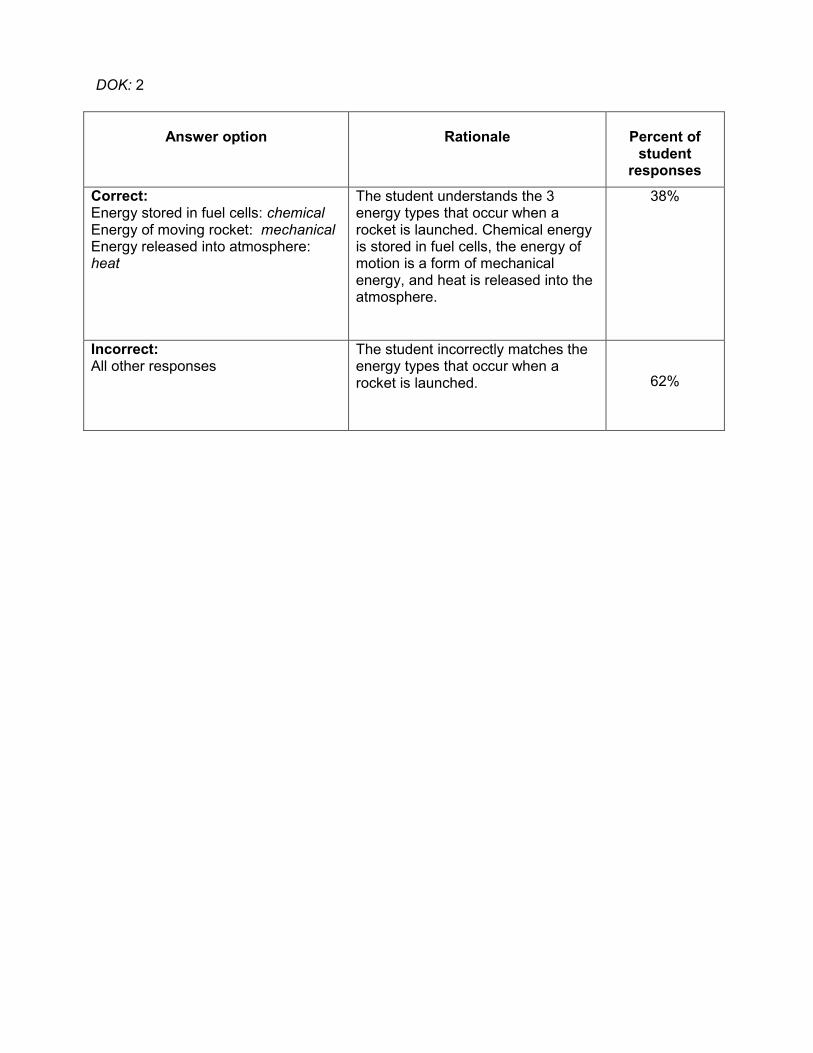
DOK: 2
Answer option Rationale Percent of student
responses
Correct: Energy stored in fuel cells: chemical Energy of moving rocket: mechanical Energy released into atmosphere: heat
The student understands the 3 energy types that occur when a rocket is launched. Chemical energy is stored in fuel cells, the energy of motion is a form of mechanical energy, and heat is released into the atmosphere.
38%
Incorrect: All other responses
The student incorrectly matches the energy types that occur when a rocket is launched. 62%
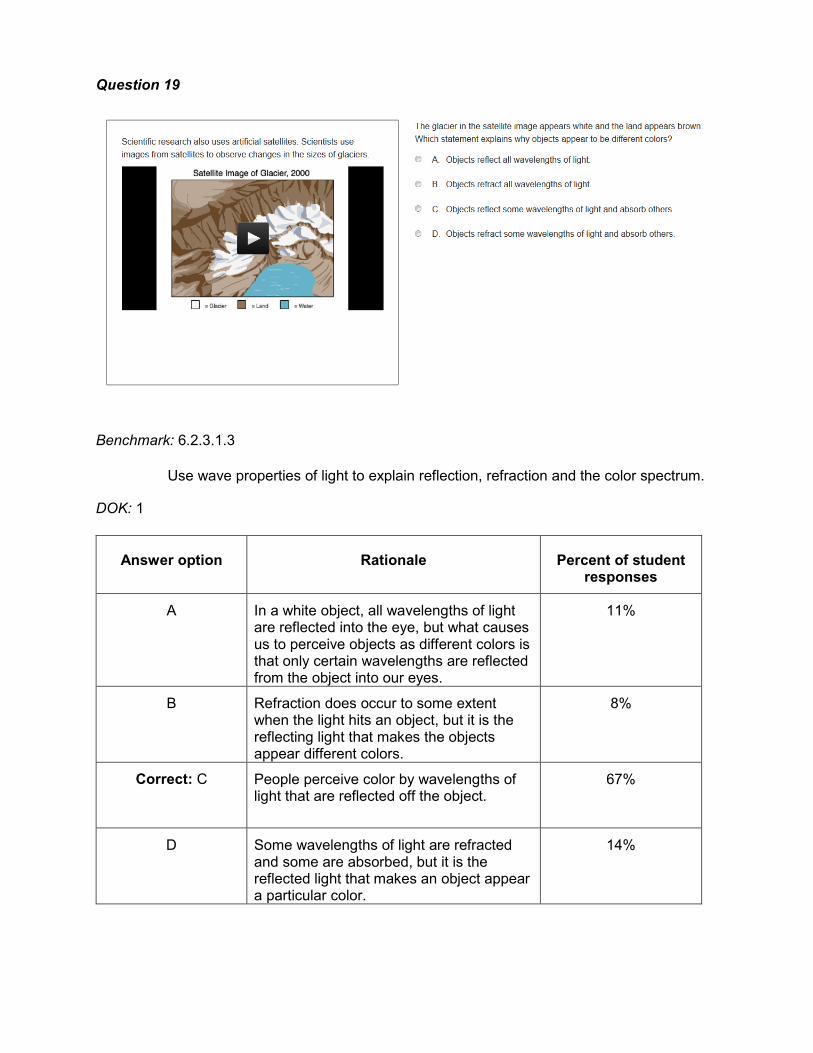
Question 19
Benchmark: 6.2.3.1.3
Use wave properties of light to explain reflection, refraction and the color spectrum.
DOK: 1
Answer option Rationale Percent of student responses
A In a white object, all wavelengths of light are reflected into the eye, but what causes us to perceive objects as different colors is that only certain wavelengths are reflected from the object into our eyes.
11%
B Refraction does occur to some extent when the light hits an object, but it is the reflecting light that makes the objects appear different colors.
8%
Correct: C People perceive color by wavelengths of light that are reflected off the object.
67%
D Some wavelengths of light are refracted and some are absorbed, but it is the reflected light that makes an object appear a particular color.
14%
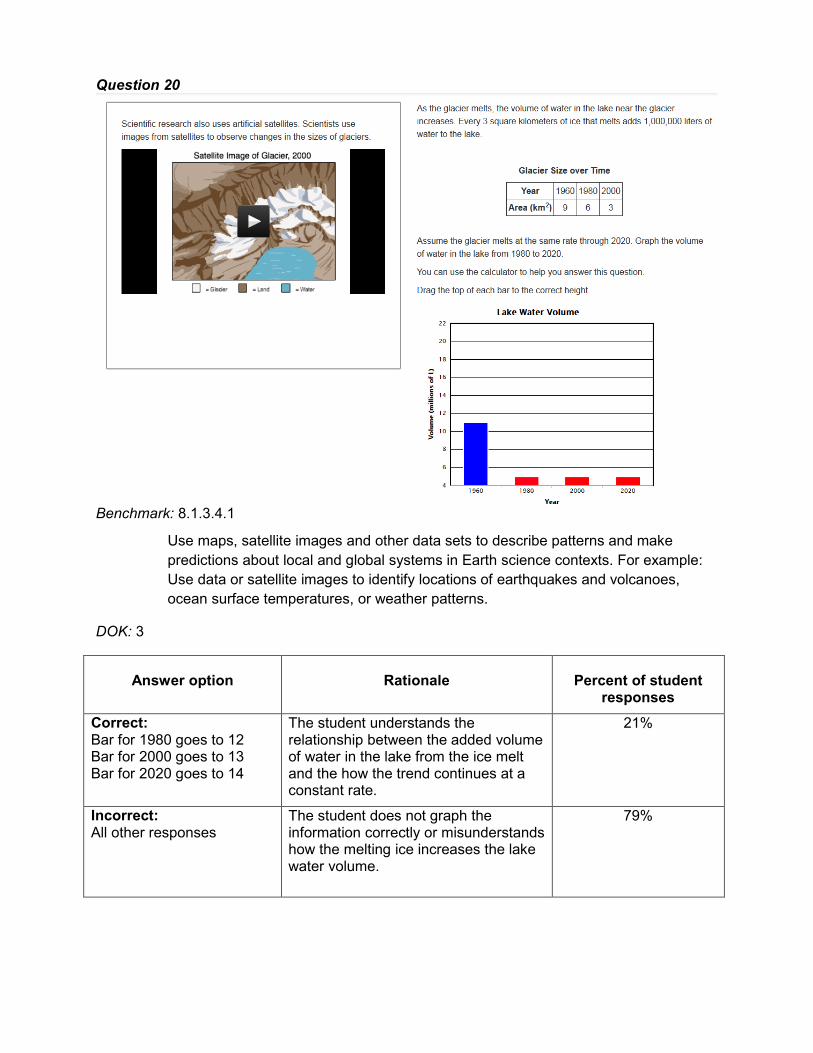
Question 20
Benchmark: 8.1.3.4.1
Use maps, satellite images and other data sets to describe patterns and make predictions about local and global systems in Earth science contexts. For example: Use data or satellite images to identify locations of earthquakes and volcanoes, ocean surface temperatures, or weather patterns.
DOK: 3
Answer option Rationale Percent of student responses
Correct: Bar for 1980 goes to 12 Bar for 2000 goes to 13 Bar for 2020 goes to 14
The student understands the relationship between the added volume of water in the lake from the ice melt and the how the trend continues at a constant rate.
21%
Incorrect: All other responses
The student does not graph the information correctly or misunderstands how the melting ice increases the lake water volume.
79%
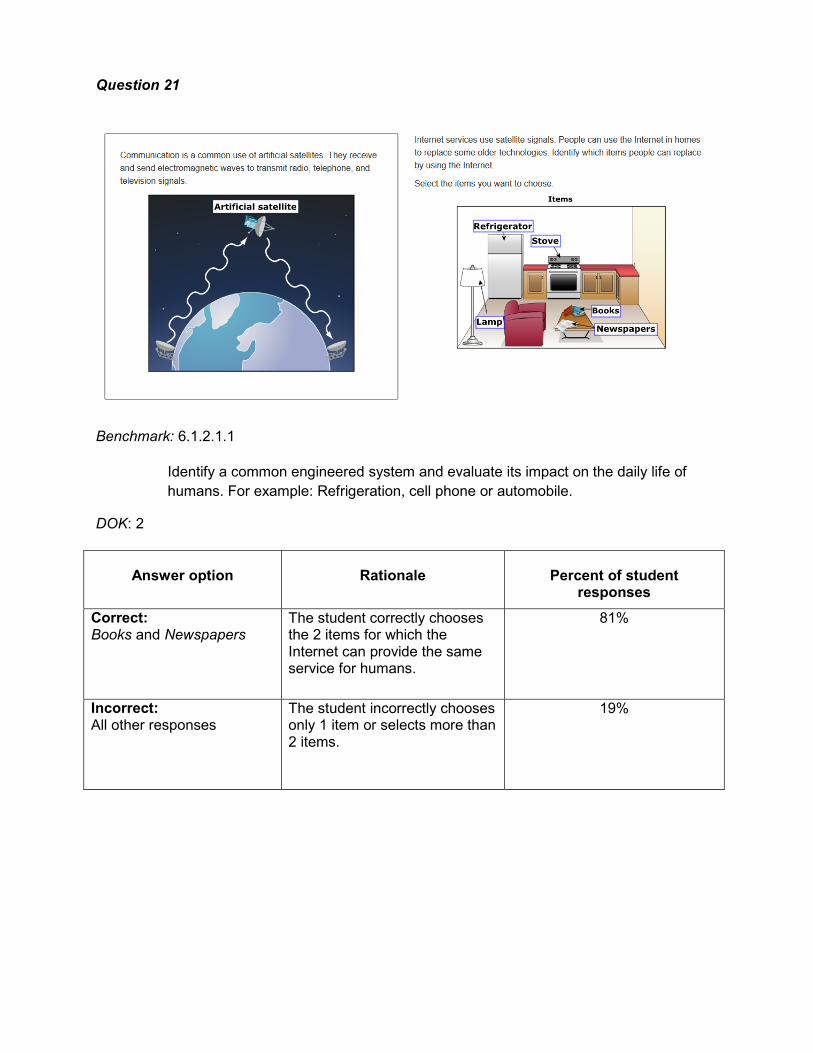
Question 21
Benchmark: 6.1.2.1.1
Identify a common engineered system and evaluate its impact on the daily life of humans. For example: Refrigeration, cell phone or automobile.
DOK: 2
Answer option Rationale Percent of student responses
Correct: Books and Newspapers
The student correctly chooses the 2 items for which the Internet can provide the same service for humans.
81%
Incorrect: All other responses
The student incorrectly chooses only 1 item or selects more than 2 items.
19%
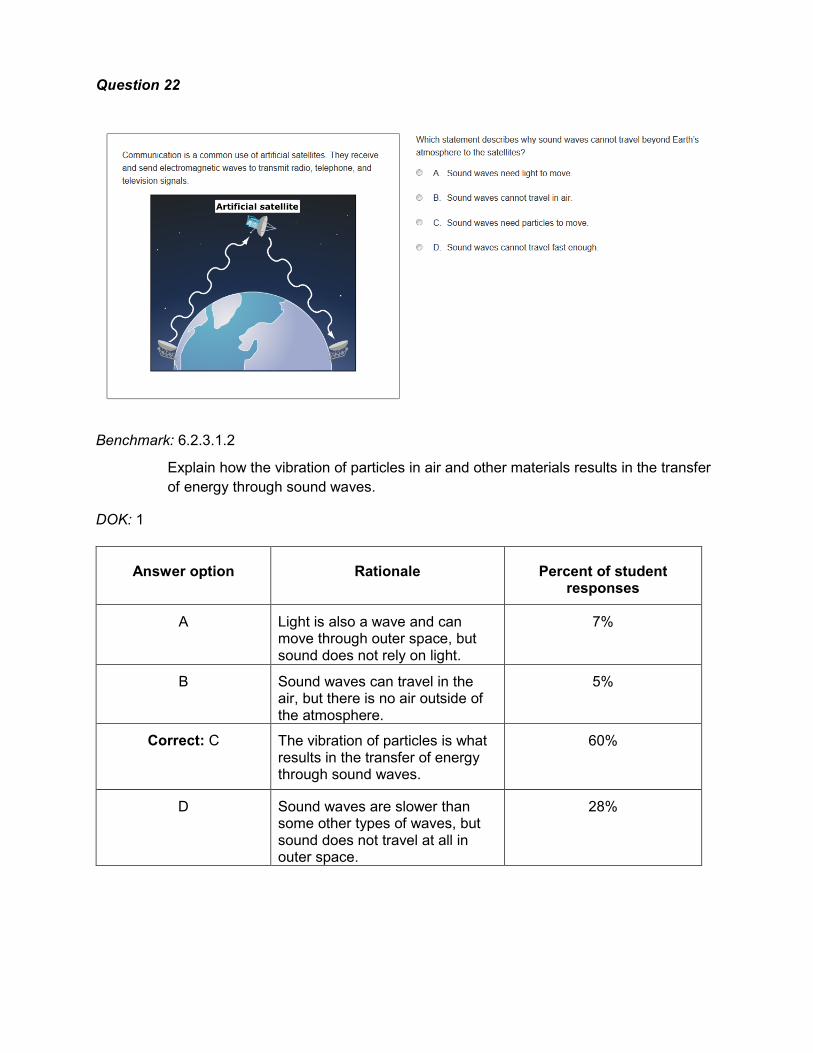
Question 22
Benchmark: 6.2.3.1.2
Explain how the vibration of particles in air and other materials results in the transfer of energy through sound waves.
DOK: 1
Answer option Rationale Percent of student responses
A Light is also a wave and can move through outer space, but sound does not rely on light.
7%
B Sound waves can travel in the air, but there is no air outside of the atmosphere.
5%
Correct: C The vibration of particles is what results in the transfer of energy through sound waves.
60%
D Sound waves are slower than some other types of waves, but sound does not travel at all in outer space.
28%
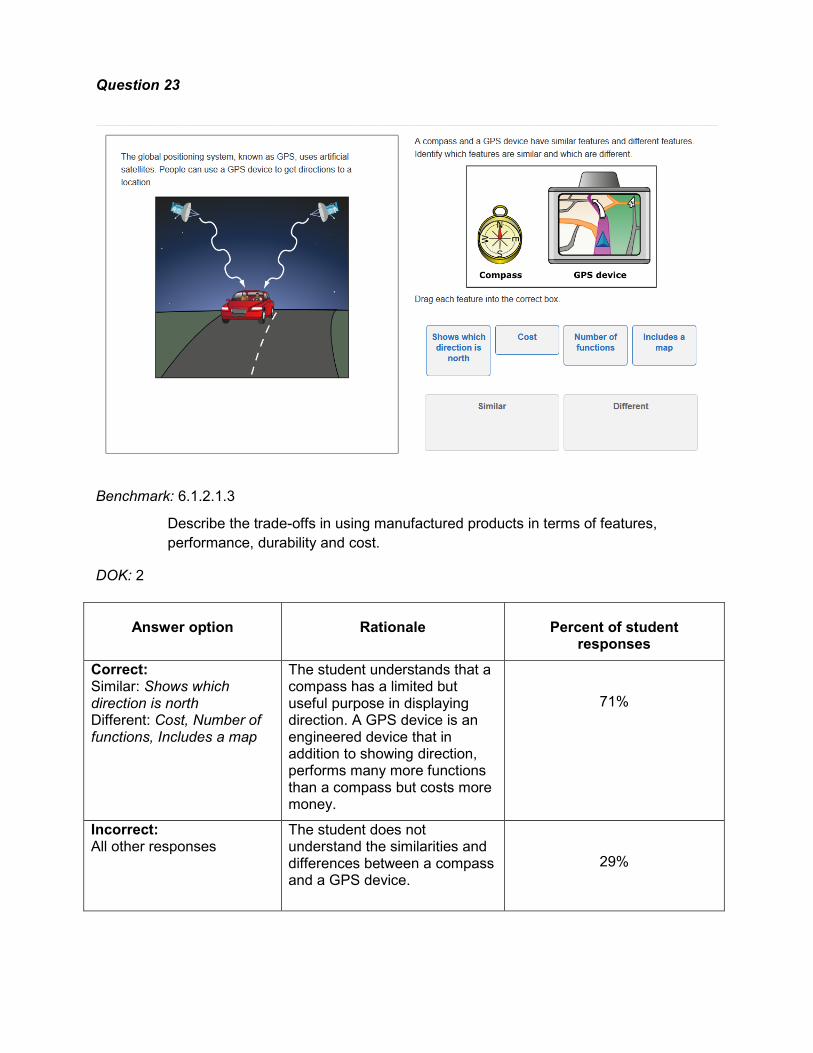
Question 23
Benchmark: 6.1.2.1.3
Describe the trade-offs in using manufactured products in terms of features, performance, durability and cost.
DOK: 2
Answer option Rationale Percent of student responses
Correct: Similar: Shows which direction is north Different: Cost, Number of functions, Includes a map
The student understands that a compass has a limited but useful purpose in displaying direction. A GPS device is an engineered device that in addition to showing direction, performs many more functions than a compass but costs more money.
71%
Incorrect: All other responses
The student does not understand the similarities and differences between a compass and a GPS device.
29%