Grade 8: Content and Reporting Targets€¦ · TIPS: Section 3 – Grade 8 © Queen’s Printer for...
99
Transcript of Grade 8: Content and Reporting Targets€¦ · TIPS: Section 3 – Grade 8 © Queen’s Printer for...


TIPS: Section 3 – Grade 8 © Queen’s Printer for Ontario, 2003 Page 1
Grade 8: Content and Reporting Targets
Across the strands and the terms Problem Solving, Communication, Technology, and Reasoning - expectations to be applied to any/all content clusters.
Term 1 – Content Targets Term 2 – Content Targets Term 3 – Content Targets Number Sense and Numeration* • Integers • Powers and Square Roots Geometry and Spatial Sense* • Pythagorean Relationship Patterning and Algebra* • Algebraic Expressions • Solving Equations • Patterning • Writing nth Terms Data Management and Probability • Experimental vs. Theoretical Probability
Number Sense and Numeration* • Fractions • Order of Operations • Unit Rate Measurement* • Circles Geometry and Spatial Sense* • Angle Properties • Construction of a Circle Data Management and Probability* • Complex Probabilities • Best Measure of Central Tendency • Census vs. Sample
Number Sense and Numeration* • Order of Operations with Exponents and
Fractions • Unit Rates and Percents • Mental Math Skill Measurement* • Triangular Prisms • Valuing Measurement Geometry and Spatial Sense • Connect the Pythagorean Relationship to
3-D figures. Patterning and Algebra* • Review and Extend Solving Equations in
Contexts • Inequalities Data Management and Probability* • Comparative Bar Graph • Bar Graph vs. Histogram
Rationale Connections between: - integer size/area of squares - integer sign/colour of integer tile - square roots/measurements in right triangles
- scientific notation/powers - Pythagorean relationship/data management through inquiry
- equation solving/applications of Pythagorean Relationship
- algebraic expressions/generalizations of patterns
- different algebraic representations of a pattern/the values generated by substitution into those representations
- statements/algebraic expressions/ equations
- algebraic expressions/unknowns in equations
Leading to: - connection between powers/ measurement units (Terms 2 and 3)
- applications of algebraic expressions and equations (Terms 2 and 3)
- solving equations requiring collection of like terms (Grade 9)
- using both theoretical and experimental means of finding patterns (Terms 2 and 3)
Connections between: - integers/order of operations - unit rate problems/Term 1 algebra - constructing circles/discovering
relationships between circle measurements
- angle properties/data management - angle properties/Term 1 algebra - theoretical and experimental probability/
complex probabilities - best measure of central tendency and
data for developing circle formulas Leading to: - combining fractions with order of
operations (Term 3) - connecting unit rates with percents and
fractions (Term 3) - combining perimeter/area of irregular
shapes with circles (Grade 9) - connecting circles to volume of a
cylinder (Grade 9) - understanding the effect of outlier data
points (Grade 9) - extending probability/statistics
(Grade 12)
Connections between: - order of operations/fractions, integers,
powers - fractions/unit rates/percent - Natural/Whole/Integer/Fractional/
Rational/Irrational sets of numbers (combining Natural, Whole, Integer, and Fractional numbers)
- volume of triangular prism and Grades 6 and 7 concept of Volume = area of base × height
- inequalities and patterning/problem solving
- solving equations/Pythagorean relationship/triangular prisms
- solving equations/unit rates - comparative bar graphs/histograms - measures of central tendency (Term 1)/
dispersion shown in a histogram - data from Term 1 and 2 investigations/
associated concepts/histograms Leading to: - combining rational numbers (Grade 9)/
irrational numbers (Grade 11 University destination)
- volume of a cylinder understood as area of base × height (Grade 9)
* Strands for reporting purposes
See Appendix for the clusters of curriculum expectations attached to each of the content targets.
Appendix: Curriculum Expectation Clusters
TIPS: Section 3 – Grade 8 © Queen’s Printer for Ontario, 2003 Page 2
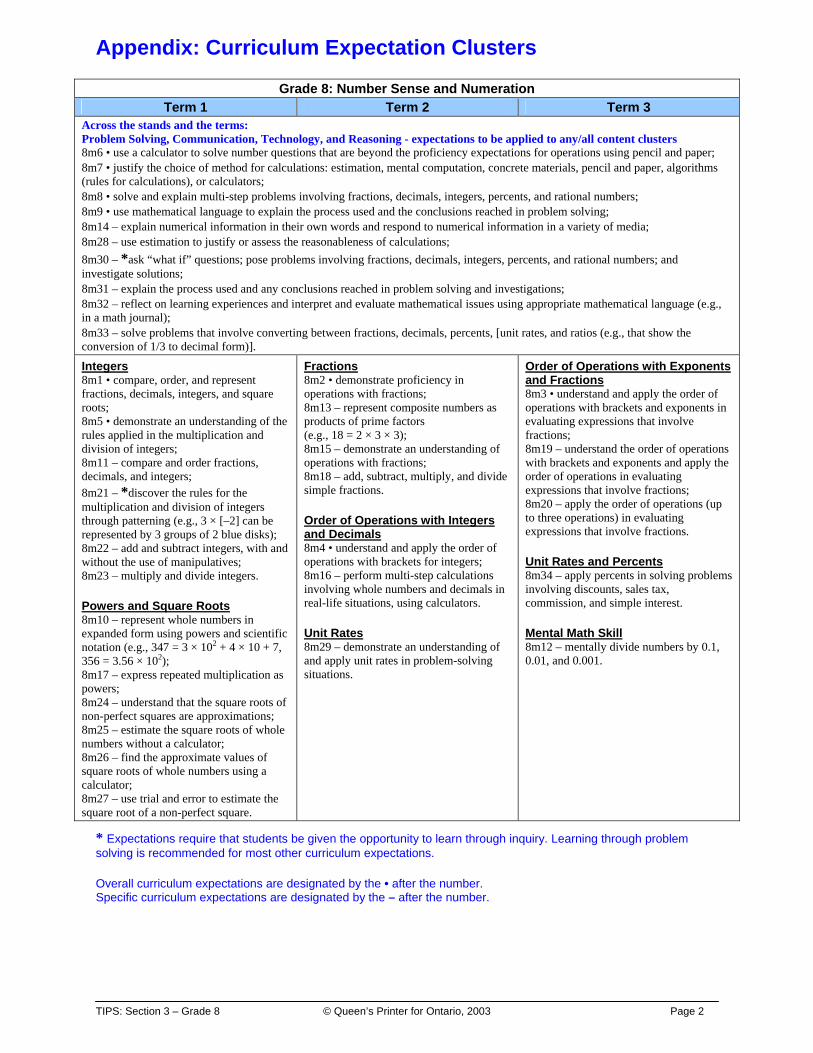
Grade 8: Number Sense and Numeration
Term 1 Term 2 Term 3 Across the stands and the terms: Problem Solving, Communication, Technology, and Reasoning - expectations to be applied to any/all content clusters 8m6 • use a calculator to solve number questions that are beyond the proficiency expectations for operations using pencil and paper; 8m7 • justify the choice of method for calculations: estimation, mental computation, concrete materials, pencil and paper, algorithms (rules for calculations), or calculators; 8m8 • solve and explain multi-step problems involving fractions, decimals, integers, percents, and rational numbers; 8m9 • use mathematical language to explain the process used and the conclusions reached in problem solving; 8m14 – explain numerical information in their own words and respond to numerical information in a variety of media; 8m28 – use estimation to justify or assess the reasonableness of calculations; 8m30 – *ask “what if” questions; pose problems involving fractions, decimals, integers, percents, and rational numbers; and investigate solutions; 8m31 – explain the process used and any conclusions reached in problem solving and investigations; 8m32 – reflect on learning experiences and interpret and evaluate mathematical issues using appropriate mathematical language (e.g., in a math journal); 8m33 – solve problems that involve converting between fractions, decimals, percents, [unit rates, and ratios (e.g., that show the conversion of 1/3 to decimal form)].
Integers 8m1 • compare, order, and represent fractions, decimals, integers, and square roots; 8m5 • demonstrate an understanding of the rules applied in the multiplication and division of integers; 8m11 – compare and order fractions, decimals, and integers; 8m21 – *discover the rules for the multiplication and division of integers through patterning (e.g., 3 × [–2] can be represented by 3 groups of 2 blue disks); 8m22 – add and subtract integers, with and without the use of manipulatives; 8m23 – multiply and divide integers. Powers and Square Roots 8m10 – represent whole numbers in expanded form using powers and scientific notation (e.g., 347 = 3 × 10² + 4 × 10 + 7, 356 = 3.56 × 10²); 8m17 – express repeated multiplication as powers; 8m24 – understand that the square roots of non-perfect squares are approximations; 8m25 – estimate the square roots of whole numbers without a calculator; 8m26 – find the approximate values of square roots of whole numbers using a calculator; 8m27 – use trial and error to estimate the square root of a non-perfect square.
Fractions 8m2 • demonstrate proficiency in operations with fractions; 8m13 – represent composite numbers as products of prime factors (e.g., 18 = 2 × 3 × 3); 8m15 – demonstrate an understanding of operations with fractions; 8m18 – add, subtract, multiply, and divide simple fractions. Order of Operations with Integers and Decimals 8m4 • understand and apply the order of operations with brackets for integers; 8m16 – perform multi-step calculations involving whole numbers and decimals in real-life situations, using calculators. Unit Rates 8m29 – demonstrate an understanding of and apply unit rates in problem-solving situations.
Order of Operations with Exponents and Fractions 8m3 • understand and apply the order of operations with brackets and exponents in evaluating expressions that involve fractions; 8m19 – understand the order of operations with brackets and exponents and apply the order of operations in evaluating expressions that involve fractions; 8m20 – apply the order of operations (up to three operations) in evaluating expressions that involve fractions. Unit Rates and Percents 8m34 – apply percents in solving problems involving discounts, sales tax, commission, and simple interest. Mental Math Skill 8m12 – mentally divide numbers by 0.1, 0.01, and 0.001.
* Expectations require that students be given the opportunity to learn through inquiry. Learning through problem solving is recommended for most other curriculum expectations. Overall curriculum expectations are designated by the • after the number. Specific curriculum expectations are designated by the – after the number.

Appendix: Curriculum Expectation Clusters
TIPS: Section 3 – Grade 8 © Queen’s Printer for Ontario, 2003 Page 3
Grade 8: Measurement
Term 1 Term 2 Term 3 Across the stands and the terms: Problem Solving, Communication, Technology, and Reasoning - expectations to be applied to any/all content clusters 8m35 • demonstrate a verbal and written understanding of and ability to apply accurate measurement and estimation strategies that relate to their environment; 8m36 • identify relationships between and among measurement concepts (linear, square, cubic, temporal, monetary); 8m39 – use listening, reading, and viewing skills to interpret and evaluate the use of measurement formulas; 8m40 – explain the relationships between various units of measurement; 8m42 – make increasingly more informed and accurate measurement estimations based on an understanding of formulas and the results of investigations; 8m43 – ask questions to clarify and extend their knowledge of linear measurement, area, volume, capacity, and mass, using appropriate measurement vocabulary. Circles
8m37 • solve problems related to the calculation of the radius, diameter, and circumference of a circle; 8m44 – measure the radius, diameter, and circumference of a circle using concrete materials; 8m45 – *recognize that there is a constant relationship between the radius, diameter, and circumference of a circle, and approximate its value through investigation; 8m46 – *develop the formula for finding the circumference and the formula for finding the area of a circle; 8m47 – estimate and calculate the radius, diameter, circumference, and the area of a circle, using a formula in a problem-solving context; 8m48 – draw a circle given its area and/or circumference; 8m49 – define radius, diameter, and circumference and explain the relationships between them.
Triangular Prisms 8m38 • apply volume and area formulas to problem-solving situations involving triangular prisms; 8m50 – *develop the formula for finding the surface area of a triangular prism using nets; 8m51 – *develop the formula for finding the volume of a triangular prism; 8m52 – understand the relationship between the dimensions and the volume of a triangular prism; 8m53 – calculate the surface area and the volume of a triangular prism, using a formula in a problem-solving context; 8m54 – sketch a triangular prism given its volume. Valuing Measurement 8m41 – research, describe, and report on uses of measurement in projects at home, in the workplace, and in the community that require precise measurements.
* Expectations require that students be given the opportunity to learn through inquiry. Learning through problem solving is also recommended for most other curriculum expectations. Overall curriculum expectations are designated by the • after the number. Specific curriculum expectations are designated by the – after the number.

Appendix: Curriculum Expectation Clusters
TIPS: Section 3 – Grade 8 © Queen’s Printer for Ontario, 2003 Page 4
Grade 8: Geometry and Spatial Sense
Across the stands and the terms: Problem Solving, Communication, Technology, and Reasoning - expectations to be applied to any/all content clusters 8m60 • use mathematical language effectively to describe geometric concepts, reasoning, and investigations.
Term 1 Term 2 Term 3 Pythagorean Relationship 8m65 – *investigate the Pythagorean relationship using area models and diagrams; 8m70 – apply the Pythagorean relationship to numerical problems involving area and right triangles; 8m73 – explain the Pythagorean relationship.
Angle Properties 8m55 • identify, describe, compare, and classify geometric figures; 8m57 • identify and investigate the relationships of angles; 8m58 • construct and solve problems involving lines and angles; 8m63 – identify the angle properties of intersecting, parallel, and perpendicular lines by direct measurement: interior, corresponding, opposite, alternate, supplementary, complementary; 8m64 – *explore the relationship to each other of the internal angles in a triangle (they add up to 180°) using a variety of methods; 8m66 – solve angle measurement problems involving properties of intersecting line segments, parallel lines, and transversals; 8m67 – create and solve angle measurement problems for triangles; 8m68 – construct line segments and angles using a variety of methods (e.g., paper folding, ruler and compass); 8m71 – describe the relationship between pairs of angles within parallel lines and transversals; 8m72 – explain why the sum of the angles of a triangle is 180º. Construct a Circle 8m59 • *investigate geometric mathematical theories to solve problems; 8m69 – construct a circle given its centre and radius or centre and a point on the circle or three points on the circle.
Connect the Pythagorean Relationship to 3-D figures 8m56 • identify, draw, and represent three-dimensional geometric figures; 8m61 – recognize three-dimensional figures from their top, side, and front views; 8m62 – sketch and build representations of three-dimensional figures (e.g., nets, skeletons) from front, top, and side views.
* Expectations require that students be given the opportunity to learn through inquiry. Learning through problem solving is also recommended for most other curriculum expectations. Overall curriculum expectations are designated by the • after the number. Specific curriculum expectations are designated by the – after the number.
Appendix: Curriculum Expectation Clusters
TIPS: Section 3 – Grade 8 © Queen’s Printer for Ontario, 2003 Page 5
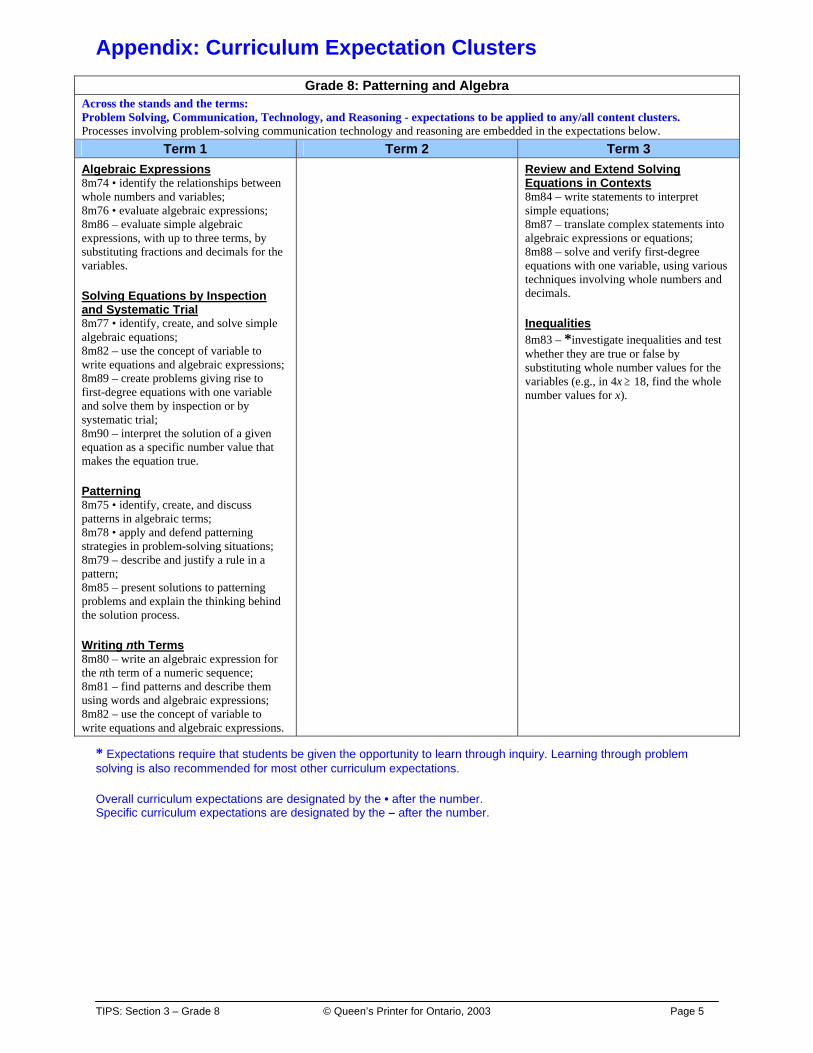
Grade 8: Patterning and Algebra
Across the stands and the terms: Problem Solving, Communication, Technology, and Reasoning - expectations to be applied to any/all content clusters. Processes involving problem-solving communication technology and reasoning are embedded in the expectations below.
Term 1 Term 2 Term 3 Algebraic Expressions 8m74 • identify the relationships between whole numbers and variables; 8m76 • evaluate algebraic expressions; 8m86 – evaluate simple algebraic expressions, with up to three terms, by substituting fractions and decimals for the variables. Solving Equations by Inspection and Systematic Trial 8m77 • identify, create, and solve simple algebraic equations; 8m82 – use the concept of variable to write equations and algebraic expressions; 8m89 – create problems giving rise to first-degree equations with one variable and solve them by inspection or by systematic trial; 8m90 – interpret the solution of a given equation as a specific number value that makes the equation true. Patterning 8m75 • identify, create, and discuss patterns in algebraic terms; 8m78 • apply and defend patterning strategies in problem-solving situations; 8m79 – describe and justify a rule in a pattern; 8m85 – present solutions to patterning problems and explain the thinking behind the solution process. Writing nth Terms 8m80 – write an algebraic expression for the nth term of a numeric sequence; 8m81 – find patterns and describe them using words and algebraic expressions; 8m82 – use the concept of variable to write equations and algebraic expressions.
Review and Extend Solving Equations in Contexts 8m84 – write statements to interpret simple equations; 8m87 – translate complex statements into algebraic expressions or equations; 8m88 – solve and verify first-degree equations with one variable, using various techniques involving whole numbers and decimals. Inequalities 8m83 – *investigate inequalities and test whether they are true or false by substituting whole number values for the variables (e.g., in 4x ≥ 18, find the whole number values for x).
* Expectations require that students be given the opportunity to learn through inquiry. Learning through problem solving is also recommended for most other curriculum expectations. Overall curriculum expectations are designated by the • after the number. Specific curriculum expectations are designated by the – after the number.

Appendix: Curriculum Expectation Clusters
TIPS: Section 3 – Grade 8 © Queen’s Printer for Ontario, 2003 Page 6
Grade 8: Data Management and Probability
Across the strands and the terms. Problem Solving, Communication, Technology, and Reasoning - expectations to be applied to any/all content clusters. 8m91 • systematically collect, organize, and analyse primary data; 8m92 • use computer applications to examine and interpret data in a variety of ways; 8m93 • interpret displays of data and present the information using mathematical terms; 8m94 • evaluate data and draw conclusions from the analysis of data; 8m95 • identify probability situations and apply a knowledge of probability; 8m99 – read a database or spreadsheet and identify its structure; 8m100 – manipulate and present data using spreadsheets, and use the quantitative data to solve problems; 8m101 – search databases for information and use the quantitative data to solve problems; 8m102 – know that a pattern on a graph may indicate a trend; 8m104 – discuss trends in graphs to clarify understanding and draw conclusions about the data; 8m105 – discuss the quantitative information presented on tally charts, stem-and-leaf plots, frequency tables, and/or graphs; 8m106 – explain the choice of intervals used in constructing bar graphs or the choice of symbols in pictographs; 8m112 – make inferences and convincing arguments that are based on data analysis; 8m113 – evaluate arguments that are based on data analysis; 8m114 – determine trends and patterns by making inferences from graphs; 8m115 – explore with technology to find the best presentation of data.
Term 1 Term 2 Term 3 Experimental vs. Theoretical Probability 8m96 • appreciate the power of using a probability model by comparing experimental results with theoretical results; 8m117 – identify 0 to 1 as a range from “never happens” (impossibility) to “always happens” (certainty) when investigating probability; 8m118 – list the possible outcomes of simple experiments by using tree diagrams, modelling, and lists; 8m119 – identify the favourable outcomes among the total number of possible outcomes and state the associated probability (e.g., of getting chosen in a random draw); 8m121 – compare predicted and experimental results.
Complex Probabilities 8m116 – use probability to describe everyday events; 8m120 – use definitions of probability to calculate complex probabilities from tree diagrams and lists (e.g., for tossing a coin and rolling a die at the same time); 8m122 – apply a knowledge of probability in sports and games, weather predictions, and political polling. Best Measure of Central Tendency 8m103 – understand and apply the concept of the best measure of central tendency; 8m109 – determine the effect on a measure of central tendency of adding or removing a value (e.g., what happens to the mean when you add or delete a very low or very high data entry). Census vs. Sample 8m97 – collect primary data using both a whole population (census) and a sample of classmates, organize the data on tally charts and stem-and-leaf plots, and display the data on frequency tables; 8m98 – understand the relationship between a census and a sample.
Comparative Bar Graph 8m107 – assess bias in data-collection methods; 8m108 – read and report information about data presented on line graphs, comparative bar graphs, pictographs, and circle graphs, and use the information to solve problems. Bar Graph vs. Histogram 8m110 – understand the difference between a bar graph and a histogram; 8m111 – construct line graphs, comparative bar graphs, circle graphs, and histograms, with and without the help of technology, and use the information to solve problems.
* Expectations require that students be given the opportunity to learn through inquiry. Learning through problem solving is also recommended for most other curriculum expectations. Overall curriculum expectations are designated by the • after the number. Specific curriculum expectations are designated by the – after the number.

TIPS: Section 3 – Grade 8 © Queen’s Printer for Ontario, 2003 Page 7
Revisits
Grade 8: Term 1 Content Flow
Sets the stage by requiring application of Grade 7 skills and concepts (inspection and systematic trials)
Exemplar task provides a segue
Applied in context
An experiment provides a segue
Applied in context for practice
Introduction Days 1-6
Establish the importance of
problem solving, communication,
cooperative learning skills
Powers and Square Roots
Days 7-10 (Number Sense and Numeration
strand)
Pythagorean Relationship Days 11-16
(Geometry and Spatial strand)
Experimental vs. Theoretical
Probability Days 17-23
(Data Management
and Probability strand)
Integers Days 24- ?
(Number Sense and Numeration
strand)
Patterning Days ?-?
(Patterning and Algebra
strand)
Writing nth Terms
Days ?- ? (Patterning and Algebra
strand)
Solving Equations Days ?-?
(Patterning and Algebra
strand)
Other sequences are possible. Suggestions for development of further Term 1 lessons are included on page 8.
Provides examples for
An experiment provides a segue
TIPS: Section 3 – Grade 8 © Queen’s Printer for Ontario, 2003 Page 8
Developing Lessons Targeting Term 1 Curriculum Clusters – Integers, Solving Equations, Patterning, Writing nth Terms Suggestions • These curriculum clusters are supported by comprehensive content-based packages – Integers,
Solving Equations and Using Variables as Placeholders, and Patterning to Algebraic Modelling. It is recommended that groups of teachers collaboratively develop lessons using the contents of these packages as a starting point.
• Each package includes: − scope and sequence across grades − suggested instructional strategies for each of Grade 7, Grade 8, and Grade 9 Applied − suggestions for helping students develop understanding in the areas where experience shows that
some students may struggle − cross-strand connections − sample questions addressing key expectations based on the four mathematical process areas
identified and supported in this project − sample Developing Proficiency tests based on key expectations − Extend Your Thinking questions that ask for multiple solutions − Is This Always True? Questions to help student deepen their understanding of key concepts.
TIPS: Section 3 – Grade 8 © Queen’s Printer for Ontario, 2003 Page 9
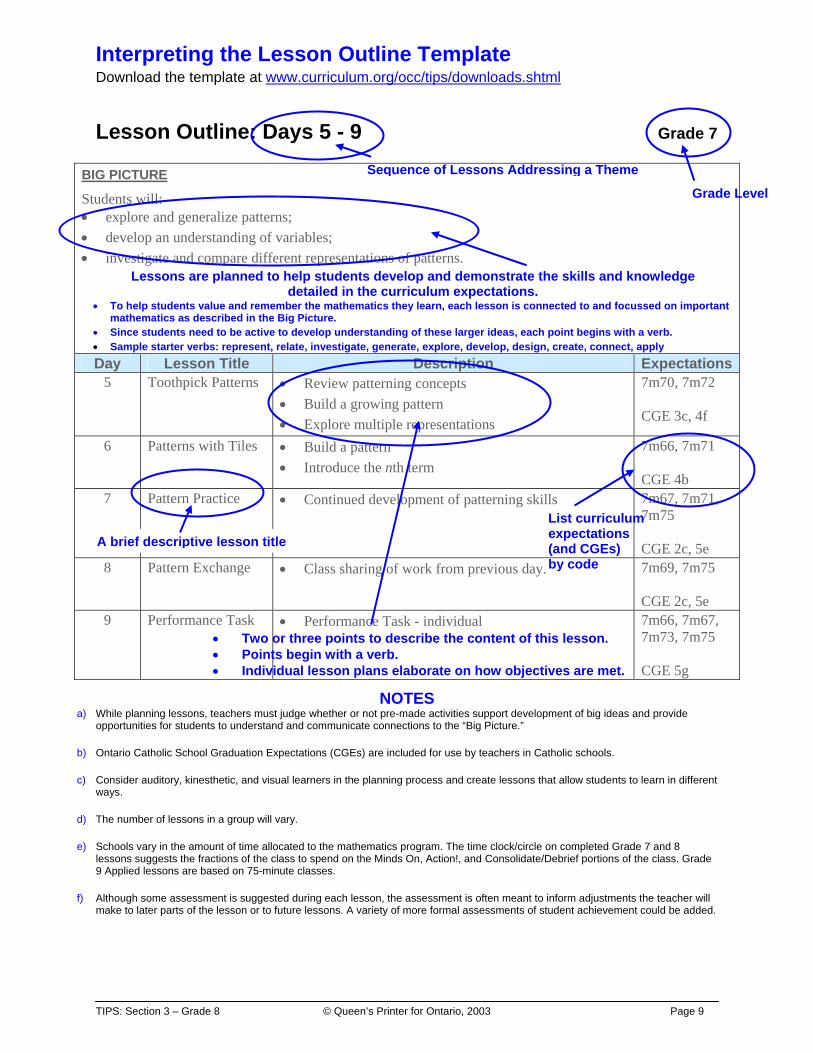
Interpreting the Lesson Outline Template Download the template at www.curriculum.org/occ/tips/downloads.shtml Lesson Outline: Days 5 - 9 Grade 7
BIG PICTURE
Students will: • explore and generalize patterns; • develop an understanding of variables; • investigate and compare different representations of patterns.
Day Lesson Title Description Expectations5 Toothpick Patterns • Review patterning concepts
• Build a growing pattern • Explore multiple representations
7m70, 7m72 CGE 3c, 4f
6 Patterns with Tiles • Build a pattern • Introduce the nth term
7m66, 7m71 CGE 4b
7 Pattern Practice • Continued development of patterning skills 7m67, 7m71, 7m75 CGE 2c, 5e
8 Pattern Exchange • Class sharing of work from previous day. 7m69, 7m75 CGE 2c, 5e
9 Performance Task • Performance Task - individual 7m66, 7m67, 7m73, 7m75 CGE 5g
NOTES a) While planning lessons, teachers must judge whether or not pre-made activities support development of big ideas and provide
opportunities for students to understand and communicate connections to the “Big Picture.” b) Ontario Catholic School Graduation Expectations (CGEs) are included for use by teachers in Catholic schools. c) Consider auditory, kinesthetic, and visual learners in the planning process and create lessons that allow students to learn in different
ways. d) The number of lessons in a group will vary. e) Schools vary in the amount of time allocated to the mathematics program. The time clock/circle on completed Grade 7 and 8
lessons suggests the fractions of the class to spend on the Minds On, Action!, and Consolidate/Debrief portions of the class. Grade 9 Applied lessons are based on 75-minute classes.
f) Although some assessment is suggested during each lesson, the assessment is often meant to inform adjustments the teacher will
make to later parts of the lesson or to future lessons. A variety of more formal assessments of student achievement could be added.
Sequence of Lessons Addressing a Theme
Grade Level
Lessons are planned to help students develop and demonstrate the skills and knowledge detailed in the curriculum expectations.
• To help students value and remember the mathematics they learn, each lesson is connected to and focussed on important mathematics as described in the Big Picture.
• Since students need to be active to develop understanding of these larger ideas, each point begins with a verb. • Sample starter verbs: represent, relate, investigate, generate, explore, develop, design, create, connect, apply
A brief descriptive lesson title
• Two or three points to describe the content of this lesson. • Points begin with a verb. • Individual lesson plans elaborate on how objectives are met.
List curriculum expectations (and CGEs) by code

TIPS: Section 3 – Grade 8 © Queen’s Printer for Ontario, 2003 Page 10
Interpreting the Lesson Planning Template Download the template at www.curriculum.org/occ/tips/downloads.shtml
Day 1: Encouraging Others Grade 8
Description • Practise the social skill of encouraging others. • Identify strategies involving estimation problems. • Set the stage for using estimation as a problem-solving strategy.
Materials • BLM 1.1 • birdseed
Assessment Opportunities
Minds On ...
Whole Group Brainstorm Explain why it is important to encourage others. Explicitly teach the social skill, “Encouraging Others,” through a group brainstorm. Create an anchor chart using the criteria: What does it look like? What does it sound like?
Action! Think/Pair/Share Gather Data Use an overhead of the Think/Pair/Share process (TIP 2.1) and student copies of BLM 1.1. Students gather data. Learning Skill/Observation/Mental Note: Circulate, observing social skills and listening to students. Share with students some of the positive words and actions observed during the activity and invite students to make additions to the anchor chart on Encouraging Others. Whole Class Sharing Based on ‘teachable topics’ during the Think/Pair/Share Activity, e.g., a particularly effective phrase/statement expressed by a student, clarification of the cooperative learning strategy, an interesting result on BLM 1.1, ask representatives of groups to share their results or report on their process.
Consolidate Debrief
Whole Class Discussion Use the posters Inquiry Model Flow Chart, Problem-Solving Strategies, and Understanding the Problem. Discuss how these posters will be of assistance over the next few days as well as during the whole math program. Point out that when students encourage others, it makes it safe for them to try new things and contribute to group activities.
“Learning is socially constructed; we seldom learn isolated from others.” - Bennett & Rolheiser Consider using stickers as a recognition for examples of the social skill being applied by a group. Solving Fermi problems is a way to collect diagnostic assessment data about social skills, academic understandings, and attitudes towards mathematics (see TIP 1.2).
Social Skill Practice Reflection
Home Activity or Further Classroom Consolidation Interview one or more adults about estimation using the following guiding questions and record your responses in a math journal. Summarize what you notice about the responses. You may be asked to share this math journal entry with the class.
Focus for the follow-up activity
• “Pulls out´ the math of the activities and investigations
• Prepares students for Home/Further Classroom Consolidation
Day #: Lesson Title
Tips for the TeacherThese include: - instructional hints - explanations - background - references to resources - sample responses to
questions/tasks
Materials used in the
lesson
Same two or three objectives listed in the lesson outline
Time colour-coded to the three parts of the day’s lesson
Meaningful and appropriate follow-up to the lesson.
• Mentally engages students at start of class • Makes connections between different math strands, previous lessons or groups of
lessons, students’ interests, jobs, etc. • Introduces a problem or a motivating activity - orients students to an activity or materials.
• Students do mathematics: reflecting, discussing, observing, investigating, exploring, creating, listening, reasoning, making connections, demonstrating understanding, discovering, hypothesizing
• Teachers listen, observe, respond
Suggested student grouping teaching/learning strategy for the activity.
Indicates an assessment opportunity - what is assessed/strategy/scoring tool
Indicates suggestedassessment
Grade Level

TIPS: Section 3 – Grade 8 © Queen’s Printer for Ontario, 2003 Page 11
Lesson Outline – Days 1 - 6 Grade 8
BIG PICTURE Students will: • develop teamwork skills through cooperative learning; • take risks when carrying out an investigation and demonstrate perseverance; • apply a variety of problem-solving strategies; • apply a number of estimation strategies during problem solving; • justify their solutions and choice of strategies; • make connections between prior and new knowledge to draw conclusions; • represent their thinking in a variety of ways, reflect on their learning, and communicate effectively.
Day Lesson Title Description Expectations1 Encouraging Others • Practise the social skill of encouraging others.
• Identify strategies involving estimation problems. • Set the stage for using estimation as a problem-solving
strategy.
8m7, 8m28 CGE 5a
2 Solving a Fermi Birdseed Problem
• Find a solution to a problem involving estimation. 8m6, 8m31, 8m112 CGE 3c
3 Taking Turns • Practise the social skill of taking turns. • Find a solution to a problem involving estimation.
8m6, 8m9, 8m32 CGE 5a
4 Paraphrasing and Summarizing
• Practise the social skill of active listening and paraphrasing.
• Practise developing good problem-solving strategies.
8m6, 8m9, 8m32, 8m112 CGE 2a
5 Including All Participants and Recording Mathematics
• Practise the social skill of including all participants. • Develop a method for effective recording of mathematics
learning. • Find a solution to a problem involving estimation.
8m6, 8m9, 8m14, 8m31 CGE 5a
6 Disagreeing in an Agreeable Way While Analysing Good Math Records
• Practise the social skill of disagreeing in an agreeable way.
• Examine math recordings, suggest how to improve them, and articulate what good writing looks like in mathematics.
• Create a concept map to help consolidate their thinking over the last few days.
8m6, 8m9, 8m14, 8m31, 8m32, 8m35, 8m39 CGE 5e

TIPS: Section 3 – Grade 8 © Queen’s Printer for Ontario, 2003 Page 12
Day 1: Encouraging Others Grade 8
Description • Practise the social skill of encouraging others. • Identify strategies involving estimation problems. • Set the stage for using estimation as a problem-solving strategy.
Materials • BLM 1.1 • birdseed
Assessment Opportunities
Minds On ...
Whole Group Brainstorm Explain why it is important to encourage others. Explicitly teach the social skill, Encouraging Others, through a group brainstorm. Create an anchor chart using the criteria: What does encouragement look like? What does it sound like? (TIP 2).
Action! Think/Pair/Share Gather Data Use an overhead of the Think/Pair/Share process (TIP 8) and student copies of BLM 1.1. Students gather data. Learning Skill/Observation/Mental Note: Circulate, observing social skills and listening to students. Share with students some of the positive words and actions observed during the activity and invite students to make additions to the anchor chart on Encouraging Others. Whole Class Sharing Based on ‘teachable topics’ during the Think/Pair/Share Activity, e.g., a particularly effective phrase/statement expressed by a student, clarification of the cooperative learning strategy, an interesting result on BLM 1.1, ask representatives of groups to share their results or report on their process. Whole Class Setting Stage Explain that during the first week, the class will solve a number of different kinds of Fermi problems to sharpen their problem-solving and estimation skills (Poster: Teaching Through Problem Solving). Discuss the concept of Fermi problems (TIP 3). Show a large bag of birdseed and ask, How many seeds do you think are in the bag? Tell the class that tomorrow they will work on solving this problem.
Consolidate Debrief
Whole Class Discussion Use the posters Teaching Through Problem Solving, Problem-Solving Strategies, and Understand the Problem. Discuss how these posters will be of assistance over the next few days as well as during the whole math program. Point out that when students encourage others, it makes it safe for them to try new things and contribute to group activities.
“Learning is socially constructed; we seldom learn isolated from others.” - Bennett & Rolheiser Consider using stickers as recognition for examples of the social skill being applied by a group. Solving Fermi problems is a way to collect diagnostic assessment data about social skills, academic understandings, and attitudes towards mathematics (TIP 3).
Social Skill Practice Reflection
Home Activity or Further Classroom Consolidation Interview one or more adults about estimation using the following guiding questions and record your responses in a math journal. Summarize what you notice about the responses. You may be asked to share this math journal entry with the class. • When do you use estimation and how often? • When are accurate calculations necessary?
Answer the following questions in the math journal to assess your growth in social skills. • The social skill focus of this activity was ___________. • Something I said or did to demonstrate the social skill was _________. • I helped the group work in a positive way by ________. • An area I want to work on is _____________.
TIPS: Section 3 – Grade 8 © Queen’s Printer for Ontario, 2003 Page 13
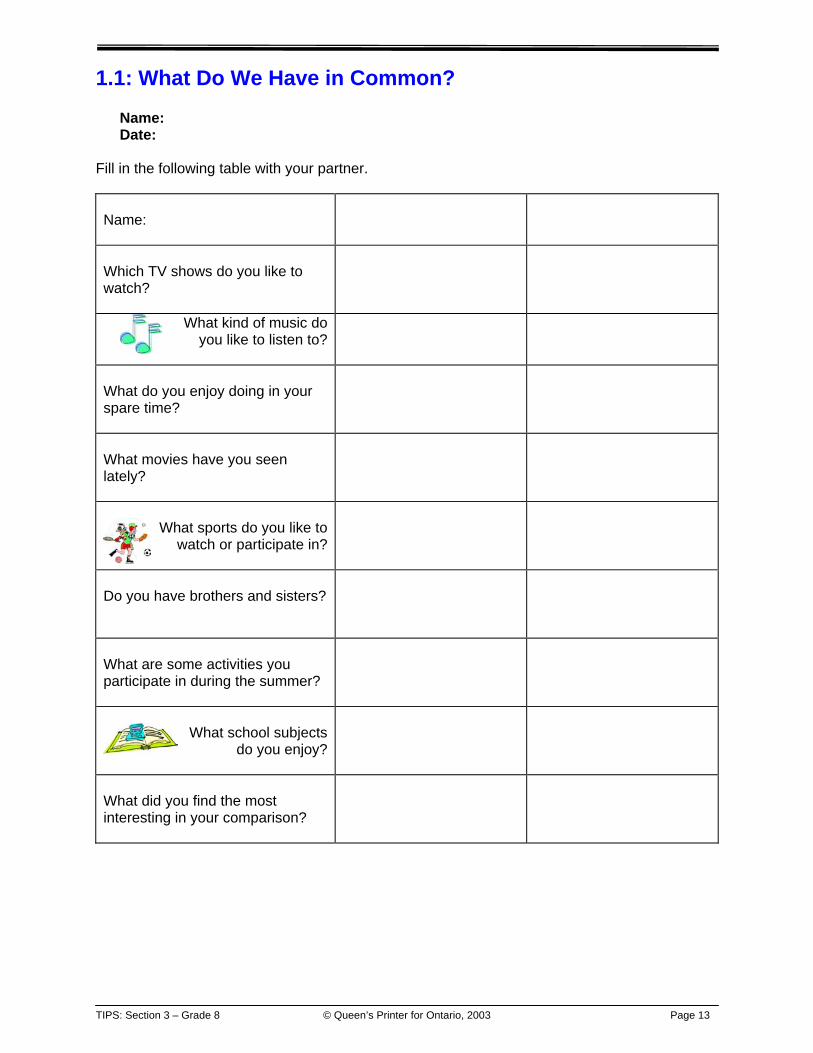
1.1: What Do We Have in Common? Name: Date:
Fill in the following table with your partner. Name:
Which TV shows do you like to watch?
What kind of music do you like to listen to?
What do you enjoy doing in your spare time?
What movies have you seen lately?
What sports do you like to
watch or participate in?
Do you have brothers and sisters?
What are some activities you participate in during the summer?
What school subjects
do you enjoy?
What did you find the most interesting in your comparison?
TIPS: Section 3 – Grade 8 © Queen’s Printer for Ontario, 2003 Page 14
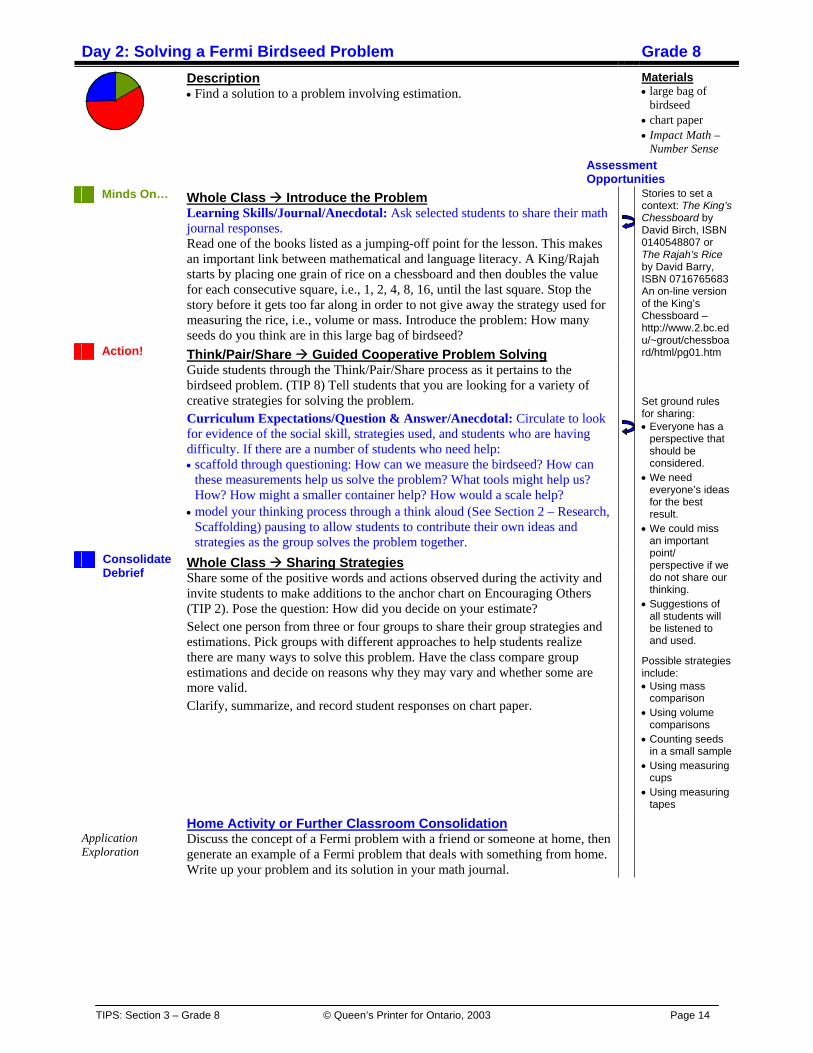
Day 2: Solving a Fermi Birdseed Problem Grade 8 Description
• Find a solution to a problem involving estimation. Materials
• large bag of birdseed
• chart paper • Impact Math –
Number Sense Assessment Opportunities Minds On…
Whole Class Introduce the Problem Learning Skills/Journal/Anecdotal: Ask selected students to share their math journal responses. Read one of the books listed as a jumping-off point for the lesson. This makes an important link between mathematical and language literacy. A King/Rajah starts by placing one grain of rice on a chessboard and then doubles the value for each consecutive square, i.e., 1, 2, 4, 8, 16, until the last square. Stop the story before it gets too far along in order to not give away the strategy used for measuring the rice, i.e., volume or mass. Introduce the problem: How many seeds do you think are in this large bag of birdseed?
Action! Think/Pair/Share Guided Cooperative Problem Solving Guide students through the Think/Pair/Share process as it pertains to the birdseed problem. (TIP 8) Tell students that you are looking for a variety of creative strategies for solving the problem. Curriculum Expectations/Question & Answer/Anecdotal: Circulate to look for evidence of the social skill, strategies used, and students who are having difficulty. If there are a number of students who need help: • scaffold through questioning: How can we measure the birdseed? How can
these measurements help us solve the problem? What tools might help us? How? How might a smaller container help? How would a scale help?
• model your thinking process through a think aloud (See Section 2 – Research, Scaffolding) pausing to allow students to contribute their own ideas and strategies as the group solves the problem together.
Consolidate Debrief
Whole Class Sharing Strategies Share some of the positive words and actions observed during the activity and invite students to make additions to the anchor chart on Encouraging Others (TIP 2). Pose the question: How did you decide on your estimate? Select one person from three or four groups to share their group strategies and estimations. Pick groups with different approaches to help students realize there are many ways to solve this problem. Have the class compare group estimations and decide on reasons why they may vary and whether some are more valid. Clarify, summarize, and record student responses on chart paper.
Stories to set a context: The King’s Chessboard by David Birch, ISBN 0140548807 or The Rajah’s Rice by David Barry, ISBN 0716765683 An on-line version of the King’s Chessboard – http://www.2.bc.edu/~grout/chessboard/html/pg01.htm Set ground rules for sharing: • Everyone has a
perspective that should be considered.
• We need everyone’s ideas for the best result.
• We could miss an important point/ perspective if we do not share our thinking.
• Suggestions of all students will be listened to and used.
Possible strategies include: • Using mass
comparison • Using volume
comparisons • Counting seeds
in a small sample • Using measuring
cups • Using measuring
tapes
Application Exploration
Home Activity or Further Classroom Consolidation Discuss the concept of a Fermi problem with a friend or someone at home, then generate an example of a Fermi problem that deals with something from home. Write up your problem and its solution in your math journal.

TIPS: Section 3 – Grade 8 © Queen’s Printer for Ontario, 2003 Page 15
Day 3: Taking Turns Grade 8
Description • Practise the social skill of taking turns. • Find a solution to a problem involving estimation.
Materials • BLM 3.1, 3.2 • phone books • calculators
Assessment Opportunities Minds On…
Whole Class Sharing Curriculum Expectations/Observation/Anecdotal: Listen to students and provide immediate feedback as Inside Outside Circle (TIP 13) are used to have students share the Fermi problem they developed. Rotate the circles and have students share their Fermi problem with a new partner. Review with the class any elements that have been misunderstood. Whole Class Brainstorm Brainstorm to create an anchor chart for Taking Turns (TIP 2). Groups of 4 Cooperative Group Problem Solving Use BLM 3.1 for a Placemat cooperative activity (TIP 9) Ask each group: Why was it difficult to solve the birdseed problem? What information did you need to know? Based on the class list of questions, each group generates a list of questions to guide them in making their estimates. Model for the class how to create one or two of these questions. Whole Class Discussion One person from each group is selected at random to share one question from the Placemat activity. Record the questions on chart paper or on a transparency. Using a transparency of BLM 3.2, the class orders the questions from the class chart from broadest at the top to more narrow information at the bottom so that the combined answers give an appropriate estimation. How did you decide on your questions?
Action! Groups of 4 Cooperative Problem Solving Learning Skills & Curriculum Expectations/Observation/Anecdotal: Circulate while groups are working. Using a Placemat activity, students choose a strategy to solve the problem, How many names are there in the phone book? After solving the problem, students use the Ranking Ladder (BLM 3.2) to sequence the questions they used to arrive at an accurate estimation.
Consolidate Debrief
Whole Class Discussion Curriculum Expectations/Exhibition/Checklist: Select one person from two or three of the groups to present their problem-solving strategies to the class. Choose groups with different methods for solving the problem. Encourage students to show how each strategy follows the estimation model. Record strategies on a transparency or chart paper. Summarize strategies with the class, modelling the selection of important information. Tell the class that they will build the summarizing skills used today during next class. Reaffirm how estimation skills improve with practice.
Inside/Outside Circles help develop a positive classroom climate and a community of learners. During cooperative learning, use a 2-colour disk as a barometer. Show the white side when the group is demonstrating the social skill. Show the red side when they are not using the social skill. Fermi solved his legendary problems by developing a series of questions and estimating the answers. Give examples of some of the positive things (Taking Turns and Encouraging Others) and add them to the class anchor charts. See TIP 15, Questioning, for suggestions on how to elicit mathematical thinking.
Reflection
Home Activity or Further Classroom Consolidation In your math journal, identify a situation where estimation is needed, then describe a strategy that could be used to establish a reasonably accurate estimate.

TIPS: Section 3 – Grade 8 © Queen’s Printer for Ontario, 2003 Page 16
3.1: Placemat Names: Date:

TIPS: Section 3 – Grade 8 © Queen’s Printer for Ontario, 2003 Page 17
3.2: Ranking Ladder Name: Date:
Use the ranking ladder to organize the questions you used to arrive at an accurate estimation. List the first question you would ask yourself to solve the problem at the top of the ladder. List the last question at the bottom of the ladder, and use the middle rungs to put the other questions in order.
TIPS: Section 3 – Grade 8 © Queen’s Printer for Ontario, 2003 Page 18
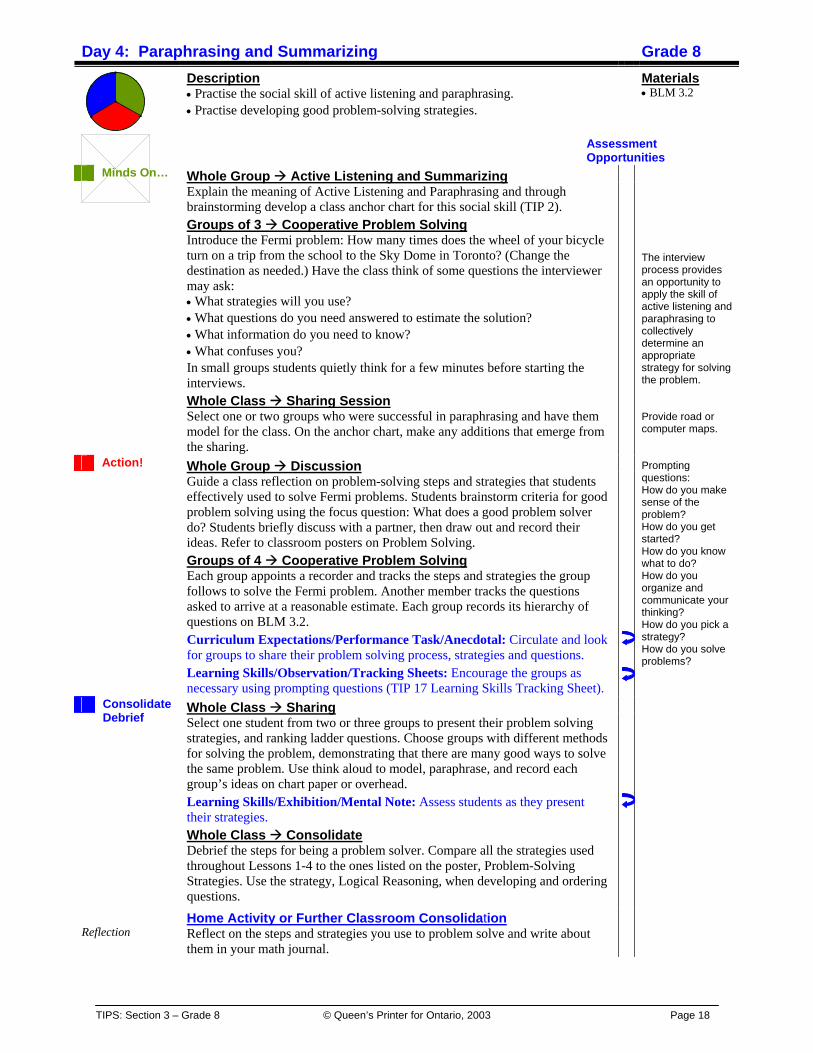
Day 4: Paraphrasing and Summarizing Grade 8
Description • Practise the social skill of active listening and paraphrasing. • Practise developing good problem-solving strategies.
Materials • BLM 3.2
Assessment Opportunities Minds On…
Whole Group Active Listening and Summarizing Explain the meaning of Active Listening and Paraphrasing and through brainstorming develop a class anchor chart for this social skill (TIP 2). Groups of 3 Cooperative Problem Solving Introduce the Fermi problem: How many times does the wheel of your bicycle turn on a trip from the school to the Sky Dome in Toronto? (Change the destination as needed.) Have the class think of some questions the interviewer may ask: • What strategies will you use? • What questions do you need answered to estimate the solution? • What information do you need to know? • What confuses you? In small groups students quietly think for a few minutes before starting the interviews. Whole Class Sharing Session Select one or two groups who were successful in paraphrasing and have them model for the class. On the anchor chart, make any additions that emerge from the sharing.
Action! Whole Group Discussion Guide a class reflection on problem-solving steps and strategies that students effectively used to solve Fermi problems. Students brainstorm criteria for good problem solving using the focus question: What does a good problem solver do? Students briefly discuss with a partner, then draw out and record their ideas. Refer to classroom posters on Problem Solving. Groups of 4 Cooperative Problem Solving Each group appoints a recorder and tracks the steps and strategies the group follows to solve the Fermi problem. Another member tracks the questions asked to arrive at a reasonable estimate. Each group records its hierarchy of questions on BLM 3.2. Curriculum Expectations/Performance Task/Anecdotal: Circulate and look for groups to share their problem solving process, strategies and questions. Learning Skills/Observation/Tracking Sheets: Encourage the groups as necessary using prompting questions (TIP 17 Learning Skills Tracking Sheet).
Consolidate Debrief
Whole Class Sharing Select one student from two or three groups to present their problem solving strategies, and ranking ladder questions. Choose groups with different methods for solving the problem, demonstrating that there are many good ways to solve the same problem. Use think aloud to model, paraphrase, and record each group’s ideas on chart paper or overhead. Learning Skills/Exhibition/Mental Note: Assess students as they present their strategies. Whole Class Consolidate Debrief the steps for being a problem solver. Compare all the strategies used throughout Lessons 1-4 to the ones listed on the poster, Problem-Solving Strategies. Use the strategy, Logical Reasoning, when developing and ordering questions.
The interview process provides an opportunity to apply the skill of active listening and paraphrasing to collectively determine an appropriate strategy for solving the problem. Provide road or computer maps. Prompting questions: How do you make sense of the problem? How do you get started? How do you know what to do? How do you organize and communicate your thinking? How do you pick a strategy? How do you solve problems?
Reflection Home Activity or Further Classroom Consolidation Reflect on the steps and strategies you use to problem solve and write about them in your math journal.

TIPS: Section 3 – Grade 8 © Queen’s Printer for Ontario, 2003 Page 19
Day 5: Including All Participants and Recording Mathematics Grade 8
Description • Practise the social skill of including all participants. • Develop a method for effective recording of mathematics learning. • Find a solution to a problem involving estimation.
Materials • BLM 1.2, 3.2,
5.1 • Math posters • colour markers
Assessment Opportunities Minds On…
Whole Class Reflection Introduce the social skill: Including All Participants. Students discuss why the skill is important and what it looks like and sounds like (TIP 2). Learning Skill/Self-Assessment/Anecdotal: Using journal question at the end of Day 1, have students self-assess their social skills development to date. Groups of 4 Graffiti Board Use the following questions to help students begin their graffiti board: • Why record in math? • What should the written explanation of your records include? • In what other ways besides words can you organize and show your thinking? • If you were trying to understand someone else’s thinking, what information
and organizational formats (diagrams, tables, charts, etc.) would help you? Circulate and use prompting questions, as necessary (TIP 15). Whole Class Sharing Students consolidate their thinking and develop a list of criteria for good math records. Create and post a class anchor chart listing the criteria for good math records.
Action! Whole Class Introduce the Fermi problem Introduce today’s problem: How many hours do students in Grade 7 and 8 in Ontario talk on the telephone in one year? Groups of 4 Solve the Problem Students discuss and record their questions on the Ranking Ladder (BLM 3.2). When they have found a satisfactory solution, the group discusses and creates their best record using the criteria developed during the Graffiti Board exercise. Provide markers and chart paper. Use BLM 5.1 on a transparency to guide students’ thinking. Learning Skills/Observation/Checklist: During the problem-solving process, look for students who are recording their series of questions in sequence and groups that are using different strategies. Call on these groups during consolidation.
Consolidate Debrief
Whole Class Discussion Curriculum Expectations/Performance Task/Rating Scale: Select groups to display their recordings and explain their estimation/problem-solving process. Clarify, if necessary, having students turn to a partner to paraphrase what was explained. Guide the discussion, as necessary. Ask students to reflect on whether they are becoming more accomplished estimators. Discuss estimation strategies that you have observed throughout the class. Tell students they will discuss records in more detail during the next class.
Note: Display the Math posters prominently: Teaching Through Problem Solving, Representations Make Our Thinking Visible, Understand the Problem, and Problem-Solving Strategies. Link to writing for different audiences. Display the teacher-made charts of student strategies for Fermi problems Remind students to use the social skills they have learned to date. Be sure that students note that good records should include one or more representations of thinking: diagrams, words, numbers or symbols, tables, etc.
Application Concept Practice
Home Activity or Further Classroom Consolidation Explain to someone how you would solve today’s Fermi problem.

TIPS: Section 3 – Grade 8 © Queen’s Printer for Ontario, 2003 Page 20
5.1: Thinking to Solve Problems
Name: Date:
What do you predict? Why? What question will you use to begin estimating? How will you decide how many students there are in Grades 7 and 8? What surprises you? Why? What do you find interesting? Explain. Describe any trends you see in the data? Why do you think these trends are happening?
TIPS: Section 3 – Grade 8 © Queen’s Printer for Ontario, 2003 Page 21
Day 6: Disagreeing in an Agreeable Way While Analysing Good Math Records Grade 8
Description • Practise the social skill of disagreeing in an agreeable way. • Examine math records, suggest how to improve them, and articulate what
good writing looks like in mathematics. • Create a concept map to help consolidate their thinking over the last few days.
Materials • BLM 6.1
Assessment Opportunities Minds On…
Whole Class Discovery Present both positive and negative examples of the social skill shown on BLM 6.1. With a partner, students compare the two scenarios. When the class agrees on the social skill, help them decide on an appropriate name for it. Discuss why this skill is important to their learning and cooperative group work. Create an anchor chart for Disagreeing in an Agreeable Way (TIP 2). Explain that today the class will analyse some examples from the previous day’s student records, specifically looking for evidence of good mathematics communication. Select two examples of group records from Day 5’s work (remove student names). Remind them that students worked hard to make these the best records possible. It is important to respect their effort by noting the strengths of the recordings, making positive suggestions for improvement. Remind students of all the positive social skills they have developed to date.
Action! Think/Pair/Share Peer Assessment Students examine the examples and jot down at least three things that demonstrate the criteria the class established and one or two positive ways the authors can improve their records. They pair and share their findings. Look for students who have found evidence of the established criteria and for examples of students disagreeing positively. Use prompting questions to encourage students, as needed. Students self-assess their group work, using the questions from Day 1. Whole Class Sharing Session Select one person from each group to make thoughtful positive comments and suggestions for improvement. Record each of the group’s suggestions on chart paper and summarize their findings. Point out any evidence students may have missed of representations, thinking, strategies, and noticing patterns. Whole Class Brainstorm Ask what students have done during the first five math classes. Record responses on chart paper or transparency (social skills, cooperative group work, Fermi problems, estimation, setting the criteria for good mathematical recordings). Discuss a concept map (poster) with students. Groups of 4 Concept Map Activity Students make a concept map to summarize what they have learned so far in math class. Remind them to use the social skills they have learned. Learning Skills/Observation/Checklist: Circulate and observe, noting the symbols and other features students use on their concept maps. Listen for good use of social skills. Assess each student’s contribution to the group as they work on their concept maps.
Consolidate Debrief
Whole Class Sharing Learning Skills/Exhibition/Checklist: Post concept maps. Students name some symbols that help them to remember the past week. Choose one student from each group to tell what the Fermi problems/ estimating taught them.
Be sensitive to the fact that in some cultures it is considered disrespectful to maintain direct eye contact with another person. Post TIP 2 or place it on a transparency. Social skills should be left posted to remind students of the expectations when working in groups. Students can be more successful making concept maps if they have time to talk about and process their memories. Concept maps may be collected and commented on for group work and effort.
Reflection
Home Activity or Further Classroom Consolidation Reflect on your group records in your math journal looking for strengths and improvements. Write a letter to the teacher to explain what you learned this week in math class and your goals for the term. Explain how you learn mathematics best.
TIPS: Section 3 – Grade 8 © Queen’s Printer for Ontario, 2003 Page 22
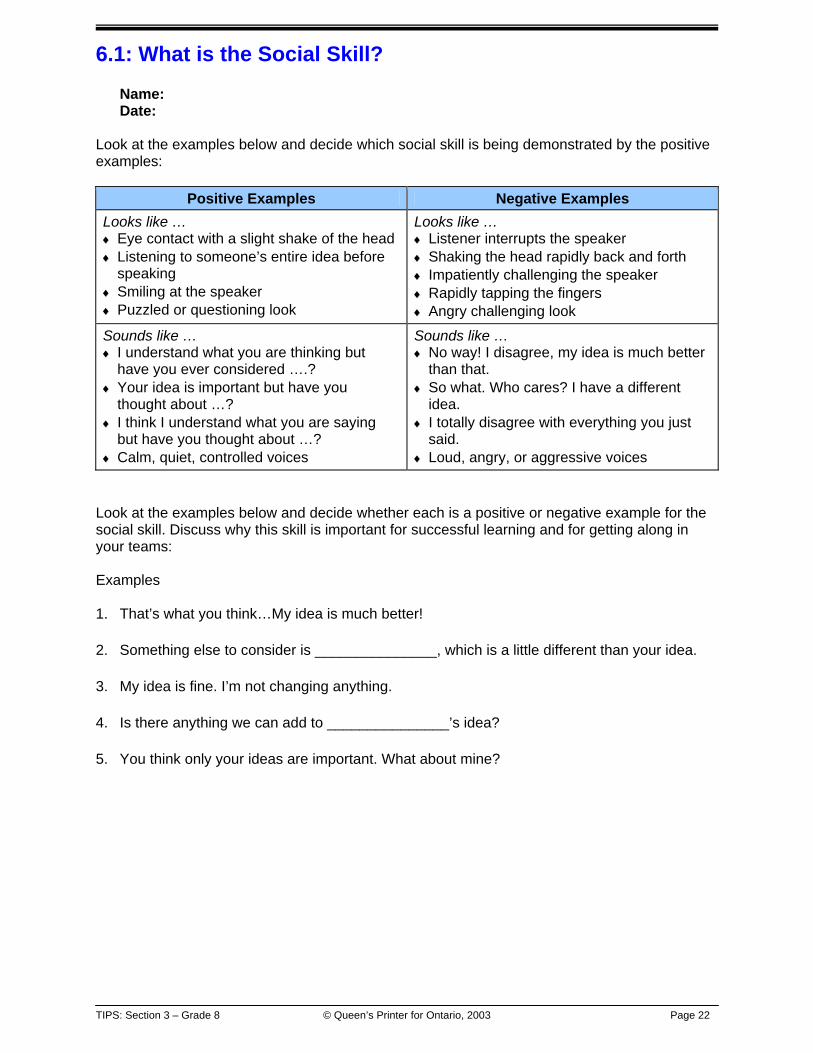
6.1: What is the Social Skill? Name: Date:
Look at the examples below and decide which social skill is being demonstrated by the positive examples:
Positive Examples Negative Examples Looks like … ♦♦ Eye contact with a slight shake of the head ♦♦ Listening to someone’s entire idea before
speaking ♦♦ Smiling at the speaker ♦♦ Puzzled or questioning look
Looks like … ♦♦ Listener interrupts the speaker ♦♦ Shaking the head rapidly back and forth ♦♦ Impatiently challenging the speaker ♦♦ Rapidly tapping the fingers ♦♦ Angry challenging look
Sounds like … ♦♦ I understand what you are thinking but
have you ever considered ….? ♦♦ Your idea is important but have you
thought about …? ♦♦ I think I understand what you are saying
but have you thought about …? ♦♦ Calm, quiet, controlled voices
Sounds like … ♦♦ No way! I disagree, my idea is much better
than that. ♦♦ So what. Who cares? I have a different
idea. ♦♦ I totally disagree with everything you just
said. ♦♦ Loud, angry, or aggressive voices
Look at the examples below and decide whether each is a positive or negative example for the social skill. Discuss why this skill is important for successful learning and for getting along in your teams: Examples 1. That’s what you think…My idea is much better! 2. Something else to consider is _______________, which is a little different than your idea. 3. My idea is fine. I’m not changing anything. 4. Is there anything we can add to _______________’s idea? 5. You think only your ideas are important. What about mine?

TIPS: Section 3 – Grade 8 © Queen’s Printer for Ontario, 2003 Page 23
Lesson Outline: Days 7 - 10 Grade 8
BIG PICTURE Students will: • appreciate that numbers can appear in numerous written and numerical forms; • represent whole numbers in expanded form using powers and scientific notation; • represent whole numbers using words and expanded notation; • apply rules for multiplying and dividing by powers of 10 to mentally solve problems; • develop rules for multiplying and dividing by powers of 10; • appreciate the need to find square roots; • use calculators to estimate the square root of a number.
Day Lesson Title Description Expectations 7 The Value of Place
Value • Review place value and correct reading of large and
small numbers from 0.001 to 999 999 999. • Represent whole numbers using word form, expanded
form, and expanded form using powers and scientific notation.
8m10, 8m11 CGE 5a
8 Powering Up with Powers of 10
• Observe patterns for multiplying and dividing by powers of 10. Develop a set of rules for multiplying and dividing by powers of 10.
8m12, 8m32, 8m36 CGE 5a
9 Making Sense of Squares
• Review area of squares. 8m91, 8m79 CGE 4b
10 Finding the Root of the Problem
• Determine square roots of perfect and non-perfect squares.
8m24, 8m25, 8m26, 8m27 CGE 4b, 5a
TIPS: Section 3 – Grade 8 © Queen’s Printer for Ontario, 2003 Page 24
Day 7: The Value of Place Value Grade 8
Description • Review place value and correct reading of large and small numbers from
0.001 to 999 999 999. • Represent whole numbers using word form, expanded form, and expanded
form using powers and scientific notation.
Materials • place value mats • centicubes • BLM 7.1, 7.2
Assessment Opportunities Minds On…
Whole Class Connection to Jobs Pose these questions: What jobs involve the use of very large numbers? What is being measured by these very large numbers? Have students volunteer their ideas and record the answers on the board.
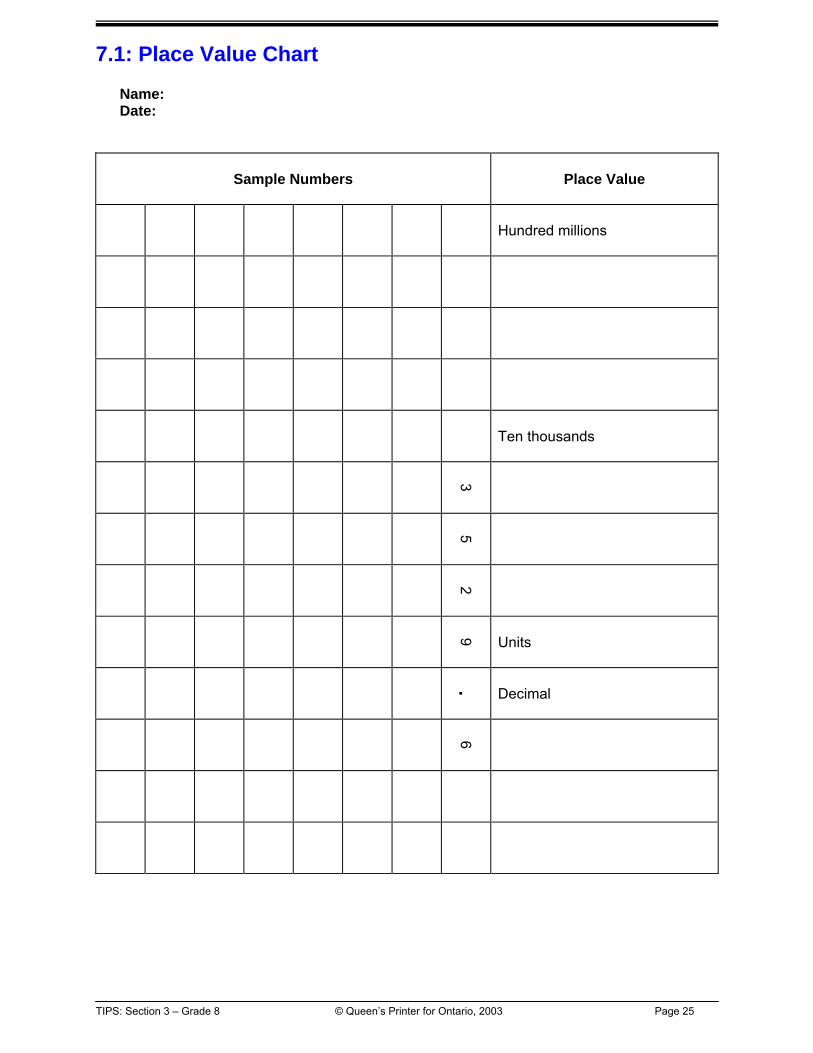
Action! Whole Class Applying Concepts Place a transparency of BLM 7.1 on the overhead projector and hand out student copies. Prompt students to name the columns with place values from hundred millions on the left to thousandths on the right of the decimal column. Fill in BLM 7.1 on the transparency and ensure each student has it completed correctly. Write a number on BLM 7.1 and say the number correctly as it is being written down, e.g., 2.47 - two and forty-seven hundredths. Curriculum Expectations/Question & Answer/Mental Note: Repeat for more numbers, prompting different students to correctly read the new number. Write one of the numbers from the chart on the board and ask, In how many different forms can you represent the number 574? Form of the number Representations Standard form 574 Word form five hundred seventy-four Expanded form 5 × 100 + 7 × 10 + 4 × 1 Students will be familiar with these three forms from previous grades. To introduce another form which expresses the expanded form with powers, ask: How can we represent 100 as a power of base 10? 100 = 10 × 10 = 102 Represent as a power of base 10: 100 000 = 10 × 10 × 10 × 10 × 10 = 105 Ask: How do you determine the exponent of the base 10? The final form of 574 in expanded form with powers 5 × 10² + 7 × 101 + 4, and in scientific notation 5.74 × 10²
Consolidate Debrief
Whole Class Demonstrate Understanding To reinforce understanding of the different forms, complete two or three exercises with students. Individual Practise Students complete BLM 7.2 individually.
Among the possibilities are jobs involving money, cell or bacteria counts, outer space, and astronomy. Students may need to use place value mats and base 10 blocks. When reading numbers aloud it is important to remember ‘and’ is used to express a decimal point. e.g., sixteen and eight tenths - 16.8, fourteen and nine thousandths - 14.009 No ‘and’ is used in one thousand forty – 1040 Students are not expected to work with zero or negative exponents until Grade 9.
Concept Practice Home Activity and Further Classroom Consolidation Order all the numbers on worksheet 7.2 from smallest to largest. In your math journal, under the heading Using Large Numbers, describe a context where large numbers are used, where you obtained this information, and express a number used in this situation in four different ways. Explain in your math journal what you think the exponent of base 10 would be for the number 1 or 100
1 = 0.01 or 100001 = 0.0001.
In scientific notation, a number looks like a number with one non-zero digit to the left of the decimal times a power of 10, e.g., 1.23 × 10, 9.6 × 10³, 5.001 × 10⁴ Pose this question for students who need a challenge.
TIPS: Section 3 – Grade 8 © Queen’s Printer for Ontario, 2003 Page 25
7.1: Place Value Chart Name: Date:
Sample Numbers
Place Value
Hundred millions
Ten thousands
3
5
2
9
Units
.
Decimal
6
TIPS: Section 3 – Grade 8 © Queen’s Printer for Ontario, 2003 Page 26
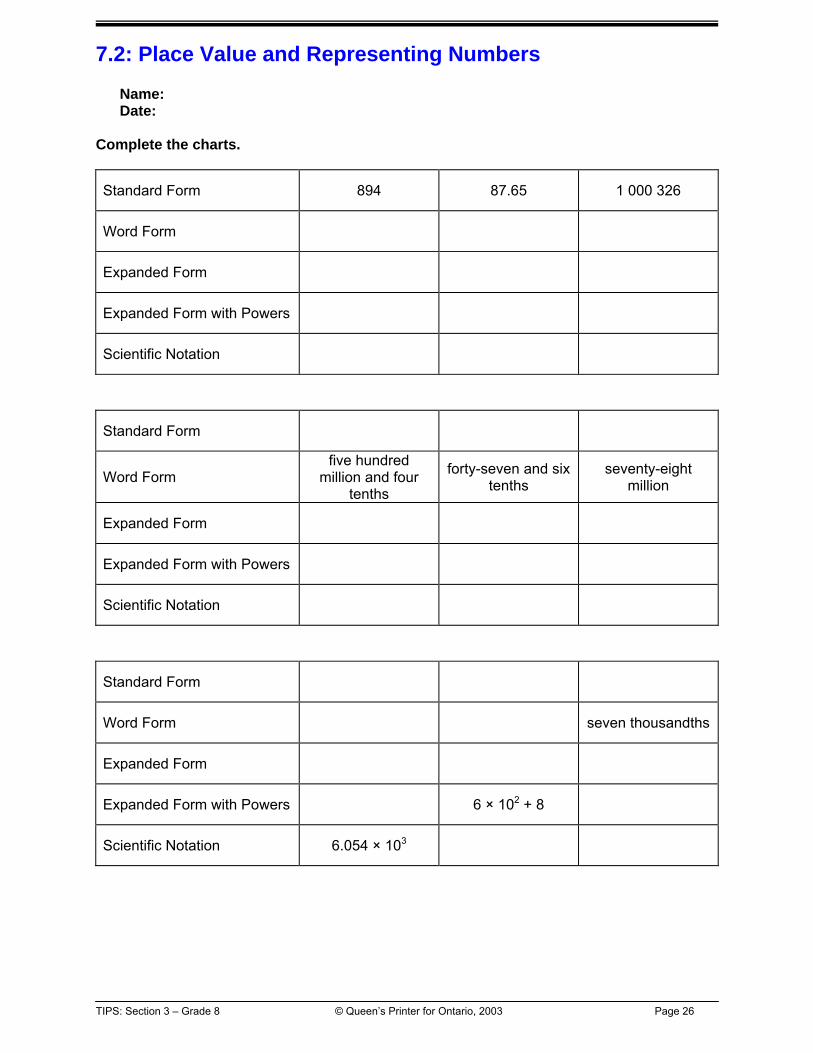
7.2: Place Value and Representing Numbers Name: Date:
Complete the charts.
Standard Form 894 87.65 1 000 326
Word Form
Expanded Form
Expanded Form with Powers
Scientific Notation
Standard Form
Word Form five hundred
million and four tenths
forty-seven and six tenths
seventy-eight million
Expanded Form
Expanded Form with Powers
Scientific Notation
Standard Form
Word Form seven thousandths
Expanded Form
Expanded Form with Powers 6 × 10² + 8
Scientific Notation 6.054 × 10³

TIPS: Section 3 – Grade 8 © Queen’s Printer for Ontario, 2003 Page 27
Day 8: Powering Up with Powers of 10 Grade 8
Description • Observe patterns for multiplying and dividing by powers of 10. • Develop a set of rules for multiplying and dividing by powers of 10.
Materials • place value
mats • centicubes,
algeblocks • BLM 8.1, 8.2
Assessment Opportunities Minds On…
Whole Class Review Concepts While taking up student responses to BLM 7.2, assess whether students require further opportunities to learn and practise or whether they are ready for a quiz. Discuss how to get 10% of a number mentally and review metric units (metric staircase). Curriculum Expectations/Question & Answer/Mental Note: Ask students to give the answers to simple questions, without using a calculator, e.g., 246 × 100, 246 ÷ 100, 246 ÷ 0.01. Explain why it would be useful to develop rules for multiplying and dividing by powers of 10. Multiplying and dividing by powers of 10 are often part of calculations related to the metric system and finance.
Action! Think/Pair/Share Building Algorithmic Skills Students individually complete Part A of BLM 8.1. In pairs, they check results and look for patterns to complete the rules in Part B. Students test the rules on new examples and then check their answers with calculators. Have two or more groups write their rules on chart paper.
Consolidate Debrief
Whole Class Summarizing As a class, agree on the best wording for the rules in Part B, BLM 8.1. The rules can be summarized as follows: 1. When multiplying by 10, 100, 1000, etc., the number gets larger, so move
the decimal point the same number of places as there are zeros in the power to the right.
2. When multiplying by 0.1, 0.01, 0.001, etc. the number gets smaller, so move the decimal point the same number of places as there are digits to the right of the decimal point to the left.
3. When dividing by 10, 100, 1000, etc., the number gets smaller, so move the decimal point the same number of places as there are zeros in the power to the left.
4. When dividing by 0.1, 0.01, 0.001, etc., the number gets larger, so move the decimal point the same number of places as there are digits to the right of the decimal point to the right.
Assign appropriate concept practice exercises from textbook – look for context questions.
Negative exponents are not introduced until Grade 9. Students who are having difficulty may use place value charts to see the direction the decimal moves. Rules may have to be modified until they are accurate. Demonstrate how division by a number less than 1 produces an answer greater than the dividend.
Application Reflection Concept Practice Skill Drill
Home Activity or Further Classroom Consolidation Complete the exercises assigned from your textbook. Answer one of these questions in your math journal: • Taxes on purchases in Ontario are 15% (7% GST and 8% PST). To do a
quick calculation of the tax owing on a purchase, you can mentally take 10% of the total and then half of that and add them together. Explain what the tax would be on a purchase of $186.00 using this method.
• In Grade 6, you converted one metric unit to another, e.g., metres to centimetres or grams to kilograms. Explain how to change from one metric unit to another, e.g., 80 m to cm, without using a calculator.
The math journal entry can be assessed for Curriculum Expectation/ Journal/Rubric. [See 8.2 Assessment Tool]

TIPS: Section 3 – Grade 8 © Queen’s Printer for Ontario, 2003 Page 28
8.1: Finding a Pattern Multiplying and Dividing using Powers of 10
Name: Date:
A) Complete the chart.
Number
Instruction
Calculation
Result
1. a) 35.2 Multiply by 10 35.2 × 10 = 35.2 × 101 352
b) 35.2 Multiply by 100 35.2 × 100 = 35.2 × 10²
c) 35.2 Multiply by 1 000
2. a) 35.2 Multiply by 0.1
b) 35.2 Multiply by 0.01
c) 35.2 Multiply by 0.001
3. a) 35.2 Divide by 10
b) 35.2 Divide by 100
c) 35.2 Divide by 1 000
4. a) 35.2 Divide by 0.1
b) 35.2 Divide by 0.01
c) 35.2 Divide by 0.001
B) Look for patterns and complete the rules: 1. When multiplying by 10, 100, 1 000, etc., the number gets ______________ so move the
decimal point __________________________________ to the ______________ .
2. When multiplying by 0.1, 0.01, 0.001, etc., the number gets ______________ so move the
decimal point __________________________________ to the ______________ .
3. When dividing by 10, 100, 1 000, etc., the number gets ______________ so move the
decimal point __________________________________ to the ______________ .
4. When dividing by 0.1, 0.01, 0.001, etc., the number gets ______________ so move the
decimal point __________________________________ to the ______________ .

TIPS: Section 3 – Grade 8 © Queen’s Printer for Ontario, 2003 Page 29
8.2 Assessment Tool: Journal Entry Name: Date: Journal Entry Topic:
Mathematical
Process (Category)
Criteria Below Level 1 Level 1 Level 2 Level 3 Level 4
Making Connections (Understanding of Concepts) - metric conversion
Depth of understanding
- little or no evidence
- superficial depth
- moderate depth
- substantial - insightful
Communicating (Communication) - explains metric conversion
Clarity - unclearly - with limited clarity
- with some clarity
- clearly - precisely
- uses mathematical language, symbols, forms, and conventions
Use of conventions (accurately, effectively, and fluently)
- demonstrates an undeveloped use of conventions
- demonstrates minimal skill in the use of conventions
- demonstrates moderate skill in the use of conventions
- demonstrates considerable skill in the use of conventions
- demonstrates a high degree of skill in the use of conventions
Comments:

TIPS: Section 3 – Grade 8 © Queen’s Printer for Ontario, 2003 Page 30
Day 9: Making Sense of Squares Grade 8
Description • Review area of squares.
Materials • 5 × 5 geoboards • overhead
geoboard • BLM 9.1, 9.2,
9.3 • Ministry
Exemplar Task (2002)
Assessment Opportunities Minds On…
Whole Class Orienting Students to an Activity Look into a box or an envelope and say, I’m looking at a quadrilateral (four-sided polygon). I think it is a square. How do I know if it really is a square? (See Grade 8 Exemplar.) Use on a transparency, of 3 × 3 dot grid, BLM 9.1. How many different-sized squares can be drawn? Have students draw the different squares on the transparency. Demonstrate the overlapping nature of 2 × 2 squares on a 4 × 4 dot grid.
Action! Pairs Shared Exploration Working in pairs, students determine all the different-sized squares they can construct on a 5 × 5 geoboard. Students record their findings on BLM 9.2. Students who finish early can explore the total number of squares that can be generated on a 5 × 5 grid. This includes counting all squares with the same area. For example, there are sixteen 1 × 1 squares. Students who require scaffolding could work with a 4 × 4 grid first, then move to a 5 × 5 grid. Challenge students to confirm that the shapes constructed using diagonal sides are squares. Further challenge them to make the confirmation in several ways (TIP 4).
Consolidate Debrief
Whole Class Summarizing Learning Skill (class participation, initiative)/Presentation/Checklist: Have some students use the overhead BLM 9.2 to show the different-sized squares generated on the 5 × 5 geoboard. Individual Making Connections Students begin BLM 9.3. This exercise helps increase student familiarity with perfect square numbers. Ensure that all squares are counted and the connection to perfect square numbers is made.
This lesson is based on one of the Grade 8 Ministry Exemplar Tasks (2002) Some students may not think of creating squares using diagonal sides.
Application Concept Practice Skill Drill
Home Activity or Further Classroom Consolidation Complete worksheet 9.3.

TIPS: Section 3 – Grade 8 © Queen’s Printer for Ontario, 2003 Page 31
9.1: Overhead Grid Dot Paper – Teacher
● ● ● ● ● ● ● ● ●
● ● ● ● ● ● ● ● ●
● ● ● ● ● ● ● ● ●
● ● ● ● ● ● ● ●
● ● ● ● ● ● ● ●
● ● ● ● ● ● ● ●
● ● ● ● ● ● ● ●
● ● ● ● ● ● ● ●
● ● ● ● ● ● ● ●
● ● ● ● ● ● ● ●
● ● ● ● ● ● ● ●

TIPS: Section 3 – Grade 8 © Queen’s Printer for Ontario, 2003 Page 32
9.2: 5 × 5 Grids Name: Date:
Use the grids below to record the results of your work.
● ● ● ● ● ● ● ● ● ●
● ● ● ● ● ● ● ● ● ●
● ● ● ● ● ● ● ● ● ●
● ● ● ● ● ● ● ● ● ●
● ● ● ● ● ● ● ● ● ●
● ● ● ● ● ● ● ● ● ●
● ● ● ● ● ● ● ● ● ●
● ● ● ● ● ● ● ● ● ●
● ● ● ● ● ● ● ● ● ●
● ● ● ● ● ● ● ● ● ●
● ● ● ● ● ● ● ● ● ●
● ● ● ● ● ● ● ● ● ●
● ● ● ● ● ● ● ● ● ●
● ● ● ● ● ● ● ● ● ●
● ● ● ● ● ● ● ● ● ●
TIPS: Section 3 – Grade 8 © Queen’s Printer for Ontario, 2003 Page 33
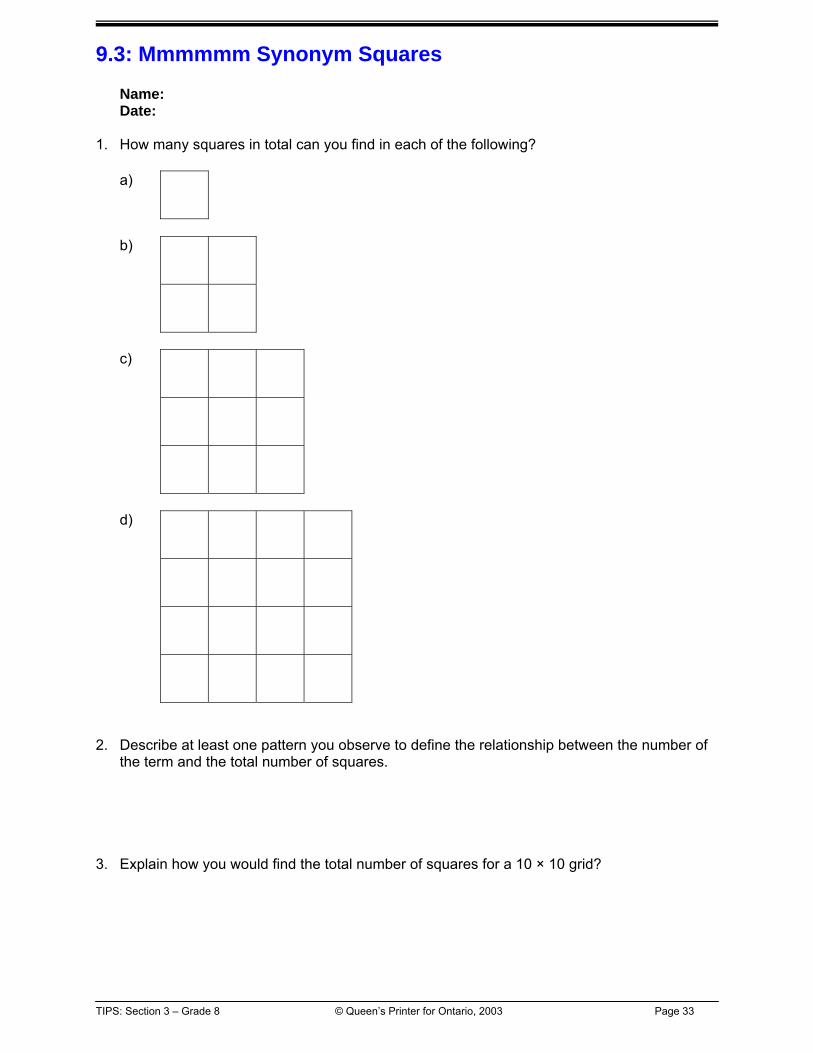
9.3: Mmmmmm Synonym Squares Name: Date:
1. How many squares in total can you find in each of the following?
a)
b)
c)
d)
2. Describe at least one pattern you observe to define the relationship between the number of
the term and the total number of squares. 3. Explain how you would find the total number of squares for a 10 × 10 grid?
TIPS: Section 3 – Grade 8 © Queen’s Printer for Ontario, 2003 Page 34
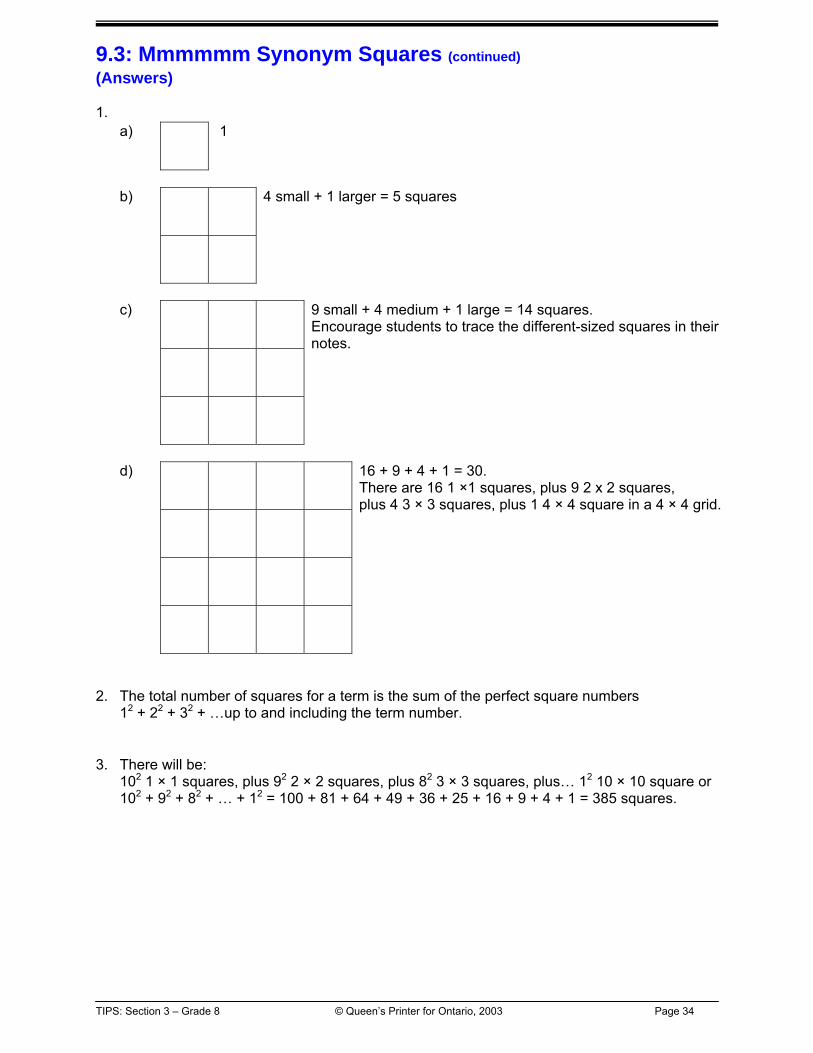
9.3: Mmmmmm Synonym Squares (continued) (Answers) 1.
a) 1
b)
4 small + 1 larger = 5 squares
c)
9 small + 4 medium + 1 large = 14 squares. Encourage students to trace the different-sized squares in their notes.
d)
16 + 9 + 4 + 1 = 30. There are 16 1 ×1 squares, plus 9 2 x 2 squares, plus 4 3 × 3 squares, plus 1 4 × 4 square in a 4 × 4 grid.
2. The total number of squares for a term is the sum of the perfect square numbers
12 + 22 + 32 + …up to and including the term number. 3. There will be:
102 1 × 1 squares, plus 92 2 × 2 squares, plus 82 3 × 3 squares, plus… 12 10 × 10 square or 102 + 92 + 82 + … + 12 = 100 + 81 + 64 + 49 + 36 + 25 + 16 + 9 + 4 + 1 = 385 squares.

TIPS: Section 3 – Grade 8 © Queen’s Printer for Ontario, 2003 Page 35
Day 10: Finding the Root of the Problem Grade 8
Description • Determine square roots of perfect and non-perfect squares.
Materials • 5 × 5 geoboards • BLM 9.3, 10.1 • calculators
Assessment Opportunities Minds On…
Whole Class Connect to Previous Lesson Emphasize the patterns between perfect square numbers and square shapes as BLM 9.3 is taken up. Students write the list of perfect square numbers from 1 to 225 (12 to 152). They may need their calculators for 132, 142, and 152. Learning Skills/Observation/Checklist: Have selected students share what they found in the exploration on BLM 9.3. Curriculum Expectations/Demonstration/Marking Scheme: Collect and mark BLM 9.3.
Action! Pairs Shared Exploration Revisit the different squares generated on the 5 × 5 geoboard. Challenge students to calculate the area of as many squares as they can. Students record their findings on additional copies of BLM 9.2.
Students who finish early can find four different ways of calculating the area of the square shown (TIP 5): students can use other areas or measurements to determine the area of the square.
Consolidate Debrief
Whole Class Demonstrate Understanding, Extend Thinking Have some students share how they determined the area of the different-sized squares generated on the 5 × 5 geoboard, using a transparency. Challenge students to find the perimeter of as many of the squares as they can. Students may find it more difficult to find the perimeter of squares that do not have an area that is represented by a perfect square. This establishes the need to learn about square roots. Define the square root of a number. Start with perfect square numbers and lead to non-perfect square numbers. Try not to introduce the term square root too soon. Students look for a number that, when multiplied by itself, gives them ten. Challenge: Q includes the set of fractions like ,,,, 56
9825
32
21 etc. Q includes
numbers like ,,10,8,7,6,5,3,2 K and π. Compare the decimal forms of numbers in Q and numbers in Q . Discuss the Q and Q notations in connection to symbols like ≠ and to negative prefixes. Pairs Introduce Concept of Irrational Numbers Students play Root Magnet, using BLM 10.1 and determine which target numbers are not perfect squares.
Familiarity with perfect square numbers significantly helps when exploring other applications that include the Pythagorean relationship. The square root of a non-perfect square whole number is an Irrational Number. It can never be expressed as a fraction, and is a decimal that never ends or repeats (like pi, 3.14159265…). Q (for quotients) represents the rational numbers.
Q represents the irrational numbers.
Application Reflection Concept Practice
Home Activity or Further Classroom Consolidation In your math journal describe the steps you would use to approximate the square root of non-perfect squares. For more practice with perfect squares, non-prefect squares, and square roots, complete the assigned exercises from your math textbook.
TIPS: Section 3 – Grade 8 © Queen’s Printer for Ontario, 2003 Page 36
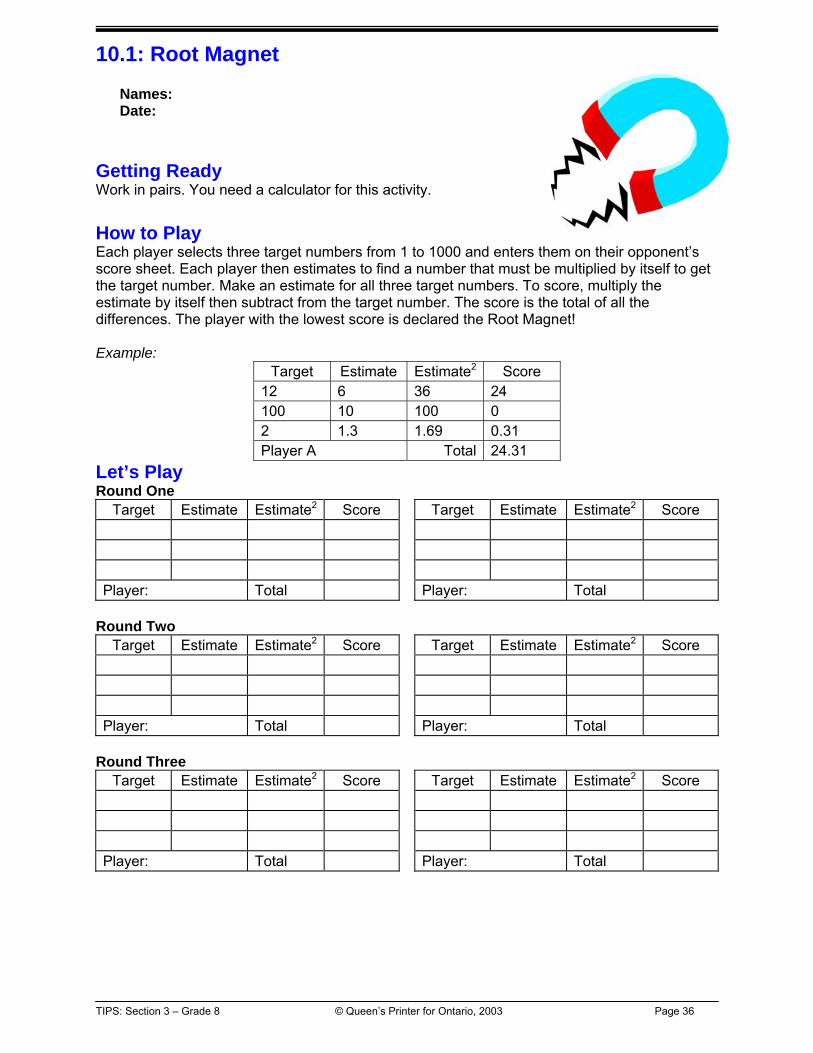
10.1: Root Magnet
Names: Date:
Getting Ready Work in pairs. You need a calculator for this activity.
How to Play Each player selects three target numbers from 1 to 1000 and enters them on their opponent’s score sheet. Each player then estimates to find a number that must be multiplied by itself to get the target number. Make an estimate for all three target numbers. To score, multiply the estimate by itself then subtract from the target number. The score is the total of all the differences. The player with the lowest score is declared the Root Magnet! Example:
Target Estimate Estimate2 Score 12 6 36 24 100 10 100 0 2 1.3 1.69 0.31 Player A Total 24.31
Let’s Play Round One
Target Estimate Estimate2 Score Target Estimate Estimate2 Score Player: Total Player: Total
Round Two
Target Estimate Estimate2 Score Target Estimate Estimate2 Score Player: Total Player: Total
Round Three
Target Estimate Estimate2 Score Target Estimate Estimate2 Score Player: Total Player: Total

TIPS: Section 3 – Grade 8 © Queen’s Printer for Ontario, 2003 Page 37
Lesson Outline: Days 11 - 16 Grade 8
BIG PICTURE Students will: • explore a real-life problem to appreciate the need to learn more mathematics, specifically the Pythagorean
relationship; • represent right-angled triangles in different orientations on a geoboard; • investigate the relationship between the areas of squares constructed along the sides of a right-angled
triangle; • test a conjecture as to whether or not the Pythagorean relationship applies to triangles other than right-angled
triangles; • consolidate understanding of the Pythagorean relationship. Day Lesson Title Description Expectations
11 Will it Fit? • Set the stage for connecting the Pythagorean relationship to problem solving.
8m9, 8m59 CGE 2c
12 Geoboards and the Pythagorean Relationship
• Develop the Pythagorean relationship. 8m26, 8m65, 8m73, 8m91, 8m94, CGE 5a, 4b
13 Investigating the Pythagorean Relationship using The Geometer’s Sketchpad ®
• Use The Geometer’s Sketchpad ® to investigate the Pythagorean relationship.
• Apply the Pythagorean relationship.
8m31, 8m59, 8m64, 8m70 CGE 5d
14 Applying the Pythagorean Relationship
• Apply the Pythagorean relationship. 8m31, 8m59, 8m70, 8m60 CGE 2c, 2d
15 Bringing It Together • Apply knowledge of various concepts to solve a variety of problems in small groups to help consolidate learning.
Expectations cited in prior lessons CGE 5e, 5a
16 What’s the Area? • Apply knowledge of the Pythagorean relationship, square roots, perfect squares, and geometric properties to solve an area problem in a variety of ways.
8m59, 8m65, 8m70 CGE 3c
TIPS: Section 3 – Grade 8 © Queen’s Printer for Ontario, 2003 Page 38
Day 11: Will it Fit? Grade 8
Description • Set the stage for connecting the Pythagorean relationship to problem solving.
Materials • chart paper or
mural paper • markers
Assessment Opportunities Minds On…
Whole Group Introducing a Problem Begin the lesson with a problem that engages prior knowledge and establishes a practical motivation for learning the Pythagorean relationship: You have a piece of plywood with dimensions that are 1.2 m × 2.4 m. You would like to pass it through a window that is 1 m by ¾ m. Can you pass the plywood through the window? Explain your reasoning. To enhance student interest, consider entering the room in role as a customer at Pat the Builder’s Build-all. Approach a student in the room as if he or she is an employee and present them with your dilemma. You really don’t want to go to all the trouble of having to return the piece of plywood, so you need a definitive answer for whether the plywood can pass through the window.
Action! Small Groups Exploring Students work in groups to think creatively and suggest a response to the problem. The focus is to motivate students in learning how to compute the length of the hypotenuse of a triangle. Curriculum Expectations/Observation/Question & Answer/Checkbric: Students demonstrate the strategies they choose to solve the problem and justify and communicate their reasoning. Record the solution options on chart paper or mural paper to be shared during the final portion of the lesson. Students may suggest scale models or other viable solutions to this problem. Evaluate their plans on practicality as well as the potential for the plan to give a definitive “yes” or “no” answer.
Consolidate Debrief
Whole Class Presentation After each small group presentation of their strategy, guide the class in concluding that mathematics can provide an efficient, accurate solution to this life problem, and that a discovery of this mathematical relationship will be the focus over the next few days. Use a graphic organizer to illustrate yes/no examples of right triangles in various orientations.
Bring in visuals – possibly a scale model or a picture to help focus student attention on the problem. A checkbric identifies the criteria by which work will be assessed, but does not contain descriptors of levels. See 16.2 Assessment Tool for an example.
Exploration Reflection
Home Activity or Further Classroom Consolidation Interview someone at home. Have they ever had trouble fitting an item through a doorway or window? Find out the details. What happened? Was mathematics involved in any part of the process, or should it have been? Come prepared to share your findings.

TIPS: Section 3 – Grade 8 © Queen’s Printer for Ontario, 2003 Page 39
Day 12: Geoboards and the Pythagorean Relationship Grade 8 Description
• Develop the Pythagorean relationship. Materials
• geoboards • BLM 12.1, 12.2,
12.3
Assessment Opportunities Minds On…
Whole Class Connecting to previous lesson and orientating students to an activity Ask students to recall the problem posed during the previous class and to share their findings. If the connection is not made to putting the piece of plywood on a diagonal, introduce the idea of diagonal by drawing a rectangle to represent a window and making a right-angled triangle using one corner.
Action! Pairs Exploration Give students BLM 12.2 and go over the instructions with them. Mixed-ability student pairs pick a card from BLM 12.1. Students do their constructions or take their measurements and enter the data, select another card, and repeat the process. In the end, there should be a minimum of fifteen entries in the table, with more than one pair working on each entry. Curriculum Expectations/Question & Answer/Mental Note: Circulate among the groups, observing student strategies for calculating the area of the square on the diagonal side (TIP 5). Use probing questions to prompt student thinking as needed: • What are the largest and smallest right-angled triangles that can be
constructed on a 5 × 5 geoboard? • Which of the geoboard triangles have two sides that are the same length? • Are you able to make a right-angled triangle with three equal sides? Explain. • Where is the largest square in relation to the triangle’s 90-degree angle? Challenge some students to confirm that the shapes on the diagonals are indeed squares (TIP 4).
Consolidate Debrief
Whole Class Making Connections and Summarizing Students examine the data, as displayed on BLM 12.2, and identify patterns. Provide sufficient time before accepting any student answers so that each student has an opportunity to participate in the thought process. Be prepared to discuss any rows on BLM 12.2 where the answers do not fit the pattern due to student error. (For each row, Value of Column 3 + Value of Column 4 should = Value of Column 6.) Guide students to describe the Pythagorean relationship in words. Debriefing should include: • the articulation of the a2 + b2 = c2 relationship which refers to the relationship
of the areas of squares built on the sides of a right-angled triangle • the convention of labelling the sides containing the right angle “a” and “b”
and the hypotenuse “c” but reinforcing that any variable can be used to indicate the sides of the triangle.
Provide a large sheet of paper in the centre of a table as a Placemat. Students write their conjectures in their own space on this Placemat without talking. Once each student has written a conjecture, the group decides on the best conjecture and how to word it.
Application Concept Practice Reflection
Home Activity or Further Classroom Consolidation You are a mathematical advice column writer responding to this letter:
“Dear Math Maniac, I pride myself in being quite a well-informed Grade 8 math student, but when I was watching the Wizard of Oz as I was babysitting, I heard the Scarecrow make a mathematical statement that confused me. It was: Once the Scarecrow received his “brains” he immediately tried to impress his friends by reciting the following mathematical equation, “The sum of the square roots of any two sides on an isosceles triangle is equal to the square root of the remaining side.” Was the Scarecrow correct? What did he mean?
Complete worksheet 12.3.
Source: http://www.geocities.com/Hollywood/Hills/6396/ozmath.htm
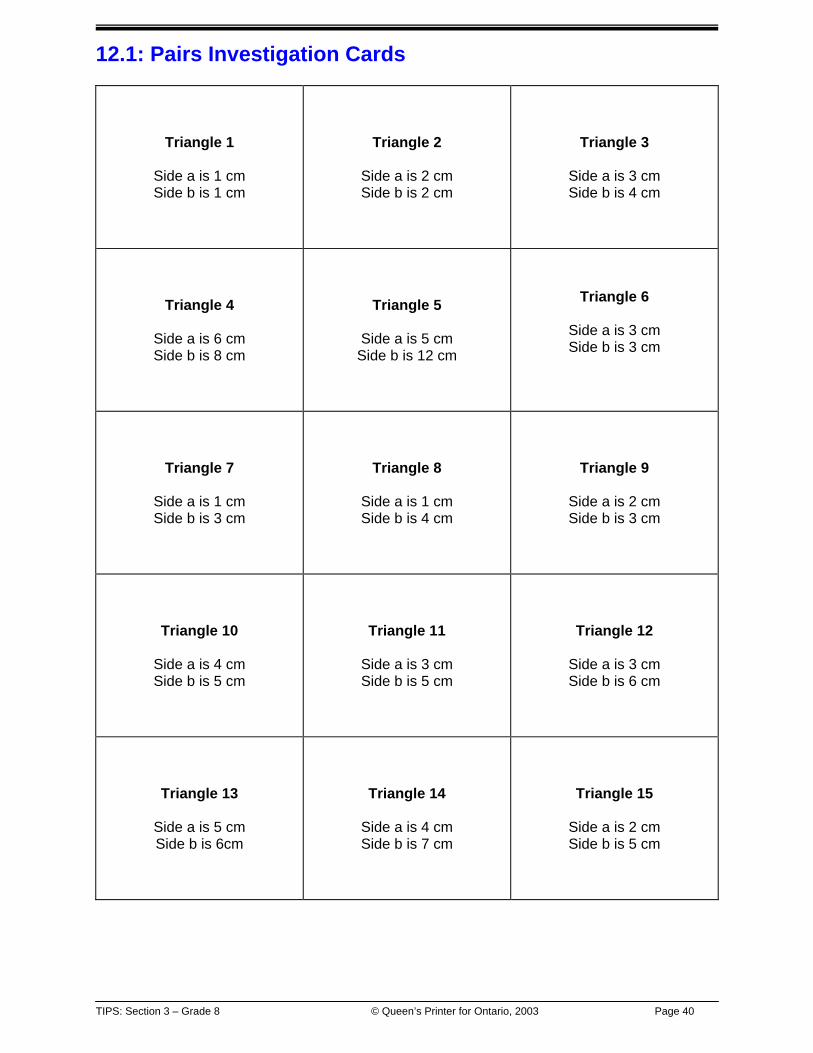
TIPS: Section 3 – Grade 8 © Queen’s Printer for Ontario, 2003 Page 40
12.1: Pairs Investigation Cards
Triangle 1
Side a is 1 cm Side b is 1 cm
Triangle 2
Side a is 2 cm Side b is 2 cm
Triangle 3
Side a is 3 cm Side b is 4 cm
Triangle 4
Side a is 6 cm Side b is 8 cm
Triangle 5
Side a is 5 cm Side b is 12 cm
Triangle 6
Side a is 3 cm Side b is 3 cm
Triangle 7
Side a is 1 cm Side b is 3 cm
Triangle 8
Side a is 1 cm Side b is 4 cm
Triangle 9
Side a is 2 cm Side b is 3 cm
Triangle 10
Side a is 4 cm Side b is 5 cm
Triangle 11
Side a is 3 cm Side b is 5 cm
Triangle 12
Side a is 3 cm Side b is 6 cm
Triangle 13
Side a is 5 cm Side b is 6cm
Triangle 14
Side a is 4 cm Side b is 7 cm
Triangle 15
Side a is 2 cm Side b is 5 cm

TIPS: Section 3 – Grade 8 © Queen’s Printer for Ontario, 2003 Page 41
12.2: Squares on Sides of a Right-angled Triangle Names: Date:
1. Using a geoboard and coloured elastics or square dot paper, or both, construct the right
triangle described on your card. Remember the two sides of the triangle are at 90° to each other. Construct the third side (the hypotenuse).
2. Construct a square on each side of the triangle, using each side length. 3. Complete the row that corresponds to your triangle number on the chart (first 5 columns
only). 4. Use the area of the square on the hypotenuse to determine the length of side “c” (column 6).
Check with a ruler. 5. Add this data to the class chart.
1 2 3 4 5 6
Triangle #
Length of Side “a”
Length of Side “b”
Area of Square on Side
“a”
Area of Square on Side
“b”
Length of hypotenuse
“c”
Area of Square on
hypotenuse “c”
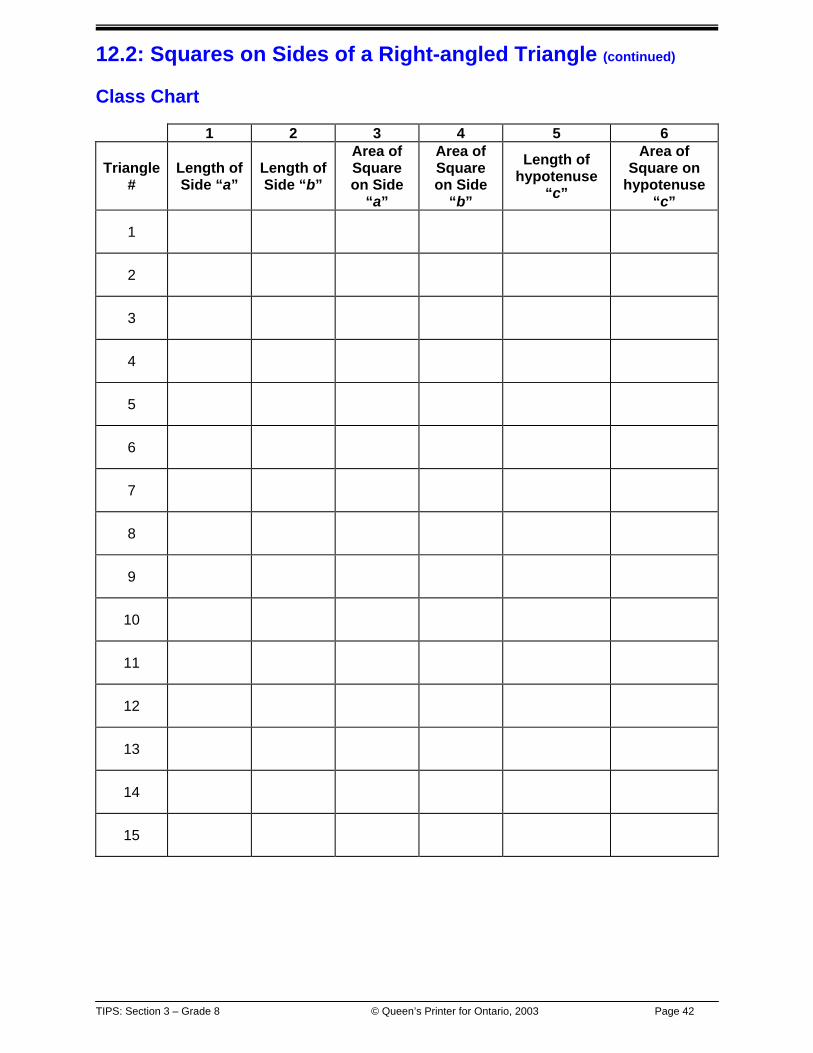
TIPS: Section 3 – Grade 8 © Queen’s Printer for Ontario, 2003 Page 42
12.2: Squares on Sides of a Right-angled Triangle (continued) Class Chart
1 2 3 4 5 6
Triangle #
Length of Side “a”
Length of Side “b”
Area of Square on Side
“a”
Area of Square on Side
“b”
Length of hypotenuse
“c”
Area of Square on
hypotenuse “c”
1
2
3
4
5
6
7
8
9
10
11
12
13
14
15

TIPS: Section 3 – Grade 8 © Queen’s Printer for Ontario, 2003 Page 43
12.3: Social Triangles
Name: Date:
Each square represents 0.5 m x 0.5 m.
1. You live at the location of rectangle #1. The other numbered rectangles represent the
homes of your friends. The scale is 500 m per unit length. Calculate the distance between your home and that of each of your friend’s. Show your work in good form.
2. A new friend lives exactly five kilometres away from your home. a) Show all possible locations for this friend’s home.
How is this set of possible locations shown on your grid? b) Use an X to mark which of these locations is on a grid point.
How did you determine the locations?

TIPS: Section 3 – Grade 8 © Queen’s Printer for Ontario, 2003 Page 44
Day 13: Exploring the Pythagorean Relationship using The Geometer’s Sketchpad® Grade 8
Description • Use The Geometer’s Sketchpad ® to investigate the Pythagorean relationship. • Apply the Pythagorean relationship.
Materials • carpenter’s
triangle • The Geometer’s
Sketchpad 4 ® • BLM 13.1 • GSP file:
Pythagorean Relationship
Assessment Opportunities Minds On…
Whole Class Connections to Careers and Posing a Question Curriculum Expectation and Learning Skills/Portfolio/Marking Scheme and Checklist: Collect student work on BLM 12.3 for assessment. Use a carpenter’s triangle as an example of a tool. Explain that it is based on the 3:4:5 Pythagorean Triple (a set of 3 whole numbers which are the lengths of the sides of a right-angled triangle) used by carpenters to ensure that their walls are “square.” Using students’ entries on BLM 12.2, identify Pythagorean Triples and start a cumulative class list to be augmented as the lessons continue. Draw student attention to the 3:4:5 and 6:8:10 triples. Might there be a relationship between these two? (multiples) Can we use this to generate other triples? Extension: Find another Pythagorean Triple besides the 3:4:5, 6:8:10, and 5:12:13 encountered on BLM 12.2, e.g., 8:15:17 Hypothesize whether or not the Pythagorean relationship is true for all types of triangles. How could we confirm or refute your hypothesis? What tool could we use to test the hypothesis?
Action! Pairs Guided Exploration Mixed-ability pairs use The Geometer’s Sketchpad® and follow instructions on BLM 13.1 to discover that the Pythagorean relationship is unique to right-angled triangles. Learning Skills (Co-operation with others)/Question & Answer/Checklist: Observe students as they work through the activity. Students who finish early can develop and explore “what if” questions they can pose in relation to the Pythagorean relationship.
Consolidate Debrief
Whole Class Demonstrating Understanding Use GSP file: The Pythagorean Relationship (p. 47) to consolidate student understanding and to introduce them to different visual proofs. Say, “Now that we understand what the Pythagorean relationship is and know that it is unique to right-angled triangles, we want to see where it applies to real life situations.” Return to the original problem from Lesson 11 and assign it.
The 3:4:5 Pythagorean Triple was also used by the Egyptians in the building of pyramids.
Application Concept Practice
Home Activity or Further Classroom Consolidation Solve the window and plywood problem from Day 11.
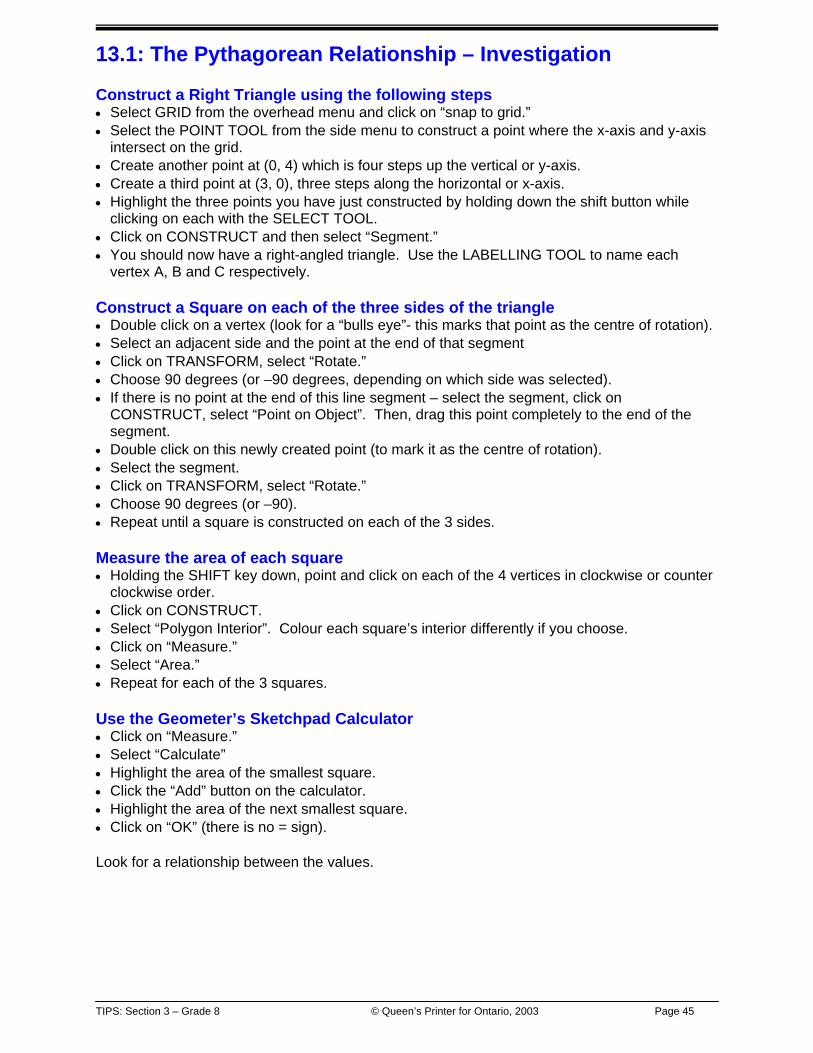
TIPS: Section 3 – Grade 8 © Queen’s Printer for Ontario, 2003 Page 45
13.1: The Pythagorean Relationship – Investigation Construct a Right Triangle using the following steps •• Select GRID from the overhead menu and click on “snap to grid.” •• Select the POINT TOOL from the side menu to construct a point where the x-axis and y-axis
intersect on the grid. •• Create another point at (0, 4) which is four steps up the vertical or y-axis. •• Create a third point at (3, 0), three steps along the horizontal or x-axis. •• Highlight the three points you have just constructed by holding down the shift button while
clicking on each with the SELECT TOOL. •• Click on CONSTRUCT and then select “Segment.” •• You should now have a right-angled triangle. Use the LABELLING TOOL to name each
vertex A, B and C respectively. Construct a Square on each of the three sides of the triangle •• Double click on a vertex (look for a “bulls eye”- this marks that point as the centre of rotation). •• Select an adjacent side and the point at the end of that segment •• Click on TRANSFORM, select “Rotate.” •• Choose 90 degrees (or –90 degrees, depending on which side was selected). •• If there is no point at the end of this line segment – select the segment, click on
CONSTRUCT, select “Point on Object”. Then, drag this point completely to the end of the segment.
•• Double click on this newly created point (to mark it as the centre of rotation). •• Select the segment. •• Click on TRANSFORM, select “Rotate.” •• Choose 90 degrees (or –90). •• Repeat until a square is constructed on each of the 3 sides. Measure the area of each square •• Holding the SHIFT key down, point and click on each of the 4 vertices in clockwise or counter
clockwise order. •• Click on CONSTRUCT. •• Select “Polygon Interior”. Colour each square’s interior differently if you choose. •• Click on “Measure.” •• Select “Area.” •• Repeat for each of the 3 squares. Use the Geometer’s Sketchpad Calculator •• Click on “Measure.” •• Select “Calculate” •• Highlight the area of the smallest square. •• Click the “Add” button on the calculator. •• Highlight the area of the next smallest square. •• Click on “OK” (there is no = sign). Look for a relationship between the values.
TIPS: Section 3 – Grade 8 © Queen’s Printer for Ontario, 2003 Page 46
13.1: The Pythagorean Relationship – Investigation (continued) Experiment •• Click and drag point any vertex other than the 90 degree one. •• Examine the area values as they change. What changes? What stays the same? •• Ask some “what if” questions here and experiment. •• Talk with your partner to further clarify any relationships you notice. Consider how these
relationships might be important in mathematics. Each student writes a journal entry as a personal interpretation of the relationship.
Journal Students use the following prompts to write and reflect upon their learning:
“After investigating the squares on the sides of right angle triangles using Geometer’s Sketchpad, my partner ________ and I discovered that… We experimented with … and found that … We also developed the following “what if” questions.
What if? Encourage students to develop and explore “what if” questions: “What if the triangle is not a right angled triangle? Will the relationship still hold true?” Students can explore this question quickly and easily with GSP. “What if a semi-circle or some other geometric figure is built on each side of the right triangle, will the relationship still exist? Encourage students to investigate this on GSP.

TIPS: Section 3 – Grade 8 © Queen’s Printer for Ontario, 2003 Page 47
The Pythagorean Relationship (GSP file) Download this file at www.curriculum.org/occ/tips/downloads.shtml
Squares will be drawn on the th ree sides.Click on the link below to show the squares.
Given: Righ t Triangle ABC, ∠C = 90 °.
The Pythagorean Relationship
Show Squares of the Side
A C
B
The Pythagorean Relationship
A right angled triangle is shown at righ twith a right angle at C.
Show Pythagorean Theore
Rese t
drag this point
Fo llow the steps below.
4)3)2)
1)
The Pythagorean RelationshipA right angled triang le is shown at righ twith a right angle at A.
Show Area Measuremen
Show Squares of Side
Show Altitude
Show Quad rilatera
A
B C
TIPS: Section 3 – Grade 8 © Queen’s Printer for Ontario, 2003 Page 48
Day 14: Applying the Pythagorean Relationship Grade 8
Description • Apply the Pythagorean relationship.
Materials • transparencies and
markers • BLM 14.1
Assessment Opportunities Minds On…
Whole Class Connecting to Previous Lessons and Introducing Problems Revisit the problem of putting a 1.2 m × 2.4 m piece of plywood through a 1 m × 4
3 m window. Ask students to indicate whether or not they thought the plywood will fit through the window. Have volunteers present each side of the argument (if there is a difference of opinion). Discuss and determine the correct answer. (Yes, the plywood will just fit, as long as it is not too thick. The diagonal of the window is 1.25 m. Some students may recognize that 3: 4 : 5 is a multiple of 4
3 : 1 : 1.25.) Use this as a point of departure to lead into other practical problems that can be solved using the Pythagorean relationship. Curriculum Expectations/Performance Task/Marking Scheme: Collect and assess students’ follow-up activity responses.
Action! Small Groups Developing Understanding Student groups rotate through four different problem centres over the course of the lesson, solving the problems on BLM 14.1. Each group is given the task of writing up a full solution to one specific problem on overhead transparencies for discussion.
Consolidate Debrief
Whole Class Presentations Solutions are presented and discussed. Clarity of communication and effective use of mathematical terminology are highlighted. Encourage students to take careful notes during the presentations to use with the consolidation activity and assessment. Curriculum Expectations/Learning Skills/Presentation/Rubric/Checklist: Assess student presentations for understanding of concepts, communication, application of procedures, and problem-solving skills.
If there are four stations and 7 or 8 groups in the class, two groups can work independently at each station. Have two versions of a written solution on an overhead transparency to compare at the close of the lesson.
Application Concept Practice
Home Activity or Further Classroom Consolidation Write complete solutions for all four problems on worksheet 14.1. These solutions will be collected next class and assessed. Critically look at your work to ensure that it is your best. Create and record a practical problem that would require the use of the Pythagorean relationship in its solution. Solve the problem on a separate sheet of paper.
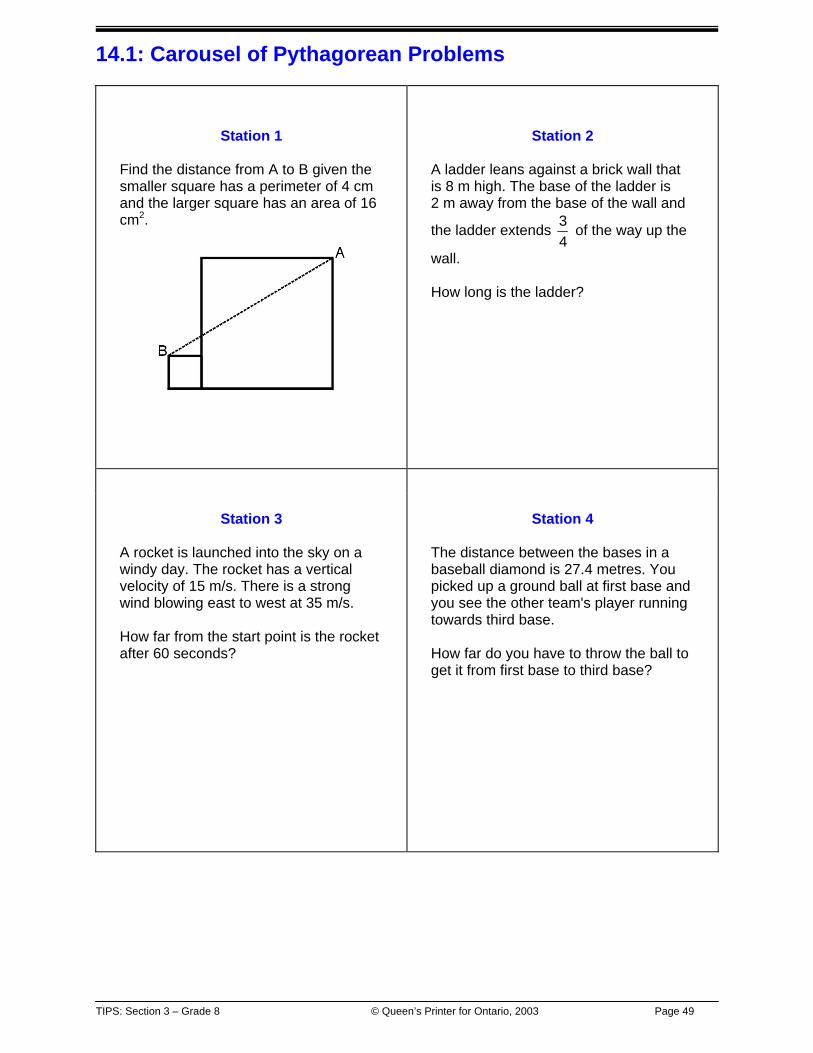
TIPS: Section 3 – Grade 8 © Queen’s Printer for Ontario, 2003 Page 49
14.1: Carousel of Pythagorean Problems
Station 1
Find the distance from A to B given the smaller square has a perimeter of 4 cm and the larger square has an area of 16 cm2.
Station 2
A ladder leans against a brick wall that is 8 m high. The base of the ladder is 2 m away from the base of the wall and
the ladder extends 43 of the way up the
wall. How long is the ladder?
Station 3
A rocket is launched into the sky on a windy day. The rocket has a vertical velocity of 15 m/s. There is a strong wind blowing east to west at 35 m/s. How far from the start point is the rocket after 60 seconds?
Station 4
The distance between the bases in a baseball diamond is 27.4 metres. You picked up a ground ball at first base and you see the other team's player running towards third base. How far do you have to throw the ball to get it from first base to third base?
TIPS: Section 3 – Grade 8 © Queen’s Printer for Ontario, 2003 Page 50
Day 15: Bringing It Together Grade 8
Description • Apply knowledge of various concepts to solve a variety of problems in small
groups to help consolidate learning.
Materials • scientific
calculator • BLM 15.1
Assessment Opportunities Minds On…
Whole Class Brainstorm Curriculum Expectations/Portfolio/Marking Scheme & Learning Skills/ Observation/Checklist: Collect completed solutions for worksheet 14.1 and assess students’ responses. Individual Reflection Ask students to brainstorm all the different mathematical concepts they have learned during this term. Make a list on the board or chart paper. Each student sorts these concepts in the table provided in question 1 on BLM 15.1. Curriculum Expectations/Anecdotal/Mental Note: Collect and read the students’ work to determine which students need assistance. Advise students that they will be revisiting concepts done previously through various activities and will be preparing for another assessment piece on the Pythagorean relationship.
Action! Pairs Conferencing Randomly number students 1 and 2. They are to find a partner with a different number than themselves and share the practical problem they created. They discuss and check it to ensure that their solutions are correct. If a student had difficulty creating a problem, the partners could create one together. Pairs Problem Solving Students work with another partner with whom to share their problem. Students solve their partner’s problem and the partner checks the solution. Each student is responsible for assisting classmates by providing hints and explanations of the solution. Repeat the process with as many partners as the class period allows.
Consolidate Debrief
Whole Group Discussion Invite comments about what students found out in trying to write, solve, and share the creation of problems that apply a particular mathematics relationship. Individual Self-Assessment Learning Skills/Worksheet/Conference: Students complete questions 2 through 4 on BLM 15.1. Conference with students as they are working on their self-assessments and working through problems individually or in small groups. Provide a series of practice questions from the textbook or supplementary resource(s) to help reinforce the skills.
Circulate as students are working to note which students may have had difficulty with the task. Take note of any especially interesting problems that students can share with the whole class.
Concept Practice Home Activity or Further Classroom Consolidation Complete the questions assigned from your textbook as a review of the Pythagorean relationship.

TIPS: Section 3 – Grade 8 © Queen’s Printer for Ontario, 2003 Page 51
15.1: What Have I Learned?
Name: Date:
1. Classify all the mathematical concepts and skills added to the class list
into the following categories. This will help you to focus on concepts you had difficulty with when reviewing for future activities and assessments.
Do not yet understand
thoroughly Consolidating Mastered
2. What do I need to review? 3. How will I improve my understanding of the concepts listed above? 4. Problems I can redo or practise to deepen my understanding.

TIPS: Section 3 – Grade 8 © Queen’s Printer for Ontario, 2003 Page 52
Day 16: What’s the Area? Grade 8
Description • Apply knowledge of the Pythagorean relationship, square roots, perfect
squares, and geometric properties to solve an area problem in a variety of ways.
Materials • scientific
calculator • BLM 16.1 • 16.2 Assessment
Tool • geoboards, dot
paper • The Geometer’s
Sketchpad® Assessment Opportunities Minds On…
Whole Class Introduction Address any problems from the consolidation activity. Have students share their solutions on the board, overhead transparency, or chart paper. Introduce the problem on BLM 16.1 Groups of 4 Brainstorm Students discuss the problem and brainstorm various ways in which they can find the area. They discuss different approaches using all materials and tools available, but do not take notes. Learning Skills/Observation/Mental Note: Circulate, listen to conversations, and note contributions of students.
Action! Individual Problem Solving Students work independently to solve the problem in as many ways as they can, using the ideas generated in their brainstorming group session. Remind students that they can use all materials that they suggested in their groups.
Consolidate Debrief
Curriculum Expectations/Performance Task/Checkbric/Marking Scheme: Collect student work and assess using 16.2 Assessment Tool Comment on the students’ strengths and next steps that they can take to improve performance.
The time in groups should be brief in order to allow time for students to individually complete the performance task. See the Grade 8 Exemplars 2002 for scored samples of student work.
Reflection
Home Activity or Further Classroom Consolidation Reflect on your ability to solve the problem presented in the assessment task and answer the following questions in your math journal: • Did you find it easy or difficult to solve the area problem? Explain why. • What tools helped you to solve the area problem? • Select one of your solution methods and describe how you thought of using it
to solve the area problem.
See Section 2 – Developing Perimeter and Area for samples of different ways students could approach the problem. When returning graded work to students, consider photocopying samples of Level 3 and 4 responses with student names removed. Select and discuss, with the class, samples that show a variety of strategies.

TIPS: Section 3 – Grade 8 © Queen’s Printer for Ontario, 2003 Page 53
16.1: Area of Rectangle ABCD Name: Date:
Find different ways to determine the area of rectangle ABCD.
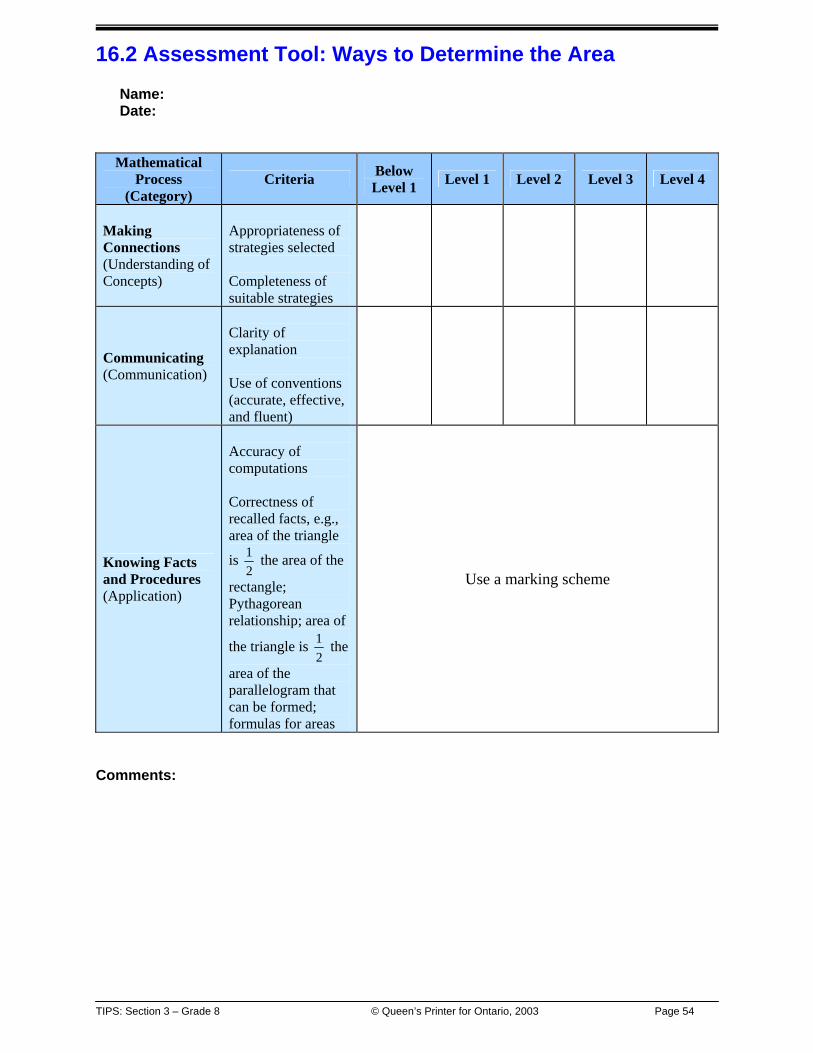
TIPS: Section 3 – Grade 8 © Queen’s Printer for Ontario, 2003 Page 54
16.2 Assessment Tool: Ways to Determine the Area Name: Date:
Mathematical Process
(Category) Criteria Below
Level 1 Level 1 Level 2 Level 3 Level 4
Making Connections (Understanding of Concepts)
Appropriateness of strategies selected Completeness of suitable strategies
Communicating (Communication)
Clarity of explanation Use of conventions (accurate, effective, and fluent)
Knowing Facts and Procedures (Application)
Accuracy of computations Correctness of recalled facts, e.g., area of the triangle
is 21 the area of the
rectangle; Pythagorean relationship; area of
the triangle is 21 the
area of the parallelogram that can be formed; formulas for areas
Use a marking scheme
Comments:
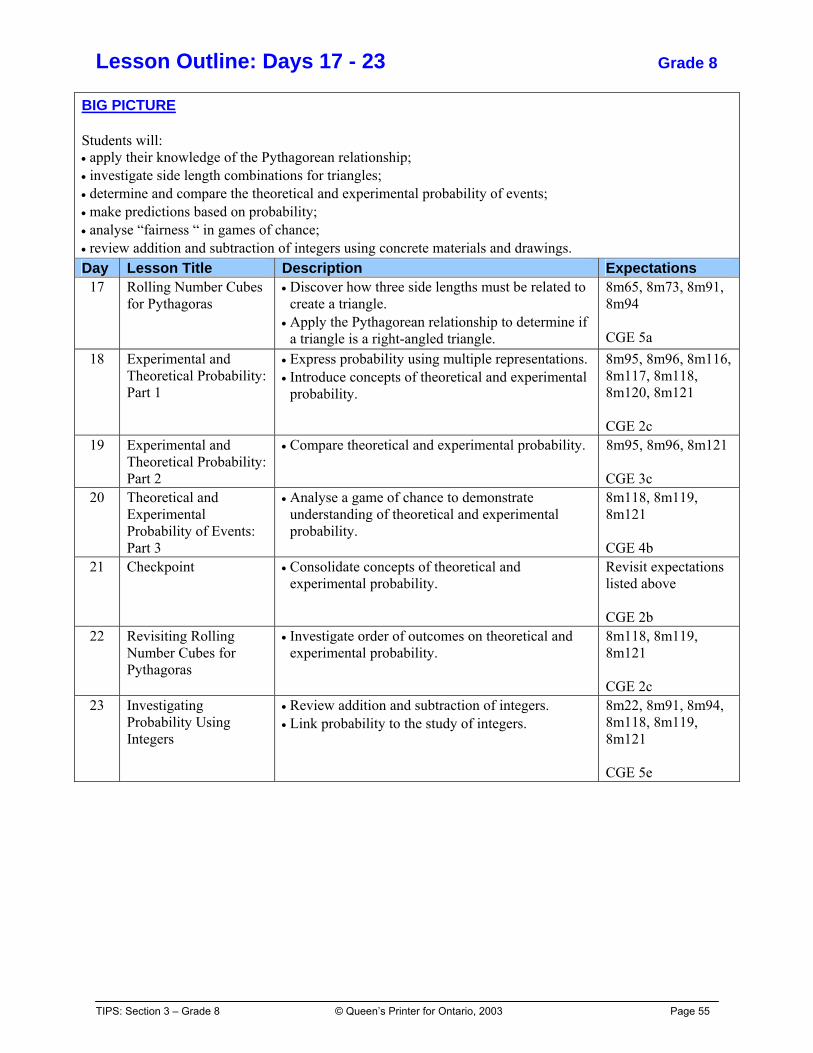
TIPS: Section 3 – Grade 8 © Queen’s Printer for Ontario, 2003 Page 55
Lesson Outline: Days 17 - 23 Grade 8
BIG PICTURE Students will: • apply their knowledge of the Pythagorean relationship; • investigate side length combinations for triangles; • determine and compare the theoretical and experimental probability of events; • make predictions based on probability; • analyse “fairness “ in games of chance; • review addition and subtraction of integers using concrete materials and drawings. Day Lesson Title Description Expectations
17 Rolling Number Cubes for Pythagoras
• Discover how three side lengths must be related to create a triangle.
• Apply the Pythagorean relationship to determine if a triangle is a right-angled triangle.
8m65, 8m73, 8m91, 8m94 CGE 5a
18 Experimental and Theoretical Probability: Part 1
• Express probability using multiple representations. • Introduce concepts of theoretical and experimental
probability.
8m95, 8m96, 8m116, 8m117, 8m118, 8m120, 8m121 CGE 2c
19 Experimental and Theoretical Probability: Part 2
• Compare theoretical and experimental probability. 8m95, 8m96, 8m121 CGE 3c
20 Theoretical and Experimental Probability of Events: Part 3
• Analyse a game of chance to demonstrate understanding of theoretical and experimental probability.
8m118, 8m119, 8m121 CGE 4b
21 Checkpoint • Consolidate concepts of theoretical and experimental probability.
Revisit expectations listed above CGE 2b
22 Revisiting Rolling Number Cubes for Pythagoras
• Investigate order of outcomes on theoretical and experimental probability.
8m118, 8m119, 8m121 CGE 2c
23 Investigating Probability Using Integers
• Review addition and subtraction of integers. • Link probability to the study of integers.
8m22, 8m91, 8m94, 8m118, 8m119, 8m121 CGE 5e

TIPS: Section 3 – Grade 8 © Queen’s Printer for Ontario, 2003 Page 56
Day 17: Rolling Number Cubes for Pythagoras Grade 8
Description • Discover how three side lengths must be related to create a triangle. • Apply the Pythagorean relationship to determine if a triangle is a right-angled
triangle.
Materials • number cubes • straws/scissors • ruler/compasses • The Geometer’s
Sketchpad® • BLM 17.1
Assessment Opportunities Minds On…
Whole Class Connecting to Previous Lessons and Posing Questions Review how to construct a triangle of side lengths 2 units, 4 units, and 5 units using ruler and compasses or using three transparencies with lengths 2 cm, 4 cm, and 5 cm or using three straws cut to the given lengths. Pose the following questions and have students write down their hypotheses, explaining their reasoning. Do not confirm or deny their hypotheses at this time. • If I roll three standard number cubes can the three numbers that appear
always be the side lengths of a triangle? • Are we able to construct a right-angled triangle using the three lengths rolled?
Action! Small Groups Investigation Curriculum Expectations/Observation/Mental Note: Observe students as they work and assist groups who have trouble creating their triangles properly. Students conduct an experiment and fill in the chart on BLM 17.1. They can use strings or straws to form the triangles or use a ruler and compasses. Each student completes the sheet and keeps it for a later activity. Students record how many sets of three numbers formed a triangle and how many sets formed a right-angled triangle.
Consolidate Debrief
Whole Class Summarizing Several students describe to the class what they found when trying to construct triangles. Help them come to the conclusion that the sum of the two shorter sides must be greater than the length of the longest side. Ask: What relationship needs to exist among the three numbers rolled, so that a triangle can be constructed? Discuss the following questions: 1. Out of 30 trials, how many triangles were formed? (Since each group may
have a different answer, discuss why this happens.) 2. How can you determine if a triangle that was formed was a right-angled
triangle? How many right-angled triangles did your group get? Students write conclusions to these questions in their notebooks or math journals. Tell them that these will be collected and assessed. Lead a discussion on how Pythagorean Triples connect to the experiment.
Reflection Concept Practice
Home Activity or Further Classroom Consolidation In your math journal, answer the following questions: • What does it take to form a triangle given three lengths? Why? • What is a Pythagorean Triple? • Make a table listing all possible number cube combinations that will form a
triangle. Identify the right-angled triangles.
This activity is part of the Grade 8 Math Exemplar, 2002. This investigation could be done as a class demonstration using The Geometer’s Sketchpad ®. Although order does not matter for constructing a triangle, in a later lesson students return to their math journal entry to determine the probability of forming a particular type of triangle. At that time, it will be important to notice that a roll of 2, 2, and 2 occurs less frequently than a roll of 2, 3, and 4.
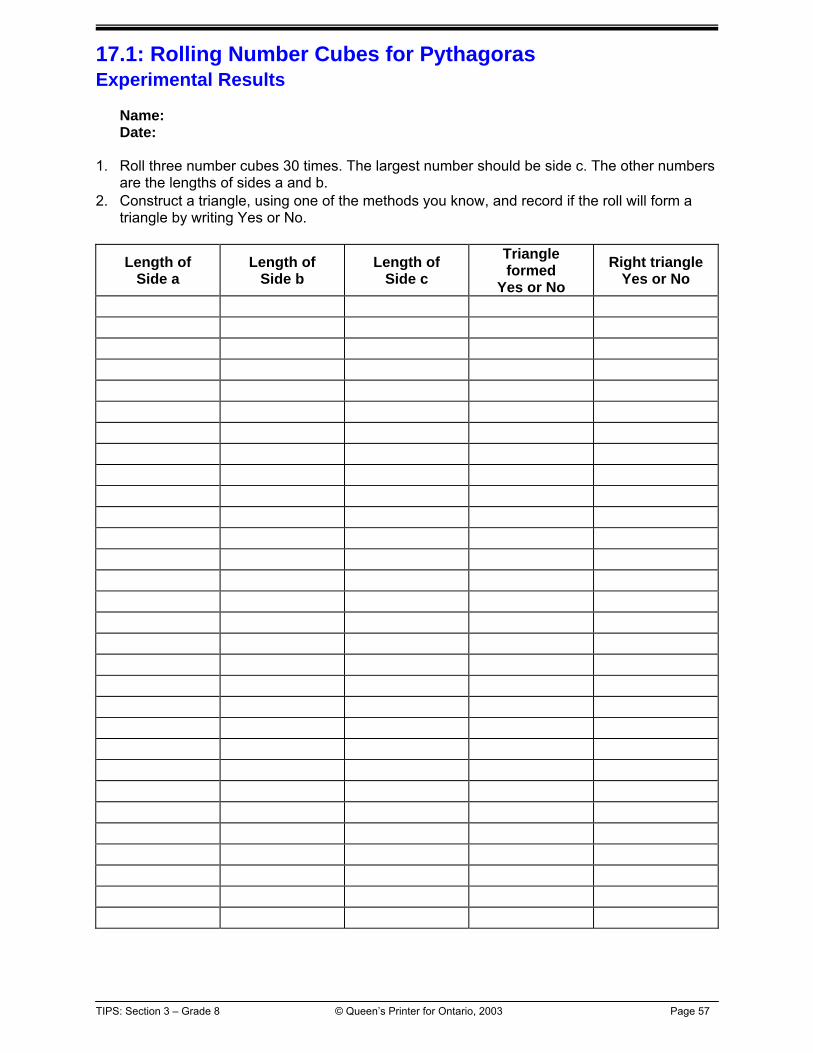
TIPS: Section 3 – Grade 8 © Queen’s Printer for Ontario, 2003 Page 57
17.1: Rolling Number Cubes for Pythagoras Experimental Results
Name: Date:
1. Roll three number cubes 30 times. The largest number should be side c. The other numbers
are the lengths of sides a and b. 2. Construct a triangle, using one of the methods you know, and record if the roll will form a
triangle by writing Yes or No.
Length of Side a
Length of Side b
Length of Side c
Triangle formed
Yes or No Right triangle
Yes or No

TIPS: Section 3 – Grade 8 © Queen’s Printer for Ontario, 2003 Page 58
Day 18: Experimental and Theoretical Probability: Part 1 Grade 8
Description • Express probability with multiple representations. • Introduce concepts of theoretical and experimental probability.
Materials • coins • BLM 18.1, 18.2
Assessment Opportunities Minds On…
Whole Class Guided Curriculum Expectations/Journal/Rubric: Collect and assess math journal entries from the follow-up activity. Review the meaning and terminology of the vocabulary associated with probability situations using BLM 18.1. Students brainstorm, write, and share their own statements, using correct terminology. Students should be prepared to offer reasoning for their decisions. In discussion, focus on those events which students identify as “maybe” to decide whether these events are likely or unlikely to occur.
Action! Pairs Demonstrating Concepts Working in pairs, students toss one coin and state the number of possible outcomes. Each pair tosses two coins and suggests possible outcomes. Demonstrate how a tree diagram can be used to organize outcomes. Focus students’ attention on the representation of choices by branches in the tree. Each pair of students creates a tree diagram for tossing three coins. As an example, when tossing three coins, we wish to see 1 head and 2 tails. What is the probability of this occurring? Explain how a preference (or what we want to occur) is considered to be a favourable outcome; how probability is considered to be the ratio of the number of favourable outcomes to the total number of possible outcomes.
outcomespossibleofNumberoutcomesfavourableofNumberP =
Pairs Investigation Each pair tosses two coins twenty times (20 is the sample size) and records their outcomes. They compare their experimental results to the theoretical results of 1 out of 4 for two heads or for two tails and 2 out of 4 for one head and one tail. They discuss how changing sample size (to more or fewer than 20) would affect their results.
Consolidate Debrief
Whole Class Student Presentation One student from each pair presents their results for tossing two coins twenty times. Discuss the effect of sample size on experimental outcomes. Discuss what a probability of 0 and a probability of 1 would mean in the context of coin tosses.
Words for the Word Wall: certain or sure, impossible, likely or probable, unlikely or improbable, maybe, uncertain or unsure, equally likely and equally unlikely. Probability is always a number between zero and one. Zero would indicate an impossible event. One would indicate a certainty. Theoretical Outcomes: all outcomes that could happen. Experimental Outcomes: all outcomes that occur when we do an experiment. Theoretical outcomes can be used to predict the experimental outcomes. A comparison of theoretical outcomes with experimental results should allow students to draw the conclusion that the experimental results will usually be close to the theoretical outcomes, but it may depend on a variety of factors, sample size, etc.
Reflection Concept Practice Skill Drill
Home Activity or Further Classroom Consolidation Complete worksheet 18.2. Devise your own simulations using spinners, combination of coins and spinners, etc.
See Answers to BLM 18.2.
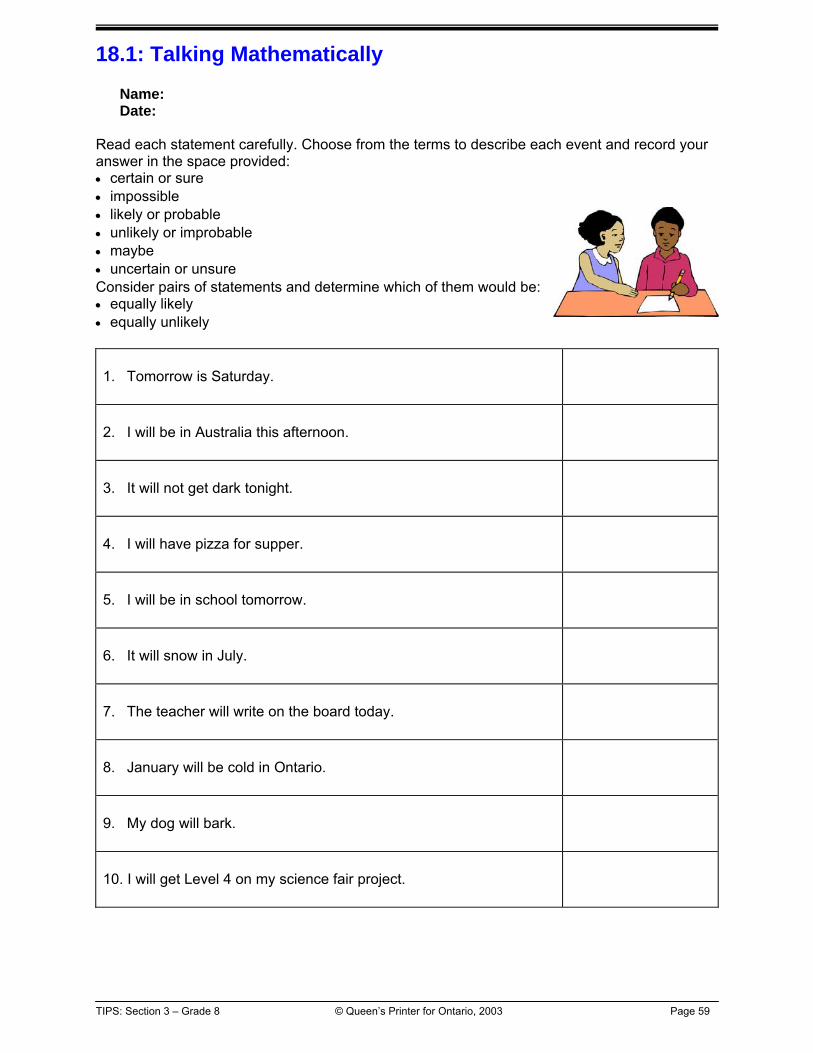
TIPS: Section 3 – Grade 8 © Queen’s Printer for Ontario, 2003 Page 59
18.1: Talking Mathematically Name: Date:
Read each statement carefully. Choose from the terms to describe each event and record your answer in the space provided: •• certain or sure •• impossible •• likely or probable •• unlikely or improbable •• maybe •• uncertain or unsure Consider pairs of statements and determine which of them would be: •• equally likely •• equally unlikely
1. Tomorrow is Saturday.
2. I will be in Australia this afternoon.
3. It will not get dark tonight.
4. I will have pizza for supper.
5. I will be in school tomorrow.
6. It will snow in July.
7. The teacher will write on the board today.
8. January will be cold in Ontario.
9. My dog will bark.
10. I will get Level 4 on my science fair project.

TIPS: Section 3 – Grade 8 © Queen’s Printer for Ontario, 2003 Page 60
18.2: Investigating Probability Name: Date:
Solve the following problems in your notebook: 1. Keisha’s basketball team must decide on a new uniform. The team has a choice of black
shorts or gold shorts and a black, white, or gold shirt. Use a tree diagram to show the team’s uniform choices. a) What is the probability the uniform will have black shorts? b) What is the probability the shirt will not be gold? c) What is the probability the uniform will have the same-coloured shorts and shirt? d) What is the probability the uniform will have different-coloured shorts and shirt?
2. Brit goes out for lunch to the local sub shop. He can choose white or whole wheat bread for
his sub. The filling for Brit’s submarine sandwich can be turkey, ham, veggies, roast beef, or salami. Use a tree diagram to show all Brit’s possible sandwich choices. a) His choice of a single topping includes tomatoes, cheese, or mixed veggies. How does
this affect his possible sub choices? b) If each possibility has an equal chance of selection, what is the probability that Brit will
choose a whole wheat turkey sub topped with tomatoes? c) What is the probability of choosing a veggie sub topped with cheese? d) What is the probability of choosing a meat sub topped with mixed veggies? e) What is the probability of choosing any meat sub topped with mixed veggies on white
bread? 3. The faces of a cube are labelled 1, 2, 3, 4, 5, and 6. The cube is rolled once.
a) What is the probability that the number on the top of the cube will be odd? b) What is the probability that the number on the top of the cube will be greater that 5? c) What is the probability that the number on the top of the cube will be a multiple of 3? d) What is the probability that the number on the top of the cube will be less than 1? e) What is the probability that the number on the top of the cube will be a factor of 36? f) What is the probability that the number on the top of the cube will be a multiple of 3
and 6?
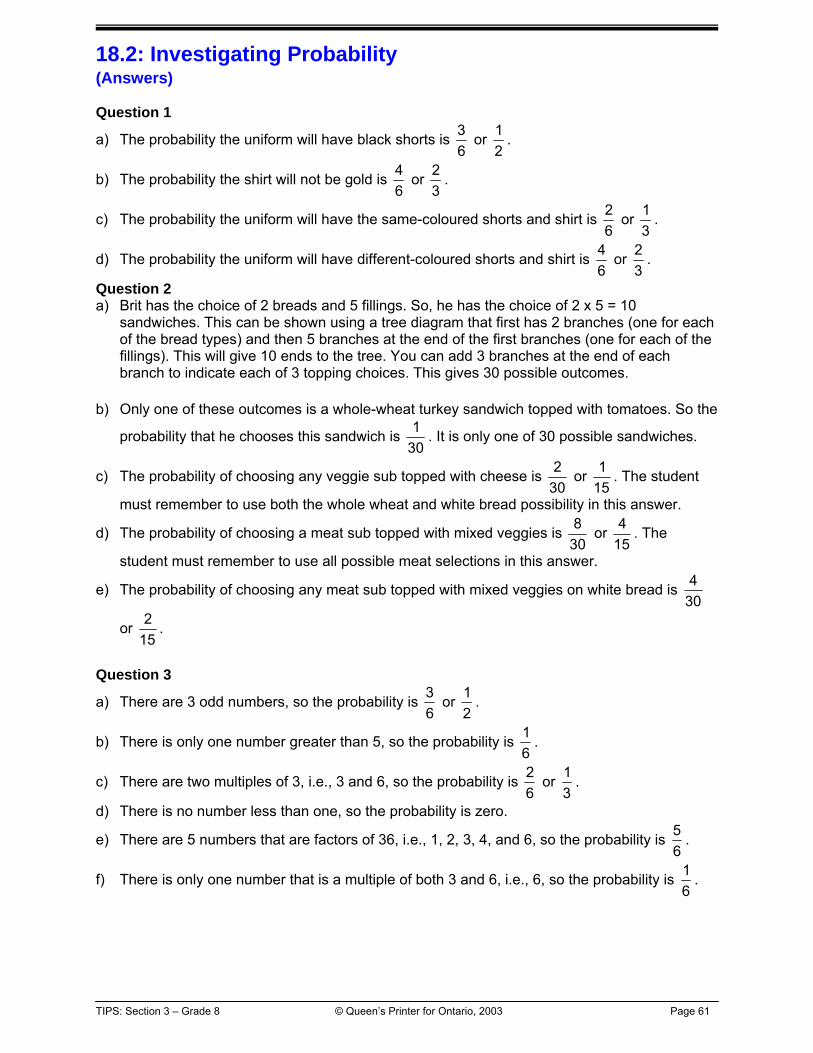
TIPS: Section 3 – Grade 8 © Queen’s Printer for Ontario, 2003 Page 61
18.2: Investigating Probability (Answers) Question 1
a) The probability the uniform will have black shorts is 63 or
21 .
b) The probability the shirt will not be gold is 64 or
32 .
c) The probability the uniform will have the same-coloured shorts and shirt is 62 or
31 .
d) The probability the uniform will have different-coloured shorts and shirt is 64 or
32 .
Question 2 a) Brit has the choice of 2 breads and 5 fillings. So, he has the choice of 2 x 5 = 10
sandwiches. This can be shown using a tree diagram that first has 2 branches (one for each of the bread types) and then 5 branches at the end of the first branches (one for each of the fillings). This will give 10 ends to the tree. You can add 3 branches at the end of each branch to indicate each of 3 topping choices. This gives 30 possible outcomes.
b) Only one of these outcomes is a whole-wheat turkey sandwich topped with tomatoes. So the
probability that he chooses this sandwich is 301 . It is only one of 30 possible sandwiches.
c) The probability of choosing any veggie sub topped with cheese is 302 or
151 . The student
must remember to use both the whole wheat and white bread possibility in this answer.
d) The probability of choosing a meat sub topped with mixed veggies is 308 or
154 . The
student must remember to use all possible meat selections in this answer.
e) The probability of choosing any meat sub topped with mixed veggies on white bread is 304
or 152 .
Question 3
a) There are 3 odd numbers, so the probability is 63 or
21 .
b) There is only one number greater than 5, so the probability is 61 .
c) There are two multiples of 3, i.e., 3 and 6, so the probability is 62 or
31 .
d) There is no number less than one, so the probability is zero.
e) There are 5 numbers that are factors of 36, i.e., 1, 2, 3, 4, and 6, so the probability is 65 .
f) There is only one number that is a multiple of both 3 and 6, i.e., 6, so the probability is 61 .

TIPS: Section 3 – Grade 8 © Queen’s Printer for Ontario, 2003 Page 62
Day 19: Theoretical and Experimental Probability: Part 2 Grade 8
Description • Compare theoretical and experimental probability.
Materials • BLM 19.1, 19.2 • different-
coloured number cubes
• coloured disks or paper squares
Assessment Opportunities Minds On…
Pairs Motivating Activity Curriculum/Journal/Rubric: Collect and assess BLM 18.2 and simulation explanations from the follow-up activity. One student chooses a number and records the number of times he/she predicts the number cube would have to be rolled in order for this number to appear. The other student rolls the number cube until the partner’s number comes up. Students switch responsibilities and repeat the activity. Discuss the probability of an event using one numbered cube, e.g., P (rolling a 4) = 6
1
• Is there a number that occurs more frequently? (No). • How did your results compare to your predictions? • Did your results surprise you? • Which sum is the most frequent when 2 number cubes are rolled? (7, six
combinations)
Action! Whole Class Connecting Concepts Demonstrate the activity (BLM 19.1). Pairs Hypothesizing and Exploring Using investigation techniques and BLM 19.1, students predict, record, and analyse their results, using two number cubes. Students switch roles and continue the experiment until all squares on the board have at least one marker on them. Demonstrate how to fill in the recording chart (BLM 19.2). In their pairs, students complete the recording charts.
Consolidate Debrief
Whole Class Communicating Understanding Lead a whole class discussion to find the theoretical probability of covering a space when there are 36 uncovered spaces (36 out of 36 or 1), 12 uncovered spaces (12 out of 36 or 3
1 ), 1 uncovered space (1 out of 36 or 361 ).
Learning Skills (class participation)/Question & Answer/Checklist: Discuss the results from BLM 19.1 using students’ answers to questions 3 to 5. Discuss the results of the tally charts on BLM 19.2. Relate the results to theoretical and experimental probability. Which columns represent these probabilities?
Probability = number of favourable outcomesnumber of possible outcomes
Theoretical Probability = the predicted probability of an event Experimental Probability = the probability of an event based on actual trials from experiments.
Encourage the use of likely, unlikely, probable, and possible. Students’ vocabulary should be moving from ‘luck’ towards theoretical probability terms. Probability of a 7 is
6 out of 36 or 61 .
Probability of each of 2 and 12 is 1 out
of 36 or 361 .
Remind students that experimental probabilities would be closer to the theoretical probabilities if the sample space were larger.
Application Concept Practice Reflection
Home Activity or Further Classroom Consolidation Solve this problem as an entry in your math journal:
In a game, players are asked to choose 5 numbers from 1 - 25. The numbers are drawn at random. You choose 1, 16, 18, 24, and 25. Your friend chooses the numbers 1, 2, 3, 4, and 5. Who do you think has a better chance of winning the game? Explain.
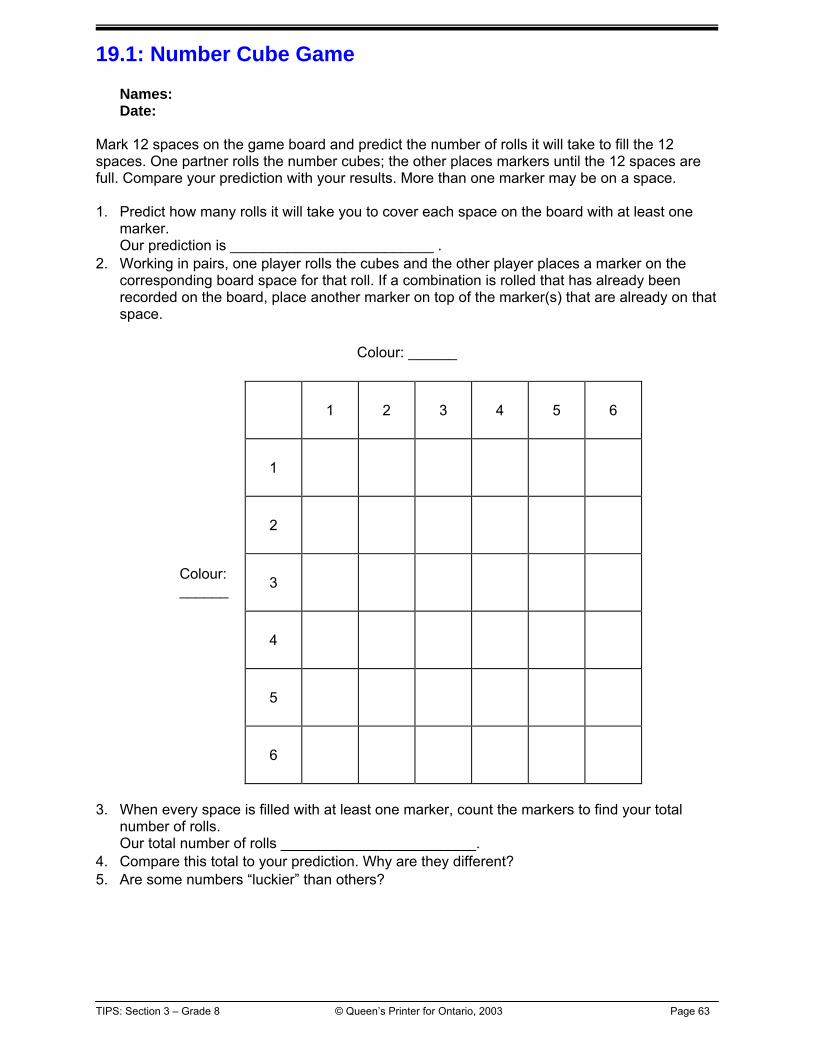
TIPS: Section 3 – Grade 8 © Queen’s Printer for Ontario, 2003 Page 63
19.1: Number Cube Game Names: Date:
Mark 12 spaces on the game board and predict the number of rolls it will take to fill the 12 spaces. One partner rolls the number cubes; the other places markers until the 12 spaces are full. Compare your prediction with your results. More than one marker may be on a space. 1. Predict how many rolls it will take you to cover each space on the board with at least one
marker. Our prediction is _________________________ .
2. Working in pairs, one player rolls the cubes and the other player places a marker on the corresponding board space for that roll. If a combination is rolled that has already been recorded on the board, place another marker on top of the marker(s) that are already on that space.
Colour: ______
1 2 3 4 5 6
1
2
3
4
5
Colour: ______
6
3. When every space is filled with at least one marker, count the markers to find your total
number of rolls. Our total number of rolls ________________________.
4. Compare this total to your prediction. Why are they different? 5. Are some numbers “luckier” than others?
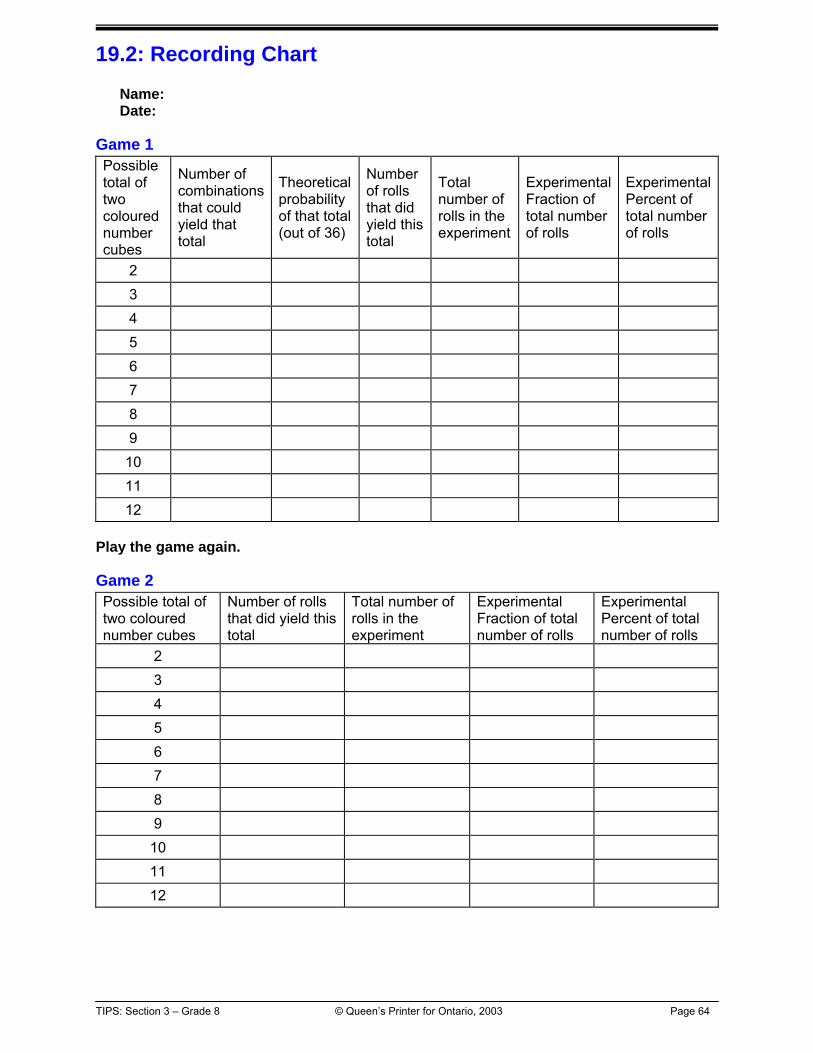
TIPS: Section 3 – Grade 8 © Queen’s Printer for Ontario, 2003 Page 64
19.2: Recording Chart Name: Date:
Game 1 Possible total of two coloured number cubes
Number of combinations that could yield that total
Theoretical probability of that total (out of 36)
Number of rolls that did yield this total
Total number of rolls in the experiment
Experimental Fraction of total number of rolls
Experimental Percent of total number of rolls
2 3 4 5 6 7 8 9
10 11 12
Play the game again.
Game 2 Possible total of two coloured number cubes
Number of rolls that did yield this total
Total number of rolls in the experiment
Experimental Fraction of total number of rolls
Experimental Percent of total number of rolls
2 3 4 5 6 7 8 9
10 11 12

TIPS: Section 3 – Grade 8 © Queen’s Printer for Ontario, 2003 Page 65
Day 20: Theoretical and Experimental Probability of Events: Part 3 Grade 8
Description • Analyse a game of chance to demonstrate understanding of theoretical and
experimental probability.
Materials • disks/tiles/cubes
(two colours) • paper bags • BLM 20.1
Assessment Opportunities Minds On…
Whole Class Reflecting on Prior Learning and Orientating students to Activity Recall the concepts of theoretical and experimental probability discussed on Day 19. Provide each pair with three green and three red tiles/cubes/disks (or any two colours) and a paper bag. Introduce the game Green is a Go by having students read BLM 20.1. Ensure that students understand how the game is played.
Action! Pairs Investigation Students play the game and each student completes all the questions. Working with a partner, students consider changing the probability of the outcome. How can the rules be changed in order to make the theoretical probability of winning a 1 in 4 chance? (BLM 20.1, Answers). Curriculum Expectations/Question and Answer/Mental Note: Listen to pairs’ discussions, making mental notes of all of the ideas that need to be discussed during whole class consolidation and debriefing.
Consolidate Debrief
Whole Class Demonstrate Understanding and Extend Thinking Discuss the students’ answers to BLM 20.1 Green is a Go. As a class, decide on the rules for a new game that will change the theoretical probability of winning to 1 in 4. Pairs Game In pairs, students conduct the new investigation. How does the experimental probability compare with the theoretical probability the class discussed? (BLM 20.1, Answers.) Encourage students to review the past few days’ work, in preparation for an assessment (Day 22).
Students may refer to the results of their coin toss simulation.
Concept Practice Exploration Reflection
Home Activity or Further Classroom Consolidation Suppose you play the game with 3 green, 3 red, and 3 yellow tiles. Write a summary in your math journal explaining how to find the theoretical probability of drawing 2 green tiles from the bag. If you were to play the game 40 times, what result would you expect? Suggest possible reasons to support your prediction.
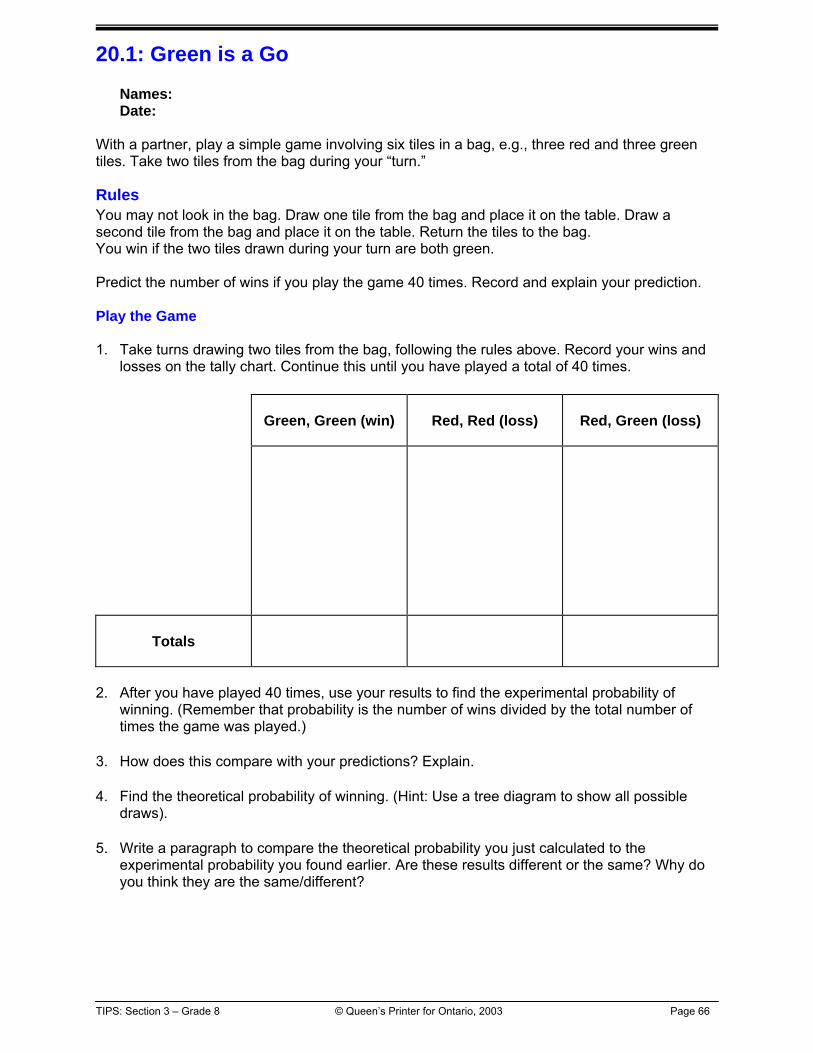
TIPS: Section 3 – Grade 8 © Queen’s Printer for Ontario, 2003 Page 66
20.1: Green is a Go Names: Date:
With a partner, play a simple game involving six tiles in a bag, e.g., three red and three green tiles. Take two tiles from the bag during your “turn.”
Rules You may not look in the bag. Draw one tile from the bag and place it on the table. Draw a second tile from the bag and place it on the table. Return the tiles to the bag. You win if the two tiles drawn during your turn are both green. Predict the number of wins if you play the game 40 times. Record and explain your prediction. Play the Game 1. Take turns drawing two tiles from the bag, following the rules above. Record your wins and
losses on the tally chart. Continue this until you have played a total of 40 times.
Green, Green (win)
Red, Red (loss)
Red, Green (loss)
Totals
2. After you have played 40 times, use your results to find the experimental probability of
winning. (Remember that probability is the number of wins divided by the total number of times the game was played.)
3. How does this compare with your predictions? Explain. 4. Find the theoretical probability of winning. (Hint: Use a tree diagram to show all possible
draws). 5. Write a paragraph to compare the theoretical probability you just calculated to the
experimental probability you found earlier. Are these results different or the same? Why do you think they are the same/different?

TIPS: Section 3 – Grade 8 © Queen’s Printer for Ontario, 2003 Page 67
20.1: Green is a Go (Answers) Many students may predict 20 wins, thinking there are 2 possible outcomes, i.e., 2 green or not 2 green. Those with a bit more knowledge will predict 10 wins, basing their prediction on the possibility of 2 heads resulting from the tossing of 2 coins. This would lead to thinking that the possible outcomes are gg rr gr rg. The table below shows all possible outcomes with tiles labelled g1, g2, g3, r1, r2, and r3.
1st pick / 2nd pick g1 g2 g3 r1 r2 r3 g1 n/a win win loss loss loss g2 win n/a win loss loss loss g3 win win n/a loss loss loss r1 loss loss loss n/a loss loss r2 loss loss loss loss n/a loss r3 loss loss loss loss loss n/a
Students may draw a tree diagram or list all possibilities. Students may show more or less organization in their analysis of the outcomes, depending on their level of understanding. There are 6 wins and 24 losses. Wins + losses = 30 (all possible outcomes).
Probability = outcomes possible of Numberoutcomes favourable of Number =
306 =
51
Post-activity discussion: Students may suggest different ideas to change the game to get a 1 in 4 chance of winning. They may suggest rule changes or equipment changes. Each suggestion can lead to a rich discussion or a new experiment to test whether it will produce the desired results and why it does or does not. Some students may suggest placing only two of each colour in the bag.
However, a table of possibilities will show that this change leads to a probability of 61 for
winning. Based on this result and the emerging pattern of 2 of each colour yielding a probability
of winning of 61 , and 3 of each colour yielding a probability of
51 , students may suggest 4 of
each colour. However, this change of equipment yields a probability of 143 .
A suggestion that does not change the equipment for the game but strictly the rules (method of play) is to pick the first tile from the bag, record its colour, return it to the bag and pick a second tile. The analysis of this method of play is shown in the chart below. There are 9 wins out of the 36 total possible picks, producing the desired 1 in 4 chance of winning. From the discussion the teacher can introduce the terms ‘with replacement’ (after the first tile is drawn out of the bag and its colour noted, the tile is returned to the bag before the second tile is drawn from the bag) and ‘without replacement’ (one tile is drawn out of the bag and its colour noted; without returning the drawn tile to the bag, a second tile is drawn from the bag and its colour noted).
1st pick / 2nd pick g1 g2 g3 r1 r2 r3 g1 win win win loss loss loss g2 win win win loss loss loss g3 win win win loss loss loss r1 loss loss loss loss loss loss r2 loss loss loss loss loss loss r3 loss loss loss loss loss loss
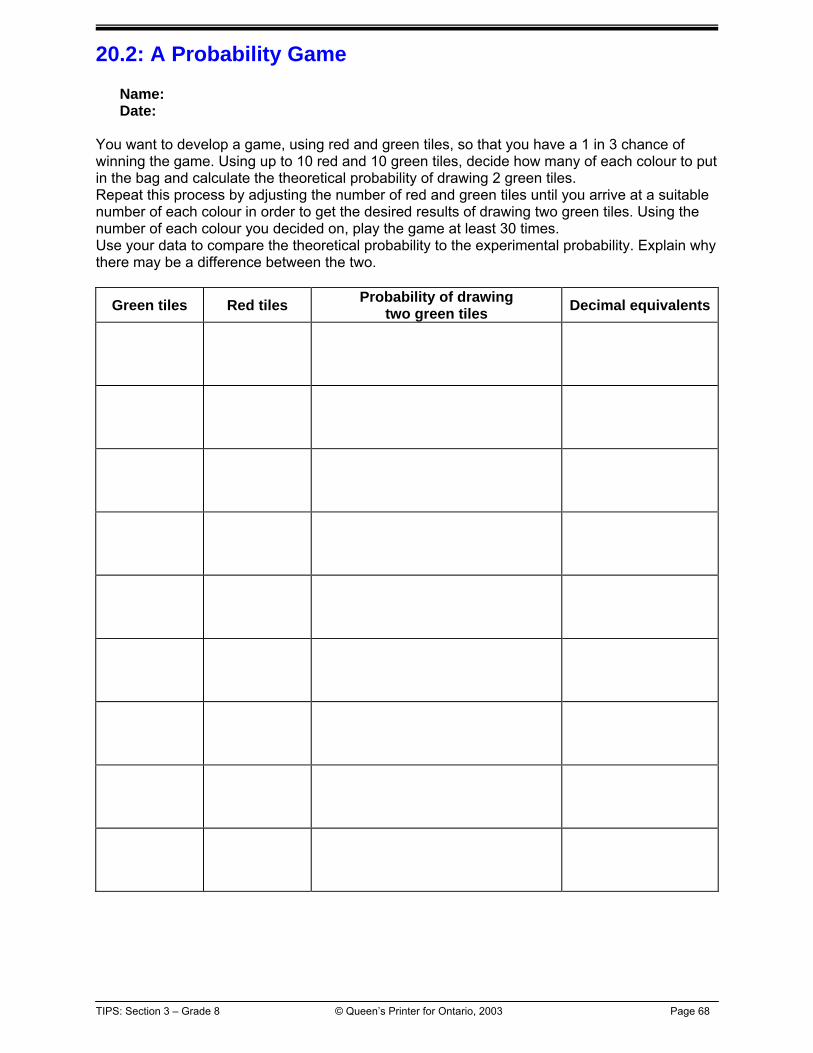
TIPS: Section 3 – Grade 8 © Queen’s Printer for Ontario, 2003 Page 68
20.2: A Probability Game Name: Date:
You want to develop a game, using red and green tiles, so that you have a 1 in 3 chance of winning the game. Using up to 10 red and 10 green tiles, decide how many of each colour to put in the bag and calculate the theoretical probability of drawing 2 green tiles. Repeat this process by adjusting the number of red and green tiles until you arrive at a suitable number of each colour in order to get the desired results of drawing two green tiles. Using the number of each colour you decided on, play the game at least 30 times. Use your data to compare the theoretical probability to the experimental probability. Explain why there may be a difference between the two.
Green tiles Red tiles Probability of drawing two green tiles Decimal equivalents

TIPS: Section 3 – Grade 8 © Queen’s Printer for Ontario, 2003 Page 69
20.2: A Probability Game (Answer) As students work on their new game design, some may be content with probabilities that are
close to 31 ; others may be exact. There are 121 possible combinations with 10 or fewer green
and 10 or fewer red tiles. Access to a calculator or computer would be useful. If this is not possible you may need to guide students to the conclusion to test only games with more green than red tiles. Students may use charts, tree diagrams, or actual listing of combinations (as done in BLM 20.1). Be sure to allow adequate time for students to complete their work.
The combinations of red and green tiles that have probabilities close to or equal to 31 :
Green tiles Red tiles Probability of drawing two green tiles Decimal equivalents
10 7 13645
169
1710
=⎟⎠⎞
⎜⎝⎛ × 0.331
9 6 3512
148
159
=⎟⎠⎞
⎜⎝⎛ × 0.343
8 5 3914 0.359
7 5 227 0.318
6 4 31 0.333
5 3 145 0.357
4 3 72 0.286
3 2 103 0.300
2 1 31 0.333
Students would likely only have time to find one or two combinations of red and green tiles to lead to the desired results.
TIPS: Section 3 – Grade 8 © Queen’s Printer for Ontario, 2003 Page 70
Day 21: Checkpoint Grade 8
Description • Consolidate concepts of theoretical and experimental probability.
Materials • BLM 20.2, 21.1
Assessment Opportunities Minds On…
Whole Class Connecting to previous group of lessons Invite students to ask any questions about the work from the previous class and then to prepare for their assessment.
Action! Individual Demonstrating Skills and Understanding Curriculum Expectations/Test/Marking Scheme: Students complete the test individually (BLM 21.1).
Consolidate Debrief
Pairs Summarizing As students finish the test, they can play games developed on Day 20.
See BLM 21.1 Checkpoint for Understanding Probability Answers. Peer tutoring would be appropriate if a student has difficulty.
Concept Practice Home Activity or Further Classroom Consolidation Finish designing your game. Complete textbook questions: (teacher identifies exercise).

TIPS: Section 3 – Grade 8 © Queen’s Printer for Ontario, 2003 Page 71
21.1: Checkpoint for Understanding Probability Name: Date:
Show full solutions in spaces provided. Read the questions carefully! 1. Tria had one each of five different-shaped number solids having 4, 6, 8, 12, and 20 sides.
She rolled two at a time and found probabilities of the sum of the numbers that came up. She recorded the probabilities in the first column of the table. When it came time to fill in the second column, she had forgotten which number solids she had used. Figure out which number solids she must have used and explain your thinking. The first one has been done for you.
She found that Using these number solids Probability of a
6 was 485
The total number of possible combinations was 48. Both the 4 and 12, and the 6 and 8 combinations would have given 48 possible combinations. If a 4-sided and a 12-sided number solid were rolled and the sum was 6, the possible combinations were 1 and 5, 2 and 4, 3 and 3, and 4 and 2 on the respective number
solids. That gives 4 rolls totalling 6 and a probability of rolling a 6 as 48
4 or
24
2, not
48
5.
If a 6-sided and an 8-sided number solid were rolled and the sum was 6, the possible combinations were 1 and 5, 2 and 4, 3 and 3, 4 and 2, and 5 and 1 on the respective
number solids. That gives 5 rolls totalling 6 and a probability of rolling a 6 as 48
5.
Therefore, Tria must have used the 6- and 8-sided number solids. Probability of a
3 is 802 or
401
Probability of a
3 is 801
Probability of a 4 is less than probability of a 5
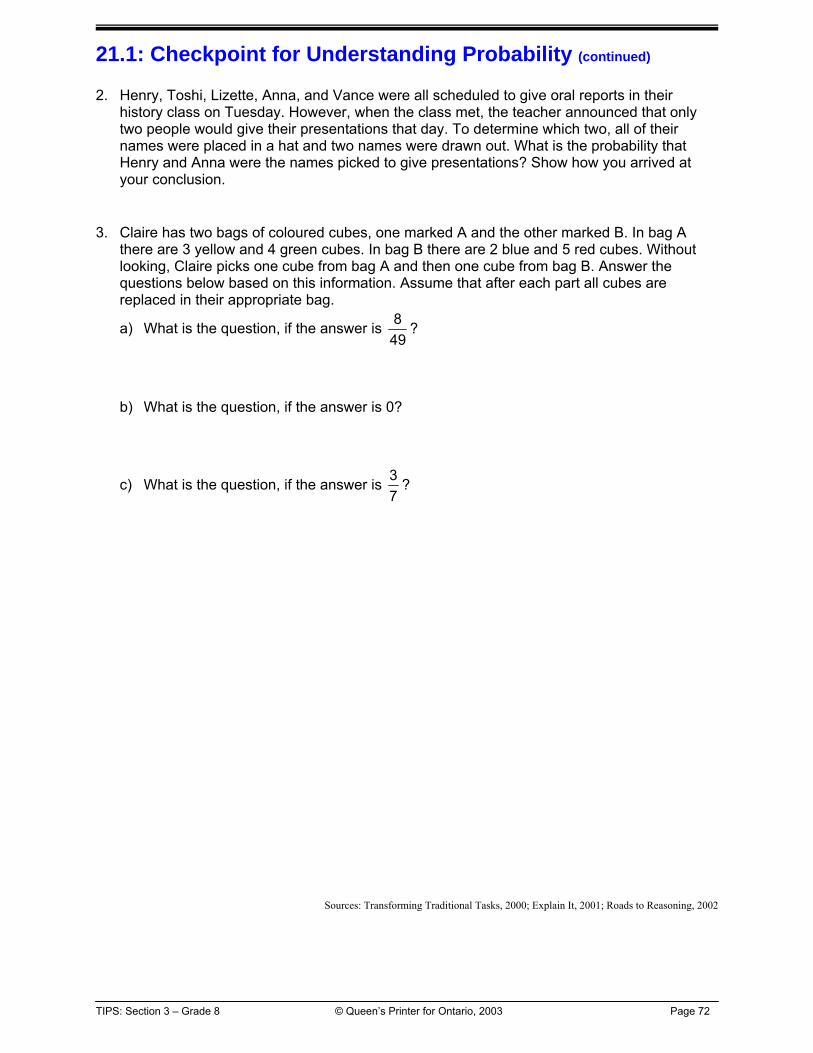
TIPS: Section 3 – Grade 8 © Queen’s Printer for Ontario, 2003 Page 72
21.1: Checkpoint for Understanding Probability (continued) 2. Henry, Toshi, Lizette, Anna, and Vance were all scheduled to give oral reports in their
history class on Tuesday. However, when the class met, the teacher announced that only two people would give their presentations that day. To determine which two, all of their names were placed in a hat and two names were drawn out. What is the probability that Henry and Anna were the names picked to give presentations? Show how you arrived at your conclusion.
3. Claire has two bags of coloured cubes, one marked A and the other marked B. In bag A
there are 3 yellow and 4 green cubes. In bag B there are 2 blue and 5 red cubes. Without looking, Claire picks one cube from bag A and then one cube from bag B. Answer the questions below based on this information. Assume that after each part all cubes are replaced in their appropriate bag.
a) What is the question, if the answer is 498 ?
b) What is the question, if the answer is 0?
c) What is the question, if the answer is 73 ?
Sources: Transforming Traditional Tasks, 2000; Explain It, 2001; Roads to Reasoning, 2002
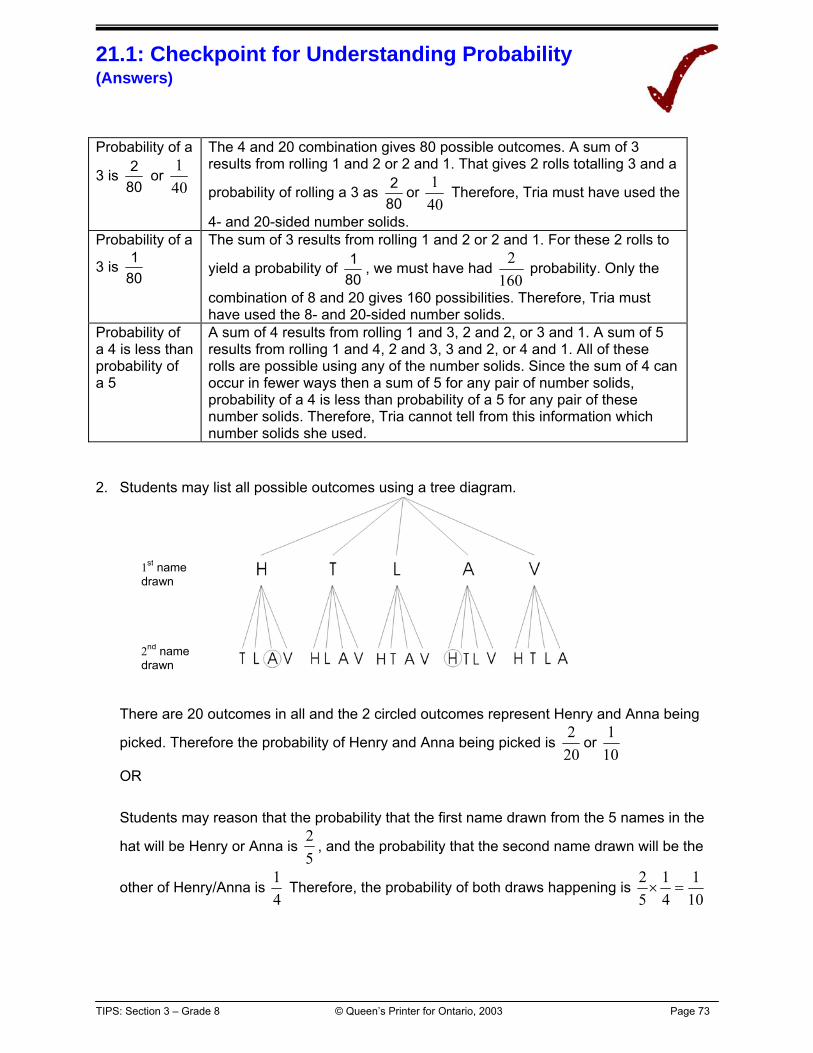
TIPS: Section 3 – Grade 8 © Queen’s Printer for Ontario, 2003 Page 73
21.1: Checkpoint for Understanding Probability (Answers) Probability of a
3 is 802 or
401
The 4 and 20 combination gives 80 possible outcomes. A sum of 3 results from rolling 1 and 2 or 2 and 1. That gives 2 rolls totalling 3 and a
probability of rolling a 3 as 802 or
401
Therefore, Tria must have used the
4- and 20-sided number solids. Probability of a
3 is 801
The sum of 3 results from rolling 1 and 2 or 2 and 1. For these 2 rolls to
yield a probability of 801 , we must have had
1602
probability. Only the
combination of 8 and 20 gives 160 possibilities. Therefore, Tria must have used the 8- and 20-sided number solids.
Probability of a 4 is less than probability of a 5
A sum of 4 results from rolling 1 and 3, 2 and 2, or 3 and 1. A sum of 5 results from rolling 1 and 4, 2 and 3, 3 and 2, or 4 and 1. All of these rolls are possible using any of the number solids. Since the sum of 4 can occur in fewer ways then a sum of 5 for any pair of number solids, probability of a 4 is less than probability of a 5 for any pair of these number solids. Therefore, Tria cannot tell from this information which number solids she used.
2. Students may list all possible outcomes using a tree diagram.
There are 20 outcomes in all and the 2 circled outcomes represent Henry and Anna being
picked. Therefore the probability of Henry and Anna being picked is 202
or 101
OR Students may reason that the probability that the first name drawn from the 5 names in the
hat will be Henry or Anna is 52
, and the probability that the second name drawn will be the
other of Henry/Anna is 41
Therefore, the probability of both draws happening is 101
41
52
=×
1st name drawn
2nd name drawn

TIPS: Section 3 – Grade 8 © Queen’s Printer for Ontario, 2003 Page 74
21.1: Checkpoint for Understanding Probability (Answers) 3. a) Each of the 7 cubes from A could be picked along with each of the 7 cubes from B. This
gives 7 x 7 = 49 possibilities in all. If 8 of these 49 outcomes are favourable, then we want the 4 green cubes from A with the 2 blue cubes from B. Therefore, the question is, “What is the probability of picking 1 green and 1 blue cube?”
b) If the probability is 0, the outcome is impossible. There are many possible answers to this question, e.g., What is the probability of picking a purple cube? What is the probability of picking a yellow and a green cube?
c) Since the answer is 73 and there are 49 possible outcomes, I’ll think of
73
as 4921
.
To get 21 favourable outcomes, I could pick yellow from A and any colour from B in 3 × 7 = 21 ways. Therefore, the question could be, “What is the probability of picking 1 yellow cube?”
Sources: Transforming Traditional Tasks, 2000; Explain It, 2001; Roads to Reasoning, 2002

TIPS: Section 3 – Grade 8 © Queen’s Printer for Ontario, 2003 Page 75
Day 22: Revisiting Rolling Number Cubes for Pythagoras Grade 8
Description • Investigate order of outcomes on theoretical and experimental probability.
Materials • completed
BLM 17.1 • BLM 22.1
Assessment Opportunities Minds On…
Whole Class Connecting to a Previous Lesson and to Prior Knowledge Recall the concepts from Rolling Number Cubes for Pythagoras (Day 17). How must three side lengths be related to form a triangle? Discuss with the class the types of triangles they know - equilateral, isosceles, scalene, and right-angled. Could you consider 1, 1, and 2, or 3, 4, and 7 to be the sides of a triangle? Why or why not? Individual Applying Concepts Refer students back to BLM 17.1 and have them add a column using Type of Triangle as the heading. Students complete this new column and prepare to discuss their criteria for deciding on the type of triangle.
Action! Whole Class Inquiry Students consider the following question and record their answers. How many outcomes are possible when rolling three number cubes? Explain. Circulate to identify students who have argued A (order matters): 6 × 6 × 6 = 216 and students who have argued B (order does not matter): (6 ways to get all 3 numbers the same) + (30 ways to get 2 numbers the same) + (20 ways to get all 3 numbers different) = 56. Identify students to explain both viewpoints. Pose the question: Now that you have heard both arguments, which do you prefer? Pairs Exploring Pair students who prefer argument A together and students who prefer argument B together. Students complete BLM 22.1, being consistent with their preferred argument – either the order of the numbers does matter (argument A) or the order does not matter (argument B). Both groups should arrive at the same answer.
P (equilateral) = 361 P (isosceles) =
247
P (scalene) = 367 P (right-angled) =
361
P (impossible triangle) = 216105
Consolidate Debrief
Whole Class Communicate Understanding Arrange student presentations of BLM 22.1 by a pair that followed argument A and by a pair that followed argument B. Curriculum Expectations/Presentation/Checkbric: Assess students on their presentations.
Concept Practice Exploration
Home Activity or Further Classroom Consolidation Roll three number cubes 50 times and record the results of each roll. Create a tally chart of the outcomes according to no triangle possible or the type of triangle that could be formed. Calculate the experimental probability of each type of triangle. Compare the theoretical probabilities to the experimental probabilities and explain differences.
Is the outcome 2, 3, 4 the same as outcome 4, 2, 3?
OR
Does the order of the numbers matter in this context?
For two numbers the same, there are 6 choices for the repeated number and 5 choices for the different number, making 6 × 5 = 30 ways. Of these 30 ways, 21 combinations yield isosceles triangles; 9 yield impossible triangles. Each of the 21 isosceles combinations can be rolled in 3 ways (with the different number rolling 1st 2nd or 3rd).
If there are too few students preferring one of the arguments, assign some of the strongest students to work with the other argument.
Scalene triangles include right-angled triangles.
For all three numbers to be different, it does not matter what number is chosen first. After that, there are 5 ways for the second number to be different, then 4 ways for the third number to be different from the first and second. This makes 5 × 4 = 20 ways for all three numbers to be different.
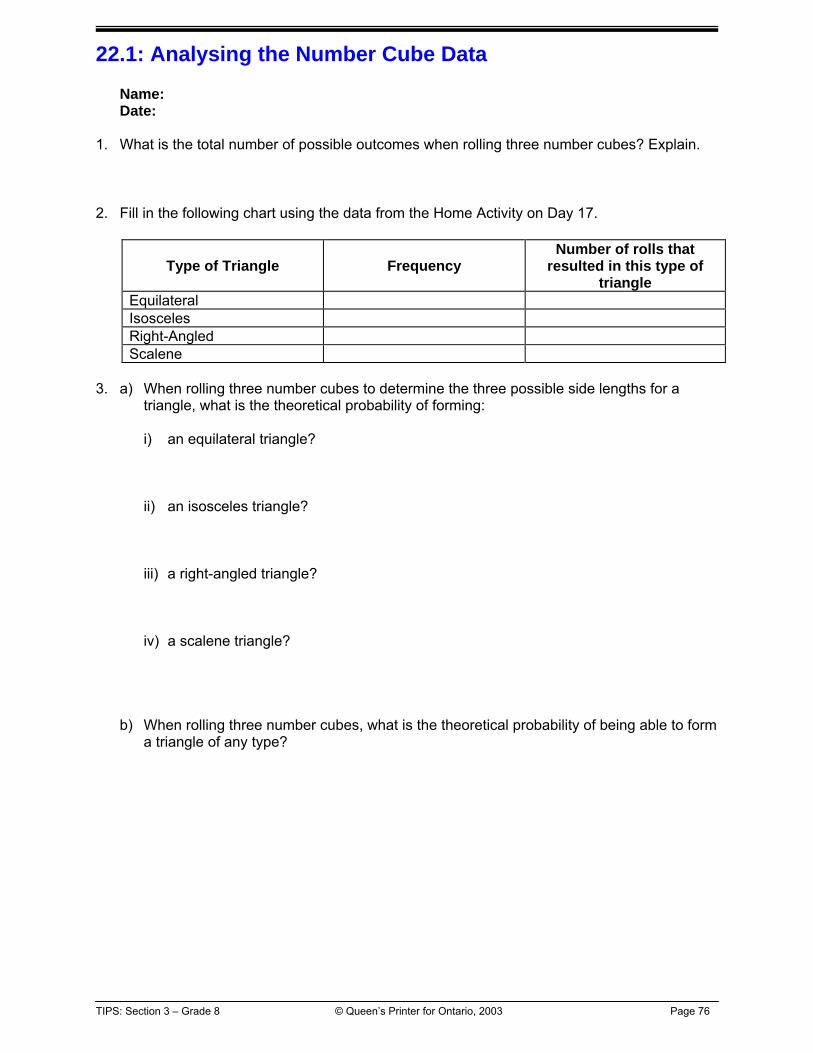
TIPS: Section 3 – Grade 8 © Queen’s Printer for Ontario, 2003 Page 76
22.1: Analysing the Number Cube Data Name: Date:
1. What is the total number of possible outcomes when rolling three number cubes? Explain. 2. Fill in the following chart using the data from the Home Activity on Day 17.
Type of Triangle Frequency Number of rolls that
resulted in this type of triangle
Equilateral Isosceles Right-Angled Scalene
3. a) When rolling three number cubes to determine the three possible side lengths for a
triangle, what is the theoretical probability of forming:
i) an equilateral triangle? ii) an isosceles triangle? iii) a right-angled triangle? iv) a scalene triangle?
b) When rolling three number cubes, what is the theoretical probability of being able to form a triangle of any type?
TIPS: Section 3 – Grade 8 © Queen’s Printer for Ontario, 2003 Page 77
Day 23: Investigating Probability Using Integers Grade 8
Description • Review addition and subtraction of integers. • Link probability to the study of integers.
Materials • integer tiles • number cubes • BLM 23.1
Assessment Opportunities Minds On…
Whole Class Connecting to Other Strands Gather all student data from the Day 22 follow-up activity to calculate experimental probabilities for more trials. Generally, the larger the number of trials, the closer experimental probability should approach theoretical probability. Review the representation of integers, using integer tiles. Identify opposites, several models of zero, and several models of +2. Ask students to model adding and subtracting integers, using integer tiles. For (+3) + (−2) show Using the zero principle, the result is +1. For (−2) – (−5) show and ask if it is possible to take away −5. Ask for a different model of -2 that would make it possible to take away −5. [ ] Once -5 is removed, the result of +3 is obvious. What is the result of adding an integer and its opposite? Does the order matter when we add integers? When we subtract? Model a series of questions like: (+2) – (+5) and (+2) + (−5); (−1) – (+4) and (−1) + (−4) to show that subtracting an integer is like adding the opposite integer. Since addition is easier to envision mentally, practise changing subtraction questions to addition questions. Ask: What addition question and answer are modelled by…? e.g., giving (+ 1) + (−2) = −1 giving (−1) – (−2) = +1
What subtraction question and answer are modelled by…?
Action! Pairs Exploring to Develop Concepts Using BLM 23.1, students conduct a simple probability experiment with integers and two different-coloured number cubes and record their results on a tally chart. Learning Skills/Observation/Checklist and Curriculum Expectations/Observation/Mental Note: Circulate while students analyse the experimental and theoretical probabilities up to and including question 6 on BLM 23.1. Make a note of students whose integer skills need review.
Consolidate Debrief
Whole Class Making Connections Several students describe and compare their experimental results. Lead a discussion to compare the experimental probabilities with each of the theoretical probabilities. What have the students found? Are the results close? Pose the questions: What do you think would happen to your experimental probabilities if you did more than 25 trials or if you combined the trials from every group in the class? How might expertise with integers have affected findings?
Use Integer tiles cut out of coloured transparencies to visually reinforce concepts. Many students will easily use the zero principle where simple matching and removing “zeros” is required. Situations requiring the addition of one or more zeros to facilitate an operation may require extra practice. Students can use the integer tiles to assist in finding sums. Some students may focus on the subtraction operation itself and not inspect the role subtraction plays in the experiment. Since subtraction is not commutative, rules for order are needed. For example: if using a red and a white number cube, the student subtracts the roll of the red die from the roll of the white number cube.
Reflection Home Activity or Further Classroom Consolidation Write a math journal entry using questions in the journal entry part of worksheet 23.1.

TIPS: Section 3 – Grade 8 © Queen’s Printer for Ontario, 2003 Page 78
23.1: Integer Number Cubes Name: Date:
Use two different-coloured number cubes. Choose one cube to be negative numbers and the other to be positive numbers. Record all of your results in the table.
Experimental Theoretical
Sum Tally Frequency Probability Possible Combinations
Number of Possible
Combinations Probability
4 6, −2; 5, −1 2

TIPS: Section 3 – Grade 8 © Queen’s Printer for Ontario, 2003 Page 79
23.1: Integer Number Cubes (continued) 1. Roll the number cubes and add the two numbers together, remembering which cube
represents positives and which cube represents negatives. Note the sum. 2. Repeat rolling the number cubes and finding the sum until you have a variety of sums. 3. What possible sums can you get? Fill out the first column of the table with the possible
sums. 4. Roll the number cubes 25 times and record each outcome of the sum in the tally column of
the table. 5. Total the tallies to find the frequency of the various sums. 6. What sum did you get the most? Why do you think this is so? 7. What sum did you get the least? Why do you think that is? 8. The experimental probability of an event happening is given by the fraction
trials of number totalhappened event thetimes of number .
For example, if you rolled the number cubes 25 times, and you got a sum of “3” 5 times,
then the experimental probability of getting a sum of 3 is 255 =
51 . Find the experimental
probability of each of the sums and enter these experimental probabilities in the table. 9. Fill in the 5th column of the table with all of the combinations of numbers that you could roll to
yield each sum. For example, a sum of 4 would have possible combinations of: 6 and −2, 5 and −1.
10. Fill in the 6th column with the number of combinations in the 5th column. 11. The theoretical probability of an event is given by the ratio
outcomes possible totalhappening event the ofways possible of number .
For example, there are two possible ways of getting a sum of 4 (see the first chart you completed). There are 36 possible combinations with the number cube, so the theoretical
probability of getting a sum of 4 is 362 =
181 . Find the theoretical probability of rolling each
of the possible sums. Enter your results in the last column of the table.
TIPS: Section 3 – Grade 8 © Queen’s Printer for Ontario, 2003 Page 80
23.1: Integer Number Cubes (continued) Math Journal Entry 1. What is the theoretical probability of:
a) rolling a negative sum? b) rolling an even sum (positive or negative?) c) not rolling a sum of 3? d) rolling anything other than a sum of 0?
2. How might errors in integer calculations be prevented in this experiment? 3. What extra considerations would be needed if the roll of the number cubes were subtracted
rather than added? 4. What other words do we use to indicate positive and negative? Suggest a variety of
situations where these words might be used. 5. How might addition and subtraction of integers be shown using a number line?

TIPS: Section 3 – Grade 8 Summative Task © Queen’s Printer for Ontario, 2003 Page 81
Multi-dart Summative Task
Grade 8 Total time 240 minutes Materials •• The Geometer’s Sketchpad® (dynamic geometry software) file (cones.gsp),
•• Calculators, dart board or diagram, BLMs Description Using manipulatives and technology students collect data to investigate the relationship
between circumference and the area of various circles within a boundary. Students discover a pattern and use it to solve a problem. They submit a report that justifies and explains their conclusions.
Expectations Assessed* and addressed
Number Sense and Numeration 8m31 – *explain the process used and any conclusions reached in problem solving and investigations; 8m32 – *reflect on learning experiences and interpret and evaluate mathematical issues using appropriate mathematical language (e.g., in a math journal). Measurement 8m37 – *solve problems related to the calculation of the radius, diameter and circumference of a circle; 8m42 – *make increasingly more informed and accurate measurement estimations based on an understanding of formulas and the results of investigations; 8m44 – *measure the radius, diameter, and circumference of a circle using concrete materials. 8m47 – estimate and calculate the radius, diameter, circumference, and area of a circle, using a formula in a problem solving context; Patterning and Algebra 8m75 – identify, create, and discuss patterns in algebraic terms; 8m77 – identify, create, and solve simple algebraic equations; 8m78 – *apply and defend patterning strategies in problem-solving situations. Ontario Catholic School Graduate Expectations CGE3c – thinks reflectively and creatively to evaluate situations and solve problems CGE5a – works effectively as an interdependent team member
Prior Knowledge
•• Understanding of circle relationships •• Skills with The Geometer’s Sketchpad®
Students should be able to: •• Draw parallel and perpendicular lines •• Create a table •• Calculate area and perimeter/circumference •• Construct points, circles, and line segments •• Create a scale drawing •• Estimate •• Develop and use Ratio and Proportion •• Apply circle formulas •• Use tables to organize data and thinking
Assessment Tools Rubric
Extensions What would be the impact on total costs of changing the cost of curved plastic trim to $1.50/m regardless of its length?

TIPS: Section 3 – Grade 8 Summative Task © Queen’s Printer for Ontario, 2003 Page 82
Pre-task Instructions Read the following script to students on the day before the investigation begins. Teacher Script 1. We will be working on an investigation over the next three mathematics classes. 2. An investigation is an extended problem designed to allow you to show your ability to undertake an
inquiry: to make a hypothesis, formulate a plan, collect data, model and interpret the data, draw conclusions, and communicate and reflect on what you have found.
3. For this investigation you will be using The Geometer’s Sketchpad®. As well you will need pencils,
pens, an eraser, a ruler, notepaper and a graphing calculator to complete the work. 4. As you do the investigation you will work as part of a group and also individually. (Distribute an
envelope or folder to each student.) I am giving each of you an envelope in which you can store your notes for the duration of the investigation. Write your name on the front of the envelope.
5. On the third day you will write a report giving your conclusions and summarizing the processes you
have followed to arrive at them. 6. Be sure to show your work and include as much explanation as needed. 7. Each section of the investigation has a recommended time limit that I will tell you so you can manage
your time. 8. You will be assigned to the following groups for the three days of the investigation. (You may wish to
assign students to their groups at this time – recommended group size is four students.) 9. Are there any questions you have regarding the format or the administration of the investigation? Teacher Notes • This summative task could be used for gathering summative assessment data or for providing formative
feedback to students before they complete another task for assessment purposes.
• If a Home Activity or Further Classroom Consolidation task is to be used for gathering assessment data, it may be most appropriate for students to work on it independently under teacher supervision.
• Some suggested Home Activity or Further Classroom Consolidation tasks help prepare students for later assessments.

TIPS: Section 3 – Grade 8 Summative Task © Queen’s Printer for Ontario, 2003 Page 83
Day 1: Introducing the Problem Grade 8
Description • Understand the complexity of the problem. • Discuss various strategies for solving the problem.
Materials • BLM S1.1, S1.2, S1.3 • dart board
Minds On ... Whole Class Guided Summarize the experiences of the Canadians who have invented a new game. (BLM S1.1) Discuss the game of darts. The purpose of the game is to score the greatest number of points. Players earn points by throwing a dart at a circular board. Points are earned when a dart lands within one of the concentric circles. The maximum number of points are in the centre of the circle. Each concentric circle radiating from the centre contains fewer points. If possible, simulate a game of darts with magnets. Explain the investigation task: Over the next four days it is your role to help a manufacturer with the design of a new and different dart game called Multi-dart. Small Groups Discussion Students read the problem together and highlight the key information (BLM S1.2). They paraphrase the problem in their own words. Whole Class Discussion Read and discuss BLM S1.3. Students ask questions for clarification of the task and their final submission.
Action! Small Groups Discussion Students explore and discuss strategies and plans for solving the problem and develop hypotheses about their potential preferred design.
Consolidate Debrief
Whole Class Share The groups share their ideas with the class. Individual Assessment Students record their hypotheses and plans for this investigation.
An optional table has been provided for teachers to make available to students if required (BLM S1.3)
Reflection
Home Activity or Further Classroom Consolidation Answer the following questions in your journal. • How did the small group discussion help you better understand the problem? • What further ideas came out in the whole class sharing? • What further considerations have you thought of since the class sharing?

TIPS: Section 3 – Grade 8 Summative Task © Queen’s Printer for Ontario, 2003 Page 84
S1.1 Article Canadian game and toy inventors have an amazing history. In 1891, James Naismith was
credited with the invention of the game of basketball. In 1909, T.E. Ryan of Toronto developed
five pin bowling. In 1980, University of Toronto students Chris Hardy and Scott Abbott created
the hit board game Trivial Pursuit. More recently, a trio of young inventors, Anton Rabie, Ben
Varadi, and Ronnen Harary created Air Hogs, and later, finger bikes and finger skateboards.
Now, just coming on to the market is a new set of games called “Toss’ems.” In these games
pog-like magnetic pieces are tossed at a metal board to simulate the games of soccer, hockey,
football, basketball, and baseball. The creator, John MacEachern was inspired as he watched
his nephews toss magnets at a fridge to amuse themselves during a period of bad weather at
the cottage. “I thought if I could package this activity it would catch on,” he explained.
What is interesting, particularly about these last inventions, is that they are not entirely unique,
but rather variations on existing games/activities. So for this mathematical investigation, you will
be examining a new variation of an old game – we’ll call it “Multi-darts.”
http://www.tossems.com Toronto Star, Monday Dec. 6, 1999. Section E pp. 1 and 3 “Air Hogs Creators Betting Little Bikes Will Fly.”
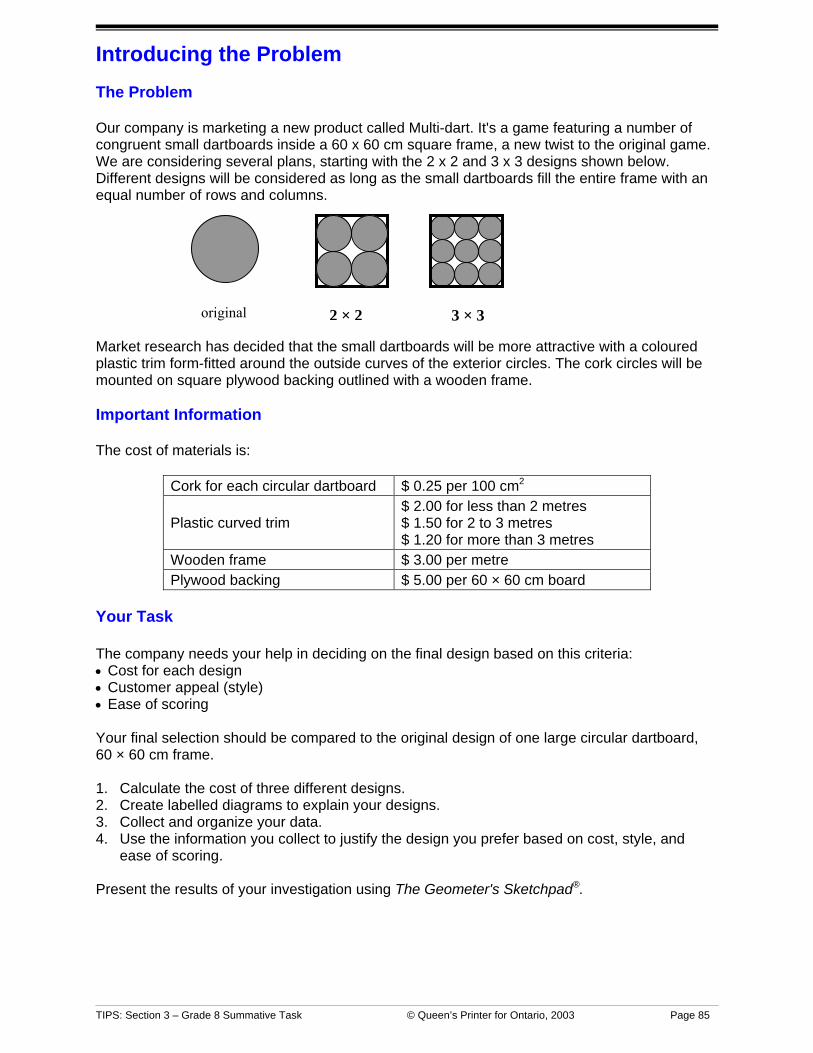
TIPS: Section 3 – Grade 8 Summative Task © Queen’s Printer for Ontario, 2003 Page 85
Introducing the Problem The Problem Our company is marketing a new product called Multi-dart. It's a game featuring a number of congruent small dartboards inside a 60 x 60 cm square frame, a new twist to the original game. We are considering several plans, starting with the 2 x 2 and 3 x 3 designs shown below. Different designs will be considered as long as the small dartboards fill the entire frame with an equal number of rows and columns. Market research has decided that the small dartboards will be more attractive with a coloured plastic trim form-fitted around the outside curves of the exterior circles. The cork circles will be mounted on square plywood backing outlined with a wooden frame. Important Information The cost of materials is:
Cork for each circular dartboard $ 0.25 per 100 cm2
Plastic curved trim $ 2.00 for less than 2 metres $ 1.50 for 2 to 3 metres $ 1.20 for more than 3 metres
Wooden frame $ 3.00 per metre Plywood backing $ 5.00 per 60 × 60 cm board
Your Task The company needs your help in deciding on the final design based on this criteria: • Cost for each design • Customer appeal (style) • Ease of scoring Your final selection should be compared to the original design of one large circular dartboard, 60 × 60 cm frame. 1. Calculate the cost of three different designs. 2. Create labelled diagrams to explain your designs. 3. Collect and organize your data. 4. Use the information you collect to justify the design you prefer based on cost, style, and
ease of scoring. Present the results of your investigation using The Geometer's Sketchpad®.
original 2 × 2 3 × 3
TIPS: Section 3 – Grade 8 Summative Task © Queen’s Printer for Ontario, 2003 Page 86
S1.2 Questions to Guide Your Final Submission
Guiding Questions for the Reflection Describe the processes and problem-solving strategies you employed in investigating Multi-Dart. What patterns and relationships did you notice? Did anything surprise you? Explain. If you were going to conduct this same investigation again, would you use the same processes and strategies, or would you try different ones? Explain. Diagrams The Geometer’s Sketchpad® diagrams should be printed and included in your portfolio. Include a text box with your name and date on each diagram. When printing a file, first select PRINT PREVIEW from the FILE menu, and then SCALE to make it fit the page. Data Organization Include a summary of the data use these headings: • Design type • Square frame perimeter • Frame cost • Plywood backing cost • Cork area • Cork cost • Curved perimeter of outside circles • Plastic trim cost • Total cost Recommendation Make a specific recommendation for one of the three designs, explaining your choice by referring to, cost, style, and ease of scoring.
Your final submission should be a portfolio comprised of four sections: • A reflection • Diagrams used in investigating the dart board designs • Organized data • Conclusion and justifications as to which design is best based on cost, style, and ease of
scoring

TIPS: Section 3 – Grade 8 Summative Task © Queen’s Printer for Ontario, 2003 Page 87
S1.3 Optional Data Organization Table A Comparison of Multi-dart Designs
Design
Square Frame
Perimeter (cm)
Frame Cost
Plywood Backing
Cost
Cork Area (cm2)
Cork Cost
Circular Trim
Perimeter (cm)
Curved Plastic Trim Cost
Total Cost
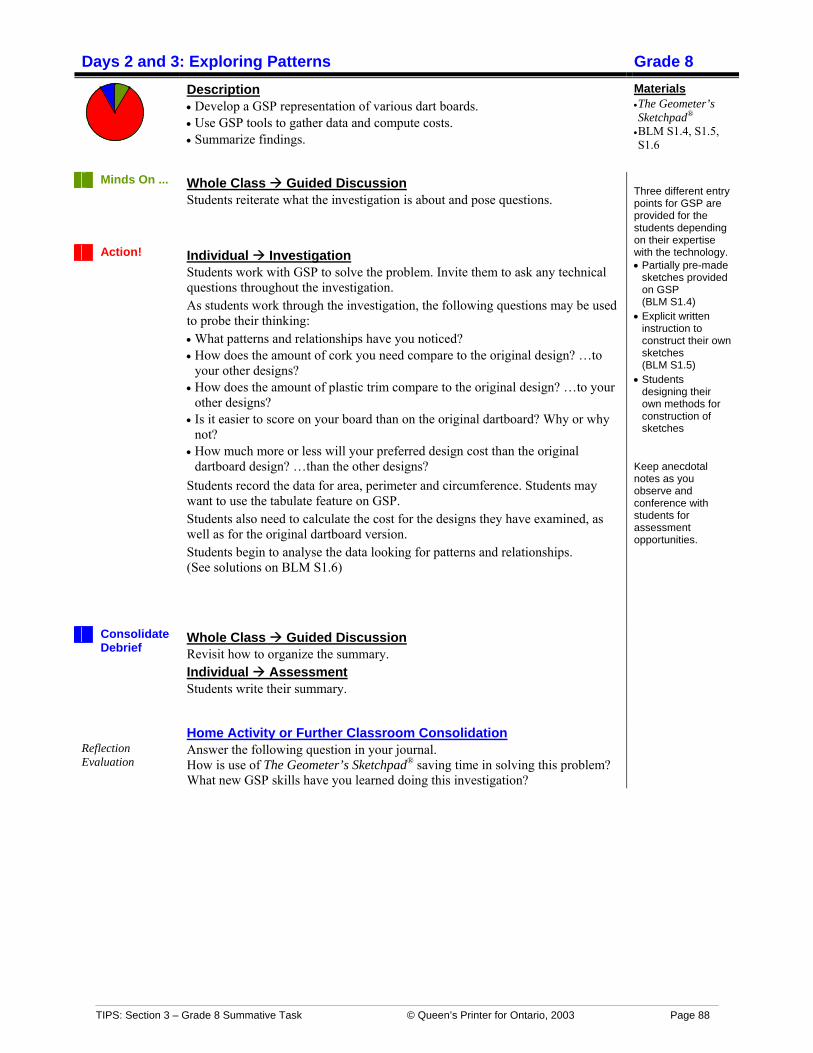
TIPS: Section 3 – Grade 8 Summative Task © Queen’s Printer for Ontario, 2003 Page 88
Days 2 and 3: Exploring Patterns Grade 8
Description • Develop a GSP representation of various dart boards. • Use GSP tools to gather data and compute costs. • Summarize findings.
Materials • The Geometer’s Sketchpad® • BLM S1.4, S1.5, S1.6
Minds On ... Whole Class Guided Discussion Students reiterate what the investigation is about and pose questions.
Action! Individual Investigation Students work with GSP to solve the problem. Invite them to ask any technical questions throughout the investigation. As students work through the investigation, the following questions may be used to probe their thinking: • What patterns and relationships have you noticed? • How does the amount of cork you need compare to the original design? …to
your other designs? • How does the amount of plastic trim compare to the original design? …to your
other designs? • Is it easier to score on your board than on the original dartboard? Why or why
not? • How much more or less will your preferred design cost than the original
dartboard design? …than the other designs? Students record the data for area, perimeter and circumference. Students may want to use the tabulate feature on GSP. Students also need to calculate the cost for the designs they have examined, as well as for the original dartboard version. Students begin to analyse the data looking for patterns and relationships. (See solutions on BLM S1.6)
Consolidate Debrief
Whole Class Guided Discussion Revisit how to organize the summary. Individual Assessment Students write their summary.
Three different entry points for GSP are provided for the students depending on their expertise with the technology. • Partially pre-made
sketches provided on GSP (BLM S1.4)
• Explicit written instruction to construct their own sketches (BLM S1.5)
• Students designing their own methods for construction of sketches
Keep anecdotal notes as you observe and conference with students for assessment opportunities.
Reflection Evaluation
Home Activity or Further Classroom Consolidation Answer the following question in your journal. How is use of The Geometer’s Sketchpad® saving time in solving this problem? What new GSP skills have you learned doing this investigation?

TIPS: Section 3 – Grade 8 Summative Task © Queen’s Printer for Ontario, 2003 Page 89
S1.4 Partial Pre-made Sketch Instructions for GSP 4.03
Standard Single Circle Dartboard Design • Begin with the pre-made sketch showing a square with a dot in the centre.
• Select one of the sides of the square. Measure its length. What is the relationship between the length of the side and the dimensions of the dartboard described in the investigation? Why do you think the sketchpad measure and the actual dartboard measure are different? How will this impact your results?
• Select one of the sides of the square again. Go to the CONSTRUCT menu and select MIDPOINT.
• Left click in a blank area to deselect the midpoint you have just constructed.
• Select the centre of the circle and then the midpoint you just constructed. Go to the CONSTRUCT menu and select CIRCLE BY CENTRE + POINT.
• Go to the MEASURE menu and select CIRCUMFERENCE. Drag this measurement to a convenient location.
• Select the circumference, and go to the CONSTRUCT menu and select CIRCLE INTERIOR. Then go to the MEASURE menu and select AREA. Once again, drag this to a convenient location.
Completing the 2 × 2 Multi-dart Design • Begin with the pre-made sketch showing a 2 × 2 square with a circle in the top left square.
• Using the SELECT TOOL, double click on the point at the centre of the entire 2 × 2 square to establish that as the centre of rotation.
• Still using the select tool, double click on the heavy red lined portion of the circumference of the circle, followed by a single click on the remaining thin-lined section of the circumference.
• Go to the TRANSFORM menu and select ROTATE. It should say 90 degrees. Click ROTATE.
• Go directly back to the TRANSFORM menu and again select ROTATE and click ROTATE. Repeat this procedure one more time to complete the Multi-dart 2 × 2 sketch.
• From this diagram, you may construct circle interiors, measure area, arc lengths, etc., to complete this portion of the investigation.
Completing the 3 × 3 Multi-dart Design • Begin with the pre-made sketch showing a 3 × 3 square with a circle in the top left square.
• To make a point at the exact centre of the entire diagram, use the SELECT TOOL to highlight two opposite vertices of the small middle square. From the CONSTRUCT menu choose SEGMENT. Click in a blank area to "deselect" these items, then repeat the process to construct a segment joining the other two opposite vertices of the small centre square.
• Highlight only the two crossing segments you have just constructed. From the CONSTRUCT menu choose Point at Intersection. Click in a blank section to "deselect" these items. Then double click on the central point you have just constructed to set it as the centre of rotation.
*Note that these instructions represent only one way to complete the sketches and solve the problem using The Geometer's Sketchpad®. As there are many other possible approaches, you may explore and deviate from the steps provided below.

TIPS: Section 3 – Grade 8 Summative Task © Queen’s Printer for Ontario, 2003 Page 90
S1.4 Partial Pre-made Sketch Instructions for GSP 4.03 (continued) • Still using the select tool, double click on the heavy red lined portion of the circumference of
the circle, followed by a single click on the remaining thin-lined section of the circumference.
• Go to the TRANSFORM menu and choose ROTATE. Repeatedly rotate this section 90 degrees until all four corners are filled.
• Now, single click on the thin lined-portion of the circumference of the original circle, followed by a single click on each of the four points on that circumference. Double click on the vertical line connected to the right hand side of the circle. This will set the line of reflection.
• Go to the TRANSFORM menu and choose REFLECT.
• Double click on the same centre of rotation we used originally. From the TRANSFORM menu choose ROTATE, and repeatedly rotate this circle until all outside squares contain circles.
• To fill the centre circle, highlight the circumference of the top centre circle, double click on the horizontal line attached to its bottom point, and from the TRANSFORM menu choose REFLECT.
• To complete the sketch, click on the west, north, and east points of the top centre circle. Go to the CONSTRUCT menu and choose ARC THROUGH 3 POINTS. Go to the DISPLAY menu and choose LINE WIDTH. Choose THICK.
• Continue to define this outer arc on the remaining three circles, either by rotating the arc you have just constructed, or by constructing arcs on each of the individual circles.
• Measure, calculate, and tabulate as needed to complete the investigation.

TIPS: Section 3 – Grade 8 Summative Task © Queen’s Printer for Ontario, 2003 Page 91
S1.5 GSP 4.03 Instructions Follow the directions below to create a 2 × 2 Multi-dart Board using The Geometer's Sketchpad® 4.03:
Constructing a circle with a radius of 2 cm. 1. Go to the EDIT menu and select PREFERENCES. 2. Change the units: angles to degrees; distance to cm. Change all three precision measures
to units. Place a check in the box beside apply to this sketch. (The use of units rather than using decimals maintains the length measurements as whole numbers.)
3. Go to the GRAPH menu and select SHOW GRID. A coordinate grid will appear with a point constructed at 1,0 and 0,0.
4. Go to the GRAPH menu and select PLOT POINTS. 5. Highlight the space on the left and enter –1.0 for a 3 × 3 Multi-dart. This will create a 2 cm
segment. For a 2 × 2 Multi-dart, enter – 2. This will create a three cm segment. In the space on the right, highlight the number and type 0. Click on PLOT and DONE. A third point will appear.
6. Click to select the two axes and go to the DISPLAY menu. Select HIDE AXES. The x and y axes will disappear.
7. Go to the GRAPH menu and select HIDE GRID. The grid should disappear leaving the three points.
8. Click on the two points, (-1, 0) and (+1, 0) and go to the CONSTRUCT menu. Choose SEGMENT. A pink line segment should appear with endpoints and a midpoint.
9. Drag the segment to a corner. Select the POINT TOOL. Click once on the page to create a point around the middle of the page.
10. The point will be bright pink. This shows that the point is selected. Click on the segment to select it as well.
11. Go to the CONSTRUCT menu and select CIRCLE BY CENTRE + RADIUS. A circle will appear. Its radius will be the same length as the line segment you placed in the corner.
12. Click somewhere on the blank sketch to deselect the circle you have selected. Measure the line segment by selecting it. (It will be pink when selected.) Then go to the MEASURE menu and select LENGTH. A small pink box will appear with the measurement inside it.
13. Click on the circumference of the circle and go to the CONSTRUCT menu. Click on POINT ON OBJECT. A point will appear on the circumference. Drag the point to the top of the circle.
m AB = 2 cm
2x2
*Note that these instructions represent only one way to complete the sketches and solve the problem using The Geometer's Sketchpad®. As there are many other possible approaches, you may explore and deviate from the steps provided below.

TIPS: Section 3 – Grade 8 Summative Task © Queen’s Printer for Ontario, 2003 Page 92
S1.5 GSP 4.03 Instructions (continued) Creating the 2 × 2 dartboard from a single circle. 14. With both the point and the CENTRE OF THE CIRCLE selected, go to the CONSTRUCT
menu and select LINE. This allows you to create points on your circle. (Note: a line has no beginning and no end.)
15. Select the circumference and the line and go to the CONSTRUCT menu. Choose INTERSECTIONS.
16. Go to the DISPLAY menu and select HIDE LINE. Highlight the two points and go to CONSTRUCT. Select SEGMENT. This will create a diameter for the circle and will help you to duplicate the circle.
17. In order to create a second circle for the Multidart Board, click on the point at the top of the circle then the point at the bottom of the circle. Go to the TRANSFORM menu and select MARK VECTOR. The segment will briefly be highlighted black. This line indicates the distance and direction of the translation.
18. Using the point tool click just above and to the left of the circle and drag to create a rectangle. This selects the circle and all points and segments.
19. Then go to the TRANSFORM menu and select TRANSLATE. A dialogue box will appear. If needed, move the dialogue box by clicking on the blue band at the top and dragging it to the side. This will allow you to see the faint outline of a circle.
20. The marked box will be checked. Click on TRANSLATE to create a second circle directly below the first. (If you are drawing a Multidart Board with three circles on each side, repeat this translation by marking the diameter of the second circle as a vector and repeating the process above.)
21. Select the line segment or diameter in the top circle and the centre point, then go to the CONSTRUCT menu. Choose PERPENDICULAR LINE. Do the same in the bottom circle so that two parallel lines are created perpendicular to the existing diameters. These lines allow you to create points where they intersect with the circle.
22. Click on a white part of the page to deselect all points and segments. Then, click on the circumference of the top circle and the perpendicular line through the centre and choose INTERSECTIONS. Do the same thing for the bottom circle.
23. Click on one of the circle diameters and one of the intersection points on the circumference. Go to the CONSTRUCT menu and choose PARALLEL LINE. Click on the white space to deselect the highlighted objects. This will create a line of reflection.
24. To reflect the two circles across the parallel line, double click on the parallel line to mark it as the mirror line. Then click and drag to draw a box around the two circles and select everything on or inside them.
25. Go to the TRANSFORM menu and click on REFLECT. (If you are drawing the 3 x 3 Mulitdart Board, create another parallel line and reflect two of the circles again.)
26. Select the two points on the top of the circles. Go to the CONSTRUCT menu and select LINE. Do the same on the bottom and each side of the circles. These lines will help create the frame for the Multidart Board.
27. Click on two intersection lines, at the corners of the board. Go to the CONSTRUCT menu and select INTERSECTION to create a corner point for the Multidart frame. Repeat to create a point for each corner of the Multidart frame.
28. Click on each of the lines and segments and go to DISPLAY menu. Select HIDE LINES. 29. Select the four points in order around the corners of the Multidart and go to the
CONSTRUCT menu to select SEGMENTS.

TIPS: Section 3 – Grade 8 Summative Task © Queen’s Printer for Ontario, 2003 Page 93
S1.5 GSP 4.03 Instructions (continued) 30. Outline the outside of the circles by creating arcs on the circles. This will outline the area to
be form-fitted with plastic trim. Click on the point between two adjacent circles (A), then one of the points on the circumference (B), and a third point where adjacent circles join (C). See the illustration below. This will select the points needed to create an arc around part of the circle.
31. With the three points selected choose CONSTRUCT and ARC THROUGH 3 POINTS. This
will select the part of the first circle which is trimmed with plastic. Repeat this process to construct arcs on the other circles. See illustration below.
32. Select the appropriate parts of the Multidart Board and use the MEASURE menu to find the
measurements.
A
C
B
AC
B

TIPS: Section 3 – Grade 8 Summative Task © Queen’s Printer for Ontario, 2003 Page 94
S1.6 Solutions (Days 2 and 3)
The calculations are based on circles inscribed on a 60 x 60 cm square
Design Circumference Perimeter Area
C = πd = 3.14 (60) = 188.4 cm
P = πd = 3.14 (60) = 188.4 cm
A = πr2 = 3.14 (302) = 2826 cm2
C = 4 πd = 4 (3.14 ) (30) = 376.8 cm double the single circle circumference
P = 3πd = 3 (3.14)(30) = 2.826 cm 1½ times the single circle “perimeter”
A = 4πr2 = 4 (3.14) (152) = 2826 cm2
C = 9 πd = 9 ( 3.14) (20) = 565.2 cm triple the single circle circumference
P = 5πd = 5 (3.14)(20) = 314 cm 1 3
2 times the single circle “perimeter”
A = 9 πr2 =9 (3.14) (102) = 2826 cm2
C = 16 πd = 16 ( 3.14) (15) = 753.6 cm quadruple the single circle circumference
P = 7πd = 7 (3.14)(15) = 329.7 cm 1¾ times the single circle “perimeter”
A = 16πr2 = 16 (3.14) (7.52) = 2826 cm2
C = 188.4 n where “n” represents the design number
The general formula would be P = (2n-1) πd (See Calculating Perimeter on next page.)
Area is constant, regardless of the number of congruent circles enclosed in the space. This means chances of “scoring” are equal regardless of design.

TIPS: Section 3 – Grade 8 Summative Task © Queen’s Printer for Ontario, 2003 Page 95
S1.6 Solutions (Days 2 and 3) (continued)
Calculating the Perimeter
If you construct a square by joining the centres of each circle, it becomes easier to see that the “perimeter” of this figure is composed of four ¾ circumferences. That is,
P = 4 × 43 (circumference of single circle)
= )d(434 π×
dπ3=
This time the four ¾ circumferences still exist but there are an additional four ½ circumferences along the perimeter, or
⎥⎦
⎤⎢⎣
⎡ π×+⎥⎦
⎤⎢⎣
⎡ π×= )d(214)d(
434P
= dd ππ 23 + = dπ5
Similarly, with a 4 x 4 array, the four ¾ circumferences still exist on the corners and this time there are eight ½ circumferences along the perimeter, or
⎥⎦
⎤⎢⎣
⎡ π×+⎥⎦
⎤⎢⎣
⎡ π×= )d(218)d(
434P
dd ππ 43 += dπ7=

TIPS: Section 3 – Grade 8 Summative Task © Queen’s Printer for Ontario, 2003 Page 96
Day 4: Extending the Pattern Grade 8
Description • Apply GSP skills to a new problem. • Investigate a change in the parameters to the multi-dart problem.
Materials • The Geometer’s Sketchpad® • BLM S1.7, S1.8
Minds On ... Whole Class Guided Read the problem together (BLM S1.7) and give students an opportunity to ask questions for clarification. Small Group Discussion Students highlight the key information and paraphrase the problem in their own words. Discuss how students think the change in size of the dartboard will proportionally affect the area, perimeter, and circumference, as well as how it might affect the cost of the larger board. Whole Class Sharing Discussion Each group shares its predictions.
Action! Independent Investigation Students work on GSP to adjust their preferred design to fit the new dimensions for the frame. They look at the values for area, perimeter, and circumference and compare them to the similar smaller multi-dart board and to their predictions. Students analyse how the results proportionally changed for area, perimeter, and circumference. They calculate the new cost for the larger game and analyse how the cost changes compared to the smaller version and their predictions.
Consolidate Debrief
Whole Class Guided Discussion Review the expectations for the written report. Independent Assessment Students write a report on their findings.
Any values for perimeter and circumference double whereas any values for area quadruple; as a result, the cost of the larger board will be more than double the smaller one.
Application Concept Practice Differentiated Reflection
Home Activity or Further Classroom Consolidation Answer one of the following questions in your journal based on whether you are satisfied with your solution to their multi-dart problem. If so, do A, or you think you could have done a much better job, do B. A: If the price of plastic curved trim was $1.50/m regardless of the length
needed, what would be the impact on your answer to today’s problem – doubling the frame size?
OR B: What could you have done differently to improve your solution? What about
this experience will you remember when you encounter a similar situation?

TIPS: Section 3 – Grade 8 Summative Task © Queen’s Printer for Ontario, 2003 Page 97
S1.7 Extending the Pattern What if the frame size is doubled? Our marketing department has decided it needs a larger model of your preferred design to sell to public places such as restaurants and clubs. We need to double the size of the frame to 120 cm × 120 cm. It is important we know the following information to help with the ordering of materials and calculating our costs: • How will doubling the dimensions of the frame size affect:
• the area of the plywood backing? • the area of the cork? • the perimeter of the wooden frame? • the perimeter of the curved plastic trim?
• What do you think the new cost of plywood backing will be? Justify your answer.
• How will the cost increase for the larger game?
• Record your results.
• Explain the relationships you noticed.
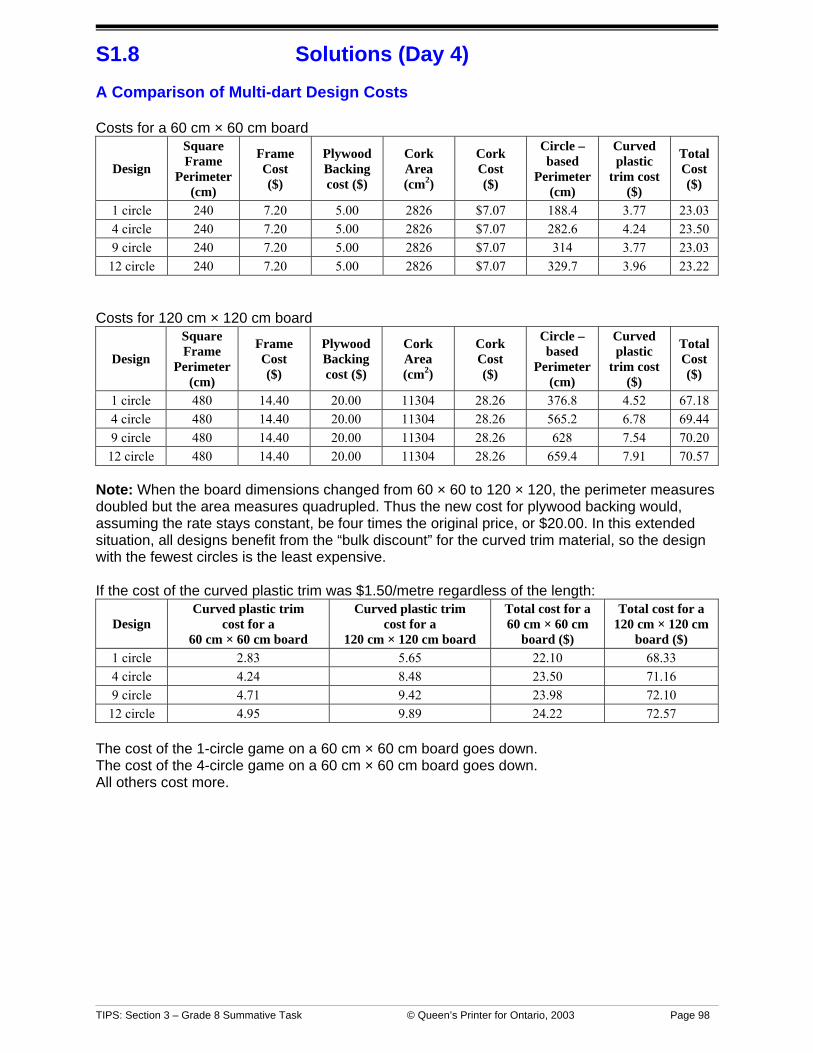
TIPS: Section 3 – Grade 8 Summative Task © Queen’s Printer for Ontario, 2003 Page 98
S1.8 Solutions (Day 4)
A Comparison of Multi-dart Design Costs Costs for a 60 cm × 60 cm board
Design
Square Frame
Perimeter (cm)
Frame Cost ($)
Plywood Backing cost ($)
Cork Area (cm2)
Cork Cost ($)
Circle – based
Perimeter (cm)
Curved plastic
trim cost ($)
Total Cost ($)
1 circle 240 7.20 5.00 2826 $7.07 188.4 3.77 23.03 4 circle 240 7.20 5.00 2826 $7.07 282.6 4.24 23.50 9 circle 240 7.20 5.00 2826 $7.07 314 3.77 23.03
12 circle 240 7.20 5.00 2826 $7.07 329.7 3.96 23.22 Costs for 120 cm × 120 cm board
Design
Square Frame
Perimeter (cm)
Frame Cost ($)
Plywood Backing cost ($)
Cork Area (cm2)
Cork Cost ($)
Circle – based
Perimeter (cm)
Curved plastic
trim cost ($)
Total Cost ($)
1 circle 480 14.40 20.00 11304 28.26 376.8 4.52 67.18 4 circle 480 14.40 20.00 11304 28.26 565.2 6.78 69.44 9 circle 480 14.40 20.00 11304 28.26 628 7.54 70.20 12 circle 480 14.40 20.00 11304 28.26 659.4 7.91 70.57
Note: When the board dimensions changed from 60 × 60 to 120 × 120, the perimeter measures doubled but the area measures quadrupled. Thus the new cost for plywood backing would, assuming the rate stays constant, be four times the original price, or $20.00. In this extended situation, all designs benefit from the “bulk discount” for the curved trim material, so the design with the fewest circles is the least expensive. If the cost of the curved plastic trim was $1.50/metre regardless of the length:
Design Curved plastic trim
cost for a 60 cm × 60 cm board
Curved plastic trim cost for a
120 cm × 120 cm board
Total cost for a 60 cm × 60 cm
board ($)
Total cost for a 120 cm × 120 cm
board ($) 1 circle 2.83 5.65 22.10 68.33 4 circle 4.24 8.48 23.50 71.16 9 circle 4.71 9.42 23.98 72.10
12 circle 4.95 9.89 24.22 72.57 The cost of the 1-circle game on a 60 cm × 60 cm board goes down. The cost of the 4-circle game on a 60 cm × 60 cm board goes down. All others cost more.