GRADE 7 MATHEMATICS STRAND 5 DATA AND …fode.education.gov.pg/courses/Mathematics/Grade...
136
GR 7 MATHEMATICS S5 1 TITLE PAGE GRADE 7 MATHEMATICS STRAND 5 DATA AND CHANCE SUB-STRAND 1: STATISTICAL DATA SUB-STRAND 2: SETS SUB-STRAND 3: CHANCE AND PROBABILITY SUB-STRAND 4: ERROR AND ACCURACY
Transcript of GRADE 7 MATHEMATICS STRAND 5 DATA AND …fode.education.gov.pg/courses/Mathematics/Grade...
GR 7 MATHEMATICS S5 1 TITLE PAGE
GRADE 7
MATHEMATICS
STRAND 5
DATA AND CHANCE
SUB-STRAND 1: STATISTICAL DATA SUB-STRAND 2: SETS SUB-STRAND 3: CHANCE AND PROBABILITY SUB-STRAND 4: ERROR AND ACCURACY
GR 7 MATHEMATICS S5 2 ACKNOWLEDGEMENTS Finalized and compiled by: Mathematics Department Published in 2016
Flexible Open and Distance Education Papua New Guinea
@ Copyright 2016, Department of Education Papua New Guinea All rights reserved. No part of this publication may be reproduced, stored in a retrieval system, or transmitted in any form or by any means electronic, mechanical, photocopying, recording or any other form of reproduction by any process is allowed without the prior permission of the publisher. ISBN: 978 - 9980 - 87- 247 - 0 National Library Services of Papua New Guinea Printed by the Flexible, Open and Distance Education
Acknowledgements We acknowledge the contributions of all Secondary and Upper Primary Teachers who in one way or another helped to develop this Course. Special thanks to the Staff of the mathematics Department of FODE who played active role in coordinating writing workshops, outsourcing lesson writing and editing processes, involving selected teachers of Madang, Central Province and NCD. We also acknowledge the professional guidance provided by the Curriculum Development and Assessment Division throughout the processes of writing and, the services given by the members of the Mathematics Review and Academic Committees. The development of this book was co-funded by GoPNG and World Bank.
MR. DEMAS TONGOGO
Principal- FODE .
GR 7 MATHEMATICS S5 3 CONTENTS
CONTENTS Page
Contents…………………………………………………………………………………………... Secretary‟s Message……………………………………………………………………………. Strand Introduction………………………………………………………………………………. Study Guide………………………………………………………………………………………. SUB-STRAND 1: STATISTICAL DATA……………………………………….……….....
Lesson 1: Tables………………………………………………………….………… Lesson 2: Graphs……………………………………………………………….…... Lesson 3: Drawing Graphs……………………………………………….………... Lesson 4: Measures of Central Tendency……………………………………...... Lesson 5: Simple and Ungrouped Frequency Distribution……………..………. Lesson 6: The Histogram and The Frequency Polygon……………..………..... Summary………………………………………………..………………. Answers to Practice Exercises 1-6…………………………………….
SUB-STRAND 2: SETS………………………………………………………….................
Lesson 7: Meaning of Set………………………………..……………………..….. Lesson 8: Kinds of Set……………………………………………………………… Lesson 9: Union and Intersection of Set……………………………….………… Lesson 10: The Venn Diagram………………………………………….................. Lesson 11: Methods of Classification……………………………………………… Summary………………………………………………………………… Answers to Practice Exercises 7-11.…….………………….….........
SUB-STRAND 3: CHANCE AND PROBABILITY………………………………………..
Lesson 12: Chance………………………………………………………………..…. Lesson 13: Probability……………………………………………………….…….... Lesson 14: Sample Space………………………………………………………..... Lesson 15: Equally Likely Outcomes..……………… ……………………………. Lesson 16: Sum of Probability……………………………………………………… Lesson 17: Complementary Events………………………………….…………..... Summary………………………………………………….……..……… Answers to Practice Exercises 12-17………………….……..………
SUB-STRAND 4: ERROR AND ACCURACY………………………….………..……….
Lesson 18: Errors from Scale Drawings………………………….……...………… Lesson 19: Errors due to Tools Used……………………………...………….….... Lesson 20: Errors due to Incompetence…………………………………………… Lesson 21: Errors due to Condition of the Materials………..………….………… Lesson 22: Errors caused by Calculation…………………………….………........ Lesson 23: Using Appropriate Measuring Tools……….……...………………….. Summary………………………………………………………………… Answers to Practice Exercises 18-23……….………..………………
REFERENCES………………………………………………………………………………...
3 4 5 6
7 9 12 21 31 35 39 43 44
51 53 57 63 66 70 74 75
79 81 84 88 92 96
100 103 104
107 109 115 119 124 126 129 133 134
136

GR 7 MATHEMATICS S5 4 MESSAGE SECRETARY’S MESSAGE Achieving a better future by individual students and their families, communities or the nation as a whole, depends on the kind of curriculum and the way it is delivered. This course is part and parcel of the new reformed curriculum. The learning outcomes are student-centered with demonstrations and activities that can be assessed. It maintains the rationale, goals, aims and principles of the national curriculum and identifies the knowledge, skills, attitudes and values that students should achieve. This is a provision by Flexible, Open and Distance Education as an alternative pathway of formal education. The course promotes Papua New Guinea values and beliefs which are found in our Constitution and Government Policies. It is developed in line with the National Education Plans and addresses an increase in the number of school leavers as a result of lack of access to secondary and higher educational institutions. Flexible, Open and Distance Education curriculum is guided by the Department of Education‟s Mission which is fivefold:
to facilitate and promote the integral development of every individual to develop and encourage an education system that satisfies the requirements
of Papua New Guinea and its people to establish, preserve and improve standards of education throughout Papua
New Guinea to make the benefits of such education available as widely as possible to al of
the people to make the education accessible to the poor and physically, mentally and
socially handicapped as well as to those who are educationally disadvantaged. The college is enhanced through this course to provide alternative and comparable pathways for students and adults to complete their education through a one system, two pathways and same outcomes. It is our vision that Papua New Guineans‟ harness all appropriate and affordable technologies to pursue this program. I commend all the teachers, curriculum writers and instructional designers who have contributed towards the development of this course.
GR 7 MATHEMATICS S5 5 INTRODUCTION STRAND 5: DATA AND CHANCE Introduction
Dear Student, This is the fifth Strand of the Grade 7 Mathematics Course. It is based on the NDOE Upper Primary Mathematics Syllabus and Curriculum framework for Grade 7. This Strand consists of four Sub-strands:
Sub-strand 1: Statistical Data Sub-strand 2: Sets
Sub-strand 3: Chance and Probability Sub-strand 4: Errors and Accuracy Sub-strand 1 – Statistical data – You will compare sets of data. Sub-strand 2 – Sets – You will classify objects using a variety of classification methods Sub-strand 3 – Chance and Probability – You will calculate probability from individual events Sub-strand 4 – Error and Accuracy – You will discuss sources of error meaningfully and apply strategies to reduce error. You will find that each lesson has reading materials to study, worked examples to help you, and a Practice Exercise. The answers to practice exercises are given at the end of each sub-strand. All the lessons are written in simple language with comic characters to guide you and many worked examples to help you. The practice exercises are graded to help you learn the process of working out problems. We hope you enjoy going through the material in this Stand. All the best! Mathematics Department FODE
GR 7 MATHEMATICS S5 6 STUDY GUIDE STUDY GUIDE Follow the steps given below as you work through the Strand. Step 1: Start with SUB-STRAND 1 Lesson 1 and work through it. Step 2: When you complete Lesson 1, do Practice Exercise 1.
Step 3: After you have completed Practice Exercise 1, check your work. The answers are given at the end of SUB-STRAND 1.
Step 4: Then, revise Lesson 1 and correct your mistakes, if any. Step 5: When you have completed all these steps, tick the check-box for
Lesson, on the Contents Page (page 3). Like this: √ Lesson 1: Tables
Then go on to the next Lesson. Repeat the same process until you complete all of the lessons in Sub-strand 1.
Step 6: Revise the Sub-strand using Sub-strand 1 Summary, then do Sub-strand test 1 in Assignment 5.
Then go on to the next Sub-strand. Repeat the same process until you complete all of the four Sub-strands in Strand 5. Assignment: (Four Sub-strand Tests and a Strand Test) When you have revised each Sub-strand using the Sub-strand Summary, do the Sub-strand Test for that Sub-strand in your assignment. The Strand book tells you when to do each Sub-strand Test. When you have completed the four Sub-strand Tests, revise well and do the Strand Test. The Assignment tells you when to do the Strand Test. Remember, if you fail by scoring less than 50% in three Assignments, your enrolment will be cancelled. So work carefully and make sure that you pass all of the Assignments.
As you complete each lesson, tick the check-box for that lesson, in the Content‟s page 3, like this √ .This helps you to check on your progress.
The Sub-strand Tests and the Strand Test in the Assignment will be marked by your Distance Teacher. The marks you score in each Assignment will count towards your final mark. If you score less than 50%, you will repeat that Assignment.
GR 7 MATHEMATICS S5 7 SS1 TITLE
SUB-STRAND 1
STATISTICAL DATA
Lesson 1: Tables
Lesson 2: Graphs
Lesson 3: Drawing Graphs
Lesson 4: Measures of Central Tendency
Lesson 5: Simple or Ungrouped Frequency Distribution
Lesson 6: The Histogram and Frequency Polygon
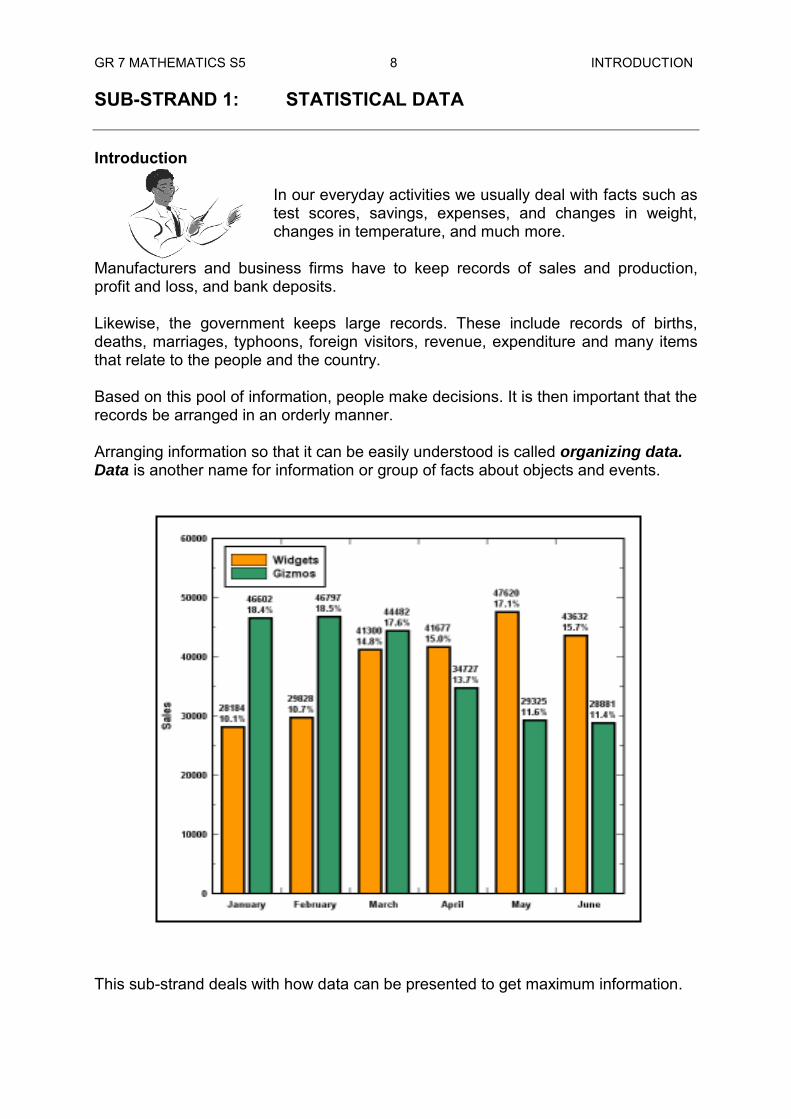
GR 7 MATHEMATICS S5 8 INTRODUCTION SUB-STRAND 1: STATISTICAL DATA Introduction
In our everyday activities we usually deal with facts such as test scores, savings, expenses, and changes in weight, changes in temperature, and much more.
Manufacturers and business firms have to keep records of sales and production, profit and loss, and bank deposits. Likewise, the government keeps large records. These include records of births, deaths, marriages, typhoons, foreign visitors, revenue, expenditure and many items that relate to the people and the country. Based on this pool of information, people make decisions. It is then important that the records be arranged in an orderly manner. Arranging information so that it can be easily understood is called organizing data. Data is another name for information or group of facts about objects and events. This sub-strand deals with how data can be presented to get maximum information.
GR 7 MATHEMATICS S5 9 SS1 LESSON 1 Lesson 1: Tables
Welcome to Lesson 1 of your Strand 5 Sub-strand 1 book.
In this lesson you will:
define a table
present and organize a collection of data in a table
interpret data presented in a table
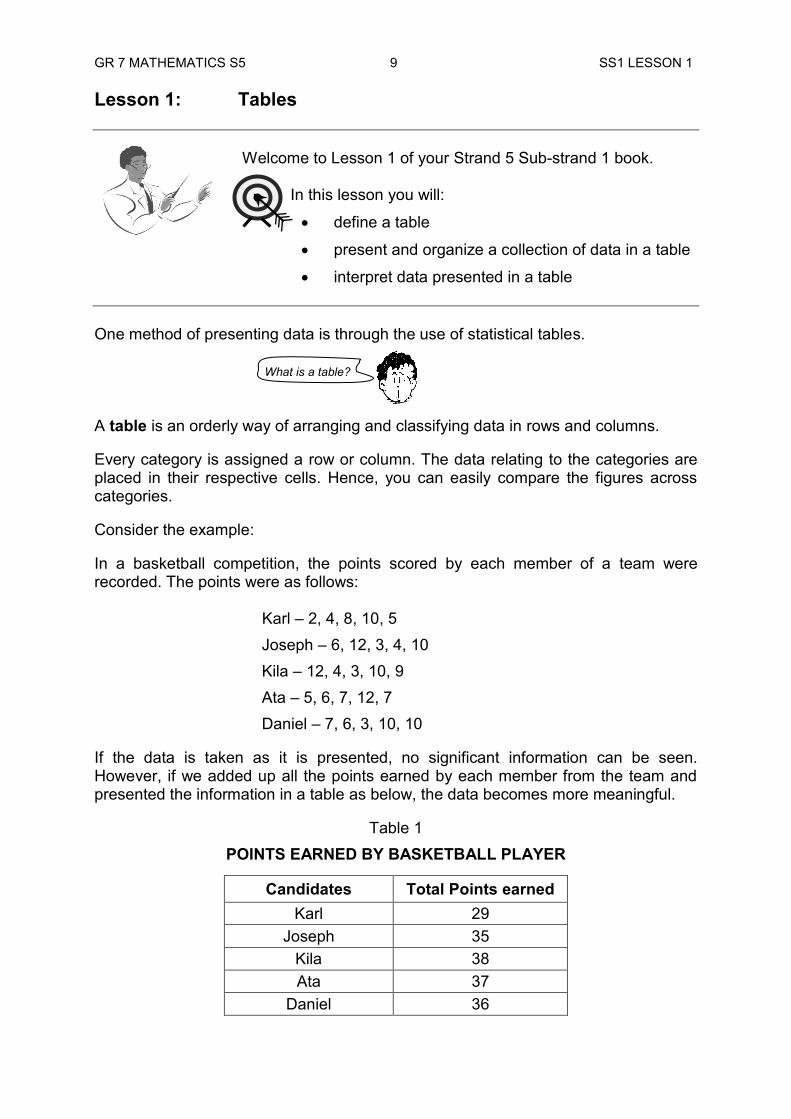
One method of presenting data is through the use of statistical tables. A table is an orderly way of arranging and classifying data in rows and columns. Every category is assigned a row or column. The data relating to the categories are placed in their respective cells. Hence, you can easily compare the figures across categories. Consider the example: In a basketball competition, the points scored by each member of a team were recorded. The points were as follows:
Karl – 2, 4, 8, 10, 5 Joseph – 6, 12, 3, 4, 10 Kila – 12, 4, 3, 10, 9 Ata – 5, 6, 7, 12, 7 Daniel – 7, 6, 3, 10, 10
If the data is taken as it is presented, no significant information can be seen. However, if we added up all the points earned by each member from the team and presented the information in a table as below, the data becomes more meaningful.
Table 1 POINTS EARNED BY BASKETBALL PLAYER
Candidates Total Points earned Karl 29
Joseph 35 Kila 38 Ata 37
Daniel 36
What is a table?
GR 7 MATHEMATICS S5 10 SS1 LESSON 1 Now, you are in a better position to answer the following questions:
1. Who was the top player in the games? 2. Among the five members, who got the lowest number of points? 3. What is the total number of points by the five team members?
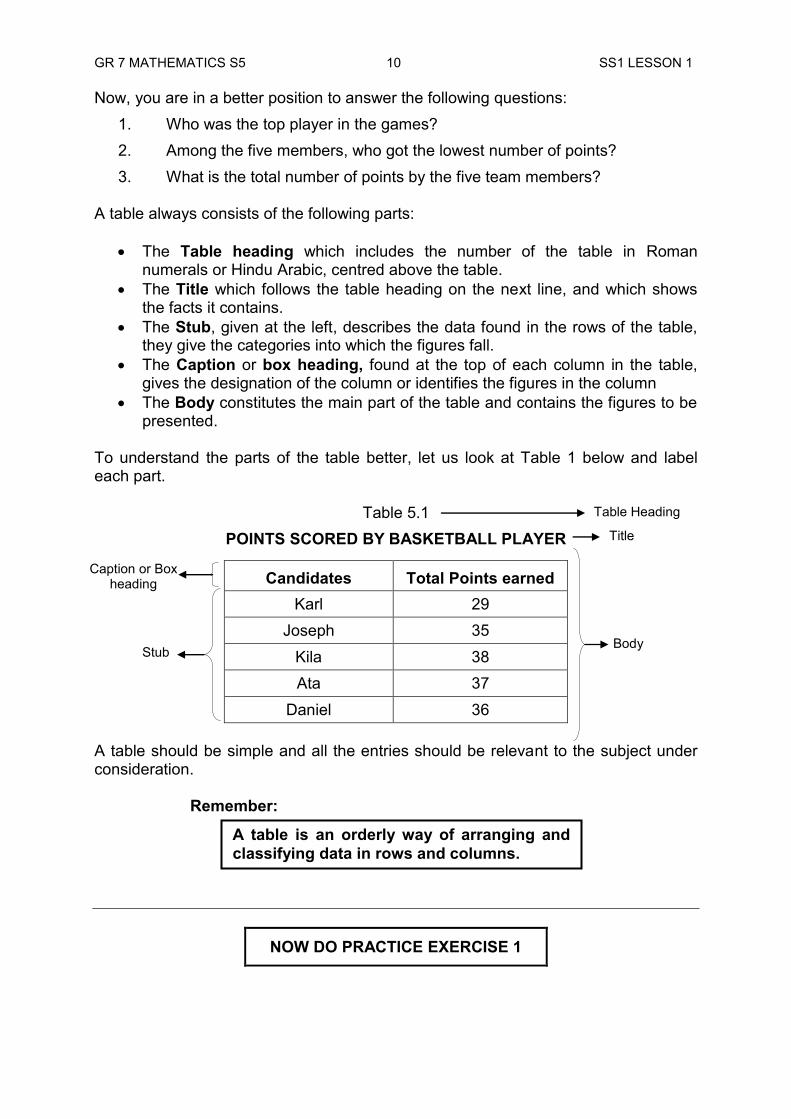
A table always consists of the following parts:
The Table heading which includes the number of the table in Roman numerals or Hindu Arabic, centred above the table.
The Title which follows the table heading on the next line, and which shows the facts it contains.
The Stub, given at the left, describes the data found in the rows of the table, they give the categories into which the figures fall.
The Caption or box heading, found at the top of each column in the table, gives the designation of the column or identifies the figures in the column
The Body constitutes the main part of the table and contains the figures to be presented.
To understand the parts of the table better, let us look at Table 1 below and label each part.
Table 5.1 POINTS SCORED BY BASKETBALL PLAYER
Candidates Total Points earned Karl 29
Joseph 35 Kila 38 Ata 37
Daniel 36 A table should be simple and all the entries should be relevant to the subject under consideration. Remember:
NOW DO PRACTICE EXERCISE 1
A table is an orderly way of arranging and classifying data in rows and columns.
Table Heading
Title
Caption or Box heading
Stub Body
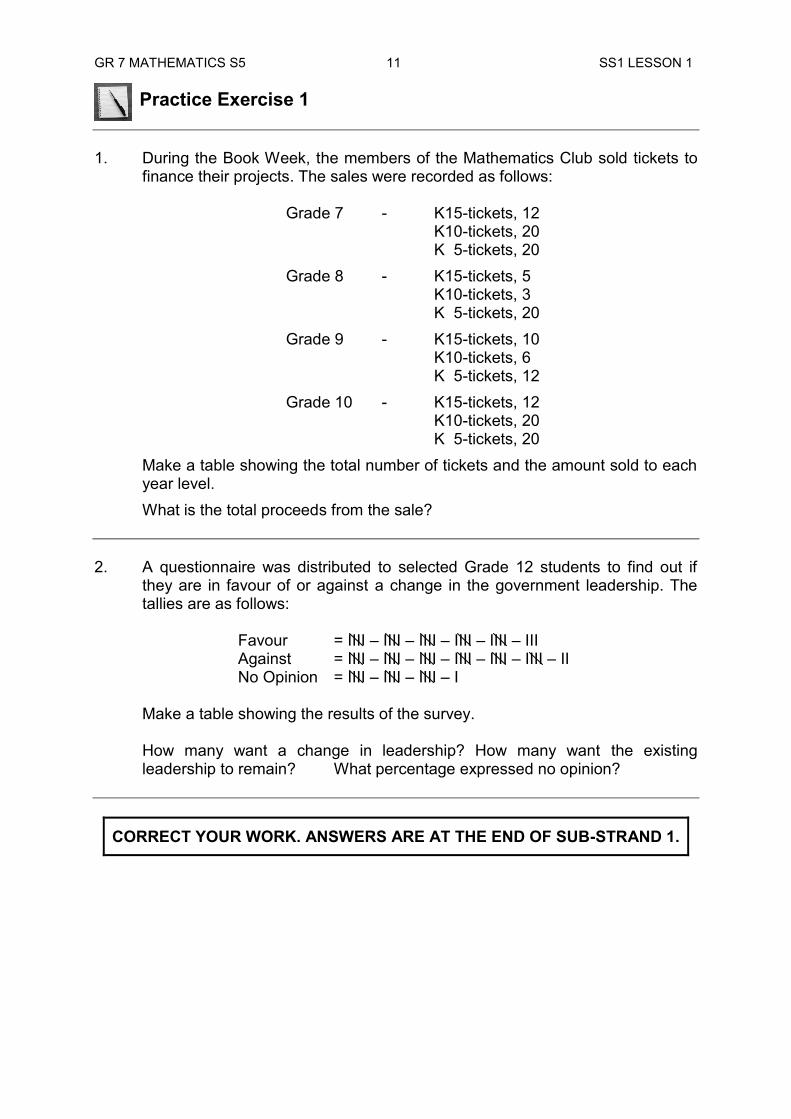
GR 7 MATHEMATICS S5 11 SS1 LESSON 1 Practice Exercise 1 1. During the Book Week, the members of the Mathematics Club sold tickets to
finance their projects. The sales were recorded as follows: Grade 7 - K15-tickets, 12 K10-tickets, 20 K 5-tickets, 20 Grade 8 - K15-tickets, 5 K10-tickets, 3 K 5-tickets, 20 Grade 9 - K15-tickets, 10 K10-tickets, 6 K 5-tickets, 12 Grade 10 - K15-tickets, 12 K10-tickets, 20 K 5-tickets, 20
Make a table showing the total number of tickets and the amount sold to each year level. What is the total proceeds from the sale?
2. A questionnaire was distributed to selected Grade 12 students to find out if
they are in favour of or against a change in the government leadership. The tallies are as follows:
Favour = IIII – IIII – IIII – IIII – IIII – III Against = IIII – IIII – IIII – IIII – IIII – IIII – II No Opinion = IIII – IIII – IIII – I Make a table showing the results of the survey. How many want a change in leadership? How many want the existing
leadership to remain? What percentage expressed no opinion?
CORRECT YOUR WORK. ANSWERS ARE AT THE END OF SUB-STRAND 1.
GR 7 MATHEMATICS S5 12 SS1 LESSON 2 Lesson 2: Graphs
In the previous lesson, you have learnt what a table is and how to present and interpret collection of data using a table.
In this lesson you will:
identify the different kinds of graphs present and organize data using graphs read and interpret graphs.
A statistical table is a way of presenting data. However, it may not be “eye-catching”, or as easy to interpret as data presented through pictures. Sets of data can also be organized and presented by graphical forms or graphs.
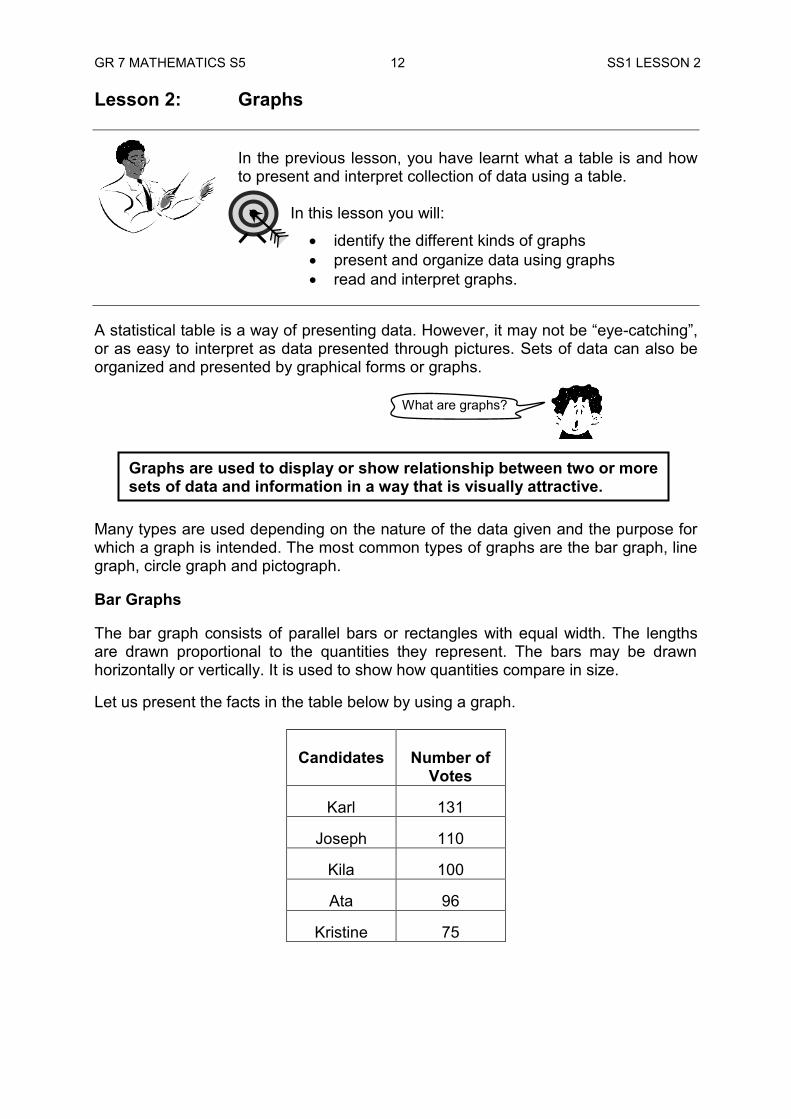
Many types are used depending on the nature of the data given and the purpose for which a graph is intended. The most common types of graphs are the bar graph, line graph, circle graph and pictograph. Bar Graphs The bar graph consists of parallel bars or rectangles with equal width. The lengths are drawn proportional to the quantities they represent. The bars may be drawn horizontally or vertically. It is used to show how quantities compare in size. Let us present the facts in the table below by using a graph.
Candidates
Number of Votes
Karl
131
Joseph
110
Kila
100
Ata
96
Kristine
75
What are graphs?
Graphs are used to display or show relationship between two or more sets of data and information in a way that is visually attractive.
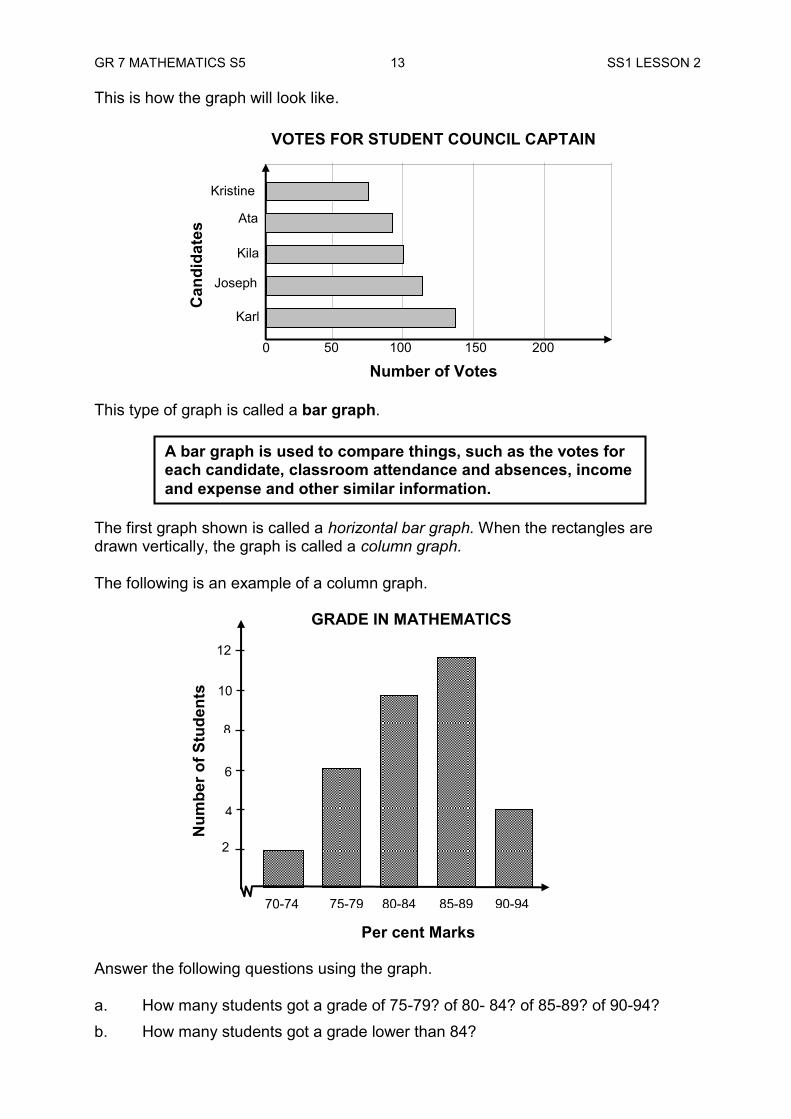
GR 7 MATHEMATICS S5 13 SS1 LESSON 2 This is how the graph will look like.
This type of graph is called a bar graph. The first graph shown is called a horizontal bar graph. When the rectangles are drawn vertically, the graph is called a column graph. The following is an example of a column graph. Answer the following questions using the graph. a. How many students got a grade of 75-79? of 80- 84? of 85-89? of 90-94? b. How many students got a grade lower than 84?
A bar graph is used to compare things, such as the votes for each candidate, classroom attendance and absences, income and expense and other similar information.
Per cent Marks
Can
dida
tes
VOTES FOR STUDENT COUNCIL CAPTAIN
Number of Votes 0 50 100 150 200
Kristine
Ata
Karl
Kila
Joseph
90-94 85-89 80-84 75-79 70-74
12
10
8
6
4
2
Num
ber o
f Stu
dent
s
GRADE IN MATHEMATICS
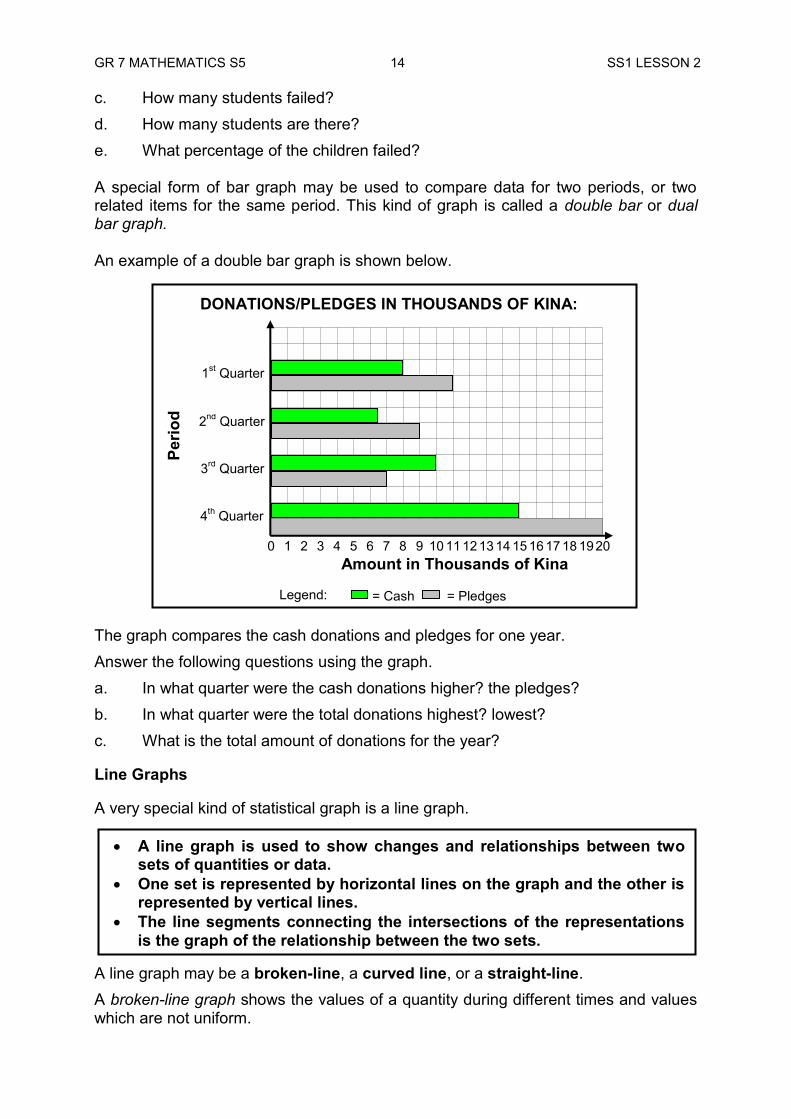
GR 7 MATHEMATICS S5 14 SS1 LESSON 2 c. How many students failed? d. How many students are there? e. What percentage of the children failed? A special form of bar graph may be used to compare data for two periods, or two related items for the same period. This kind of graph is called a double bar or dual bar graph. An example of a double bar graph is shown below. The graph compares the cash donations and pledges for one year. Answer the following questions using the graph. a. In what quarter were the cash donations higher? the pledges? b. In what quarter were the total donations highest? lowest? c. What is the total amount of donations for the year? Line Graphs A very special kind of statistical graph is a line graph.
A line graph may be a broken-line, a curved line, or a straight-line. A broken-line graph shows the values of a quantity during different times and values which are not uniform.
A line graph is used to show changes and relationships between two sets of quantities or data.
One set is represented by horizontal lines on the graph and the other is represented by vertical lines.
The line segments connecting the intersections of the representations is the graph of the relationship between the two sets.
DONATIONS/PLEDGES IN THOUSANDS OF KINA: 2010
13 14 15 16 17 18 19 20 10 11 12 8 9 1 2 5 3 4 6 7 0
1st Quarter
2nd Quarter
3rd Quarter
4th Quarter
Legend: = Cash = Pledges
Perio
d
Amount in Thousands of Kina
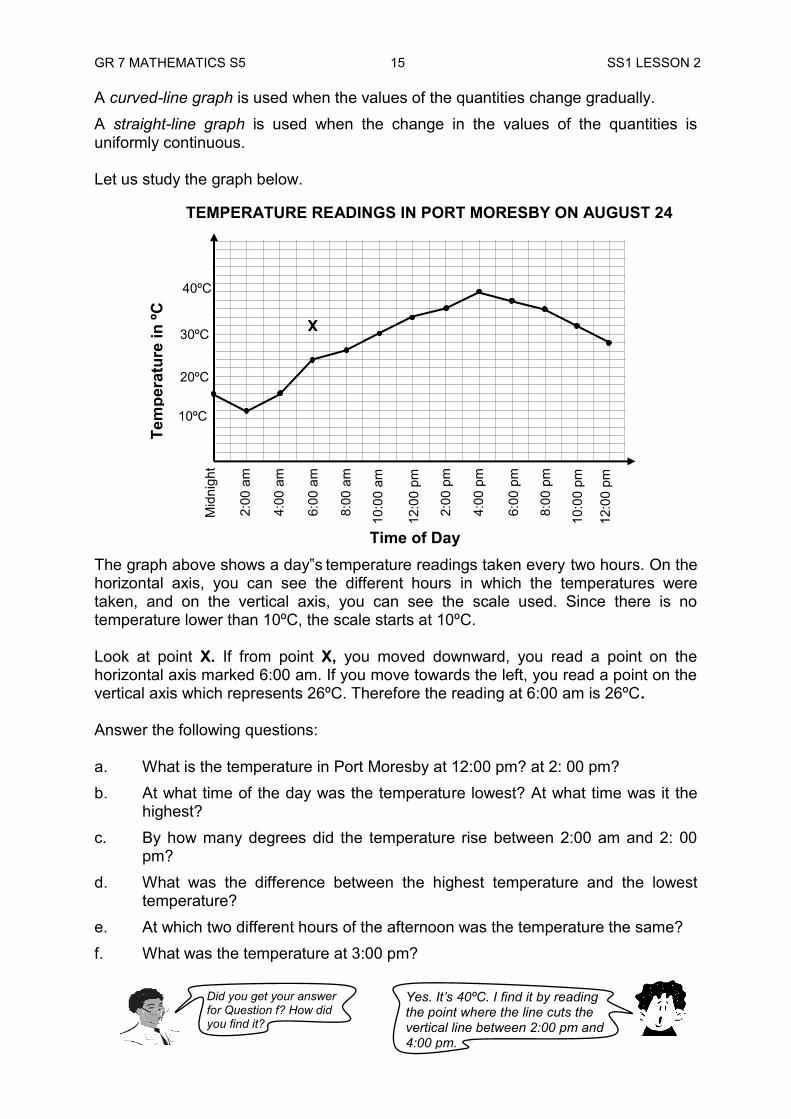
GR 7 MATHEMATICS S5 15 SS1 LESSON 2 A curved-line graph is used when the values of the quantities change gradually. A straight-line graph is used when the change in the values of the quantities is uniformly continuous. Let us study the graph below.
The graph above shows a day‟s temperature readings taken every two hours. On the horizontal axis, you can see the different hours in which the temperatures were taken, and on the vertical axis, you can see the scale used. Since there is no temperature lower than 10ºC, the scale starts at 10ºC. Look at point X. If from point X, you moved downward, you read a point on the horizontal axis marked 6:00 am. If you move towards the left, you read a point on the vertical axis which represents 26ºC. Therefore the reading at 6:00 am is 26ºC. Answer the following questions: a. What is the temperature in Port Moresby at 12:00 pm? at 2: 00 pm? b. At what time of the day was the temperature lowest? At what time was it the
highest? c. By how many degrees did the temperature rise between 2:00 am and 2: 00
pm? d. What was the difference between the highest temperature and the lowest
temperature? e. At which two different hours of the afternoon was the temperature the same? f. What was the temperature at 3:00 pm?
X
12:0
0 pm
8:00
pm
10:0
0 pm
2:00
am
Mid
nigh
t
40ºC
30ºC
20ºC
10ºC
4:00
am
6:00
am
8:00
am
10:0
0 am
12:0
0 pm
2:00
pm
4:00
pm
6:00
pm
TEMPERATURE READINGS IN PORT MORESBY ON AUGUST 24
Time of Day
Tem
pera
ture
in ºC
Yes. It’s 40ºC. I find it by reading the point where the line cuts the vertical line between 2:00 pm and 4:00 pm.
Did you get your answer for Question f? How did you find it?
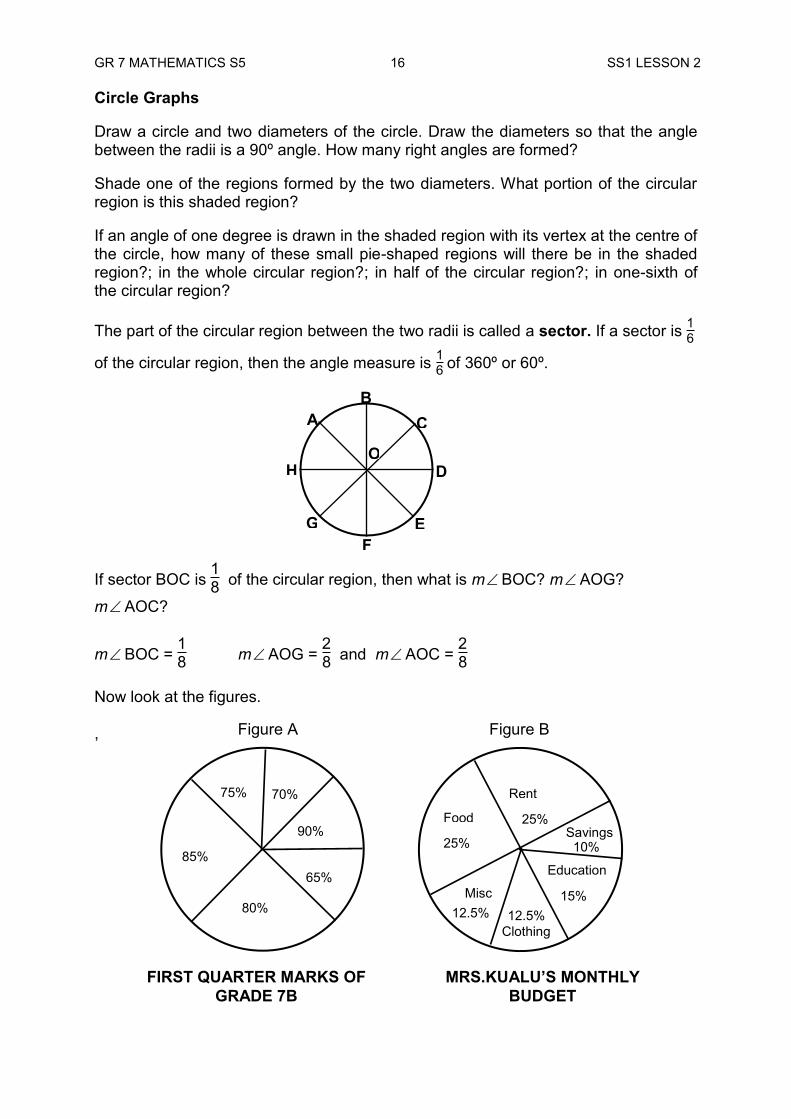
GR 7 MATHEMATICS S5 16 SS1 LESSON 2 Circle Graphs Draw a circle and two diameters of the circle. Draw the diameters so that the angle between the radii is a 90º angle. How many right angles are formed? Shade one of the regions formed by the two diameters. What portion of the circular region is this shaded region? If an angle of one degree is drawn in the shaded region with its vertex at the centre of the circle, how many of these small pie-shaped regions will there be in the shaded region?; in the whole circular region?; in half of the circular region?; in one-sixth of the circular region?
The part of the circular region between the two radii is called a sector. If a sector is 16
of the circular region, then the angle measure is 16 of 360º or 60º.
If sector BOC is 18 of the circular region, then what is mBOC? mAOG?
mAOC?
mBOC = 18 mAOG =
28 and mAOC =
28
Now look at the figures. ,
A B
H
C
G F
D
E
O
Figure A Figure B
85%
80%
75%
90%
70%
65%
FIRST QUARTER MARKS OF GRADE 7B
MRS.KUALU’S MONTHLY BUDGET
25%
15% 12.5% 12.5%
25% 10%
Food
Education
Clothing
Misc
Savings
Rent
GR 7 MATHEMATICS S5 17 SS1 LESSON 2 The figures on page 16 are circle graphs or pie graphs. Each graph consists of a circle which represents a whole or 100 percent. It is subdivided into sectors which look like pieces of pie, and whose sizes are proportional to the magnitude or percentage they represent. Each of these circle graphs shows the percentage distribution of a whole into each component parts. Let us analyse the figures on page 16. Figure A: First quarter marks for Grade 7B
a. What part of the class got 90%? 75%?
The sector representing 90% is 18 of the circle therefore 1
8 of the class scored 90%.
The sector representing 75% is 18 of the circle therefore 18 of the class
scored 75% b. If there are 40 students in Grade 7B, how many got a mark of 90%?
80%? 75%?
From (a) above 18 of the students scored 90% therefore 1
8 of 40 is 5. That means 5 students scored 90%. 28 of 40 students scored 80%, 2
8 of 40 is 10. This means 10 students scored 80%.
Then 18 of the students scored 75%, therefore 18 of 40 is 5. This means 5 students scored 75%.
Now answer the following questions on your own.
c. How many students failed to get a mark of 75%? What per cent of the class is this?
d. If the ratio of boys to girls is 2:3, 1. how many girls got a mark of 85%? 2. how many boys got a mark of 65%?
Figure B: Mrs. Kualu‟s Monthly Budget
a. What part of Mrs. Kualu‟s income is spent on food? on clothing? on rent? on education? on savings? on miscellaneous?
b. Write the different items in fraction form. c. If Mrs. Kualu‟s income is K2500, how much does she spend on education? d. How many times the miscellaneous expense is the rent expense?
A circle graph is used to show the relationship of a part to a whole quantity, such as the relationship between items of expenses and savings and income.
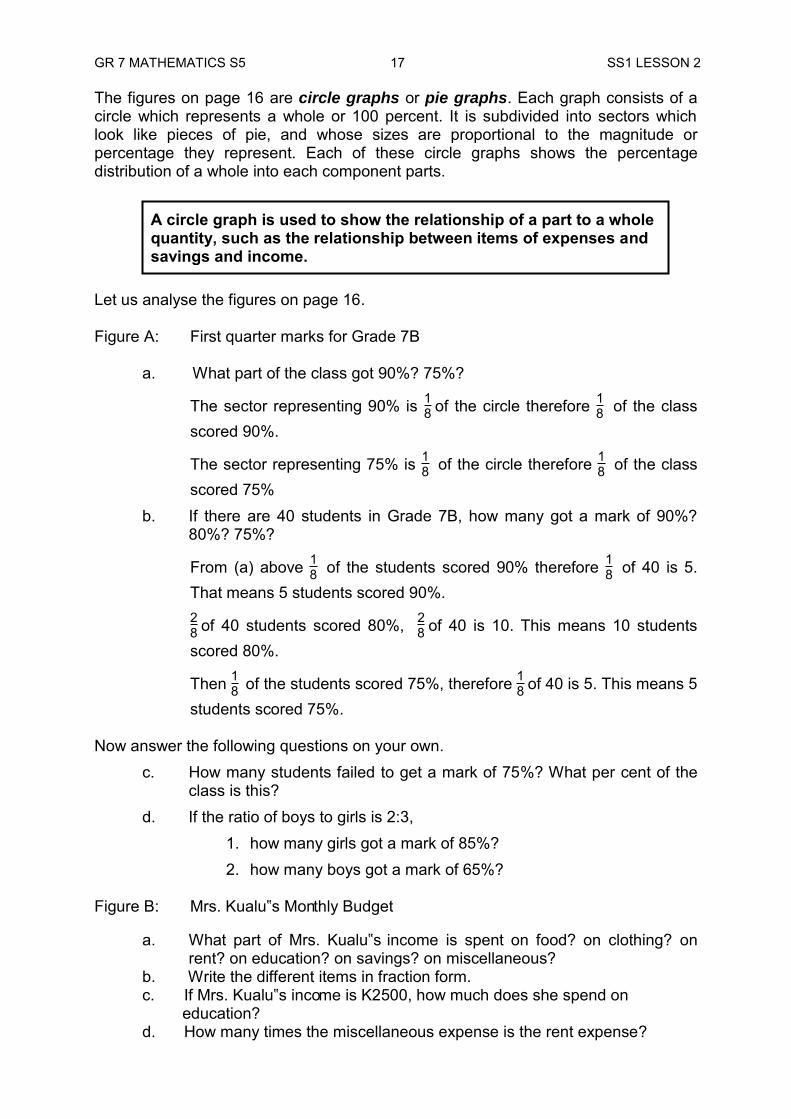
GR 7 MATHEMATICS S5 18 SS1 LESSON 2 PICTOGRAPHS
A student made a report on the number of ASEAN visitors that came to the Philippines in 2006. The record shows this distribution: Brunei – 2000 Indonesia – 5000, Malaysia – 12 000, Singapore – 18 000 Thailand – 8000 First he thought of drawing a bar graph to impress his teacher. Thinking, however, that the bar graph would not do the trick, he decided to draw pictures to replace the bars. His graph looked like the one above. Notice that each picture of a man represents 1000 visitors. The man or any other symbol chosen is the scale. Count how many visitors there are in each category. Other names for pictographs are picture graph and pictogram. Now let us recap. You should remember all these facts.
NOW DO PRACTICE EXERCISE 2
A pictograph is used to show pictures of the objects represented by the data. The pictograph can be used in place of any other graphs.
Brunei
Malaysia
Indonesia
Singapore
Thailand
= 1000
Graph is used to show the relationship between quantities through pictorial form. The most commonly used types of graphs are the bar graph, circle graph, line graph and pictograph.
The bar graph and circle graph are used to show the relative magnitude of different quantities.
Line graphs are used if the rate and direction of change of the quantities are considered. Line graphs may be broken-line, smooth curve or straight line graphs.
Pictographs use picture to represent a quantity.
GR 7 MATHEMATICS S5 19 SS1 LESSON 2
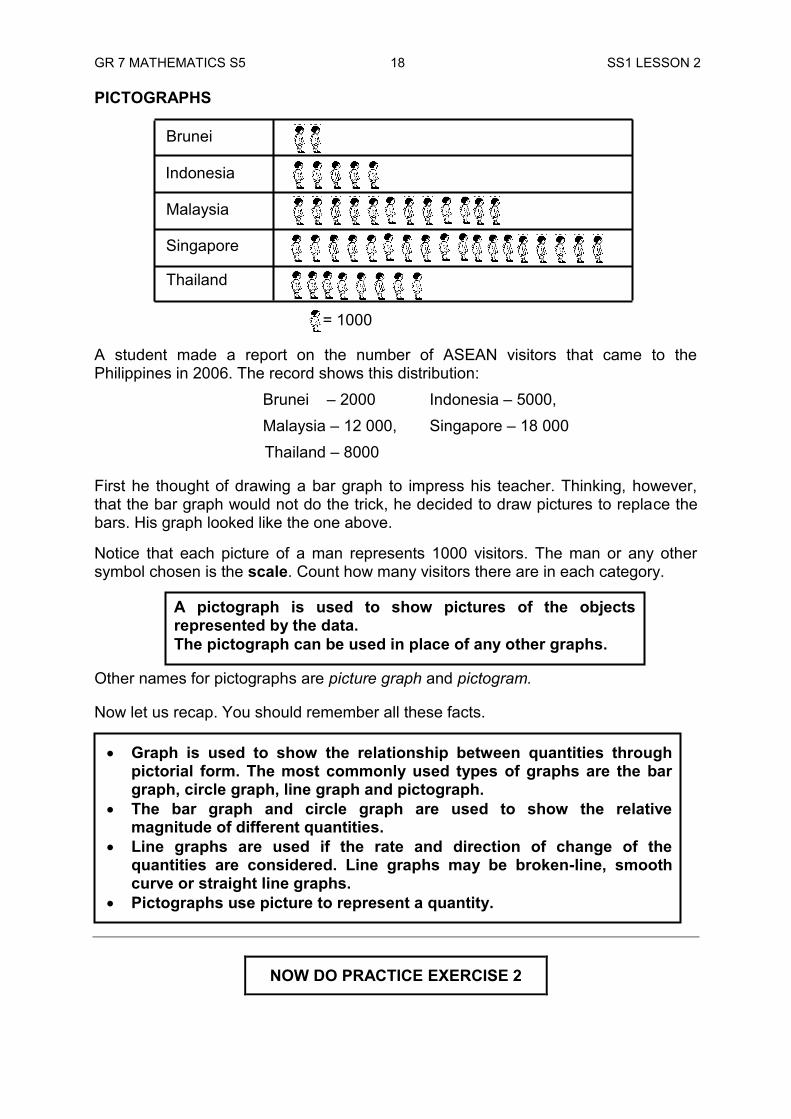
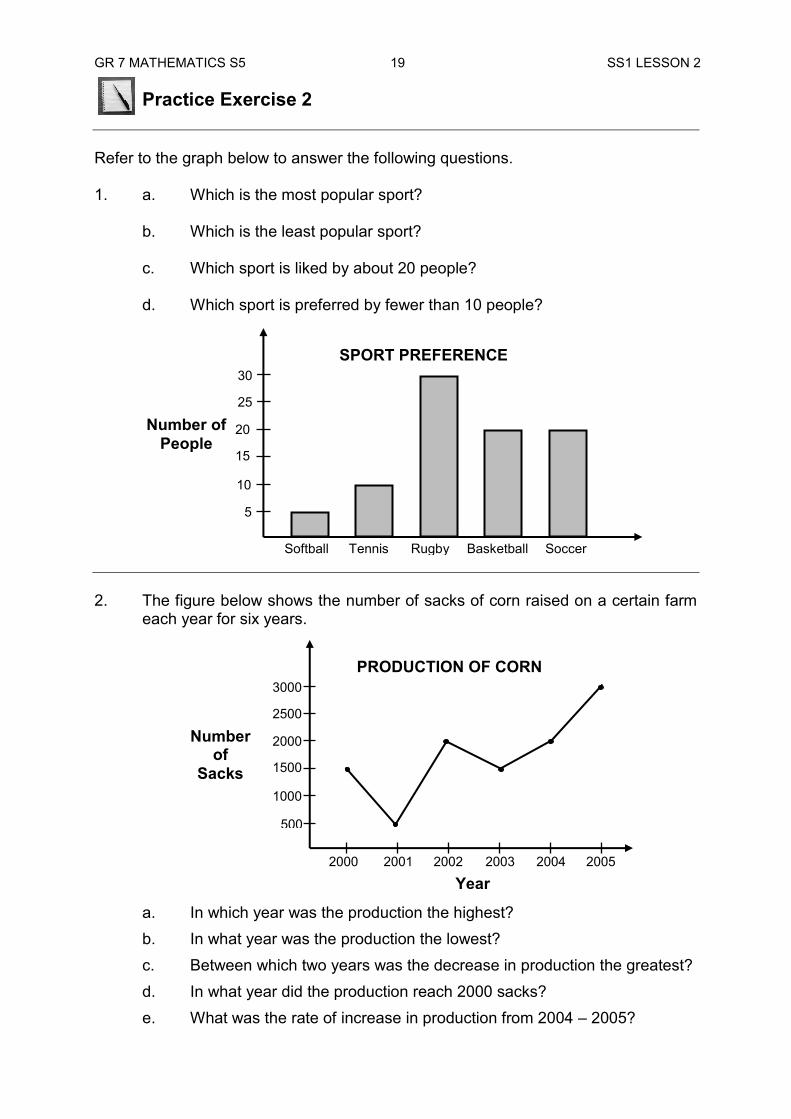
Practice Exercise 2 Refer to the graph below to answer the following questions. 1. a. Which is the most popular sport?
b. Which is the least popular sport?
c. Which sport is liked by about 20 people?
d. Which sport is preferred by fewer than 10 people? 2. The figure below shows the number of sacks of corn raised on a certain farm
each year for six years.
a. In which year was the production the highest? b. In what year was the production the lowest? c. Between which two years was the decrease in production the greatest? d. In what year did the production reach 2000 sacks? e. What was the rate of increase in production from 2004 – 2005?
Year
500
1000
1500
2000
3000
2500
2000 2001 2002 2003 2004
Number of
Sacks
PRODUCTION OF CORN
2005
5 5
10
15
20
3030 25
Softball Tennis Rugby Basketball Soccer
Number of People
SPORT PREFERENCE
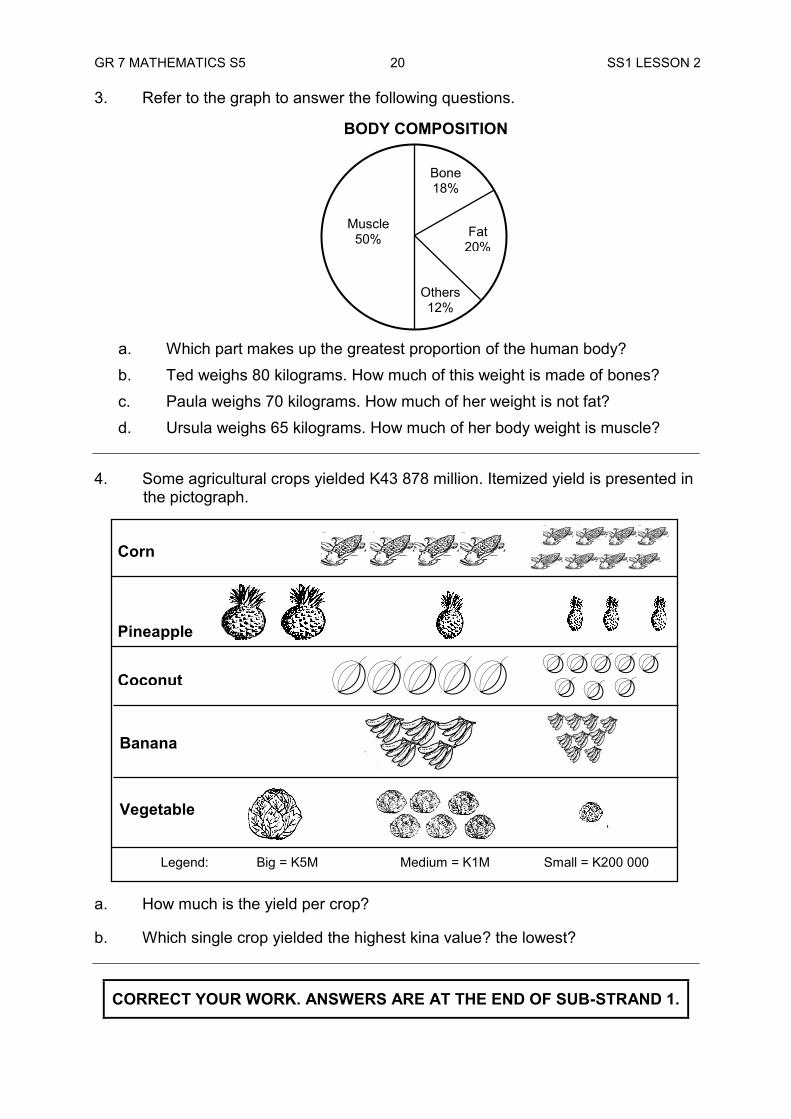
GR 7 MATHEMATICS S5 20 SS1 LESSON 2 3. Refer to the graph to answer the following questions.
a. Which part makes up the greatest proportion of the human body? b. Ted weighs 80 kilograms. How much of this weight is made of bones? c. Paula weighs 70 kilograms. How much of her weight is not fat? d. Ursula weighs 65 kilograms. How much of her body weight is muscle?
4. Some agricultural crops yielded K43 878 million. Itemized yield is presented in the pictograph. a. How much is the yield per crop? b. Which single crop yielded the highest kina value? the lowest?
CORRECT YOUR WORK. ANSWERS ARE AT THE END OF SUB-STRAND 1.
Muscle 50%
Bone18%
Fat 20%
Others 12%
BODY COMPOSITION
Legend: Big = K5M Medium = K1M Small = K200 000
Corn
Pineapple
Coconut
Banana
Vegetable
GR 7 MATHEMATICS S5 21 SS1 LESSON 3 Lesson 3: Drawing Graphs
In the previous lesson, you learnt the meaning of graph, the different kinds of graphs and their uses. In this lesson you will:
draw and construct graphs.
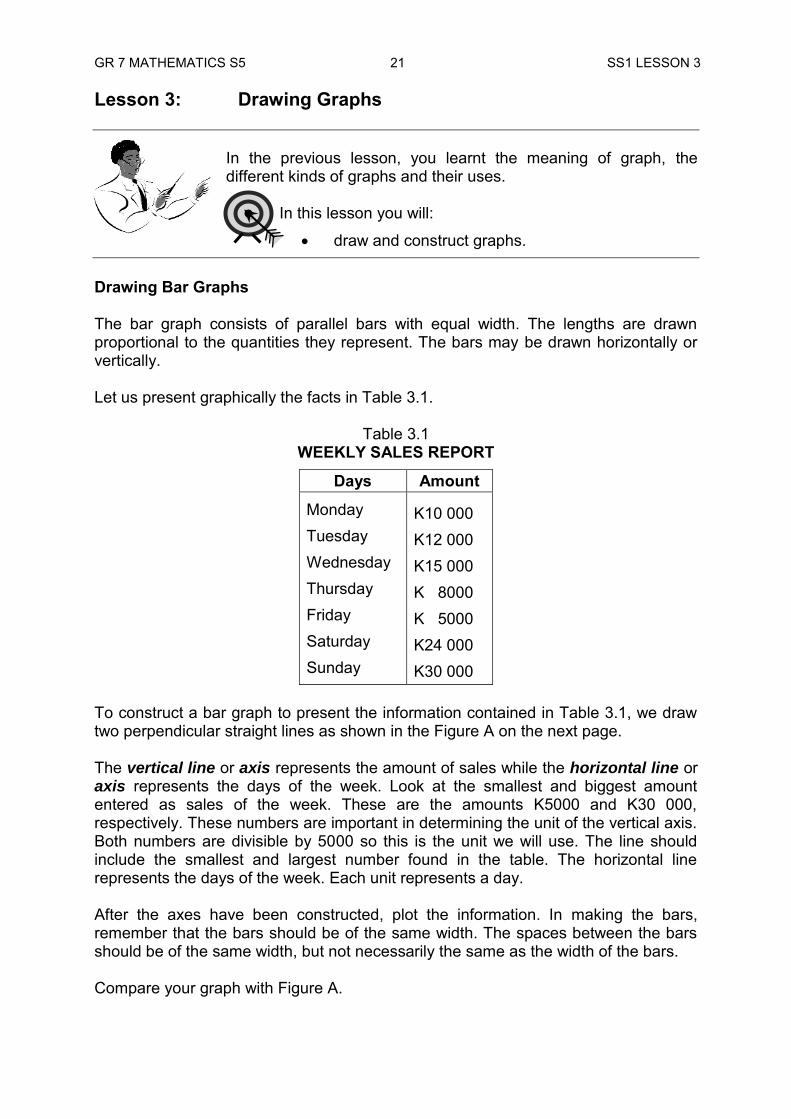
Drawing Bar Graphs The bar graph consists of parallel bars with equal width. The lengths are drawn proportional to the quantities they represent. The bars may be drawn horizontally or vertically. Let us present graphically the facts in Table 3.1.
Table 3.1 WEEKLY SALES REPORT
Days Amount
Monday Tuesday Wednesday Thursday Friday Saturday Sunday
K10 000 K12 000 K15 000 K 8000 K 5000 K24 000 K30 000
To construct a bar graph to present the information contained in Table 3.1, we draw two perpendicular straight lines as shown in the Figure A on the next page.
The vertical line or axis represents the amount of sales while the horizontal line or axis represents the days of the week. Look at the smallest and biggest amount entered as sales of the week. These are the amounts K5000 and K30 000, respectively. These numbers are important in determining the unit of the vertical axis. Both numbers are divisible by 5000 so this is the unit we will use. The line should include the smallest and largest number found in the table. The horizontal line represents the days of the week. Each unit represents a day. After the axes have been constructed, plot the information. In making the bars, remember that the bars should be of the same width. The spaces between the bars should be of the same width, but not necessarily the same as the width of the bars. Compare your graph with Figure A.
GR 7 MATHEMATICS S5 22 SS1 LESSON 3 Here is the figure.
Figure A
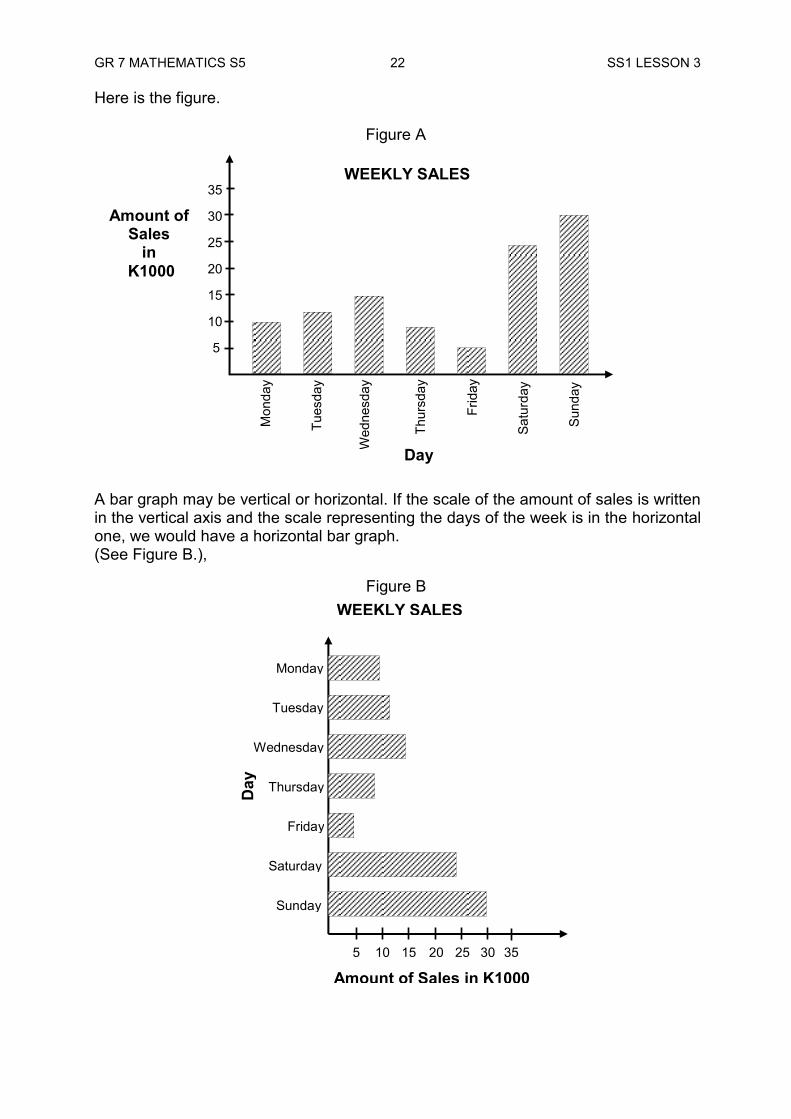
A bar graph may be vertical or horizontal. If the scale of the amount of sales is written in the vertical axis and the scale representing the days of the week is in the horizontal one, we would have a horizontal bar graph. (See Figure B.),
Amount of Sales
in K1000
Sund
ay
Mon
day
Tues
day
Wed
nesd
ay
Thur
sday
Frid
ay
Satu
rday
5
10
15
20
25
30
35
Day
WEEKLY SALES
Sunday
Monday
Tuesday
Wednesday
Thursday
Friday
Saturday
25 30 20 15 10 5 35
Day
Amount of Sales in K1000
WEEKLY SALES Figure B
GR 7 MATHEMATICS S5 23 SS1 LESSON 3 The following should be considered in constructing a bar graph. 1. Draw the two perpendicular straight axes. 2. Select a suitable scale for each axis and how it should be spaced. 3. Mark off equal spaces on the two axes and label the points. The smallest
number should start at the left for the horizontal scale and at the bottom for the vertical scale.
4. Draw the bars above or opposite the labels to which they refer. The bars should be of the same width and the spaces between them should all be the same. Since the lengths of the bars should be proportional to the sizes of the quantities they represent, choose an appropriate scale such that there will be enough space for the longest bar.
5. Give a brief title to the graph.
Activity 1
Construct a bar graph showing the following telephone calls that were received by a radio station during a stormy day.
Time of Day Number of calls 8:00 – 9:00 am 9:00 – 10:00 am 10:00 – 11:00 am 11:00 – 12:00 noon 12:00 – 1:00 pm 1:00 – 2:00 pm 2:00 – 3:00 pm 3:00 – 4:00 pm 4:00 – 5:00 pm
22 16 15 10 5 14 12 10 8
Drawing Pictographs (Picture Graphs) Pictographs are modification of bar graphs. Symbols are used to represent numbers. For example, a picture of a coin is often used to represent monetary expenditures. Using the data in Table 3.1 on page 21, follow the steps to construct your pictograph. Step 1: Decide on the symbol to be used. Step 2: Decide on your scale by figuring out how much one symbol will
represent. Do you need to use a part of a symbol to represent a group smaller than what a whole symbol represents?
Step 3: Draw the graph. Repeat the symbols as many times as required to show the size of each group.
Step 4: Write the scale used and the title of the graph. Step 5: Compare your pictograph with Figure C on the next page.
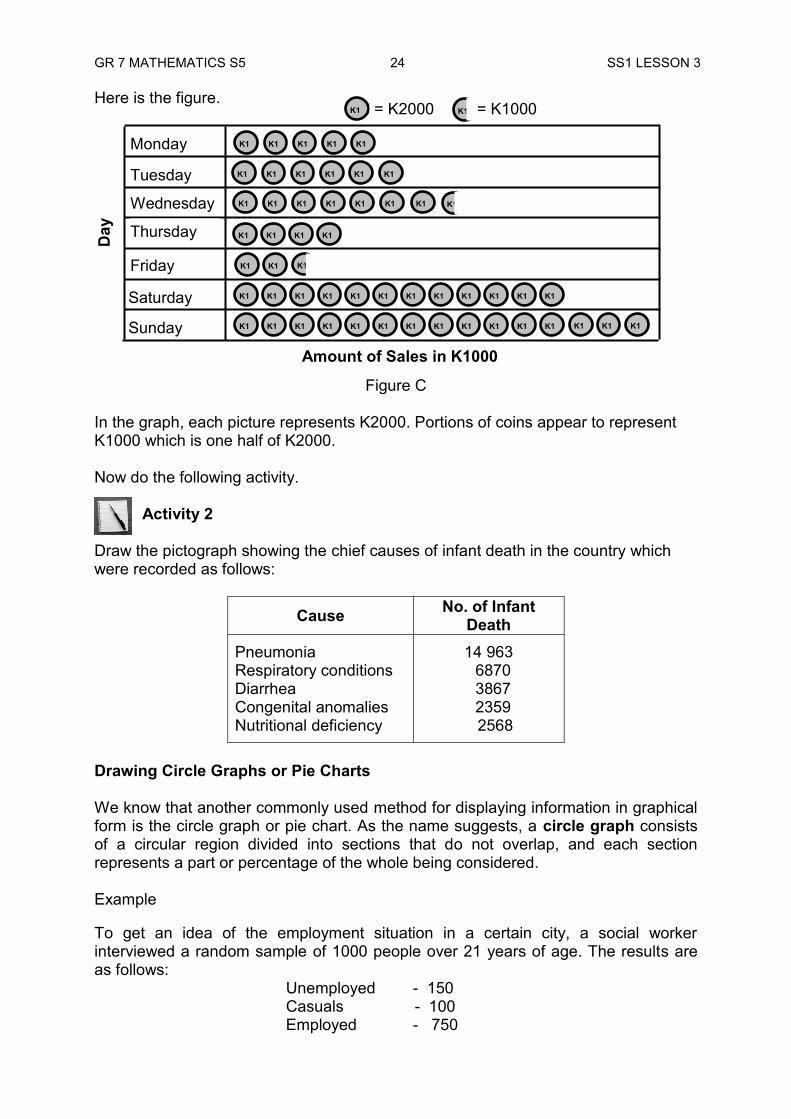
GR 7 MATHEMATICS S5 24 SS1 LESSON 3 Here is the figure.
Figure C
In the graph, each picture represents K2000. Portions of coins appear to represent K1000 which is one half of K2000. Now do the following activity. Activity 2 Draw the pictograph showing the chief causes of infant death in the country which were recorded as follows:
Cause No. of Infant Death
Pneumonia Respiratory conditions Diarrhea Congenital anomalies Nutritional deficiency
14 963 6870 3867 2359 2568
Drawing Circle Graphs or Pie Charts We know that another commonly used method for displaying information in graphical form is the circle graph or pie chart. As the name suggests, a circle graph consists of a circular region divided into sections that do not overlap, and each section represents a part or percentage of the whole being considered. Example To get an idea of the employment situation in a certain city, a social worker interviewed a random sample of 1000 people over 21 years of age. The results are as follows:
Unemployed - 150 Casuals - 100 Employed - 750
K1
K1 K1 K1
K1 K1 K1 K1 K1
K1 K1 K1 K1 K1 K1
K1 K1 K1 K1 K1 K1 K1 K1
K1
K1
K1 K1
K1 K1 K1 K1 K1 K1 K1 K1 K1 K1 K1 K1
K1 K1 K1 K1 K1 K1 K1 K1 K1 K1 K1 K1 K1 K1 K1
Monday
Tuesday
Wednesday
Thursday
Friday
Saturday
Sunday
Day
Amount of Sales in K1000
= K2000 K1 = K1000
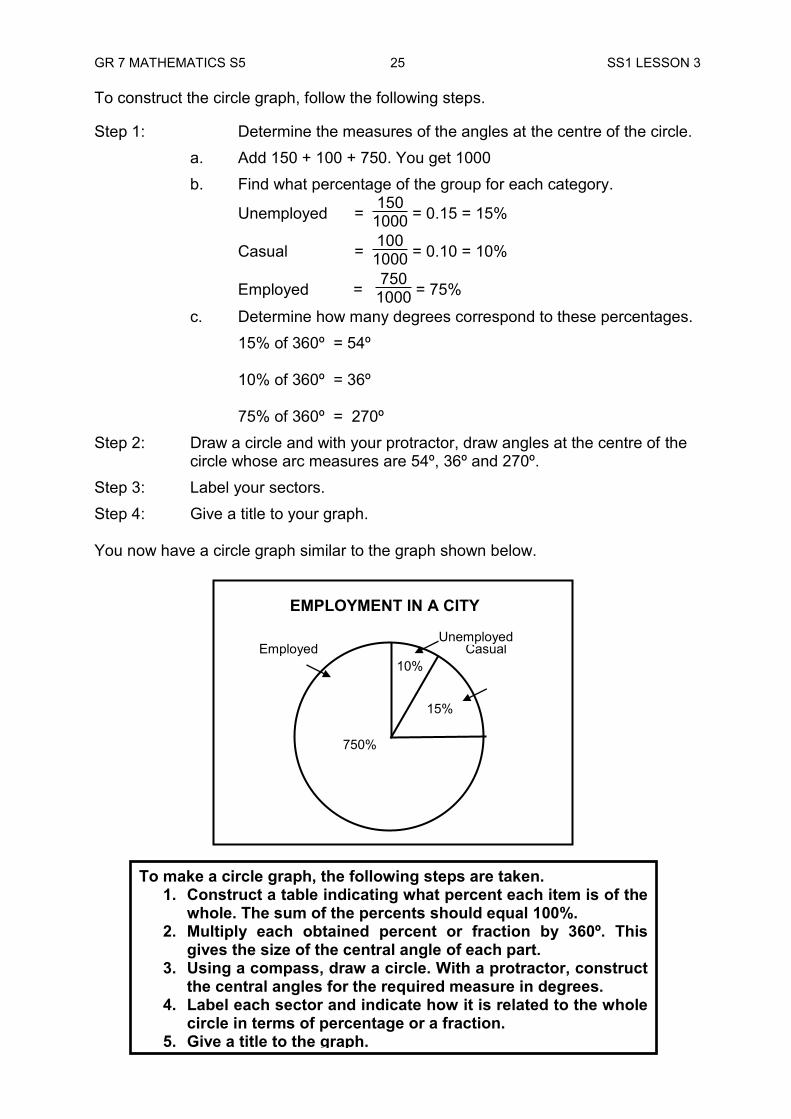
GR 7 MATHEMATICS S5 25 SS1 LESSON 3 To construct the circle graph, follow the following steps. Step 1: Determine the measures of the angles at the centre of the circle.
a. Add 150 + 100 + 750. You get 1000 b. Find what percentage of the group for each category.
Unemployed = 150
1000 = 0.15 = 15%
Casual = 1001000 = 0.10 = 10%
Employed = 750
1000 = 75%
c. Determine how many degrees correspond to these percentages. 15% of 360º = 54º 10% of 360º = 36º 75% of 360º = 270º
Step 2: Draw a circle and with your protractor, draw angles at the centre of the circle whose arc measures are 54º, 36º and 270º.
Step 3: Label your sectors. Step 4: Give a title to your graph. You now have a circle graph similar to the graph shown below.
To make a circle graph, the following steps are taken. 1. Construct a table indicating what percent each item is of the
whole. The sum of the percents should equal 100%. 2. Multiply each obtained percent or fraction by 360º. This
gives the size of the central angle of each part. 3. Using a compass, draw a circle. With a protractor, construct
the central angles for the required measure in degrees. 4. Label each sector and indicate how it is related to the whole
circle in terms of percentage or a fraction. 5. Give a title to the graph.
Casual
15%
10%
750%
Employed Unemployed
EMPLOYMENT IN A CITY
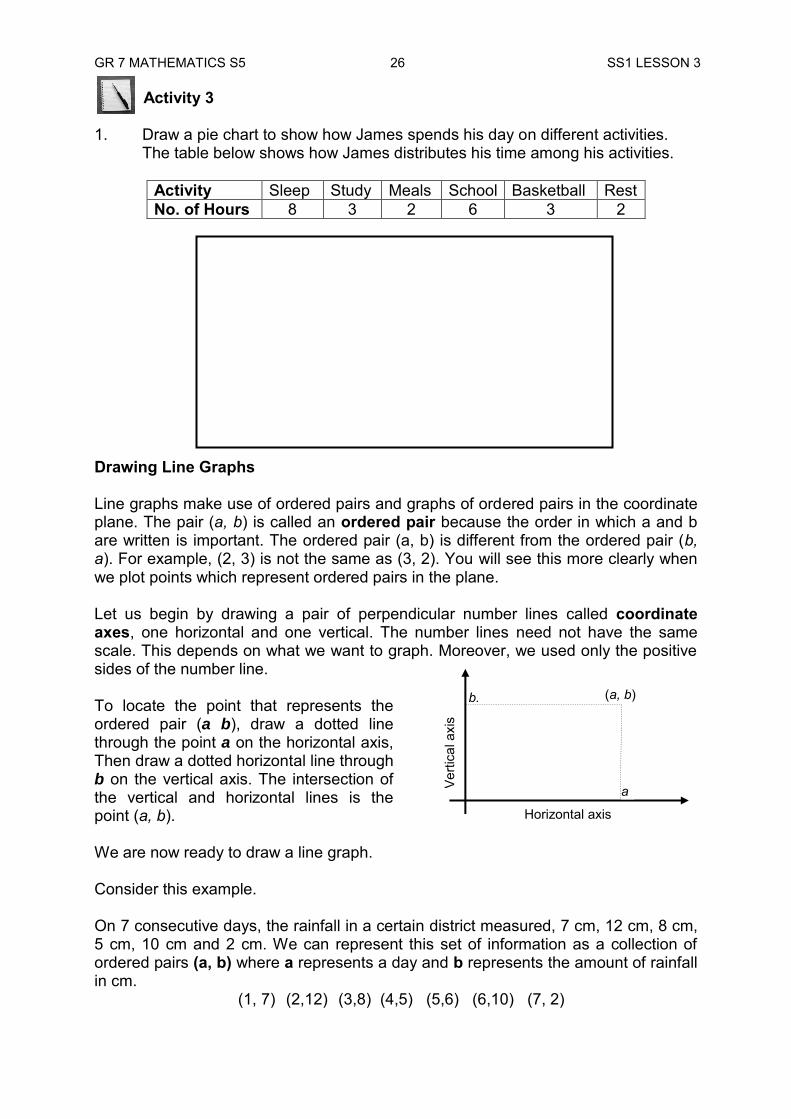
GR 7 MATHEMATICS S5 26 SS1 LESSON 3 Activity 3 1. Draw a pie chart to show how James spends his day on different activities.
The table below shows how James distributes his time among his activities.
Activity Sleep Study Meals School Basketball Rest No. of Hours 8 3 2 6 3 2
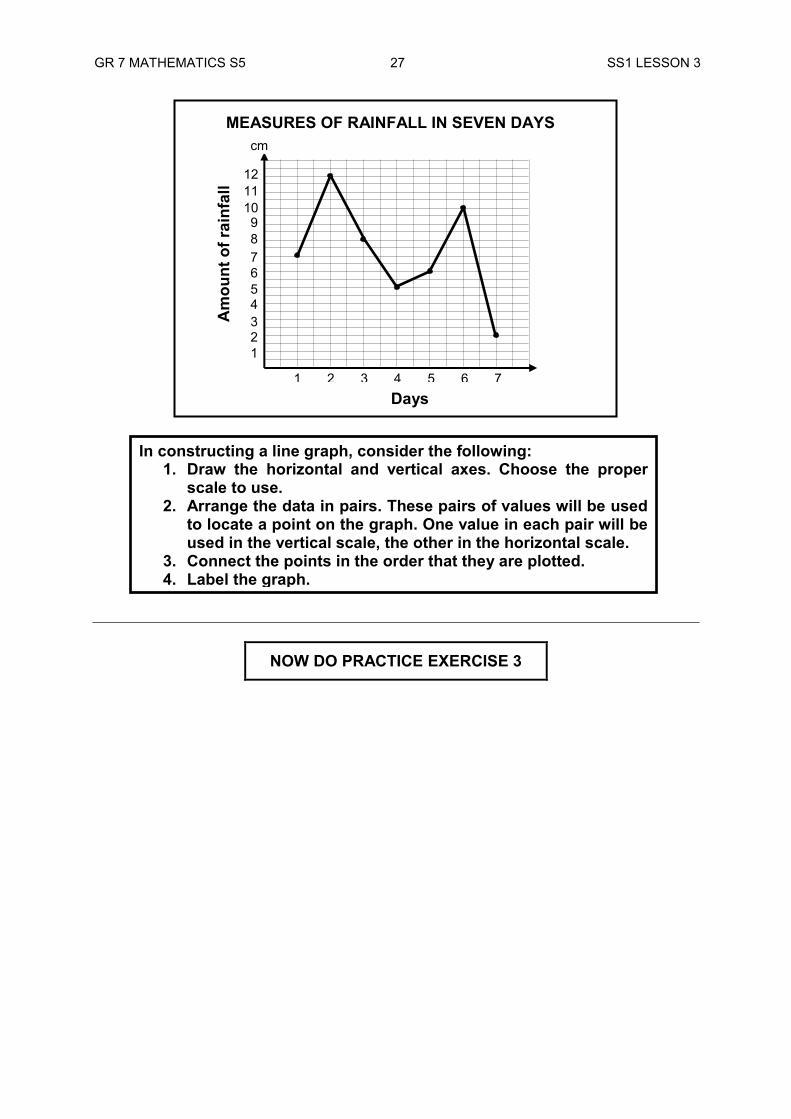
Drawing Line Graphs Line graphs make use of ordered pairs and graphs of ordered pairs in the coordinate plane. The pair (a, b) is called an ordered pair because the order in which a and b are written is important. The ordered pair (a, b) is different from the ordered pair (b, a). For example, (2, 3) is not the same as (3, 2). You will see this more clearly when we plot points which represent ordered pairs in the plane. Let us begin by drawing a pair of perpendicular number lines called coordinate axes, one horizontal and one vertical. The number lines need not have the same scale. This depends on what we want to graph. Moreover, we used only the positive sides of the number line. To locate the point that represents the ordered pair (a b), draw a dotted line through the point a on the horizontal axis, Then draw a dotted horizontal line through b on the vertical axis. The intersection of the vertical and horizontal lines is the point (a, b). We are now ready to draw a line graph. Consider this example. On 7 consecutive days, the rainfall in a certain district measured, 7 cm, 12 cm, 8 cm, 5 cm, 10 cm and 2 cm. We can represent this set of information as a collection of ordered pairs (a, b) where a represents a day and b represents the amount of rainfall in cm. (1, 7) (2,12) (3,8) (4,5) (5,6) (6,10) (7, 2)
(a, b)
Horizontal axis
Verti
cal a
xis
b, b)
a b)
GR 7 MATHEMATICS S5 27 SS1 LESSON 3
NOW DO PRACTICE EXERCISE 3
In constructing a line graph, consider the following: 1. Draw the horizontal and vertical axes. Choose the proper
scale to use. 2. Arrange the data in pairs. These pairs of values will be used
to locate a point on the graph. One value in each pair will be used in the vertical scale, the other in the horizontal scale.
3. Connect the points in the order that they are plotted. 4. Label the graph.
MEASURES OF RAINFALL IN SEVEN DAYS
Am
ount
of r
ainf
all
1 2 4 5 3 6 7
cm
1 2 3 4 5 6 7
12 11 10 9 8
Days
GR 7 MATHEMATICS S5 28 SS1 LESSON 3
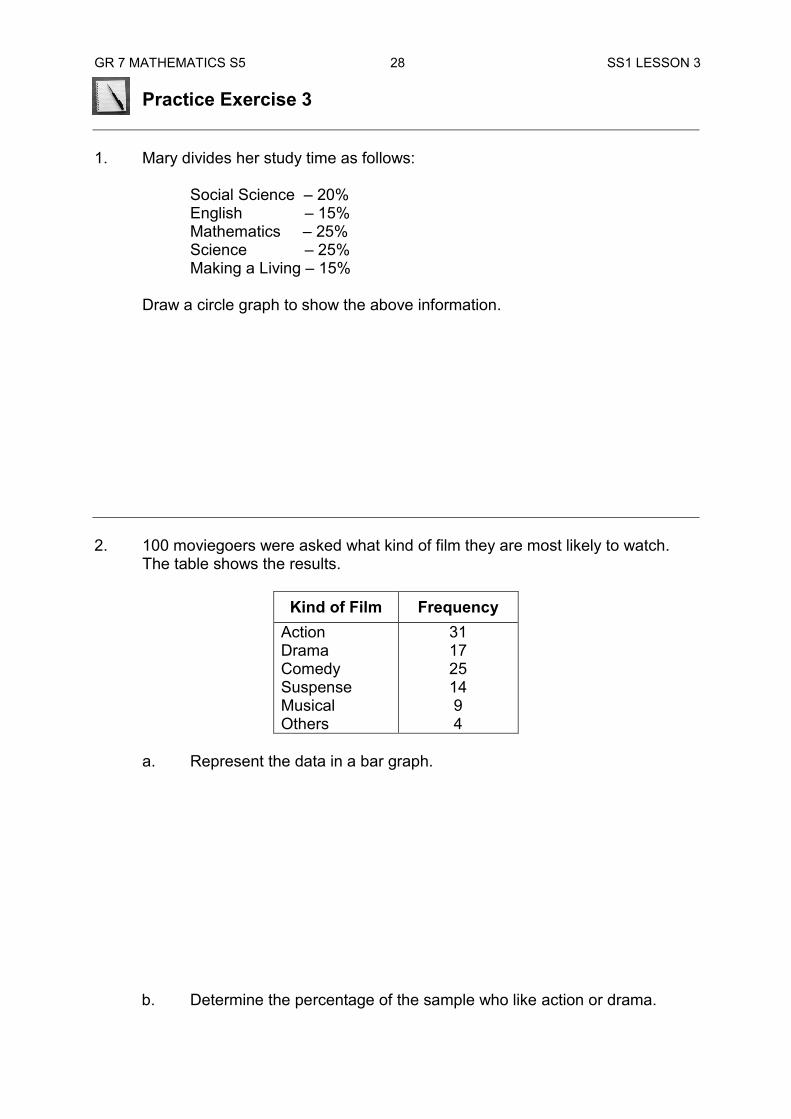
Practice Exercise 3 1. Mary divides her study time as follows: Social Science – 20% English – 15% Mathematics – 25% Science – 25% Making a Living – 15%
Draw a circle graph to show the above information. 2. 100 moviegoers were asked what kind of film they are most likely to watch. The table shows the results.
Kind of Film Frequency Action Drama Comedy Suspense Musical Others
31 17 25 14 9 4
a. Represent the data in a bar graph.
b. Determine the percentage of the sample who like action or drama.
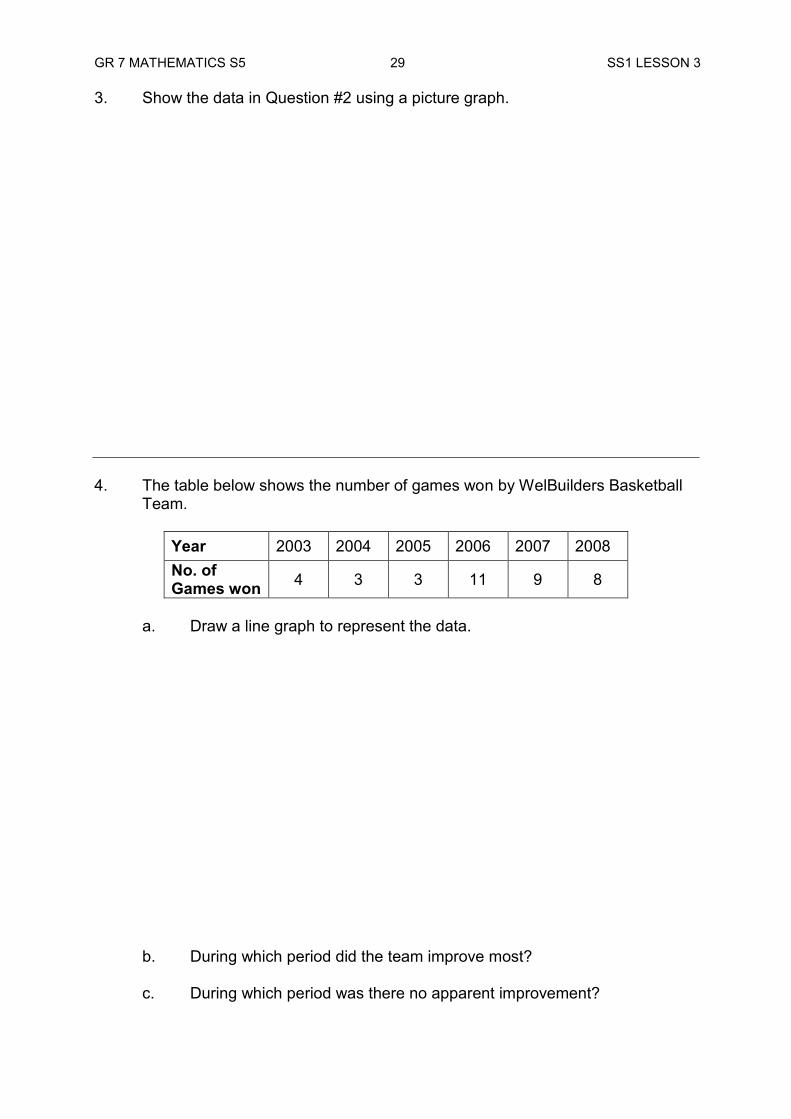
GR 7 MATHEMATICS S5 29 SS1 LESSON 3 3. Show the data in Question #2 using a picture graph. 4. The table below shows the number of games won by WelBuilders Basketball
Team.
Year 2003 2004 2005 2006 2007 2008 No. of Games won 4 3 3 11 9 8
a. Draw a line graph to represent the data. b. During which period did the team improve most? c. During which period was there no apparent improvement?
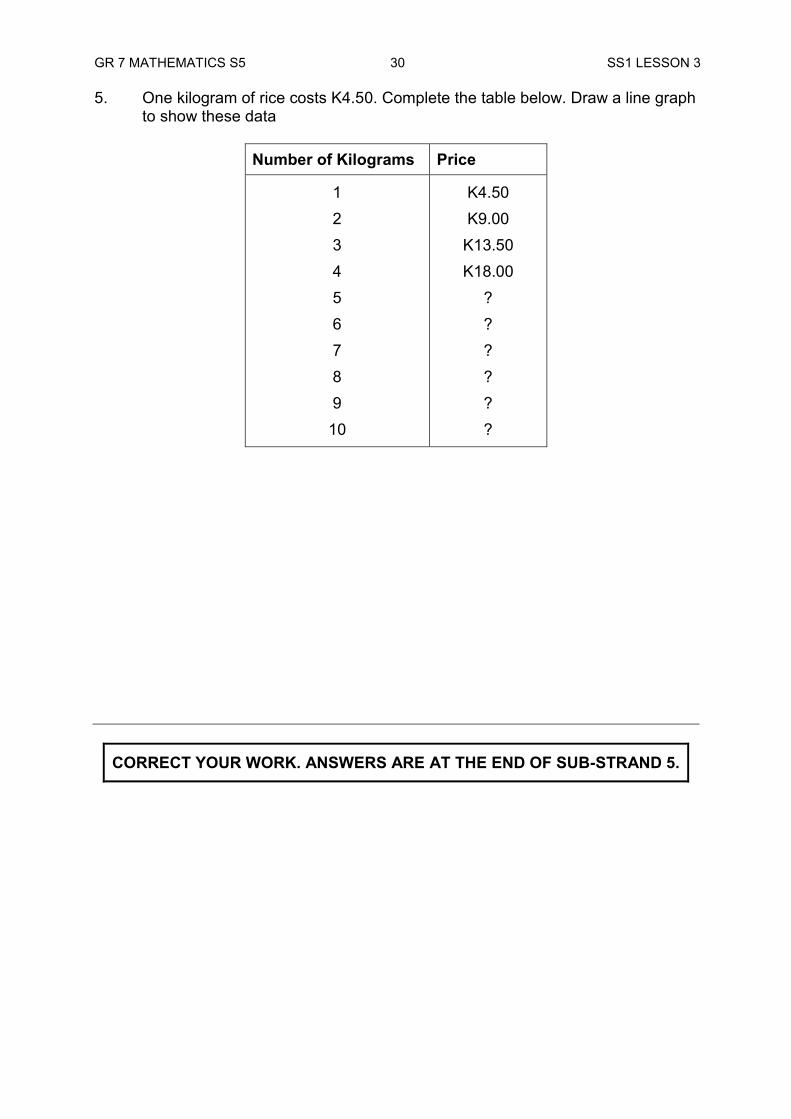
GR 7 MATHEMATICS S5 30 SS1 LESSON 3 5. One kilogram of rice costs K4.50. Complete the table below. Draw a line graph
to show these data
Number of Kilograms Price
1 2 3 4 5 6 7 8 9 10
K4.50 K9.00
K13.50 K18.00
? ? ? ? ? ?
CORRECT YOUR WORK. ANSWERS ARE AT THE END OF SUB-STRAND 5.
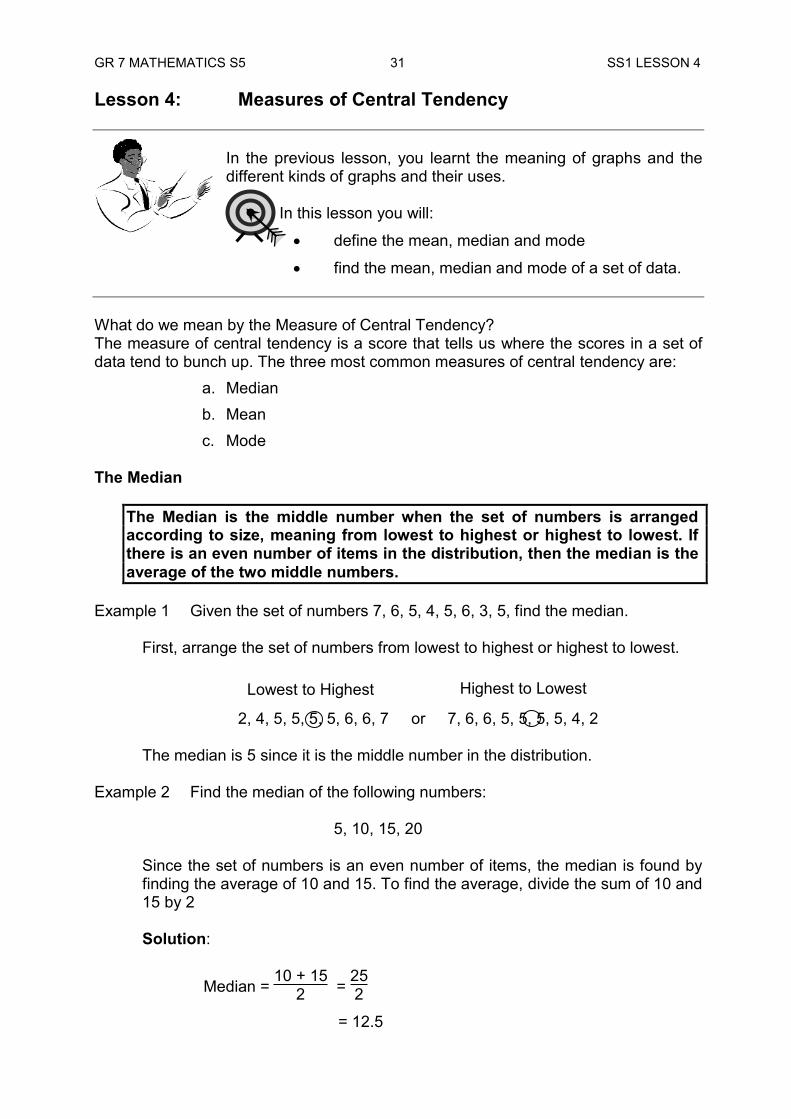
GR 7 MATHEMATICS S5 31 SS1 LESSON 4 Lesson 4: Measures of Central Tendency
In the previous lesson, you learnt the meaning of graphs and the different kinds of graphs and their uses. In this lesson you will:
define the mean, median and mode
find the mean, median and mode of a set of data.
What do we mean by the Measure of Central Tendency? The measure of central tendency is a score that tells us where the scores in a set of data tend to bunch up. The three most common measures of central tendency are:
a. Median b. Mean c. Mode
The Median
The Median is the middle number when the set of numbers is arranged according to size, meaning from lowest to highest or highest to lowest. If there is an even number of items in the distribution, then the median is the average of the two middle numbers.
Example 1 Given the set of numbers 7, 6, 5, 4, 5, 6, 3, 5, find the median.
First, arrange the set of numbers from lowest to highest or highest to lowest. 2, 4, 5, 5, 5, 5, 6, 6, 7 or 7, 6, 6, 5, 5, 5, 5, 4, 2
The median is 5 since it is the middle number in the distribution. Example 2 Find the median of the following numbers:
5, 10, 15, 20
Since the set of numbers is an even number of items, the median is found by finding the average of 10 and 15. To find the average, divide the sum of 10 and 15 by 2 Solution:
Median = 10 + 15
2 = 252
= 12.5
Lowest to Highest Highest to Lowest
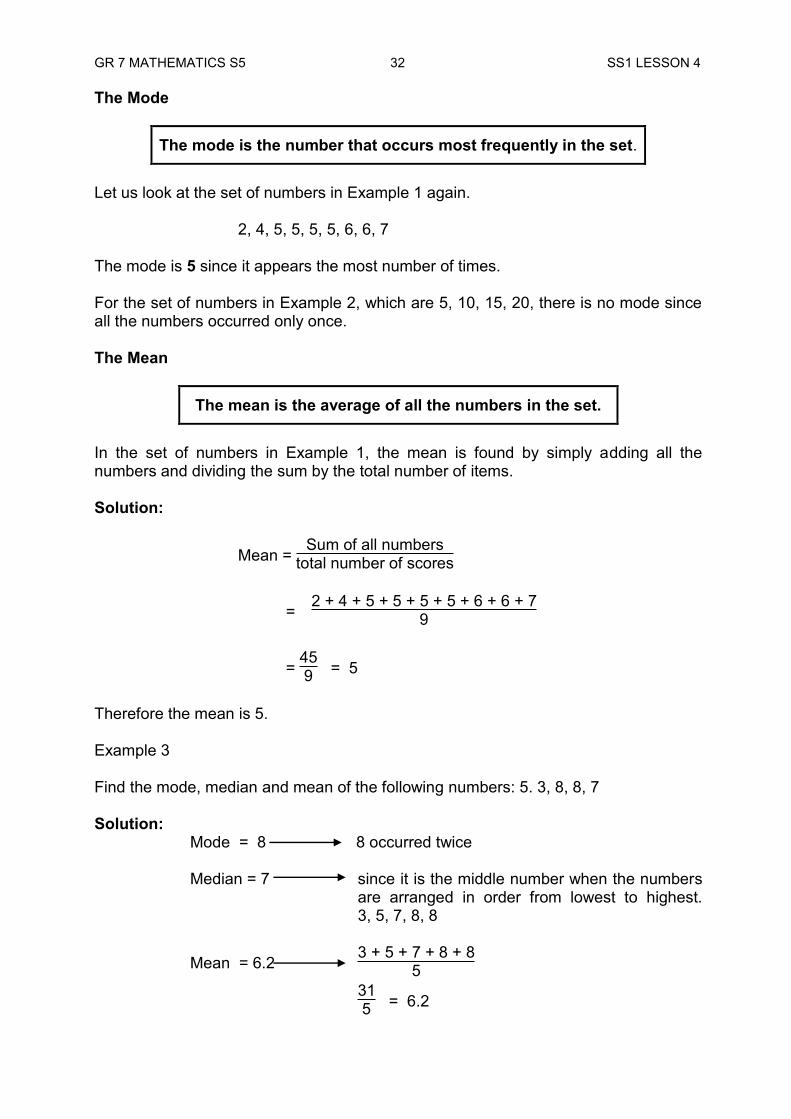
GR 7 MATHEMATICS S5 32 SS1 LESSON 4 The Mode
The mode is the number that occurs most frequently in the set.
Let us look at the set of numbers in Example 1 again. 2, 4, 5, 5, 5, 5, 6, 6, 7 The mode is 5 since it appears the most number of times. For the set of numbers in Example 2, which are 5, 10, 15, 20, there is no mode since all the numbers occurred only once. The Mean
The mean is the average of all the numbers in the set.
In the set of numbers in Example 1, the mean is found by simply adding all the numbers and dividing the sum by the total number of items. Solution:
Mean = Sum of all numbers
total number of scores
= 2 + 4 + 5 + 5 + 5 + 5 + 6 + 6 + 7
9
= 459 = 5
Therefore the mean is 5. Example 3 Find the mode, median and mean of the following numbers: 5. 3, 8, 8, 7 Solution:
Mode = 8 8 occurred twice
Median = 7 since it is the middle number when the numbers are arranged in order from lowest to highest. 3, 5, 7, 8, 8
Mean = 6.2 3 + 5 + 7 + 8 + 8
5
315 = 6.2
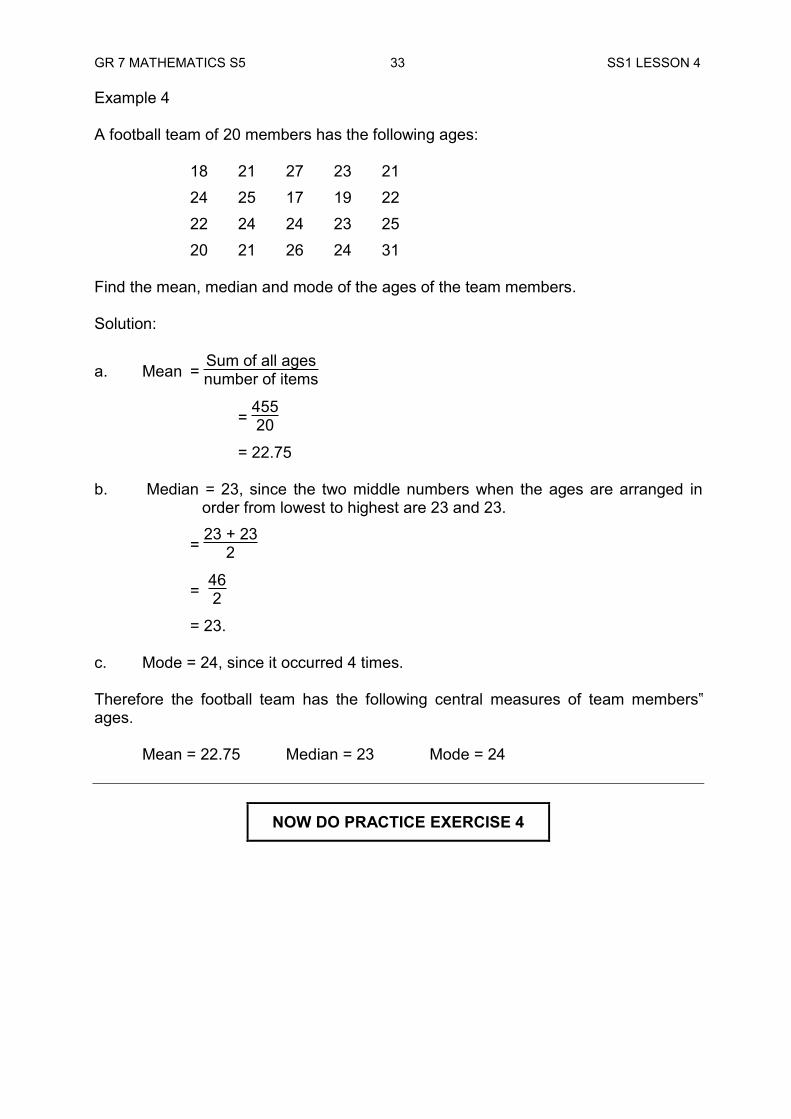
GR 7 MATHEMATICS S5 33 SS1 LESSON 4 Example 4 A football team of 20 members has the following ages: 18 21 27 23 21 24 25 17 19 22 22 24 24 23 25 20 21 26 24 31 Find the mean, median and mode of the ages of the team members. Solution:
a. Mean = Sum of all agesnumber of items
= 45520
= 22.75 b. Median = 23, since the two middle numbers when the ages are arranged in
order from lowest to highest are 23 and 23.
= 23 + 23
2
= 462
= 23. c. Mode = 24, since it occurred 4 times. Therefore the football team has the following central measures of team members‟ ages. Mean = 22.75 Median = 23 Mode = 24
NOW DO PRACTICE EXERCISE 4
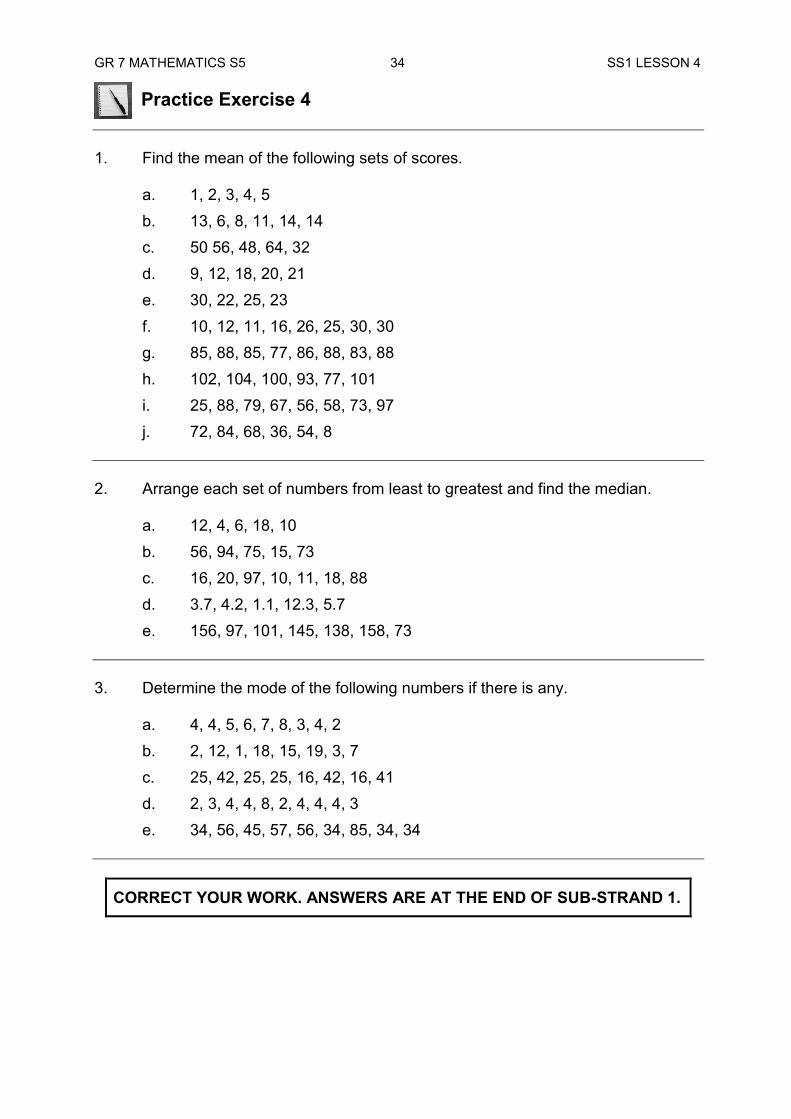
GR 7 MATHEMATICS S5 34 SS1 LESSON 4 Practice Exercise 4 1. Find the mean of the following sets of scores.
a. 1, 2, 3, 4, 5 b. 13, 6, 8, 11, 14, 14 c. 50 56, 48, 64, 32 d. 9, 12, 18, 20, 21 e. 30, 22, 25, 23 f. 10, 12, 11, 16, 26, 25, 30, 30 g. 85, 88, 85, 77, 86, 88, 83, 88 h. 102, 104, 100, 93, 77, 101 i. 25, 88, 79, 67, 56, 58, 73, 97 j. 72, 84, 68, 36, 54, 8
2. Arrange each set of numbers from least to greatest and find the median.
a. 12, 4, 6, 18, 10 b. 56, 94, 75, 15, 73 c. 16, 20, 97, 10, 11, 18, 88 d. 3.7, 4.2, 1.1, 12.3, 5.7 e. 156, 97, 101, 145, 138, 158, 73
3. Determine the mode of the following numbers if there is any.
a. 4, 4, 5, 6, 7, 8, 3, 4, 2 b. 2, 12, 1, 18, 15, 19, 3, 7 c. 25, 42, 25, 25, 16, 42, 16, 41 d. 2, 3, 4, 4, 8, 2, 4, 4, 4, 3 e. 34, 56, 45, 57, 56, 34, 85, 34, 34
CORRECT YOUR WORK. ANSWERS ARE AT THE END OF SUB-STRAND 1.
GR 7 MATHEMATICS S5 35 SS1 LESSON 5 Lesson 5: Simple or Ungrouped Frequency Distribution
In lessons 1 and 2 you learnt about tables and graphs as ways and means of presenting data.
In this lesson you will:
define a frequency distribution table
present data in a frequency distribution table
find the mean, median and mode of an ungrouped data distribution.
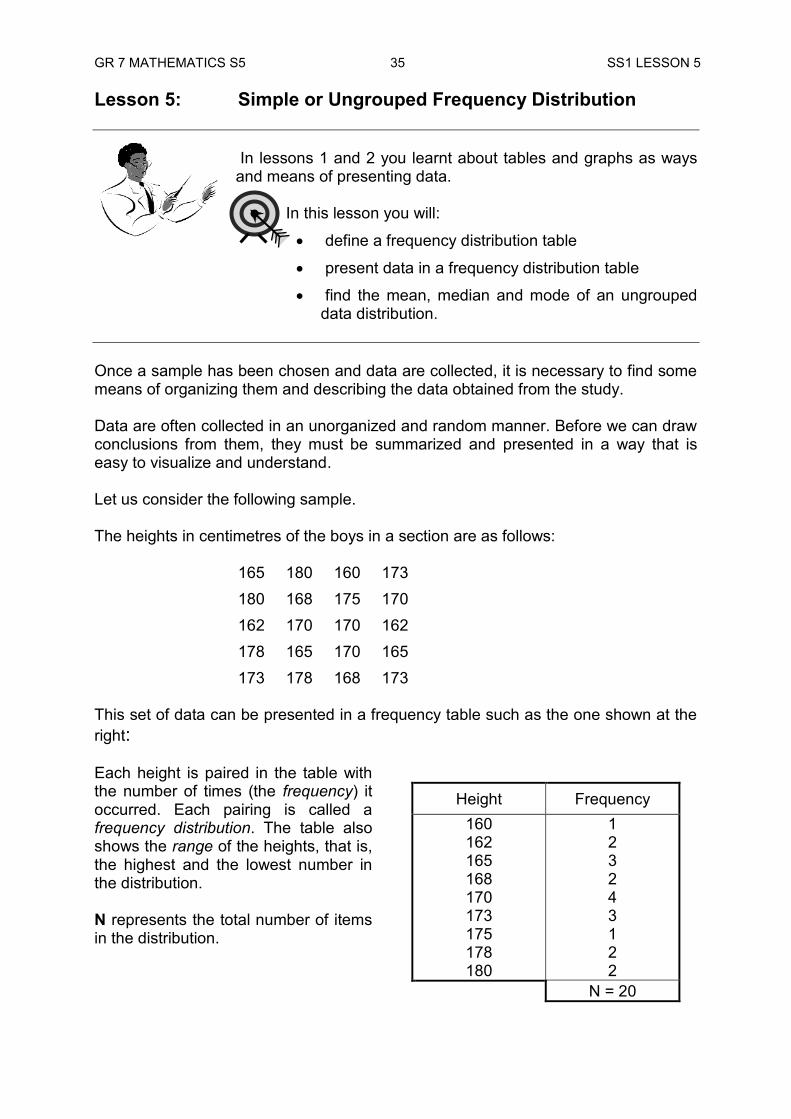
Once a sample has been chosen and data are collected, it is necessary to find some means of organizing them and describing the data obtained from the study. Data are often collected in an unorganized and random manner. Before we can draw conclusions from them, they must be summarized and presented in a way that is easy to visualize and understand. Let us consider the following sample. The heights in centimetres of the boys in a section are as follows:
165 180 160 173 180 168 175 170 162 170 170 162 178 165 170 165 173 178 168 173
This set of data can be presented in a frequency table such as the one shown at the right: Each height is paired in the table with the number of times (the frequency) it occurred. Each pairing is called a frequency distribution. The table also shows the range of the heights, that is, the highest and the lowest number in the distribution. N represents the total number of items in the distribution.
Height Frequency
160 162 165 168 170 173 175 178 180
1 2 3 2 4 3 1 2 2
N = 20
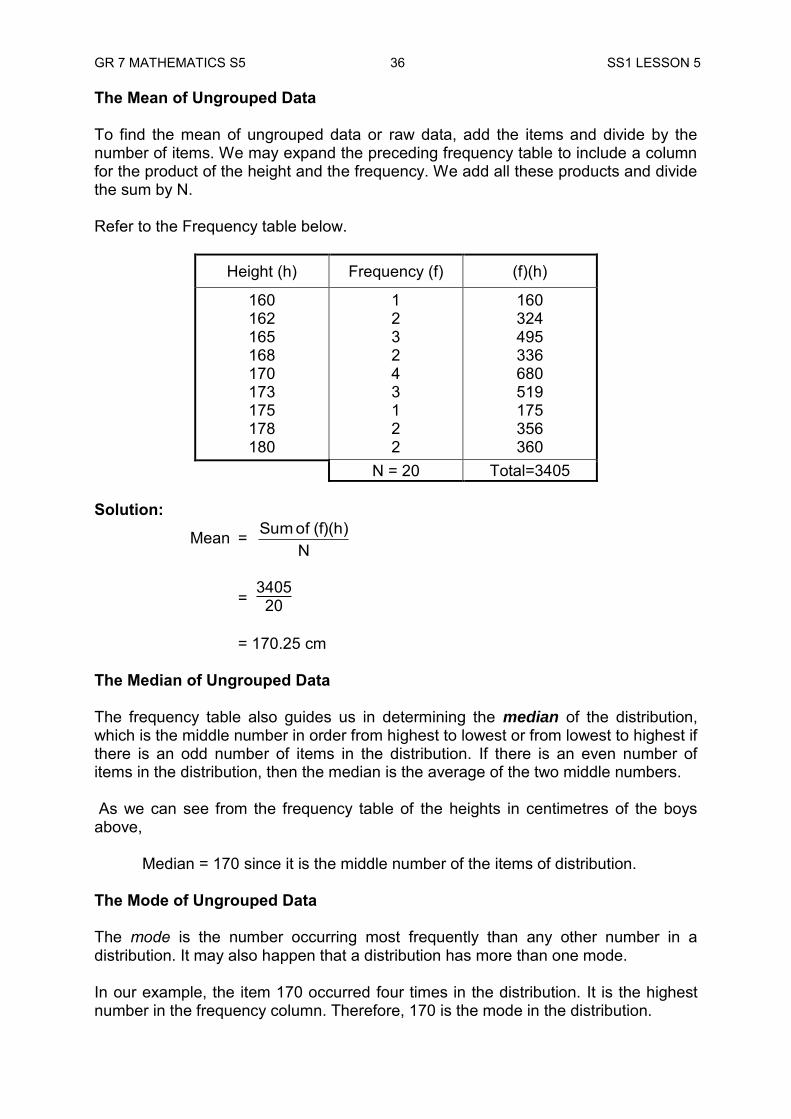
GR 7 MATHEMATICS S5 36 SS1 LESSON 5 The Mean of Ungrouped Data To find the mean of ungrouped data or raw data, add the items and divide by the number of items. We may expand the preceding frequency table to include a column for the product of the height and the frequency. We add all these products and divide the sum by N. Refer to the Frequency table below.
Height (h) Frequency (f) (f)(h)
160 162 165 168 170 173 175 178 180
1 2 3 2 4 3 1 2 2
160 324 495 336 680 519 175 356 360
N = 20 Total=3405 Solution:
Mean = N
(f)(h) of Sum
= 340520
= 170.25 cm
The Median of Ungrouped Data The frequency table also guides us in determining the median of the distribution, which is the middle number in order from highest to lowest or from lowest to highest if there is an odd number of items in the distribution. If there is an even number of items in the distribution, then the median is the average of the two middle numbers. As we can see from the frequency table of the heights in centimetres of the boys above,
Median = 170 since it is the middle number of the items of distribution. The Mode of Ungrouped Data The mode is the number occurring most frequently than any other number in a distribution. It may also happen that a distribution has more than one mode. In our example, the item 170 occurred four times in the distribution. It is the highest number in the frequency column. Therefore, 170 is the mode in the distribution.
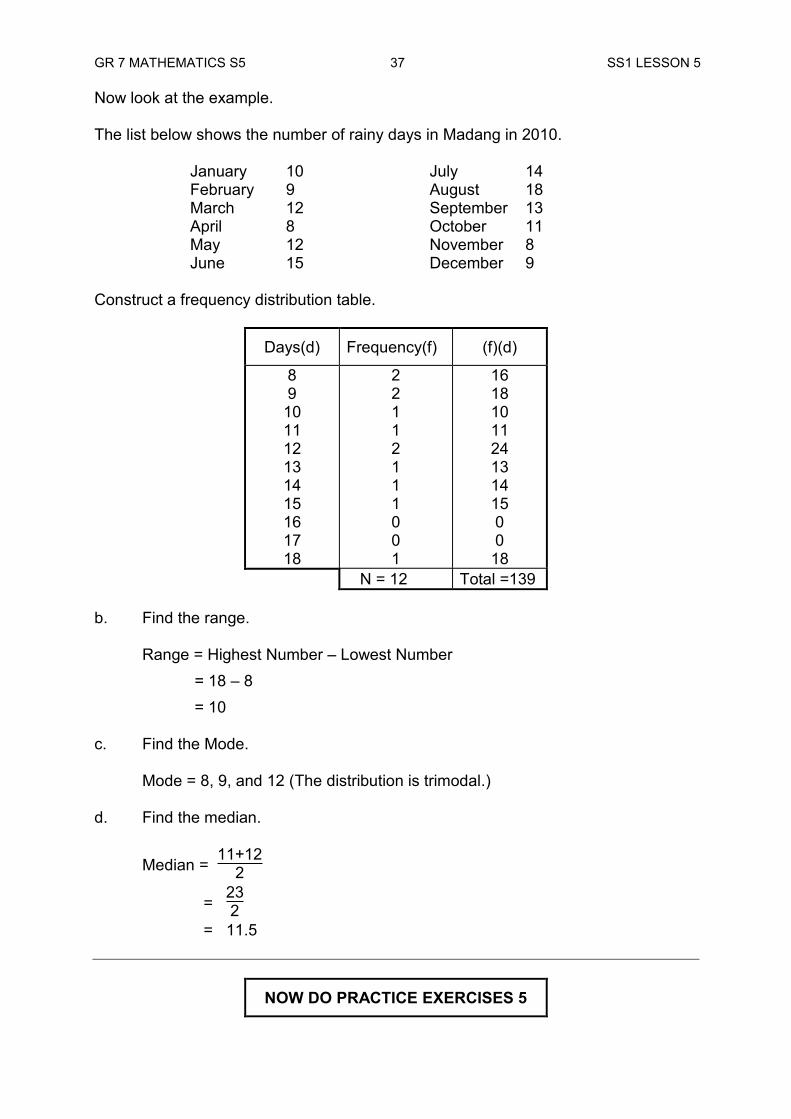
GR 7 MATHEMATICS S5 37 SS1 LESSON 5 Now look at the example. The list below shows the number of rainy days in Madang in 2010. January 10 July 14 February 9 August 18 March 12 September 13 April 8 October 11 May 12 November 8 June 15 December 9 Construct a frequency distribution table.
Days(d) Frequency(f) (f)(d)
8 9 10 11 12 13 14 15 16 17 18
2 2 1 1 2 1 1 1 0 0 1
16 18 10 11 24 13 14 15 0 0 18
N = 12 Total =139 b. Find the range. Range = Highest Number – Lowest Number = 18 – 8 = 10 c. Find the Mode. Mode = 8, 9, and 12 (The distribution is trimodal.) d. Find the median.
Median = 11+12
2
= 232
= 11.5
NOW DO PRACTICE EXERCISES 5
GR 7 MATHEMATICS S5 38 SS1 LESSON 5
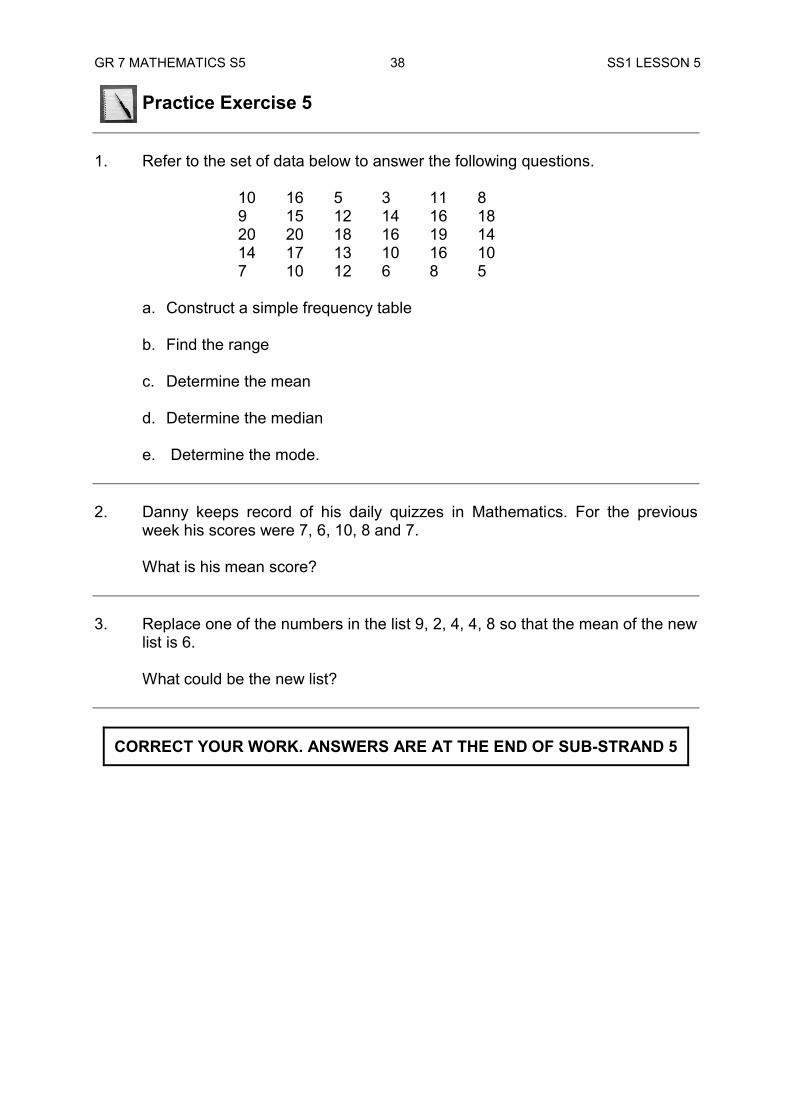
Practice Exercise 5 1. Refer to the set of data below to answer the following questions. 10 16 5 3 11 8
9 15 12 14 16 18 20 20 18 16 19 14 14 17 13 10 16 10 7 10 12 6 8 5
a. Construct a simple frequency table
b. Find the range
c. Determine the mean
d. Determine the median
e. Determine the mode.
2. Danny keeps record of his daily quizzes in Mathematics. For the previous
week his scores were 7, 6, 10, 8 and 7.
What is his mean score? 3. Replace one of the numbers in the list 9, 2, 4, 4, 8 so that the mean of the new
list is 6.
What could be the new list?
CORRECT YOUR WORK. ANSWERS ARE AT THE END OF SUB-STRAND 5
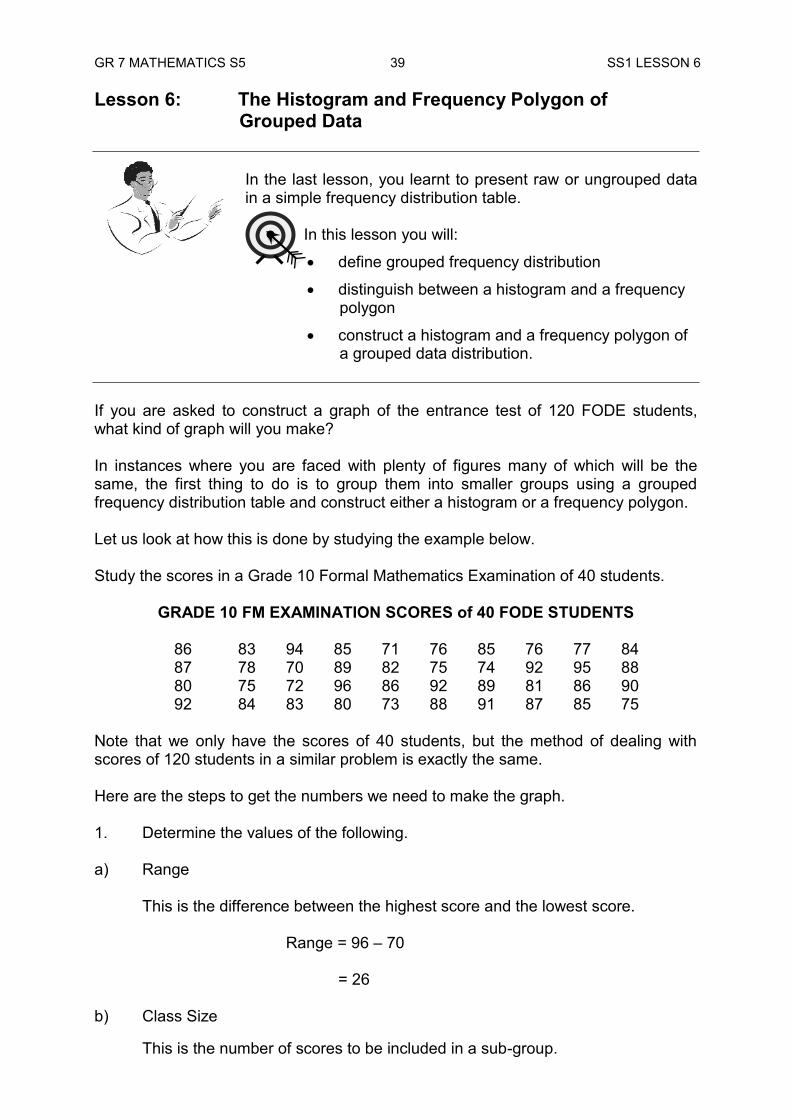
GR 7 MATHEMATICS S5 39 SS1 LESSON 6 Lesson 6: The Histogram and Frequency Polygon of Grouped Data
In the last lesson, you learnt to present raw or ungrouped data in a simple frequency distribution table.
In this lesson you will:
define grouped frequency distribution
distinguish between a histogram and a frequency polygon
construct a histogram and a frequency polygon of a grouped data distribution.
If you are asked to construct a graph of the entrance test of 120 FODE students, what kind of graph will you make? In instances where you are faced with plenty of figures many of which will be the same, the first thing to do is to group them into smaller groups using a grouped frequency distribution table and construct either a histogram or a frequency polygon. Let us look at how this is done by studying the example below. Study the scores in a Grade 10 Formal Mathematics Examination of 40 students.
GRADE 10 FM EXAMINATION SCORES of 40 FODE STUDENTS
86 83 94 85 71 76 85 76 77 84 87 78 70 89 82 75 74 92 95 88 80 75 72 96 86 92 89 81 86 90 92 84 83 80 73 88 91 87 85 75
Note that we only have the scores of 40 students, but the method of dealing with scores of 120 students in a similar problem is exactly the same. Here are the steps to get the numbers we need to make the graph. 1. Determine the values of the following. a) Range
This is the difference between the highest score and the lowest score.
Range = 96 – 70
= 26
b) Class Size
This is the number of scores to be included in a sub-group.
GR 7 MATHEMATICS S5 40 SS1 LESSON 6 First, we choose the number of sub-groups or classes. The number of classes formed is usually between 10 and 20. Suppose we choose 10 for our example. Then the class can be determined by dividing the range by the number of classes, etc.
Class size = range
number of classes
= 26
10
= 2.6 This indicates that each class may have either 2 or 3 scores. Let us take 3.
c. Class Intervals and Midpoints
The information of the classes is mostly left to the individual doing work. Let us start our first class interval as 69 – 71. This includes 3 scores (69, 70 and 71). If we continue making the smaller groups, the next classes are 72-74, 75 -77, 78 - 80, and so on, until we reach the class containing the highest score. To make the graph we will need the class marks or midpoints of the intervals. In our example, the class marks are 70, 73, 76 and so on.
2. We can now construct a frequency distribution table.
Scores Tally Frequency
69 – 71 72 – 74 75 – 77 78 – 80 81 – 83 84 – 86 87 – 89 90 – 92 93 – 95 96 - 98
II III
IIII I III IIII
IIII III IIII I IIII II I
2 3 6 3 4 8 6 5 2 1
Total = 40
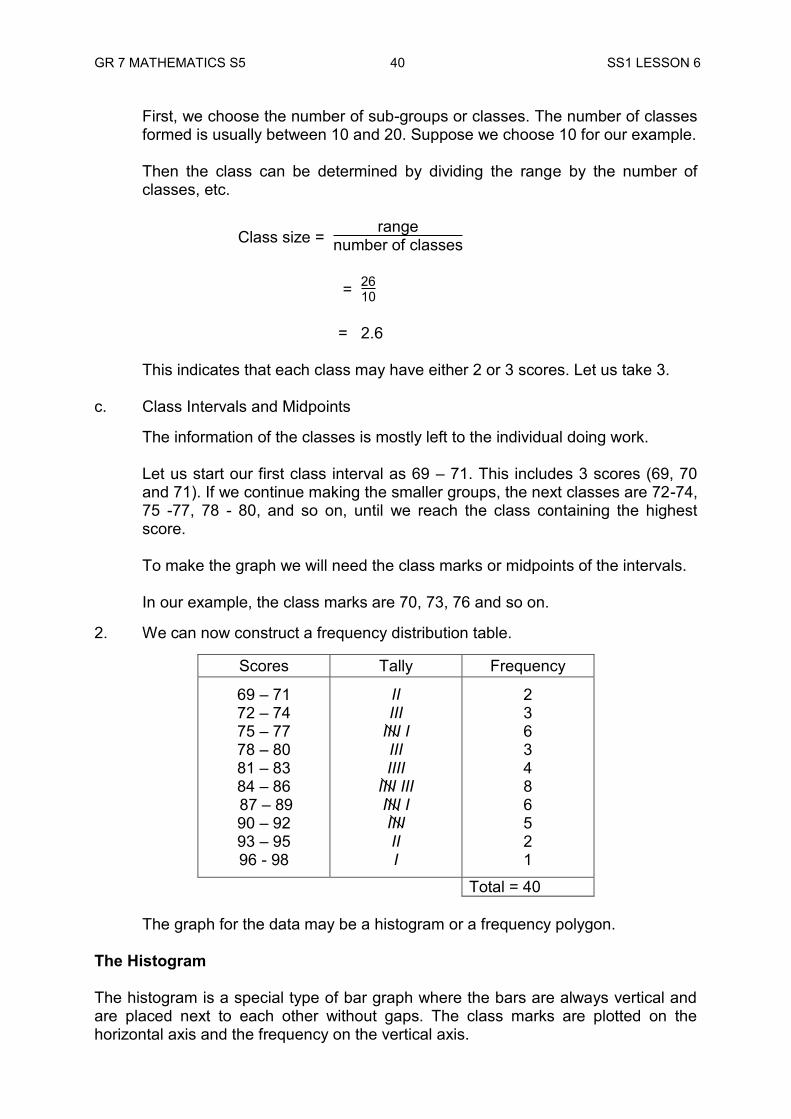
The graph for the data may be a histogram or a frequency polygon.
The Histogram The histogram is a special type of bar graph where the bars are always vertical and are placed next to each other without gaps. The class marks are plotted on the horizontal axis and the frequency on the vertical axis.
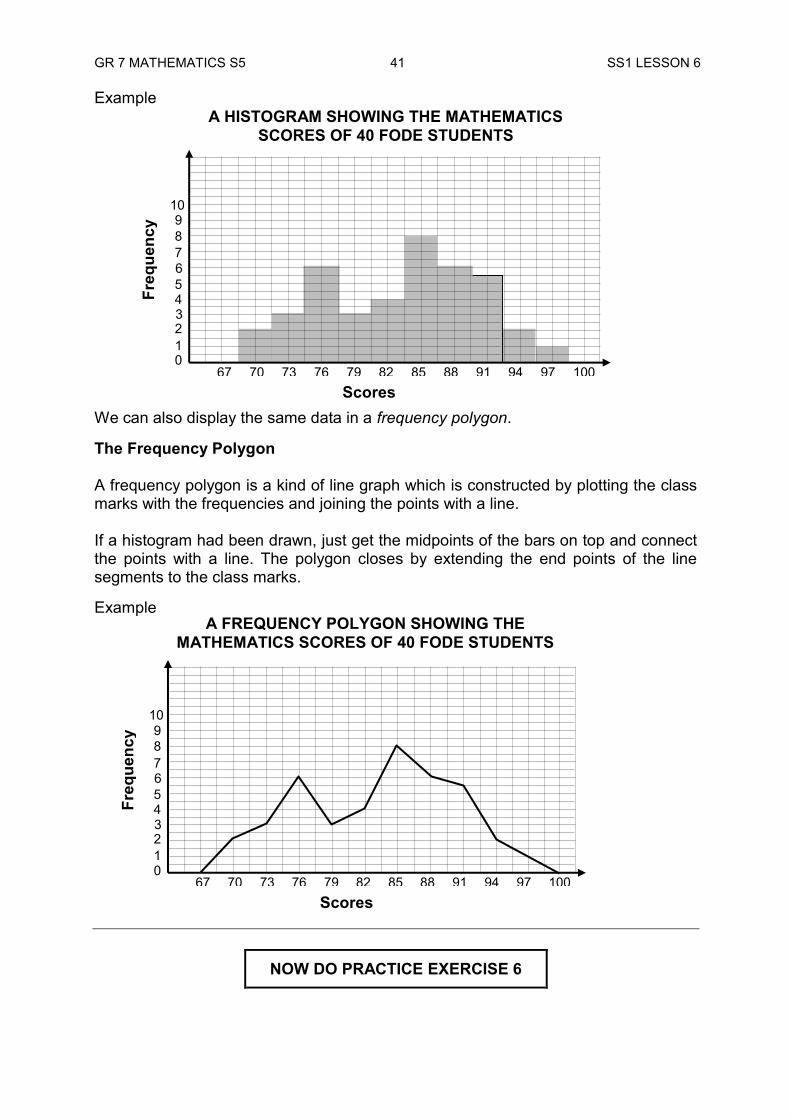
GR 7 MATHEMATICS S5 41 SS1 LESSON 6 Example We can also display the same data in a frequency polygon. The Frequency Polygon A frequency polygon is a kind of line graph which is constructed by plotting the class marks with the frequencies and joining the points with a line. If a histogram had been drawn, just get the midpoints of the bars on top and connect the points with a line. The polygon closes by extending the end points of the line segments to the class marks. Example
NOW DO PRACTICE EXERCISE 6
A FREQUENCY POLYGON SHOWING THE MATHEMATICS SCORES OF 40 FODE STUDENTS
8
6
2 1
Freq
uenc
y
0
4 3
7
9 10
5
67 76 70 73 100 79 82 85 88 91 94 97 Scores
A HISTOGRAM SHOWING THE MATHEMATICS SCORES OF 40 FODE STUDENTS
8
6
2 1
Freq
uenc
y
0
4 3
7
9 10
5
67 76 70 73 100 79 82 85 88 91 94 97 Scores
GR 7 MATHEMATICS S5 42 SS1 LESSON 6
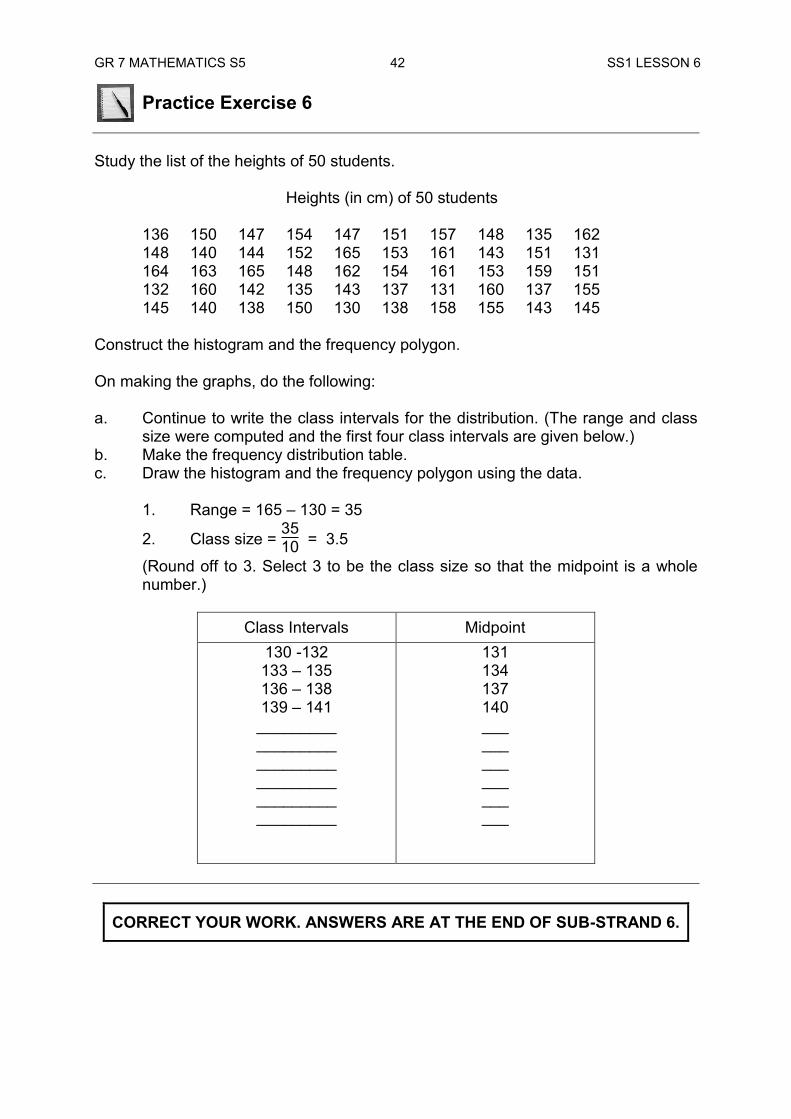
Practice Exercise 6 Study the list of the heights of 50 students. Heights (in cm) of 50 students
136 150 147 154 147 151 157 148 135 162 148 140 144 152 165 153 161 143 151 131 164 163 165 148 162 154 161 153 159 151 132 160 142 135 143 137 131 160 137 155 145 140 138 150 130 138 158 155 143 145
Construct the histogram and the frequency polygon. On making the graphs, do the following: a. Continue to write the class intervals for the distribution. (The range and class
size were computed and the first four class intervals are given below.) b. Make the frequency distribution table. c. Draw the histogram and the frequency polygon using the data.
1. Range = 165 – 130 = 35
2. Class size = 3510 = 3.5
(Round off to 3. Select 3 to be the class size so that the midpoint is a whole number.)
Class Intervals Midpoint
130 -132 133 – 135 136 – 138 139 – 141
_________ _________ _________ _________ _________ _________
131 134 137 140 ___ ___ ___ ___ ___ ___
CORRECT YOUR WORK. ANSWERS ARE AT THE END OF SUB-STRAND 6.
GR 7 MATHEMATICS S5 43 SS1 SUMMARY SUB-STRAND 1: SUMMARY
A Table is an orderly way of arranging and classifying data in rows and columns.
A Graph is used to show the relationship between quantities through a pictorial form. The most commonly used types of graphs are the bar graph, circle graph, line graph and pictograph.
The bar graph and circle graph are used to show the relative magnitude of different quantities.
Line graphs are used if the rate and direction of change of the quantities are considered. Line graphs may be a broken-line, a smooth curve or a straight line.
Pictographs use picture to represent a quantity. Measures of Central Tendency are measures that give some notion of the
“middle” value of a set of scores. One of these is the mode which is the number that occurs most frequently in the set. It is the score with the highest frequency.
The mean is the average of all the numbers in the set. It is the sum of all the scores divided by the number of scores.
The median of the distribution, if the set of scores is arranged in order of size, the middle score, for an odd number of scores the average of the two middle scores, for an even number of scores.
Frequency Distribution is an orderly way of arranging numerical information easier to read and understand.
Frequency is the number of times a given score occurs. The range of a distribution is the difference between the highest and the
lowest score. The histogram is a special type of bar graph where the bars are always
vertical and are placed next to each other without gaps. The class marks are plotted on the horizontal axis and the frequency on the vertical axis.
A frequency polygon is a kind of line graph which is constructed by plotting the class marks with the frequencies and joining the points with straight lines.
REVISE LESSON 1-6 THEN DO SUB-STRAND TEST 1 IN ASSIGNMENT 5
This summarises the important ideas and concepts to remember.
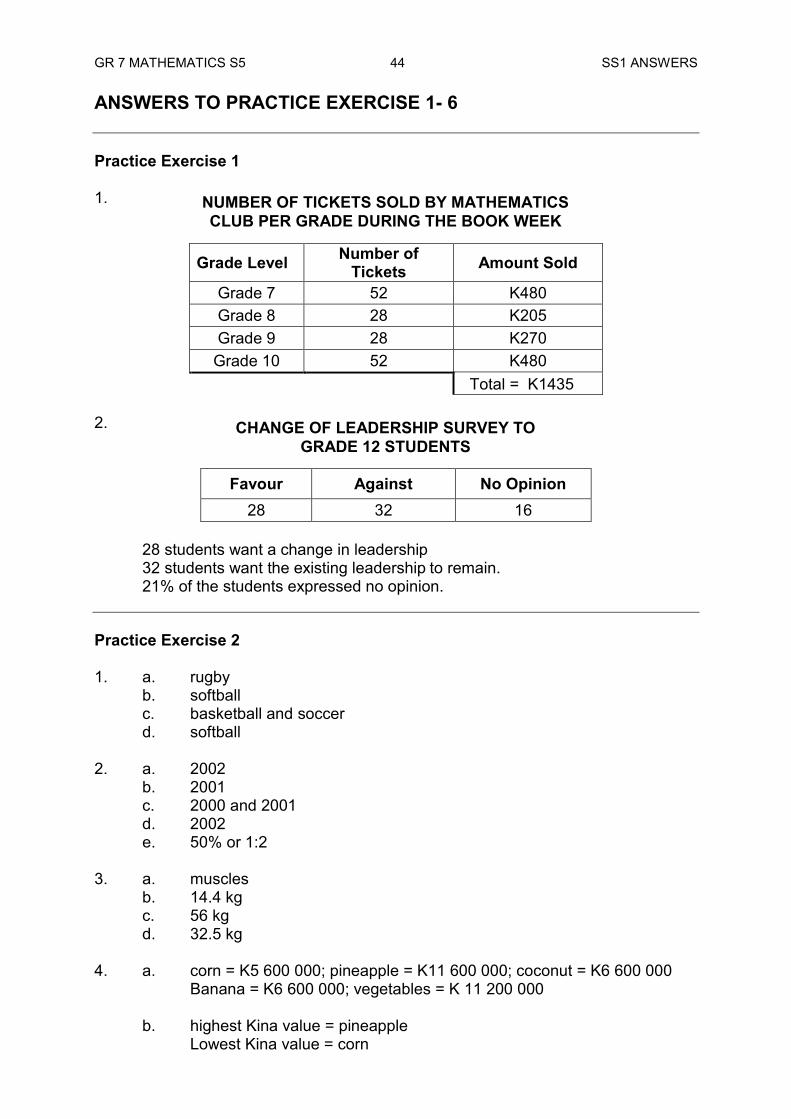
GR 7 MATHEMATICS S5 44 SS1 ANSWERS ANSWERS TO PRACTICE EXERCISE 1- 6 Practice Exercise 1 1.
Grade Level Number of Tickets Amount Sold
Grade 7 52 K480 Grade 8 28 K205 Grade 9 28 K270
Grade 10 52 K480 Total = K1435
2.
Favour Against No Opinion 28 32 16
28 students want a change in leadership 32 students want the existing leadership to remain. 21% of the students expressed no opinion. Practice Exercise 2 1. a. rugby b. softball c. basketball and soccer d. softball 2. a. 2002 b. 2001 c. 2000 and 2001 d. 2002 e. 50% or 1:2 3. a. muscles b. 14.4 kg c. 56 kg d. 32.5 kg 4. a. corn = K5 600 000; pineapple = K11 600 000; coconut = K6 600 000 Banana = K6 600 000; vegetables = K 11 200 000
b. highest Kina value = pineapple Lowest Kina value = corn
NUMBER OF TICKETS SOLD BY MATHEMATICS CLUB PER GRADE DURING THE BOOK WEEK
CHANGE OF LEADERSHIP SURVEY TO GRADE 12 STUDENTS
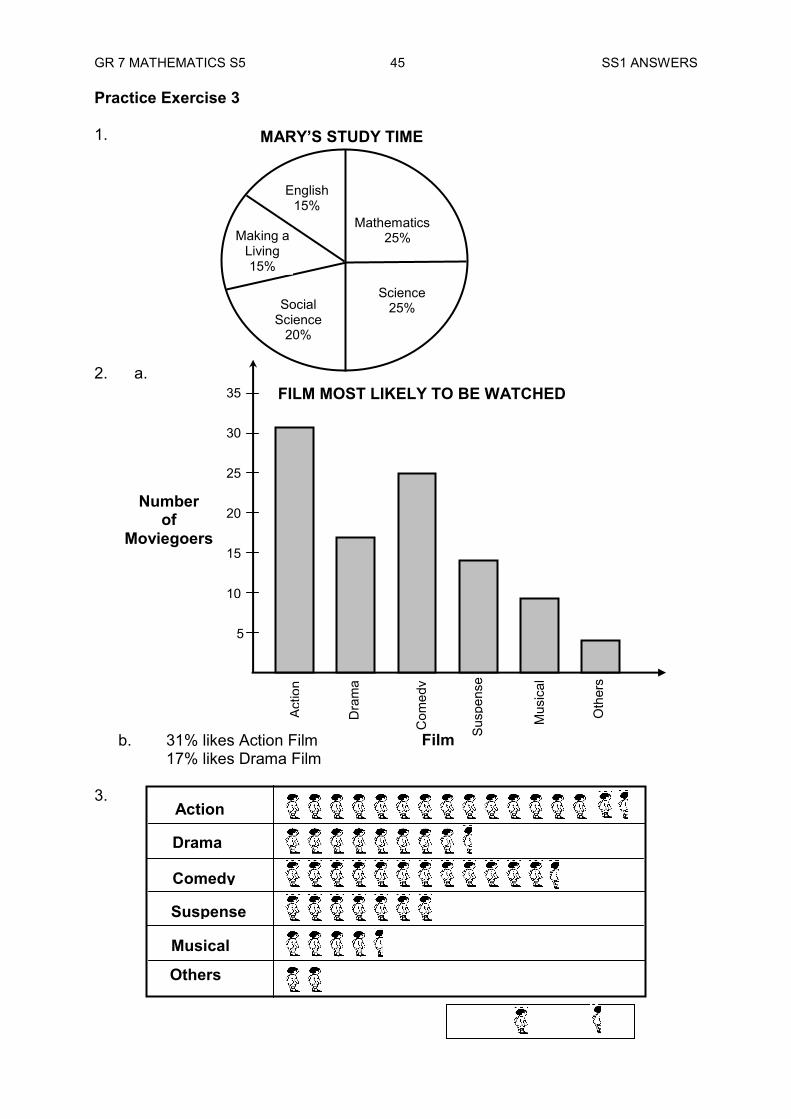
GR 7 MATHEMATICS S5 45 SS1 ANSWERS Practice Exercise 3 1. 2. a.
b. 31% likes Action Film 17% likes Drama Film
3.
Mathematics 25%
Science 25%
Making a Living 15%
English 15%
Social Science
20%
MARY’S STUDY TIME
FILM MOST LIKELY TO BE WATCHED
5
10
15
20
25
30
35
Actio
n
Dra
ma
Oth
ers
Com
edy
Susp
ense
Mus
ical
Number of
Moviegoers
Film
Action
Drama
Comedy
Suspense
Musical
Others
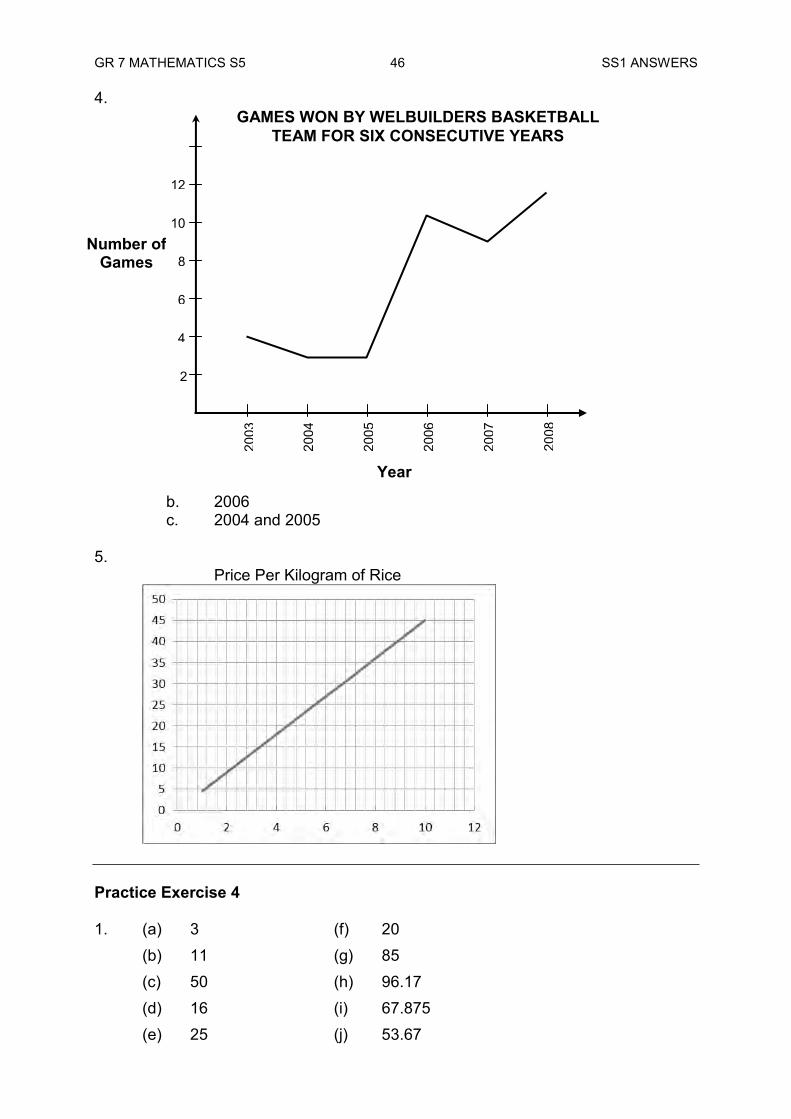
GR 7 MATHEMATICS S5 46 SS1 ANSWERS 4.
b. 2006 c. 2004 and 2005
5.
Price Per Kilogram of Rice
Practice Exercise 4 1. (a) 3 (f) 20 (b) 11 (g) 85 (c) 50 (h) 96.17 (d) 16 (i) 67.875 (e) 25 (j) 53.67
2
4
6
8
10
12
2003
2004
2005
2006
2007
2008
GAMES WON BY WELBUILDERS BASKETBALL TEAM FOR SIX CONSECUTIVE YEARS
Number of Games
Year
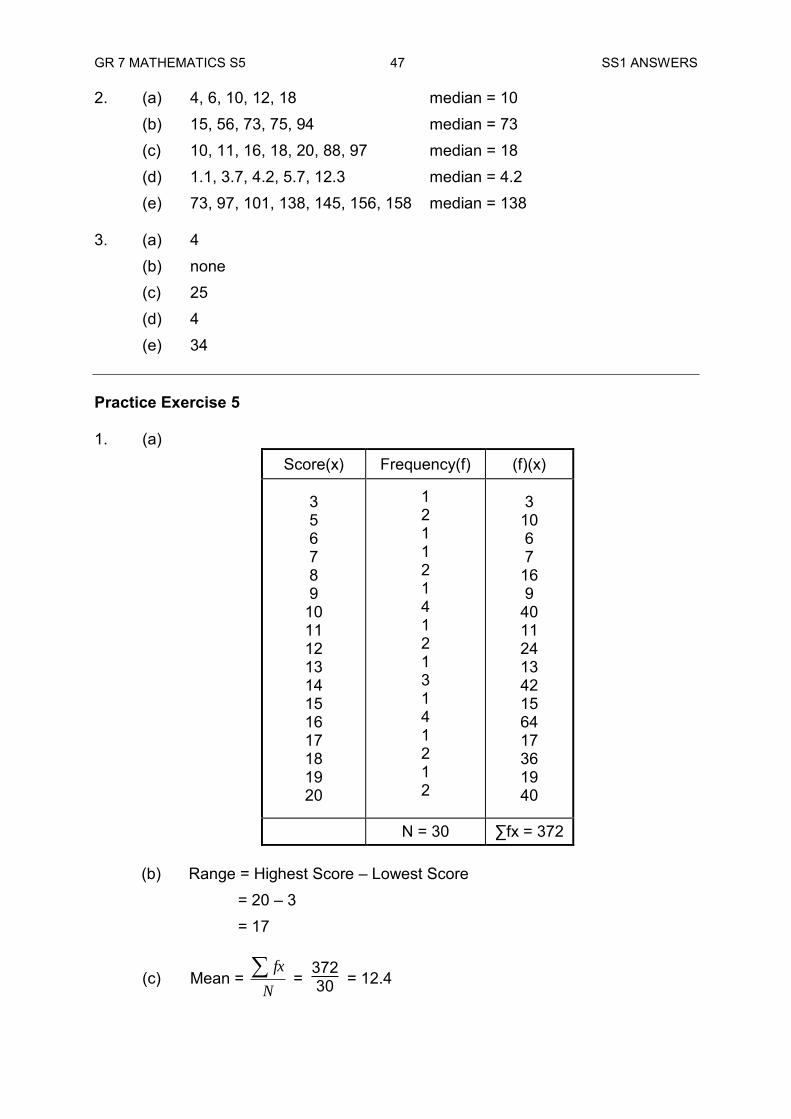
GR 7 MATHEMATICS S5 47 SS1 ANSWERS 2. (a) 4, 6, 10, 12, 18 median = 10 (b) 15, 56, 73, 75, 94 median = 73 (c) 10, 11, 16, 18, 20, 88, 97 median = 18 (d) 1.1, 3.7, 4.2, 5.7, 12.3 median = 4.2 (e) 73, 97, 101, 138, 145, 156, 158 median = 138 3. (a) 4 (b) none (c) 25 (d) 4 (e) 34 Practice Exercise 5 1. (a)
Score(x) Frequency(f) (f)(x)
3 5 6 7 8 9
10 11 12 13 14 15 16 17 18 19 20
1 2 1 1 2 1 4 1 2 1 3 1 4 1 2 1 2
3 10 6 7
16 9
40 11 24 13 42 15 64 17 36 19 40
N = 30 ∑fx = 372
(b) Range = Highest Score – Lowest Score = 20 – 3 = 17
(c) Mean = N
fx = 37230 = 12.4
GR 7 MATHEMATICS S5 48 SS1 ANSWERS
(d) Median = 12 +13
2 = 252 = 12.5
(e) Mode = 10 and 16
2. Mean = 7+6+10+8+7
5 = 385 = 7.6
3. New list may be one of the following: (9, 5, 4, 4, 8) replace 2 by 5 (9, 2, 4, 4, 11) replace 8 by 11 (9, 2, 4, 7, 8) replace 4 by 7 (12, 2, 4, 4, 8) replace 9 by 12
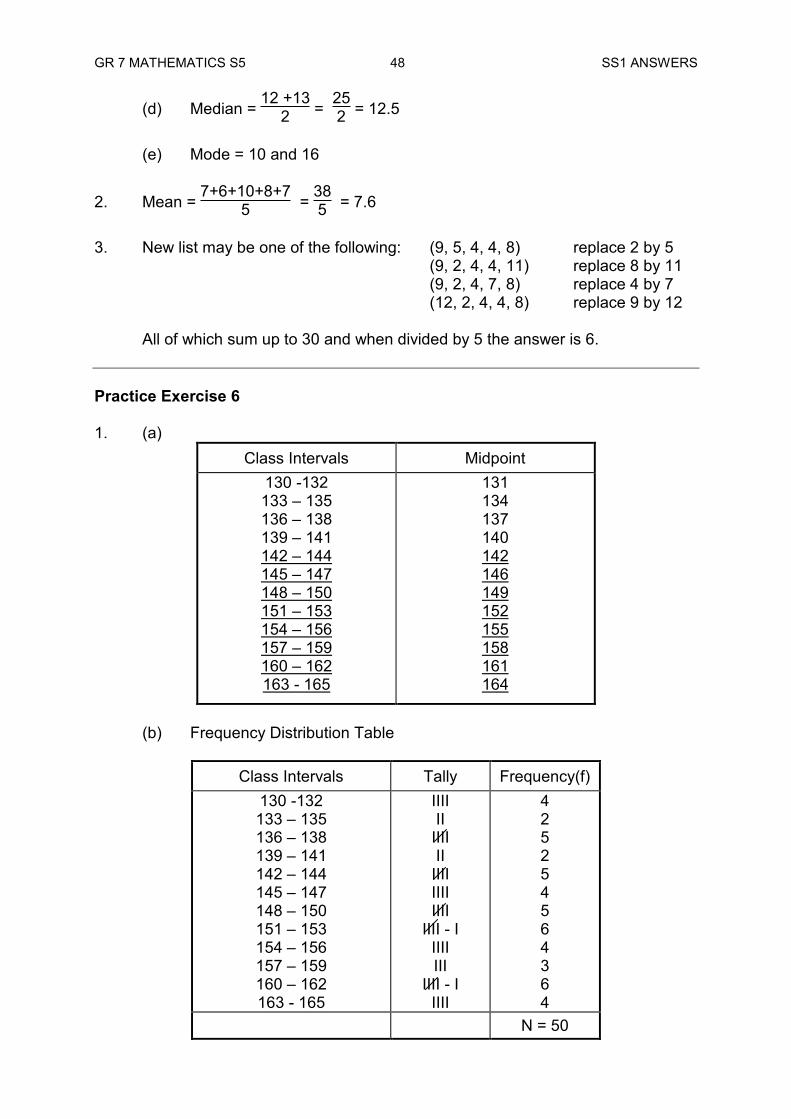
All of which sum up to 30 and when divided by 5 the answer is 6. Practice Exercise 6 1. (a)
Class Intervals Midpoint 130 -132 133 – 135 136 – 138 139 – 141 142 – 144 145 – 147 148 – 150 151 – 153 154 – 156 157 – 159 160 – 162 163 - 165
131 134 137 140 142 146 149 152 155 158 161 164
(b) Frequency Distribution Table
Class Intervals Tally Frequency(f)
130 -132 133 – 135 136 – 138 139 – 141 142 – 144 145 – 147 148 – 150 151 – 153 154 – 156 157 – 159 160 – 162 163 - 165
IIII II
IIII II
IIII IIII IIII
IIII - I IIII III
IIII - I IIII
4 2 5 2 5 4 5 6 4 3 6 4
N = 50
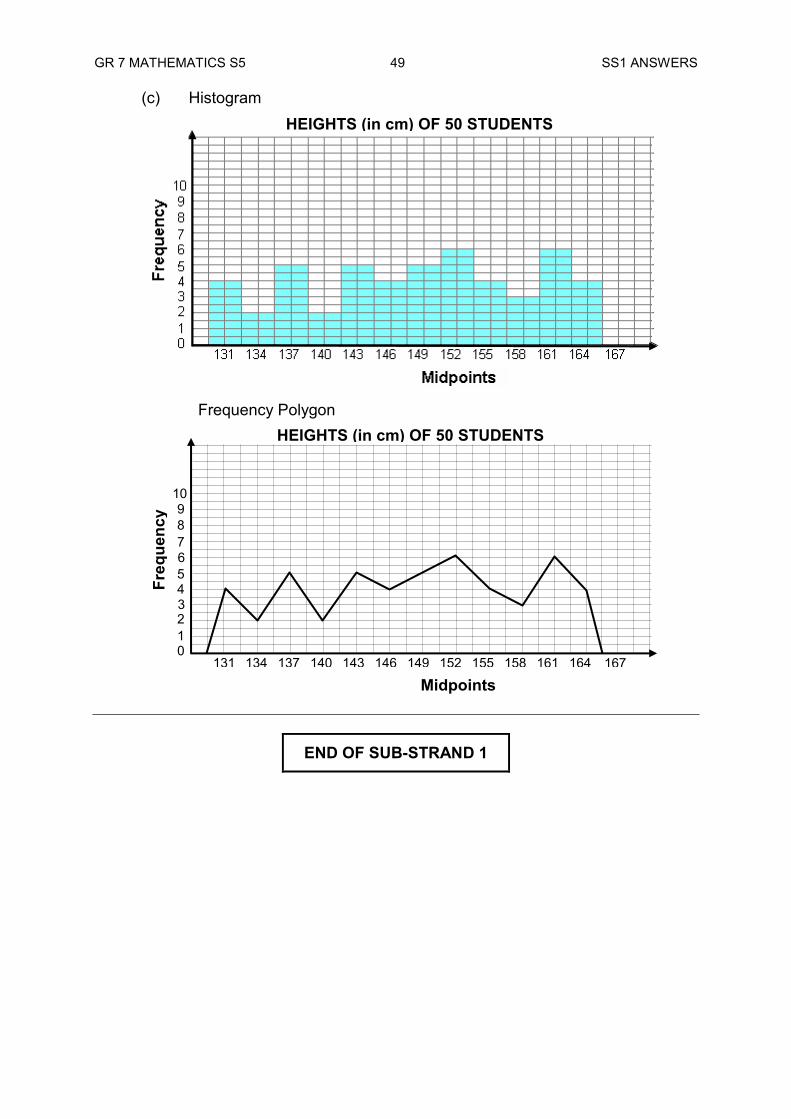
GR 7 MATHEMATICS S5 49 SS1 ANSWERS
(c) Histogram
Frequency Polygon
END OF SUB-STRAND 1
8
6
2 1
Freq
uenc
y
0
4 3
7
9 10
5
131 140 134 137 164 143 146 149 152 155 158 161
Midpoints 167
HEIGHTS (in cm) OF 50 STUDENTS
HEIGHTS (in cm) OF 50 STUDENTS

GR 7 MATHEMATICS S5 50 VACANT PAGE
GR 7 MATHEMATICS S5 51 SS2 TITLE
SUB-STRAND 2
SETS
Lesson 7: Meaning of Sets Lesson 8: Kinds of Sets Lesson 9: Union and Intersection of Sets Lesson10: The Venn Diagram Lesson12: Methods of Classification
GR 7 MATHEMATICS S5 52 SS2 INTRODUCTION SUB-STRAND 2: SETS Introduction
The basic concept of sets, whose importance in mathematics was first considered by George Cantor (1845 – 1918), is so fundamental to the different branches of mathematics that it is impossible to give a precise definition in terms of more basic concepts. However it is so deeply embedded in our intuition that we shall rely on our experience to consider the idea of sets.
We may think of a set as a collection of objects of any sort, restricting ourselves to those objects that are clearly and sufficiently described so that there is no question as to whether a certain object does or does not belong to the set. For example, we might consider the following as sets.
1. The set of Grade 7 students in FODE 2. The set of Grade 7 students in FODE whose surnames begin with the letter M 3. The set of positive numbers less than 5 4. The set of all points that lie on a given line 5. The set of letters in the word “Popondetta.”
In real life situations we group things. Some examples include the following.
Grouping a small village into – a group of old men, a group of old women, a group of girls, a group of boys, a group of baby boys and so on.
Group of girls and group of boys in a class. Living things can be grouped into plants and animals. The students in a school can be put into classes, house colours or into age
groups. In this sub-strand you will study the concepts of sets and use a variety of classification methods. In the first lesson, we will define a set and represent sets using different notations. In the second lesson, we will define the different kinds of sets and recognize the empty set as a group with the particular attribute that it has no members then we will define and find union and intersection of sets in the third lesson. We will also describe, use and draw Venn diagrams to understand the notion of sets in the fourth lesson and lastly, identify the 2 methods of classification of objects. We will also define terms that are used to describe different groups and represent them in a diagram form. This Sub-strand can help us in our organisational skills, especially when it comes to sorting and putting objects into groups. We hope you will enjoy this Sub-strand.
GR 7 MATHEMATICS S5 53 SS2 LESSON 7
A
Lesson 7: Meaning of Set You learnt about sets in your Lower Primary Mathematics. In this lesson you will:
define set
present set using different notations ___________________________________________________________________ “A crowd of people”, „a herd of cows”, “a litter of puppies” are phrases we use in daily life for groups of people or animals. Mathematics also, has a term for groups of objects, especially groups of numbers. This term is set. A set is any collection of objects or things. The following are just some examples of a set.
The set of the past Prime Ministers of Papua New Guinea The set of National High Schools in PNG The set of the Regions of Papua New Guinea The set of distinct letters of the word “mathematics‟ The set of Grade 7 students of FODE whose surnames start with the letter “C” The set of natural numbers: 1, 2, 3, etc.
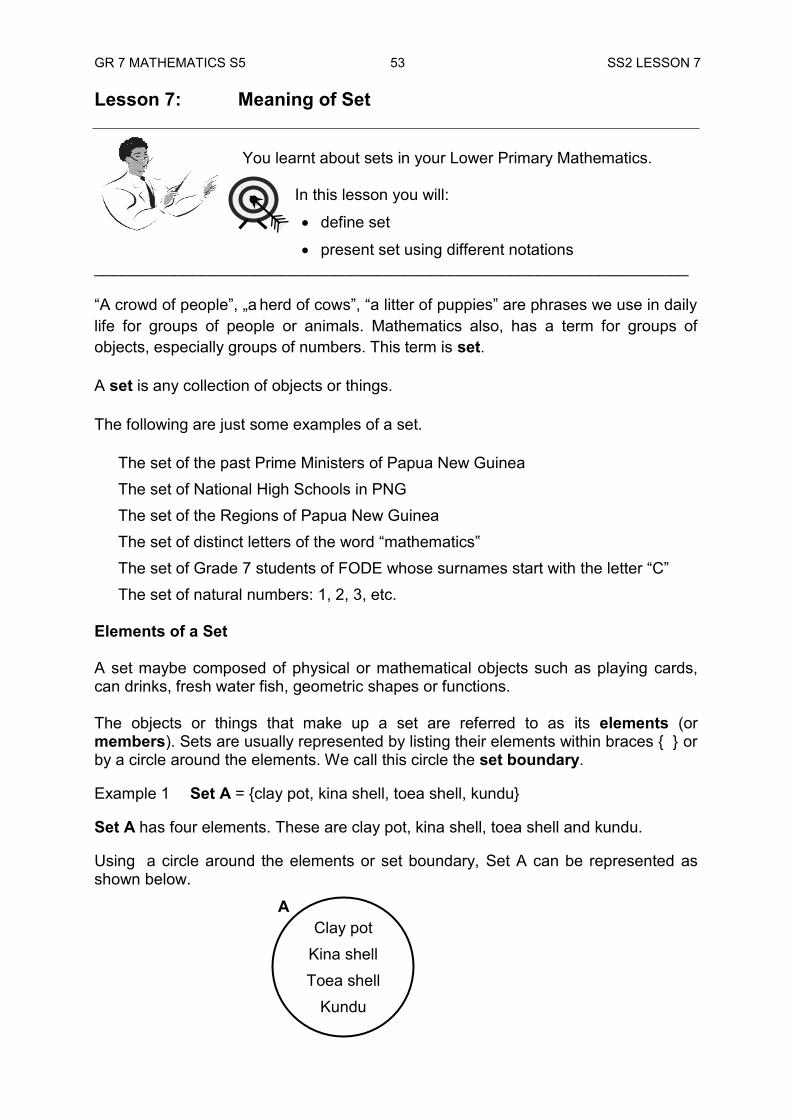
Elements of a Set A set maybe composed of physical or mathematical objects such as playing cards, can drinks, fresh water fish, geometric shapes or functions. The objects or things that make up a set are referred to as its elements (or members). Sets are usually represented by listing their elements within braces { } or by a circle around the elements. We call this circle the set boundary. Example 1 Set A = {clay pot, kina shell, toea shell, kundu} Set A has four elements. These are clay pot, kina shell, toea shell and kundu. Using a circle around the elements or set boundary, Set A can be represented as shown below.
Clay pot Kina shell Toea shell
Kundu
GR 7 MATHEMATICS S5 54 SS2 LESSON 7
B
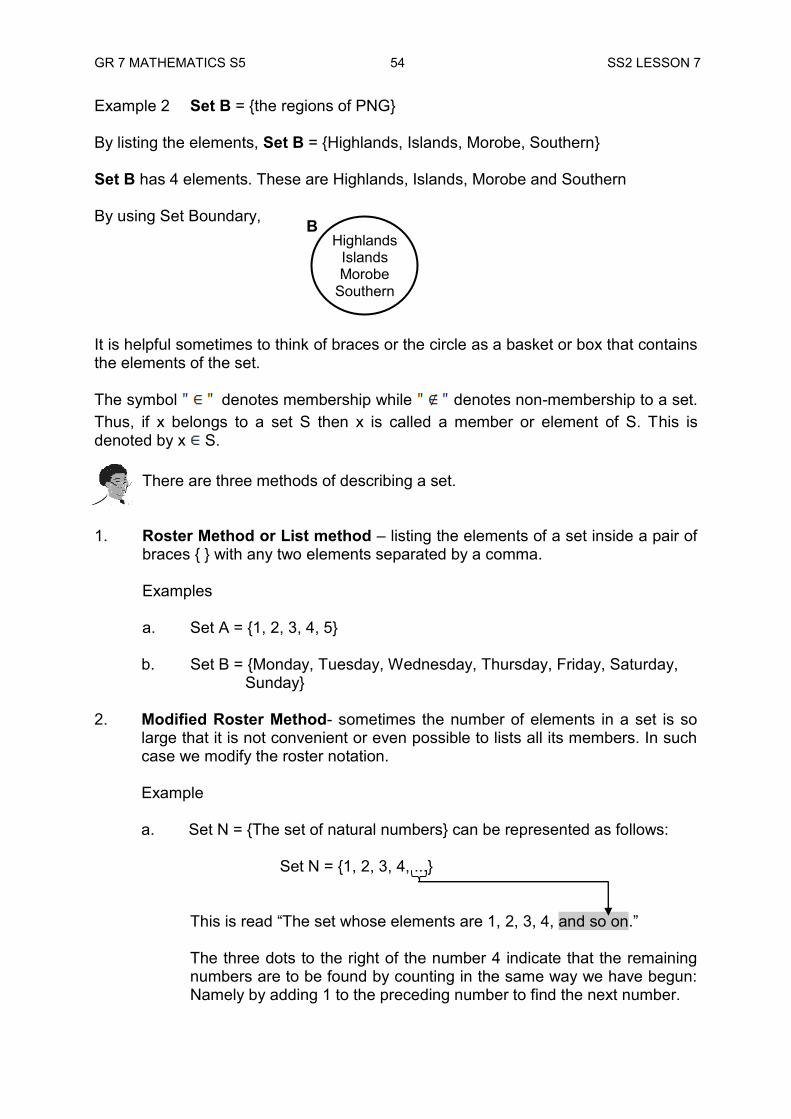
Example 2 Set B = {the regions of PNG} By listing the elements, Set B = {Highlands, Islands, Morobe, Southern} Set B has 4 elements. These are Highlands, Islands, Morobe and Southern By using Set Boundary, It is helpful sometimes to think of braces or the circle as a basket or box that contains the elements of the set. The symbol denotes membership while denotes non-membership to a set. Thus, if x belongs to a set S then x is called a member or element of S. This is denoted by x S.
There are three methods of describing a set. 1. Roster Method or List method – listing the elements of a set inside a pair of
braces { } with any two elements separated by a comma. Examples
a. Set A = {1, 2, 3, 4, 5} b. Set B = {Monday, Tuesday, Wednesday, Thursday, Friday, Saturday,
Sunday} 2. Modified Roster Method- sometimes the number of elements in a set is so
large that it is not convenient or even possible to lists all its members. In such case we modify the roster notation.
Example
a. Set N = {The set of natural numbers} can be represented as follows:
Set N = {1, 2, 3, 4, ...}
This is read “The set whose elements are 1, 2, 3, 4, and so on.” The three dots to the right of the number 4 indicate that the remaining numbers are to be found by counting in the same way we have begun: Namely by adding 1 to the preceding number to find the next number.
Highlands Islands Morobe
Southern
GR 7 MATHEMATICS S5 55 SS2 LESSON 7
b. Set M = {The set of all even numbers} Set M = {2, 4, 6, 8, ...}
This is read “The set whose elements are 2, 4, 6, 8 and so on.” The three dots to the right of the number 8 indicate that the remaining numbers are to be found by counting in the same way we have begun; namely by adding 2 to the preceding number to find the next number.
3. Rule Method or Defining Property Method – describing the elements of the
set wherein the criteria for membership in the set are given. It usually uses the set builder notation wherein the symbol x is used to represent any member of the given set.
Examples The examples in number 1 can also be written as follows:
a. Set A = {x, such that x is a number less than 6} A shorter and more efficient notation is Set A = {x|x is a number less than 6}, where the vertical bar is read “such that”.
b. Set B = {x|x is a day of the week}
NOW DO PRACTICE EXERCISE 7
GR 7 MATHEMATICS S5 56 SS2 LESSON 7 Practice Exercise 7 1. What is a set?
2. List five examples of sets. 3. Write the members of each of these sets inside a set boundary. Then describe
each set in words. a) Kina, toea b) Sunday, Monday, Tuesday, Wednesday, Thursday, Friday, Saturday c) January, February, March, April, May, June d) July, August, September, October, November, December ___________________________________________________________________ 4. Write the members of each of these sets using braces. a) The set of the days of the week beginning with T. b) The set of the months of the year beginning with J. c) The set of the first ten counting numbers. d) The set of the first eleven whole numbers. e) The set of the first ten triangle numbers. f) The set of the first ten square numbers. g) The set of letters in the alphabet.
CHECK YOUR WORK. ANSWERS ARE AT THE END OF SUB-STRAND 2.
GR 7 MATHEMATICS S5 57 SS2 LESSON 8 Lesson 8: Kinds of Sets
In the previous lesson, you defined sets and represented sets using different notations.
In this lesson you will:
identify different kinds of sets
define and recognise an empty set as a group with the particular attribute that it has no members.
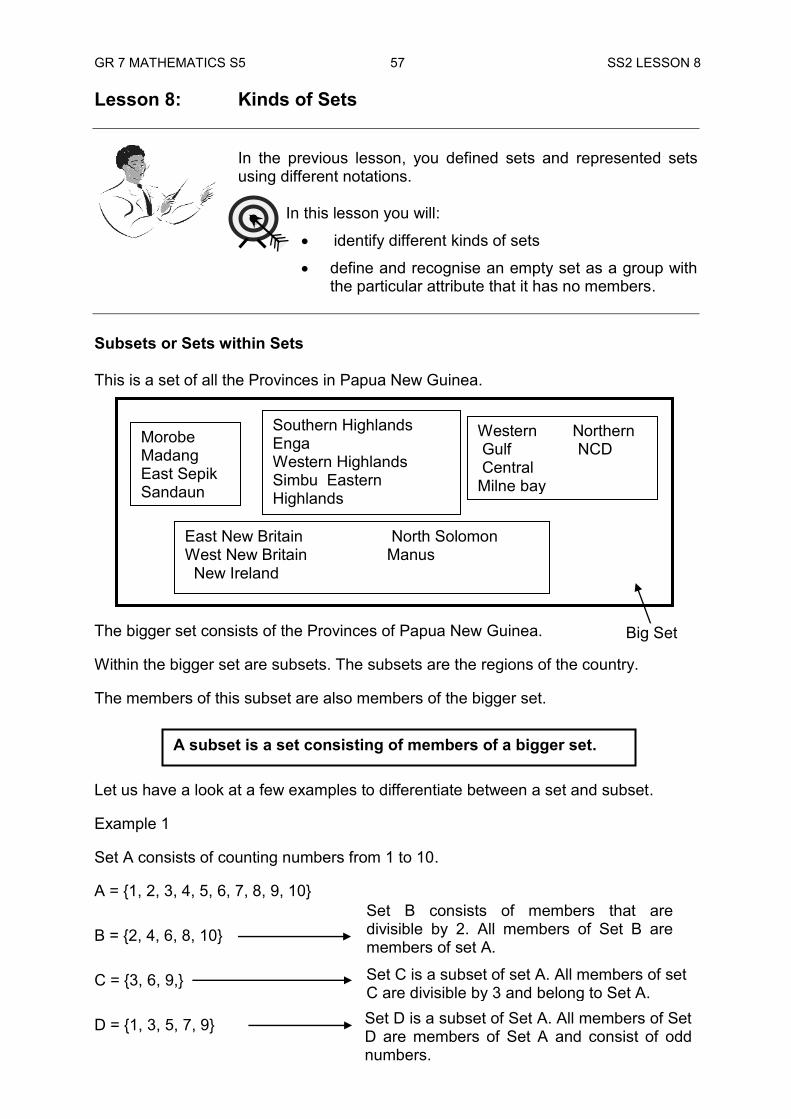
Subsets or Sets within Sets This is a set of all the Provinces in Papua New Guinea. The bigger set consists of the Provinces of Papua New Guinea. Within the bigger set are subsets. The subsets are the regions of the country. The members of this subset are also members of the bigger set. Let us have a look at a few examples to differentiate between a set and subset. Example 1 Set A consists of counting numbers from 1 to 10. A = {1, 2, 3, 4, 5, 6, 7, 8, 9, 10} B = {2, 4, 6, 8, 10} C = {3, 6, 9,} D = {1, 3, 5, 7, 9}
A subset is a set consisting of members of a bigger set.
Morobe Madang East Sepik Sandaun
Western Northern Gulf NCD Central Milne bay
Southern Highlands Enga Western Highlands Simbu Eastern Highlands
East New Britain North Solomon West New Britain Manus New Ireland
Big Set
Set B consists of members that are divisible by 2. All members of Set B are members of set A. Set B is subset of set A. Set C is a subset of set A. All members of set C are divisible by 3 and belong to Set A. Set D is a subset of Set A. All members of Set D are members of Set A and consist of odd numbers.
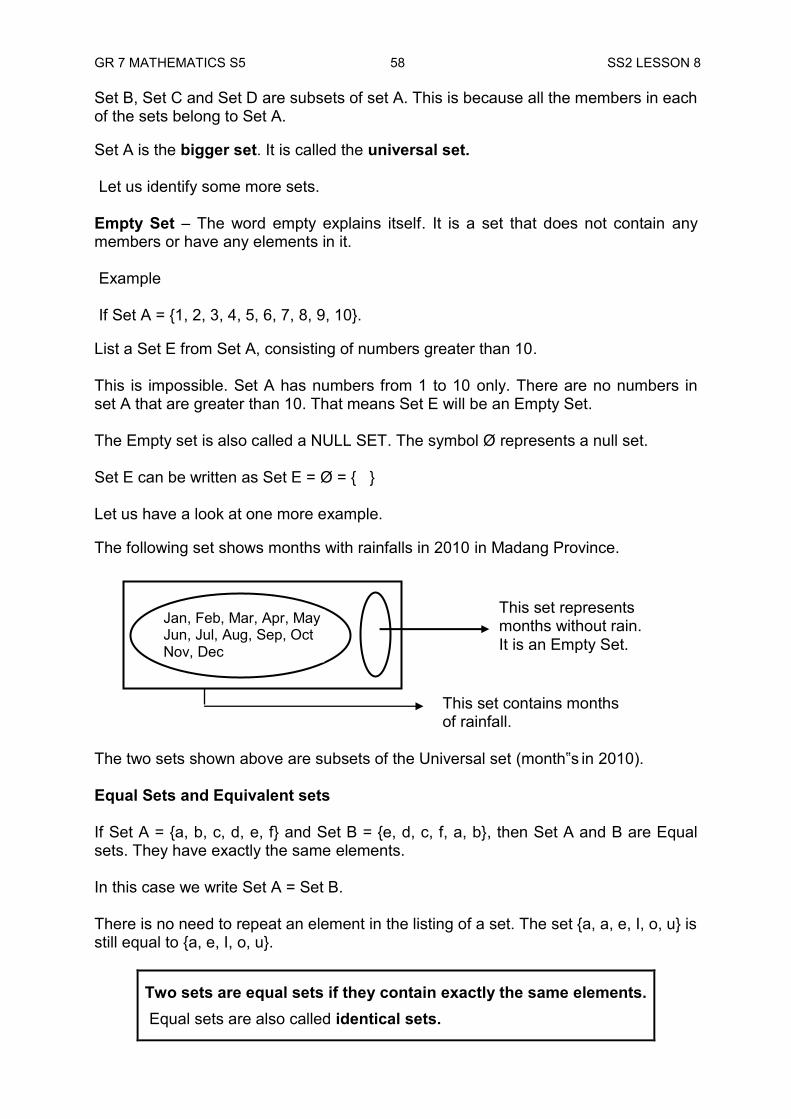
GR 7 MATHEMATICS S5 58 SS2 LESSON 8 Set B, Set C and Set D are subsets of set A. This is because all the members in each of the sets belong to Set A. Set A is the bigger set. It is called the universal set. Let us identify some more sets. Empty Set – The word empty explains itself. It is a set that does not contain any members or have any elements in it. Example If Set A = {1, 2, 3, 4, 5, 6, 7, 8, 9, 10}. List a Set E from Set A, consisting of numbers greater than 10. This is impossible. Set A has numbers from 1 to 10 only. There are no numbers in set A that are greater than 10. That means Set E will be an Empty Set. The Empty set is also called a NULL SET. The symbol Ø represents a null set. Set E can be written as Set E = Ø = { } Let us have a look at one more example. The following set shows months with rainfalls in 2010 in Madang Province. The two sets shown above are subsets of the Universal set (month‟s in 2010). Equal Sets and Equivalent sets If Set A = {a, b, c, d, e, f} and Set B = {e, d, c, f, a, b}, then Set A and B are Equal sets. They have exactly the same elements. In this case we write Set A = Set B. There is no need to repeat an element in the listing of a set. The set {a, a, e, I, o, u} is still equal to {a, e, I, o, u}.
Two sets are equal sets if they contain exactly the same elements. Equal sets are also called identical sets.
This set represents months without rain. It is an Empty Set.
This set contains months of rainfall.
Jan, Feb, Mar, Apr, May Jun, Jul, Aug, Sep, Oct Nov, Dec
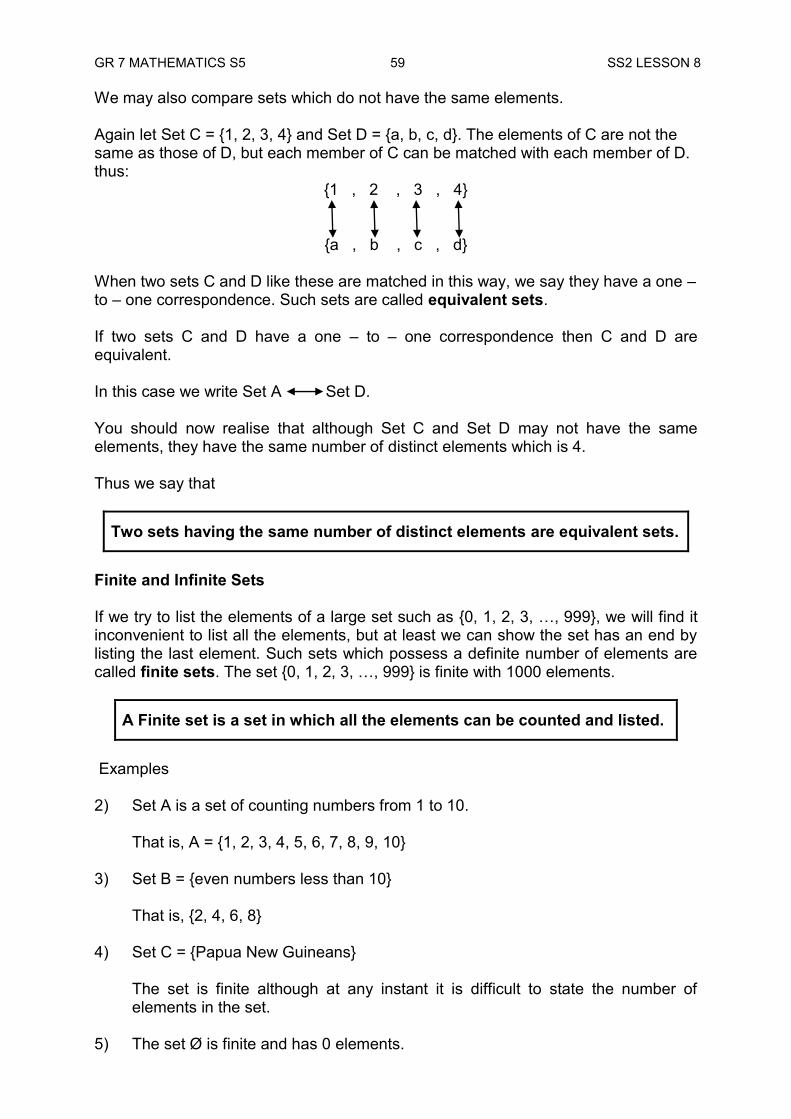
GR 7 MATHEMATICS S5 59 SS2 LESSON 8 We may also compare sets which do not have the same elements. Again let Set C = {1, 2, 3, 4} and Set D = {a, b, c, d}. The elements of C are not the same as those of D, but each member of C can be matched with each member of D. thus:
{1 , 2 , 3 , 4}
{a , b , c , d} When two sets C and D like these are matched in this way, we say they have a one – to – one correspondence. Such sets are called equivalent sets. If two sets C and D have a one – to – one correspondence then C and D are equivalent. In this case we write Set A Set D. You should now realise that although Set C and Set D may not have the same elements, they have the same number of distinct elements which is 4. Thus we say that
Two sets having the same number of distinct elements are equivalent sets.
Finite and Infinite Sets If we try to list the elements of a large set such as {0, 1, 2, 3, …, 999}, we will find it inconvenient to list all the elements, but at least we can show the set has an end by listing the last element. Such sets which possess a definite number of elements are called finite sets. The set {0, 1, 2, 3, …, 999} is finite with 1000 elements.
A Finite set is a set in which all the elements can be counted and listed.
Examples 2) Set A is a set of counting numbers from 1 to 10.
That is, A = {1, 2, 3, 4, 5, 6, 7, 8, 9, 10}
3) Set B = {even numbers less than 10}
That is, {2, 4, 6, 8} 4) Set C = {Papua New Guineans}
The set is finite although at any instant it is difficult to state the number of elements in the set.
5) The set Ø is finite and has 0 elements.
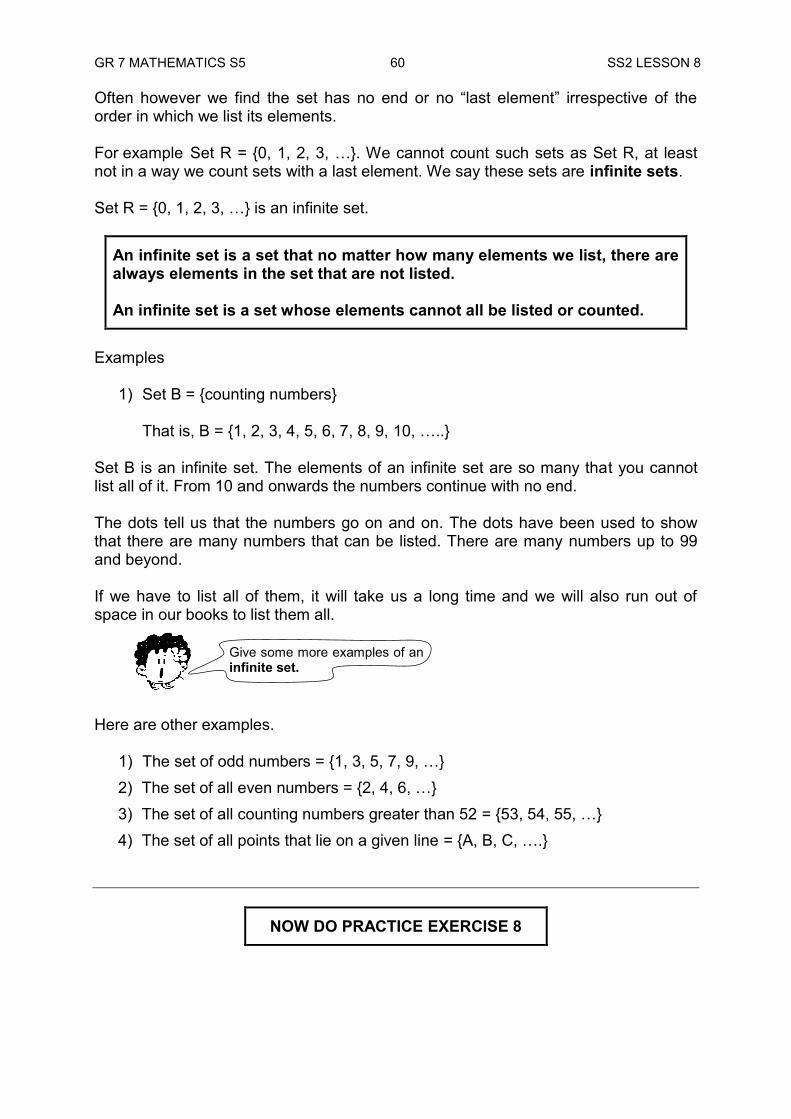
GR 7 MATHEMATICS S5 60 SS2 LESSON 8 Often however we find the set has no end or no “last element” irrespective of the order in which we list its elements. For example Set R = {0, 1, 2, 3, …}. We cannot count such sets as Set R, at least not in a way we count sets with a last element. We say these sets are infinite sets. Set R = {0, 1, 2, 3, …} is an infinite set.
An infinite set is a set that no matter how many elements we list, there are always elements in the set that are not listed. An infinite set is a set whose elements cannot all be listed or counted.
Examples
1) Set B = {counting numbers} That is, B = {1, 2, 3, 4, 5, 6, 7, 8, 9, 10, …..} Set B is an infinite set. The elements of an infinite set are so many that you cannot list all of it. From 10 and onwards the numbers continue with no end. The dots tell us that the numbers go on and on. The dots have been used to show that there are many numbers that can be listed. There are many numbers up to 99 and beyond. If we have to list all of them, it will take us a long time and we will also run out of space in our books to list them all. Here are other examples.
1) The set of odd numbers = {1, 3, 5, 7, 9, …} 2) The set of all even numbers = {2, 4, 6, …} 3) The set of all counting numbers greater than 52 = {53, 54, 55, …} 4) The set of all points that lie on a given line = {A, B, C, ….}
NOW DO PRACTICE EXERCISE 8
Give some more examples of an infinite set.
GR 7 MATHEMATICS S5 61 SS2 LESSON 8 Practice Exercise 8 1. Draw a set representing the Provinces of PNG and show a subset of the
following (a) The Southern Region Provinces (b) The Island Region Provinces
2. Inside a set boundary, present the set of the first ten square numbers. Now
draw a set boundary around each of these subsets.
(a) The square numbers which are also odd numbers. (b) The square numbers which are also even numbers.
3. A universal set consists of odd numbers from 1 to 10. {1, 3, 5, 7, 9}
Following are subsets of the universal set. Present the sets using the roster method. The first one has been done for you.
(a) A set less than 5 = {1, 3} (b) A set greater than 5
(c) A set divisible by 3
(d) A set divisible by 2
4. List the elements of the following sets. Which of them are infinite?
(a) {even numbers less than 12}
(b) {odd numbers less than 6}
(c) {prime numbers}
(d) {odd numbers greater than 6}
(e) {even numbers between 5 and 12}
GR 7 MATHEMATICS S5 62 SS2 LESSON 8 5. Use the roster method to specify each of the sets listed below. The first one is
done for you.
(a) The set of letters in the word “indian” Answer: {i, n, d, a, n}
(b) The set of letters in the word “naid”
(c) The set of letters in the word “dain”
(d) The set of letters in the word “naidin”
(e) The set of letters in the word “ tain” 6. Tell which of the sets in Question 5 are equivalent and which are equal.
CHECK YOUR WORK. ANSWERS ARE AT THE END OF SUB-STRAND 2.
GR 7 MATHEMATICS S5 63 SS2 LESSON 9 Lesson 9: Union and Intersection of Sets In the previous lesson we identified different types of sets. In this lesson you will:
define union and intersection of sets
differentiate between the two sets
find the union and intersection of given sets. Intersection of Sets What is an Intersection of Sets?
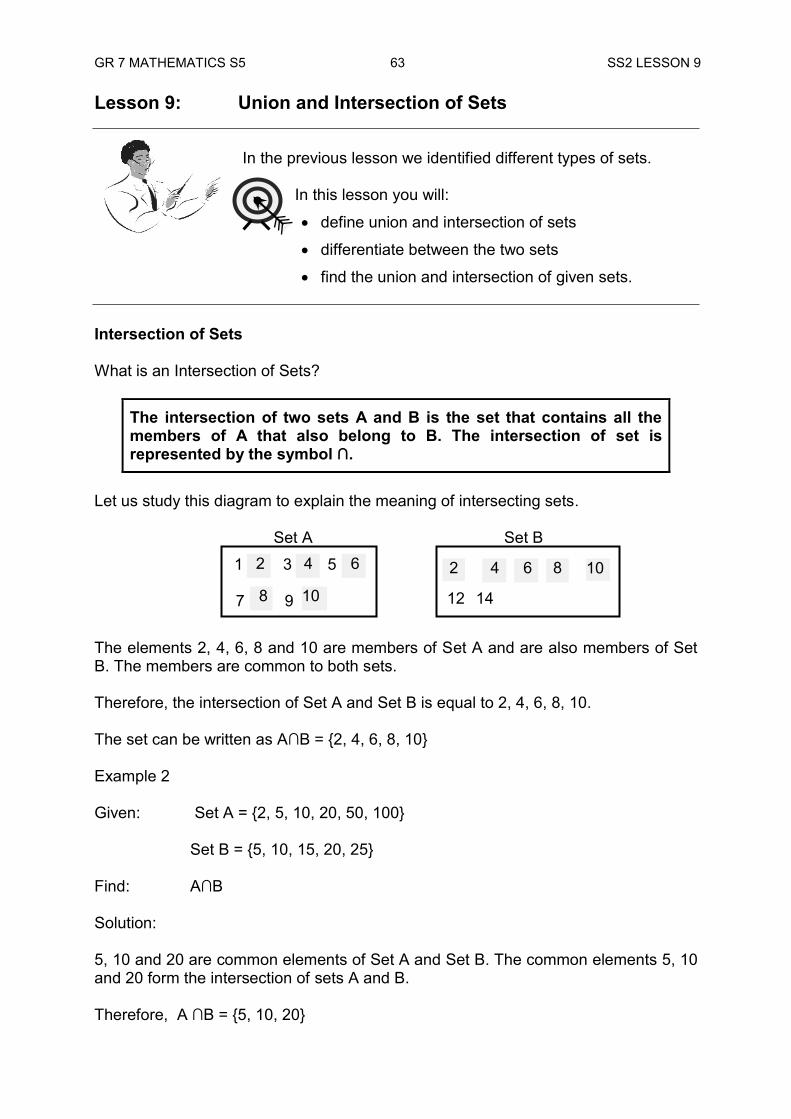
The intersection of two sets A and B is the set that contains all the members of A that also belong to B. The intersection of set is represented by the symbol ∩.
Let us study this diagram to explain the meaning of intersecting sets. Set A Set B The elements 2, 4, 6, 8 and 10 are members of Set A and are also members of Set B. The members are common to both sets. Therefore, the intersection of Set A and Set B is equal to 2, 4, 6, 8, 10. The set can be written as A∩B = {2, 4, 6, 8, 10} Example 2 Given: Set A = {2, 5, 10, 20, 50, 100} Set B = {5, 10, 15, 20, 25} Find: A∩B Solution: 5, 10 and 20 are common elements of Set A and Set B. The common elements 5, 10 and 20 form the intersection of sets A and B. Therefore, A ∩B = {5, 10, 20}
1 3 5 7 9
12 14
2 4 6
10
8 2 10 4 6
8
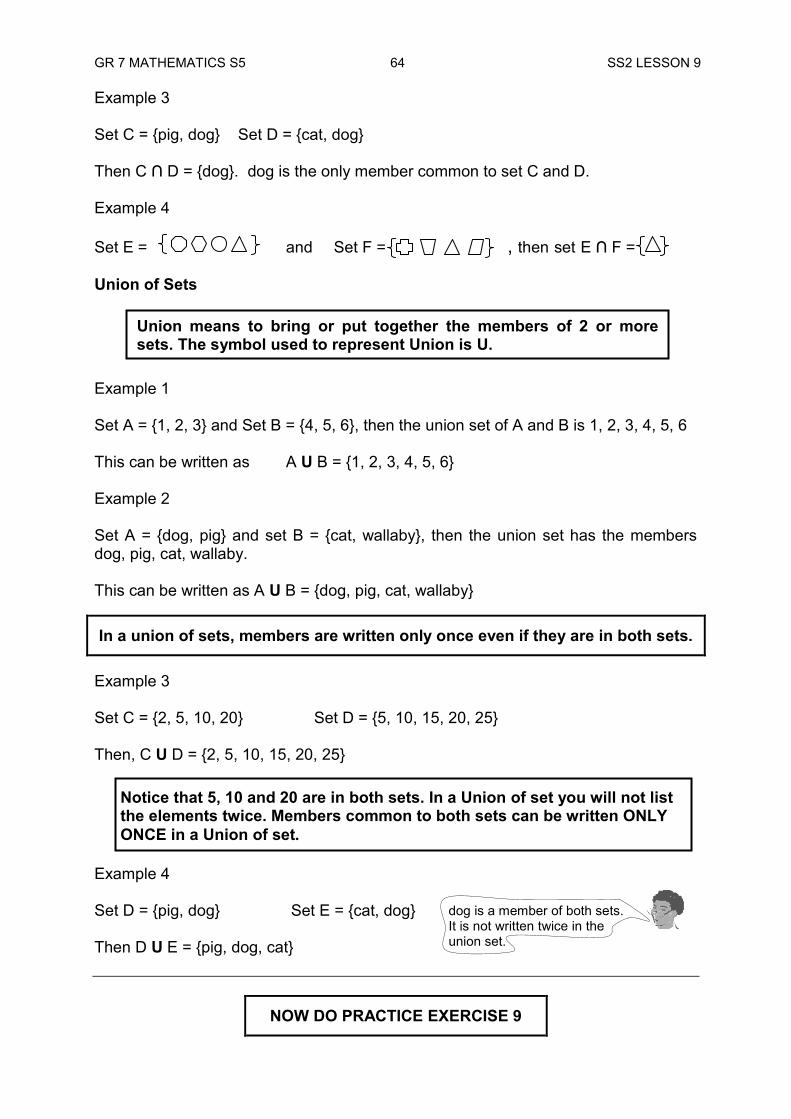
GR 7 MATHEMATICS S5 64 SS2 LESSON 9 Example 3 Set C = {pig, dog} Set D = {cat, dog} Then C ∩ D = {dog}. dog is the only member common to set C and D. Example 4 Set E = and Set F = , then set E ∩ F = Union of Sets Example 1 Set A = {1, 2, 3} and Set B = {4, 5, 6}, then the union set of A and B is 1, 2, 3, 4, 5, 6 This can be written as A U B = {1, 2, 3, 4, 5, 6} Example 2 Set A = {dog, pig} and set B = {cat, wallaby}, then the union set has the members dog, pig, cat, wallaby. This can be written as A U B = {dog, pig, cat, wallaby}
In a union of sets, members are written only once even if they are in both sets. Example 3 Set C = {2, 5, 10, 20} Set D = {5, 10, 15, 20, 25} Then, C U D = {2, 5, 10, 15, 20, 25} Example 4 Set D = {pig, dog} Set E = {cat, dog} Then D U E = {pig, dog, cat}
NOW DO PRACTICE EXERCISE 9
Notice that 5, 10 and 20 are in both sets. In a Union of set you will not list the elements twice. Members common to both sets can be written ONLY ONCE in a Union of set.
Union means to bring or put together the members of 2 or more sets. The symbol used to represent Union is U.
dog is a member of both sets. It is not written twice in the union set.
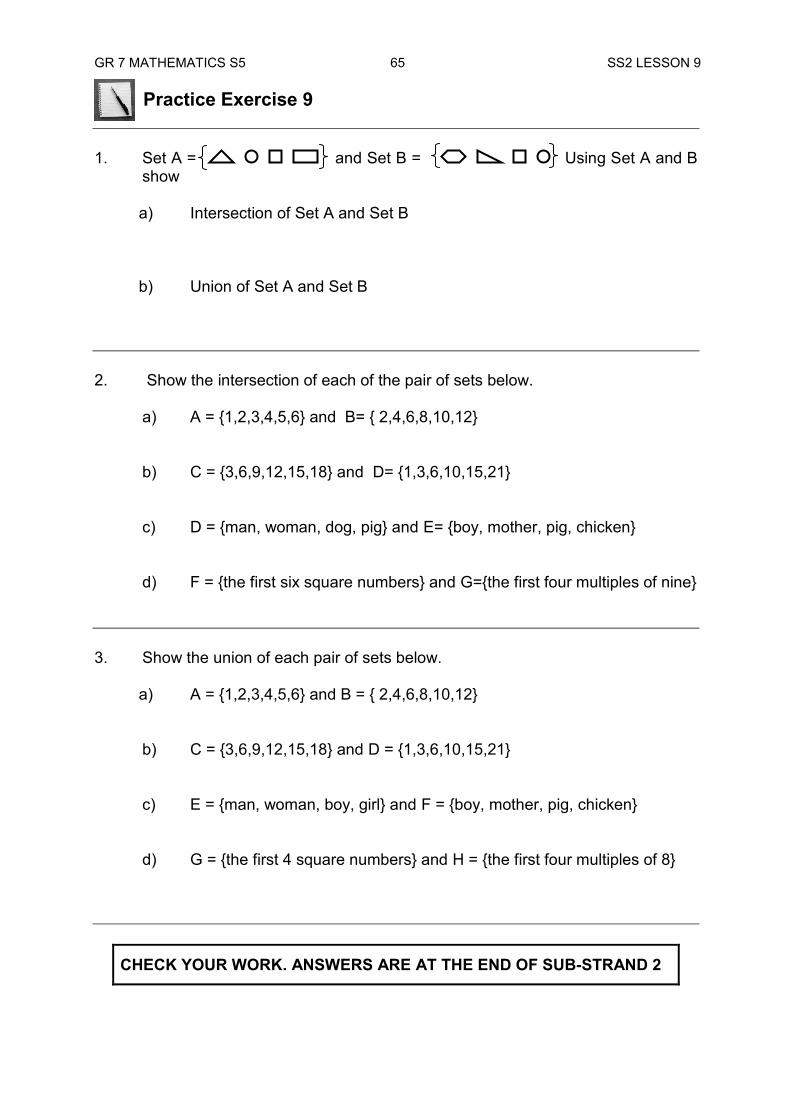
GR 7 MATHEMATICS S5 65 SS2 LESSON 9 Practice Exercise 9 1. Set A = and Set B = Using Set A and B
show a) Intersection of Set A and Set B b) Union of Set A and Set B 2. Show the intersection of each of the pair of sets below. a) A = {1,2,3,4,5,6} and B= { 2,4,6,8,10,12} b) C = {3,6,9,12,15,18} and D= {1,3,6,10,15,21} c) D = {man, woman, dog, pig} and E= {boy, mother, pig, chicken} d) F = {the first six square numbers} and G={the first four multiples of nine} 3. Show the union of each pair of sets below. a) A = {1,2,3,4,5,6} and B = { 2,4,6,8,10,12} b) C = {3,6,9,12,15,18} and D = {1,3,6,10,15,21} c) E = {man, woman, boy, girl} and F = {boy, mother, pig, chicken} d) G = {the first 4 square numbers} and H = {the first four multiples of 8}
CHECK YOUR WORK. ANSWERS ARE AT THE END OF SUB-STRAND 2
GR 7 MATHEMATICS S5 66 SS2 LESSON 10 Lesson 10: Venn Diagrams
In the previous lesson you have learnt the union and intersection of sets.
In this lesson you will:
define what a Venn Diagram is
draw a Venn Diagram
use Venn Diagrams to represent sets. What is a Venn diagram?
A Venn diagram is a diagram used for sorting objects or things. It uses a rectangle to represent the bigger set (Universal Set) and all the subsets of the bigger set by circles inside the rectangle. Elements common to more than one set are represented by intersection of circles.
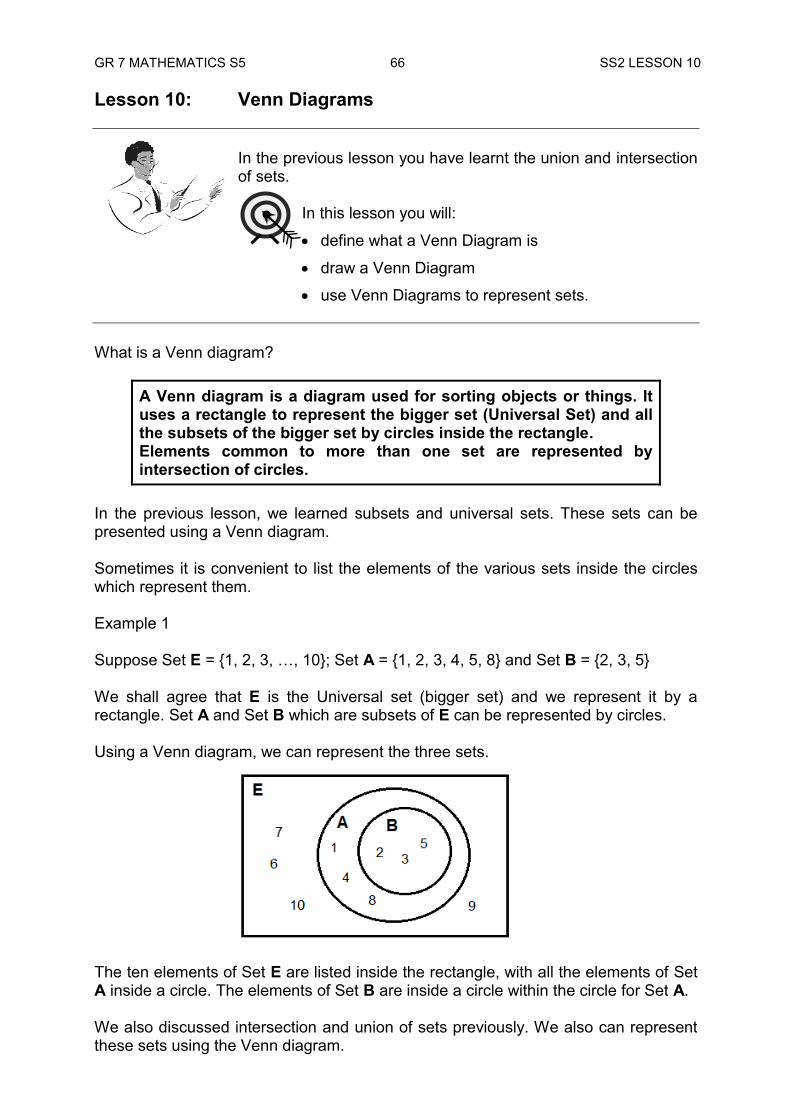
In the previous lesson, we learned subsets and universal sets. These sets can be presented using a Venn diagram. Sometimes it is convenient to list the elements of the various sets inside the circles which represent them. Example 1 Suppose Set E = {1, 2, 3, …, 10}; Set A = {1, 2, 3, 4, 5, 8} and Set B = {2, 3, 5} We shall agree that E is the Universal set (bigger set) and we represent it by a rectangle. Set A and Set B which are subsets of E can be represented by circles. Using a Venn diagram, we can represent the three sets.
The ten elements of Set E are listed inside the rectangle, with all the elements of Set A inside a circle. The elements of Set B are inside a circle within the circle for Set A. We also discussed intersection and union of sets previously. We also can represent these sets using the Venn diagram.
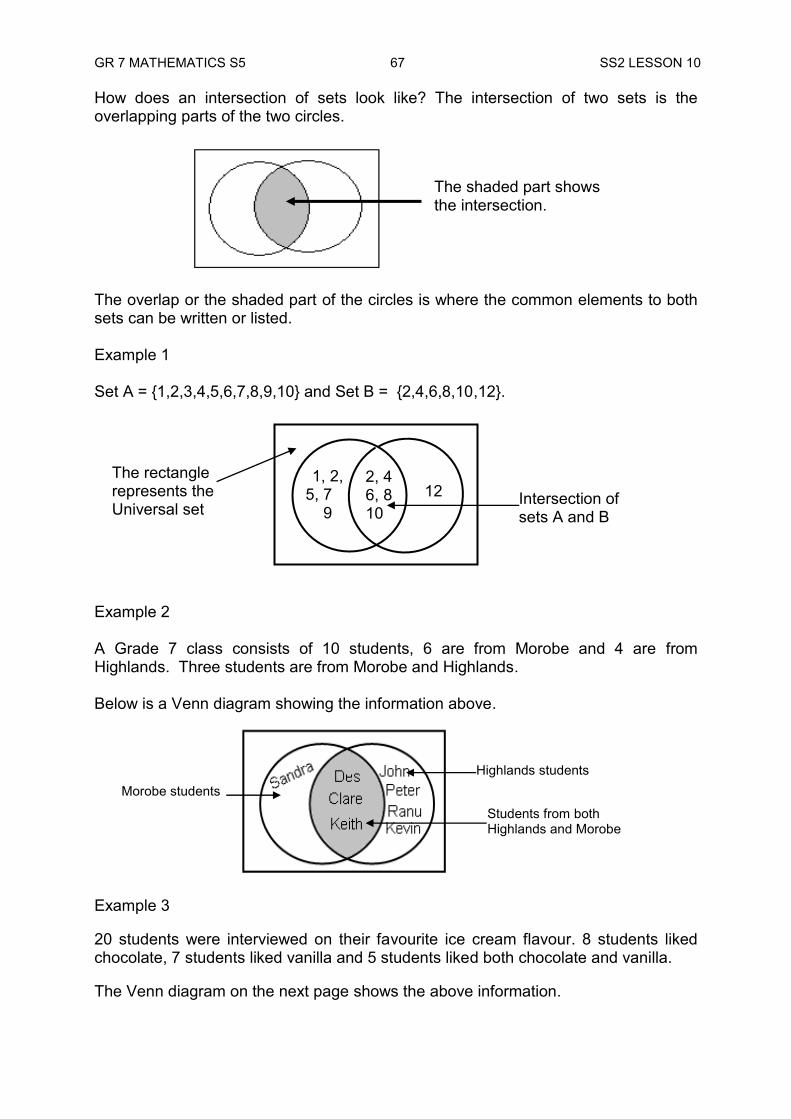
GR 7 MATHEMATICS S5 67 SS2 LESSON 10 How does an intersection of sets look like? The intersection of two sets is the overlapping parts of the two circles. The overlap or the shaded part of the circles is where the common elements to both sets can be written or listed. Example 1 Set A = {1,2,3,4,5,6,7,8,9,10} and Set B = {2,4,6,8,10,12}.
Example 2 A Grade 7 class consists of 10 students, 6 are from Morobe and 4 are from Highlands. Three students are from Morobe and Highlands. Below is a Venn diagram showing the information above. Example 3 20 students were interviewed on their favourite ice cream flavour. 8 students liked chocolate, 7 students liked vanilla and 5 students liked both chocolate and vanilla. The Venn diagram on the next page shows the above information.
The shaded part shows the intersection.
Highlands students
Students from both Highlands and Morobe
Morobe students
The rectangle represents the Universal set
Intersection of sets A and B
1, 2, 5, 7 9
2, 4 6, 8 10
12
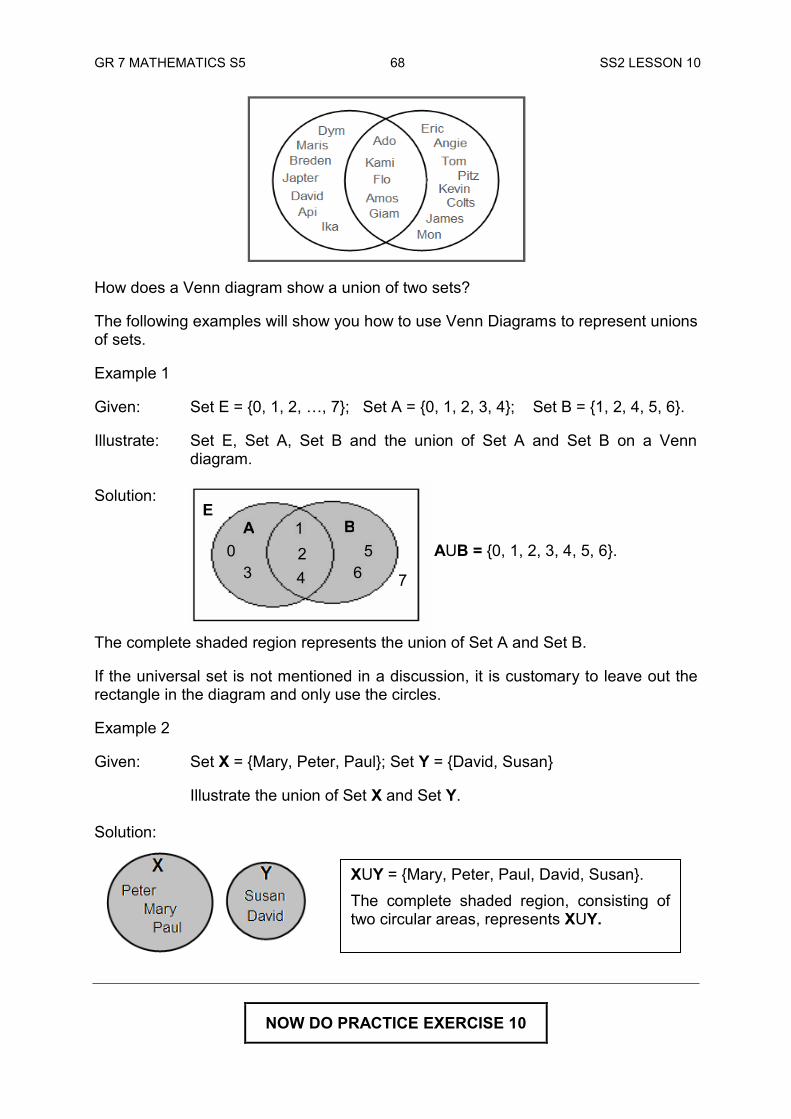
GR 7 MATHEMATICS S5 68 SS2 LESSON 10 How does a Venn diagram show a union of two sets? The following examples will show you how to use Venn Diagrams to represent unions of sets. Example 1 Given: Set E = {0, 1, 2, …, 7}; Set A = {0, 1, 2, 3, 4}; Set B = {1, 2, 4, 5, 6}. Illustrate: Set E, Set A, Set B and the union of Set A and Set B on a Venn
diagram. Solution: AUB = {0, 1, 2, 3, 4, 5, 6}. The complete shaded region represents the union of Set A and Set B. If the universal set is not mentioned in a discussion, it is customary to leave out the rectangle in the diagram and only use the circles. Example 2 Given: Set X = {Mary, Peter, Paul}; Set Y = {David, Susan} Illustrate the union of Set X and Set Y. Solution:
NOW DO PRACTICE EXERCISE 10
1
2
3 4
1 5
6 0
7
E A B
XUY = {Mary, Peter, Paul, David, Susan}. The complete shaded region, consisting of two circular areas, represents XUY.
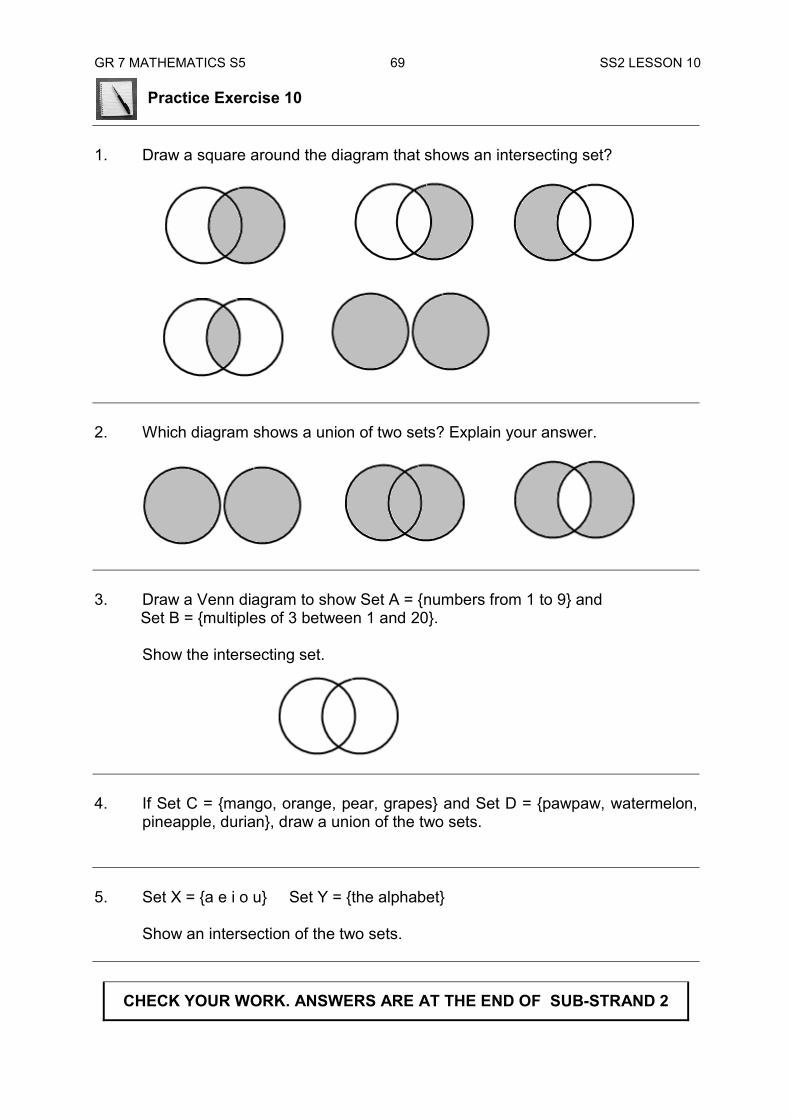
GR 7 MATHEMATICS S5 69 SS2 LESSON 10 Practice Exercise 10 1. Draw a square around the diagram that shows an intersecting set?
2. Which diagram shows a union of two sets? Explain your answer.
3. Draw a Venn diagram to show Set A = {numbers from 1 to 9} and
Set B = {multiples of 3 between 1 and 20}. Show the intersecting set.
4. If Set C = {mango, orange, pear, grapes} and Set D = {pawpaw, watermelon,
pineapple, durian}, draw a union of the two sets. 5. Set X = {a e i o u} Set Y = {the alphabet} Show an intersection of the two sets.
CHECK YOUR WORK. ANSWERS ARE AT THE END OF SUB-STRAND 2
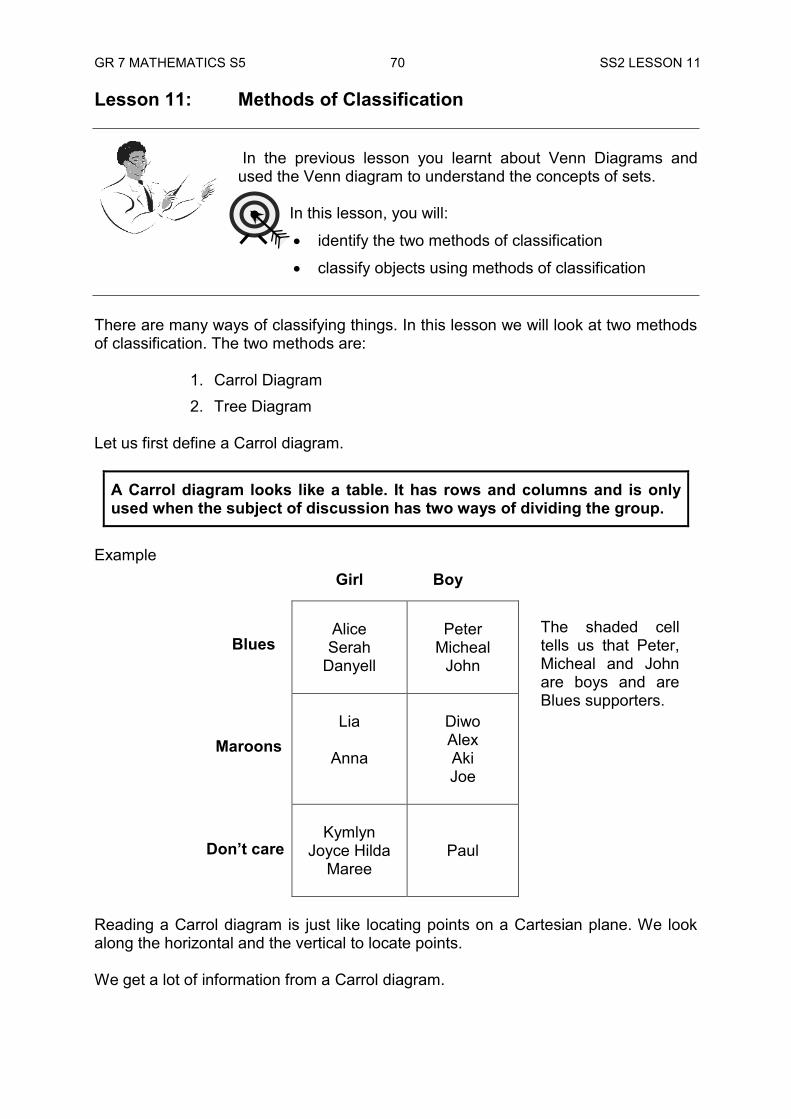
GR 7 MATHEMATICS S5 70 SS2 LESSON 11 Lesson 11: Methods of Classification
In the previous lesson you learnt about Venn Diagrams and used the Venn diagram to understand the concepts of sets.
In this lesson, you will:
identify the two methods of classification
classify objects using methods of classification There are many ways of classifying things. In this lesson we will look at two methods of classification. The two methods are:
1. Carrol Diagram 2. Tree Diagram
Let us first define a Carrol diagram.
A Carrol diagram looks like a table. It has rows and columns and is only used when the subject of discussion has two ways of dividing the group.
Example
Alice Serah
Danyell
Peter
Micheal John
Lia
Anna
Diwo Alex Aki Joe
Kymlyn Joyce Hilda
Maree
Paul
Reading a Carrol diagram is just like locating points on a Cartesian plane. We look along the horizontal and the vertical to locate points. We get a lot of information from a Carrol diagram.
Blues
Maroons
Don’t care
Girl Boy
The shaded cell tells us that Peter, Micheal and John are boys and are Blues supporters.
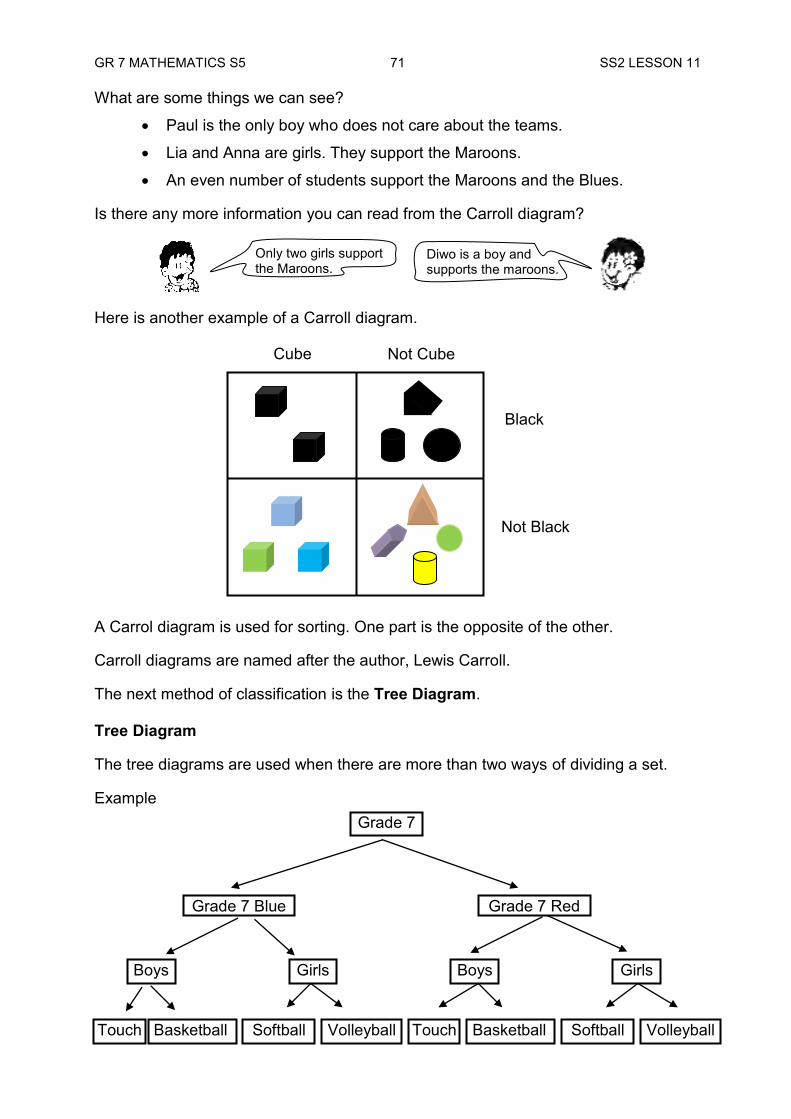
GR 7 MATHEMATICS S5 71 SS2 LESSON 11 What are some things we can see?
Paul is the only boy who does not care about the teams.
Lia and Anna are girls. They support the Maroons.
An even number of students support the Maroons and the Blues. Is there any more information you can read from the Carroll diagram? Here is another example of a Carroll diagram. A Carrol diagram is used for sorting. One part is the opposite of the other. Carroll diagrams are named after the author, Lewis Carroll. The next method of classification is the Tree Diagram. Tree Diagram The tree diagrams are used when there are more than two ways of dividing a set. Example
Diwo is a boy and supports the maroons.
Only two girls support the Maroons.
Touch
Grade 7
Grade 7 Blue Grade 7 Red
Boys Girls Boys Girls
Volleyball Softball Basketball Volleyball Softball Touch Basketball
Cube Not Cube
Black
Not Black
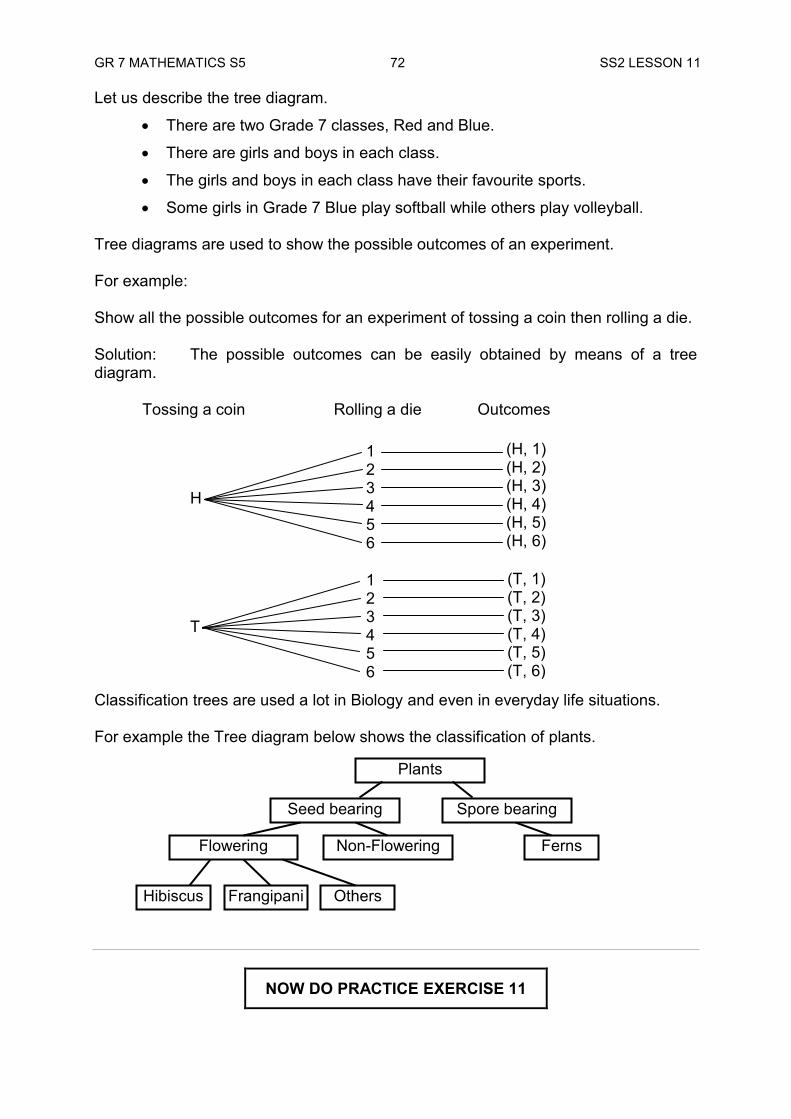
GR 7 MATHEMATICS S5 72 SS2 LESSON 11 Let us describe the tree diagram.
There are two Grade 7 classes, Red and Blue.
There are girls and boys in each class.
The girls and boys in each class have their favourite sports.
Some girls in Grade 7 Blue play softball while others play volleyball. Tree diagrams are used to show the possible outcomes of an experiment. For example: Show all the possible outcomes for an experiment of tossing a coin then rolling a die. Solution: The possible outcomes can be easily obtained by means of a tree diagram. Tossing a coin Rolling a die Outcomes H T Classification trees are used a lot in Biology and even in everyday life situations. For example the Tree diagram below shows the classification of plants.
NOW DO PRACTICE EXERCISE 11
1 2 3 4 5 6
(H, 1) (H, 2) (H, 3) (H, 4) (H, 5) (H, 6)
1 2 3 4 5 6
(T, 1) (T, 2) (T, 3) (T, 4) (T, 5) (T, 6)
Plants
Flowering Non-Flowering
Hibiscus
Seed bearing Spore bearing
Frangipani Others
Ferns
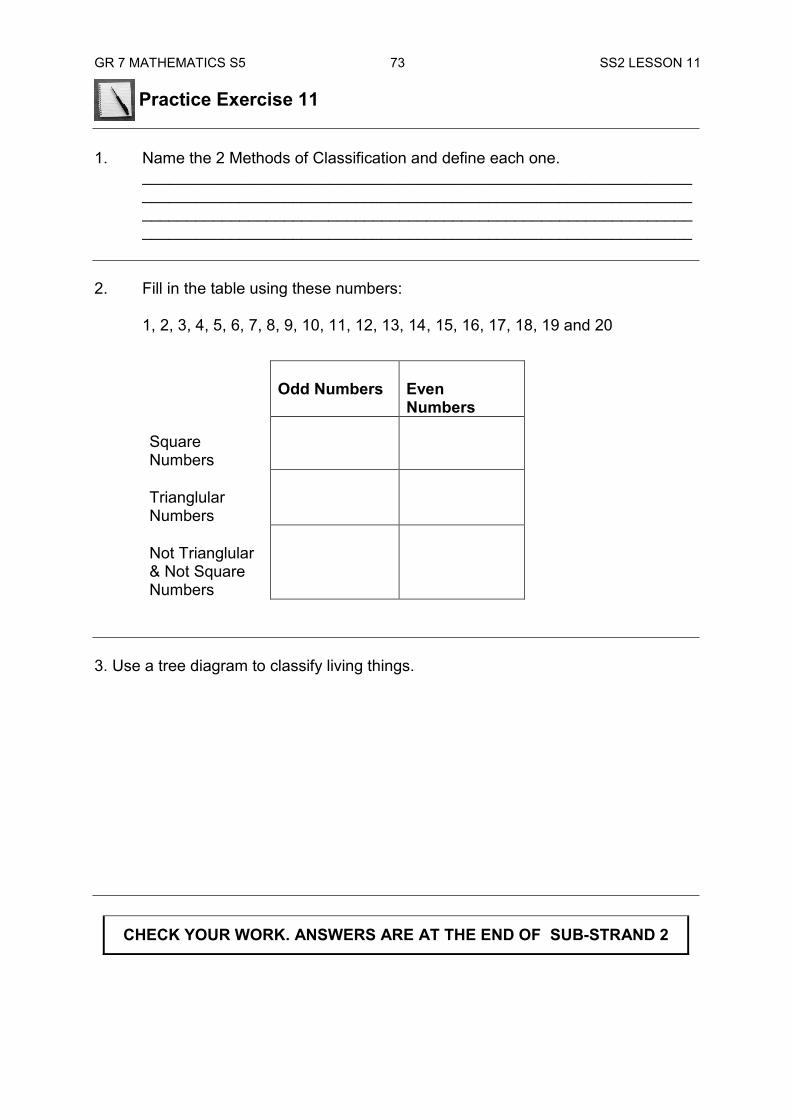
GR 7 MATHEMATICS S5 73 SS2 LESSON 11 Practice Exercise 11 1. Name the 2 Methods of Classification and define each one. ______________________________________________________________ ______________________________________________________________ ______________________________________________________________ ______________________________________________________________ 2. Fill in the table using these numbers: 1, 2, 3, 4, 5, 6, 7, 8, 9, 10, 11, 12, 13, 14, 15, 16, 17, 18, 19 and 20
Odd Numbers
Even Numbers
Square Numbers
Trianglular Numbers
Not Trianglular & Not Square Numbers
3. Use a tree diagram to classify living things.
CHECK YOUR WORK. ANSWERS ARE AT THE END OF SUB-STRAND 2
GR 7 MATHEMATICS S5 74 SS2 SUMMARY SUB-STRAND 2: SUMMARY The study of sets is the foundation of probability, statistics and Mathematics in general. A set is a collection. The collection can be objects, numbers and geometric
shapes. A set consists of elements or members. A universal set consists of subsets. It is sometimes referred to as a bigger set. Members of a subset are members of a universal set. The members of an infinite set cannot be listed and therefore a dot is used to
represent the members that cannot be listed. The dots tell us that the pattern continues.
The members of a finite set can be listed. Equal Sets have exactly the same members. Equivalent Sets have exactly the same number of members. The union of two or more sets consist of all members of the set. Intersecting sets have members in common. All sets can be classified using a Carrol diagram or Tree diagram A Tree diagram is used when there are more than two ways of representing a
group. A Carrol diagram is used when there are only two ways of representing a
group. A Venn diagram is a pictorial diagram representing sets. Circles are used to
represent sets drawn in a rectangle. The rectangle is the universal set.
REVISE LESSONS 7-11. THEN DO SUB-STRAND TEST 1 IN ASSIGNMENT 5
This summarises the important ideas and concepts to remember.
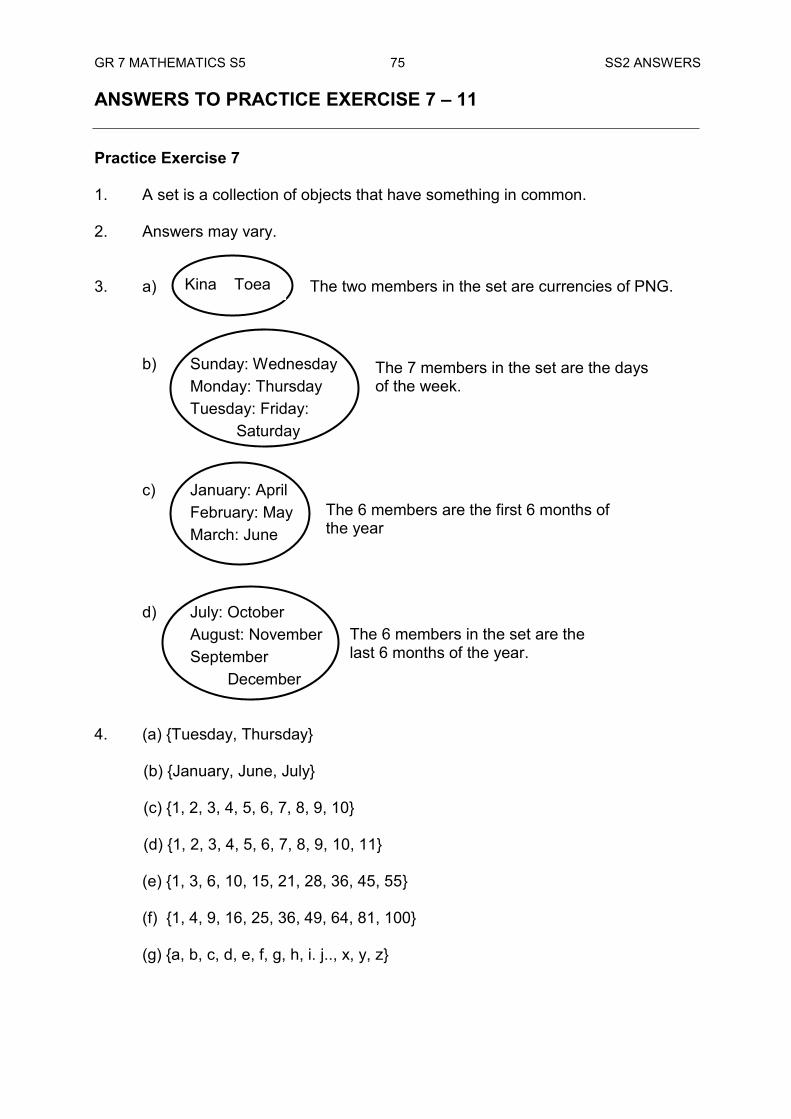
GR 7 MATHEMATICS S5 75 SS2 ANSWERS ANSWERS TO PRACTICE EXERCISE 7 – 11 Practice Exercise 7 1. A set is a collection of objects that have something in common. 2. Answers may vary.
3. a) b) Sunday: Wednesday Monday: Thursday Tuesday: Friday: Saturday c) January: April February: May March: June d) July: October August: November September December 4. (a) {Tuesday, Thursday} (b) {January, June, July} (c) {1, 2, 3, 4, 5, 6, 7, 8, 9, 10} (d) {1, 2, 3, 4, 5, 6, 7, 8, 9, 10, 11}
(e) {1, 3, 6, 10, 15, 21, 28, 36, 45, 55} (f) {1, 4, 9, 16, 25, 36, 49, 64, 81, 100}
(g) {a, b, c, d, e, f, g, h, i. j.., x, y, z}
Kina Toea The two members in the set are currencies of PNG.
The 7 members in the set are the days of the week.
The 6 members are the first 6 months of the year
The 6 members in the set are the last 6 months of the year.
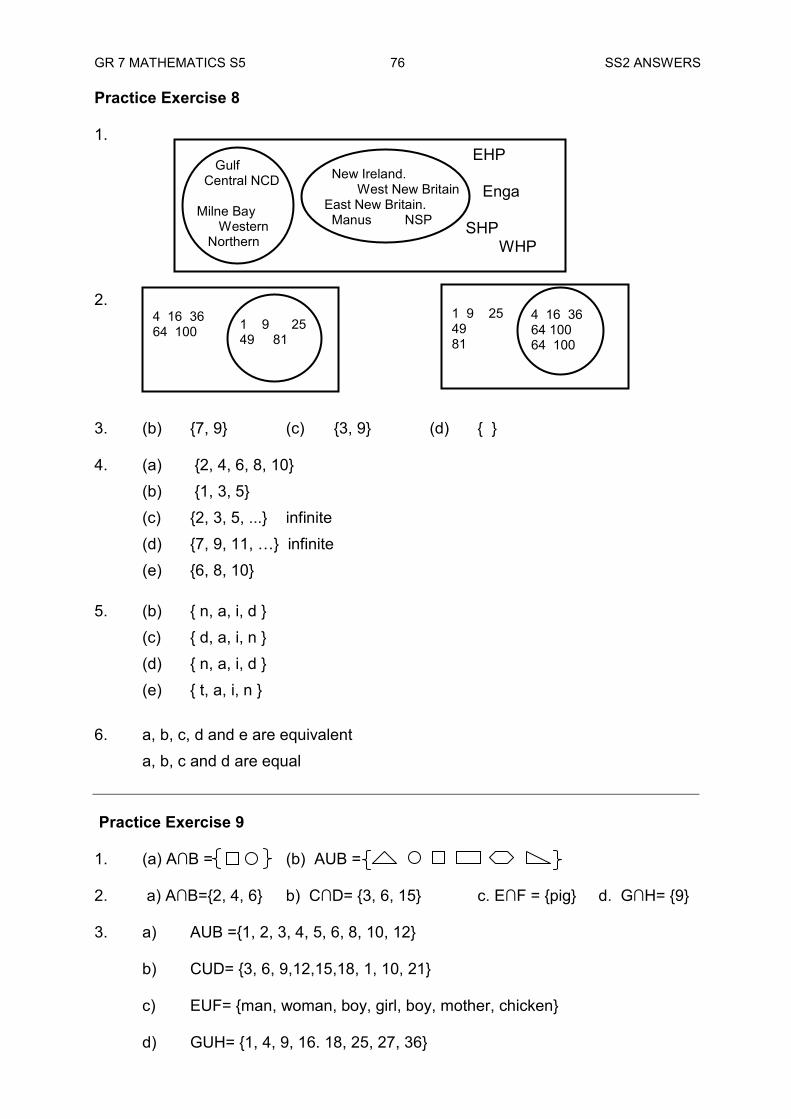
GR 7 MATHEMATICS S5 76 SS2 ANSWERS Practice Exercise 8 1. 2. 3. (b) {7, 9} (c) {3, 9} (d) { } 4. (a) {2, 4, 6, 8, 10} (b) {1, 3, 5} (c) {2, 3, 5, ...} infinite (d) {7, 9, 11, …} infinite (e) {6, 8, 10} 5. (b) { n, a, i, d } (c) { d, a, i, n } (d) { n, a, i, d } (e) { t, a, i, n } 6. a, b, c, d and e are equivalent a, b, c and d are equal Practice Exercise 9 1. (a) A∩B = (b) AUB = 2. a) A∩B={2, 4, 6} b) C∩D= {3, 6, 15} c. E∩F = {pig} d. G∩H= {9} 3. a) AUB ={1, 2, 3, 4, 5, 6, 8, 10, 12} b) CUD= {3, 6, 9,12,15,18, 1, 10, 21} c) EUF= {man, woman, boy, girl, boy, mother, chicken} d) GUH= {1, 4, 9, 16. 18, 25, 27, 36}
EHP Enga
SHP
WHP
Gulf Central NCD Milne Bay Western Northern
New Ireland. West New Britain East New Britain. Manus NSP
4 16 36 64 100
1 9 25 49 81
1 9 25 49 81
4 16 36 64 100 64 100
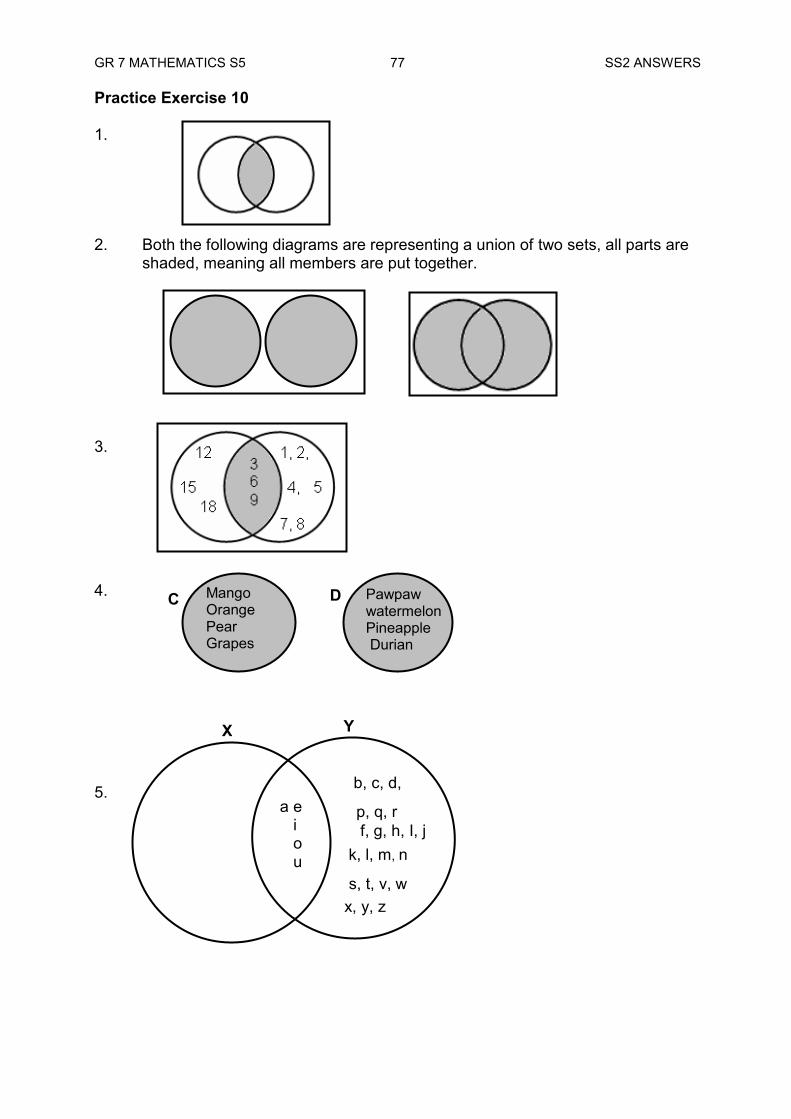
GR 7 MATHEMATICS S5 77 SS2 ANSWERS Practice Exercise 10 1. 2. Both the following diagrams are representing a union of two sets, all parts are shaded, meaning all members are put together. 3. 4. 5.
C Mango Orange Pear Grapes
D Pawpaw watermelon Pineapple Durian
b, c, d,
f, g, h, I, j k, l, m, n
p, q, r
s, t, v, w x, y, z
a e i o u
X Y
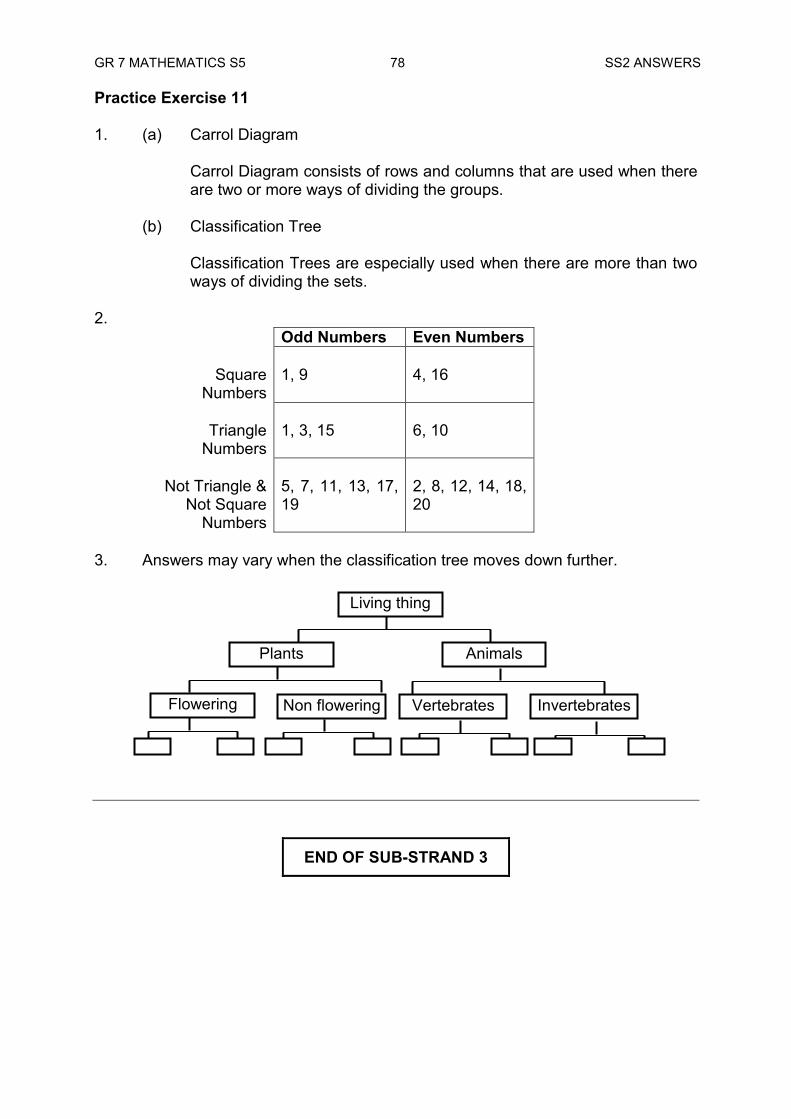
GR 7 MATHEMATICS S5 78 SS2 ANSWERS Practice Exercise 11 1. (a) Carrol Diagram
Carrol Diagram consists of rows and columns that are used when there are two or more ways of dividing the groups.
(b) Classification Tree
Classification Trees are especially used when there are more than two ways of dividing the sets.
2.
Odd Numbers Even Numbers
Square Numbers
1, 9
4, 16
Triangle
Numbers
1, 3, 15
6, 10
Not Triangle &
Not Square Numbers
5, 7, 11, 13, 17, 19
2, 8, 12, 14, 18, 20
3. Answers may vary when the classification tree moves down further.
END OF SUB-STRAND 3
Living thing
Plants Animals
Flowering Non flowering Vertebrates Invertebrates
GR 7 MATHEMATICS 5 79 SS3 TITLE
SUB-STRAND 3
PROBABILITY AND CHANCE
Lesson 12: Chance Lesson 13: Probability Lesson 14: Sample Space Lesson 15: Equally Likely Outcome Lesson 16: Sum of Probability Lesson 17: Complementary Events
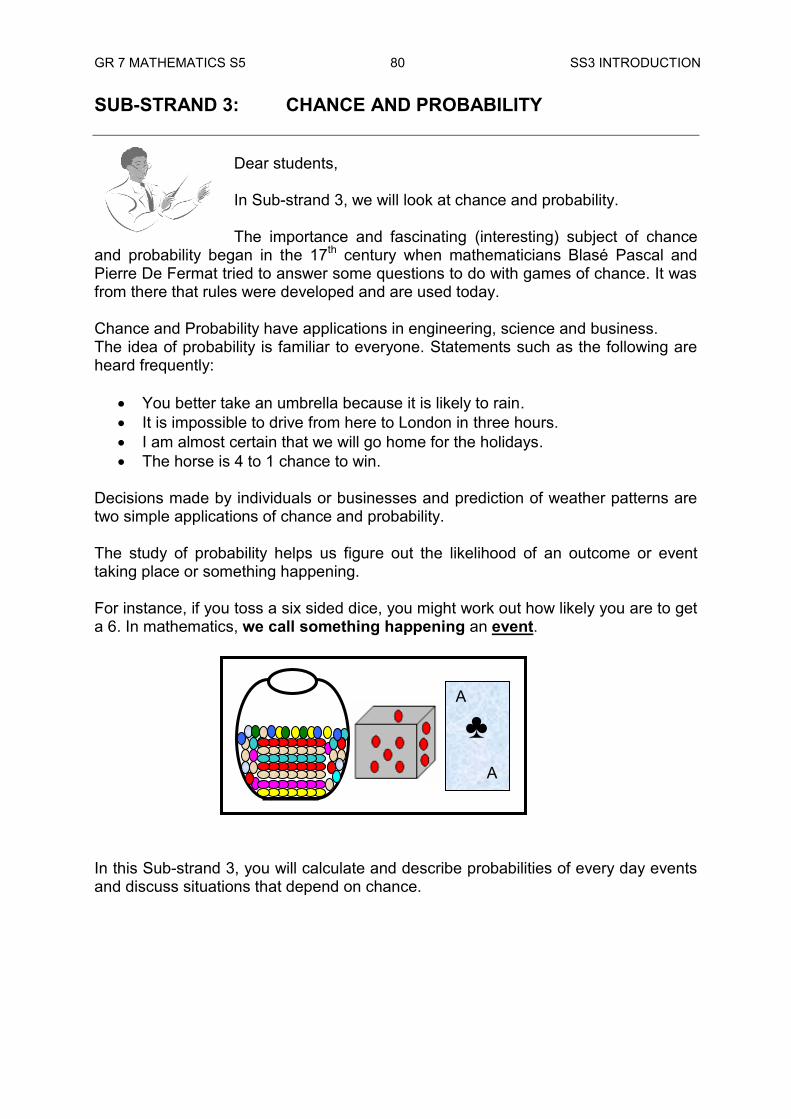
GR 7 MATHEMATICS S5 80 SS3 INTRODUCTION
SUB-STRAND 3: CHANCE AND PROBABILITY
Dear students, In Sub-strand 3, we will look at chance and probability. The importance and fascinating (interesting) subject of chance
and probability began in the 17th century when mathematicians Blasé Pascal and Pierre De Fermat tried to answer some questions to do with games of chance. It was from there that rules were developed and are used today. Chance and Probability have applications in engineering, science and business. The idea of probability is familiar to everyone. Statements such as the following are heard frequently:
You better take an umbrella because it is likely to rain. It is impossible to drive from here to London in three hours. I am almost certain that we will go home for the holidays. The horse is 4 to 1 chance to win.
Decisions made by individuals or businesses and prediction of weather patterns are two simple applications of chance and probability. The study of probability helps us figure out the likelihood of an outcome or event taking place or something happening. For instance, if you toss a six sided dice, you might work out how likely you are to get a 6. In mathematics, we call something happening an event.
In this Sub-strand 3, you will calculate and describe probabilities of every day events and discuss situations that depend on chance.
A
♣
A
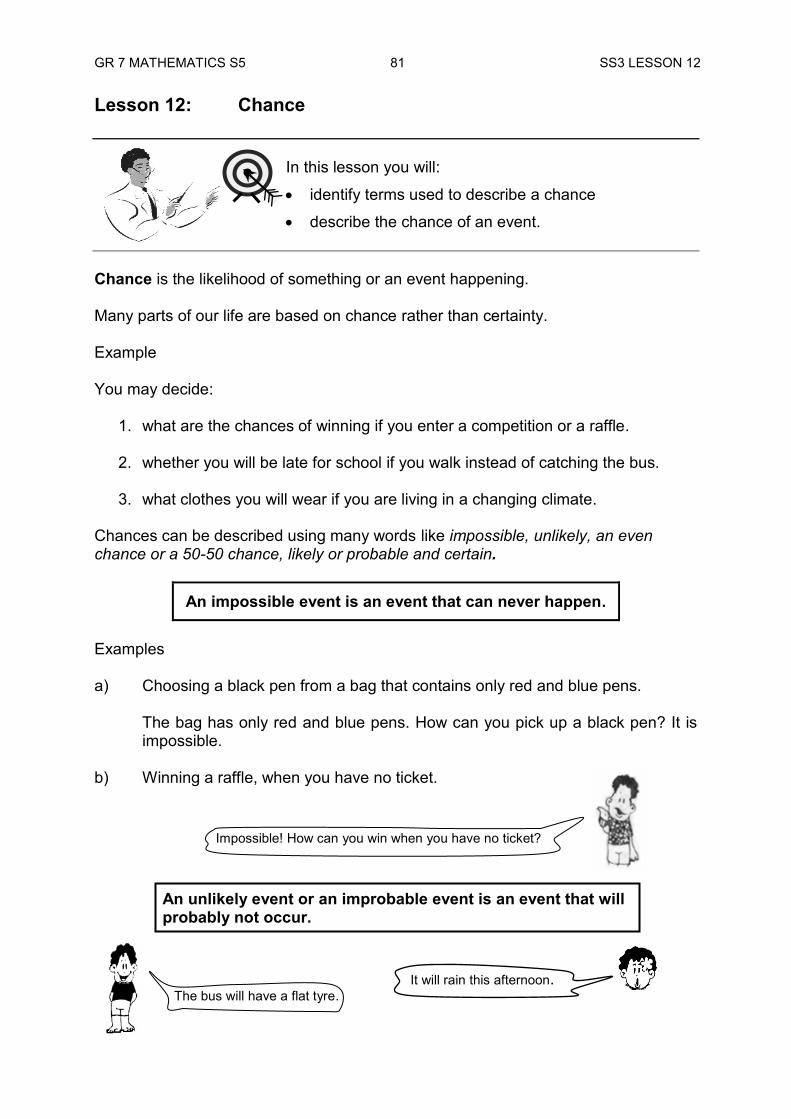
GR 7 MATHEMATICS S5 81 SS3 LESSON 12
Lesson 12: Chance
In this lesson you will:
identify terms used to describe a chance
describe the chance of an event. Chance is the likelihood of something or an event happening. Many parts of our life are based on chance rather than certainty. Example You may decide:
1. what are the chances of winning if you enter a competition or a raffle. 2. whether you will be late for school if you walk instead of catching the bus. 3. what clothes you will wear if you are living in a changing climate.
Chances can be described using many words like impossible, unlikely, an even chance or a 50-50 chance, likely or probable and certain.
An impossible event is an event that can never happen.
Examples
a) Choosing a black pen from a bag that contains only red and blue pens.
The bag has only red and blue pens. How can you pick up a black pen? It is impossible.
b) Winning a raffle, when you have no ticket.
An unlikely event or an improbable event is an event that will probably not occur.
It will rain this afternoon. The bus will have a flat tyre.
Impossible! How can you win when you have no ticket?
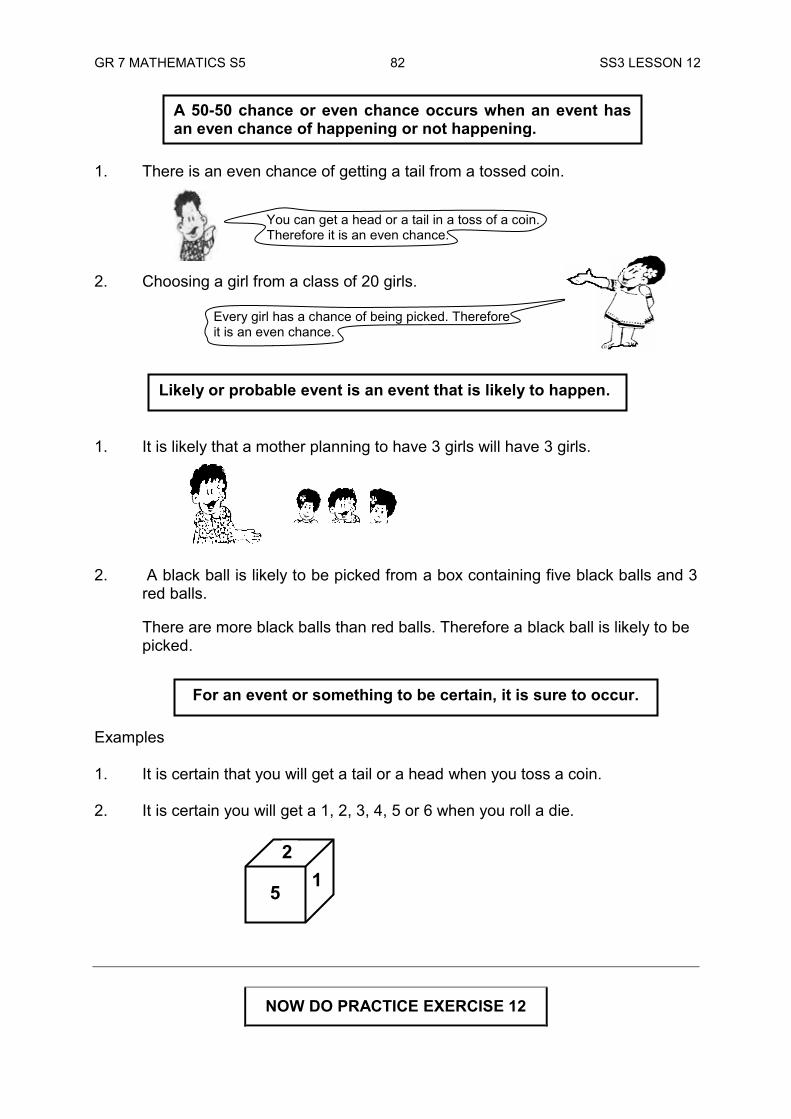
GR 7 MATHEMATICS S5 82 SS3 LESSON 12 1. There is an even chance of getting a tail from a tossed coin.
2. Choosing a girl from a class of 20 girls.
1. It is likely that a mother planning to have 3 girls will have 3 girls.
2. A black ball is likely to be picked from a box containing five black balls and 3
red balls.
There are more black balls than red balls. Therefore a black ball is likely to be picked.
Examples 1. It is certain that you will get a tail or a head when you toss a coin.
2. It is certain you will get a 1, 2, 3, 4, 5 or 6 when you roll a die.
NOW DO PRACTICE EXERCISE 12
A 50-50 chance or even chance occurs when an event has an even chance of happening or not happening.
Likely or probable event is an event that is likely to happen.
For an event or something to be certain, it is sure to occur.
You can get a head or a tail in a toss of a coin. Therefore it is an even chance.
Every girl has a chance of being picked. Therefore it is an even chance.
1 5
2
GR 7 MATHEMATICS S5 83 SS3 LESSON 12 Practice Exercise 12 1. Here is a list of statements. For each event, decide what you think the chances
are, using one of the chance descriptions.
a) A new born baby is a girl.
b) Choosing a black card from a pack of 10 red cards.
c) Mary winning a ticket when she has no tickets.
d) Choosing a blue marble from a bag that contains a blue and a red marble.
e) Getting a head or a tail when a coin is tossed.
f) Obtaining 5 when a dice is thrown.
g) Picking a black marble from a bag containing 5 black marbles and 1 red marble.
h) It will rain today.
i) You will be 2 metres tall by your 14th birthday.
j) Snow will fall in Mount Hagen town tomorrow.
CORRECT YOUR WORK. ANSWERS ARE AT THE END OF SUB-STRAND 3
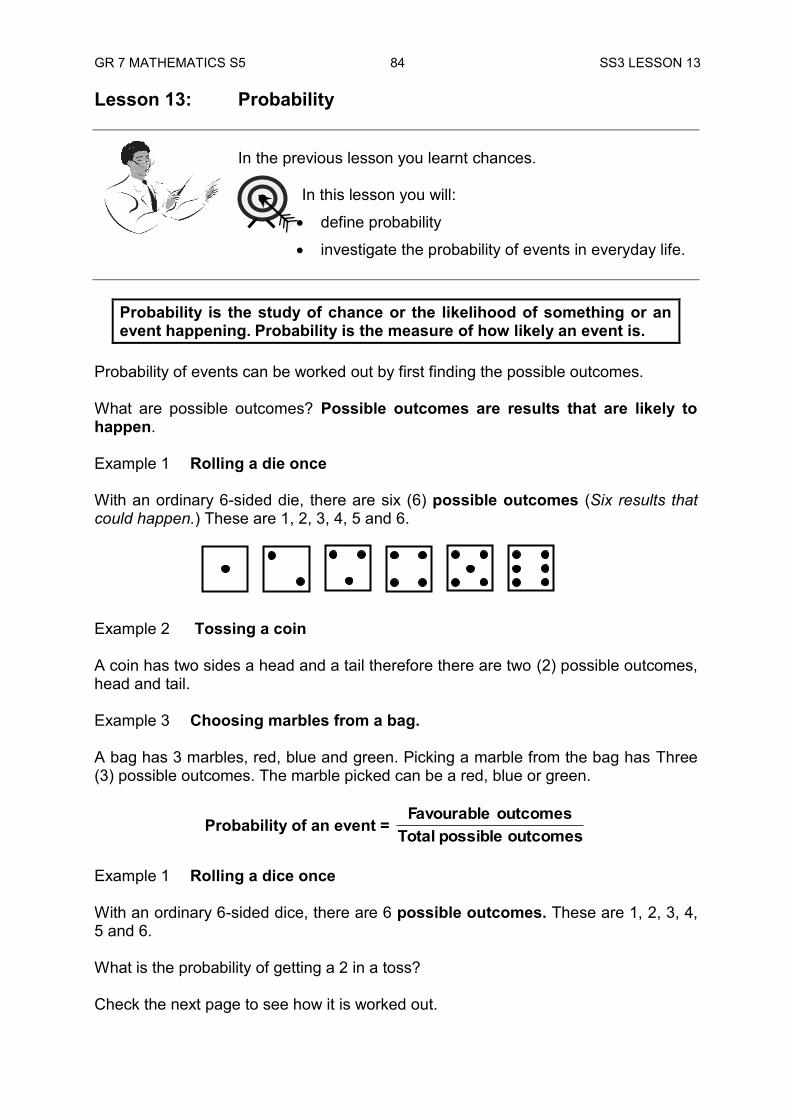
GR 7 MATHEMATICS S5 84 SS3 LESSON 13 Lesson 13: Probability
In the previous lesson you learnt chances.
In this lesson you will:
define probability
investigate the probability of events in everyday life.
Probability is the study of chance or the likelihood of something or an event happening. Probability is the measure of how likely an event is.
Probability of events can be worked out by first finding the possible outcomes. What are possible outcomes? Possible outcomes are results that are likely to happen. Example 1 Rolling a die once With an ordinary 6-sided die, there are six (6) possible outcomes (Six results that could happen.) These are 1, 2, 3, 4, 5 and 6.
Example 2 Tossing a coin A coin has two sides a head and a tail therefore there are two (2) possible outcomes, head and tail. Example 3 Choosing marbles from a bag. A bag has 3 marbles, red, blue and green. Picking a marble from the bag has Three (3) possible outcomes. The marble picked can be a red, blue or green.
Probability of an event = outcomespossibleTotaloutcomesFavourable
Example 1 Rolling a dice once With an ordinary 6-sided dice, there are 6 possible outcomes. These are 1, 2, 3, 4, 5 and 6. What is the probability of getting a 2 in a toss?
Check the next page to see how it is worked out.
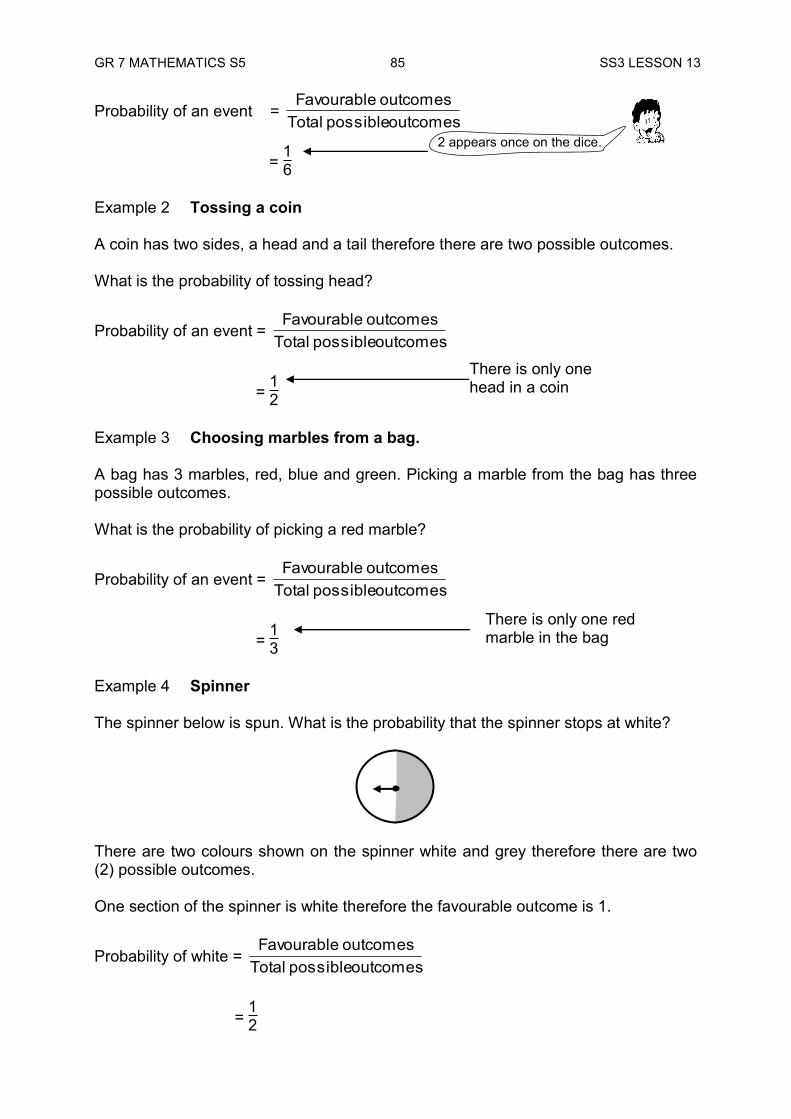
GR 7 MATHEMATICS S5 85 SS3 LESSON 13
Probability of an event = outcomespossibleTotal
outcomesFavourable
= 16
Example 2 Tossing a coin A coin has two sides, a head and a tail therefore there are two possible outcomes. What is the probability of tossing head?
Probability of an event = outcomespossibleTotal
outcomesFavourable
= 12
Example 3 Choosing marbles from a bag. A bag has 3 marbles, red, blue and green. Picking a marble from the bag has three possible outcomes. What is the probability of picking a red marble?
Probability of an event = outcomespossibleTotal
outcomesFavourable
= 13
Example 4 Spinner The spinner below is spun. What is the probability that the spinner stops at white? There are two colours shown on the spinner white and grey therefore there are two (2) possible outcomes. One section of the spinner is white therefore the favourable outcome is 1.
Probability of white = outcomespossibleTotal
outcomesFavourable
= 12
There is only one head in a coin
There is only one red marble in the bag
2 appears once on the dice.
GR 7 MATHEMATICS S5 86 SS3 LESSON 13
If the probability of an outcome is 0, it means that the outcome is impossible.
Example 5 A bag has 3 marbles, red, blue and green. What is the probability of choosing a black marble?
Probability of an event = outcomespossibleTotal
outcomesFavourable
= 03
= 0
The probability is 0. It is an impossible event. Can you see why? The bag contains red, blue and green marbles. It does not contain black marbles.
NOW DO PRACTICE EXERCISE 13
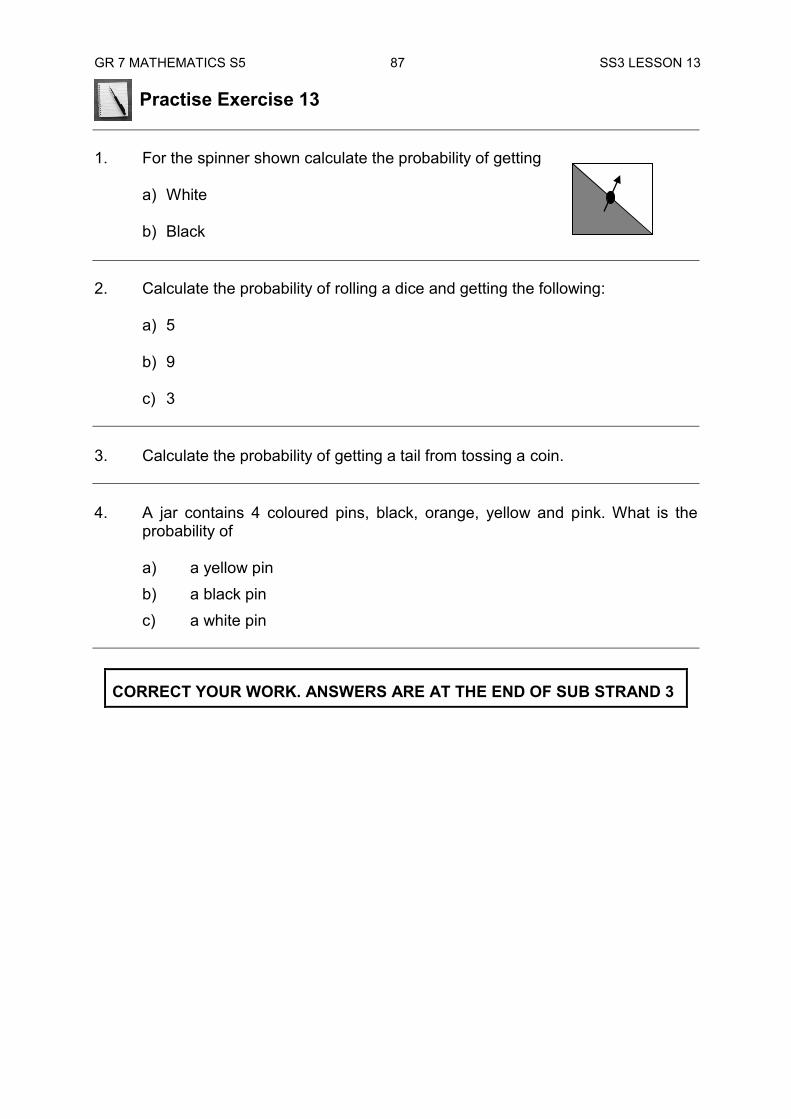
GR 7 MATHEMATICS S5 87 SS3 LESSON 13 Practise Exercise 13 1. For the spinner shown calculate the probability of getting
a) White
b) Black 2. Calculate the probability of rolling a dice and getting the following:
a) 5 b) 9 c) 3
3. Calculate the probability of getting a tail from tossing a coin. 4. A jar contains 4 coloured pins, black, orange, yellow and pink. What is the
probability of
a) a yellow pin b) a black pin c) a white pin
CORRECT YOUR WORK. ANSWERS ARE AT THE END OF SUB STRAND 3
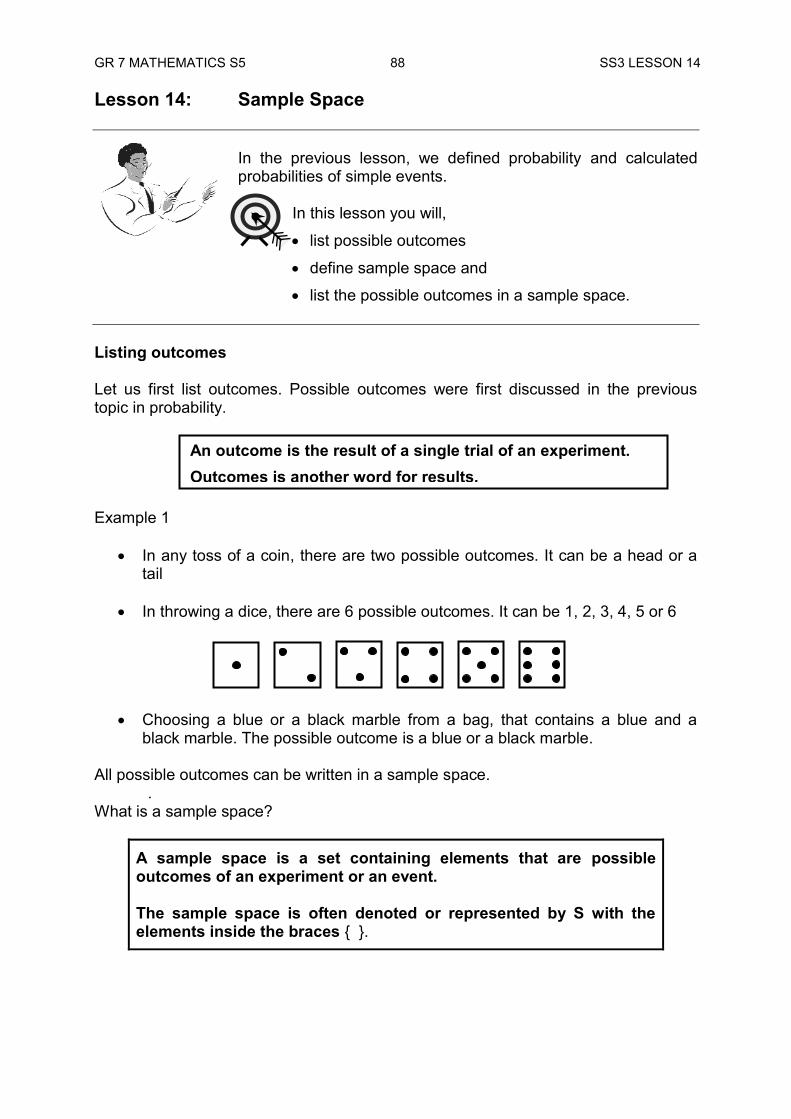
GR 7 MATHEMATICS S5 88 SS3 LESSON 14 Lesson 14: Sample Space
In the previous lesson, we defined probability and calculated probabilities of simple events.
In this lesson you will,
list possible outcomes
define sample space and
list the possible outcomes in a sample space. Listing outcomes Let us first list outcomes. Possible outcomes were first discussed in the previous topic in probability. Example 1
In any toss of a coin, there are two possible outcomes. It can be a head or a tail
In throwing a dice, there are 6 possible outcomes. It can be 1, 2, 3, 4, 5 or 6
Choosing a blue or a black marble from a bag, that contains a blue and a
black marble. The possible outcome is a blue or a black marble. All possible outcomes can be written in a sample space. . What is a sample space?
A sample space is a set containing elements that are possible outcomes of an experiment or an event. The sample space is often denoted or represented by S with the elements inside the braces { }.
An outcome is the result of a single trial of an experiment. Outcomes is another word for results.
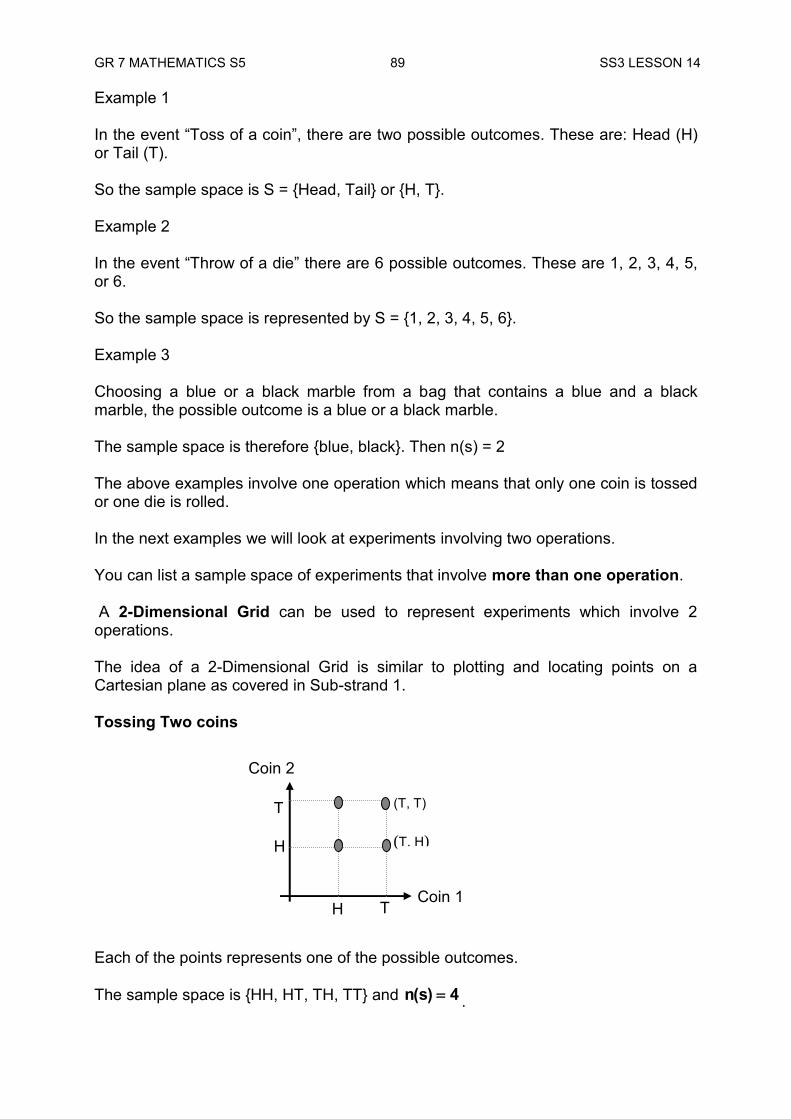
GR 7 MATHEMATICS S5 89 SS3 LESSON 14 Example 1 In the event “Toss of a coin”, there are two possible outcomes. These are: Head (H) or Tail (T). So the sample space is S = {Head, Tail} or {H, T}. Example 2 In the event “Throw of a die” there are 6 possible outcomes. These are 1, 2, 3, 4, 5, or 6. So the sample space is represented by S = {1, 2, 3, 4, 5, 6}. Example 3 Choosing a blue or a black marble from a bag that contains a blue and a black marble, the possible outcome is a blue or a black marble. The sample space is therefore {blue, black}. Then n(s) = 2 The above examples involve one operation which means that only one coin is tossed or one die is rolled. In the next examples we will look at experiments involving two operations. You can list a sample space of experiments that involve more than one operation. A 2-Dimensional Grid can be used to represent experiments which involve 2 operations. The idea of a 2-Dimensional Grid is similar to plotting and locating points on a Cartesian plane as covered in Sub-strand 1. Tossing Two coins Each of the points represents one of the possible outcomes. The sample space is {HH, HT, TH, TT} and 4)s(n .
Coin 2
Coin 1
T
H
H T
(T, T)
(T, H)
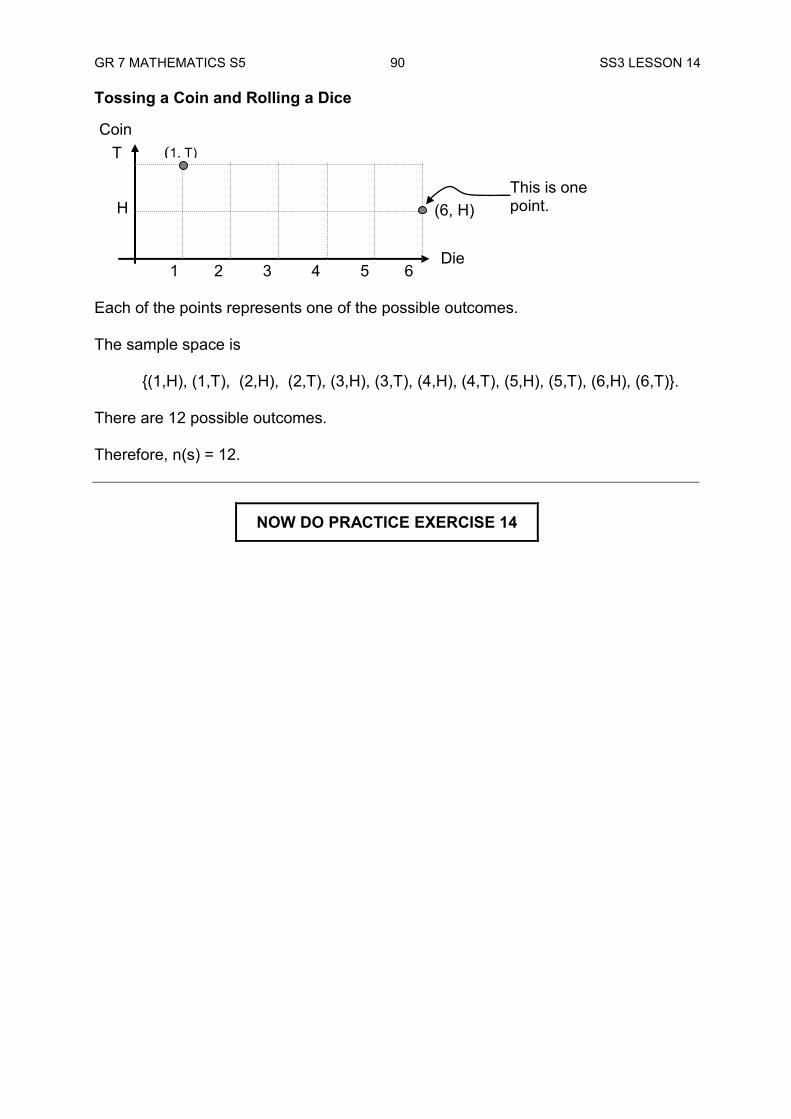
GR 7 MATHEMATICS S5 90 SS3 LESSON 14 Tossing a Coin and Rolling a Dice T H 1 2 3 4 5 6 Each of the points represents one of the possible outcomes. The sample space is
{(1,H), (1,T), (2,H), (2,T), (3,H), (3,T), (4,H), (4,T), (5,H), (5,T), (6,H), (6,T)}. There are 12 possible outcomes. Therefore, n(s) = 12.
NOW DO PRACTICE EXERCISE 14
Die
Coin (1, T)
(6, H) This is one point.
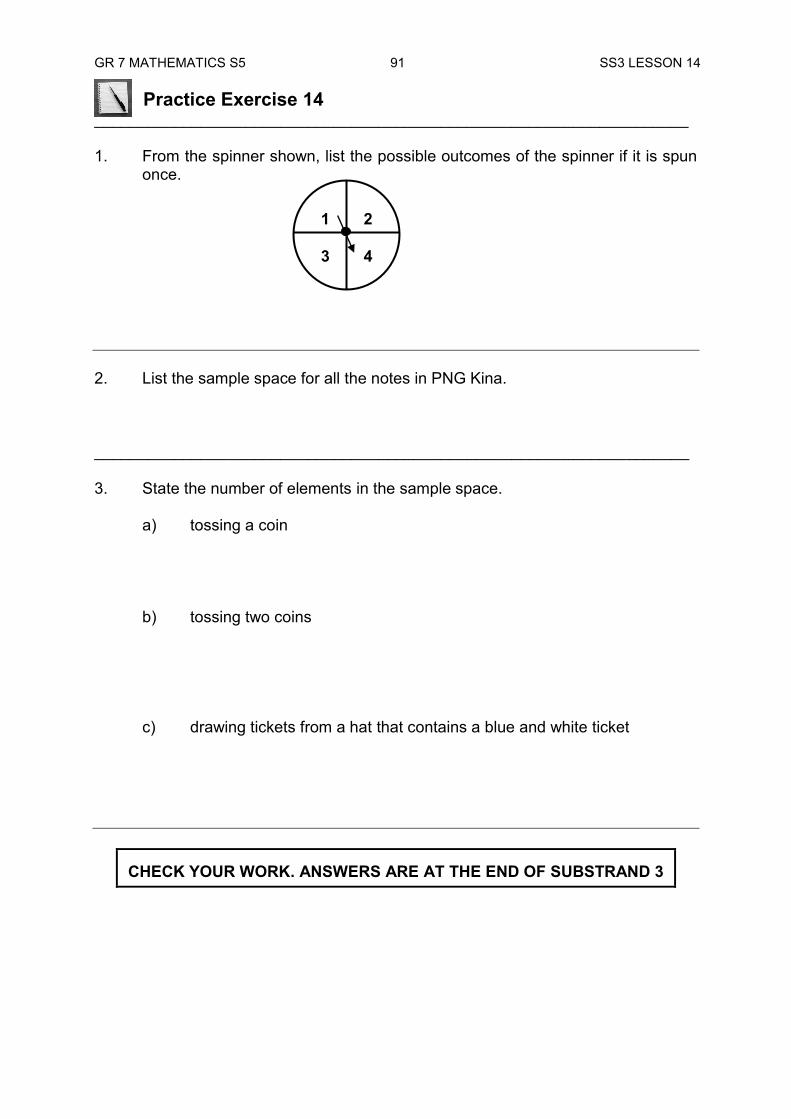
GR 7 MATHEMATICS S5 91 SS3 LESSON 14 Practice Exercise 14 ___________________________________________________________________ 1. From the spinner shown, list the possible outcomes of the spinner if it is spun
once.
2. List the sample space for all the notes in PNG Kina. ___________________________________________________________________
3. State the number of elements in the sample space.
a) tossing a coin
b) tossing two coins
c) drawing tickets from a hat that contains a blue and white ticket
CHECK YOUR WORK. ANSWERS ARE AT THE END OF SUBSTRAND 3
1 2
3 4
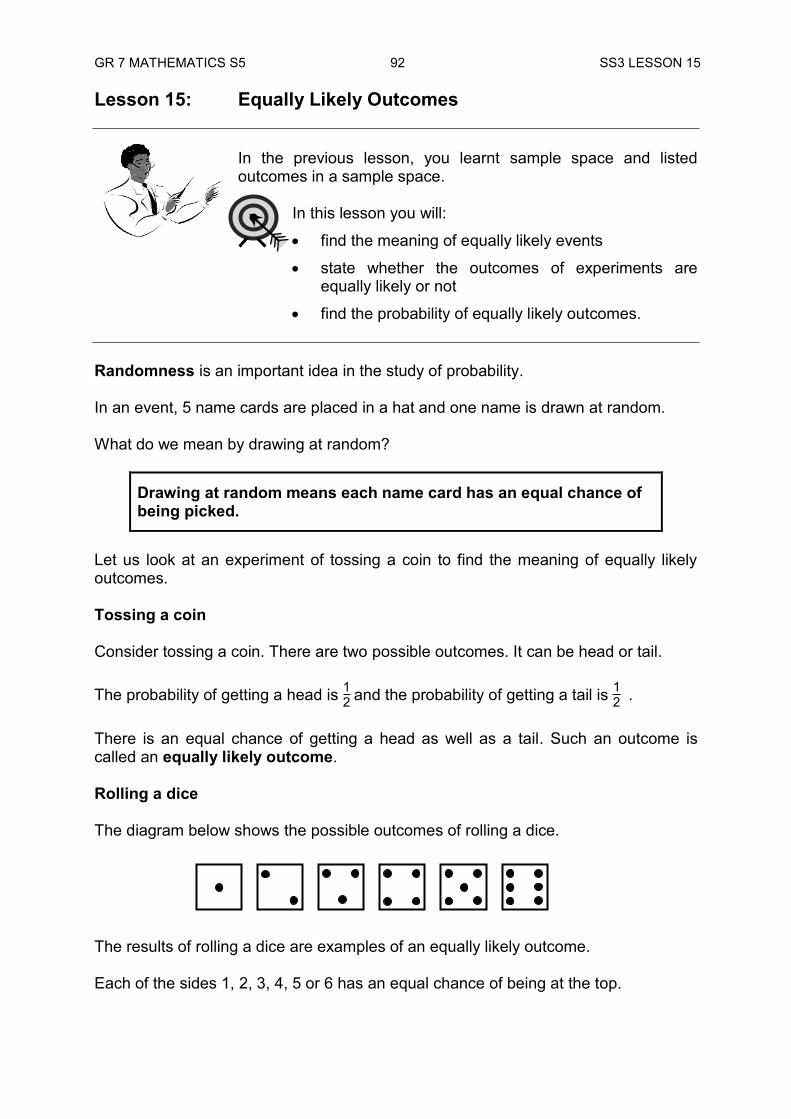
GR 7 MATHEMATICS S5 92 SS3 LESSON 15 Lesson 15: Equally Likely Outcomes
In the previous lesson, you learnt sample space and listed outcomes in a sample space.
In this lesson you will:
find the meaning of equally likely events
state whether the outcomes of experiments are equally likely or not
find the probability of equally likely outcomes. Randomness is an important idea in the study of probability. In an event, 5 name cards are placed in a hat and one name is drawn at random. What do we mean by drawing at random?
Drawing at random means each name card has an equal chance of being picked.
Let us look at an experiment of tossing a coin to find the meaning of equally likely outcomes. Tossing a coin Consider tossing a coin. There are two possible outcomes. It can be head or tail. The probability of getting a head is 12 and the probability of getting a tail is 12 . There is an equal chance of getting a head as well as a tail. Such an outcome is called an equally likely outcome. Rolling a dice The diagram below shows the possible outcomes of rolling a dice. The results of rolling a dice are examples of an equally likely outcome. Each of the sides 1, 2, 3, 4, 5 or 6 has an equal chance of being at the top.
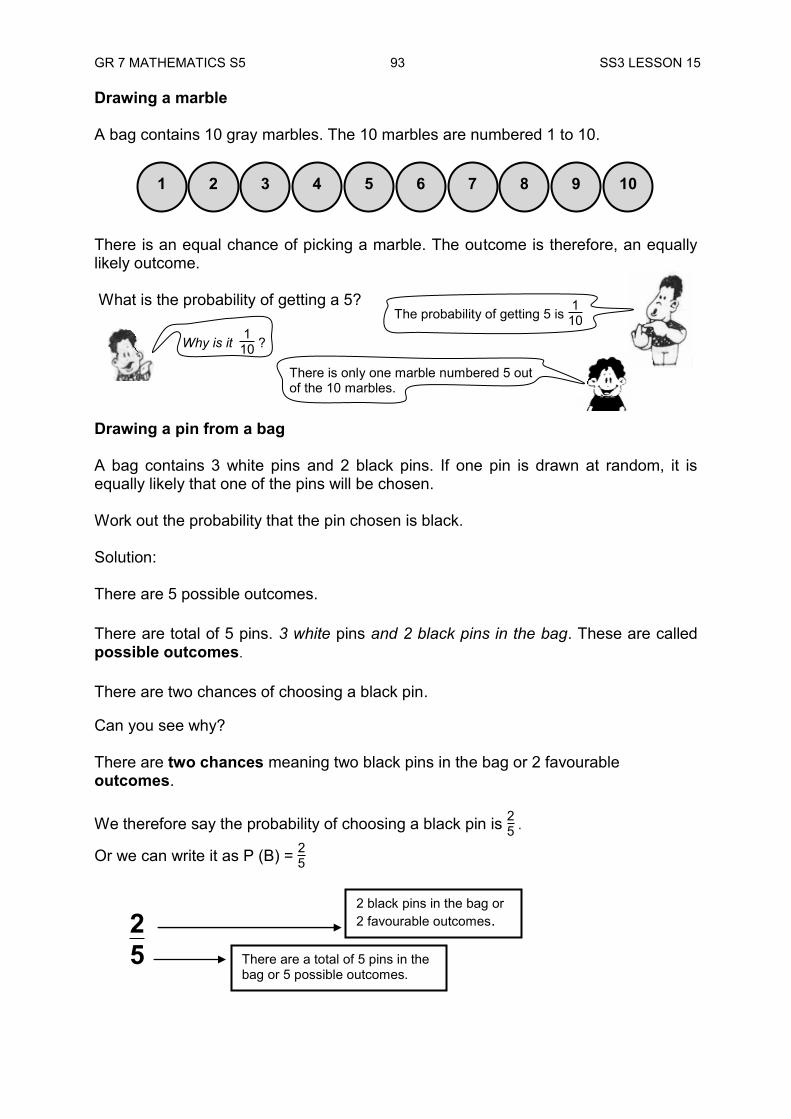
GR 7 MATHEMATICS S5 93 SS3 LESSON 15 Drawing a marble A bag contains 10 gray marbles. The 10 marbles are numbered 1 to 10. There is an equal chance of picking a marble. The outcome is therefore, an equally likely outcome. What is the probability of getting a 5?
Drawing a pin from a bag A bag contains 3 white pins and 2 black pins. If one pin is drawn at random, it is equally likely that one of the pins will be chosen. Work out the probability that the pin chosen is black. Solution: There are 5 possible outcomes. There are total of 5 pins. 3 white pins and 2 black pins in the bag. These are called possible outcomes. There are two chances of choosing a black pin. Can you see why? There are two chances meaning two black pins in the bag or 2 favourable outcomes. We therefore say the probability of choosing a black pin is 25 .
Or we can write it as P (B) = 25
25
2 black pins in the bag or 2 favourable outcomes.
There are a total of 5 pins in the bag or 5 possible outcomes.
The probability of getting 5 is 110
Why is it 1
10 ?
There is only one marble numbered 5 out of the 10 marbles.
1 2 3 4 5 6 7 8 9 10
GR 7 MATHEMATICS S5 94 SS3 LESSON 15 In general, the following rule can be used to work out the probability of equally likely outcomes.
Probability = Number of favourable outcomesNumber of possible outcomes
Let us use the rule to find the probability of getting a white pin.
P (White) = Number of favourable outcomesNumber of possible outcomes
There are 3 white pins out of 5 in the bag. This means that the number of favourable outcomes is 3. Therefore, the probability of getting a white pin is P (White) = 35 This rule has been covered in Lesson 13.
NOW DO PRACTICE EXERCISE 15
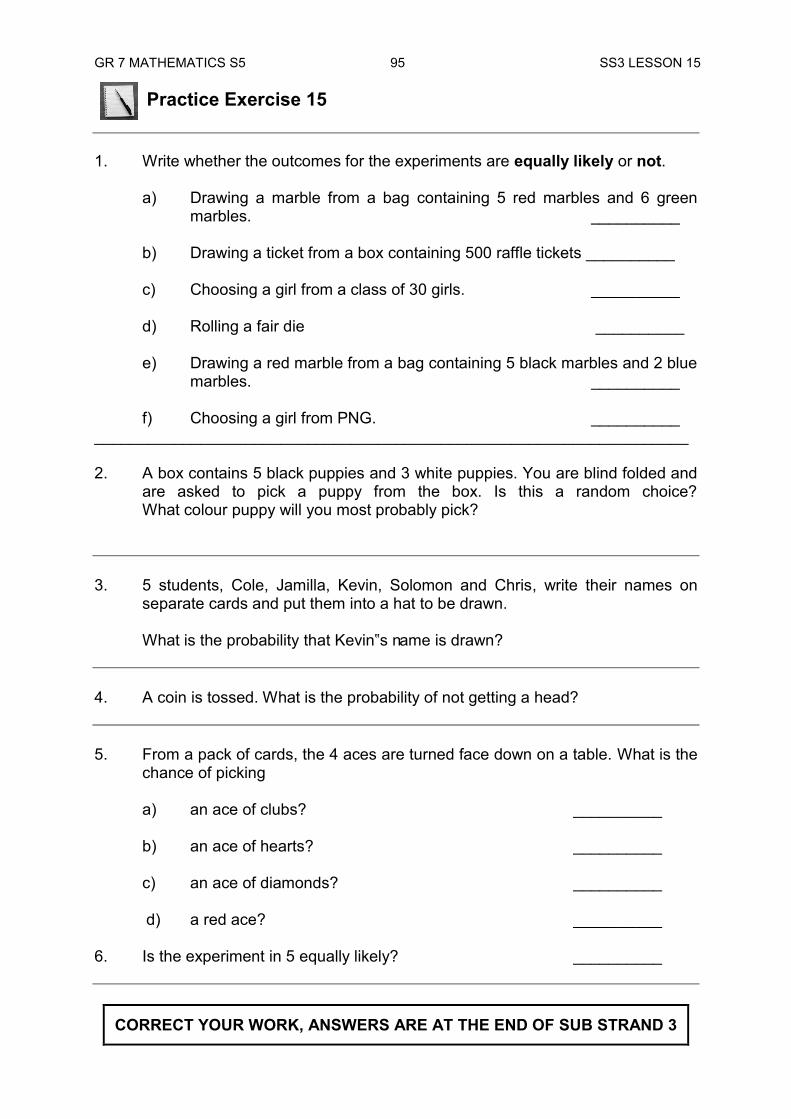
GR 7 MATHEMATICS S5 95 SS3 LESSON 15
Practice Exercise 15 1. Write whether the outcomes for the experiments are equally likely or not.
a) Drawing a marble from a bag containing 5 red marbles and 6 green marbles. __________
b) Drawing a ticket from a box containing 500 raffle tickets __________
c) Choosing a girl from a class of 30 girls. __________
d) Rolling a fair die __________
e) Drawing a red marble from a bag containing 5 black marbles and 2 blue
marbles. __________
f) Choosing a girl from PNG. __________ ___________________________________________________________________
2. A box contains 5 black puppies and 3 white puppies. You are blind folded and
are asked to pick a puppy from the box. Is this a random choice? What colour puppy will you most probably pick?
3. 5 students, Cole, Jamilla, Kevin, Solomon and Chris, write their names on
separate cards and put them into a hat to be drawn.
What is the probability that Kevin‟s name is drawn? 4. A coin is tossed. What is the probability of not getting a head? 5. From a pack of cards, the 4 aces are turned face down on a table. What is the
chance of picking
a) an ace of clubs? __________
b) an ace of hearts? __________
c) an ace of diamonds? __________
d) a red ace? __________
6. Is the experiment in 5 equally likely? __________
CORRECT YOUR WORK, ANSWERS ARE AT THE END OF SUB STRAND 3
GR 7 MATHEMATICS S5 96 SS3 LESSON 16 Lesson 16: Sum of Probabilities
In the previous lesson, we learnt equally likely outcomes and calculated probabilities of outcomes.
In this lesson, we will
find probabilities of experiments
find the sum of the probabilities of an event or an experiment.
___________________________________________________________________
The sum of all probabilities of all possible outcomes is equal to 1.
From the previous lesson, we learnt that the outcomes of tossing a coin are an equally likely outcome. Tossing a coin has two possible outcomes. The possible outcomes are a head or a tail. Therefore the probability of the head is 12 and the probability of the tail is 12 . Probability of head + Probability of tail = 1
That is, 12 +
12 = 1
Example 1 Rolling a dice Rolling a dice has 6 possible outcomes. The outcomes are 1, 2 , 3, 4, 5 or 6. We expect the sum of all the possible outcomes to be equal to 1. The probability of getting a 1, 2, 3, 4, 5 and 6 is 16 each. P (1) = 16 P (2) = 16 P (3) = 16 P (4) = 16 P (5) = 16 P (6) = 16 Now, we add the probabilities:
P(1) + P(2) + P(3) + P(4) + P(5) + P(6) = 1
16 + 16 + 16 + 16 + 16 + 16 = 1
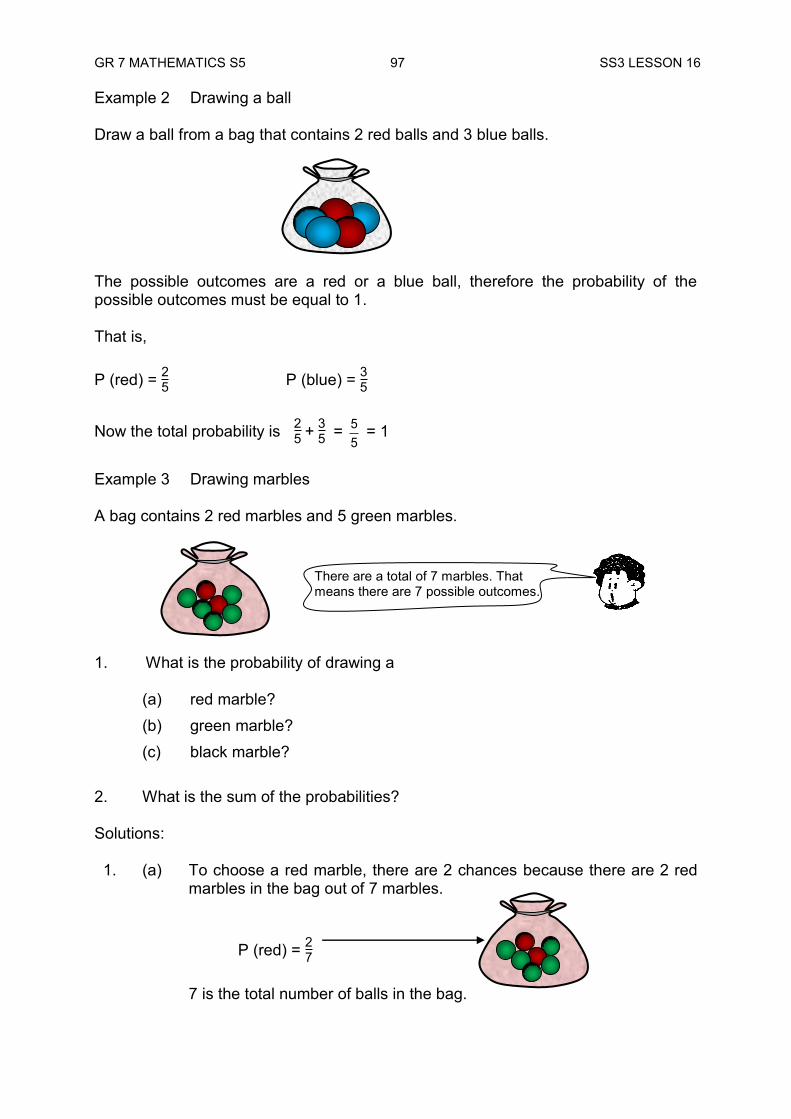
GR 7 MATHEMATICS S5 97 SS3 LESSON 16 Example 2 Drawing a ball Draw a ball from a bag that contains 2 red balls and 3 blue balls. The possible outcomes are a red or a blue ball, therefore the probability of the possible outcomes must be equal to 1. That is, P (red) = 25 P (blue) = 35 Now the total probability is 25 + 35 =
55 = 1
Example 3 Drawing marbles A bag contains 2 red marbles and 5 green marbles. 1. What is the probability of drawing a
(a) red marble? (b) green marble? (c) black marble?
2. What is the sum of the probabilities? Solutions: 1. (a) To choose a red marble, there are 2 chances because there are 2 red
marbles in the bag out of 7 marbles.
P (red) = 27
7 is the total number of balls in the bag.
There are a total of 7 marbles. That means there are 7 possible outcomes.
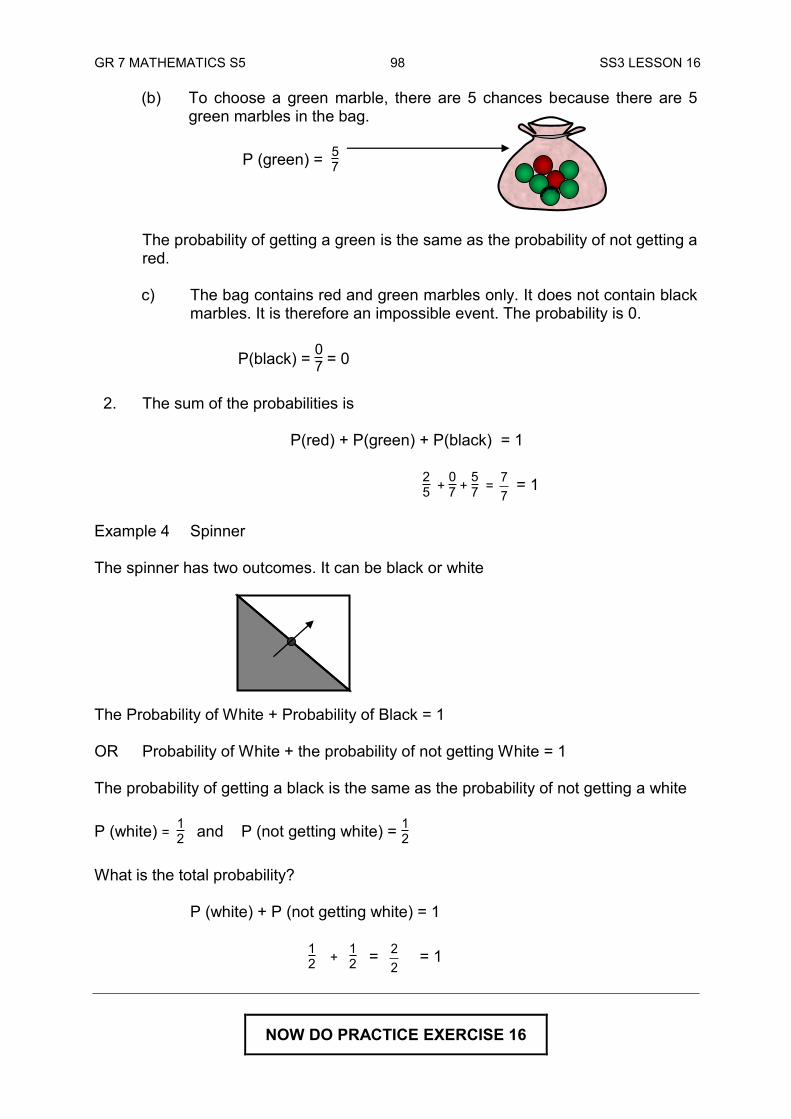
GR 7 MATHEMATICS S5 98 SS3 LESSON 16
(b) To choose a green marble, there are 5 chances because there are 5 green marbles in the bag.
P (green) = 57
The probability of getting a green is the same as the probability of not getting a red.
c) The bag contains red and green marbles only. It does not contain black
marbles. It is therefore an impossible event. The probability is 0.
P(black) = 07 = 0 2. The sum of the probabilities is
P(red) + P(green) + P(black) = 1 25 + 07 + 57 =
77 = 1
Example 4 Spinner The spinner has two outcomes. It can be black or white The Probability of White + Probability of Black = 1 OR Probability of White + the probability of not getting White = 1
The probability of getting a black is the same as the probability of not getting a white
P (white) = 12 and P (not getting white) = 12 What is the total probability?
P (white) + P (not getting white) = 1 12 + 12 =
22 = 1
NOW DO PRACTICE EXERCISE 16
GR 7 MATHEMATICS S5 99 SS3 LESSON 16
Practice Exercise 16 1. A ticket is randomly selected from a box containing 3 green tickets, 4 blue
tickets and 5 red tickets. What is the probability of choosing a
a) green ticket?
b) blue ticket?
c) red ticket?
d) black ticket? 2. What is the sum of the probabilities in Question 1?
3. A carton of a dozen eggs contain 8 brown eggs and the rest are white.
a) How many are white eggs?
b) What is the probability that the egg chosen is
i. white?
ii. not white?
4. What is the sum of the probabilities in Question 3? 5. Consider tossing a 5 toea coin. What is the probability of getting
a) a head?
b) a tail?
c) not getting a head?
6. What do you notice about Question 5b and c?
CORRECT YOUR WORK. ANSWERS ARE AT THE END OF SUB-STRAND 3.
GR 7 MATHEMATICS S5 100 SS3 LESSON 17 Lesson 17: Complementary Events
In the previous lesson, you learnt how to calculate the sum of probabilities.
In this lesson you will:
define complementary events
find the complementary of an event taking place.
What are complementary events?
Complementary events are events that cannot occur at the same time.
Examples
a. The gender of a baby born involves complementary events. A baby is born either male or female.
b. It will rain tomorrow is the complement of it will not rain tomorrow.
c. Not rolling a 6 in a die is the complement of rolling a 6. d. The plate will not break is the complement of the plate will break. e. The egg will break is the complement of the egg will not break. f. Standing up is the complement of not standing up. g. Winning a race is the complement of not winning a race.
A bag contains red balls and green balls What is complement of choosing a red ball?
The complement of choosing a red ball is not choosing a red ball.
Not choosing a red ball means the same as choosing a green ball.
GR 7 MATHEMATICS S5 101 SS3 LESSON 17 Drawing pins White and black pins are drawn from a box. What is the complement of choosing a black pin? The complement is not choosing a black pin. A spinner A spinner shown is spun. What is the complement of getting 1? The complement of getting 1 is not getting 1. There are only two outcomes in a spin. If you don‟t get 1 then you will surely get 2. A bag of Balls A bag contains red, blue and green balls. What is the complement of choosing a red ball? The complement of choosing a red ball is choosing a blue or a green ball.
NOW DO PRACTICE EXERCISE 17
1 2
Not choosing a black is the same as choosing a white.
GR 7 MATHEMATICS S5 102 SS3 LESSON 17
Practice Exercise 17
1. Write the complement of each event
a) I will win the race.
b) Cole will not be the school captain.
c) I will not win the raffle.
d) That team won‟t beat us.
e) Mary will catch cold next year.
f) You will select a yellow ball.
g) Dad won‟t raise my allowance.
h) I will buy 200 bags of betel nut.
i) She will get a flat tyre.
j) 1000 copies of the Distance Education books will be sent. 2. A box contains some coloured raffle tickets. The tickets are orange, pink and blue.
What is the complement of drawing:
a) an orange ticket?
b) a pink ticket?
c) blue ticket?
3. Hamamas Trading sells different ice cream flavours for K1.50 only.
What is the complement of buying the following ice cream flavours?
a) chocolate
b) vanilla
c) strawberry
CHECK YOUR WORK. ANSWERS ARE AT THE END OF SUB-STRAND 3.
GR 7 MATHEMATICS S5 103 SS3 SUMMARY SUB-STRAND 3: SUMMARY ___________________________________________________________________ Chance is the likelihood of an event happening. There are many words that can be used to describe chance. Certain is a word used to describe an event that is sure to happen. Likely describes an event that may happen. Even – chance or 50 – 50 chance describes events that have an equal chance
of occurring or not occurring. Unlikely describes an event that may not occur. An impossible event is an event that will not occur.
Probability is the study of chance or the likelihood of an event occurring. Probability can be worked out by using the rule:
Probability = favourable outcomes total possible outcomes
Outcome is another word for result. Outcomes of an event can be listed in a sample space. A 2-Dimensional grid can be used to work out or list outcomes of an event. n(s) describes the number of elements in a sample space. Equally likely events are events which have an even chance of occurring. The sum of probabilities is equal to 1. Complementary events are two extremes of an event. Running is the
complement of not running.
REVISE LESSONS 12–17 THEN DO SUBSTRAND TEST 3 IN ASSIGNMENT 3
In this summary you will find some of the important ideas and concepts to remember.
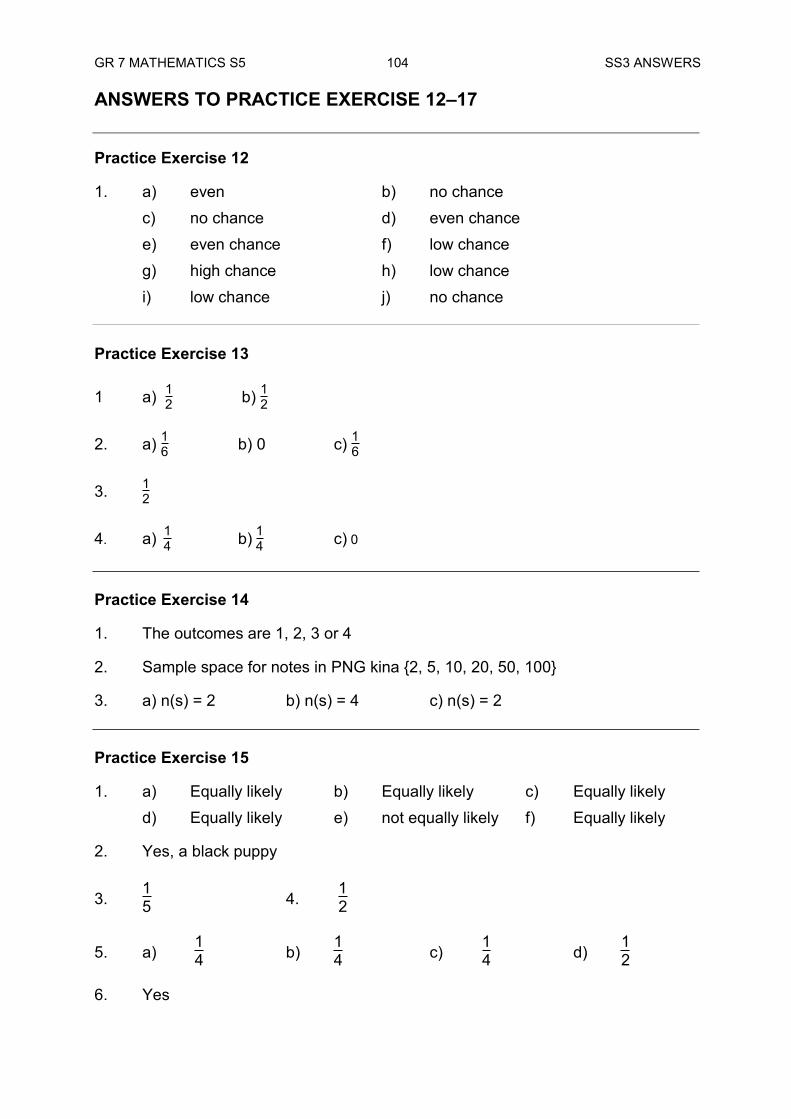
GR 7 MATHEMATICS S5 104 SS3 ANSWERS ANSWERS TO PRACTICE EXERCISE 12–17 Practice Exercise 12 1. a) even b) no chance c) no chance d) even chance e) even chance f) low chance g) high chance h) low chance i) low chance j) no chance Practice Exercise 13 1 a) 12 b) 12
2. a) 16 b) 0 c) 16
3. 12
4. a) 14 b) 14 c) 0
Practice Exercise 14 1. The outcomes are 1, 2, 3 or 4 2. Sample space for notes in PNG kina {2, 5, 10, 20, 50, 100} 3. a) n(s) = 2 b) n(s) = 4 c) n(s) = 2 Practice Exercise 15 1. a) Equally likely b) Equally likely c) Equally likely d) Equally likely e) not equally likely f) Equally likely 2. Yes, a black puppy
3. 15 4.
12
5. a) 14 b)
14 c)
14 d)
12
6. Yes
GR 7 MATHEMATICS S5 105 SS3 ANSWERS Practice Exercise 16
1. a) 312 b)
412 c)
512 d) 0
2. 1
3. a ) 4 b) (i) 4
12 (ii) 812
4. 1
5 a) 12 b)
12 c)
12
6. Getting a tail means the same as not getting a head. Practice Exercise 17 1. a) I will not win the race b) Cole will be the school captain. c) I will win the raffle. d) That team will beat us. e) Mary will not catch the cold next year. f) You won‟t select a yellow ball. g) Dad will raise my allowance. h) I will not buy 200 bags of betel nut. i) She won‟t get a flat tyre.
j) 1000 copies of Distance Education books will not be sent out. 2 a) a pink or blue ticket b) an orange or blue ticket c) an orange or pink ticket 3. a) Vanilla or strawberry b) Chocolate or strawberry c) Chocolate or vanilla ___________________________________________________________________
END OF SUB-STRAND 3

GR 7 MATHEMATICS S5 106 VACANT PAGE
GR 7 MATHEMATICS S5 107 SS4 TITLE
SUB-STRAND 4
ERROR AND ACCURACY
Lesson 18: Errors from Scale Drawing Lesson 19: Errors due to Tools Used Lesson 20: Errors due to Incompetence Lesson 21: Errors due to Condition of the
Materials Lesson 22: Errors caused by Calculations Lesson 23: Using Appropriate Measuring
Tools
GR 7 MATHEMATICS S5 108 SS4 INTRODUCTION SUB-STRAND 4: ERROR AND ACCURACY Introduction
If you are looking for a kaukau that weighs exactly 1 gram, you will never find one. It is because the world you are living in is not exact.
There are many things we measure in this world that are not exact. The sub-strand gives us a chance to discuss accuracy and limit errors in measurement, reading, calculation and use of appropriate tools. In this sub-strand you will identify errors:
caused by rounding off to the nearest measurement due to accuracy of tools used due to incompetency due to the condition of the materials caused by calculation inappropriate tools used.
GR 7 MATHEMATICS S5 109 SS4 LESSON 18 Lesson 18: Errors from Scale Drawings
In Grade 6 you learnt about sources of error in measurement of length.
In this lesson you will:
identify errors caused by rounding off to the nearest scale units.
We will limit our examples to measurement of lengths. The same idea can later be used in measurement of angles, area, volume and time. Accuracy of measurement is an important idea in the study of errors from scale drawings. Accuracy of Measurements Any measurement in the real world is an approximation. This is because the real world is not exact. It is not really possible to be sure that an object is exactly one metre long since any measuring instrument has a limit to its accuracy. We cannot say one kaukau will weigh exactly 2 grams. Because the real world is not exact, therefore measurements contain errors. When we take measurements, we are usually reading some sort of scale. The scale of a ruler may have millimetres (mm) marked on it, but when we measure the length of an object, it is likely to fall between two divisions. So, we estimate to the nearest mm. The ruler is only accurate to within a half a millimetre.
Any measurement is only accurate to ± 0.5 of the smallest division on the scale.
What do you mean by Accuracy of Measurements?
What is error?
Error is the difference between a measurement and the true or accepted value.
GR 7 MATHEMATICS S5 110 SS4 LESSON 18 That means
a ruler marked in cm has an accuracy of ± 0.5 cm
a set of scales in kg has an accuracy of ± 0.5 kg
a tape measure marked in cm is accurate to ± 0.5 cm This means the true measure falls between - 0.5 and +0.5 of the reading. Example 1 Peter used a tape measure in cm to measure his height. What is Peter‟s height range if he estimates his height to be 188 cm?
Answer:
The tape measure is only accurate to ± 0.5 cm
Therefore the range of the height is 188 ± 0.5 That is (188 + 0. 5 cm) = 188.5 cm and (188 – 0.5cm) = 187.5 cm Therefore, Peter‟s height range is between 187.5 cm and 188.5 cm. Example 2 Mary used a tape measure marked with cm to measure the following lengths.
State the range of lengths possible for 145 cm Answer:
Remember any measurement is accurate to ± 0.5 so, 145 – 0.5 = 144. 5 and 145 + 0.5 = 145.5 Now the range of length possible for 145 cm is between 144.5 cm and 145.5 cm. Anything outside the range is regarded as incorrect.
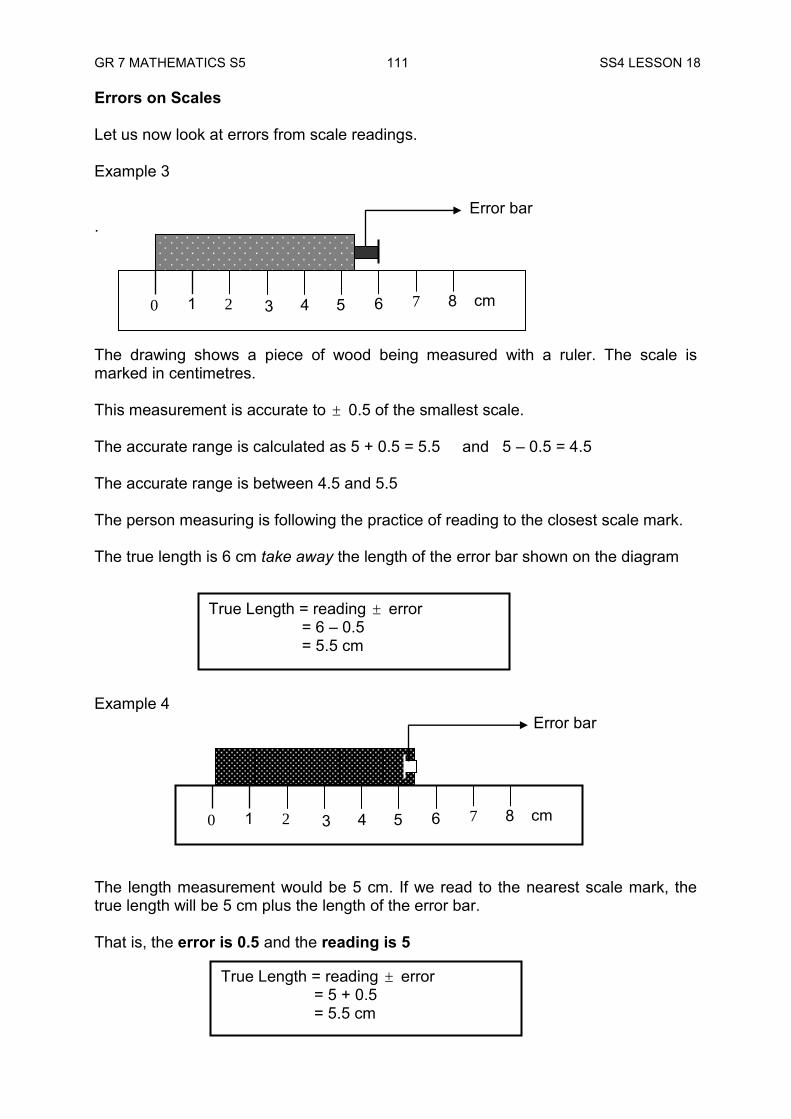
GR 7 MATHEMATICS S5 111 SS4 LESSON 18 Errors on Scales Let us now look at errors from scale readings. Example 3 . The drawing shows a piece of wood being measured with a ruler. The scale is marked in centimetres. This measurement is accurate to 0.5 of the smallest scale. The accurate range is calculated as 5 + 0.5 = 5.5 and 5 – 0.5 = 4.5 The accurate range is between 4.5 and 5.5 The person measuring is following the practice of reading to the closest scale mark. The true length is 6 cm take away the length of the error bar shown on the diagram Example 4 The length measurement would be 5 cm. If we read to the nearest scale mark, the true length will be 5 cm plus the length of the error bar. That is, the error is 0.5 and the reading is 5
Error bar
0 1 2 3 4 5 6 7 8 cm
True Length = reading error = 6 – 0.5 = 5.5 cm
0 1 2 3 4 5 6 7 8 cm
Error bar
True Length = reading error = 5 + 0.5 = 5.5 cm
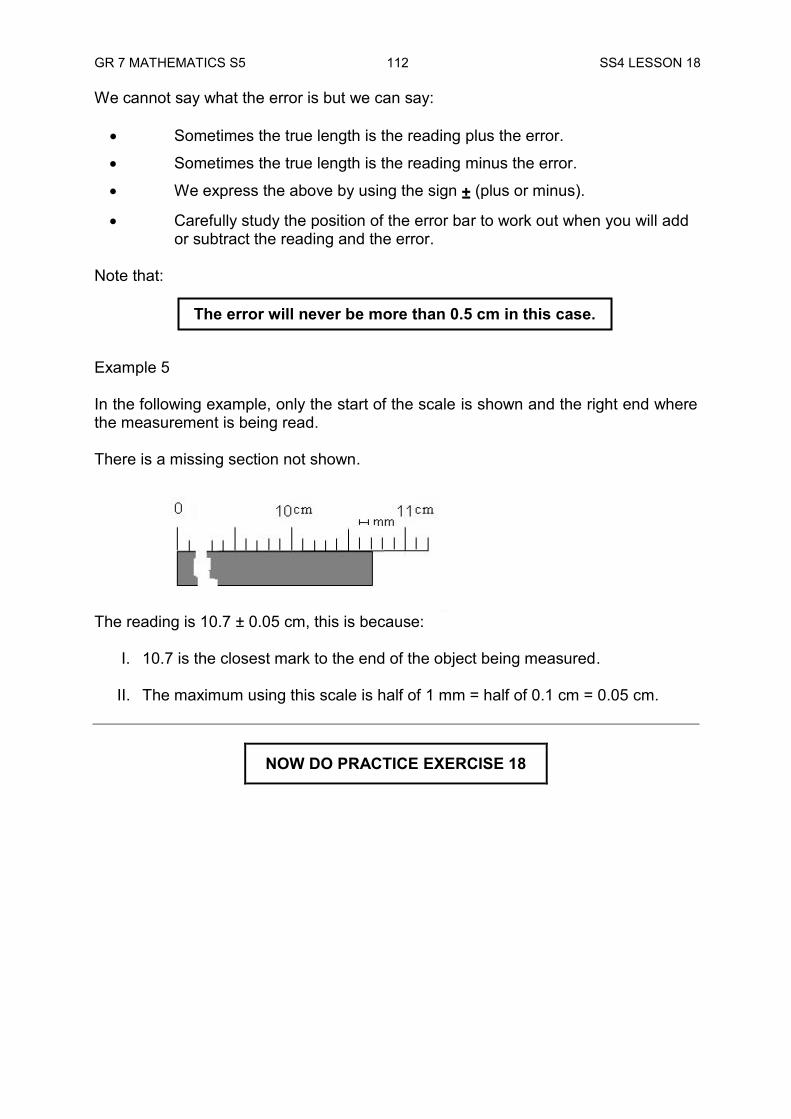
GR 7 MATHEMATICS S5 112 SS4 LESSON 18 We cannot say what the error is but we can say: Sometimes the true length is the reading plus the error.
Sometimes the true length is the reading minus the error.
We express the above by using the sign ± (plus or minus).
Carefully study the position of the error bar to work out when you will add or subtract the reading and the error. Note that: Example 5 In the following example, only the start of the scale is shown and the right end where the measurement is being read. There is a missing section not shown.
The reading is 10.7 ± 0.05 cm, this is because:
I. 10.7 is the closest mark to the end of the object being measured.
II. The maximum using this scale is half of 1 mm = half of 0.1 cm = 0.05 cm.
NOW DO PRACTICE EXERCISE 18
The error will never be more than 0.5 cm in this case.
GR 7 MATHEMATICS S5 113 SS4 LESSON 18 Practice Exercise 18 1. State the accuracy of the following measuring devices.
a) a ruler marked in mm b) a set of scales marked in kg
c) a tape measure marked in cm d) a measuring cup marked with 100 mL graduations.
______________________________________________________________________________________
2. Geiok used a tape measure marked with cm to measure the following lengths. State the range of lengths possible for each. a) 310 cm
b) 229 m ___________________________________________________________________ 3. Stefan used a set of scales marked with kg to weigh some friends. State the range of weights possible for each person. a) Kylie 49 kg b) Nev 85 kg c) Wei 72 kg ___________________________________________________________________ 4. Find the range of values for the following measurements: a) 27 mm b) 1.5 kg c) 25 g d) 4.8 m e) 3.75 kg
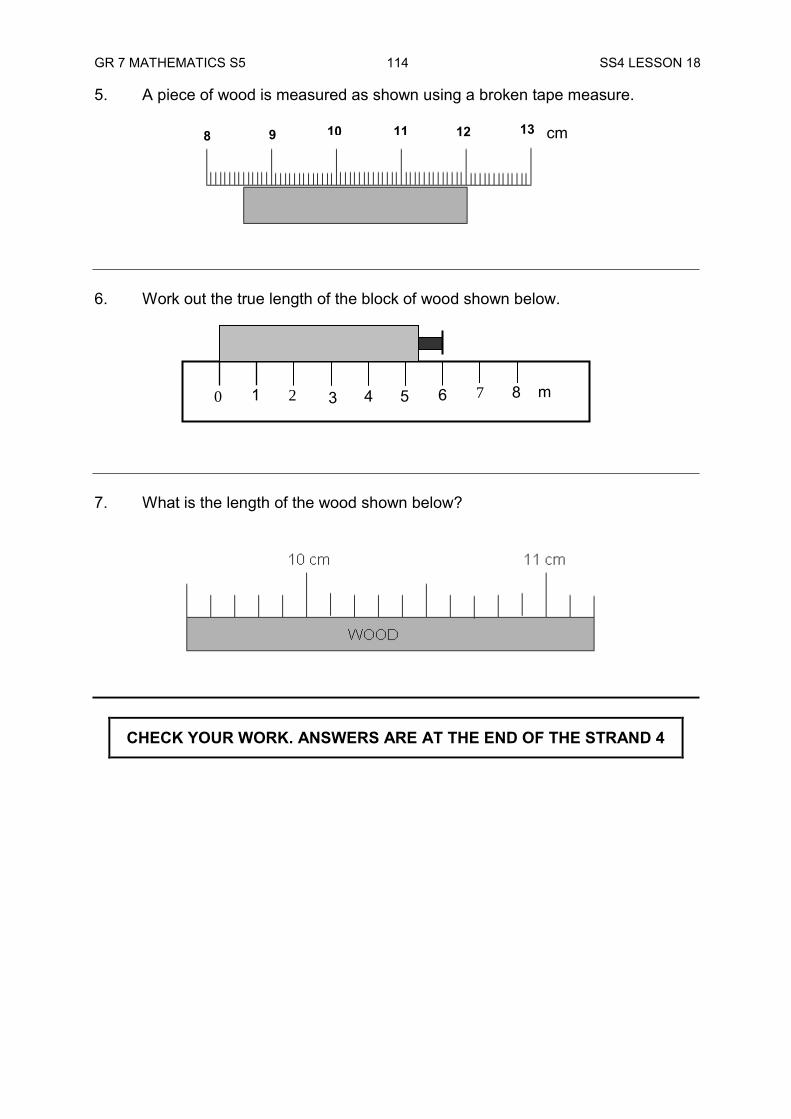
GR 7 MATHEMATICS S5 114 SS4 LESSON 18 5. A piece of wood is measured as shown using a broken tape measure. 6. Work out the true length of the block of wood shown below.
7. What is the length of the wood shown below?
CHECK YOUR WORK. ANSWERS ARE AT THE END OF THE STRAND 4
8 9 10 11 12 13 cm
0 1 2 3 4 5 6 7 8 m
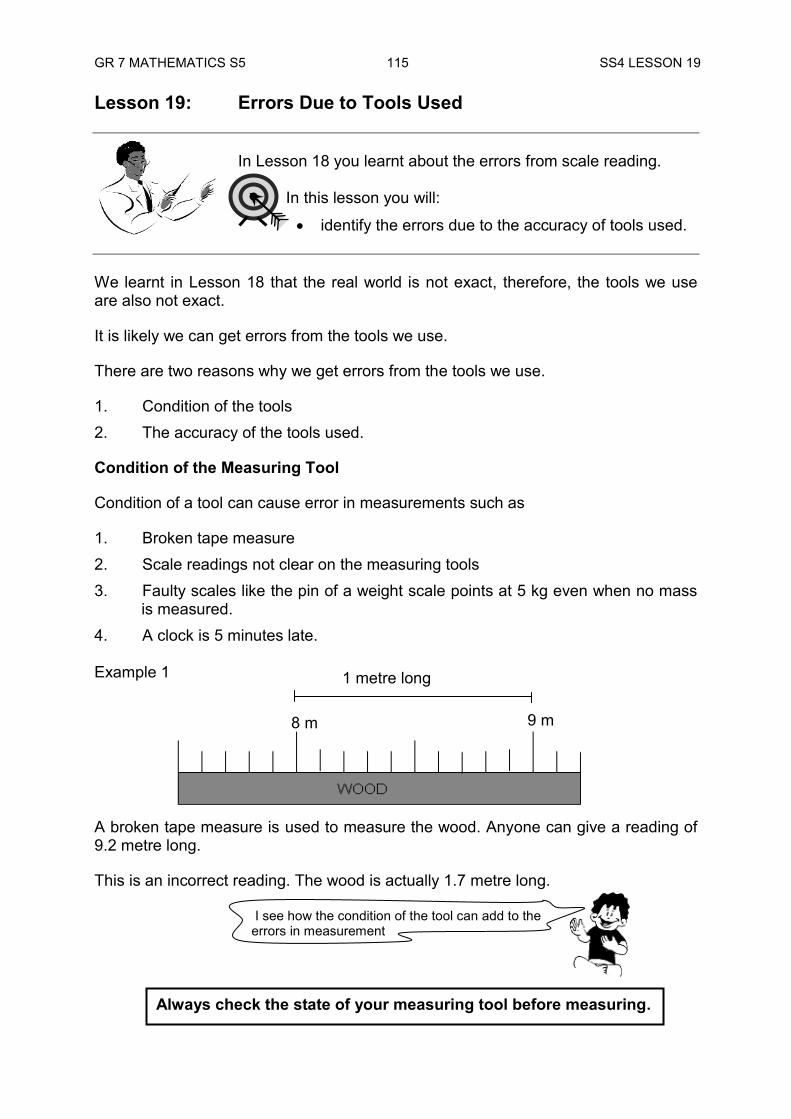
GR 7 MATHEMATICS S5 115 SS4 LESSON 19 Lesson 19: Errors Due to Tools Used
In Lesson 18 you learnt about the errors from scale reading. In this lesson you will:
identify the errors due to the accuracy of tools used.
We learnt in Lesson 18 that the real world is not exact, therefore, the tools we use are also not exact. It is likely we can get errors from the tools we use. There are two reasons why we get errors from the tools we use. 1. Condition of the tools 2. The accuracy of the tools used. Condition of the Measuring Tool Condition of a tool can cause error in measurements such as 1. Broken tape measure 2. Scale readings not clear on the measuring tools 3. Faulty scales like the pin of a weight scale points at 5 kg even when no mass
is measured. 4. A clock is 5 minutes late. Example 1 A broken tape measure is used to measure the wood. Anyone can give a reading of 9.2 metre long. This is an incorrect reading. The wood is actually 1.7 metre long.
Always check the state of your measuring tool before measuring.
8 m 9 m
1 metre long
I see how the condition of the tool can add to the errors in measurement
GR 7 MATHEMATICS S5 116 SS4 LESSON 19 The Accurate Use of Tools People perform experiments or measurements in ways that can cause error. Sometimes the situation causes an error. Example 1 A student is selected from the class and every student measures the circumference of her head to the nearest tenth of a centimetre. Most students get between 47 and 49 centimetres. One student gets 37.4 centimetres.
The example above involves some measurement error, but those measurements were correct. However the student who got 37.4 cm must have made a mistake, an error resulting from misunderstanding.
Most students had slightly different answers in Example 1 due to how each student performed the measurement (accuracy of the tool used). That is, where they placed the tape measure or how tight or loose they held the tape measure. All these measurements were close to each other; however the student with the reading of 37.4 cm probably made a mistake such as reading the tape measure incorrectly or placed the tape measure in the wrong position. This can be corrected. Example 2 A student drops a ball from a height of 80 cm three times to see how high it bounces. He gets 41 cm, 45 cm and 44 cm. It is surprising that repeating the activity; that is dropping the ball from 80 cm high, results in different measurement. It is hard to measure how high the ball bounces, since the ball does not stop at the height of its bounce and wait for you to measure the distance from the floor. Also there can be differences caused by different parts of the ball being bouncier or different spots on the floor being bouncier. In Examples 1 and 2, there were repeated measurements of the same thing that produced different answers. Note: In mathematics we must tell the difference between error and mistake.
That explains why the situations contribute to the accuracy of the tools used.
This is a typical example of an experimental error.
GR 7 MATHEMATICS S5 117 SS4 LESSON 19 The 37.4 cm measurement is a mistake. It is an error resulting from carelessness, lack of concentration or misunderstanding. The other students‟ measurements were slightly different from each other. They also involve some measurement errors. Example 3 Students measure the volume of a marble using a cylinder. Most students got either 7 or 8 cubic centimeters. Two students got 67 cubic centimeters. In Example 3, students used a cylinder to measure the volume by displacement. Two students forgot to subtract the volume of the water in the cylinder so they got measurements that were very different from the others.
NOW DO PRACTICE EXERCISE 19
This is a clear example of a mistake.
The actual volume of the marble is between 7 and 8 cubic centimetres.
GR 7 MATHEMATICS S5 118 SS4 LESSON 19 Practice Exercise 19 1. You are to measure and draw a distance of 26 cm on A3 paper.
a) Check that all scales are clear. b) Check that zero mark is visible. c) Check the ruler edge is straight.
2. Weigh yourself. Check to see that the scales needle is moving freely and is at
zero before you take your weight. 3. You are to measure the distance for a 100 m race.
a) You will use a sports tape to peg out the distance.
b) Check that all scale intervals are the same. Check if all scales are
clearly shown. c) Ensure that the zero mark is still there.
4. A school starts lessons at 8 am. A student‟s clock is 15 minutes early. He
arrives at school at quarter past 8.
Is he late or early? Explain your answer. 5. A weighing scale has its needle pointing at 5 kg. Joel weighs himself and finds
that he is 57 kg.
What is his actual weight? Explain how you got your answer. 6. A class of students measured Martina‟s height. Most students got answers
between 110 cm and 112 cm. One student got a reading of 112 m.
Explain what might have caused the different answers.
CHECK YOUR WORK. ANSWERS ARE AT THE END OF SUB-STRAND 4
GR 7 MATHEMATICS S5 119 SS4 LESSON 20 Lesson 20: Errors due to Incompetence ___________________________________________________________________
In the previous lesson, we learnt that errors in reading measurements can occur as a result of the tools used.
In this lesson you will:
calculate errors due to incompetence. ___________________________________________________________________ What do we mean by incompetence? Much of the errors that we get from measurements are due to incompetence. Let us look at the same examples used in Lesson 19 to explain incompetence. Example 1 A student is selected from the class and every student measures the circumference of her head to the nearest tenth of a centimeter. Most students get between 47 and 49 centimetres. One student gets 37.4 centimetres.
The student who got 37.4 made a mistake which is an error resulting from carelessness, lack of concentration or misunderstanding. This is an example of incompetence.
Example 2 Students measure the volume of a marble using a cylinder. Most students get either 7 or 8 cubic centimeters. Two students get 67 cubic centimeters.
The two students who got 67 cubic centimetres is an example of incompetence. They did not know how to work out the answer or just forgot to subtract the volume of water.
Incompetence means not possessing the necessary ability or skill to carry out the task. In measurement, it is the lack of skill and knowledge of reading scales or taking measurements.
Your knowledge on using the correct units is also important in giving accurate readings.
nor can you measure the weight of a baby in cm.
You can not measure the length of a classroom in kilometres.
GR 7 MATHEMATICS S5 120 SS4 LESSON 20 The previous lessons on measurement units are important in this study. Using incorrect units gives an error in measurement. Example 3 What is the most suitable unit to measure the following? a) Thickness of a strand of hair
Answer: Millimeter is the best unit because a strand of hair is very thin.
b) The length of a river
Answer: A river is usually very long so kilometres or miles is best.
c) Area of a hibiscus leaf
Answer: A leaf is about the size of palm so square centimetres is best.
Example 4 Shannon decides to measure the volume of water with a measuring jug. What should she check for before taking the reading? Answer: Carelessness and lack of concentration can cause you to make a
mistake in your reading.
Therefore she must check to see that the readings are clear and make sure she is measuring water and not another liquid.
If the readings on the measuring jug are not clear, she can use a container that has measurements clearly shown.
NOW DO PRACTICE EXERCISE 20
GR 7 MATHEMATICS S5 121 SS4 LESSON 20 Practice Exercise 20 1. Read the information below and identify what the person needs to check on
before taking the measurements.
a). Masir is going to record Sam‟s running time with a stop watch. _________________________________________________________ _________________________________________________________ _________________________________________________________
b). Schola will check her weight in the bathroom using the bathroom scale. _________________________________________________________ _________________________________________________________ _________________________________________________________
c). Ruth will measure and peg out a rectangular 10m by 4m area. _________________________________________________________ _________________________________________________________ _________________________________________________________
d). Maleva needs 211
L of water to cook rice.
_________________________________________________________ _________________________________________________________ _________________________________________________________
e). Dom needs 500kg of green coffee to make 300kg of dried coffee. _________________________________________________________ _________________________________________________________ _________________________________________________________
2. State the correct units to measure the following items
a) Weight of a cargo ship. __________
b) Height of a bulldozer. __________
c) Length of your thumb. __________ d) Distance from Port Moresby to Lae. __________
e) Thickness of a fishing line. __________
f) Area of a swimming pool. __________
g) Speed of 100 metre race. __________
GR 7 MATHEMATICS S5 122 SS4 LESSON 20 3. State whether the following statements are correct or not? Give a reason for
your answer?
a) 1 mm is about a grain of sand _________________________________________________________ _________________________________________________________ _________________________________________________________
b) 1 metre is about the width of a standard door. _________________________________________________________ _________________________________________________________ _________________________________________________________
c) 1 kilometre takes about 15 minutes to walk.
_________________________________________________________ _________________________________________________________ _________________________________________________________ ___________________________________________________________________ 4. A group of students measured Paul‟s heightl. Most students got a result
between 98 cm and 100 cm. One student got 1 metre and two others got 78 cm.
Explain the possible causes of the different results.
______________________________________________________________ ______________________________________________________________ ______________________________________________________________ ______________________________________________________________ 5. Mary and Jack calculated the difference between 2:30 pm and 3:20 pm on the
same day. The results were 1 hour and 50 minutes respectively.
Indicate which answer is right and which is wrong. Give an explanation for each of your answers. ______________________________________________________________________________________________________________________________________________________________________________________________________________________________________________________________________________________________________________________
6. What time is 1 12 hours after 7: 30 pm? Show your working out.
GR 7 MATHEMATICS S5 123 SS4 LESSON 20 7. If today‟s date is 3rd October, what will be the date in one week‟s time? It is important to be able to calculate using the calendar.
8. Which measure of capacity, 50mL, 500mL or 50 L would be most appropriate
for
a) a bottle of drink?
b) a petrol tank of a car?
c) a medicine glass?
Give a reason for each of the above. a) _________________________________________________________ b) _________________________________________________________ c) _________________________________________________________
9. How many times would a 1.5 L jug need to be filled to pour out 50 drinks at the
party if the glasses hold 300 mL?
CHECK YOU WORK. ANSWERS ARE AT THE END OF THE SUB-STRAND 4
GR 7 MATHEMATICS S5 124 SS4 LESSON 21 Lesson 21: Errors Due to the Condition of the Materials
Measured ___________________________________________________________________
We learnt that incompetence contributes to the errors we get in measuring.
In this lesson you will:
identify some conditions that cause error in measurement.
The condition of the materials or the item to be measured can cause error in the measurement. Example 1 A bag of vanilla beans weighed 20kg.The bag was later found with nails implanted amongst the beans. The 20 kg bag is therefore not the true weight of the vanilla beans. Example 2 A 3 metre material cut from a roll may not be exactly 3 metres. Materials of different textures have different errors associated with them. Example 3 The weight of raw goods can be too high if it is not properly dried. Copra is an example. Other examples include a bag of coffee which may contain leaves or sticks, gold may contain some traces of copper and salt may contain traces of mud. Example 4 A gold buyer tests a sample of gold and finds it is 95% gold and 5% copper. If the sample weighs 400 g, what is the true weight of gold in the sample? Raw materials such as coffee, copra or cocoa packed in bags may contain dried leaves or grass. Its weight may not be accurate. Minerals such as gold and copper can have a small percentage of impurities which can add to error in measurement.
NOW DO PRACTICE EXERCISE 21
People buying these materials often do tests for purity before measuring.
GR 7 MATHEMATICS S5 125 SS4 LESSON 21 Practice Exercise 21
1. Conan collected 10 kg of coffee from his coffee garden.
If his coffee beans weigh 9.6 kg three days later, what was the percentage of water in the coffee beans?
2. Ronan sells 60 g of alluvial gold. The buyer knows that 5% of the gold is
waste.
What is the correct weight of gold?
3. Constacia Dupa sells 200 kg of green-copra to a buyer. If she sold it the next
day, she might lose 8% of the weight.
What will be the weight of copra the next day? 4. 25% of a consignment of fruit was bad. If 1500 kg was good, how much did
the consignment weigh? 5. A consignment of perishable goods weighs 300 kg. 30% of the consignment is
un-saleable.
What weight is saleable? ___________________________________________________________________ 6. A certain mixture of glycerin and water contains 35% weight of glycerin. To
every 100 grams of the mixture are added 25 grams of water.
Find what percentage of the weight of the diluted mixture is water?
CHECK YOUR WORK. ANSWERS ARE AT THE END OF SUB-STRAND 4
GR 7 MATHEMATICS S5 126 SS4 LESSON 23 Lesson 22: Errors caused by Calculations
In the previous lesson we looked at errors due to the condition of materials.
In this lesson you will
identify errors caused by calculations. ___________________________________________________________________ What are some causes of error in calculation? In this lesson we look at errors caused by calculation. Your knowledge of estimation and rounding off numbers in number and operations in the earlier lessons will be helpful in this lesson. Estimating and Rounding There are many uses of estimation which are important in solving mathematical problems. Let us look at the following examples to explain what we mean by estimating. Example 1 Two-seventh of 37 students is 10 students. To solve this, we multiply 27 and 37.
That is, 27 × 37= 10.571429
The answer cannot be 10.571429. Students are human beings. We do not count persons as decimals or fractions. Persons are counted in whole numbers. The answer cannot be 10.6. You cannot round off people. If you do calculation in which you use measurements that are inaccurate, then the result of the calculation will be even less accurate. This is particularly true especially when multiplication is involved.
Estimate means to judge approximately the value, worth or importance of something.
What is an estimate?
Note the answer is rounded off. It is a normal practice.
GR 7 MATHEMATICS S5 127 SS4 LESSON 23 Example 2 A floor of a room has a length of 8.1m and a width of 4.7m. Find the area of the room. Solution: The area is found by the Rule
Area = length × width
Therefore, Area = 8.1m x 4.2 m = 34.02 m2
The area is 34 m2.
With the area of buildings, the measurements are usually rounded off. In this case, 34 m2 has an error of 0.02. Example 3 A tank holds 1000 litres of water. How many times will a 3.2 litre bucket take to empty the tank? Solution: 1000 divide by 3.2 is equal to 312.5
Therefore, it will take 312 times.
NOW DO PRACTICE EXERCISE 22
See how the error is worked out. Error is equal to the difference between the actual area and the expected value. i e, 34.02 – 34 = 0.02
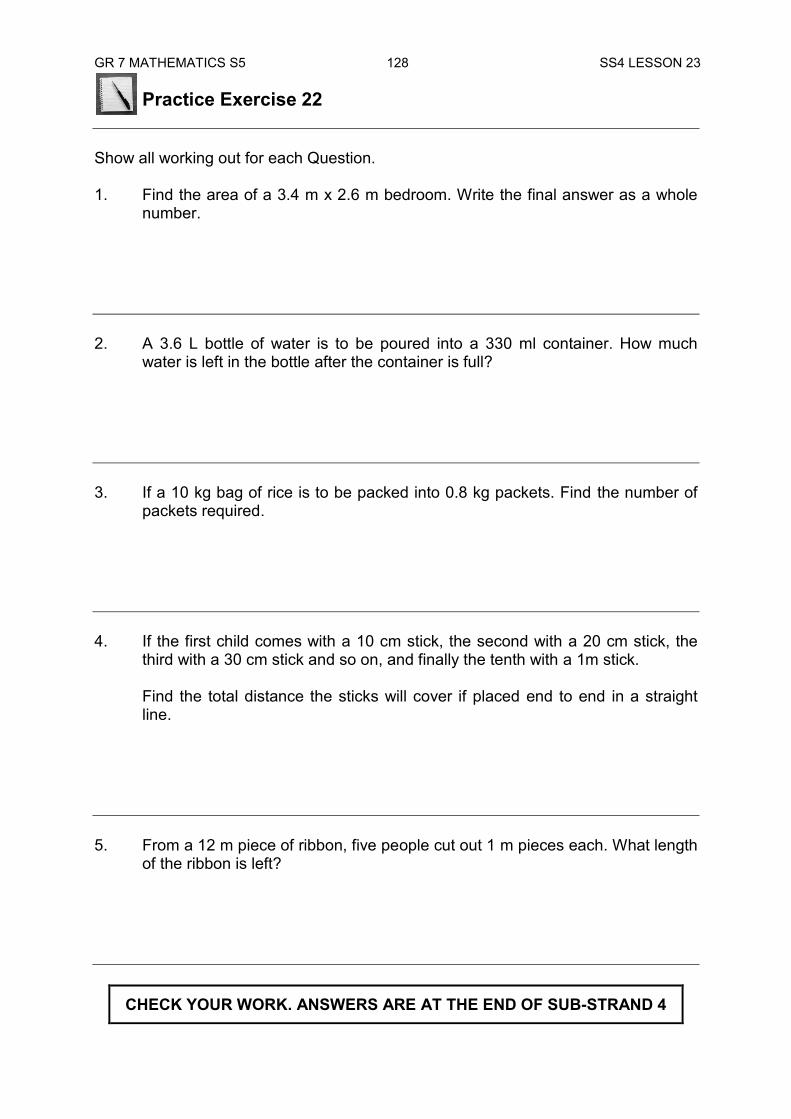
GR 7 MATHEMATICS S5 128 SS4 LESSON 23
Practice Exercise 22 Show all working out for each Question. 1. Find the area of a 3.4 m x 2.6 m bedroom. Write the final answer as a whole
number. 2. A 3.6 L bottle of water is to be poured into a 330 ml container. How much
water is left in the bottle after the container is full? 3. If a 10 kg bag of rice is to be packed into 0.8 kg packets. Find the number of
packets required. 4. If the first child comes with a 10 cm stick, the second with a 20 cm stick, the
third with a 30 cm stick and so on, and finally the tenth with a 1m stick. Find the total distance the sticks will cover if placed end to end in a straight line.
5. From a 12 m piece of ribbon, five people cut out 1 m pieces each. What length
of the ribbon is left?
CHECK YOUR WORK. ANSWERS ARE AT THE END OF SUB-STRAND 4
GR 7 MATHEMATICS S5 129 SS4 LESSON 23 Lesson 23: Using Appropriate Measuring Tools.
We have learned about five different types of errors in the 5 preceding lessons.
In this lesson you will:
identify some measuring tools
identify measures to limit errors in measurements. ___________________________________________________________________ It is important to use the correct and appropriate instrument to measure objects. Much of the errors we get are because we do not use the right instruments. Let us first of all look at some basic measuring instruments. You have covered the instruments in detail in Measurement 1 and 2. You can refer back to Strand 4 to review the instruments. To measure length, we can use the following: 1. Ruler (30cm) on paper 2. Meter ruler on black or white board 3. Tape measure on land or reading heights To measure weight, we can use the following 1. Bathroom scale for human weight 2. Beam balance for smaller weights such as that of a pebble. 3. Beam balance for larger weights such as for bags of copra. To measure time, we use the following Stop watch to check on running time. A clock or wrists watch to monitor time of the day. How do we reduce error in measurements? To get more reliable and accurate results, scientists often repeat a measurement several times and then take the average of all the measurements. The average that we use can be either the mean or the median.
GR 7 MATHEMATICS S5 130 SS4 LESSON 23 Example 1 A student drops a ball from a height of 80 cm three times to see how high it bounces. He gets 42 cm, 45 cm and 44 cm. We can take the median of all scores and say the ball bounces to a height of 44 cm. We can take the mean of the readings and say the ball bounced 43 cm high. 42 + 45 + 44
3 = 1313 = 43.666…..
Notice that 43.666… is close to 44. In this lesson, we will only use the mean as a measure to reduce errors. Example 2 Mary‟s weight was measured by 5 girls. They had the following readings: 45 kg, 45.5 kg, 46 kg, 44.5 kg and 44 kg. Using mean to work out her closest weight, we have 225 ÷ 5 = 45 kg Answer: Mary‟s weight is 45 kg Example 3 John‟s height is measured 3 times. The results are 110, 112 and 111. What is John‟s height? 112 + 111 + 110
3 = 3333 = 111
Answer: John‟s height is 111 cm.
NOW DO PRACTICE EXERCISE 23
Remember how median was worked out from Sub-strand 1 Arrange all the scores. The middle score is the median.
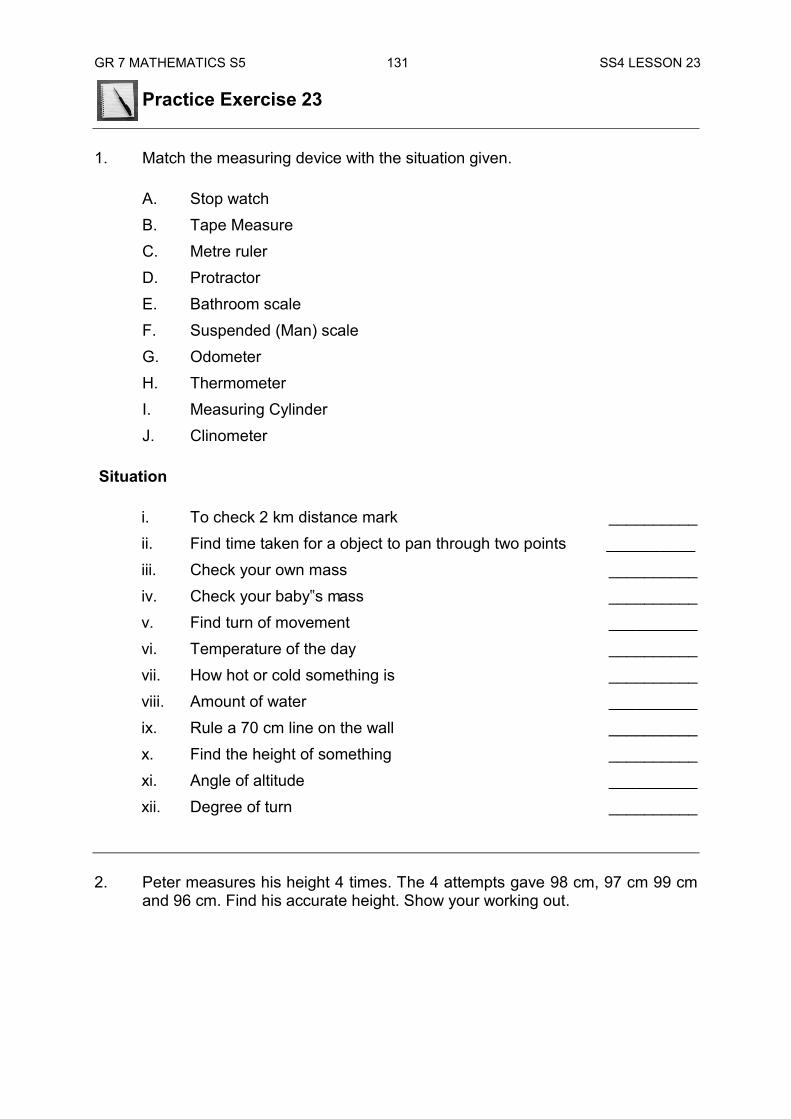
GR 7 MATHEMATICS S5 131 SS4 LESSON 23
Practice Exercise 23 1. Match the measuring device with the situation given.
A. Stop watch B. Tape Measure C. Metre ruler D. Protractor E. Bathroom scale F. Suspended (Man) scale G. Odometer H. Thermometer I. Measuring Cylinder J. Clinometer
Situation
i. To check 2 km distance mark __________ ii. Find time taken for a object to pan through two points __________ iii. Check your own mass __________ iv. Check your baby‟s mass __________ v. Find turn of movement __________ vi. Temperature of the day __________ vii. How hot or cold something is __________ viii. Amount of water __________ ix. Rule a 70 cm line on the wall __________ x. Find the height of something __________ xi. Angle of altitude __________ xii. Degree of turn __________
2. Peter measures his height 4 times. The 4 attempts gave 98 cm, 97 cm 99 cm
and 96 cm. Find his accurate height. Show your working out.
GR 7 MATHEMATICS S5 132 SS4 LESSON 23 3. A length of wood was measured. The readings were 42 cm, 43 cm, 45 cm, 42
cm and 44 cm.
What is the accurate length? 4. A volume of water was measured to be 32 cm3, 31cm3 and 34 cm3.
What is the accurate reading? 5. The distance from my house to the school was measured a number of times.
My readings were 1 km, 1.5 km, 1.2 km and 1.6 km.
What would be the closest reading?
CHECK YOUR WORK. ANSWERS ARE AT THE END OF SUB-STRAND 4
GR 7 MATHEMATICS S5 133 SS4 SUMMARY SUB-STRAND SUMMARY The world is not exact, that is why we have errors in measurements.
An error is the difference between a measurement and the true or accepted value.
Incompetence means not possessing the necessary ability or skill to carry out the task. In measurement, it is the lack of skill and knowledge of reading scales or taking measurements.
Estimate means to judge approximately the value, worth or importance of something.
Any measurement is only accurate to ± 0.5 of the smallest division on the scale.
The two reasons why we get errors from the tools we use are: conditions of tools and the accuracy of the tools used.
REVISE LESSONS 20-24. THEN DO SUB-STRAND TEST IN ASSIGNMENT 5
In this summary you will find some of the important ideas and concepts to remember
GR 7 MATHEMATICS S5 134 SS4 ANSWERS ANSWERS TO PRACTICE EXERCISES 18-23 Practice Exercise 18 1 a) ± 0.5 mm b) ± 0.5 k c) ± 0.5 cm d) ± 0.5 mL 2. a) 309.5 cm to 310.5 cm b) 228.5 m to 229.5 m 3. a) 48.5 kg to 49.5 kg b) 84.5 to 85.5 kg c) 71.5 kg to 72.5 kg 4. a) 26.5 to 27.5 b) 1 to 2 kg c) 24.5 g to 25.5 kg
d) 4.3m to 5.3m e) 3.25 to 4.25kg 5. 3.6 cm 6 5.5 m 7. 1.7 cm Practice Exercise 19 1. Answers vary 2. Answers vary 3. Answers vary 4. Because the clock is 15 minutes early, then 8: 15 – 15 = 8 am. He is therefore
in time. 5. 52 kg 6. unit of measurement is incorrect. Practice Exercise 20 1. Make sure instruments are not faulty. Readings are clear. 2. a) tonnes b) metres c) cm d) km or miles e) mm f) metre g) seconds 3. a, b and c are correct
4. Answers vary
5. 50 minutes is correct
6. 9 pm
7. 10th of October
8. a) 500 ml b) 50 L c) 50 mL
9. ten times
GR 7 MATHEMATICS S5 135 SS4 ANSWERS Practice Exercise 21 1. 4 % 2. 57 grams 3. 184 kg 4. 2000kg 5. 210 kg 6. 72 % Practice Exercise 22 1. 9 m 2. 3.27 L 3. 13 packets 4. 550 cm 5. 7 metres left. Practice Exercise 23 1. i. G ii. A iii. E iv. F v. D vi. H
vii. H viii. I ix. C x. B xi. J xii. D 2. 97 cm 3. 43 cm 4 32 cm3 5. 1.30 km
END OF SUB-STRAND 4
GR 7 MATHEMATICS S5 136 REFERENCES
REFERENCES
NDOE (1995) Secondary School Mathematics 7A, Department of Education, PNG
NDOE (1995) Secondary School Mathematics 7B, Department of Education, PNG
Sue Gunningham and Pat Lilburn, Mathematics 7A and 7B, Outcome Edition, Oxford University Press, Australia and New Zealand
Mcseveny, R. Conway and S. Wilkens, New Signpost Mathematics 7, Pearson Education Australia Pty Ltd., www. longman.com.au
Thompson, and E. Wrightson, revised by S. Tisdell, Developmental Mathematics Book 1 and 2, McGraw Hill Fourth Edition
Antonio Coronel, P. Manalastas and Jose Marasigan, Mathematics 1 An Integrated Approach, Bookmark Inc. Makati, Manila, Philippines
Mathematics 1 for First Year High School, Textbook and Teachers Manual, SEDP Series DECS Republic of the Philippines
Estrellita l. Misa and Bernardino Q. Li, Moving Ahead with Mathematics, Mathematics Textbook for First Year High School, Public School Edition, FNB Educational Inc. Quezon City, Philippines
Worked examples for Mathematics Outcomes, Upper Primary, NDOE, PNG 2003
Intermediate Algebra, 3rd Edition: Johnston, Willis and Hughes Nelson Math 7, K. Swan, R. Adamson, G. Asp, M. Cocking, G. FitzSimons,
C. Lovitt and M. Orr
![[C] Communication [PS] Problem Solving Technology … · · 2013-08-20138 Kindergarten to Grade 8 Mathematics: Manitoba Curriculum Framework of Outcomes 2013) Grade 8 Strand: ...](https://static.fdocuments.us/doc/165x107/5b037d367f8b9a6c0b8c6125/c-communication-ps-problem-solving-technology-kindergarten-to-grade-8-mathematics.jpg)