1 Probability and Statistics What is probability? What is statistics?

G r a d e 6 M a t h e M a t i c s
Statistics and Probability

S t a t i s t i c s a n d P r o b a b i l i t y 3
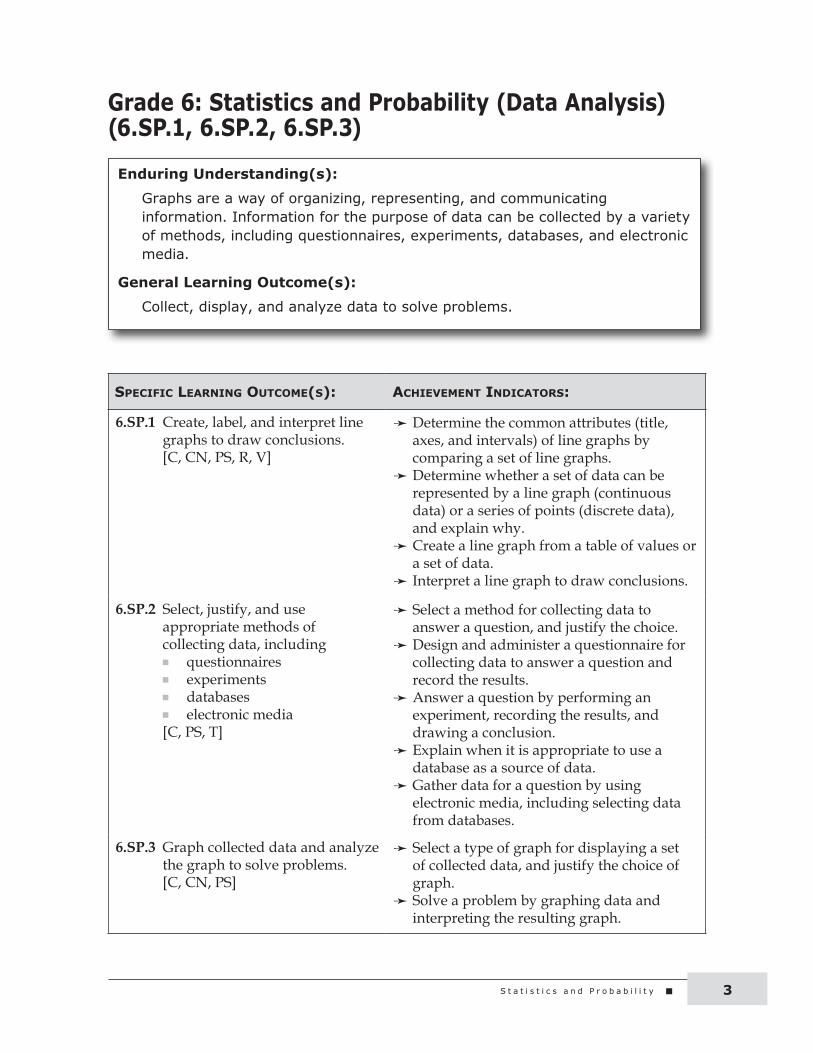
Grade 6: Statistics and Probability (Data Analysis) (6.SP.1, 6.SP.2, 6.SP.3)
Enduring Understanding(s):
Graphs are a way of organizing, representing, and communicating information. Information for the purpose of data can be collected by a variety of methods, including questionnaires, experiments, databases, and electronic media.
General Learning Outcome(s):
Collect, display, and analyze data to solve problems.
Specific Learning OutcOme(S): achievement indicatOrS:
6.SP.1 Create, label, and interpret line graphs to draw conclusions. [C, CN, PS, R, V]
Determine the common attributes (title, axes, and intervals) of line graphs by comparing a set of line graphs.
Determine whether a set of data can be represented by a line graph (continuous data) or a series of points (discrete data), and explain why.
Create a line graph from a table of values or a set of data.
Interpret a line graph to draw conclusions.
6.SP.2 Select, justify, and use appropriate methods of collecting data, including n questionnaires n experiments n databases n electronic media [C, PS, T]
Select a method for collecting data to answer a question, and justify the choice.
Design and administer a questionnaire for collecting data to answer a question and record the results.
Answer a question by performing an experiment, recording the results, and drawing a conclusion.
Explain when it is appropriate to use a database as a source of data.
Gather data for a question by using electronic media, including selecting data from databases.
6.SP.3 Graph collected data and analyze the graph to solve problems. [C, CN, PS]
Select a type of graph for displaying a set of collected data, and justify the choice of graph.
Solve a problem by graphing data and interpreting the resulting graph.

G r a d e 6 M a t h e m a t i c s : S u p p o r t D o c u m e n t f o r T e a c h e r s4
Prior Knowledge
Students may have had experience with the following:n Collecting, organizing, and using first-hand data (tally marks, line plots, charts, and
lists) to answer questionsn Drawing conclusions by constructing and interpreting pictographs and bar graphs.
involving many-to-one correspondencen Drawing conclusions by constructing and interpreting double bar graphsn Representing and describing decimals to hundredthsn Representing and describing whole numbers to 1 000 000
related Knowledge
Students should be introduced to the following:n Using graphs and tables to represent and describe patterns and relationshipsn Using technology to solve problems involving large numbers
BacKground information
In Grade 5, students learned to differentiate between first-hand data (information they obtained directly by asking questions, measuring, observing, or doing experiments) and second-hand data (readily available and obtainable from sources such as newspapers, magazines, journals, and electronic media). They also learned to construct and interpret double bar graphs (two sets of comparable data) to draw conclusions.
In Grade 6, students will learn to draw conclusions by creating, labelling, and interpreting line graphs. They will also solve problems by selecting, justifying, and using appropriate methods of collecting data, and by graphing collected data and analyzing the graph.
Line graphs are used when continuous data need to be presented, such as distance between a student and the school as he or she is nearing or leaving the school, shadow of a tree from sunrise to sunset, age, height, and temperature.
The method of data collection (including questionnaires, experiments, databases, and electronic media) depends on the question the student wants answered. Collected data is easier analyzed when it is presented by a graph. The title of the graph is placed above the graph, as shown below. The axes are labelled. By looking at the graphs below, we see that, for Graph 1, the x-axis represents the number of hours over which the measurements were taken, and the y-axis represents the length of the plant’s shadow in centimetres. For Graph 2, the x-axis represents the time in months over which the measurements were taken, and the y-axis represents the weight of the puppy in

S t a t i s t i c s a n d P r o b a b i l i t y 5
kilograms. The increments should be of equal size, numbered, and start at 0. If part of the scale has been omitted, then the graph will have a squiggle in its scale in order to indicate that an amount has been skipped. The independent values are placed along the horizontal axis and the dependent values are placed along the vertical axis. The two line graphs below will clarify this further.
Imagine that you want to measure the shadow of a certain flower between noon and evening, and use your data to create a graph. If this flower had no shadow at noon, had a 3 cm shadow at 1 p.m., and 3 more cm each hour, your graph should look much like Graph 1 below. Since your measurements were taken on the hour, each hour, the dots are placed above the numbers denoting the time. The shadow of the little flower did not grow in leaps of 3 cm when you were doing the measuring, but it continuously grew throughout the entire time (during and in between the time of the measurements). Since the growth is continuous, we represent the continuous growth by connecting the dots and forming a solid line.
Graph 1
Also, imagine that a little boy named Leo got a puppy for his birthday. If the puppy weighed 7 kg when Leo got it, 9 kg one month later, and gained 2 more kg each month, the graph representing the growth of the puppy should look much like Graph 2 below. Since the weight measurements were taken each month, the dots were placed above the numbers denoting the number of months passed since Leo got the puppy. The weight of the puppy did not increase in leaps of 2 kg on the day when the measurements were taken, but there was a continuous fluctuation of weight during each month between the measurements.
Although the numbering along the two axes starts at zero, the graph itself may or may not start at zero. Graph 1 starts at 0 because there was no shadow when the original measurement started, but Graph 2 starts at y = 7 because the puppy weighed 7 kilograms when Leo got it.
��
��
��
�������������� � � � � � �
���������� ����
��
����
���
��������

G r a d e 6 M a t h e m a t i c s : S u p p o r t D o c u m e n t f o r T e a c h e r s6
Graph 2
Now, imagine that you read in the daily newspaper that a certain country had a population of 270 million in the year 1998, 275 million in 2000, 280 million in 2002, 285 million in 2004, 290 million in 2006, 295 million in 2008, and 300 million in 2010. If you were to graph this data, you would need to place a squiggle between the zero and 1996 on the x-axis, and you would also need to place a squiggle between zero and 270 million to indicate that part of the scale has been omitted.
��
��������������
�����
����������� �
����������������� � � � � � �
��
�
�
�
�
�
�
���
����
����
�����
������
������
�
�����������������
��
��� �� ����������
� ��� ��� �� �� ��� �� ���
��
� � � � �

S t a t i s t i c s a n d P r o b a b i l i t y 7
It is important that students understand that they can connect the dots to form a line only if the graph represents continuous data. If the data is discrete, the dots are not connected, as in the example below.
���
����
����
�����
������
������
�
�����������������
��� �� �� �� �� � � � � ��
����� ��� �� ��� �� ��� ���
��
�
�
�
�
�
���
����
����
�����
������
������
�
�����������������
� � ���� ���� ��� ��� ���� ����
���� ������������
�
��
�
��
��

G r a d e 6 M a t h e m a t i c s : S u p p o r t D o c u m e n t f o r T e a c h e r s8
Imagine that during your math class you wanted to record the number of sips you had each time you drank some water. The first time you reached for your water bottle, you were very thirsty so you had seven sips of water; the second and third time, you were less thirsty so you had three sips each time; the fourth time, you only took two sips; the fifth time, you got a little thirstier so you took five sips; the sixth time around, you took three sips; and by the end of the math class, you were quite thirsty again so you drank eight sips of water. You would not connect these dots because these seven dots represent seven distinct actions. You were drinking only at those specified seven times you recorded and not in between—that is, you were not drinking continuously starting from the first time all the way through to the seventh time.
mathematical language
datagraphline graphtitleaxesintervalscontinuous datadiscrete data
�
������������������������������
�����
�����
������
����
�
��������������������
���������� ��������
�
�
�
�
��
�

S t a t i s t i c s a n d P r o b a b i l i t y 9
learning exPeriences
Assessing Prior Knowledge
Materials: n graph papern BLM 6.SP.1.3: Prior Knowledgen penciln straight edgeOrganization: Individual/whole class Procedure:1. Let students know that they will be doing an activity and that the
purpose of this activity is to find out what they know about line graphs.
2. Distribute to each student a copy of BLM 6.SP.1.3: Prior Knowledge and tell them to complete the activity.
3. Have students share their graphs and conclusions with the rest of the class.
Observation Checklist
Observe students’ responses to determine whether they can do the following:r Make a line graph.r Explain when a line graph is used.r Include a title with the graph.r Label the axes.r Use appropriate scale with equal increments that start at zero.r List more than one way of collecting data.
G r a d e 6 M a t h e m a t i c s : S u p p o r t D o c u m e n t f o r T e a c h e r s10
Suggestions for Instruction
Materials: n BLM 6.SP.1.4: Common Attributes of Line Graphs
Organization: Pairs/whole class
Procedure:1. Have students work in groups of two.2. Distribute to each student a copy of BLM 6.SP.1.4.3. Ask students to analyze the line graphs and discuss with their partner what they
observed.4. Have a class discussion on what is similar and/or different.5. Write the common attributes (title, axes, and intervals) on the board, and discuss the
importance of each.6. Ask students to write in their journals the common attributes of a line graph, and
explain why each is important.
n Determine the common attributes (title, axes, and intervals) of line graphs by comparing a set of line graphs.
Observation Checklist
Check students’ replies to determine whether they can do the following:r Tell that each line graph has a title and that the title of the graph is
placed above the graph.r Tell that each line graph has two axes (horizontal and vertical) and
that the axes are labelled.r Tell that each axis is marked with increments of equal size, which
are numbered, and start at zero.

S t a t i s t i c s a n d P r o b a b i l i t y 11
Suggestions for Instruction
Materials: n BLM 6.SP.1.5: Timmy’s Mom Had a New Baby
Organization: Pairs/whole class
Procedure:1. Have students do this activity individually.2. Distribute to each student a copy of BLM 6.SP.1.5.3. Ask students to analyze the set of data and answer the following questions:
a) How tall was the baby at the time of the first check-up?b) How much did the baby grow between check-ups?c) Would the baby grow more if Timmy sang to the baby? Why?d) How much do you think the baby would grow between check-ups if Grandma
came for a visit? Why?e) Would you use a line graph or a series of points to represent this data? Why?
4. Have a class discussion. 5. Ask students to write in their journals if they would use the same type of graph to
record the number of candy bars they ate each day, and explain their reason for their decision.
n Determine whether a set of data can be represented by a line graph (continuous data) or a series of points (discrete data), and explain why.
Observation Checklist
Check students’ replies to determine whether they can do the following:r Tell that the increase in height was the same each month. r Tell that the data was continuous.r Tell that they need to use a line graph to represent continuous
data.

G r a d e 6 M a t h e m a t i c s : S u p p o r t D o c u m e n t f o r T e a c h e r s12
Suggestions for Instruction
Materials: n BLM 6.SP.1.6: Grandma’s Lilac Bush
Organization: Individual
Procedure:1. Have students do this activity individually.2. Distribute to each student a copy of BLM 6.SP.1.6.3. Tell students to answer the following questions:
a) What was the height of Grandma’s lilac bush after three months?b) What do you think it means that the lilac bush was 40 cm at 0 months? Explain.c) Do you think the lilac bush would grow faster if Grandma would plant another
lilac bush next to it? Explain.4. Tell students to create a line graph from the table of values. 5. Circulate to see if they record the title of the graph, mark the axes, and use equally
spaced intervals.6. Have a class discussion. 7. Ask students to write in their journals what they learned about creating a line graph
from a table of values.
n Create a line graph from a table of values or a set of data.
Observation Checklist
Check students’ replies to determine whether they can do the following:r Draw a line graph. r Place the title above the graph.r Label each axis.r Mark each axis with increments of equal size, number increments,
and start at 0.

S t a t i s t i c s a n d P r o b a b i l i t y 13
Suggestions for Instruction
Materials: n BLM 6.SP.1.7: Mom’s Distance from Home
Organization: Small groups (3 or 4 students)/whole class
Procedure:1. Have students do this activity in groups of 3 or 4.2. Place on the overhead projector a transparency of BLM 6.SP.1.7.3. Tell students to study the graph, and discuss with their group members what they
observed.4. Circulate to listen for their observation. (Did the students observe the title, axes, and
intervals?) Following are some questions you might want to ask your students:a) What does the horizontal portion of the graph represent?b) What does the vertical portion of the graph represent?c) Do you think mom was walking or driving? Why?d) What do you think the graph would look like if she started running?e) Do you think the graph would look different if you accompanied mom? Why?f) What do you think the graph would look like if dad took the same route? Why?
5. Have a class discussion. 6. Ask students to write in their journals what they learned.
n Interpret a line graph to draw conclusions.
Observation Checklist
Check students’ replies to determine whether they can do the following:r Recognize a line graph. r Observe the title above the graph.r Observe that each axis is labelled.r Observe that each axis is marked with increments of equal size,
that increments are numbered, and that they start at 0.

G r a d e 6 M a t h e m a t i c s : S u p p o r t D o c u m e n t f o r T e a c h e r s14
Suggestions for Instruction
Materials: n BLM 6.SP.1.8: Questions for Data Collection #1
Organization: Whole class
Procedure:1. Place on the overhead projector a transparency of BLM 6.SP.1.8.2. Read the first question.3. Let students choose the method of collecting data they think is appropriate for the
question.4. Discuss their choice. 5. Read the next question and repeat the process until all six questions have been
discussed. 6. Discuss the database as a source of data. If students chose the database as a source of
data for any of the questions, discuss why they did so. If students did not choose the database as a source of data for any of the questions, discuss why they did not.
7. Ask students to write in their journals what they learned about data sources—i.e., give an example of when they might use a) questionnaires as a method of data collectionb) experiments as a method of data collectionc) databases as a method of data collectiond) electronic media as a method of data collection
n Select a method for collecting data to answer a question, and justify the choice.
n Explain when it is appropriate to use a database as a source of data.
Observation Checklist
Check students’ replies to determine whether they can do the following:r Recognize the appropriate method of collecting data. r Recognize when it is appropriate to use a database as a method of
collecting data.r Provide a good justification for choosing a particular method of
collecting data.
S t a t i s t i c s a n d P r o b a b i l i t y 15
Suggestions for Instruction
Materials: n Posters marked “questionnaire,” “experiment,” “database,” “electronic media” (each
posted in a different corner of the room)
Organization: Whole class
Procedure:1. Let students know that you will be playing a game called “Four Corners.”2. Provide students with a data collection scenario.3. Ask them to think individually about which would be the best way to collect the
data (questionnaire, experiment, database, electronic media).4. Let students know that each corner of the room represents a different type of data
collection.5. Ask them to go to the corner that represents the method of data collection that they
think is best suited to the scenario.6. When they are there, chat with the others who also selected that method, and
prepare to share the reasoning with the whole class.7. One by one, the groups will share their reasoning, trying to convince other members
of the class to come to their corner.
n Select a method for collecting data to answer a question, and justify the choice.
n Explain when it is appropriate to use a database as a source of data.
G r a d e 6 M a t h e m a t i c s : S u p p o r t D o c u m e n t f o r T e a c h e r s16
Suggestions for Instruction
Materials: n BLM 6.SP.1.9: Questions for Data Collection #2
Organization: Individual/whole class
Procedure:1. Have students work individually.2. Distribute to each student a copy of BLM 6.SP.1.9.3. Say the following to students
a) Read each question carefully.b) For each question, write down the method you would choose to collect your data.c) Explain why you would choose that method of data collection.
4. Circulate to see if they choose the appropriate method of data collection for each question.
5. Have a class discussion. 6. Ask students to write in their journals what they learned.
n Select a method for collecting data to answer a question, and justify the choice.
n Explain when it is appropriate to use a database as a source of data.
Observation Checklist
Check students’ replies to determine whether they can do the following:r Recognize the appropriate method of collecting data. r Recognize when it is appropriate to use a database as a method of
collecting data.r Provide a good justification for choosing a particular method of
collecting data.

S t a t i s t i c s a n d P r o b a b i l i t y 17
Suggestions for Instruction
Organization: Small groups (three or four students)/whole class
Procedure:1. Have students sit in small groups.2. Discuss with the whole class possible questions that lend themselves to a
questionnaire type of data collecting. Choose types of questions that can be done in the classroom.
3. Write on the board the questions appropriate for the questionnaire type of data collecting.
4. Choose one of the questions and, together, design a questionnaire for data collecting.5. Discuss what makes a good questionnaire.6. Tell each group to choose one question from the board and design a questionnaire.7. Circulate to see if the questionnaires are asking the appropriate information to
collect good data for each particular question. 8. Have a class discussion. 9. Make copies of student questionnaires.
10. Ask students to administer the questionnaire to other groups, and then record the results.
n Design and administer a questionnaire for collecting data to answer a question and record the results.
Observation Checklist
Check students’ replies to determine whether they can do the following:r Recognize the appropriate method of collecting data. r Recognize when it is appropriate to use a questionnaire as the
method of collecting data.r Design and administer a questionnaire for collecting data.r Record results of a questionnaire.

G r a d e 6 M a t h e m a t i c s : S u p p o r t D o c u m e n t f o r T e a c h e r s18
Suggestions for Instruction
Materials: n computern respiration rate beltn relative pressure sensor
Organization: Whole class
Procedure:1. Use Internet Explorer (or any other web browser) to find PASCO:AP Biology
Probeware Labs. 2. Click on the following links:
a) “educator resources” (in the blue title area at the top)b) Scroll down to “Experiments” and click on “Online Experiments” c) “Take My Breath Away” (under Featured Experiments)d) Scroll down to “Downloads,” and click on “Take My Breath Away - Science
Workshop” 3. Read the experiment “Take My Breath Away - Science Workshop for Systems” and
follow the instructions.4. Under “Data Analysis,” omit question 2. (Mean is not part of the Grade 6
curriculum.)5. Omit “Conclusions and Extensions.” 6. Have a class discussion and ask students to record their answers to the following
questions:a) What was your breathing rate at the start of the experiment? b) What was your breathing rate during your exercise? c) What was your breathing rate at the end of your exercise? d) What do you think your breathing rate would be if you were sleeping? Why?e) What do you think your breathing rate would be if your friend would read you a
story? Why? f) How do you think the graph would look if your breathing rate was measured
while you played soccer? Why?
n Answer a question by performing an experiment, recording the results, and drawing a conclusion.

S t a t i s t i c s a n d P r o b a b i l i t y 19
Suggestions for Instruction
Materials: n BLM 6.SP.1.8: Questions for Data Collection #1n BLM 6.SP.1.9: Questions for Data Collection #2
Organization: Whole class
Procedure:1. Have students sit in small groups.2. Place a transparency copy of BLM 6.SP.1.8 and BLM 6.SP.1.9. 3. Tell students to read the questions and choose the ones that lend themselves to
collecting data by performing an experiment.4. Have a class discussion.5. Discuss with the whole class other possible questions that lend themselves to data
collecting by performing an experiment. Try to select questions that lend themselves to performing experiments in class.
6. Discuss what makes a good experiment.7. Tell each group to choose one question from those they discussed, perform an
experiment in class, record the results, and draw a conclusion.8. Circulate to see if the students are collecting the appropriate data, recording the
results, and drawing a conclusion. 9. Have a class discussion.
10. Tell students to record in their journals what they learned about answering a question by performing an experiment, recording the results, and drawing a conclusion.
Observation Checklist
Check students’ replies to determine whether they can do the following:r Use technology as an aid to conduct an experiment. r Use technology as the method of collecting data.r Record the results of an experiment.r Draw a conclusion from a computer-designed graph.
n Answer a question by performing an experiment, recording the results, and drawing a conclusion.

G r a d e 6 M a t h e m a t i c s : S u p p o r t D o c u m e n t f o r T e a c h e r s20
Suggestions for Instruction
Materials: n BLM 6.SP.1.8: Questions for Data Collection #1n BLM 6.SP.1.9: Questions for Data Collection #2
Organization: Individually/whole class
Procedure:1. Have students work individually.2. Distribute to each student a copy of BLM 6.SP.1.8 and BLM 6.SP.1.9. 3. Tell students to read the questions and choose the ones that lend themselves to
collecting data by using electronic media, including selecting data from databases.4. Have a class discussion.5. Tell students that each of them needs to choose a question from those discussed
earlier and gather data for his or her question by using the computer. 6. Have each student work alone at a computer.7. Circulate to see if the students are finding the appropriate data. 8. Have a class discussion. 9. Tell students to think of who might use this data and for what purpose. Have them
record their ideas in their journals.
Observation Checklist
Check students’ replies to determine whether they can do the following:r Recognize when it is appropriate to use an experiment as the
method of collecting data.r Perform an experiment for collecting data.r Record the results of an experiment.r Draw a conclusion from an experiment.
n Gather data for a question by using electronic media, including selecting data from databases.

S t a t i s t i c s a n d P r o b a b i l i t y 21
Suggestions for Instruction
Materials: n BLM 6.SP.1.10: Bobby Planted Peas n BLM 6.SP.1.11: Data or Not?
Organization: Two groups
Procedure:1. Tell students that before they do the activity, there will be a small review.2. Discuss with the class the different types of graphs they learned about in the
previous grades and in Grade 6.3. Ask individual students to draw examples of graphs on the board.4. Discuss what the best use would be for each graph.5. Tell students to draw a sample of each graph, such as a pictograph, single bar graph,
double bar graph (from previous grades), and a line graph (Grade 6) and give an example of when each would be used, as stated in the class discussion.
6. Circulate and check that students draw a sample of each graph (i.e., a pictograph, single bar graph, double bar graph, and a line graph), and that they give an example of when each would be used, as stated in the class discussion.
7. Then divide class into two groups (group A and B).8. Distribute to each student in group A a copy of BLM 6.SP.1.10. Distribute to each
student in group B a copy of BLM 6.SP.1.11.
Observation Checklist
Check students’ replies to determine whether they can do the following:r Recognize when it is appropriate to gather data by using electronic
media.r Use electronic media for collecting data.
n Select a type of graph for displaying a set of collected data, and justify the choice of graph.
n Solve a problem by graphing data and interpreting the resulting graph.
G r a d e 6 M a t h e m a t i c s : S u p p o r t D o c u m e n t f o r T e a c h e r s22
9. Say the following to the students:a) Read the question carefully.b) Select a type of graph for displaying the data collected from your question.c) Justify your choice of graph.
10. Have a class discussion.11. Tell each group to do the following :
a) Graph the data on a poster-sized sheet.b) Interpret the resulting graph.c) Post the graph on the board.
12. Ask for three volunteers from group A to come up to the front of the class and explain their work.
13. Let students from group B ask questions for clarification.14. Ask for three volunteers from group B to come up to the front of the class and
explain their work.15. Let students from group A ask questions for clarification.16. Tell students to write in their journals what they learned about selecting graphs and
interpreting the resulting graph.
Observation Checklist
Check students’ replies to determine whether they can do the following:r Select the appropriate type of graph for displaying a set of
collected data. r Justify their choice of graph.r Graph data.r Interpret the resulting graph.

S t a t i s t i c s a n d P r o b a b i l i t y 23
Grade 6: Statistics and Probability (Chance and Uncertainty) (6.SP.4)
Enduring Understanding(s):
Chance is an element of many aspects of our lives. The chance that an event will occur varies from impossible to certain.
Experimental results of a small-scale experiment may be quite different from the theoretical probability, while experimental results of a very large experiment should be approaching the theoretical probability.
General Learning Outcome(s):
Use experimental and theoretical probabilities to represent and solve problems involving uncertainty.
Specific Learning OutcOme(S): achievement indicatOrS:
6.SP.4 Demonstrate an understanding of probability by n identifying all possible outcomes of a probability experiment n differentiating between experimental and theoretical probability n determining the theoretical probability of outcomes in a probability experiment n determining the experimental probability of outcomes in a probability experiment n comparing experimental results with the theoretical probability for an experiment [C, ME, PS, T]
List the possible outcomes of a probability experiment, such asn tossing a coinn rolling a die with any number of sidesn spinning a spinner with any number of
sectors Determine the theoretical probability of
an outcome occurring for a probability experiment.
Predict the probability of an outcome occurring for a probability experiment by using theoretical probability.
Conduct a probability experiment, with or without technology, and compare the experimental results to the theoretical probability.
Explain that as the number of trials in a probability experiment increases, the experimental probability approaches theoretical probability of a particular outcome.
Distinguish between theoretical probability and experimental probability, and explain the differences.
G r a d e 6 M a t h e m a t i c s : S u p p o r t D o c u m e n t f o r T e a c h e r s24
Prior Knowledge
Students may have had experience with the following:n Using words, such as impossible, possible, and certain, to describe the likelihood of a
single outcome occurringn Using words, such as less likely, equally likely, and more likely, to compare the likelihood
of two possible outcomes occurringn Having an understanding of fractions
related Knowledge
Students should be introduced to the following:n Demonstrating an understanding of ration Demonstrating and explaining the meaning of preservation of equality, concretely,
pictorially, and symbolically
BacKground information
In Grade 5, students worked on developing their knowledge of the terms associated with probability, understanding the role chance plays in their lives, and awareness that some events are more probable than others. In Grade 6, students learn to distinguish between theoretical and experimental probability. They will predict possible outcomes of a probability experiment based on theoretical probability, conduct probability experiments, and compare their experimental results with the theoretical probability for an experiment.
When students perform the coin toss experiment, they will learn that no matter how many times they toss a coin, a) there are always two possible outcomes for each toss (i.e., heads and tails)b) the probability of getting heads is 1 out of 2c) the probability of getting tails is 1 out of 2 (The theoretical probability of getting
either outcome in any coin toss is always 1 out of 2, since there are only two sides to a coin and therefore two possible outcomes.)
When students roll, for example, a six-sided die they will learn that no matter how many times they roll a six-sided die of equal size,a) there are always six possible outcomes (i.e., side 1, side 2, side 3, side 4, side 5, and
side 6)

S t a t i s t i c s a n d P r o b a b i l i t y 25
b) the probability of rolling any one of the sides is 1 out of 6 (The theoretical probability of rolling any one of the six sides on any six-sided die of equal size is always 1 out of 6, since there are six sides, an equal opportunity to land on each side, and therefore six possible outcomes.)
When students spin, for example, a spinner with three equal-sized sectors, like “Spinner #1” below, they will learn that no matter how many times they spin that spinner,a) there are always three possible outcomes (i.e., sector 1, sector 2, and sector 3)b) the probability of landing on any one of the three sectors is 1 out of 3 (The
theoretical probability of landing on any one of the three sectors on any spinner with three equal-sized sectors is always 1 out of 3, since there are three equal sectors and three possible outcomes.)
When students spin a spinner with three sectors where the sectors are not all of equal size but for example like “Spinner #2” above (i.e., if sector 1 is a quarter of a circle, sector 2 is also a quarter of a circle, and sector 3 is half of a circle, they will learn that no matter how many times they spin that spinner), a) there are always three possible outcomes (i.e., sector 1, sector 2, and sector 3)b) the probability of landing on sector 1 is 1 out of 4c) the probability of landing on sector 2 is 1 out of 4d) the probability of landing on sector 3 is 2 out of 4
(On this type of a spinner, the theoretical probability of landing on sector 1 and sector 2 is 1 out of 4 each, since sector 1 and sector 2 each occupy a quarter of a circle, but the theoretical probability of landing on sector 3 is 2 out of 4, since sector 3 occupies one-half of a circle, which can also be viewed as two-quarters of a circle.)
� �
�
��
�

G r a d e 6 M a t h e m a t i c s : S u p p o r t D o c u m e n t f o r T e a c h e r s26
When students try to compare their results of a probability experiment (any probability experiment they perform), they will notice that the experimental probability may not necessarily be the same as they may have predicted based on the outcomes of theoretical probability. In fact, “as the number of trials increases, the experimental probability approaches theoretical probability of a particular outcome.” (Manitoba Education and Training 124)
mathematical language
probabilityexperimental probabilitytheoretical probabilitypossible outcomesexperimental resultsaccurate
learning exPeriences
Assessing Prior Knowledge
Organization: Whole class Procedure:1. Tell students that during the following few lessons, the subject of their
discussion and activities will be the topic of probability.2. Ask them to try to remember what they learned in Grade 5 about
chance and uncertainty.3. Place the terms Impossible, Possible, Certain, Less likely, More likely, and
Equally likely on the board. 4. Discuss each term separately. 5. Provide examples of each term orally and write them on the board.6. Tell students to copy the terms and examples (off the board) into their
journals.7. Then tell them to provide their own examples and notes to further
clarify their understanding of each term.

S t a t i s t i c s a n d P r o b a b i l i t y 27
Suggestions for Instruction
Materials: n pennies
Organization: Whole class
Procedure:1. Write on the board “penny.” 2. Discuss with the class the possible outcomes of tossing a penny one time.3. Write it on the board.4. Ask students to write in their notebooks all possible outcomes for tossing a penny a
second time, a third time, a fourth time, and a fifth time.5. Discuss the possible outcomes for each scenario. How does each subsequent toss
compare to the first toss?6. Write on the board the word quarter.
8. Walk around and observe student notes and examples for each term. Check whether the notes reveal their knowledge as to the following questions: a) What is the meaning of each term (Impossible, Possible, Certain, Less
likely, More likely, and Equally likely)? b) What is an example of each term (Impossible, Possible, Certain, Less
likely, More likely, and Equally likely)?
Observation Checklist
Observe students’ responses to determine whether they can do the following:r Define the probability terms learned in Grade 5 (Impossible,
Possible, Certain, Less likely, More likely, and Equally likely).r Provide examples for the probability terms learned in Grade 5
(Impossible, Possible, Certain, Less likely, More likely, and Equally likely).
n List the possible outcomes of a probability experiment, such asn tossing a coinn rolling a die with any number of sidesn spinning a spinner with any number of sectors

G r a d e 6 M a t h e m a t i c s : S u p p o r t D o c u m e n t f o r T e a c h e r s28
7. Have students write in their journals the possible outcomes for tossing a quarter once, twice, and three times. How do these results compare to the results of tossing a penny?
Suggestions for Instruction
Materials: n six-sided die
Organization: Whole class/fours
Procedure:1. Show to the class a large six-sided die.2. Have a class discussion on what the possible outcomes would be for rolling a six-
sided fair die once.3. Tell students to discuss with their group members the possible outcomes for rolling a
six-sided fair die a second time.4. Ask one student to write on the board the replies of his or her group.5. Ask students to discuss their replies compared to the one on the board.6. Ask students why they think they got those particular replies.7. Have students write in their journals the possible outcomes for rolling a six-sided
fair die a third time, and state how these results compare to the results of the first and second roll. Why?
Observation Checklist
Check students’ replies to determine whether they can do the following:r List the two possible outcomes of a coin (heads, tails).r Tell that each coin has the same two possible outcomes (heads,
tails).
n List the possible outcomes of a probability experiment, such asn tossing a coinn rolling a die with any number of sidesn spinning a spinner with any number of sectors

S t a t i s t i c s a n d P r o b a b i l i t y 29
Suggestions for Instruction
Materials: n BLM 6.SP.4.1: Spinner A n BLM 6.SP.4.2: Spinner B n BLM 6.SP.4.3: Spinner C
Organization: Whole class/small groups
Procedure:1. Show on the overhead projector Spinner A. 2. Discuss with the class the possible outcomes of spinning Spinner A once.3. Ask a student to write the outcomes on the board.4. Show on the overhead projector Spinner B. 5. Tell students to write in their notebooks all possible outcomes of spinning Spinner B
once.6. Discuss the possible outcomes. How do these outcomes compare to the outcomes of
Spinner A?7. Show on the overhead projector Spinner C. 8. Tell students to observe carefully Spinner C and discuss in their group the possible
outcomes of this spinner. 9. Tell students to write in their notebooks all possible outcomes of spinning once a
spinner like Spinner C, and state how these results compare to the results of the other two spinners. Why?
Observation Checklist
Check students’ replies to determine whether they can do the following:r List the six possible outcomes of rolling a six-sided fair die (side 1,
side 2, side 3, side 4, side 5, and side 6).r Tell that each roll has the same six possible outcomes (side 1, side
2, side 3, side 4, side 5, and side 6).
n List the possible outcomes of a probability experiment, such asn tossing a coinn rolling a die with any number of sidesn spinning a spinner with any number of sectors
G r a d e 6 M a t h e m a t i c s : S u p p o r t D o c u m e n t f o r T e a c h e r s30
Suggestions for Instruction
Materials: n dime
Organization: Whole class/individual
Procedure:1. Tell students the following:
a) “We have already discussed the possible outcomes of tossing a penny one time, a second time, a third time, a fourth time, and a fifth time, and we concluded that there are two possible outcomes—that is, heads or tails.”
b) “You have also recorded in your journals the possible outcomes of tossing a quarter one time, a second time, a third time, and how those results compared to the results of tossing a penny. Do you remember what we concluded?”
c) Have students recall the conclusion. If need be, remind them that tossing a quarter also yielded two possible outcomes—that is, heads or tails.
2. Then say: “Today, we are going to discuss the theoretical probability of each of those outcomes for a probability experiment.”
3. Discuss with the class the theoretical probability of obtaining “heads” when you toss a dime once.
4. Discuss with the class the theoretical probability of obtaining a “tails” when you toss a dime once.
5. Ask a student to come up to the board and write up the results as discussed.
Observation Checklist
Check students’ replies to determine whether they can do the following:r List the possible outcomes of spinning a spinner with three sectors
(sector 1, sector 2, and sector 3).r List the possible outcomes of spinning a spinner with four sectors
(sector 1, sector 2, sector 3, and sector 4).r Tell that for each spinner the number of sectors determines the
number of possible outcomes.
n Determine the theoretical probability of an outcome occurring for a probability experiment.
S t a t i s t i c s a n d P r o b a b i l i t y 31
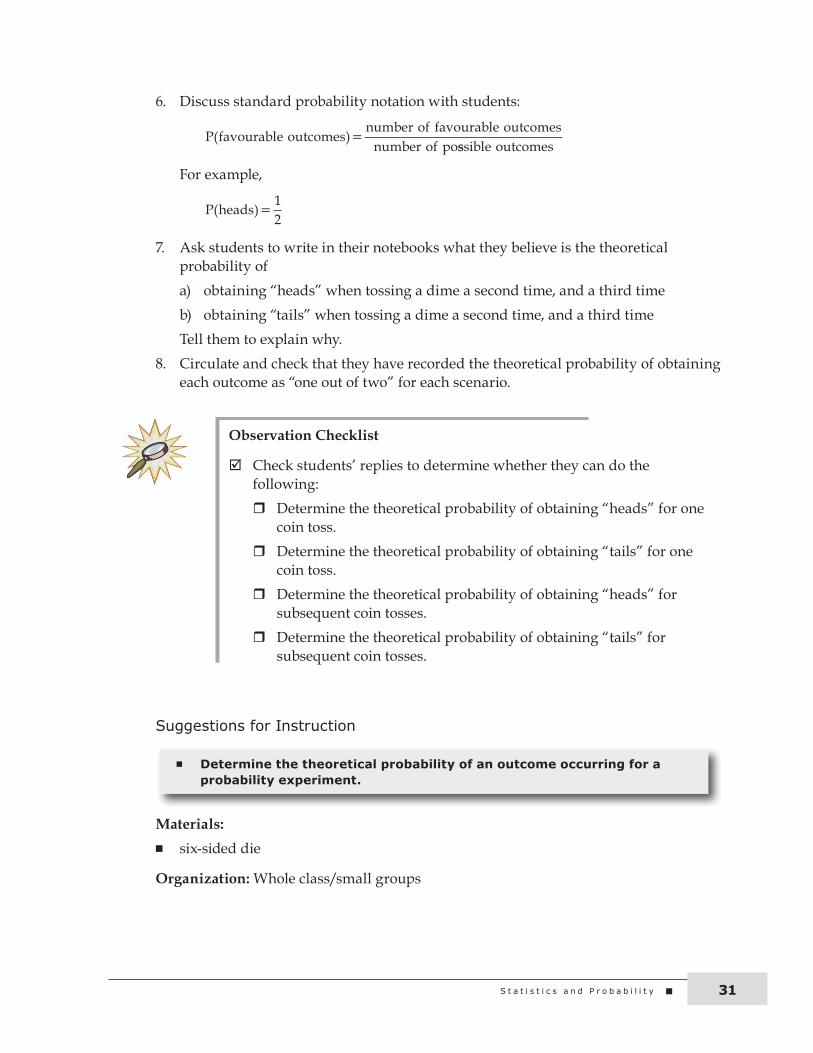
6. Discuss standard probability notation with students:
For example,
7. Ask students to write in their notebooks what they believe is the theoretical probability of a) obtaining “heads” when tossing a dime a second time, and a third timeb) obtaining “tails” when tossing a dime a second time, and a third time
Tell them to explain why. 8. Circulate and check that they have recorded the theoretical probability of obtaining
each outcome as “one out of two” for each scenario.
Suggestions for Instruction
Materials: n six-sided die
Organization: Whole class/small groups
P favourable outcomesnumber of favourable outcomesnumber of po
( )sssible outcomes
P heads( )12
Observation Checklist
Check students’ replies to determine whether they can do the following:r Determine the theoretical probability of obtaining “heads” for one
coin toss.r Determine the theoretical probability of obtaining “tails” for one
coin toss.r Determine the theoretical probability of obtaining “heads” for
subsequent coin tosses.r Determine the theoretical probability of obtaining “tails” for
subsequent coin tosses.
n Determine the theoretical probability of an outcome occurring for a probability experiment.

G r a d e 6 M a t h e m a t i c s : S u p p o r t D o c u m e n t f o r T e a c h e r s32
Procedure:1. Have a class review what the possible outcomes would be for rolling a six-sided fair
die once, and a second time.2. Then say: “Today, we are going to discuss the theoretical probability of each of those
outcomes for a probability experiment.”3. Discuss with the class the theoretical probability of rolling “side 1” when rolling a
six-sided fair die once.4. Tell students to discuss with their group members the theoretical probability of
rolling “side 1” when rolling a six-sided fair die a second time.5. Ask one student from each group to give an oral report of the replies of his or her
group.6. Tell students to discuss with their group members the theoretical probability of
rolling “side 2” when rolling a six-sided fair die a) once b) a second time
7. Ask one student from each group to give an oral report of the replies of his or her group and why they chose those particular replies.
8. Have students write in their journals what they believe is the theoretical probability of rolling “side 3,” “side 4,” “side 5,” and “side 6” when rolling a six-sided fair diea) once b) a second time
9. Have them state why they chose those particular replies.
Observation Checklist
Check students’ replies to determine whether they can do the following:r Determine the theoretical probability of rolling “side 1” for one
single roll when rolling a six-sided fair die once.r Determine the theoretical probability of rolling “side 1” for one
single roll when rolling a six-sided fair die a second time.r Determine the theoretical probability of rolling any one side for
one single roll when rolling a six-sided fair die once.r Determine the theoretical probability of rolling any one side for
one single roll when rolling a six-sided fair die a second time.

S t a t i s t i c s a n d P r o b a b i l i t y 33
Suggestions for Instruction
Materials: n BLM 6.SP.4.1: Spinner An BLM 6.SP.4.2: Spinner B n BLM 6.SP.4.4: Spinner D
Organization: Whole class/pairs
Procedure:1. Review possible outcomes of spinning once a spinner using Spinner A, Spinner B, and
Spinner D as examples.2. Then say: “Today, we are going to discuss the theoretical probability of each of those
outcomes for a probability experiment.”3. Have students express the theoretical probabilities of each of the sectors in
Spinner B.4. Look carefully at Spinner A. What can you observe about the size of the sectors?5. Discuss their observations about the sectors.6. Have a class review of fractions using Spinner A.7. Then discuss as a class the theoretical probability of a spinner like Spinner A
stopping on a) yellowb) redc) blue
8. Have students work in pairs in order to write in their notebooks the theoretical probability of a spinner like Spinner D stopping ona) Sector 1b) Sector 2c) Sector 3 d) Sector 4 e) Sector 5
based on their class discussion.9. Circulate and check that students used the correct fraction for each sector.
n Determine the theoretical probability of an outcome occurring for a probability experiment.

G r a d e 6 M a t h e m a t i c s : S u p p o r t D o c u m e n t f o r T e a c h e r s34
Suggestions for Instruction
Materials: n BLM 6.SP.4.5: Probability Bingon BLM 6.SP.4.1: Spinner A n bingo chipsn coin
Organization: Whole class
Observation Checklist
Check students’ replies to determine whether they can do the following:r Determine the theoretical probability of a spinner like “Spinner D”
stopping onSector 1 Sector 2 Sector 3 Sector 4 Sector 5
r Understand the notion of equivalent fractions, such as one-half equals two-quarters, one-quarter equals two-eighths, and one-third equals two-sixths.
r Reason mathematically in order to determine the theoretical probabilities of sectors of a spinner with uneven sector sizes.
n List the possible outcomes of a probability experiment, such asn tossing a coinn rolling a die with any number of sidesn spinning a spinner with any number of sectors
n Determine the theoretical probability of an outcome occurring for a probability experiment.
n Predict the probability of an outcome occurring for a probability experiment by using theoretical probability.
S t a t i s t i c s a n d P r o b a b i l i t y 35
Procedure:1. Let students know that they will be playing a game called Probability Bingo, and
explain the rules:a) They will be given a blank Probability Bingo sheet in which they will need to fill
in the possible outcomes from tossing a coin, rolling a regular die, and spinning Spinner A. Outcomes may repeat as many times as they wish.
b) Alternate between tossing a coin, rolling the die, and spinning the spinner. c) Each time, call out the result and students will mark one space on their board
(e.g., if they wrote “heads” in three times, they would have to select which one to cover).
d) The first student to get a Bingo (line, X, blackout, etc.) wins.e) Students will need to use their knowledge about probability to fill in the chart to
give them the best chance of winning.2. Play the game.
Suggestions for Instruction
Materials: n penniesn BLM 6.SP.4.6: Record Sheet #1
Organization: Pairs
Procedure:1. Tell students that they will be doing a probability experiment, but first they need to
line up in a single row. 2. Then have the student closest to you call out “one,” the next student call out “two,”
the third student call out “one,” the fourth student call out “two,” and so on, alternating between “one” and “two” until you run out of students.
3. Tell the “ones” to turn around, facing the “twos.” They then shake hands and remember that they are partners.
4. Tell the “ones” to pick up a Record Sheet from your desk and go back to their seats.5. Tell the “twos” to come and get a penny from you and then join their partners.
n Predict the probability of an outcome occurring for a probability experiment by using theoretical probability.
n Conduct a probability experiment, with or without technology, and compare the experimental results to the theoretical probability.
n Explain that as the number of trials in a probability experiment increases, the experimental probability approaches the theoretical probability of a particular outcome.
G r a d e 6 M a t h e m a t i c s : S u p p o r t D o c u m e n t f o r T e a c h e r s36
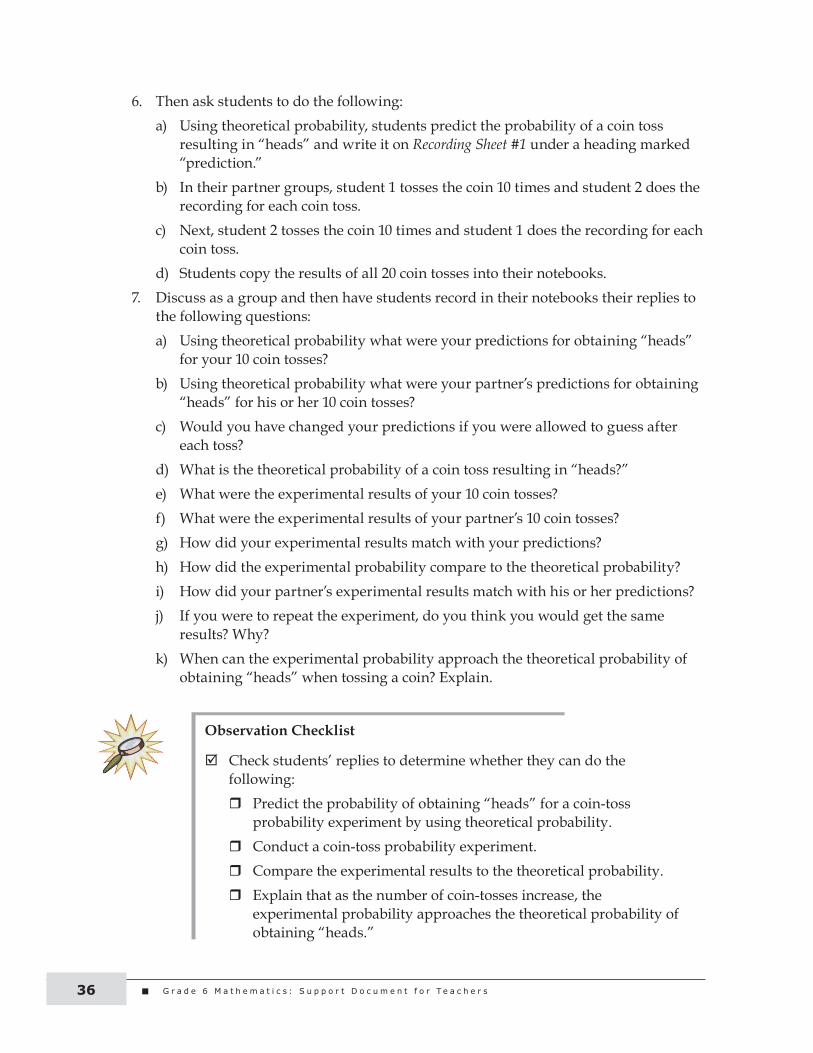
6. Then ask students to do the following:a) Using theoretical probability, students predict the probability of a coin toss
resulting in “heads” and write it on Recording Sheet #1 under a heading marked “prediction.”
b) In their partner groups, student 1 tosses the coin 10 times and student 2 does the recording for each coin toss.
c) Next, student 2 tosses the coin 10 times and student 1 does the recording for each coin toss.
d) Students copy the results of all 20 coin tosses into their notebooks.7. Discuss as a group and then have students record in their notebooks their replies to
the following questions:a) Using theoretical probability what were your predictions for obtaining “heads”
for your 10 coin tosses?b) Using theoretical probability what were your partner’s predictions for obtaining
“heads” for his or her 10 coin tosses?c) Would you have changed your predictions if you were allowed to guess after
each toss?d) What is the theoretical probability of a coin toss resulting in “heads?”e) What were the experimental results of your 10 coin tosses? f) What were the experimental results of your partner’s 10 coin tosses? g) How did your experimental results match with your predictions? h) How did the experimental probability compare to the theoretical probability?i) How did your partner’s experimental results match with his or her predictions? j) If you were to repeat the experiment, do you think you would get the same
results? Why?k) When can the experimental probability approach the theoretical probability of
obtaining “heads” when tossing a coin? Explain.
Observation Checklist
Check students’ replies to determine whether they can do the following:r Predict the probability of obtaining “heads” for a coin-toss
probability experiment by using theoretical probability.r Conduct a coin-toss probability experiment. r Compare the experimental results to the theoretical probability. r Explain that as the number of coin-tosses increase, the
experimental probability approaches the theoretical probability of obtaining “heads.”

S t a t i s t i c s a n d P r o b a b i l i t y 37
Suggestions for Instruction
Materials: n one coin per student (the same type for the whole class—e.g., a penny)
Organization: Class
Procedure:1. Have students determine the theoretical probability for heads and for tails in a toss.2. Have each student
a) toss a coin 10 times b) record results for each toss (heads, tails)c) record the experimental probability for the tosses
3. Compare students’ results by collecting data from all students and charting results by name.
4. Combine all data, chart the results, and record the experimental probability for the class.
5. Ask students to compare their results with the combined class results and write the theoretical probability.
6. Explain the difference between experimental probability and theoretical probability.
n Distinguish between theoretical probability and experimental probability, and explain the differences.
Observation Checklist
Check students’ replies to determine whether they can do the following:r Determine the theoretical probability (in a toss) for:
n Headsn Tails
r Determine the experimental probability based on their experimental results.
r Compare experimental probability to theoretical probability.r Explain the difference between experimental probability and
theoretical probability.
G r a d e 6 M a t h e m a t i c s : S u p p o r t D o c u m e n t f o r T e a c h e r s38
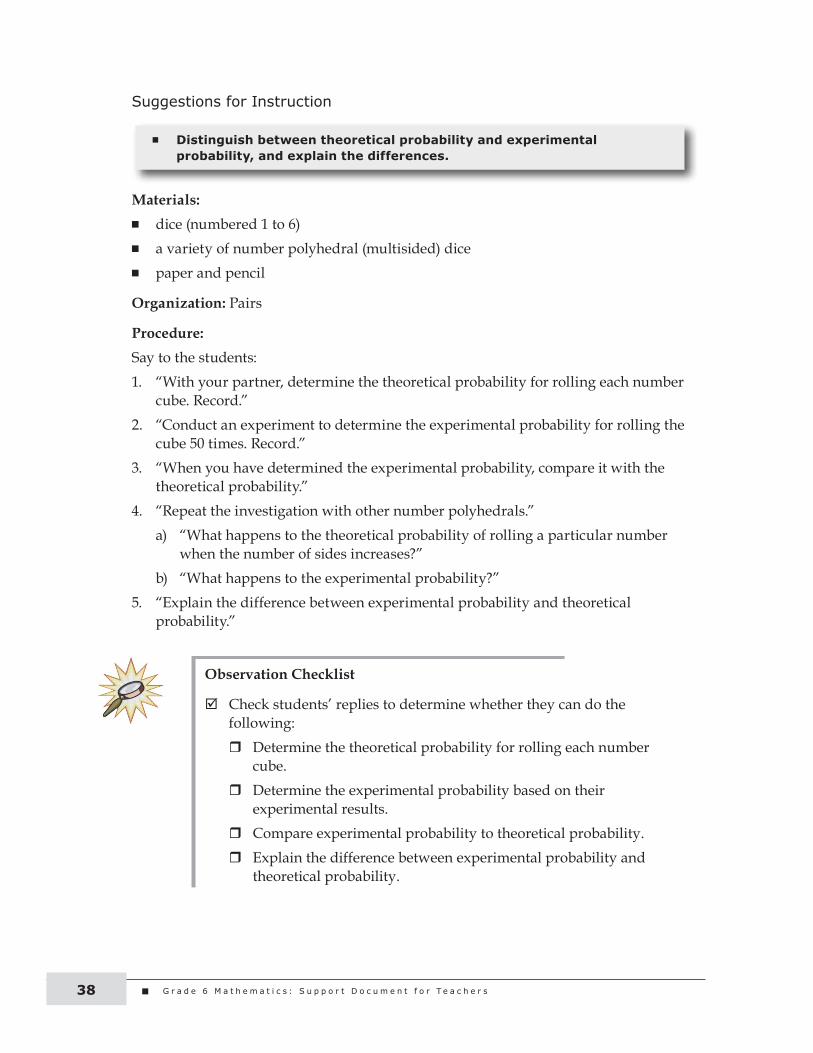
Suggestions for Instruction
Materials: n dice (numbered 1 to 6)n a variety of number polyhedral (multisided) dicen paper and pencil
Organization: Pairs
Procedure:Say to the students:1. “With your partner, determine the theoretical probability for rolling each number
cube. Record.”2. “Conduct an experiment to determine the experimental probability for rolling the
cube 50 times. Record.”3. “When you have determined the experimental probability, compare it with the
theoretical probability.”4. “Repeat the investigation with other number polyhedrals.”
a) “What happens to the theoretical probability of rolling a particular number when the number of sides increases?”
b) “What happens to the experimental probability?”5. “Explain the difference between experimental probability and theoretical
probability.”
n Distinguish between theoretical probability and experimental probability, and explain the differences.
Observation Checklist
Check students’ replies to determine whether they can do the following:r Determine the theoretical probability for rolling each number
cube.r Determine the experimental probability based on their
experimental results.r Compare experimental probability to theoretical probability.r Explain the difference between experimental probability and
theoretical probability.

S t a t i s t i c s a n d P r o b a b i l i t y 39
Suggestions for Instruction
Materials: n six-sided dicen BLM 5–8.5: Number Cardsn BLM 6.SP.4.7: Record Sheet #2
Organization: Six groups
Procedure:1. Make several copies of Number Cards (use the cards numbered from 1 through 6,
inclusive).2. Divide the class into six groups by handing out one numbered card to each student. 3. Then say: “Students holding cards numbered ‘one’ will sit in front of the board (pick
any spot you like). Students holding cards numbered ‘two’ will sit by the window” (and so on, designating a specific spot for each of the six groups).
4. Tell students : a) “Each group will represent one side of a six-sided die.” b) “Look at your cards to tell which side you represent.” (For example, the group of
students holding cards numbered “one” represent “side one” of the six-sided die; the group of students holding cards numbered “two” represent “side two” of the six-sided die, and so on.)
c) “I want each group to predict the probability of the outcome they represent. No two groups will predict the probability of the same outcome.”
d) “More specifically, using theoretical probability, predict the probability of rolling a ‘number representing your side of the six-sided die’ for each of the rolls.”
5. Then point at each group, one at a time, and ask: “Using theoretical probability, your group is predicting the probability of occurring of what outcome?” (Each group will need to state their particular outcome based on the numbered cards you handed to them.)
6. Hand a copy of Record Sheet #2 to each student.7. Say to the class: “Write your predictions on your sheet under a heading marked
‘theoretical probability.’”
n Predict the probability of an outcome occurring for a probability experiment by using theoretical probability.
n Conduct a probability experiment, with or without technology, and compare the experimental results to the theoretical probability.
n Explain that as the number of trials in a probability experiment increases, the experimental probability approaches theoretical probability of a particular outcome.

G r a d e 6 M a t h e m a t i c s : S u p p o r t D o c u m e n t f o r T e a c h e r s40
8. Circulate to check that students write the correct prediction of an outcome occurring. 9. Then say: “Now you are going to do a probability experiment using a six-sided die.”
Each group will toss the die 10 times. One person will do the recording.10. Give each group a six-sided die.11. Ask one student from each group to copy the results from each Record Sheet onto
one large sheet of paper and post it on the board. 12. Ask another student to give an oral report of the replies of his or her group,
comparing their group’s results to the class’s results.13. Discuss as a group first and then have students record in their notebooks the replies
to the following questions:a) What were the experimental results of your 10 rolls for each possible outcome? b) What were the experimental results of the class’s 10 rolls for each possible
outcome? c) How did your experimental results match with your predictions of the
theoretical outcomes? d) How did the class’s experimental results match with your predictions of the
theoretical outcomes? e) If you were to repeat the experiment, do you think you would get the same
results? Why?f) When can the experimental probability approach the theoretical probability of
obtaining a “your particular outcome” when rolling a six-sided fair die? Explain.
Observation Checklist
Check students’ replies to determine whether they can do the following:r By using theoretical probability, predict the probability of rolling
a “particular side” for one single roll when you roll a six-sided fair die once.
r For a probability experiment, predict the probability of rolling a “particular side” for each single roll when you roll a six-sided fair die 10 times.
r Conduct a “six-sided fair die” roll probability experiment. r Compare the experimental results to the theoretical probability. r Explain that as the number of rolls increase, the experimental
probability approaches the theoretical probability of obtaining a particular outcome.
S t a t i s t i c s a n d P r o b a b i l i t y 41
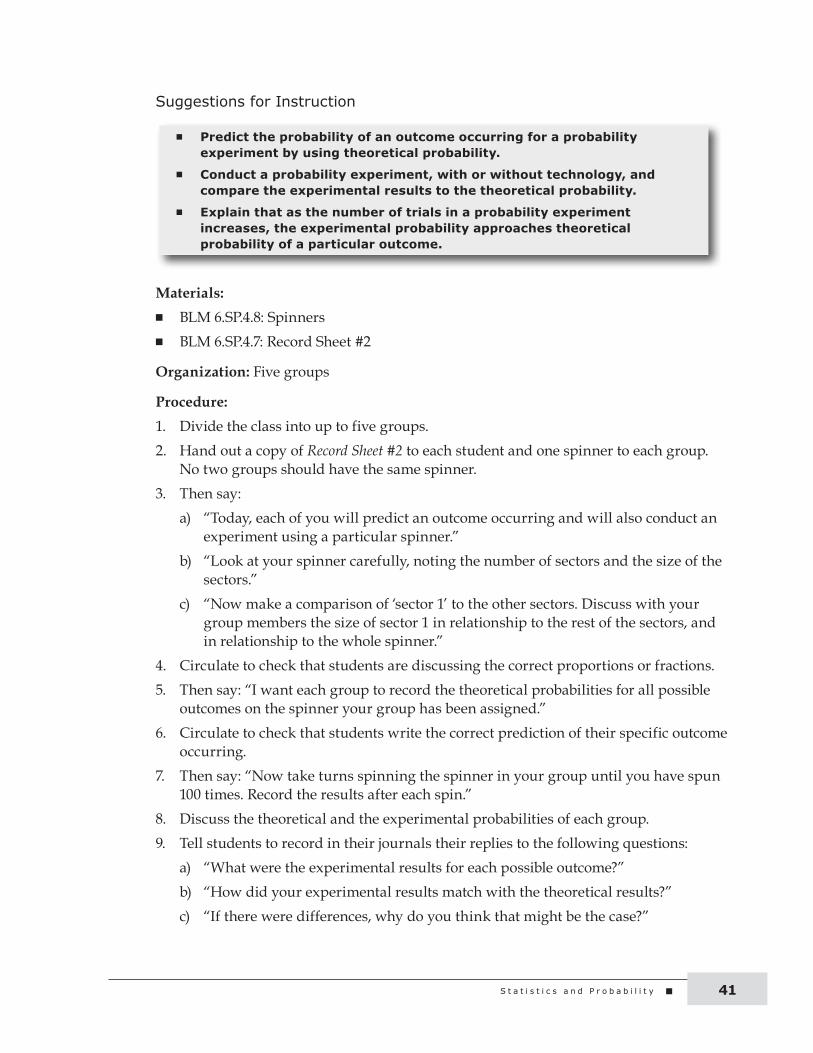
Suggestions for Instruction
Materials: n BLM 6.SP.4.8: Spinners n BLM 6.SP.4.7: Record Sheet #2
Organization: Five groups
Procedure:1. Divide the class into up to five groups.2. Hand out a copy of Record Sheet #2 to each student and one spinner to each group.
No two groups should have the same spinner.3. Then say:
a) “Today, each of you will predict an outcome occurring and will also conduct an experiment using a particular spinner.”
b) “Look at your spinner carefully, noting the number of sectors and the size of the sectors.”
c) “Now make a comparison of ‘sector 1’ to the other sectors. Discuss with your group members the size of sector 1 in relationship to the rest of the sectors, and in relationship to the whole spinner.”
4. Circulate to check that students are discussing the correct proportions or fractions.5. Then say: “I want each group to record the theoretical probabilities for all possible
outcomes on the spinner your group has been assigned.” 6. Circulate to check that students write the correct prediction of their specific outcome
occurring. 7. Then say: “Now take turns spinning the spinner in your group until you have spun
100 times. Record the results after each spin.”8. Discuss the theoretical and the experimental probabilities of each group.9. Tell students to record in their journals their replies to the following questions:
a) “What were the experimental results for each possible outcome?” b) “How did your experimental results match with the theoretical results?”c) “If there were differences, why do you think that might be the case?”
n Predict the probability of an outcome occurring for a probability experiment by using theoretical probability.
n Conduct a probability experiment, with or without technology, and compare the experimental results to the theoretical probability.
n Explain that as the number of trials in a probability experiment increases, the experimental probability approaches theoretical probability of a particular outcome.
G r a d e 6 M a t h e m a t i c s : S u p p o r t D o c u m e n t f o r T e a c h e r s42
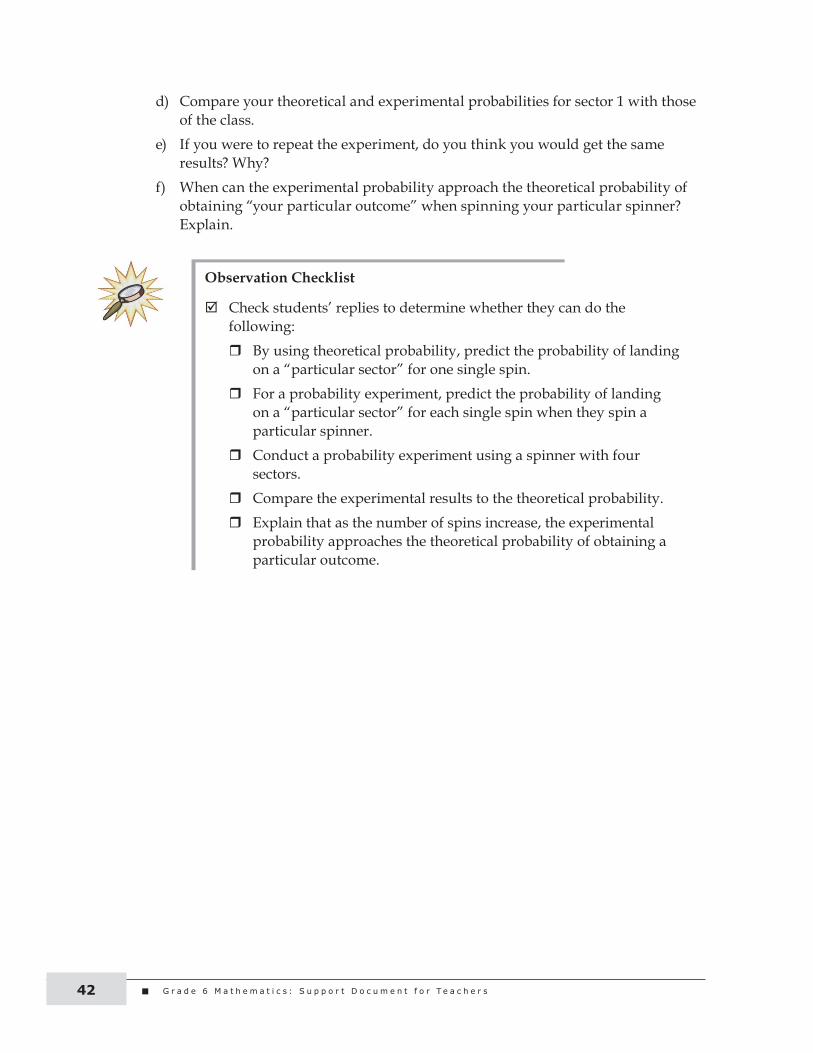
d) Compare your theoretical and experimental probabilities for sector 1 with those of the class.
e) If you were to repeat the experiment, do you think you would get the same results? Why?
f) When can the experimental probability approach the theoretical probability of obtaining “your particular outcome” when spinning your particular spinner? Explain.
Observation Checklist
Check students’ replies to determine whether they can do the following:r By using theoretical probability, predict the probability of landing
on a “particular sector” for one single spin.r For a probability experiment, predict the probability of landing
on a “particular sector” for each single spin when they spin a particular spinner.
r Conduct a probability experiment using a spinner with four sectors.
r Compare the experimental results to the theoretical probability. r Explain that as the number of spins increase, the experimental
probability approaches the theoretical probability of obtaining a particular outcome.
S t a t i s t i c s a n d P r o b a b i l i t y 43
Putting the Pieces together
How Predictable Are They?
Purpose: The purpose of this activity is for students to do the following:n Demonstrate their understanding of the difference between experimental and
theoretical probability by completing and analyzing a statistical experiment.n Show that they can collect data by observation. n Show that they can use data to determine the experimental probability of an event
happening in the future.
This activity is designed to also show that students can do the following: n Demonstrate an understanding of fractions. n Demonstrate an understanding of ratio.
Curricular Links: English language arts
Materials/Resources:n paper and penciln large poster paper
Organization: Groups of three to five students
Inquiry: Scenario Have students work in small groups discussing who or what person or animal they
will observe, and what they will observe about that person or animal. Each student may choose a person or a pet. They may not choose to observe a student who is a member of their own group.
Procedure1. Tell students that each of them needs to choose one person or a pet to observe for
five days.2. The person can be another student or a family member whom they see every day.
The person cannot be a member of their group.3. Tell students to discuss what they might be observing for their data collection. Examples:
a) When does a person arrive at school?b) When does a person arrive at home?c) When does a person go for a walk?d) When does a person smile?
G r a d e 6 M a t h e m a t i c s : S u p p o r t D o c u m e n t f o r T e a c h e r s44
e) When does a cat meow or a dog bark?f) At what time does your pet rub against you?
4. Let students choose the five behaviours that they think provide the best data for their observations.
5. Write their observations daily in their journals.6. State the theoretical probability for the observations.7. At the end of the five days, record all data on a large sheet of paper. 8. Analyze the data and record the experimental probability.9. Make predictions based on the experimental probability.
10. Choose and create a graph that best fits your data.11. Make a presentation to the other group members.
Literature Link For collecting data and predictions on temperature, wind, and pressure, students can
check The Weather Network at <www.theweathernetwork.com> (they can choose the city for which they collect data).
Assessment: Use the following checklist to assess students’ replies to determine whether they can
do the following:q Use fractions.q Make observations.q Make predictions based on the experimental probability.q Choose which graph best fits the data.q Compare experimental probability to theoretical probability.

S t a t i s t i c s a n d P r o b a b i l i t y 45
Use the following observation checklist to assess student learning:
The student can do the following: Yes No Comment
Make good choices for observations.
Record daily observations.
Record observations in detail.
Express theoretical probability as a fraction.Express experimental probability as a fraction.Make predictions based on experimental probability.
Choose a graph that best fits data.
Create a graph that best fits data.
Compare experimental probability to theoretical probability.
Extension: Taking it further Read to the class the book Same Old Horse by Stuart J. Murphy and illustrated by
Steve Bjorkman. Ask students the following:
n “Jazz and Majesty said that Hankie was predictable. Can you predict when Hankie will sneeze next? Why?”
n “What other predictions can you make about Hankie?”n “What is the theoretical probability that Hankie will wear a red saddle on week
11?”n “What is the experimental probability that Hankie will wear a red saddle on
week 11?”n “Write your own story using your knowledge of statistics and probability.”

G r a d e 6 M a t h e m a t i c s : S u p p o r t D o c u m e n t f o r T e a c h e r s46
N o t e s