Grade 5 supplement - The Math Learning Center€¦ · · 2017-08-07Grade 5 supplement set e2 Data...
14
Grade 5 supplement set e2 Data Anlaysis: Fundamental Counting Principle Includes Activity 1: Counting the Possible Outcomes A1.1 Independent Worksheet 1: Charlie’s Marbles A1.9 Independent Worksheet 2: Rachel’s Outfits A1.11 skill s & Concepts H use the fundamental counting principle on sets with up to 4 items to determine the number of possible combinations H determine the probability of events occurring in familiar contexts or experiments, and express probability as fractions from zero to one P0809
Transcript of Grade 5 supplement - The Math Learning Center€¦ · · 2017-08-07Grade 5 supplement set e2 Data...

Grade 5 supplementset e2 Data Anlaysis: Fundamental Counting Principle
IncludesActivity 1: Counting the Possible Outcomes A1.1
Independent Worksheet 1: Charlie’s Marbles A1.9
Independent Worksheet 2: Rachel’s Outfits A1.11
skills & ConceptsH use the fundamental counting principle on sets with up to 4 items to determine the
number of possible combinations
H determine the probability of events occurring in familiar contexts or experiments, and
express probability as fractions from zero to one
P0809

Bridges in mathematics Grade 5 supplement
set e2 Data Analysis: Fundamental Counting Principle
The Math Learning Center, PO Box 12929, Salem, Oregon 97309. Tel. 1 800 575–8130.
© 2009 by The Math Learning Center
All rights reserved.
Prepared for publication on Macintosh Desktop Publishing system.
Printed in the United States of America.
P0809
The Math Learning Center grants permission to classroom teachers to reproduce blackline
masters in appropriate quantities for their classroom use.
Bridges in Mathematics is a standards-based K–5 curriculum that provides a unique blend
of concept development and skills practice in the context of problem solving. It incorpo-
rates the Number Corner, a collection of daily skill-building activities for students.
The Math Learning Center is a nonprofit organization serving the education community.
Our mission is to inspire and enable individuals to discover and develop their mathematical
confidence and ability. We offer innovative and standards-based professional development,
curriculum, materials, and resources to support learning and teaching. To find out more,
visit us at www.mathlearningcenter.org.

set e2 data analysis: Fundamental Counting principle
Bridges in Mathematics Grade 5 Supplement • e2.1© The Math Learning Center
set e2 H Activity 1
Activity
Counting the possible Outcomes
OverviewIn this activity, students use charts and tree diagrams to
show the possible outcomes of probability experiments.
The teacher then guides the class to understand and
apply the fundamental counting principle, which states
that the total number of outcomes is equal to the number
of possibilities in a set of choices multiplied by the
number of possibilities in each other set of choices.
skills & ConceptsH use the fundamental counting principle on sets with
up to 4 items to determine the number of possible
combinations
H determine the probability of events occurring in famil-
iar contexts or experiments, and express probability
as fractions from zero to one
You’ll needH Counting the Possible Outcomes (pages E2.6–E2.7, run
1 copy of each sheet on a transparency)
H Amber’s Experiment (page E2.8, run a class set)
H Student Math Journals
H a piece of paper to mask portions of the overhead
H a paper lunch sack
H 4 tile, one each in green, red, yellow, and blue
H a penny
Instructions for Counting the possible Outcomes1. Ask students to get out their math journals and let them know that you are going to investigate some more probability experiments today. Then show just the top section of Counting the Possible Outcomes, page 1, at the overhead.
Set E2 Data Analysis: Fundamental Counting Principle Blackline Run 1 copy on a transparency.
Counting the Possible Outcomes page 1 of 2
Rafael put 4 tile in a bag, one green, one red, one yellow, and one blue. Then he shook the bag to mix the tile.
If he fl ips a penny and pulls 1 tile out of the bag without looking, what is the probability that the penny will land on heads and the tile he pulls out will be green?
What do you have to do to fi nd out?
To determine probability, you need to know all the different things that can hap-pen. A list of all the possible outcomes is called a sample space.
You can make a sample space for a probability experiment by thinking of all the possibilities and writing them down. Here are two other methods:
1 Make a chart.
Green Red Yellow Blue
Heads
Tails
2. Read the text with the class. Model the experimental set-up by placing 4 tile, one in each color, into a paper lunch sack. Close the sack and shake it to mix the tile. Show students the penny and repeat the question: what is the probability that if you flip the penny and pull 1 tile from the sack without looking, the penny will come up heads and you will get a green tile? Ask them to think about this question pri-vately and write a response in their journals that includes both an answer and an explanation.
3. After a few minutes, have students pair-share their responses. Then ask volunteers to share their thinking with the class.
set e2 data analysis: Fundamental Counting principle
© The Math Learning Centere2.2 • Bridges in Mathematics Grade 5 Supplement
Students I said the probability of getting heads and green is unlikely because it seems like there are a lot of things that can happen, like you could get heads and red, or tails and blue. I said he has a 1 out of 6 chance of getting heads and green because the penny has 2 sides and there are 4 different colors of tile in the bag. Two plus four is 6. I said maybe 8 because you can get heads with 4 different colors or tails with 4 different colors.
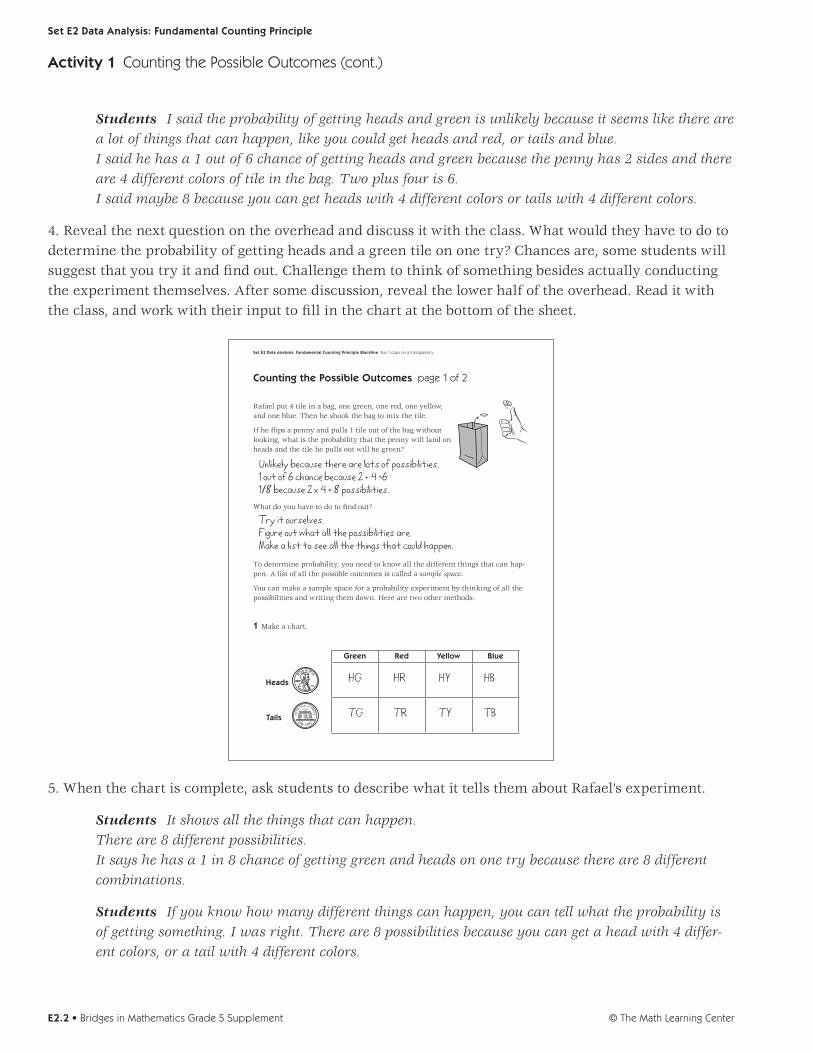
4. Reveal the next question on the overhead and discuss it with the class. What would they have to do to determine the probability of getting heads and a green tile on one try? Chances are, some students will suggest that you try it and find out. Challenge them to think of something besides actually conducting the experiment themselves. After some discussion, reveal the lower half of the overhead. Read it with the class, and work with their input to fill in the chart at the bottom of the sheet.
Set E2 Data Analysis: Fundamental Counting Principle Blackline Run 1 copy on a transparency.
Counting the Possible Outcomes page 1 of 2
Rafael put 4 tile in a bag, one green, one red, one yellow, and one blue. Then he shook the bag to mix the tile.
If he fl ips a penny and pulls 1 tile out of the bag without looking, what is the probability that the penny will land on heads and the tile he pulls out will be green?
What do you have to do to fi nd out?
To determine probability, you need to know all the different things that can hap-pen. A list of all the possible outcomes is called a sample space.
You can make a sample space for a probability experiment by thinking of all the possibilities and writing them down. Here are two other methods:
1 Make a chart.
Green Red Yellow Blue
Heads
Tails
Unlikely because there are lots of possibilities.1 out of 6 chance because 2 + 4 =61/8 because 2 x 4 = 8 possibilities.
Try it ourselves.Figure out what all the possibilities are.Make a list to see all the things that could happen.
HG HR HY HB
TG TR TY TB
5. When the chart is complete, ask students to describe what it tells them about Rafael’s experiment.
Students It shows all the things that can happen. There are 8 different possibilities. It says he has a 1 in 8 chance of getting green and heads on one try because there are 8 different combinations.
Students If you know how many different things can happen, you can tell what the probability is of getting something. I was right. There are 8 possibilities because you can get a head with 4 differ-ent colors, or a tail with 4 different colors.
activity 1 Counting the Possible Outcomes (cont.)

set e2 data analysis: Fundamental Counting principle
Bridges in Mathematics Grade 5 Supplement • e2.3© The Math Learning Center
activity 1 Counting the Possible Outcomes (cont.)
Teacher How would you express the probability as a fraction?
Ramani There are 8 possibilities, so getting heads and green is 1 out of 8. That’s 1/8.
6. Now show the top section of the second overhead. Explain that people sometimes use a tree diagram to create a sample space, or a list of all the possibilities. Give students a few moments to examine the diagram quietly. Work with their input to complete the diagram. Then reveal and discuss the question at the bottom of the sheet.
Set E2 Data Analysis: Fundamental Counting Principle Blackline Run 1 copy on a transparency.
Counting the Possible Outcomes page 2 of 2
2 Make a tree diagram.
Tile Color
Green
Blue
Yellow
Red
Green
Blue
Yellow
Red
OutcomesCoin Face
heads
tails
Heads & Green
Tails & Green
3 If Rafael fl ips a penny and pulls 1 tile out of the bag without looking, what is the probability that the penny will land on tails and the tile he pulls out will be blue? How do you know?
Heads & BlueHeads & YellowHeads & Red
Tails & BlueTails & YellowTails & Red
7. Give students each a copy of Amber’s Experiment. Read the first question together and give students a few minutes to record their responses privately. Then ask them to pair-share, and have a few volunteers share and explain their predictions to the class.

set e2 data analysis: Fundamental Counting principle
© The Math Learning Centere2.4 • Bridges in Mathematics Grade 5 Supplement
NAME DATE
Set E2 Data Analysis: Fundamental Counting Principle Blackline Run a class set.
Amber’s Experiment
1 Amber is going to fl ip a penny and roll a die at the same time. The die has the numbers 1, 2, 3, 4, 5, and 6 on it. What is the probability that the penny will land on heads and the die will land on 4? Write your prediction here and explain your thinking.
264
2 You are going to make 2 kinds of sample spaces for this experiment. Remem-ber, a sample space is a list of all the possible outcomes.
a Think before you start. What are the possible outcomes for the penny fl ip?
b What are the possible outcomes for the die roll?
c Complete the chart below to show all the possible outcomes of Amber’s experi-ment.
Number Rolled
Heads H2
2 5
Tails
T5
d On the back of this sheet, make a tree diagram to show all the possible out-comes of Amber’s experiment.
3 How many possible outcomes are there in this experiment? ______________
4 What is the probability that the penny will land on heads and the die will land on 4? Express your answer as a fraction.
8. Review the rest of the tasks on the sheet together. When students understand what to do, give them most of the remaining time to complete the work. Leave Counting the Possible Outcomes, page 2 on display at the overhead so students can see an example of a tree diagram. Circulate as they are working and give assistance as needed.
9. Toward the end of the period, or at the start of the next, reconvene the class to discuss the work they have completed. Here are some questions to pose: • HowmanypossibleoutcomesdidyoufindforAmber’sexperiment?(12)• Whatistheprobabilitythatshewillgetheadsonthepennyanda4onthedieinonetry?(1/12)• Whatistheprobabilitythatshewillgettailsonthepennyanda5onthedieinonetry?(1/12)• Whatistheprobabilitythatshewillgetheadsonthepennyandanevennumberonthedie?(3/12)• Whichdoyouthinkiseasierandmoreeffectiveasasamplespace,thechartorthetreediagram?
Why?• Isthereaneasierwaytodeterminethenumberofpossibleoutcomesthanmakingalist,achart,ora
treediagram?(Yes.Youcanmultiplythenumberofpossibleoutcomesforthepennybythenumberof possible outcomes for the die. That is 2 x 6, or 12 possible outcomes. Chances are, some of your stu-dentswillhavenoticedthisontheirown.Ifnot,callittotheirattention.)
10. After you have discussed the last question with the class, explain that mathematicians have devel-oped a generalization called the fundamental counting principle. This principle tells us that the total number of outcomes is equal to the number of possibilities in a set of choices multiplied by the number of possibilities in each other set of choices. Then place the first overhead back on display. Does the prin-ciple work to tell how many outcomes there are for Rafael’s experiment?
activity 1 Counting the Possible Outcomes (cont.)

set e2 data analysis: Fundamental Counting principle
Bridges in Mathematics Grade 5 Supplement • e2.5© The Math Learning Center
activity 1 Counting the Possible Outcomes (cont.)
Students Yep! There are 2 ways the penny can land and 4 different colors. 2 x 4 = 8. You can see it on the chart, but just multiplying is way easier than making a chart.
11. Ask students to think about the fundamental counting principle in relation to the Odd Coin Game. Can they use the counting principle to predict how many different outcomes there are for flipping 3 coins at the same time?
Students There are 2 possibilities for each penny. You can get heads or tails. So that’s 2 outcomes for the first penny, 2 for the second, and 2 for the third. It would be 2 x 2 x 2 = 8. That’s right! There were 8 different combinations, remember?
independent Worksheet
UseSetE2IndependentWorksheets1and2toprovidestudentswithmorepracticecreatingsamplespaces and applying the fundamental counting principle.

© The Math Learning Centere2.6 • Bridges in Mathematics Grade 5 Supplement
set e2 data analysis: Fundamental Counting principle Blackline Run 1 copy on a transparency.
Counting the possible Outcomes page 1 of 2
Rafael put 4 tile in a bag, one green, one red, one yellow, and one blue. Then he shook the bag to mix the tile.
Ifheflipsapennyandpulls1tileoutofthebagwithoutlooking, what is the probability that the penny will land on heads and the tile he pulls out will be green?
What do you have to do to find out?
To determine probability, you need to know all the different things that can hap-pen. A list of all the possible outcomes is called a sample space.
Youcanmakeasamplespaceforaprobabilityexperimentbythinkingofallthepossibilities and writing them down. Here are two other methods:
1 Make a chart.
Green red Yellow Blue
Heads
tails

Bridges in Mathematics Grade 5 Supplement • e2.7© The Math Learning Center
set e2 data analysis: Fundamental Counting principle Blackline Run 1 copy on a transparency.
Counting the possible Outcomes page 2 of 2
2 Make a tree diagram.
Tile Color
Green
Blue
Yellow
Red
Green
Blue
Yellow
Red
OutcomesCoin Face
heads
tails
Heads & Green
Tails & Green
3IfRafaelflipsapennyandpulls1tileoutofthebagwithoutlooking,whatisthe probability that the penny will land on tails and the tile he pulls out will be blue? How do you know?

© The Math Learning Centere2.8 • Bridges in Mathematics Grade 5 Supplement
name date
set e2 data analysis: Fundamental Counting principle Blackline Run a class set.
amber’s experiment
1 Amber is going to flip a penny and roll a die at the same time. The die has the numbers 1, 2, 3, 4, 5, and 6 on it. What is the probability that the penny will land on heads and the die will land on 4? Write your prediction here and explain your thinking.
264
2Youaregoingtomake2kindsofsamplespacesforthisexperiment.Remem-ber, a sample space is a list of all the possible outcomes.
a Think before you start. What are the possible outcomes for the penny flip?
b What are the possible outcomes for the die roll?
c Complete the chart below to show all the possible outcomes of Amber’s experi-ment.
number rolled 2 5
Heads H2
tails
T5
d On the back of this sheet, make a tree diagram to show all the possible out-comes of Amber’s experiment.
3 How many possible outcomes are there in this experiment? ______________
4 What is the probability that the penny will land on heads and the die will land on 4? Express your answer as a fraction.

Bridges in Mathematics Grade 5 Supplement • e2.9© The Math Learning Center
name date
set e2 data analysis: Fundamental Counting principle Blackline Run a class set.
set e2 H Independent Worksheet 1
independent Worksheet
Charlie’s marbles
Charlie put 4 marbles in a bag. One of the marbles was green, one was yellow, one was blue, and one was red. He shook the bag to mix up the marbles.
Then he put 4 more marbles in another bag. One of the marbles was green, one was yellow, one was blue, and one was red. He shook the bag to mix up the marbles.
Whenthebagswereready,Charliesaidtohisfriend,Sara,“Iamgoingtopullamarble out of both bags at the same time without looking. What are my chances of getting a red marble out of the first bag and a blue marble out of the second bag?”
Sarasaid,“Ithinkyourchancesofgettingaredmarbleoutofthefirstbagandablue marble out of the second bag are 1 in 16.”
1 Do you agree with Sara? Why or why not?
2 Complete the chart below to show all the possible combinations Charlie could get.
Marbles in Bag 2
Mar
ble
s in
Bag
1
Green Yellow Blue red
Green GG
Yellow YB
Blue
red RY
(Continuedonnextpage.)

© The Math Learning Centere2.10 • Bridges in Mathematics Grade 5 Supplement
set e2 data analysis: Fundamental Counting principle Blackline Run a class set.
Independent Worksheet 1 Charlie’s Marbles (cont.)
3 Complete the tree diagram below to show all the possible combinations Charlie could get.
Marbles in Bag 2
Green
Yellow
Blue
Red
OutcomesMarbles in Bag 1
Green
Yellow
G & G
G & Y
G & B
G & R
Blue
Red
4 What are Charlie’s chances of getting a red marble out of the first bag and a blue marble out of the second bag if he pulls one marble out of each bag without looking?
chAllenge
5 What are Charlie’s chances of getting two marbles the same color if he pulls one marble out of each bag without looking? Explain your answer.

Bridges in Mathematics Grade 5 Supplement • e2.11© The Math Learning Center
name date
set e2 data analysis: Fundamental Counting principle Blackline Run a class set.
set e2 H Independent Worksheet 2
independent Worksheet
rachel’s Outfits
Rachel just got 4 new t-shirts and 3 pairs of pants for summer vacation. One of her new t-shirts is pink. Another is purple. Another is yellow, and the fourth one is turquoise. She got a purple pair of pants, a white pair of pants, and a turquoise pair of pants.
1 How many different outfits do you think Rachel will be able to make with her new shirts and pants? Explain your prediction.
2 The fundamental counting principle says you can multiply the number of shirts by the number of pants to figure out how many different outfits Rachel can make. Try it here.
____ shirts × ____ pairs of pants = ____ different outfits
3 Make a chart or a tree diagram below to show how many outfits Rachel can make. Use a separate piece of paper if you do not have enough room.
4Isthereanyadvantagetomakingachartortreediagraminsteadofusingthefundamental counting principle? Explain your answer.

© The Math Learning Centere2.12 • Bridges in Mathematics Grade 5 Supplement