Grade 3 Unit 3: Measurement & Data (3 Weeks) · Grade 3 Unit 3: Measurement & Data (3 Weeks) ......
15
Grade 3 Unit 3: Measurement & Data (3 Weeks) Stage 1 – Desired Results Established Goals Unit Description Common Core Learning Standards Solve problems involving measurement and estimation of intervals of time, liquid volumes, and masses of objects. 3.MD.1. Tell and write time to the nearest minute and measure time intervals in minutes. Solve word problems involving addition and subtraction of time intervals in minutes, e.g., by representing the problem on a number line diagram. 3.MD.2. Measure and estimate liquid volumes and masses of objects using standard units of grams (g), kilograms (kg), and liters (l). 1 Add, subtract, multiply, or divide to solve one-step word problems involving masses or volumes that are given in the same units, e.g., by using drawings (such as a beaker with a measurement scale) to represent the problem. 2 Represent and interpret data. 3.MD.3. Draw a scaled picture graph and a scaled bar graph to represent a data set with several categories. Solve one- and two-step “how many more” and “how many less” problems using information presented in scaled bar graphs. For example, draw a bar graph in which each square in the bar graph might represent 5 pets. Common Core Standards of Mathematical Practice 1. Make sense of problems and persevere in solving them. 2. Reason abstractly and quantitatively. 3. Construct viable arguments and critique the reasoning of others. 4. Model with mathematics. 5. Use appropriate tools strategically. 6. Attend to precision. 7. Look for and make use of structure. 8. Look for and express regularity in repeated reasoning. Big Ideas 1. Operations Meanings & Relationships: The same sentence (e.g. 12-4=8) can be associated with different concrete or real-world situations, AND different number sentences can be associated with the same concrete or real-world situation. 2. Measurement: Some attributes of objects are measurable and can be quantified using unit amounts. 3. Some questions can be answered by collecting and analyzing data, and the question to be answered determines the data that needs to be collected and how best to collect it. Data can be Essential Questions 1. How can we use addition and subtraction to solve real-world problems involving joining, separating, part-part-whole, or comparison? 1. How can use multiplication and division to solve real-world problems involving joining equal groups, separating equal groups, separating equal groups, comparison, or combinations? 2. How do we use the attributes of an object to measure and compare? 2. How do we select and appropriate sample for describing and making predictions about population? 3. How do we determine the appropriate graph to use for our data
Transcript of Grade 3 Unit 3: Measurement & Data (3 Weeks) · Grade 3 Unit 3: Measurement & Data (3 Weeks) ......
Grade 3 Unit 3: Measurement & Data (3 Weeks)
Stage 1 – Desired Results
Established Goals Unit Description Common Core Learning Standards Solve problems involving measurement and estimation of intervals of time, liquid volumes, and masses of objects.
3.MD.1. Tell and write time to the nearest minute and measure time intervals in minutes. Solve word problems involving
addition and subtraction of time intervals in minutes, e.g., by representing the problem on a number line diagram.
3.MD.2. Measure and estimate liquid volumes and masses of objects using standard units of grams (g), kilograms (kg), and
liters (l).1 Add, subtract, multiply, or divide to solve one-step word problems involving masses or volumes that are given in
the same units, e.g., by using drawings (such as a beaker with a measurement scale) to represent the problem.2
Represent and interpret data.
3.MD.3. Draw a scaled picture graph and a scaled bar graph to represent a data set with several categories. Solve one- and two-step “how many more” and “how many less” problems using information presented in scaled bar graphs. For example, draw a bar graph in which each square in the bar graph might represent 5 pets.
Common Core Standards of Mathematical Practice
1. Make sense of problems and persevere in solving them. 2. Reason abstractly and quantitatively. 3. Construct viable arguments and critique the reasoning of others. 4. Model with mathematics. 5. Use appropriate tools strategically. 6. Attend to precision. 7. Look for and make use of structure. 8. Look for and express regularity in repeated reasoning.
Big Ideas 1. Operations Meanings & Relationships: The same
sentence (e.g. 12-4=8) can be associated with different concrete or real-world situations, AND different number sentences can be associated with the same concrete or real-world situation.
2. Measurement: Some attributes of objects are measurable and can be quantified using unit amounts.
3. Some questions can be answered by collecting and analyzing data, and the question to be answered determines the data that needs to be collected and how best to collect it. Data can be
Essential Questions 1. How can we use addition and subtraction to solve
real-world problems involving joining, separating,
part-part-whole, or comparison?
1. How can use multiplication and division to solve
real-world problems involving joining equal
groups, separating equal groups, separating equal
groups, comparison, or combinations?
2. How do we use the attributes of an object to
measure and compare?
2. How do we select and appropriate sample for describing and making predictions about population?
3. How do we determine the appropriate graph to
use for our data

represented visually using tables, charts and graphs.
3. How do we determine the appropriate scale sop
that patterns can be observed in data?
Content (Students will know….) A. Clocks display time in hours and minutes (3MD1)
B. Clock models and number lines can be used to
solve elapsed time problems (3MD1)
C. Volumes and masses of objects with standard units: grams, kilograms and liters (3MD2)
D. Unit relationships (3MD2)
E. Picture graph and bar graph (3MD3)
Skills (Students will be able to…) A1. Tell and write time to nearest minute B1. Measure time intervals in minutes B1. Solve world problems involving addition and subtraction. B1. Use number lines with pre-determined intervals to solve elapsed time problems. B1. Use open number lines to determine time intervals to solve elapsed time problems. C1. Reason about the units of mass and volume using units C2. Understand the size and weight of a liter, gram, and kilogram C3. Measure attributes of objects D1. Add, subtract, multiply and divide to solve one-step word problems involving masses or volumes D2. Subdivide larger units into smaller units (partition) D3. Repeat the same unit to determine the measure (iteration) D4. The number of units depends on the size of the unit (compensation) E1. Read scaled picture graphs and bar graphs E2. Draw scaled picture graphs and bar graphs E3. Pose a question, collect date, analyze data and interpret data in a scaled picture graph and bar graph E3. Solve one and two step “how many more” and “how many less” problems using information presented in a picture graph or bar graph E4. Determine the number of units a symbol represents in a picture graph E5. Determine an appropriate scale and create a scaled picture or bar graph
Terms/ Vocabulary Liter, kilogram, gram, bar graph, picture graph, interval, volume, mass, standard units, scale, data, metric
Stage 2 – Assessment Evidence
Initial Task: The School Cafeteria
Final Performance Task: Mary’s Bakery
Other Evidence Teacher observation, conferencing, teacher designed assessment pieces, student work, exit slips, journal entries
Stage 3 – Learning Plan
Everyday Mathematics/Impact Mathematics Lessons – The following lessons may support some of the CCLS & essential questions outlined in this unit map:
3.MD.1: 1-4, 1-13, 3-6, 5-5, 5-12

3.MD.2: No applicable EDM Lessons
3.MD.3: 1-5, 1-13, 4-10, 5-2 Additional Resources:
Georgia Unit of Study: https://www.georgiastandards.org/Common-Core/Common%20Core%20Frameworks/CCGPS_Math_3_Unit7FrameworkSE.pdf
Parking Cars Task for 3.MD.3: http://insidemathematics.org/common-core-math-tasks/3rd-grade/3-2007%20Parking%20Cars.pdf
Time to Get Clean Task for 3.MD.1: http://insidemathematics.org/common-core-math-tasks/3rd-grade/3-2008%20Time%20to%20Get%20Clean.pdf
Data Grapher Online Tool: http://illuminations.nctm.org/ActivityDetail.aspx?ID=204
Elapsed Time Ruler: http://www.k-5mathteachingresources.com/support-files/elapsedtimerulersample1.pdf
Elapsed Time Word Problems: http://www.k-5mathteachingresources.com/support-files/elapsedtimewordproblems.pdf
3.MD.2 Problems and Activities: o http://www.k-5mathteachingresources.com/support-files/capacity-mass-word-problems.pdf o http://www.k-5mathteachingresources.com/support-files/estimatingweight.pdf o http://www.k-5mathteachingresources.com/support-files/moreorlessthanaliter.pdf o http://www.k-5mathteachingresources.com/support-files/capacitylineup.pdf
3.MD.3 Problems and Activities: o http://www.k-5mathteachingresources.com/support-files/buttonbargraph.pdf o http://www.k-5mathteachingresources.com/support-files/buttonpictograph.pdf o http://www.k-5mathteachingresources.com/support-files/jakessurvey.pdf o http://www.k-5mathteachingresources.com/support-files/collectingandrepresentingdata.pdf

Name: ______________________________________ Date: __________________
Grade 3 Unit 3 Initial Performance Task: The School Cafeteria
1. The clock below shows the time the school cafeteria begins serving breakfast.
What time does the cafeteria begin serving breakfast?
2. The Cook begins making the lunch salads at 10:45 a.m. It takes 10 minutes to prepare the salad, 5 minutes to make the dressing and 15 minutes to serve the salad. What time will the salad be ready?
Use the number line below to show your mathematical thinking.
10:45 11:00 11:15 11:30 11:45 12:00 12:15
Liters Liters Liters
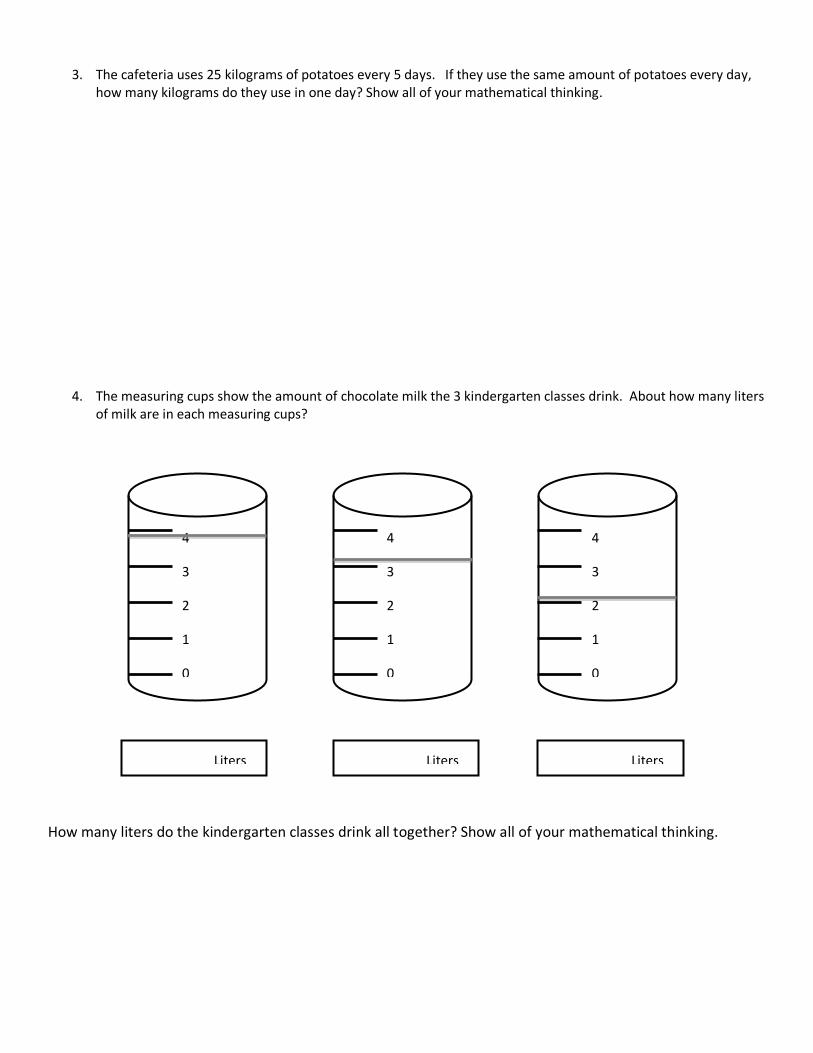
3. The cafeteria uses 25 kilograms of potatoes every 5 days. If they use the same amount of potatoes every day,
how many kilograms do they use in one day? Show all of your mathematical thinking.
4. The measuring cups show the amount of chocolate milk the 3 kindergarten classes drink. About how many liters of milk are in each measuring cups?
How many liters do the kindergarten classes drink all together? Show all of your mathematical thinking.
4
3
2
1
0
4
3
2
1
0
4
3
2
1
0

5. The cafeteria keeps track of the number of pizza lunches they serve every day. Below is a table showing
the number of lunches served each day.
5a. Use the table above to complete the pictograph.
5b. How many more pizza lunches did they serve on Thursday than on Friday? Show all of your mathematical thinking. 5c. How many more pizza lunches were sold on Monday than on Wednesday and Friday combined? Show all of your mathematical thinking.
Pizza Lunches Served
Day of the Week Number of Lunches
Monday 55
Tuesday 35
Wednesday 25
Thursday 50
Friday 15
Pizza Lunches Served Monday
Tuesday
Wednesday X X X X X Thursday Friday
Key:
X = 5

6. Ms. Smith’s class surveyed the 4th grade students to find out their favorite cafeteria food. The graph below shows the data.
6a. Use the graph above to complete the data table below. 6b. How many students like Chicken Nuggets and Grilled Cheese? Show all of your mathematical thinking.
Favorite Cafeteria Food
Type of Food Number of Students
Pizza
Chicken Nuggets
Peanut Butter & Jelly
Grilled Cheese

Grade 3 Unit 3 School Cafeteria Scoring Guide
School Cafeteria Points Section
Points
1. Gives the correct answer:
7:45 a.m.
1
1
2. Gives the correct answer and shows correct work on the number line
11:15 a.m.
10:45 11:00 11:15 11:30 11:45 12:00 12:15
1
1
2
3. Gives the correct answer:
5 kilograms
Shows mathematical thinking:
25 ÷ 5 = 5 kilograms OR
5 Kilograms OR
Any other relevant work
1
1
2
4. Gives correct amount for each measuring cup:
4 Liters - 3 Liters - 2 Liters Gives correct answer with correct work:
9 Liters AND
4+3+2=9 (or any other relevant work – including pictures)
1
1
2
5a. Correctly completes the pictograph
Pizza Lunches Served Monday X X X X X X X X X X X
Tuesday X X X X X X X
Wednesday X X X X X Thursday X X X X X X X X X X Friday X X X
2 2

5b. Gives correct answer with correct work
50 – 15 = 35
1
1
5c. Gives correct answer with correct work:
15 pizza lunches AND
25 + 15 = 40 (or any other relevant work – including pictures)
1 1
6a. Completes the data table:
Favorite Cafeteria Food
Type of Food Number of Students
Pizza 20
Chicken Nuggets 24
Peanut Butter & Jelly 12
Grilled Cheese 32
2
2
6b. Gives correct answer with correct work
24 + 32=56
1 1
Total Points 14
Novice Apprentice Practitioner Expert
0-4 5-8 9-12 13-14

Name: ______________________________________ Date: __________________
Grade 3 Unit 3
Initial Performance Task: Mary’s Bakery
1. The clock below shows the time Mary wakes up to go to the Bakery. (3.MD.1)
What time does Mary wake up in the morning?
2. Mary gets to the bakery at 5:45 a.m. It takes 15 minutes to prepare the cookie dough, 10 minutes to
bake the cookies and 15 minutes to decorate them. What time will the cookies be ready to sell? (3.MD.1)
Use the number line below to show your mathematical thinking.

Liters Liters Liters
3. Mary puts 215 grams of sugar in each yellow cake. She is making 6 cakes. How many grams of sugar
does she need? Show all of your mathematical thinking. (3.MD.2)
4. The measuring cups show the amount of milk Mary uses while making her pies. About how many liters
of milk are in each measuring cup?
How many liters does Mary use all together? Show all of your mathematical thinking.
4
3
2
1
0
4
3
2
1
0
4
3
2
1
0
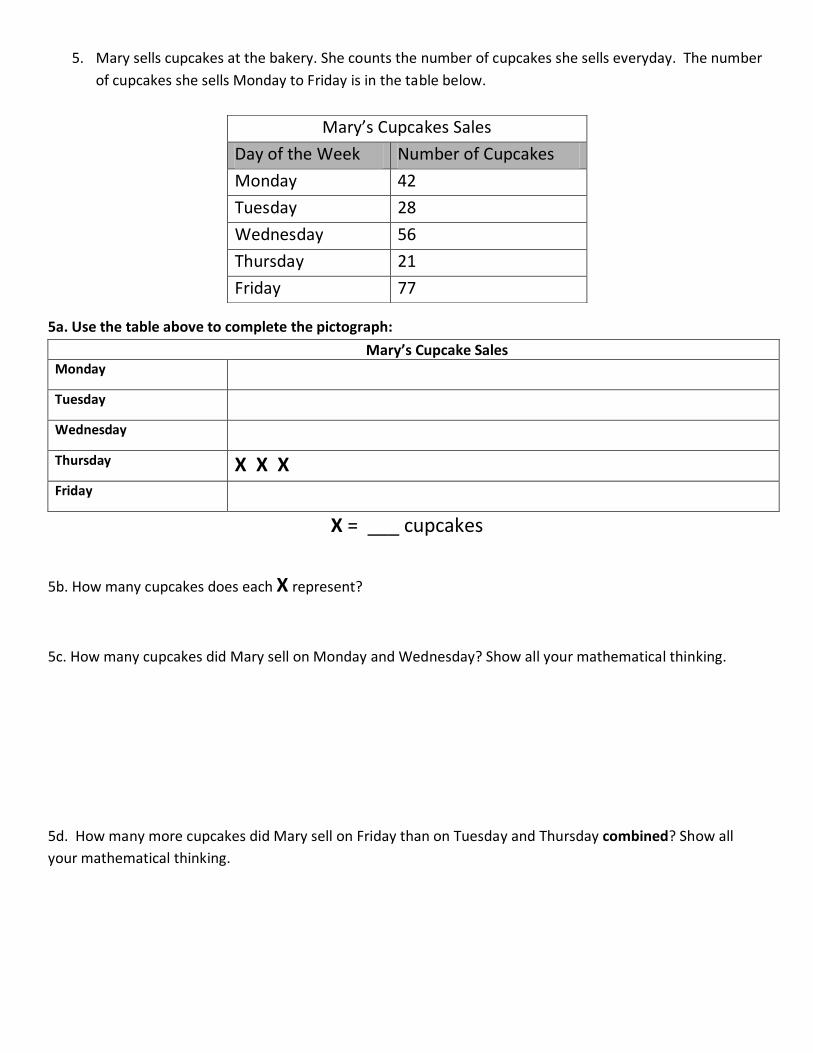
5. Mary sells cupcakes at the bakery. She counts the number of cupcakes she sells everyday. The number
of cupcakes she sells Monday to Friday is in the table below.
5a. Use the table above to complete the pictograph:
X = ___ cupcakes
5b. How many cupcakes does each X represent?
5c. How many cupcakes did Mary sell on Monday and Wednesday? Show all your mathematical thinking.
5d. How many more cupcakes did Mary sell on Friday than on Tuesday and Thursday combined? Show all
your mathematical thinking.
Mary’s Cupcakes Sales
Day of the Week Number of Cupcakes
Monday 42
Tuesday 28
Wednesday 56
Thursday 21
Friday 77
Mary’s Cupcake Sales Monday
Tuesday
Wednesday
Thursday X X X Friday

6. Mary surveys her customers to find out their favorite cookie. The customer’s choices are shown in the
table below.
Use the information above to complete the bar graph.
Be sure to:
Label the graph
Graph all the data
Customer’s Favorite Cookies
____________________________________________________________________
Customer’s Favorite Cookies
Type of Cookie Number of Cookies
Chocolate Chip 15
Oatmeal 18
Ginger Snap 9
Peanut Butter 24
Nu
mb
er
of
Co
oki
es

Grade 3 Unit 3 Mary’s Bakery Scoring Guide
Mary’s Bakery Points Section
Points
5. Gives the correct answer:
4:45 a.m.
1
1
6. Gives the correct answer and shows correct work on the number line
6:25 a.m.
Possible number line
5:15 5:30 5:45 6:00 6:15 6:30 6:45
1
1
2
7. Gives the correct answer:
1,290 grams
Shows mathematical thinking:
215 x 6= 1,290 grams OR
200 x 6=1,200 10x6=60 5x6=30 1,200+60+30=1,290 OR
Any other relevant work – including pictures
1
1
2
8. Gives correct amount for each measuring cup:
2 Liters - 3 Liters - 1 Liter Gives correct answer with correct work:
6 Liters AND
2+3+1=6 (or any other relevant work – including pictures)
1
1
2
5a. Correctly completes the pictograph
Mary’s Cupcake Sales Monday X X X X X X
Tuesday X X X X
Wednesday X X X X X X X Thursday X X X Friday X X X X X X X X X X X
2 2
5b. Gives correct answer:
7 cupcakes
1 1

5c. Gives correct answer with correct work:
98 cupcakes AND
42 + 56= 98 (or any other relevant work – including pictures)
1 1
5d. Gives correct answer:
28 cupcakes
Gives correct work:
28 + 21= 49 AND
77 – 49= 28
1
1
2
6. Completes the bar graph:
Has correct scale
All labels are correct
All data graphed correctly
2 1 2
5
Total Points 18
Novice Apprentice Practitioner Expert
0-5 6-10 11-16 17-18