GRADE 2 SUPPLEMENT - The Math Learning Center...Measuermnsetum: D ieou nu: Bridges in Mathematics...
24
GRADE 2 SUPPLEMENT Set D1 Measurement: Duration Includes Activity 1: Time Tests D1.1 Activity 2: A Second, a Minute or an Hour? D1.5 Activity 3: How Long Does it Take? D1.7 Activity 4: The Water Experiment D1.11 Activity 5: Two Pounds of Apples D1.15 Activity 6: A Quart of Ice Cubes D1.19 Skills & Concepts H demonstrate an understanding of units of time and time relationships (seconds in a minute and minutes in an hour) H identify quantitative and qualitative change over time H analyze quantitative and qualitative change over time H match a.m. and p.m. to familiar situations H use appropriate tools to measure liquid volume in cups, quarts, and gallons; ounces and pounds H organize data in charts H infer trends in a data set as increasing, decreasing, or random P201304
Transcript of GRADE 2 SUPPLEMENT - The Math Learning Center...Measuermnsetum: D ieou nu: Bridges in Mathematics...

GRADE 2 SUPPLEMENTSet D1 Measurement: Duration
IncludesActivity 1: Time Tests D1.1
Activity 2: A Second, a Minute or an Hour? D1.5
Activity 3: How Long Does it Take? D1.7
Activity 4: The Water Experiment D1.11
Activity 5: Two Pounds of Apples D1.15
Activity 6: A Quart of Ice Cubes D1.19
Skills & ConceptsH demonstrate an understanding of units of time and time relationships (seconds in a minute
and minutes in an hour)
H identify quantitative and qualitative change over time
H analyze quantitative and qualitative change over time
H match a.m. and p.m. to familiar situations
H use appropriate tools to measure liquid volume in cups, quarts, and gallons; ounces and
pounds
H organize data in charts
H infer trends in a data set as increasing, decreasing, or random
P201304

Bridges in Mathematics Grade 2 Supplement
Set D1 Measurement: Duration
The Math Learning Center, PO Box 12929, Salem, Oregon 97309. Tel. 1 800 575–8130.
© 2013 by The Math Learning Center
All rights reserved.
Prepared for publication on Macintosh Desktop Publishing system.
Printed in the United States of America.
P201304
The Math Learning Center grants permission to classroom teachers to reproduce blackline
masters in appropriate quantities for their classroom use.
Bridges in Mathematics is a standards-based K–5 curriculum that provides a unique blend
of concept development and skills practice in the context of problem solving. It incorpo-
rates the Number Corner, a collection of daily skill-building activities for students.
The Math Learning Center is a nonprofit organization serving the education community.
Our mission is to inspire and enable individuals to discover and develop their mathematical
confidence and ability. We offer innovative and standards-based professional development,
curriculum, materials, and resources to support learning and teaching. To find out more,
visit us at www.mathlearningcenter.org.

Set D1 Measurement: Duration
Bridges in Mathematics Grade 2 Supplement • D1.1© The Math Learning Center
Set D1 H Activity 1
ACTIVITY
Time Tests
OverviewStudents discuss some of the things they know about 1
second, 1 minute, and 1 hour, and try a variety of experi-
ments to find out just how long these time increments
really are.
Skills & ConceptsH demonstrate an understanding of units of time and
time relationships (seconds in a minute and minutes in
an hour)
H identify quantitative and qualitative change over time
You’ll needH classroom clock with a second hand
H whiteboard and markers
H a piece of scratch paper for each child
H pencils
H 3 or 4 tubs of pattern blocks or other building
materials (e.g. legos, construx, wood cubes, blocks)
H 3 or 4 tubs of geoblocks (divide your entire supply)
Instructions for Time Tests1. Gather children to your discussion circle. Explain that you’re going to talk about time today. Write the following question on the whiteboard: How long is a second? Read the question with the class and ask students to pair-share some ideas. Can they describe how long a second is? Can they think of some things they could do in just one second? Then invite volunteers to share their ideas with the class as you record at the whiteboard.
How Long is a Second ?• It’s like 1 wink.• I can snap my fingers in 1 second.• I can blink my eyes in 1 second.• People always say “Just a second.”• It’s 1 tick on the clock.• There are 60 seconds in a minute.
2. Draw students’ attention to the classroom clock. Show them the second hand and explain that each time it moves, 1 second has passed. Explain that some people like to count seconds like this: 1, one thousand; 2, one thousand; 3, one thousand; and so on. Try it with the class. Can you and the students pace the count to match the movement of the second hand?
3. Now try some experiments. Have students snap their fingers in time to the ticking of the clock. Does that speed feel about right, or does it seem like they could snap more than once per second? Repeat the experiment with clapping and then blinking. Students may decide that snapping their fingers once per second seems about right, but they can clap 2 or 3 times in a second, and blink even more times than that per second.

Set D1 Measurement: Duration
© The Math Learning CenterD1.2 • Bridges in Mathematics Grade 2 Supplement
4. Next, write this question on the whiteboard: How long is a minute? Ask students to pair-share ideas and then record some of them on the board. What do they know about a minute? What are some of the things they can do in a minute?
How Long is a Minute ?• It’s longer than a second.• It’s still really short.• I can get dressed in 1 minute.• I can swim a lap in less than a minute.• I can eat my breakfast in just 1 minute.• I can brush my teeth in 1 minute, but my mom makes me brush for 2 minutes.• There are 60 minutes in an hour.
5. Draw students’ attention back to the clock. Explain that when the second hand gets to the 12, you’re all going to watch the clock without making a sound for 1 minute. Try this and then ask students to dis-cuss the experience. How many seconds passed? Did a minute seem short or long to them?
6. Ask students to stand up. Demonstrate holding your arms outstretched on either side, so your body looks like the letter T. Ask them if they think they can do the same and hold the position for 1 minute. Then explain that when the second hand reaches the 12, you’ll all stand that way for 1 minute. If they have to put their arms down and rest before a minute passes, that’s okay, but no one including you can talk. At the end of the minute, ask students to discuss the experience. Did a minute seem short or long this time?
7. Ask students how many times they think they can write their first name in 1 minute. Record some of their estimates at the board. Then have them return to their tables and get out their pencils while you give each of them a piece of scratch paper. Explain that you’ll say, “Go,” when the second hand reaches the 12, and they’ll have exactly 1 minute to write their first name as many times as they can. If some students want to use shorter nick-names, that’s fine, but they have to print well enough so other people can read their writing. Try this and then have students share and compare their results. Were there any surprises?
8. While students remain at their tables, write this question on the board: How long is an hour? Ask them to pair-share ideas and record some of their responses on the board. What do they know about an hour? What are some of the things they can do in an hour? Can they name events in their daily life that take an hour?
Activity 1 Time Tests (cont.)

Set D1 Measurement: Duration
Bridges in Mathematics Grade 2 Supplement • D1.3© The Math Learning Center
How Long is an Hour ?• It’s a really long time.• We have math for an hour every day.• We have reading for 2 hours every day.• If you watch 2 TV shows that’s an hour.• It takes me an hour to get ready for school.• I get to watch TV for 1 hour every day.• It takes an hour to drive to my grandma’s.
9. Now pass out the tubs of math materials. Each table will need one tub of pattern blocks or other build-ing materials. Give students at each table a few moments to divide the materials, so each child has a good supply in front of him or her. When they have their materials organized, ask students to put their hands in their laps. Explain that you are going to give them 1 second to build with the materials. At your signal, they’re to start, and then they’re to stop when they hear the signal again. Try this several times, and then have them put their hands back in their laps. What can they do with the materials in 1 second?
Students Not much! I hardly got started! I put 2 triangles together. I put 1 block on top of another. A second isn’t long enough to do anything.
10. Repeat step 9, but give students a minute instead of a second this time. What can they do with the materials in 1 minute?
Students I made a flower with the pattern blocks. I made a pretty tall tower with the little cubes. I started a really cool pattern, but a minute wasn’t enough time to finish it.
11. Now offer to give students an hour to build with their materials. Some may say they won’t be able to keep working for an hour. Others may say that they’ll run out of materials or ideas before an hour has passed. Just explain that you’ll give the signal when the second hand reaches the 12 and record the starting time on the board. Get them started and let them work for 10 minutes. Then ask them to stop. Write the time on the board, and explain that it’s only been 10 minutes. How many more minutes would it take for an hour to pass? What were they able to accomplish in 10 minutes? Could they really continue to build for an hour? Can they think of any activities they could sustain for a full hour?
Extension• Overthenextfewdays,notethetimesyoustartandstopreadingtime,mathtime,lunch,gym,and
so on. How does an hour feel in the context of classroom instruction? How does an hour feel when they’re in the car, or waiting for their mom to come home from work? How does an hour feel when they’re doing something they really like to do? How does an hour doing chores feel?
Activity 1 Time Tests (cont.)

© The Math Learning CenterD1.4 • Bridges in Mathematics Grade 2 Supplement

Set D1 Measurement: Duration
Bridges in Mathematics Grade 2 Supplement • D1.5© The Math Learning Center
Set D1 H Activity 2
ACTIVITY
A Second, a Minute or an Hour?
OverviewHow long does it take to stack 15 wooden cubes? How
long does it take to knock the stack over? Using a col-
lection of items the teacher has gathered beforehand,
students suggest and conduct a variety of time-related
experiments.
Skills & ConceptsH demonstrate an understanding of units of time and
time relationships (seconds in a minute and minutes in
an hour)
H identify quantitative and qualitative change over time
H analyze quantitative and qualitative change over time
Recommended TimingAnytime after Set D1 Activity 1
You’ll needH classroom clock with a second hand
H Work Places currently in use
H Pigs on a Blanket by Amy Axelrod (optional)
H a cafeteria tray (see Advance Preparation)
H fifteen 3⁄4˝ wooden cubes in a small container
H 4 or 5 ice cubes in a cup
H a small, clear container of very hot water
H several popsicle sticks
H a saucer
H several pieces of scratch paper
H a pair of scissors
H a box of 8 crayons
H a pencil
Advance Preparation Place the last 9 items listed above
on a cafeteria tray immediately before you conduct this
activity.
Instructions for A Second, a Minute or an Hour?1. Place the tray of materials you’ve prepared in the middle of the discussion circle, within easy reach. Invite students to join you in the circle. Give the children a few moments to look at the things on the tray, and then explain that you’re going to use them to do some time experiments today.
2. Draw students’ attention to the tub of wooden cubes. How long do they think it will take you to stack all 15 cubes—a second, a minute, or an hour? A few might respond that it will only take a second, but most will probably say that it will take closer to a minute. Wait until the second hand on the classroom clock reaches the 12 and then ask students to watch the clock as you stack the cubes. Discuss the results when you’re finished. Did it take more than a second? Did it take exactly a minute? Did it take closer to 1 second or 1 minute?
3. Invite one of the students to knock over the stack of cubes. How long will it take—a second, a minute, or an hour? Ask students to whisper their predictions to the people sitting next to them, and then watch the clock as your volunteer knocks over the stack. Did it take closer to 1 second or 1 minute?

Set D1 Measurement: Duration
© The Math Learning CenterD1.6 • Bridges in Mathematics Grade 2 Supplement
4. Point out that both of these experiments involved changing the materials in some way. You took the cubes out of their tub and stacked them. Your helper knocked the stack over. Now ask students to brain-storm some other 1-second, 1-minute, and 1-hour experiments you could try using only the materials on the tray. As they discuss various ideas, be sure they know that the water in the container is quite hot. Record their suggestions on the board.
One Second• rip the paper in half• break one of the 2 popsicle sticks• dump the ice cubes out of the cup• drop an ice cube into the cup• spill the water• dump out the crayons• break the pencil• stack 2 cubes
One Minute• cut out a paper snowflake• melt an ice cube in the hot water (if you stir that will help)• write your name and address on the paper• write your first name 10 times on the paper• make a little building withthe wooden cubes and the popsicle sticks
One Hour• draw a really, really good picture• get an ice cube to melt if you just put it in the saucer• write a really good story• melt all the ie cubes by leaving them in the cup
5. Invite volunteers to try some of the 1-second and 1-minute suggestions as their classmates watch and time them. Place a star beside the suggestions that actually take the predicted amount of time (or close to it).
6. If it hasn’t already been suggested by the class, propose that you place one of the ice cubes on the saucer and leave the rest in their cup. Will it take less than, more than, or exactly an hour for the cube on the saucer to melt? What about the cubes in the cup? Set up both experiments and record the starting time on the whiteboard. Appoint an official “watch-person” to keep an eye on the ice cubes, and send the students out to do Work Places for the rest of your math time.
7. Record the time when the cube on the saucer is finally all melted. Do the same for the cup of ice cubes. Then work with students to calculate the amount of time it actually took in both cases. Are they surprised?
Extension• ReadPigs on a Blanket by Amy Axelrod to your class. This amusing book addresses the passage of
time, exploring intervals such as 13 minutes, 30 minutes, 45 minutes, and an hour. Reading it to the class is also a great way to review time-telling, especially if you have a Judy Clock or small student clocks for children to use while they’re listening to the story.
Activity 2 A Second, a Minute or an Hour? (cont.)

Set D1 Measurement: Duration
Bridges in Mathematics Grade 2 Supplement • D1.7© The Math Learning Center
Set D1 H Activity 3
ACTIVITY
How Long Does It Take?
OverviewStudents sort a collection of pictures by the amount of time
it takes to do each activity shown. Then they describe and
illustrate 3 different activities, one that takes 1 second, one
that takes 1 minute, and one that takes 1 hour.
Skills & ConceptsH demonstrate an understanding of units of time and
time relationships (seconds in a minute and minutes in
an hour)
Recommended TimingAnytime after Set D1 Activity 2
You’ll needH How Long Does It Take? Activity Cards, sheets 1 and 2
(pages D1.9 and D1.10, class set)
H 12˝ × 18˝ drawing paper, 1 sheet per student
H scissors
H glue sticks
H pencils
H crayons
Instructions for How Long Does It Take?1. Gather children to your discussion circle. Show them a copy of the first sheet of How Long Does It Take? Activity Cards. Give them a moment to examine the pictures and ask them to identify one activ-ity that would take about a second to do. Ask them to find another that would take about a minute, and another that would take about an hour. Depending on students’ experiences and sense of time, they may not always agree, and that’s fine.
Students You can open a lunchbox in 1 minute. I think it would only take about a second. I can make my bed in a minute. It only takes me a second to make my bed! It would take about an hour to go to the park and play. My dad wouldn’t let me stay that long. I get to watch TV for an hour after school. We get to watch more than that, but it’s closer to an hour than a minute or a second!
2. Explain that in a minute, you’re going to give each of them 2 sheets of the activity cards. Their job will be to cut out all 18 cards and sort them according to the amount of time it takes to do each activ-ity. Then demonstrate how to fold a piece of 12" × 18" drawing paper into thirds and label each third as shown on the next page. Explain that they’ll need to glue each picture where they think it belongs on the sheet. Be sure they understand these times are only approximate. It might actually take them 2 min-utes to make their bed or 45 minutes to get ready for bed and read a bed-time story, but it takes closer to a minute than an hour to make their bed, and closer to an hour than a minute to get ready for bed.

Set D1 Measurement: Duration
© The Math Learning CenterD1.8 • Bridges in Mathematics Grade 2 Supplement
1 second 1 minute 1 hour
3. When students understand what to do, send them back to their tables to get out their scissors and glue sticks while you pass out the blacklines and sheets of drawing paper. Ask them to go to work as soon as they have all the materials they need. Encourage them to discuss their decisions with their neighbors as they work, and reassure them that it’s okay if they don’t always agree. It can take different amounts of time for different people to do the same thing.
4. When they’re finished sorting and gluing the pictures, have them turn their papers over and write the same headings at the top: 1 second, 1 minute, and 1 hour. Then ask them to describe and illustrate an activity under each heading. Encourage them to think of their own ideas rather than copying what’s al-ready shown on the activity cards they’ve just sorted.
Extension• Displaychildren’sdrawingsonaclassroomwallorinthehallforparents,teachers,andotherstu-
dents to enjoy.
Activity 3 How Long Does It Take? (cont.)

Bridges in Mathematics Grade 2 Supplement • D1.9© The Math Learning Center
Set D1 Measurement: Duration Blackline Run a class set.
How Long Does It Take? Activity Cards page 1 of 2
Jump 1 time
Watch TV
Bounce a basketball 1 time
Open your lunchbox Go to soccer practice
Brush your teeth Eat 1 waffle Play computer games
Get out of bed

© The Math Learning CenterD1.10 • Bridges in Mathematics Grade 2 Supplement
Set D1 Measurement: Duration Blackline Run a class set.
How Long Does It Take? Activity Cards page 2 of 2
Make toast
Play at the park Make your bed
Fry 2 eggs
Get ready for bed and read a bed-time story
Turn on a nightlight Brush your hair
Turn off an alarm clock
Turn on the TV

Set D1 H Activity 4
ACTIVITY
The Water Experiment
OverviewThe teacher shares three units of liquid measure with the
class: a cup, a quart, and a gallon. Students help mea-
sure and pour water from one container to the next to
discover that a quart holds 4 cups, and a gallon holds 4
quarts or 16 cups. After a gallon container has been filled
and the water tinted blue, the class empties it into a plas-
tic aquarium. Students discuss what might happen if they
set the aquarium somewhere in the room where it won’t
be disturbed. Will the amount of water in the aquarium
remain the same, increase, or decrease? Will the water
change in any other way? How long will it take before
changes start to occur? Students observe the water qual-
ity, check the level, measure the quantity, and record their
observations on a chart each week.
Skills & ConceptsH identify quantitative and qualitative change over time
H analyze quantitative and qualitative change over time
H use appropriate tools to measure liquid volume in
cups, quarts, and gallons
H organize data in charts
H infer trends in a data set as increasing, decreasing, or
random
H generalize connections among mathematics, the envi-
ronment, and other subjects
You’ll needH Water Experiment Chart (page D1.14, run copies as
needed)
H plastic aquarium or other clear or translucent open
container that holds a gallon
H two empty, clean 1-gallon milk jugs (see Advance
Preparation)
H 1-cup measuring cup
H clear or translucent 1-quart container
H small bottle of blue or green food coloring
H fine-tip permanent marker
H cafeteria tray
H towel
H funnel
H 1-quart plastic pitcher
H individual chalkboards or whiteboards, chalk or dry-
erase pens, and erasers
H a piece of chart paper
Advance Preparation Run a strip of masking tape up the
side of the quart container, one of the gallon milk jugs, and
the plastic aquarium. Fill the other milk jug with exactly
1 gallon of water. Set the two jugs, the 1-cup measure,
quart container, food coloring, funnel, permanent marker,
and plastic aquarium on the cafeteria tray. Place the tray in
the middle of your discussion area right before you con-
duct this activity.
Instructions for The Water Experiment1. Distribute chalkboards/whiteboards, chalk/pens, and erasers to students, and ask them to join you in the discussion area. Have them form a circle and set their writing materials down in front of them. Explain that you are going to do some measuring today, and then the class is going to set up an experiment.
2. Show students the empty gallon jug, the quart container, and the 1-cup measure. Explain that these are tools people use to measure liquid volume (or capacity). Which holds the most? Which holds the
Set D1 Measurement: Duration
Bridges in Mathematics Grade 2 Supplement • D1.11© The Math Learning Center

least? Draw students’ attention to the filled gallon jug. Place the 1-cup measure near the jug. Ask stu-dents to estimate how many cups of water the gallon jug is holding. Have them record their estimates on their chalkboard/whiteboards and take a moment to pair-share their ideas.
3. Before you start measuring the water, show students the bottle of food coloring. Ask them to predict what will happen if you squeeze 15 drops of coloring into the water. Will the water change in any way? How? How long will it take for the change to occur? After students have discussed these questions, have them count as you put 15 drops of coloring into the gallon of water. Ask them to watch silently for 1 minute and then share any changes they can observe.
4. Next, call on volunteers to help you transfer the water from the filled to the empty gallon jug, mea-suring as you go. First fill the one-cup measure. Then pour the water from the cup into the quart con-tainer. Mark the masking tape to show the water level. Repeat this 3 more times, marking the tape each time. How many cups does it take to fill the quart container? Ask students to make tally marks on their whiteboards to help keep track of the number of cups you’ve poured out of the first gallon jug so far.
5. Pour the water from the quart container into the empty gallon jug and mark the masking tape to show the water level. How many more quarts do students think it will take to fill the jug? Discuss this briefly. Then call on more volunteers to help you transfer another 4 cups of water from the first jug to the quart, and then to the second jug. Ask the class to continue tracking your work with tally marks.
6. How many cups have you measured out so far? How many quarts have you filled and emptied into the second gallon jug. How full are both jugs now?
Students They’re both half full. We’ve poured 8 cups out of the first one so far. We filled up that quart bottle 2 times. Four cups fit in a quart. And 2 of those quarts only fill up half the big milk jug.
Set D1 Measurement: Duration
© The Math Learning CenterD1.12 • Bridges in Mathematics Grade 2 Supplement
Activity 4 The Water Experiment (cont.)

7. Ask students if you need to continue measuring the water out of the first jug one cup at a time. Pro-pose instead that you pour the remaining water directly into the quart container as you measure the contents of the first jug into the second jug. Will they be able to keep recording the number of cups on their boards?
Jonah Yes! Every time you fill a quart, it’s worth 4 cups, so we just make 4 marks. Plus it’s faster that way.
8. When all the water has been measured into the second jug, and students have determined that a gal-lon holds 4 quarts or 16 cups, explain that you are going to pour all of the water into the plastic aquar-ium. Will the water fill the aquarium? Have students discuss their predictions. Then pour the gallon of tinted water into the aquarium and mark the water level.
9. Now ask students to predict what will happen if you put the aquarium in a safe place somewhere in the classroom and leave it sit uncovered and undisturbed. Will there be any changes? If so, how long might they take to occur? Record students’ predictions on a piece of chart paper.
Water Experiment Predictions• The water might dry up.• The water might get more blue.• The aquarium might get some blue on it. • There might get to be more water.• Nothing will happen. No changes.• It might dry up in a day.• It might take a week or a month.• If no one touches it, it won’t change.• The water might take a year to dry up.
10. Work with input from the class to decide where to place the aquarium. Then show students the Water Experiment Chart. Explain that a different group of children will examine the water and the aquarium for changes each week. They will also measure the water to see if the amount has changed, and enter the data on a chart.
11. Once the experiment is set up, take time during Number Corner each week to examine the Water Experiment Chart together and discuss any changes your students have observed. Does the data on the chart indicate that the quantity of water is increasing, decreasing, changing at random, or not changing at all from one week to the next? You will need to keep the tray of measuring equipment and the towel available over the coming months. You will probably also want to have a parent helper or aide supervise the measuring group each week to help them handle the water carefully, measure with accuracy, and re-cord the data. Be sure all your students get a turn to participate in making measurements over the com-ing months.
Set D1 Measurement: Duration
Bridges in Mathematics Grade 2 Supplement • D1.13© The Math Learning Center
Activity 4 The Water Experiment (cont.)

© The Math Learning CenterD1.14 • Bridges in Mathematics Grade 2 Supplement
NA
ME
DA
TE
Set D1 Measurement: Duration Blackline Run copies as needed.
Wat
er E
xper
imen
t Ch
art
DA
TEW
ATE
R Q
UA
NTI
TYW
ATE
R Q
UA
LITY
/CO
MM
ENTS

Set D1 Measurement: Duration
Bridges in Mathematics Grade 2 Supplement • D1.15© The Math Learning Center
Set D1 H Activity 5
ACTIVITY
Two Pounds of Apples
OverviewStart with two sets of apples, each weighing a pound.
Peel one set and leave the skins on the other. Place the
two sets in a warm, sunny location in your classroom and
leave them uncovered and undisturbed. Will the apples in
either set change? How will they change? How long will it
take? This experiment provides students with an oppor-
tunity to measure weight in pounds and ounces as they
explore qualitative and quantitative changes.
Skills & ConceptsH identify quantitative and qualitative change over time
H analyze quantitative and qualitative change over time
H use appropriate tools to measure weight in ounces
and pounds
H organize data in charts
H infer trends in a data set as increasing, decreasing, or
random
H generalize connections among mathematics, the envi-
ronment, and other subjects
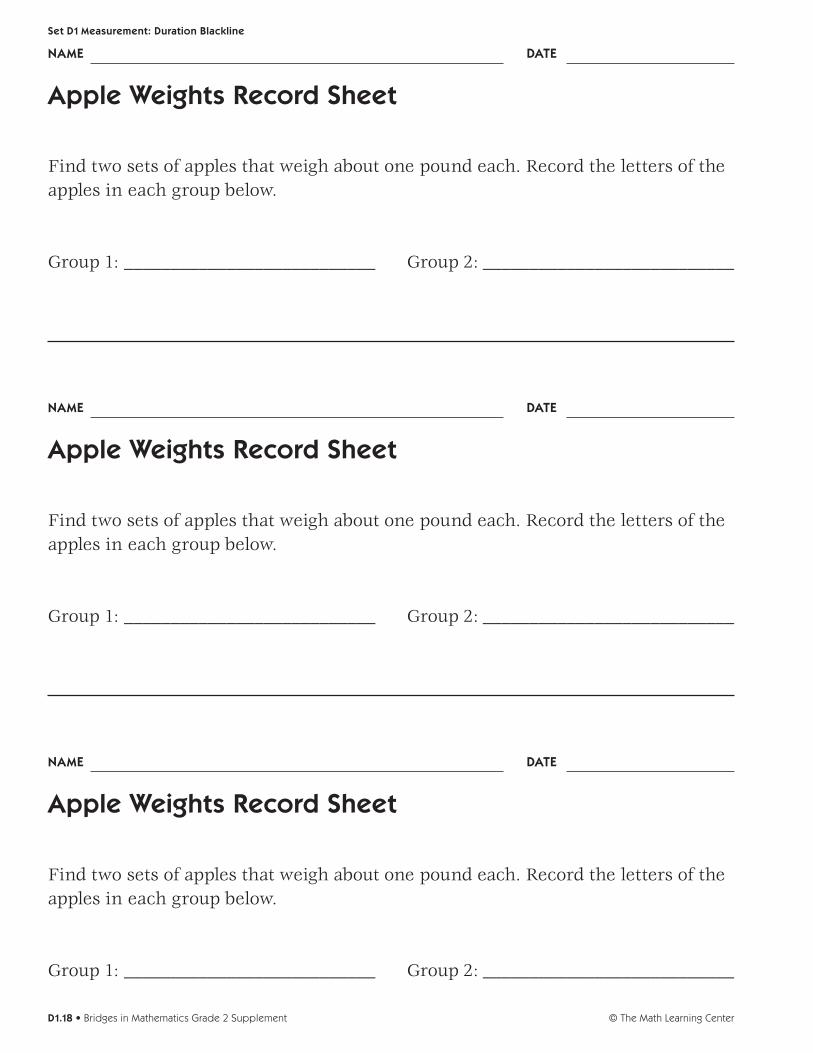
You’ll needH Apple Weights Record Sheet (page D1.18, run a third
of a class set)
H 12 medium sized apples (see Advance Preparation)
H 12 adhesive dots (see Advance Preparation)
H a balance scale
H standard pound and ounce weights or several 1-pound
boxes of modeling clay (see Advance Preparation)
H a carrot peeler
H several paper plates
H paper towels
H 2 pieces of chart paper
H The Apple Doll, by Elisa Kleven (optional)
Advance Preparation Bring a dozen medium-sized
apples to school in a paper sack. Weigh them beforehand
to make sure they don’t weigh more than 3–4 pounds in
all. Write a letter on each adhesive dot, from A–L, and la-
bel each apple with one of the dots. If you have standard
pound and ounce weights, use them. If not, use three
1-pound boxes of modeling clay for 1-pound weights.
Cut each stick of clay from a fourth box into quarters and
roll them into balls to create sixteen 1-ounce weights.
Instructions for Two Pounds of Apples1. Gather students to your discussion area and have them form a circle. Tell them that you are going to do a new experiment, but they need to do some preliminary work before you can start. Place the sack of apples in the center of the circle and show students how you have labeled each apple with a letter.
2. Explain that the experiment requires two sets of apples that weigh one pound each. Ask students to estimate the weight of the entire sack of apples. Then place the sack on one side of the balance and have students help you balance the other side with pounds and ounces as needed. Discuss with students how they might go about finding combinations of apples that weigh as close to one pound as possible. Show them one of the Apple Weights Record Sheets and work with their input to find one combination of ap-ples that works. Is this the only possible combination?

Set D1 Measurement: Duration
© The Math Learning CenterD1.16 • Bridges in Mathematics Grade 2 Supplement
Set D1 Measurement: Durat on Blackline
NAME DATE
Apple Weights Record Sheet
Find two sets of apples that weigh one pound each. Record the letters of the applesin each group below.
Group 1: ___________________________ Group 2: ___________________________
Mrs Fisher
B, D, and G
Jan 7
3. Make the apples, the Apple Weights Record Sheets, the balance scale and the weights available to chil-dren during Work Places over the next few days. Ask them to work in pairs to find groupings of apples that weigh a pound each. Chances are, there will be a number of combinations that work.
4. After 3–4 days, ask students to form a circle in the discussion area to set up the experiment. Acknowl-edge the fact that they probably found several or more different combinations of apples that weighed very close to or exactly a pound. Choose two of the combinations, and work with help from the stu-dents to weigh both sets again, making sure they are one pound each. Then explain that you are going to place each set of apples on a double or triple layer of paper plates. The apples will be placed in such a way that they aren’t touching one another. You will find a warm, sunny place to set them in the class-room, where they will remain undisturbed. The only difference between the two sets is that you are go-ing to peel one of the sets and leave the other with the skins on.
5. Peel the apples in one of the sets as students watch and discuss their predictions. Will the apples in ei-ther set change? If so, how? How long will it be before changes start to appear? As soon as you have fin-ished peeling the apples, set them on one plate. Set the “skins-on” apples on another. Record the time on a piece of chart paper, as well as the weight of each set of apples. Then record some of the predictions your students have made.
Apple ExperimentPeeled: 1 pound Start Time 9:35 a.m.Skins-On: 1 pound
PredictionsPeeled Apples: Skins-On Apples:• rotten • rotten• squishy • mushy• turn brown right away • won’t turn brown• get buggy • get buggy• changes faster than • change slower
the ones with skins on • might get moldy• maybe get mold on them• maybe dry up
6. Next, work with students to make a recording chart. Solicit their suggestions about the title of the chart, and how to set it up so they can keep track of changes in the weight and appearance of the apples in the two different sets. Decide with them how often to check the apples, and write in the first few dates. Then record the first day’s data. The chart you make with them might look something the one shown below.
Activity 5 Two Pounds of Apples (cont.)

Set D1 Measurement: Duration
Bridges in Mathematics Grade 2 Supplement • D1.17© The Math Learning Center
Apple Watching Experiment
Peeled Apples Skin-On Apples
Date
1/10
1/11
1/12
1/13
Weight Appearance
white, no peels, a tiny bit of brown
red, hard, shiny, little white dots
Weight
1 pound 1 pound
Appearance
7. Have a different pair of students weigh the two sets of apples and record observations on the chart each day for 2–3 weeks, possibly longer depending on how long the apples take to change. Take time during Number Corner to discuss the changes, especially the weight changes recorded on the chart. What trends can students infer from the weight data? Is the weight of either or both sets of apples in-creasing, decreasing, or changing at random? Is one set of apples losing weight more rapidly than the other? Why might that be?
Extension• IfyouhaveaccesstoThe Apple Doll, by Elisa Kleven, read it to your class. This is a beautifully writ-
ten picture book that might inspire you and your students to make your own apple dolls. If so, there are instructions included in the book.
Activity 5 Two Pounds of Apples (cont.)
© The Math Learning CenterD1.18 • Bridges in Mathematics Grade 2 Supplement
Set D1 Measurement: Duration Blackline
NAME DATE
Apple Weights Record Sheet
Find two sets of apples that weigh about one pound each. Record the letters of the apples in each group below.
Group 1: ___________________________ Group 2: ___________________________
NAME DATE
Apple Weights Record Sheet
Find two sets of apples that weigh about one pound each. Record the letters of the apples in each group below.
Group 1: ___________________________ Group 2: ___________________________
NAME DATE
Apple Weights Record Sheet
Find two sets of apples that weigh about one pound each. Record the letters of the apples in each group below.
Group 1: ___________________________ Group 2: ___________________________

Set D1 Measurement: Duration
Bridges in Mathematics Grade 2 Supplement • D1.19© The Math Learning Center
Set D1 H Activity 6
ACTIVITY
A Quart of Ice Cubes
OverviewHow long does it take for a quart of ice cubes to melt?
How much water will there be when all the cubes have
melted? Students make predictions and then work with
the teacher to set up the experiment. Some of the deci-
sions they have to make include where to place the con-
tainer, how often to check it, how to set up a recording
chart, and what to do if the ice has not melted by the end
of the school day.
Skills & ConceptsH identify quantitative and qualitative change over time
H analyze quantitative and qualitative change over time
H use appropriate tools to measure liquid volume in
cups and quarts
H use appropriate tools to measure weight in ounces
and pounds (see Extensions)
H measure temperature on Celsius and Fahrenheit ther-
mometers (see Extensions)
H organize data in charts
H infer trends in a data set as increasing, decreasing, or
random
H match a.m. and p.m. to familiar situations
H generalize connections among mathematics, the envi-
ronment, and other subjects
You’ll needH 2–3 trays of ice cubes (see Advance Preparation)
H clear or translucent 1-quart jar (see Advance
Preparation)
H 1-cup measure
H fine-tip permanent marker
H cafeteria tray
H towel
H 2 pieces of chart paper
H balance scale, pound and ounce weights (optional)
H Celsius and Fahrenheit thermometers (optional)
Advance Preparation Run a strip of masking tape up
the side of the quart jar. Prepare 2–3 trays of ice cubes;
enough to fill the jar. Keep these in the freezer until just
before you conduct the activity. Right before you meet
with the students, place the quart jar, 1-cup measure, and
trays of ice cubes on the cafeteria tray and set it near your
discussion area.
Instructions for A Quart of Ice Cubes1. Gather students to your discussion area and have them form a circle. Tell them you are going to work together to set up a new experiment today. Show them the quart jar and help them recall that a quart holds 4 cups of liquid. Explain that you are going to fill the jar with ice cubes and then watch to see what changes occur and how long it takes for them to appear. Count the number of ice cubes in one tray and ask students to estimate how many cubes it will take to fill the quart jar.
2. Ask students to help you keep track of the number of ice cubes as you dump as many trays as needed into the quart jar. Then set the jar in the middle of the circle. Record the number of cubes it took to fill the jar and the current time on a piece of chart paper. Then have students share any observations they can make about the ice and the jar right now. Ask them to predict what might happen if you leave the

Set D1 Measurement: Duration
© The Math Learning CenterD1.20 • Bridges in Mathematics Grade 2 Supplement
jar out uncovered and undisturbed. How long will it take for the changes to start? Most students will readily predict that the ice will melt. How long will it take for the entire quart of ice to melt? How much water will there be when all the ice has melted? Record students’ predictions on the chart paper. As you do so, introduce the convention of labeling time as a.m. or p.m. so people know whether students are talking about times between midnight and noon, or between noon and midnight.
Ice Cube Experiment20 ice cubes Start Time 9:45 a.m.
Predictions• The ice will melt.• It will make a lot of water.• They will make exactly 1 quart of water.• There is lots of space between the cubes so it will
only be maybe 2-3 cups of water. • They will all melt by 3:00 p.m.• They will be melted by lunchtime, 11:45 a.m.• It will take 2 days for them to all melt.• They will melt when we’re asleep ton ight at about
11:30 p.m.
3. Now explain that one of the challenges all scientists face is how to collect and record their data. Show students the second piece of chart paper and work with them to set up a recording chart that will help answer their questions, including the length of time it will take for all the ice to melt, and the amount of water that will result. Here are some of the issues to address with the class as you make the chart:• Whatshouldthetitleofourchartbe?• Whatinformationdowewanttorecordonourchart?• Howoftenshouldwecheckontheicecubestoseeiftheyarecompletelymelted?• Whowilldothechecking?• Whatiftheicehasn’tmeltedbythetimewegohometoday?
Students may have other thoughts and ideas about what to put on the chart. Implement their sugges-tions as you draw up the chart for your class.
Our Ice Cube Experiment How much water?
Date & Time
1/6 9:45 a.m.1/6 10:45 a.m.1/6 11:45 a.m.1/6 12:45 p.m.1/6 1:45 p.m.1/6 2:45 p.m.1/6 3:45 p.m.1/6 4:45 p.m.1/7 8:45 a.m.
Inspectors
The ClassJess & SaraJuan & Kim
DeShawn & GeriRosa & AjaMax & YukiMr. GomezMr. GomezThe Class
Ice Melted Yet?None Part All
Activity 6 A Quart of Ice Cubes (cont.)
Set D1 Measurement: Duration
Bridges in Mathematics Grade 2 Supplement • D1.21© The Math Learning Center
4. When the ice has fully melted, work with help from the students to measure the amount of water in the container. Is it more than, less than, or exactly a quart? Why might the results have turned out the way they did? Would you get exactly the same results if you repeated the experiment? Why or why not? What increased during the observation period? What decreased?
Extensions• Yourstudentsmightbeinterestedintrackingtheweightoftheiceandcontainerduringthisexperi-
ment. Whether or not the weight of the ice-filled jar will change as the ice changes to water is a genu-ine question for second graders. If you want to pursue this exploration with your students, you will need a sturdy balance scale, as well as pound and ounce weights. (If you don’t have manufactured weights, a 4-stick box of school modeling clay usually weighs a pound. Each stick can be cut into fourths to approximate ounces.)
• Youandyourstudentsmightalsowanttotrackthetemperatureoftheice-filledjarastheicemelts.If so, you will need a thermometer that measures temperature in both Celsius and Fahrenheit, or one thermometer of each type. Take the opportunity to have children read and record the temperature using both scales. Some may be interested in the fact that the freezing point of water at sea level is 0º C and 32º F.
Activity 6 A Quart of Ice Cubes (cont.)

© The Math Learning CenterD1.22 • Bridges in Mathematics Grade 2 Supplement