Economic Geography Urban and Rural Geography Political Geography.

Grade 11 Physical Geography: Patterns, Processes, and Interactions
Unit 4 – Weather and Climate
Compiled by:
Jeremy Cruz, Julia Klepl, Richard Pye, Kathryn Scott, Laura Smith, and Ryan Van Berkel
TABLE OF CONTENTS Page
Unit Overview _________________________________________________________ 3 Cumulative Task Part I __________________________________________________ 10 Activity 4.1: The difference between Weather and Climate _______________________ 12 Activity 4.2: What Drives Climate __________________________________________ 16 Activity 4.3: The Major Climate Controls – LOWERN ___________________________ 20 Activity 4.4: Earth's climate zones __________________________________________ 23 Activity 4.5: ArcGIS Lab - Running Hot and Cold: A global perspective _____________ 34 Activity 4.6: Climate, Soils and Vegetation ___________________________________ 35 Activity 4.7: Ocean and Glacier Effects on Weather and Climate __________________ 41 Cumulative Task Part II __________________________________________________ 45 Activity 4.8: Natural Disasters and their Effects on Weather and Climate Part 1 ______ 47 Activity 4.9: Hurricanes, Tornadoes, Earthquakes and their Effects on Weather
and Climate Part 2 ___________________________________________ 48 Activity 4.10: The Greenhouse Effects on Global Warming ______________________ 50 Activity 4.11: Consequences of Greenhouse Effects and Local Weather Issues ______ 52 Activity 4.12: Climate Change and the Climate Challenge ________________________ 55 Activity 4.13: Taking Action - Attacking Climate Change _________________________ 58 GIS Module 3, lessons 1 & 3 ________________________________________ Appendix GIS Ice Storm Module _____________________________________________ Appendix
2

Unit Overview Physical Geography: Patterns, Processes, and Interactions, Grade 11, University/College Preparation, CGF3M Unit 4 – Weather and Climate Unit Design The unit consists of 13 activities, and 2 cumulative tasks. Assessment & Evaluation of Student Achievement The students will be assessed based on homework reading from Earth Matters, GIS lab activities, research projects on specific topics from each subsection, and/or from class work and discussion. All assessment is formative and will not count towards the student's final mark. The students will be evaluated two times during the unit, once in the middle and once at the end. Each of these cumulative tasks will be accompanied by a rubric outlining how the four categories of the achievement chart (knowledge and understanding, thinking and inquiry, communication, and application) apply to the marking scheme. The rubrics will have space for comment and show the distribution of marks across the four categories. This evaluation is part of the 70% course work which will be followed by a year end cumulative task work 30% of the final grade. Rationale The study of Physical Geography is particularly important in today’s context, where it is so easy to lose sight of the fact that we are intimately connected to our physical environment. Yet physical processes operating on the geologic timescale are ultimately responsible for the landscapes that we inhabit and the resources that support us. At the same time, our species has become the most significant agent of change on the Planet’s surface. There is no better example of this than our impact on climate. This unit on Climate from a geographic perspective will provide students with a critical understanding of and ability to participate in one of the most important environmental discourses of our time. Through exposure to how climatic systems operate and their profound impacts on human economies, settlements, and food production students will begin to understand the severity of this issue and the importance of acting as stewards of the planet in the interests of sustainability. Statement of Beliefs Geography is about the constantly changing world we live in and its many facets. Individuals and the societies they live in cannot be understood outside the context of planet earth. A Geographic understanding of that planet, its systems, the life that inhabits it, the societies that we create upon it, and how these things interact and change is essential to the development of responsible global citizens and to the sustainable future of the Earth. The study of Geography will help develop this lasting understanding and sense of responsibility among students.
3
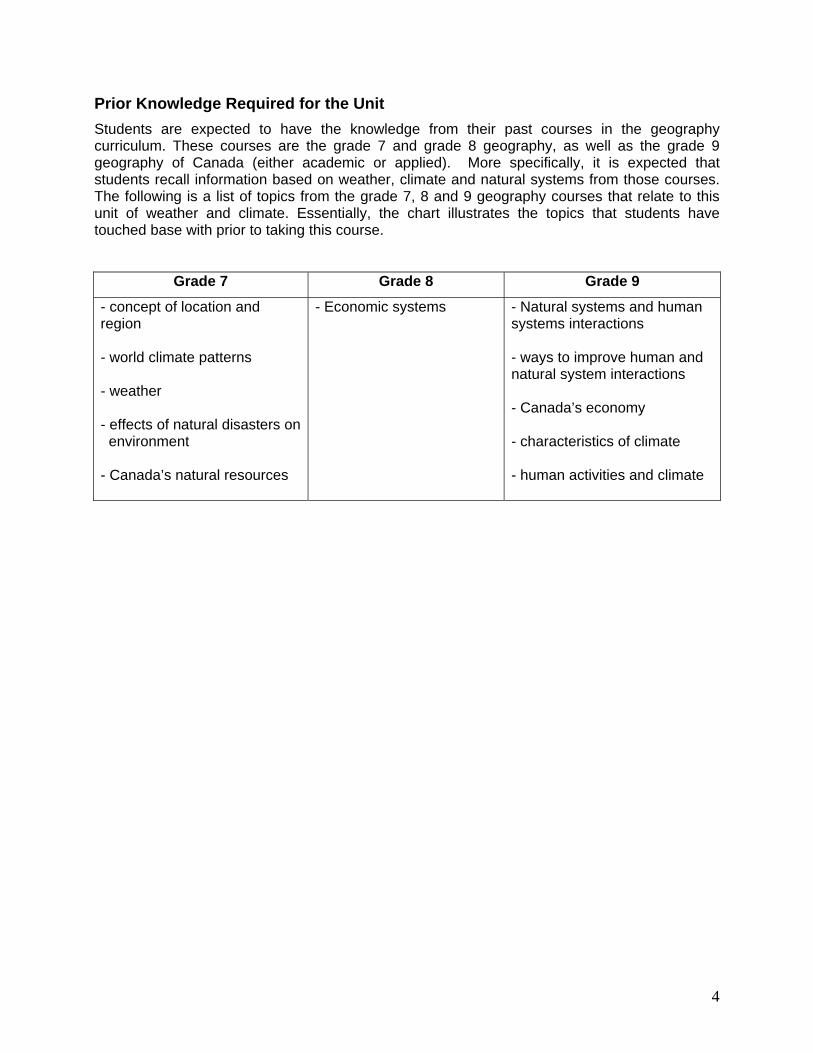
Prior Knowledge Required for the Unit Students are expected to have the knowledge from their past courses in the geography curriculum. These courses are the grade 7 and grade 8 geography, as well as the grade 9 geography of Canada (either academic or applied). More specifically, it is expected that students recall information based on weather, climate and natural systems from those courses. The following is a list of topics from the grade 7, 8 and 9 geography courses that relate to this unit of weather and climate. Essentially, the chart illustrates the topics that students have touched base with prior to taking this course.
Grade 7 Grade 8 Grade 9
- concept of location and region - world climate patterns - weather - effects of natural disasters on environment - Canada’s natural resources
- Economic systems - Natural systems and human systems interactions - ways to improve human and natural system interactions - Canada’s economy - characteristics of climate - human activities and climate
4
Overall Expectations
Geographic Foundations: Space and Systems • Analyse the sources and nature of energy flows through the lithosphere, atmosphere,
hydrosphere, and biosphere. Human-Environment Interactions • Evaluate the impact of human life on the environment; • Explain the importance of stewardship and sustainability as guiding principles for human
use of the physical environment. Global Connections • Explain the reasons for the global patterns of continents and oceans, landforms, climate,
soils, and vegetation. Understanding and Managing Change • Analyse the causes and consequences of climate change; • Analyse changes in natural systems caused by natural phenomena. Methods of Geographic Inquiry and Communication • Use the methods and tools of geographic investigation and inquiry to locate, gather,
evaluate, and organize information; • Communicate the results of geographic inquiries and investigations, using appropriate
terms and concepts and a variety of forms and techniques. Specific Expectations
Geographic Foundations: Space and Systems • Explain how the earth’s orbit and tilt relate to the seasons and annual variations in
climate; • Identify the interconnections among natural systems (e.g., climate) within selected
ecosystems; • Describe the origins, distribution, and frequency of different kinds of storms (e.g., frontal
depressions, hurricanes, tornadoes, thunderstorms); • Describe the flow of matter and energy through ecosystems (e.g., hydrologic cycle,
carbon cycle) and explain the relationship of these flows to landforms, climate, soils, and vegetation;
• Explain how climatic controls act upon the elements of the atmosphere to produce the climatic zones of the earth;
• Analyse the effects of natural variations in climate on the structure and composition of soils and vegetation of selected regions.
5

Human-Environment Interactions • Describe the trade-offs for humans living in areas that are subject to natural disruptions; • Describe the effects of human activities (e.g., urban expansion, resource exploitation) on
various aspects of the environment; • Analyse ways in which human activities may increase or decrease the risks from natural
hazards (e.g., floods, avalanches, tornadoes); • Evaluate the impact on a selected region of human-caused changes in atmospheric
conditions (e.g., acid precipitation, smog, ozone depletion). • Evaluate the impact of human activities (e.g., deforestation, the burning of fossil fuels,
fertilizer use) on natural cycles (e.g., the carbon, nitrogen, or phosphorus cycles). Global Connections • Describe the similarities and differences among global ecosystems (e.g. temperate and
tropical rainforests, polar and mid-latitude deserts); • Explain the role that oceans and ocean currents play in moderating climate; • Explain the relationships that link global patterns of landforms, climate, soils, and
vegetation to each other; • Compare global distribution patterns of climate, soils, and vegetation with patterns in
their local bioregion. Understanding and Managing Change • Describe the potential effects of climate change on the sustainability of resource-based
industries (e.g., agriculture, forestry); • Explain the relationship between natural variations in global climate and glacial
movement; • Identify the mechanisms of change within the lithosphere, atmosphere (e.g., greenhouse
effect), hydrosphere, and biosphere; • Explain the potential effects of long-term climate change (e.g., global warming) on
different parts of the world, including their local community; • Describe the difficulties involved in predicting climate change; • Evaluate the role of technology in changing human-environment relationships. Methods of Geographic Inquiry and Communication • Explain current methods and technologies used to track and predict weather, including
dangerous phenomena such as hurricanes, thunderstorms, and tornadoes; • Identify selected physical features on the earth’s surface using various sources (e.g.,
geographic information systems [GIS]); • Use a variety of geotechnologies to interpret, analyse, and synthesize information in
connection with a geographic inquiry (e.g., geographic information systems [GIS]).
6

Unit Synopsis Chart Activity/Sequence Time Assessment Student Tasks Cumulative Task Part 1
Presented prior to Activity 4.1, and to be completed after Activity 4.7.
K/U, T/I, C, A - Research factors that influence climate for 2 cities and explain how they are relevant. - Research the name and characteristics of the climate zone the cities are in and their general characteristics. - Create two climographs (1 for each city). - Create a poster to display their research results - Present (5 minutes) poster to the class and post a pin on the classroom world map for each of the cities. - Research, report, verbal presentations
4.1 The difference between weather and climate
30 min K/U - Distinguish between statements describing weather and climate - Worksheet
4.2 What drives Climate: Incoming solar radiation and the earth’s tilt
70 min K/U, T/I C, A - Explain how latitude effects climate and the seasons via incoming solar radiation and the earth’s tilt - Diagram, Paragraph
4.3 Factors affecting Climate: L.O.W.E.R.N.
140 min K/U, C, A - Explain how each of the major climate factors influences local climates - Presentation, Worksheet
4.4 Earth's climate zones
140 min K/U - Read, analyze, and construct climographs. - Explain the relationship between climate and climate zones. - Explain climate zone classification. - Brainstorming, worksheets
4.5 ArcGIS Lab: Running Hot and Cold: A global perspective
140 min K/U, C - Explain the characteristics of the earth’s tropical, temperate, and polar zones. - GIS, worksheet
7

4.6 Climate, Soils and Vegetation
140 min K/U, T/I, C - Explain the correlation between climate and soils and vegetation. - Research, discuss, and write reports on the relationship between climate and agriculture. - Research, report
4.7 Ocean and Glacier Effects on Weather and Climate
280 min K/U, T/I, C - Distinguish how fresh and salt water density, oceans currents, El Nino/La Nina effect climate - Research Assign. - Explain how Ice, Snow, and Glaciers effect climate. Understand Albedo's role in climate. - Video and Jigsaw
Cumulative Task Part 2
Presented prior to Activity 4.8, and to be completed after Activity 4.13.
K/U, T/I, C, A - Use ArcGIS to plot dangerous weather patterns that occur in both locations. They will also plot urban/rural areas, areas of intense agriculture/forestry /fishing, and GDP. - Student will make hypothesis about how the cities will be affected by climate change in the future, and support their hypothesis. - Based on the analysis, students will make a decision as to which of the 2 locations would be a more favourable place to live, and submit a “portfolio” to showcase their choice. - GIS lab, research, report
4.8 Natural Disasters: Effects on Weather Part 1
140 min K/U, T/I, C, A - Analyze storms, tornadoes, and hurricanes through the creation of a bristol board presentation of a major storm and a GIS lab on 1998 Ice Storm - Research, presentation
8

4.9 Natural Disasters: Effects on Weather Part 2
140 min K/U, T/I, C, A - Using GIS, Students will make a map showing the direction that the ice storm moved through south-eastern Ontario and western Quebec in 1998. - GIS lab
4.10 The greenhouse effect and global warming.
140 min K/U, C - Students will research a particular greenhouse gas. They will then present their findings to the class as well as create notes for the class - Presentation and Research mini-assignment.
4.11 Consequences of Climate Change and Local Weather Issues
140 min T/I, C - Students will get into discussions regarding Climate Change consequences and our local issues such as smog and acid rain. - Discussion.
4.12 Climate Challenge
70 min K/U, T/I, A - The goal of the game is to make environmentally sustainable and friendly choices and policies, in order to reduce the dangers of climate change, while also maintaining popularity with voters. - Online, interactive game.
4.13 Taking Action: Attacking Climate Change
210 min K/U, C, A - Students will work in pairs to research an area dependent on natural resources economies and create a plan to maintain that resource(s) in the face of climate change. - Discussion, Presentation and Research mini-assignment.
9

Julia Klepl, Richard Pye, and Kathryn Scott
Grade 11 Physical Geography Unit 4 Cumulative Task Part I
Select 2 cites you want to visit anywhere on earth, but on different continents. Research the factors that influence climate for each city and explain how they are relevant in a few paragraphs (1/2 page). Research the name and characteristics of the climate zone your cities are in and their general characteristics (1/2). Create 2 climographs (1 for each city). Create a poster to display 4 pictures of your cities and/or their climate zones (2 for each city) and include your research and graphs. Present (2 minutes) your finding to the class and post a pin on the classroom world map for each of your cities. What factors influence climate in the area near each city?
• Remember the factors influencing climate can be
summarized as L.O.W.E.R. N. -- Latitude, Oceans, Wind, Elevation, Relief, and Near water.
• Remember to explain WHY your climate factors are important and which climate factors are MOST influential in your cities.
• Examples: ocean currents; trade winds; proximity to lakes, glaciers, or a coast (possibly El Nino); and proximity to mountains, valleys, or plateaus.
What climate zones are your cities in? What are the characteristics of those climate zones?
• To do an internet search, type “city name” and “climate zones” to find the specific
zone. • From there research what characteristics the zone has. Include interesting facts on
temperature, precipitation, natural vegetation, most common agricultural practices, etc.
What are the seasonal patterns for the two cities? Create a climograph, using temperature and precipitation data, for each city.
• Find temperature and precipitation data for your locations at www.worldclimate.com • Compare your two cities to Toronto by searching for Toronto's climograph. (Which
city has greatest precipitation in which month? Which city is hottest or coldest and in what month?).
Prepare a poster with pictures and text to describe your two cities and their weather and climate. Each student will present their poster to the class (2 min).
• You must include a minimum of 4 images of your cities and/or their climate zones, typed paragraphs (one for section 1, 2, and 3 from above), and the climograph for your 2 cities.
• You will pin a label provided by the teacher on the classroom world map for each of your cities.
10

Julia Klepl, Richard Pye, and Kathryn Scott Rubric - Culminating Task Part I
Criteria 80 – 100% (Level 4)
70 – 79% (Level 3)
60 – 69% (Level 2)
50 – 59% (Level 1)
Knowledge/Understanding Describe 2 cities, the climate
zone for each location and all factors influencing climate for each location. Create climographs using temperature and precipitation for both locations.
10 marks
Describes 2 cities and identifies climate controls and climate zone characteristics with a high degree of accuracy. Creates climographs demonstrating thorough understanding.
Describes 2 cities and identifies climate controls and climate zone characteristics with considerable accuracy. Creates climographs demonstrating considerable understanding.
Describes 2 cities and identifies climate controls and climate zone characteristics with some accuracy. Creates climographs demonstrating some understanding.
Describes 2 cities and identifies climate controls and climate zone characteristics with limited accuracy. Creates climographs demonstrating limited understanding.
Thinking/Inquiry Demonstrate use of planning
skills (focusing research, gathering information) and processing skills (analyzing and organizing)
10 marks
Plans, conducts and organizes research with a high degree of effectiveness.
Plans, conducts and organizes research with considerable effectiveness.
Plans, conducts and organizes research with some effectiveness.
Plans, conducts and organizes research with limited effectiveness.
Communication Expresses and organizes
information on poster in a clear and logical manner.
Presents the finished poster
to the class, using appropriate vocabulary and concepts and a variety of forms and techniques.
10 marks
Expresses information with a high degree of effectiveness. Uses written, oral and visual forms with a high degree of effectiveness
Expresses information with considerable effectiveness. Uses written, oral and visual forms with considerable effectiveness
Expresses information with some effectiveness. Uses written, oral and visual forms with some effectiveness
Expresses information with limited effectiveness. Uses written, oral and visual forms with limited effectiveness
Application Application of knowledge of
climate controls and factors to explain why they are significant to each city and what is the most influential to each city.
10 marks
Applies knowledge of climate controls and factors with a high degree of effectiveness.
Applies knowledge of climate controls and factors with considerable effectiveness.
Applies knowledge of climate controls and factors with some effectiveness.
Applies knowledge of climate controls and factors with limited effectiveness.
Total: / 40
Comments:
.
11

Kathryn Scott
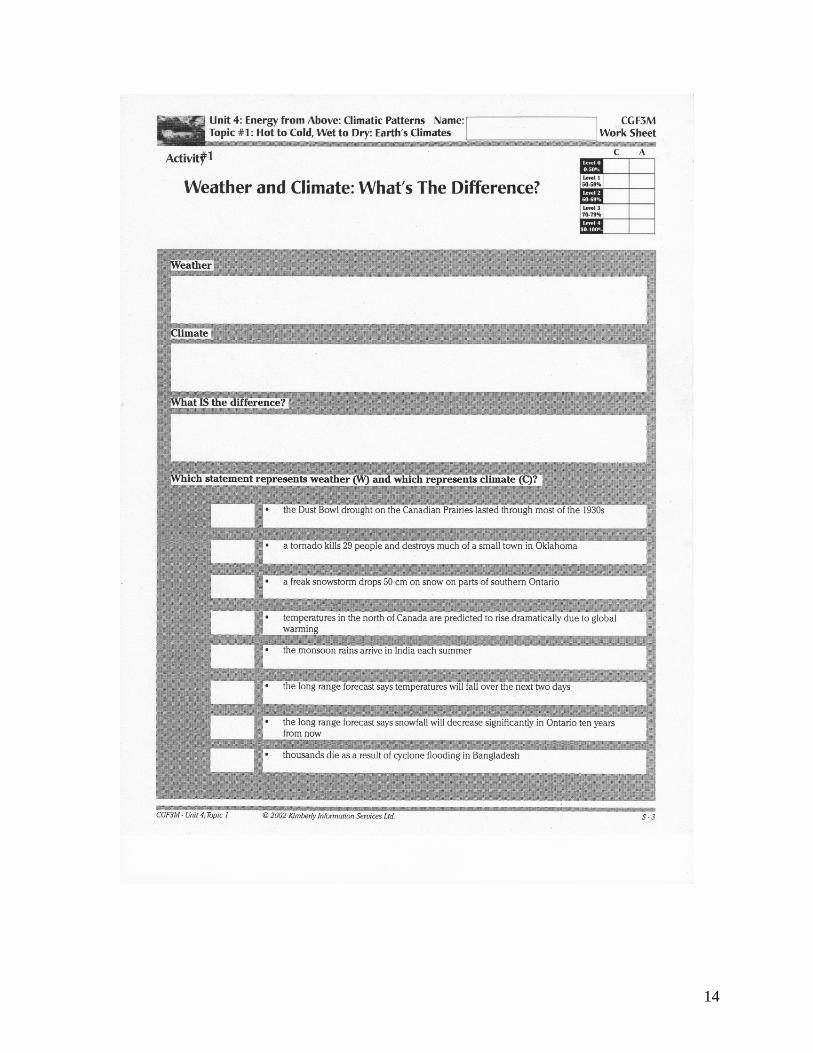
Activity 4.1 – The difference between Weather and Climate Time: 30 min Description This brief activity serves as a diagnostic tool to assess students understanding of weather and climate and to reinforce that while weather and climate are related, they are not synonymous. The activity will give students a basic understanding of what is meant by weather and climate, how they differ, and how they relate, provide and some examples of weather and climate phenomenon.
Strand(s): Global Connections.
Overall Expectations
• Explain the reasons for the global patterns of continents and oceans, landforms, climate, soils, and vegetation.
Specific Expectations
• Demonstrate an understanding of the differences between local weather and global climate.
Prior Knowledge and Skills Students will be asked to draw on knowledge of weather and climate gained in the grade 7 and grade 9 geography curriculums and in science courses, but a wide range of prior knowledge is to be expected. Prior knowledge will be helpful, but not necessary, as the activity will provide the necessary understanding of climate and weather. Planning notes
• Have a class set of handouts (see attached) prepared as well as a copy on overhead transparency and an overhead projector.
• Use the time given to students to work in pairs to visit students individually and assess their knowledge.
Teaching and Learning strategies
1. Have students attempt to classify statements on the handout as representing either climate (C) or weather (W), working in pairs
2. As a class fill out the portion of the handout which defines weather, climate and the difference between them, asking students for input before agreeing on a definition. Use the board or overhead projector to display the definitions
3. Have students work in their pairs to re-evaluate the way they classified each of the statements according to the definitions of weather and climate provided
4. Take up the statements as a class. If time permits, ask students to discuss other examples of weather and climate.
12

Assessment and Evaluation of Student Achievement Diagnostic/ formative assessment of students understanding of the difference between climate and weather, through classification of statements on the worksheet. Accommodations All definitions, etc will be provided both orally and in writing. Students with difficulty writing may be provided with written answers. Students will be working in pairs. Resources Handout: “Weather and climate: What’s the Difference?” Student handout and teacher answer sheet. From Kimberly Information Services ltd. 2002. CGF3M – Physical Geography. (See attached)
13
14

15

Kathryn Scott
Activity 4.2 –What Drives Climate Time: 70 min Description This activity will build on students current understanding of climate to emphasize that the major driving force behind the climate and it’s variation across the earth’s surface is the variation in amounts of insolation received by different points on earth. Students will brainstorm what they know about the climate differences and similarities on earth. Through direct instruction the teacher will then use a globe, two flashlights, and diagrams to demonstrate how the tilt of the earth is responsible for seasonal variations and latitudinal variations in climate.
Strand(s): Geographic Foundations: Space and Systems. Overall Expectations
• Analyse the sources and nature of energy flows through the lithosphere, atmosphere, hydrosphere, and biosphere.
Specific Expectations
• Explain how the earth’s orbit and tilt relate to the seasons and annual variations in climate.
Prior Knowledge and Skills Students will draw on knowledge of variations in climate around the world, from students’ travels, their families, the media, etc. They will build on knowledge of convective cells gained during the study of the earth’s interior and plate tectonics from this course. Planning notes
• Have a class set of construction paper labels reading HOT, COLD, ARID, HUMID, DISTINCT SEASONS, and NO DISTINCT SEASONS (roughly 6 of each) ready to be taped to the world map
• Have a large globe and two working flashlights handy. The blackboard may be used if a large globe is not available.
Teaching and Learning strategies 1. Ask students to brainstorm what they know about the general variations in climate across the
earth’s surface. This could be from any source (E.g. Places they have traveled to, places their families are from, places they have studied, places they have seen portrayed in the media, etc). This will take the form of a teacher led class discussion a. Prompts for discussion might include: Where is it the hottest? Where is it the coldest?
Where are some of the wettest places on earth? Where are some of the driest places on earth? Does every place on earth have four seasons like we do in Ontario?
16

b. Students will likely reveal they already know quite a bit about the major climatic variations on Earth i.e. that it is warmer near the equator and colder towards the poles, that some places have 4 seasons and others have similar weather all year, etc.
c. As Students discuss, have them place the labels for HOT, COLD, ARID, HUMID, 4 SEASONS, 2 SEASONS, and NO SEASONS where they think they should go on the map
2. Explain that what drives all weather and climate is the amount of incoming solar radiation
(energy from the sun, termed “insulation”) received at the earth’s surface, and that the amount of incoming solar radiation is not equal on all parts of the earth.
a. Ask students where they think the most and least energy is received based on where the HOT and COLD labels are placed on the map (highest near the Equator and lowest near the poles).
3. Emphasize that the world’s circulation systems (atmospheric, oceanic) which make up climate and weather, work to move the high amounts of energy received at the equator towards the poles. This is what the rest of the unit will cover in detail. The amount of solar radiation determines winds, air mass dominance, ocean currents, precipitation, etc.
4. Have four students volunteer to come up to the front of the class. Have 1 hold the large globe, and give each of the other two a flashlight
o Have student 1 hold the globe at a tilt of approximately 23.5 degrees and explain that this is the tilt of the earths axis
o Dim the lights and have the other two students stand together a short distance away from the globe.
o Ask one to shine the flashlight directly at Toronto at a 90 degree angle o Have the fourth student use chalk to trace the circle where the light hits. Show the
circle to the rest of the class. o Then, have the second student with a flashlight shine the light on Toronto, but this
time from a 45 degree angle. Again, have the fourth student trace the circle where the light shines, then show to the rest of the class. The first circle should be much smaller than the second.
o Explain that this means that the energy is much more intense when the sun is directly overhead, because the same amount of energy is being concentrated in a smaller area (have students make a note on the intensity of insulation)
o Repeat the Shining the flashlights on the globe, this time with one student shining the light directly at the equator from 90 degrees, and the other simultaneously shining the flashlight parallel to the first but at northern Canada
o Use the blackboard to draw a diagram illustrating what was just shown and have students copy this into their notes
o Using the students with the flashlights and the globe (have the globe travel around the sun while maintaining it’s axial tilt) as well as diagrams, explain how the earth’s tilt causes the intensity of insolation to change throughout the year and this is why we have seasons. Explain that the tropic of Capricorn (23.5 degrees S and the Tropic of Cancer (23.5 degrees North) are where they are because of the earth’s tilt (These latitudes mark the furthest points north and south where the sun’s rays contact the surface at 90 degrees). Also point out that it is not just the intensity of the suns rays but also the amount of daylight that varies with latitude and affects climate. Emphasize that this is why Latitude is a major factor affecting climate.
The attached diagrams may be useful as a reference for the teacher or to copy for students.
17

Assessment and Evaluation of Student Achievement Formative: Students will be asked to draw a diagram and write a short paragraph explaining how latitude affects the climate in Toronto and why we have four seasons. Accommodations Students will be given several opportunities to move out of their seats. Students who have difficulty taking notes or drawing diagrams will be given handouts. All important key will be given both orally and in writing. Students will be given time to work on the formative assessment in class. Extra time will be given to those requiring it. Resources
• Large Globe, Flashlights (1 will do but it’s best to have 2) • Diagrams illustrating the angle of insulation at different times of year, and the earth’s
yearly progression around the sun. A good source is:
Christopherson, R.W. and M.L. Byrne. (2005). Gersystems: An Introduction to Physical Geography. (1st Canadian Ed). Prentice Hall, New Jersey. Pp 50 and 56. (see attached).
18

19

Kathryn Scott
Activity 4.3: The Major Climate Controls - LOWERN Time: 140 min Description This lesson will re-introduce students to the main factors that affect climate; Latitude, ocean currents, winds, elevation, relief (or topography) and nearness to water (LOWERN). Students will work in small groups to reaserch one of these factors and present their findings to the rest of the class. Students will fill out an organizer describing the effects each factor has on the two main aspects of climate, temperature and precipitation, and how each factor influences the temperature and precipitation regimes of Toronto.
Strand(s): Geographic Foundations: Space and Systems; Global Connections, Methods of Geographic Inquiry and communication. Overall Expectations
• Explain the reasons for the global patterns of continents and oceans, landforms, climate, soils, and vegetation;
• Use the methods and tools of geographic investigation and inquiry to locate, gather, evaluate, and organize information;
• Communicate the results of geographic inquiries and investigations, using appropriate terms and concepts and a variety of forms and techniques.
Specific Expectations
• Explain how climatic controls act upon the elements of the atmosphere to produce the climatic zones of the earth;
• Explain the role that oceans and ocean currents play in moderating climate. Prior Knowledge and Skills
• Ability to work in Groups • Ability to conduct research using the textbook, secondary sources and the internet • Knowledge of Toronto’s climate • Oral Presentation Skills
Planning notes Instruct students to come to class with their textbooks. Book the computer lab if necessary. Bring additional secondary sources if possible. Depending on class dynamics, create groups in advance, use a system to assign students to a group randomly as they enter the class, or allow students to form their own groups.
20
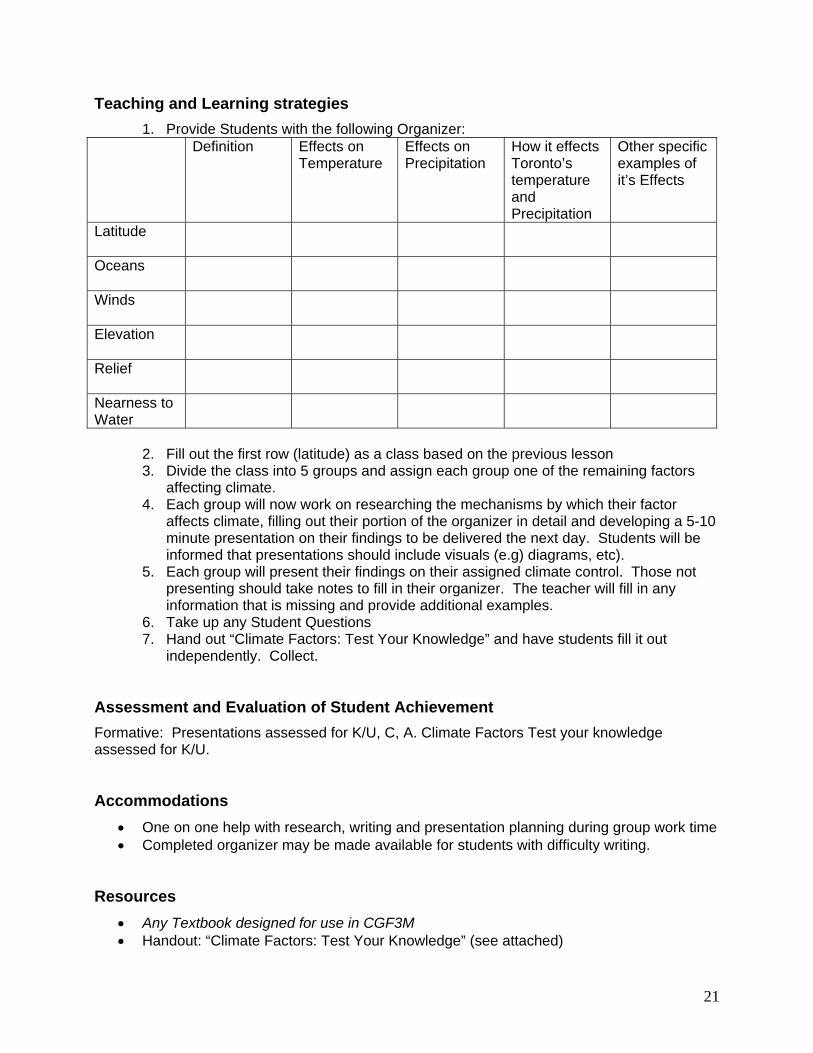
Teaching and Learning strategies 1. Provide Students with the following Organizer:
Definition Effects on Temperature
Effects on Precipitation
How it effects Toronto’s temperature and Precipitation
Other specific examples of it’s Effects
Latitude
Oceans
Winds
Elevation
Relief
Nearness to Water
2. Fill out the first row (latitude) as a class based on the previous lesson 3. Divide the class into 5 groups and assign each group one of the remaining factors
affecting climate. 4. Each group will now work on researching the mechanisms by which their factor
affects climate, filling out their portion of the organizer in detail and developing a 5-10 minute presentation on their findings to be delivered the next day. Students will be informed that presentations should include visuals (e.g) diagrams, etc).
5. Each group will present their findings on their assigned climate control. Those not presenting should take notes to fill in their organizer. The teacher will fill in any information that is missing and provide additional examples.
6. Take up any Student Questions 7. Hand out “Climate Factors: Test Your Knowledge” and have students fill it out
independently. Collect. Assessment and Evaluation of Student Achievement Formative: Presentations assessed for K/U, C, A. Climate Factors Test your knowledge assessed for K/U. Accommodations
• One on one help with research, writing and presentation planning during group work time • Completed organizer may be made available for students with difficulty writing.
Resources
• Any Textbook designed for use in CGF3M • Handout: “Climate Factors: Test Your Knowledge” (see attached)
21

22

Julia Klepl
Activity 4.4: Earth's climate zones Time: 140 min Description Students explore the different types of climate zones by investigating the Koeppen system of climate classification and learn that the concept of climate is complex. They will then learn a simple way to characterize different climates by studying climographs, which are a graphic way of displaying climate information; specifically, average temperature and precipitation. In this lesson, students learn about how to read, analyze, and construct climographs. They also practice matching climographs to climate zones around the world.
Strand(s): Geographic Foundations: Space and Systems; Global Connections. Overall Expectations
• Analyse the sources and nature of energy flows through the lithosphere, atmosphere, hydrosphere, and biosphere;
• Explain the reasons for the global patterns of continents and oceans, landforms, climate, soils, and vegetation.
Specific Expectations
• Identify the interconnections among natural systems (e.g., climate) within selected ecosystems;
• Explain how climatic controls act upon the elements of the atmosphere to produce the climatic zones of the earth;
• Describe the similarities and differences among global ecosystems (e.g. temperate and tropical rainforests, polar and mid-latitude deserts).
Prior Knowledge and Skills This lesson will build upon knowledge of world climate patterns studied in grade 7, as well as the characteristics of climate studied in grade 9. Students will also be expected to draw on information already covered in the unit and should know the difference between weather and climate, the seasonal variations and latitudinal variations in climate, and the main factors that affect climate. Resources
• Koeppen system of climate classification handout • Overhead - World climate zone map • Overhead - Climograph of Toronto overhead • Climograph worksheet • Temperature and precipitation data for various cities around the world • Climograph template for student needing accommodations • Overhead projector
23

Planning Notes A collection of pictures and a climograph is needed for each climate zone, to show students during teacher led discussion. Prior to lesson, handouts for each ‘unknown city’ A – O will be made, following the example handout given in this lesson plan. Teaching and Learning strategies 1. Review with students the elements that make up climate—temperature, humidity,
precipitation, pressure and winds. Then, facilitate a short discussion asking students how their lives are affected by the climate of the place where they live (Toronto). What specific things are strongly influenced by the climate? Answers should include things such as the clothing they wear, the vegetation and animal life of the area, recreation opportunities, etc.
2. Show a climograph of Toronto and explain that climographs are used to classify climate
around the world. Ask students to examine the figure without the data tables, to help them make sense of the visual format of the graph. Explain how climographs were developed to make it easier to characterize the climate of specific places. A climograph graphically depicts two different sets of information: average temperature and average precipitation data for a location. The precipitation information is shown as a bar for each month, and the temperature information is shown as a line connecting twelve points (one for each month). Reconstruct the climograph of Toronto on a blank overhead, showing students how it is done step by step (scales for temperature and precipitation, months written along the bottom, labelled axis, bar graph for precipitation, line graph for temperature, neat and legible).
3. Give students the Köppen Climate Classification handout and the World Climate Zone map.
Facilitate a discussion on the different climate zones, showing pictures and climographs for each zone. Students make notes on each zone.
4. Working in pairs, each student is then given a handout with temperature and precipitation
data for a different unnamed city (same data for each pair). Each pair will work together and construct a climograph using their unnamed city data. Then, students answer questions based on the climograph assigned to them, including trying to guess the city, and the climate zone the city is in. The students will then report to the class on their findings and their hypothesis of which city/climate zone the climograph represents. Each pair will also place a label on a map of the world to keep track of student guesses. Encourage discussion and critique of student conclusions. When all pairs have made their presentations, reveal the identity of the actual cities. Students will then compare their prediction to the Koppen Climate Classification System and check if they made the correct placement on the map.
5. Close the lesson by conducting a class discussion, asking the students such questions as:
• What would you pack if you were visiting different parts of the world? • Would it be easier to pack if they were going from east to west (or vice versa) or if they
were going from north to south (or vice versa)? Why? (Students should consider the predominant climates when answering. East/west travel would have less change in climate, while north/south could potentially have more changes.)
24

Assessment and Evaluation of Student Achievement Allow as many students as possible to contribute their ideas and take note of comprehension and involvement. Assess the students’ abilities by walking around and viewing the students as they work together. Worksheets will be taken up and assessed, however assessment is formative and will not count towards the students final grade. Accommodations A prepared copy of the board notes will be provided for anyone who has trouble writing everything down in time. It may be helpful to give some students a filled out climograph template for completing the climographs, with the scales given. Some students may have difficulty interpreting the climographs because of the amount of information in the graph or because of difficulty reading graphs. For such students, it may be helpful to allow them to construct separate graphs for temperature and for precipitation. Students with limited mathematical skills may find the different vertical scales confusing, or may have difficulty determining an appropriate range for each scale. Pairing such students with others who are more comfortable with the mathematical concepts may be helpful. Because much of the lesson is designed to be completed in groups, pairing ELL students with more proficient students should provide support for the ELL students. A vocabulary list with key words such as climate, temperature, precipitation, rainfall, etc. may also be helpful to ELL students. References Adapted from the Natrional Geographic Xpeditions lesson entitled “Climographs: Temperature, Precipitation, and the Human Condition.”
25

Overhead World Climate Zone Map
26

Handout The Köppen Climate Classification System A - Equatorial - Tropical moist climate
• Tropical Moist (Af) _________________________________________________________________________ _________________________________________________________________________ • Monsoon variety of Af (Am) _________________________________________________________________________ _________________________________________________________________________ • Wet-Dry Tropical (Aw) _________________________________________________________________________ _________________________________________________________________________
B - Arid - Dry climates • Dry Tropical (BW) _________________________________________________________________________ _________________________________________________________________________ • Dry Midlatitude (BS) _________________________________________________________________________ _________________________________________________________________________
C - Warm Temperature - Moist midlatitude climates with mild winters • Moist Continental (Cf) _________________________________________________________________________ _________________________________________________________________________ • Mediterranean (Cs) _________________________________________________________________________ _________________________________________________________________________
D - Snow - Moist midlatitude climates with cold winters.
• Subarctic ( Dfc) _________________________________________________________________________ _________________________________________________________________________ • Humid Continental (Dfa/b) _________________________________________________________________________ _________________________________________________________________________
E - Polar
• Ice Covered (EF) _________________________________________________________________________ _________________________________________________________________________ • Tundra (ET) _________________________________________________________________________ _________________________________________________________________________
H - Highland – Cold Climate due to elevation
__________________________________________________________________________________________________________________________________________________
27

Overhead Climograph of Toronto
28

Example of Climograph Worksheet Climograph Worksheet Using the data below, construct a climograph. Make sure your climograph is labeled correctly and has appropriate scales. Unnamed City ‘C’ Jan Feb Mar Apr May Jun Jul Aug Sep Oct Nov Dec °C -6.4 -5.6 -0.8 6.3 12.3 17.6 20.7 19.7 15.4 9.1 3.2 -3.3 Jan Feb Mar Apr May Jun Jul Aug Sep Oct Nov Dec mm 47.1 46.4 57.7 65.6 66.7 65.7 72.3 81.9 70.0 62.9 67.2 61.6
29

Answer the following questions: 1. What is the warmest month at your location? ____________ 2. What is the average temperature of the coldest month at your location? ___________ 3. Remembering that temperatures vary a great deal during the day, do you think the
temperature goes below 0oC at any time in April at your location? Why or why not? _________________________________________________________________________ _________________________________________________________________________ _________________________________________________________________________
4. What is the driest month at your location? ______________ 5. Is this a good place to visit for a warm-weather winter vacation? ________ 6. What type of recreational activities would people participate in at this location? _________________________________________________________________________ _________________________________________________________________________ 7. What kind of crops could grow at this location without irrigation? Explain your choices. _________________________________________________________________________ _________________________________________________________________________ _________________________________________________________________________ 8. What kind of natural vegetation would you expect to find at your location. _________________________________________________________________________ _________________________________________________________________________ 9. Do you think flooding is a serious risk at this location? Why? _________________________________________________________________________ _________________________________________________________________________ _________________________________________________________________________ 10. Make a hypothesis as to what city your climograph represents _____________ 11. Based on your knowledge of climate zones, where do you think this location is? Explain. _________________________________________________________________________ _________________________________________________________________________ _________________________________________________________________________
30

Teacher Resource Temperature/Precipitation Data for various cities A (London, England) Jan Feb Mar Apr May Jun Jul Aug Sep Oct Nov Dec °C 5.9 5.5 8.0 9.8 13.1 16.2 18.9 18.5 16.0 12.8 8.9 7.1 Jan Feb Mar Apr May Jun Jul Aug Sep Oct Nov Dec mm 77.7 51.1 60.2 54.1 55.3 56.6 44.8 55.6 67.7 73.2 77.6 78.9 B (New York, USA) Jan Feb Mar Apr May Jun Jul Aug Sep Oct Nov Dec °C -0.4 0.5 5.0 10.2 15.5 20.7 24.1 23.7 19.7 13.8 8.4 2.5 Jan Feb Mar Apr May Jun Jul Aug Sep Oct Nov Dec mm 80.9 73.0 92.1 91.8 103.4 82.6 94.5 94.0 87.6 75.9 88.2 89.2 C (Toronto, Canada) Jan Feb Mar Apr May Jun Jul Aug Sep Oct Nov Dec °C -6.4 -5.6 -0.8 6.3 12.3 17.6 20.7 19.7 15.4 9.1 3.2 -3.3 Jan Feb Mar Apr May Jun Jul Aug Sep Oct Nov Dec mm 47.1 46.4 57.7 65.6 66.7 65.7 72.3 81.9 70.0 62.9 67.2 61.6 D (Sydney, Australia) Jan Feb Mar Apr May Jun Jul Aug Sep Oct Nov Dec °C 22.1 22.0 20.9 18.3 15.2 12.8 11.8 13.0 15.2 17.6 19.4 21.2 Jan Feb Mar Apr May Jun Jul Aug Sep Oct Nov Dec mm 103.4 111.0 131.3 129.7 123.0 129.2 102.8 80.3 69.3 82.6 81.4 78.2 E (Tokyo, Japan) Jan Feb Mar Apr May Jun Jul Aug Sep Oct Nov Dec °C 3.6 4.3 7.4 13.0 17.3 20.8 24.7 26.1 22.4 16.5 11.1 6.1 Jan Feb Mar Apr May Jun Jul Aug Sep Oct Nov Dec mm 49.9 71.5 106.4 129.2 144.0 176.0 135.6 148.5 216.4 194.1 95.6 54.4 F (Bagdad, Iraq) Jan Feb Mar Apr May Jun Jul Aug Sep Oct Nov Dec °C 9.4 11.8 16.2 21.6 27.7 32.3 34.6 34.2 30.8 24.9 17.2 11.1 Jan Feb Mar Apr May Jun Jul Aug Sep Oct Nov Dec mm 27.1 27.5 26.9 18.8 7.3 0.0 0.0 0.2 0.1 2.6 20.0 26.3 G (Cairo, Egypt) Jan Feb Mar Apr May Jun Jul Aug Sep Oct Nov Dec °C 13.8 15.2 17.4 21.4 24.7 27.3 27.9 27.9 26.3 23.7 19.1 15.1 Jan Feb Mar Apr May Jun Jul Aug Sep Oct Nov Dec mm 5.1 3.8 3.7 1.5 1.0 0.2 0.0 0.0 0.0 1.0 2.5 5.7
31

H (Bangkok, Thailand) Jan Feb Mar Apr May Jun Jul Aug Sep Oct Nov Dec °C 25.9 27.6 29.2 30.1 29.6 29.0 28.5 28.4 28.1 27.7 26.8 25.5 Jan Feb Mar Apr May Jun Jul Aug Sep Oct Nov Dec mm 10.6 28.2 30.7 71.8 189.4 151.7 158.2 187.0 319.9 230.8 57.3 9.4 I (Lima, Peru) Jan Feb Mar Apr May Jun Jul Aug Sep Oct Nov Dec °C 22.2 22.8 22.3 20.5 18.5 17.1 16.3 16.1 16.1 17.0 18.5 20.5 Jan Feb Mar Apr May Jun Jul Aug Sep Oct Nov Dec mm 1.2 0.9 0.7 0.4 0.6 1.8 4.4 3.1 3.3 1.7 0.5 0.7 J (Vancouver, Canada) Jan Feb Mar Apr May Jun Jul Aug Sep Oct Nov Dec °C 2.7 4.4 6.1 8.9 12.3 15.1 17.3 17.1 14.3 10.0 5.9 3.7 Jan Feb Mar Apr May Jun Jul Aug Sep Oct Nov Dec mm 145.7 121.4 102.3 69.2 55.8 47.1 31.3 37.0 59.6 116.3 154.6 171.5 K (Yellowknife, Canada) Jan Feb Mar Apr May Jun Jul Aug Sep Oct Nov Dec °C -27.9 -25.0 -18.2 -6.8 4.6 12.6 16.2 14.0 6.8 -1.4 -14.3 -23.9 Jan Feb Mar Apr May Jun Jul Aug Sep Oct Nov Dec mm 13.7 12.0 11.1 9.7 16.2 20.3 34.9 38.9 28.9 32.4 23.3 16.6 L (Cape Town, South Africa) Jan Feb Mar Apr May Jun Jul Aug Sep Oct Nov Dec °C 21.7 21.8 20.8 18.6 15.8 13.9 13.3 13.7 15.2 17.1 19.2 20.5 Jan Feb Mar Apr May Jun Jul Aug Sep Oct Nov Dec mm 15.9 15.2 21.6 49.5 91.7 105.4 91.2 82.6 54.3 39.6 24.2 19.3 M (San Jose, Costa Rica) Jan Feb Mar Apr May Jun Jul Aug Sep Oct Nov Dec °C 27.2 27.9 28.5 28.7 27.9 27.2 26.9 26.9 26.5 26.6 26.6 26.8 Jan Feb Mar Apr May Jun Jul Aug Sep Oct Nov Dec mm 6.9 2.7 6.1 32.8 199.2 240.0 183.0 243.1 308.7 53.0 18.7 32.7 N (Honolulu, USA) Jan Feb Mar Apr May Jun Jul Aug Sep Oct Nov Dec °C 22.7 22.7 23.5 24.3 25.2 26.3 26.9 27.4 27.2 26.4 25.1 23.3 Jan Feb Mar Apr May Jun Jul Aug Sep Oct Nov Dec mm 80.4 68.0 72.4 31.5 25.2 9.7 14.7 14.3 17.9 53.4 67.0 89.1 O (New Delhi, India) Jan Feb Mar Apr May Jun Jul Aug Sep Oct Nov Dec °C 14.1 16.9 22.4 28.6 32.9 3.8 31.0 29.8 29.2 26.0 20.3 15.4 Jan Feb Mar Apr May Jun Jul Aug Sep Oct Nov Dec mm 22.7 20.1 14.5 10.1 15.0 67.9 200.4 200.3 122.5 18.5 3.0 10.0
32

Climograph Template
360 55
340 50
320 45
300 40
280 35
260 30
240 25
220 20
200 15
180 10
160 5
140 0
120 -5
100 -10
80 -15
60 -20
40 -25
20 -30
Pre
cipi
tatio
n (m
m)
0 -35
Temperature ( oC
)
Jan Feb Mar Apr May Jun Jul Aug Sep Oct Nov Dec
Months
33

Julia Klepl
Activity 4.5: ArcGIS Lab - Running Hot and Cold: A global perspective Time: 140 min Description Students will build upon the material already covered in the unit by completing a ArcGIS module. They will explore characteristics of the earth’s tropical, temperate, and polar zones by analyzing monthly and annual temperature patterns in cities around the world, and observe patterns associated with climate controls.
Strand(s): Geographic Foundations: Space and Systems; Methods of Geographic Inquiry and Communication.
Overall Expectations
• Analyse the sources and nature of energy flows through the lithosphere, atmosphere, hydrosphere, and biosphere;
• Use the methods and tools of geographic investigation and inquiry to locate, gather, evaluate, and organize information.
Overall Expectations
• Explain how climatic controls act upon the elements of the atmosphere to produce the climatic zones of the earth;
• Identify selected physical features on the earth’s surface using various sources (e.g., geographic information systems [GIS]);
• Use a variety of geotechnologies to interpret, analyse, and synthesize information in connection with a geographic inquiry (e.g., geographic information systems [GIS]).
Prior Knowledge and Skills Students should know how to read maps, should have knowledge of the earth’s climate controls and climate zones, and should have general computer knowledge. Assessment and Evaluation of Student Achievement Assess the students’ abilities by walking around and viewing the students as they work on the computers. Worksheets and GIS layouts will be taken up and assessed, however assessment is formative and will not count towards the students final grade. Resources
• ERSI Module 3 package “Physical Geography II: Ecosystems, Climate, and Vegetation” - Lesson 1 “Running Hot and Cold: A global perspective.” (see Appendix)
34

Julia Klepl Activity 4.6: Climate, Soils and Vegetation Time: 2 x 70 min Description Soils tend to show a strong geographical correlation with climate, especially at the global scale. Climate also determines vegetation cover which in turn influences soil development. Students will research, discuss, and write reports on the relationship between climate, soils and vegetation. They will pretend that they are interested in purchasing farms in specific parts of the world and will investigate that region's weather and climate. Strand(s): Geographic Foundations: Space and Systems; Global Connections. Overall Expectations
• Analyse the sources and nature of energy flows through the lithosphere, atmosphere, hydrosphere, and biosphere;
• Explain the reasons for the global patterns of continents and oceans, landforms, climate, soils, and vegetation.
Specific Expectations
• Analyse the effects of natural variations in climate on the structure and composition of soils and vegetation of selected regions;
• Explain the relationships that link global patterns of landforms, climate, soils, and vegetation to each other;
• Compare global distribution patterns of climate, soils, and vegetation with patterns in their local bioregion.
Prior Knowledge and Skills Students should be familiar with the climate zones of the world and the climate controls that act upon them. Resources
• Student handout - Climate, Soils and Vegetation • Computer with Internet access • Overhead - World Climate Zone Map • Overhead – World Biomes • Overhead projector
Teaching and Learning strategies 1. Ask students the question: "What do you know about the things needed to grow crops?"
Write answers on the board (soil, water, sunlight, air, space). Hold a class discussion on students' current understanding of the relationship between climate and soils and vegetation cover. What types of crops grow in different parts of the world, and how does climate affect the decision to grow crops in different regions?
35

2. The climate and geography of a region determines what type of biome can exist in that region. Each biome consists of many ecosystems whose communities have adapted to the small differences in climate and the environment inside the biome. Hold a short investigation on the world’s biomes and how they compare to climate zones. Show the relationships between the two using overheads of a map of the world’s climate zones and a map of the world’s biomes.
3. In pairs, students will select a specific agricultural area in the world in which to buy their farm
• Brazilian Cerrado, • Fertile Crescent in Middle East, • Prairies in Canada/Russia • Mediterranean in the Mediterranean/California, • Golden horseshoe, • Cotton belt of usa/australia/africa/asia), etc.
4. They will then research the climate of that area, paying particularly attention to temperatures, precipitation levels and patterns, the length of a typical farming season, soil types and local vegetation. Also, they will find out how weather and climate affect farmers in general. Have them answer the following questions:
• What are the average high and low temperatures in January and July? • What is the average annual precipitation? • When does this region get most of its rainfall? • How has climate influenced the development of soil in the area? • Is there a period of the year when the farm will need to be fallow (e.g., the
coldest parts of the winter)? • How does weather affect other factors that are important for operating the farm,
such as insect reproduction, types of crops that will thrive, etc.? • What will be your greatest weather-related concerns? How will the weather
affect your operations?
The following Web sites may be helpful: Agriculture Online Weather Page http://www.agriculture.com/ag/weather/;jsessionid=Y103XQTMCELELQFIBQPSCAQForeign Agricultural Service http://www.pecad.fas.usda.gov/cropexplorer/The Weather Channel http://www.weather.com/ 5. Students will then write reports describing the specific weather- and climate-related issues
they will need to be aware of when running their farms. 6. Hold a closing class discussion on students' research findings. What interesting things have
they learned about climate and agriculture? If they were farmers, what would they need to keep in mind about climate and weather in order to ensure the success of their farms?
36

Assessment and Evaluation of Student Achievement Allow as many students as possible to contribute their ideas and take note of comprehension and involvement. Assess the students’ abilities by walking around and viewing the students as they conduct research. Reports will be taken up and assessed, with comments given, however assessment is formative and will not count towards the students final grade. Accommodations A prepared copy of the board notes will be provided for anyone who has trouble writing everything down in time. Because much of the lesson is designed to be completed in groups, pairing ELL students with more proficient students should provide support for the ELL students. A vocabulary list with key words such may also be helpful to ELL students. Reference Adapted from the Natrional Geographic Xpeditions lesson entitled “Weather and Agriculture.”
37
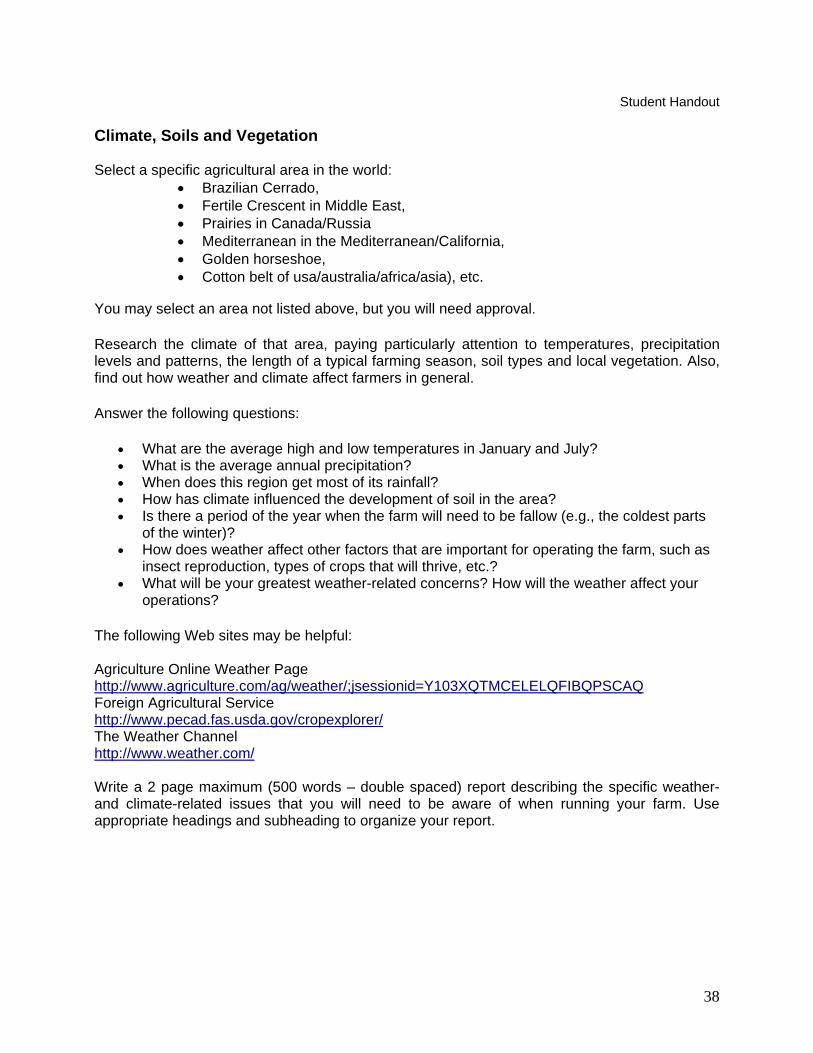
Student Handout Climate, Soils and Vegetation Select a specific agricultural area in the world:
• Brazilian Cerrado, • Fertile Crescent in Middle East, • Prairies in Canada/Russia • Mediterranean in the Mediterranean/California, • Golden horseshoe, • Cotton belt of usa/australia/africa/asia), etc.
You may select an area not listed above, but you will need approval.
Research the climate of that area, paying particularly attention to temperatures, precipitation levels and patterns, the length of a typical farming season, soil types and local vegetation. Also, find out how weather and climate affect farmers in general.
Answer the following questions:
• What are the average high and low temperatures in January and July? • What is the average annual precipitation? • When does this region get most of its rainfall? • How has climate influenced the development of soil in the area? • Is there a period of the year when the farm will need to be fallow (e.g., the coldest parts
of the winter)? • How does weather affect other factors that are important for operating the farm, such as
insect reproduction, types of crops that will thrive, etc.? • What will be your greatest weather-related concerns? How will the weather affect your
operations?
The following Web sites may be helpful: Agriculture Online Weather Page http://www.agriculture.com/ag/weather/;jsessionid=Y103XQTMCELELQFIBQPSCAQForeign Agricultural Service http://www.pecad.fas.usda.gov/cropexplorer/The Weather Channel http://www.weather.com/ Write a 2 page maximum (500 words – double spaced) report describing the specific weather- and climate-related issues that you will need to be aware of when running your farm. Use appropriate headings and subheading to organize your report.
38

Overhead World Climate Zone Map
39

Overhead World Biomes
40

Richard Pye Activity 4.7: Ocean and Glacier Effects on Weather and Climate Time: 280 min Description Inquiry based lesson on why oceans change weather and even climate both locally and around the world.
Strand(s): Geographic Foundations: Space and Systems; Understanding and Managing Change
Overall Expectations
• Analyse the causes and consequences of past and future climate change • Analyse changes in natural systems caused by natural phenomena • Explain the sources and nature of energy flows through the lithosphere, atmosphere,
hydrosphere, and biosphere
Specific Expectations
• Identify and describe the mechanisms of change within the lithosphere, atmosphere, hydrosphere, and biosphere
Prior Knowledge & Skills • Fundamental knowledge of oceans, density, and thermodynamics Planning Notes • Locating Good diagrams and Visual aids will assist comprehension • Research activity requires Internet access • Bring markers and chart paper for students to answer questions on during group work • Locate a video on El Nino and La Nina for a summary activity at the end of this section Teaching/Learning Strategies 1. Water Density, Ocean Currents, and Their Effects on Climate Students read: 170-72, 176, and 178-81 in small groups of 4-5 students. Together they
answer questions 1, 3, 5, and 6 on page 183.
A) Demonstrate on the board diagrams of water molecules in their three states, liquid, gas, and solid, to show their density. Gas is the least dense, and then ice, then water. Water's highest density is at 4oC. Review the Hydrologic Cycle.
B) Discuss how water with the highest density sinks and the lowest density rises.
Question: When ice forms in a lake why does it float? Most solids are denser than their liquid forms how is ice different?
41

C) Discuss how fresh water and salt water differ and why salt water behaves differently than
fresh water. Water that has a high salt concentration sinks. As water evaporates at the surface the salt concentration increases so the warm surface water begins to descend.
D) Discuss ocean currents and their general trends in the northern and southern hemispheres.
Discuss the Coriolis Effect and its influence on current direction in both hemispheres. E) Discuss El Nino and La Nina. Focus on the reverse of ocean currents and on the resulting
climate and weather changes. Introduce the main concepts from the text but allow students to do most of the discovery on specific case studies in the Activity from National Geographic below.
F) Discuss Tides and the role the Moon and Sun's gravity have on tides. Discuss the types
and frequency of tides. Explain that when the moon and sun both pull on the oceans in the same direction the tides are more intense.
Activity: National Geographic Xpeditions El Nino Students research and create a newspaper article on El Nino Using the following internet cites students are to: 1) Identify the effects of El Niño 2) Pose hypotheses about the occurrence of natural events 3) Identify relationships among patterns on a map 4) Write a newspaper article detailing the effects of El Niño Internet resources: http://www.cnn.com/SPECIALS/el.nino/http://kids.earth.nasa.gov/archive/nino/intro.htmlhttp://www.elnino.noaa.gov/http://www.elnino.noaa.gov/lanina.htmlhttp://www.nationalgeographic.com/elnino/ Assessment & Evaluation of Student Achievement
• Have the groups choose one event that was a manifestation of the 1998-1999 El Niño. Then have them write a newspaper article about it. The article can be straight news, or a feature story about the effects of El Niño.
• Have students compile their articles into a special newspaper feature section on El Niño. They can glue their articles onto large sheets of paper and add illustrations.
Extending the Lesson Have students write follow-up newspaper articles about the La Niña phenomenon that occurred in 1998. What were its effects? How did it compare and contrast to El Niño? ~Taken from www.nationalgeographic.com/xpeditions
42

2. Glaciers, Ice, and Show and Their Effects on Weather and Climate A) Discuss the different types of glaciers. Discuss how glaciers are formed from snow and how
snow changes into a special kind of ice layer that is a glacier. B) Discuss how glaciers move and the rate at which the melt versus the rate at which they are
created from snow. Introduce the concept of an Ice Age and its relationship to snow not melting in the summer. Discuss how snow reflects 80% of incoming solar radiation back to space whereas bare land or open seas only reflect 20%.
C) Discuss the possible causes of an Ice Age: eccentricity of orbit, earth’s tilt, and albedo.
Discuss what happens when snow fails to melt in the summer and how it causes a positive feedback loop on climate.
D) Discuss the effects of Global warming on snow both on mountains, ice caps, glaciers, and
how they affect global temperature, sea level, and fresh water supplies. F) Discuss permafrost and its effect on soil. Global warming is causing the permafrost to thaw
so discuss the implications to building structures and to soil. Research JigSaw Activity: Earth Matters p. 214 Using the chart provided on p. 214 students are to search the text or use the internet to discover the extent, description, impact on atmosphere, lithosphere, and biosphere, trends, and technology for monitoring snow cover, permafrost, sea ice, and glaciers. Because this is a large task use the collaborative learning jigsaw. Divide the class into 4 groups which each research 1) snow cover, 2) permafrost, 3) sea ice, 4) glaciers. Each group presents to the class what they found about their topic. National Geographic Video: Antarctica’s Big Meltdown Assessment & Evaluation of Student Achievement Formative assessment: chart and peer assessment of a paragraph. Extending the Lesson Students do a GIS lab on El Nino/La Nina entitled ‘Sibling Rivalry – An advanced investigation.’ They will document and identify patterns and characteristics associated with these phenomena, and then assess the impact these anomalies have on the global and local environment. Accommodations
• Diagrams could be used instead only using a textual explanation from the textbook. • Venn Diagrams and more exercise can be used to help students retain knowledge. • Use video resources to demonstrate actual places climate change has occured.
43

Resources
• Textbook: Earth Matters • ERSI Module 3 package “Physical Geography II: Ecosystems, Climate, and Vegetation” -
Lesson 3 ‘Sibling Rivalry – An advanced investigation’ (see Appendix) • Video: Antarctica’s Big Meltdown • Visit to an Ocean Planet Activities: http://sealevel.jpl.nasa.gov/education/activities.html
44
Jeremy Cruz, Laura Smith, Ryan Van Berkel
Grade 11 Physical Geography Unit 4 Cumulative Task Part II
Students will use GIS software ArcGIS to plot dangerous weather patterns that occur in their previously chosen locations (in Part I). Students will also plot urban/rural areas, areas of intense agriculture/forestry/fishing, and GDP. Where do the most dangerous weather patterns occur in your locations? • Use ArcGIS to plot dangerous weather patterns • Also plot urban and rural areas, GDP, and areas of intense
agricultur/forestry/fishing. Prepare a Portfolio � Make a hypothesis about how the cities will be affected by climate change in the
future, and support your hypothesis in an organized portfolio. � After you have made your hypothesis, and thoroughly analyzed both locations, make
a final decision as to which of the two locations would be a more favorable place to live.
……Include: � Include a table of contents, reference page (refer to the course outline), pictures,
tables, graphs, and any supporting research. � Use the library, and limited internet sources (no more than 2).
45

Jeremy Cruz, Laura Smith, Ryan Van Berkel Rubric - Culminating Task Part II
Criteria 80 – 100% (Level 4)
70 – 79% (Level 3)
60 – 69% (Level 2)
50 – 59% (Level 1)
Knowledge/Understanding Describe the origins,
distribution, and frequency of different kinds of storms (e.g., frontal depressions, hurricanes, tornadoes, thunderstorms);
10 marks
Portfolio describes 2 cities and identifies their geographical importance with a high degree of accuracy. Letter describes and explains the opinion of the selected dispute participant with a high degree of accuracy and relevancy.
Portfolio describes 2 cities and identifies their geographical importance with considerable accuracy. Letter describes and explains the opinion of the selected dispute participant with a considerable degree of accuracy and relevancy.
Portfolio describes 2 cities and identifies their geographical importance with some accuracy. Letter describes and explains the opinion of the selected dispute participant with some accuracy and relevancy.
Portfolio describes 2 cities and identifies their geographical importance with limited accuracy. Letter describes and explains the opinion of the selected dispute participant with limited accuracy and relevancy.
Thinking/Inquiry Describe the trade-offs for
humans living in areas that are subject to natural disruptions
10 marks
Uses appropriate methods of geographical inquiry and organizes and evaluates research with a high degree of effectiveness
Uses appropriate methods of geographical inquiry and organizes and evaluates research with considerable effectiveness
Uses appropriate methods of geographical inquiry and organizes and evaluates research with some effectiveness
Uses appropriate methods of geographical inquiry and organizes and evaluates research with limited effectiveness
Communication Communicate the results of
geographic inquiries and investigations, using appropriate terms and concepts and a variety of forms and techniques.
10 marks
Expresses ideas, arguments, and conclusions with a high degree of appropriateness Uses written, and visual forms with a high degree of effectiveness
Expresses ideas, arguments, and conclusions with considerable appropriateness Uses written, and visual forms with considerable effectiveness
Expresses ideas, arguments, and conclusions with some appropriateness Uses written, and visual forms with some effectiveness
Expresses ideas, arguments, and conclusions with limited appropriateness Uses written, and visual forms with limited effectiveness
Application Evaluate the impact on a
selected region of human-caused changes in atmospheric conditions (e.g., acid precipitation, smog, ozone depletion).
10 marks
Demonstrates an understanding of both cities and justifies city choice with a high degree of persuasiveness
Demonstrates an understanding of both cities and justifies city choice with considerable persuasiveness
Demonstrates an understanding of both cities and justifies city choice with some persuasiveness
Demonstrates an understanding of both cities and justifies city choice with limited persuasiveness
Total: / 40
Comments:
46

Laura Smith
Activity 4.8: Natural Disasters and their Effects on Weather and Climate Part 1
Time: 280 min Description
Students will analyze storms, tornadoes, and hurricanes through two different activities. Both activities will give students a basic understanding of natural disasters, their characteristics, definitions, descriptions, and their overall effects on weather and climate. These research based activities will serve as a preparation tool for part 2 of the cumulative task.
Strand(s): Global Connections; Understanding and Managing Change.
Overall Expectations
• Evaluate the role of technology in changing human environment relationships • Demonstrate and understanding of the importance of field verification of data collected
from remote sensing instruments
Specific Expectations
• Explain current methods and technologies used to track and predict weather, including dangerous phenomena such as hurricanes, thunderstorms, and tornadoes
Teaching and Learning Strategies Activity 4. 10 Hurricanes, Tornadoes, Earthquakes and their Effects on Weather and Climate PART ONE
1. Students will discuss what they already know about natural disasters and answer the questions determined by the teacher from Earth Matters.
2. Students will be placed into groups of three and are asked to define a natural disaster
assigned by the teacher. After ten minutes, the teacher will ask the students to discuss their answers.
3. The students will be brought to the library and (assumed computer lab within the library)
to research a natural disaster of their choice. They will be given the option of working alone or in a group to create a Bristol board project.
4. Bristol boards will be supplied by the student, and chart paper can be allotted to those
who do not have supplies. Posters must include written conclusions, pictures, diagrams, charts and a reference page outlining the materials that were used for the project.
5. The following class will be spent finishing the project. At the end of the class, the
students will be able to observe their fellow classmates work in a “gallery” setting.
47

Laura Smith
Activity 4.9: Hurricanes, Tornadoes, Earthquakes and their Effects on Weather and Climate Part 2
Teaching and Learning Strategies 1. Students will be introduced to GIS software, assuming that the school is equipped with
ArcView 3.0 or 9.0. 2. The students will complete the lab, with assistance of the teacher, “Ice Storm 1998”. (see
Appendix) 3. Two classes will be given to complete the lab, students must carefully follow the
instructions outlined on the lab.
Assessment and Evaluation of Student Achievement Formative assessment: Assignments will be assessed on completeness, content and creativity. The GIS lab will be marked specifically on whether or not the student gathered an understanding of the software and its uses. Accommodations
• There may need to be more time given for the Bristol Board Project. • Students may need individual help for the GIS ArcView Lab.
Resources
• Textbook: Earth Matters • ArcView 3.0 or 9.0 (Computer Software) and Ice Storm 1998 Lab • Assumed data sets needed for the lab already installed
48

Ice Storm 1998 Lab - Example
49

Jeremy Cruz Activity 4.10: The Greenhouse Effects on Global Warming Time: 280 min Description The purpose of this lesson is to develop awareness regarding the effects of human activity on climate and weather patterns. The main focus of this activity is for students to understand the current climate and weather issues and how those issues can be prevented with respect to human action. By completion of this task, students should be able to identify the main climatic/weather problems and understand the various obstructions that humans pose towards weather and climate.
Strand(s): Understanding and Managing Climate; Human-Environment interactions.
Overall Expectations
• Evaluate the impact of human life on the environment; • Explain the importance of stewardship and sustainability guiding principles for human
use of the physical environment; • Describe the effects of human activities (e.g., urban expansion, resource exploitation) on
various aspects of the environment; • Analyze ways in which human activities may increase or decrease the risks from natural
hazards; • Evaluate the impact on a selected region of human-caused changes in atmospheric
conditions (e.g., acid precipitation, smog, ozone depletion); • Evaluate the impact of human activities (e.g., deforestation, the burning of fossil fuels,
fertilizer use) on natural cycles. Prior Knowledge
Students must recollect previous lessons about the atmosphere, climate and weather. Furthermore, they must recall their knowledge of climate from the grade nine geography course. Planning Notes In order to complete this activity, visuals would be very effective for the lesson. Visuals depicting the greenhouse effect are examples. Also, photos displaying consequences of the human induced climate/weather issues (eg: smog, melted glaciers, dead animals, etc…) should be prepared. All handouts and activity instructions must be ready. Also, 2 computer lab period must be booked in order for students to conduct research (must have computers with internet access).
50

Teaching and Learning Strategies 1. Catch the students’ attention with the use of effective video and visuals. 2. Introduce the idea of the greenhouse effect. 3. Assign the students into groups in order to work on a mini research activity (see student
handout). 4. Mediate the class presentations. 5. Discuss further issues regarding global warming and human activity. 6. The students will understand the greenhouse effect and global warming and the
relationship to human actions. 7. The students will teach and learn the types of greenhouse gases to each other and
human involvement; shall understand how humans contribute to global warming. 8. The students will develop and understanding on how the population can combat issues
such as global warming.
51

Jeremy Cruz
Activity 4.11: Consequences of Greenhouse Effects and Local Weather Issues
Teaching and Learning Strategies 1. Discuss the consequences of global warming (e.g. rising sea levels). 2. Discuss local weather issues (e.g. smog, rain problems, ozone depletion). 3. Generally discuss human characteristics vs. weather/climate consequences (e.g.
human greed for money vs. the condition of our climate) and the difficulties in addressing climate awareness.
4. The student will understand the consequences of global warming – past, present,
future. 5. The student will develop an awareness regarding local issues in weather
patterns. 6. The student will understand the difficulties involved when addressing
weather/climate issues (e.g. political issues) Assessment and Evaluation of Student Achievement Teacher will observe the mini-presentations and class discussion. A Formative assessment will be used. Also, peer assessment may be considered. Accommodations
• Students who have attention difficulties may be grouped with those who do not have this problem.
• Students who have issues with record keeping will be given prepared notes.
Resources
• Video resource • Text book: Earth Matters • Two computer lab periods • Chart paper and markers
52

Student Handout
Student to Student Awareness! Task: You will be broken up into 5 or 6 different groups. Then, your group will be assigned a specific greenhouse gas. Immediately after that, you will research your gas and should be able to answer/discuss the following: 1. Definition of your term 2. Your gas’ contribution to global warming (example: does it warm the temperatures? Is it a
major greenhouse gas? Etc…) 3. How it is created and/or emitted into the atmosphere (include at least 3 ways). 4. Human Involvement (can be direct or indirect) 5. An interesting point about your gas. Upon completion of research, your group will effectively present their finding to the class. Also, you will provide the class with 4 notes to copy (using # 1-4 above, no longer than 5 sentences). If you are not presenting, you are responsible for writing down those notes. You will be provided with markers and chart paper to create your notes! Gases: CARBON DIOXIDE (CO2) METHANE (CH4) NITROUS OXIDE (N2O) FLUOROCARBONS (CFCs and PFCs) WATER (H2O) OZONE (O3)
53

ROUGHWORK
1. Definition. 2. Contribution to Global Warming. 3. How its created/emitted. 4. Human Involvement. 5. An Interesting Fact
54
Ryan Van Berkel
Activity 4.12: Climate Change and the Climate Challenge Time: 70 minutes Description This lesson/activity revolves around a fun, interactive game called the “Climate Challenge” on the BBC website. The game asks students to put themselves in the role of the president of the European Nations in a near future world. The goal of the game is to make environmentally sustainable and friendly choices and policies, in order to reduce the dangers of climate change, while also maintaining popularity with voters. While being fun for the students, the game also provides excellent review information and helps them see the connections between their choices as “president” and how those choices will affect the climate and the people of Europe.
Strand(s): Human-Environment Interactions; Understanding and Managing Change. Overall Expectations
• Evaluate the impact of human life on the environment; • Explain the importance of stewardship and sustainability as guiding principles for human
use of the physical environment; • Analyze the causes and consequences of climate change.
Specific Expectations
• Describe the trade-offs for humans living in areas that are subject to natural disruptions; • Describe the effects of human activities on various aspects of the environment; • Evaluate the role of technology in changing human-environment relationships.
Prior Knowledge
• As this is the final section of the unit, the students will have a good understanding of weather and climate and a fundamental knowledge of global warming trends/climate change.
• Students have practiced research and inquiry skills, as well as using the internet and computers.
Planning Notes
• LCD projector • Computer Lab access
55

Teaching and Learning Strategies 1. Teacher makes any necessary announcements to the class and introduces the day’s
activity; 2. Students log on to computer; 3. Teacher verbally provides instructions for the Climate Challenge game and how to
access it on the BBC website (http://www.bbc.net.uk/sn/hottopics/climatechange/climate_challenge/);
4. Students begin playing the game; 5. As students begin to finish their games, if time allows, the teacher will lean a short wrap-
up discussion on the game’s results and students strategies etc. Assessment and Evaluation of Student Achievement As this activity is intended to be a fun review prior to beginning the second culminating task, and is therefore not evaluated, although can be used as a diagnostic to determine if all students have a proper understanding of the curriculum before they begin their final project. Accommodations Students may need to work in pairs if there are not enough computers available for each to have their own. Resources BBC website (http://www.bbc.net.uk/sn/hottopics/climatechange/climate_challenge/)
56
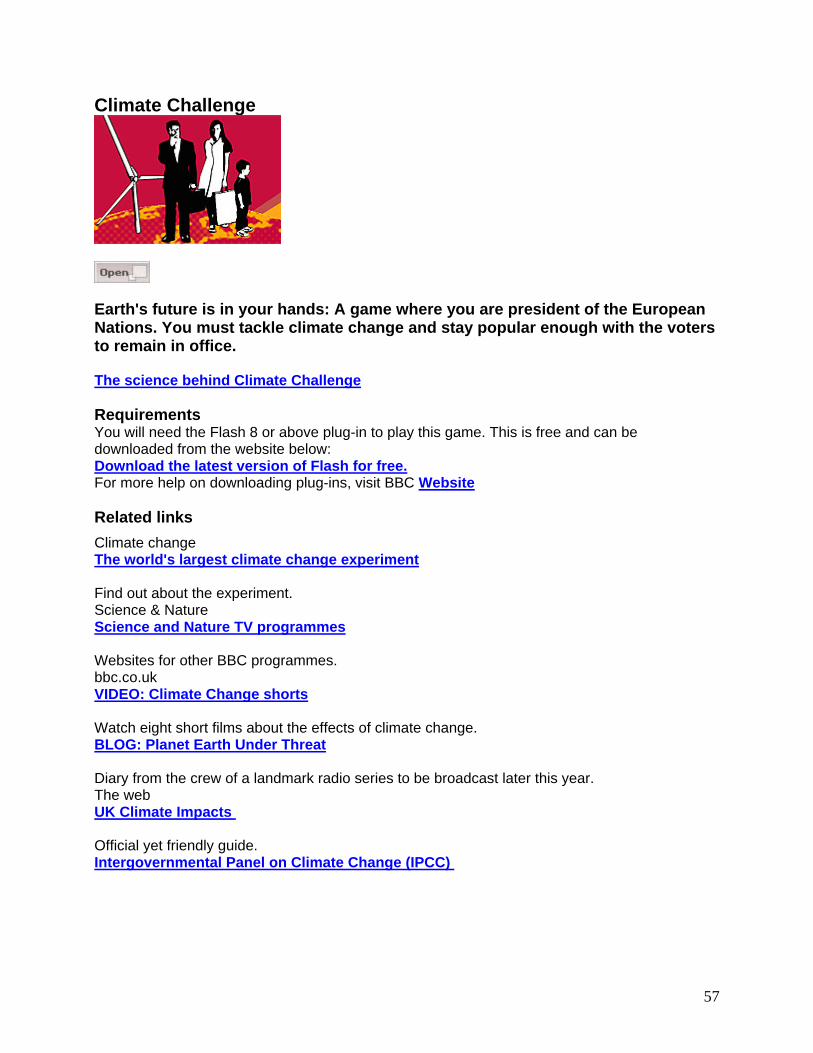
Climate Challenge
Earth's future is in your hands: A game where you are president of the European Nations. You must tackle climate change and stay popular enough with the voters to remain in office. The science behind Climate Challenge Requirements You will need the Flash 8 or above plug-in to play this game. This is free and can be downloaded from the website below: Download the latest version of Flash for free.For more help on downloading plug-ins, visit BBC Website Related links Climate change The world's largest climate change experiment Find out about the experiment. Science & Nature Science and Nature TV programmes Websites for other BBC programmes. bbc.co.uk VIDEO: Climate Change shorts Watch eight short films about the effects of climate change. BLOG: Planet Earth Under Threat Diary from the crew of a landmark radio series to be broadcast later this year. The web UK Climate Impacts Official yet friendly guide. Intergovernmental Panel on Climate Change (IPCC)
57

Activity 4.13: Taking Action - Attacking Climate Change Ryan Van Berkel Time: 210 min Description This lesson/activity will allow students, working in pairs, to take on the role of environmental activists or scientists who have been chosen to create an “Action Plan” for managing and reducing the negative effects of climate change on the economy (primarily resource based economies) of a certain area or region around the world (possibly a country, or large province etc.) by a government body, such as the Ministry of Environment or the Minister of Natural Resources.
Using the computer lab to conduct research, as well as drawing upon previous lessons on global warming and climate issues, the student’s will create a short presentation in which they explain the current damage to their region done by climate change, followed by their action plan on how to manage and reduce the damage caused in the future, with solid evidence as to why and how their solutions will work.
Strand(s): Geographic Foundations: Space and Systems; Human-Environment Interactions; Global Connections; Understanding and Managing Change; and Methods of Geographic Inquiry and Communication. Overall Expectations
• Evaluate the impact of human life on natural systems; • Explain the importance of stewardship and sustainability as guiding principles for human
use of the physical environment; • Explain the reasons for the global patterns of continents and oceans, landforms, climate,
soils, and vegetation; • Analyse the causes and consequences of climate change; • Use the methods and tools of geographic investigation and inquiry to locate, gather,
evaluate, and organize information; • Communicate the results of geographic inquiries and investigations, using appropriate
terms and concepts and a variety of forms and techniques.
Specific Expectations
• Identify the interconnections among natural systems (e.g., climate) within selected ecosystems;
• Describe the trade-offs for humans living in areas that are subject to natural disruptions; • Describe the effects of human activities (e.g., urban expansion, resource exploitation) on
various aspects of the environment; • Describe the potential effects of climate change on the sustainability of resource-based
industries (e.g., agriculture, forestry); • Explain the potential effects of long-term climate change (e.g., global warming) on
different parts of the world, including their local community; • Describe the difficulties involved in predicting climate change; • Evaluate the role of technology in changing human-environment relationships; • Use the methods and tools of geographic investigation and inquiry to locate, gather,
evaluate, and organize information; • Communicate the results of geographic inquiries and investigations, using appropriate
terms and concepts and a variety of forms and techniques.
58

Prior Knowledge and Skills • As this is the final section of the unit, the students will have a good understanding of
weather and climate and a fundamental knowledge of global warming trends/climate change.
• Students have practiced research and inquiry skills, as well as using the internet and computers.
Planning Notes
• TV and DVD or computer with DVD Rom and projector needed. • Computer lab access required for 2 consecutive days. • Show BC case study example.
Teaching/Learning Strategies Day 1:
• Teacher makes any necessary announcements to the class and introduces the day’s lesson/activity
• HOOK: Teacher begins Planet Earth “Into the Wilderness” clip (start DVD at 46 minute mark)
• Once the clip is finished, the teacher asks the class for opinions and comments and allows the students to share and discuss. The teacher will also pose 2 main questions to get the students thinking about climate change issues and the global economy. More discussion.
• Teacher hands out the “Taking Action: Attacking Climate Change” assignment and explains it and ensures all students have a clear understanding of the expectations.
• Teacher gives short explanation of how to find reputable and quality websites for research online, and what to avoid using.
• Teacher has students pair up with a partner and log onto a computer. • Students select a region of the world to study and begin researching their “action plan”
on a computer for the remainder of the class. • Teacher uses work time to monitor student’s progress and learning skills, such as
participation, initiative and co-operation. Day 2:
• Teacher makes any necessary announcements to the class and introduces the day’s work.
• Student pairs continue their research and planning for their oral presentation. • Students who have sufficient research and evidence etc. may begin to plan and work on
their presentation. • Teacher uses work time to monitor student’s progress and learning skills, such as
participation, initiative and co-operation. Day 3:
• Teacher makes any necessary announcements to the class and introduces the plan for the day.
• The rest of the class is devoted to students’ “Action Plan” Presentations.
59

Assessment and Evaluation Formative: Student’s learning skills will be assessed by the teacher during research/work
periods. Formal: The Action Plan presentations will be marked as a small term assignment, and will
be evaluated based on the achievement chart, with communication and application being considered most heavily.
Accommodations
• Teacher should be aware of any student(s) with limited or no computer/internet access at home and these students should be paired with ones who do have access outside of school.
• More research time may be needed for any pairs with limited computer access and the teacher should be aware and plan a time outside of regular class (before or after school, or on lunch) for the students use the computers at school.
Resources
• Text: Earth Matters • Websites:
- Global Climate Change – www.climatechange.gc.ca - Environment Canada – http://www.ec.gc.ca - Ministry of Environment – www.ene.gov.on.ca
- National Environmental Satellite, Data, and Information Service – http://ns.noaa.gov/NESDIS/NESDIS_Home.html- BBC - http://www.bbc.net.uk/sn/hottopics/climatechange/
60

Description Working in pairs, you will select a country or region any where in the world, particularly one that relies heavily on natural resources to sustain its economy (e.g. fisheries, forestry, tourism, agriculture). You and your partner will take on the role of environmental activists or scientists, who have been hired by the government of the area you selected to create an “Action Plan” to help manage your area’s natural resource economy in the face of increasing climate change dangers. Instructions 1. Chose a partner and select an area of the world to study. 2. Check with the teacher to ensure your world area is suitable and will be a feasible case
study. 3. Log onto a computer and begin researching your region. You should be looking for the
following information:
What resources does my region rely on? How are they currently being affected by climate change? Statistics on lost resources/damages due to climate change Interesting/informative visuals (pictures, diagrams, charts etc.) Ways to combat the negative climate change impacts Future climate change predictions for the region and it’s effects on the economy in the
future
4. After all class research time is complete, you and your partner will prepare a short presentation of your “Action Plan” (no longer than 12 minutes) that describes and outlines all of the information above. Each pair should also include some helpful visuals (either through a PowerPoint presentation, or on bristol board or some other display)
Evaluation You will be assessed on your learning skills and work habits during research time in the computer lab. The presentations will be marked according to the achievement chart. See attached rubric for criteria. Resources
• Your textbook • Websites:
- Global Climate Change – www.climatechange.gc.ca - Environment Canada – http://www.ec.gc.ca - Ministry of Environment – www.ene.gov.on.ca
61

- National Environmental Satellite, Data, and Information Service – http://ns.noaa.gov/NESDIS/NESDIS_Home.html
- BBC - http://www.bbc.net.uk/sn/hottopics/climatechange/- There are also many other government websites for many countries or provinces which
contain links to environment and economy related material.
Example response from case study of BC climate change and economy Forestry - Mountain Pine Beetle: The Problem: • In the winter, temperatures must consistently be below -35 Celsius or -40 Celsius for
several straight days to kill off large portions of mountain pine beetle populations
Consistent warming of winter temperatures due to climate change reduces likelihood of enough beetle larvas dying before spring to maintain proper levels.
• The cumulative area of B.C. affected to some degree by beetles is estimated at 13 million hectares (about four times the size of Vancouver Island)
Newly attacked trees turn red about one year after infestation. Trees stay in the red-attack stage for one to two years before turning grey as they lose their needles.
Solutions: • Reforestation… • Fuel Management… • Mountain Pine Beetle and Hydrology etc…
Mountain Pine Beetle
Pine showing damage from beetle infestation
62

module 3
Physical Geography II
Ecosystems, Climate, and Vegetation
Physical Geography II explores a variety of characteristics that influence climate: latitude, elevation, landforms, proximity to ocean, and the El Niño and La Niña events.
Running Hot and Cold: A global perspective
Students will explore characteristics of the earth’s tropical, temperate, and polar zones by analyzing monthly and annual temperature patterns in cities around the world. In the course of their investigation, students will observe temperature patterns associated with changes in latitude as well as differences caused by factors such as elevation and proximity to the ocean.
Seasonal Differences: A regional case study of South Asia
Students will observe patterns of monsoon rainfall in South Asia and analyze the relationship of those patterns to the region’s physical features. The consequences of monsoon season on human life will be explored by studying South Asian agri-cultural practices and patterns of population distribution.
Sibling Rivalry: An advanced investigation
Students will study climatic phenomena El Niño and La Niña by downloading map images from the GLOBE (Global Learning and Observations to Benefit the Environment) Web site. They will incorporate these images into an ArcMap map document and identify patterns and characteristics of these phenomena, then assess the impact these anomalies have on the global and local environment.


Running Hot and Cold
A global perspective
Lesson overview
Students will explore characteristics of the earth’s tropical, temperate, and polar zones by analyzing monthly and annual temperature patterns in cities around the world. In the course of their investigation, students will observe temperature patterns associated with changes in latitude as well as differences caused by factors such as elevation and proximity to the ocean.
Estimated time
Two to three 45-minute class periods
Materials
✔
Colored pencils
✔
Student handouts from this lesson to be copied:• Student handout (page 121)• Running Hot and Cold outline map of the world (page 122)• GIS Investigation sheets (pages 123 to 136)• Answer sheet (pages 137 to 143)• Assessment(s) (pages 144 to 147)
Standards andobjectives
National geography standards
GEOGRAPHY STANDARD MIDDLE SCHOOL HIGH SCHOOL
1
How to use maps and other geo-graphic representations, tools, and technologies to acquire, process, and report informa-tion from a spatial perspective
The student understands how to use maps, charts, and databases to analyze spatial distributions and patterns.
The student understands how to use technologies to represent and interpret Earth’s physical and human systems.
5
That people create regions to interpret Earth’s complexity
The student understands the ele-ments and types of regions.
The student understands the struc-ture of regional systems.
7
The physical processes that shape the patterns of Earth’s surface
The student understands how Earth–Sun relationships affect phys-ical processes and patterns on Earth.
The student understands spatial variation in the consequences of physical processes across Earth’s surface.
Module 3 Global perspective

118
Global perspective: Running Hot and Cold
Lesson overview and teacher notes
MODULE 3
• PHYSICAL GEOGRAPHY II: ECOSYSTEMS, CLIMATE, AND VEGETATION
Standards andobjectives
(continued)
Objectives
The student is able to:• Locate tropical, temperate, and polar zones.• Describe the characteristic yearly and monthly temperature patterns in those
zones.• Describe the influence of latitude, elevation, and proximity to the ocean on
yearly temperature patterns.• Compare and explain monthly temperature patterns in the Northern and
Southern hemispheres.
GIS skills and tools
• Turn layers on and off• Set the font, size, and style for feature labels• Turn feature labels on and off• Set the font, color, size, and style for text• Add text to the map• Activate a data frame• Display a graph• Set the selectable layers• Determine latitude and longitude of map features• Clear selected features on a map• Open an attribute table• Select records in a table• Sort records in a table• Freeze a field in a table• Clear selected records in a table
Change the font color
Zoom in on the map
Add new text to the map
Zoom to the full extent of the map
Select and move text on the map
Identify features to learn more about them
Add layers to the map
Select features on the map
Pan the map
Find features on the map

Lesson overview and teacher notes
Global perspective: Running Hot and Cold
119
MODULE 3
• PHYSICAL GEOGRAPHY II: ECOSYSTEMS, CLIMATE, AND VEGETATION
For more on geographic inquiry and these steps, see Geographic Inquiry and GIS (pages xxiii to xxv).
Teacher notes
Lessonintroduction
Begin the lesson by asking students to name places that they believe to be the
coldest and hottest on the planet. Briefly compare their choices and the reasoning behind them. Distribute the Running Hot and Cold student handout. Working in pairs or small groups, students should identify the planet’s three hottest cities in
July and the three coldest cities in January. At the end of five minutes, each
group should share their lists with the rest of the class. Use the blackboard or an
overhead projector to tally the cities mentioned as each group reports. Based on
the tally, circle the cities that were listed most often. Explain that they are going to do an activity that will explore temperature patterns in cities around the world.
As they complete the GIS Investigation, they will have an opportunity to check their answers on this handout and reconsider them in view of what they learn.
Before beginning the computer activity, engage students in a discussion about the cities that are circled on the list.• Why do you think this city is one of the coldest or hottest?• What countries are these cities located in?• Has anyone ever visited one of these cities?
Student activity Before completing this lesson with students, we recommend that you complete it as well. Doing so will allow you to modify the activity to accommodate the specific needs of your students.
After completing and discussing the Running Hot and Cold student handout, have your students work on the computer component of the lesson. Ideally, each student should be at an individual computer, but the lesson can be modified to accommodate a variety of instructional settings.
Distribute the GIS Investigation sheets to the students. Explain that in this activity they will use GIS to observe and analyze yearly and monthly tempera-ture patterns in cities around the world. The worksheets will provide them with detailed instructions for their investigations. As they investigate, they will iden-tify global and regional temperature variations and speculate on possible reasons for the patterns that they observe.

120
Global perspective: Running Hot and Cold
Lesson overview and teacher notes
MODULE 3
• PHYSICAL GEOGRAPHY II: ECOSYSTEMS, CLIMATE, AND VEGETATION
Teacher Tip: Step 9 asks students to rename their map document and save it. Make sure you inform your students on how to rename their map document and where to save it.
In addition to instructions, the worksheet includes questions to help students focus on key concepts.
Things to look for while the students are working on this activity:• Are the students using a variety of tools?• Are the students answering the questions as they work through the procedure?• Are the students experiencing any difficulty navigating between windows in
the map document?
Conclusion
When the class has finished the GIS Investigation, lead a discussion that summa-
rizes the conclusions they reached. Be sure to address latitude in the Northern
Hemisphere, latitude in the Southern Hemisphere, proximity to ocean, and eleva-tion as factors that influence temperature. After students have had an opportunity to share their conclusions, discuss the similarities and differences among the ideas
presented. Allow students to question each other and clarify confusing or contra-dictory statements. Develop a consensus about how each factor influences
temperature.
Assessment
In the middle and high school assessments, students will use the GIS Investiga-tion to draw conclusions about the factors that influence temperature patterns. They will write an essay offering data and examples from the GIS Investigation that support these statements.
Middle school students will be required to make a paper or ArcMap-generated map that illustrates the points of their essay. High school students will be required to use ArcMap only to make their maps.
Extensions
• Collect additional temperature data for cities in one specific world region. Use that data to create a regional version of this map document and analyze that data to create a regional temperature profile.
• Investigate the phenomenon of global warming. Use the Internet to collect
monthly temperature data for recent years in one or more of the cities included
in the map document. Compare actual recorded temperatures to average
monthly temperatures to see if current temperatures are warmer than average.
Compare changes in one region with global changes to see if there are differences.
• Collect rainfall data for the cities included in this map document. Use this data in combination with the temperature data to create an ArcMap layout that illustrates typical climate patterns for each of the climate types.
• Check out the Resources by Module section of this book’s companion Web site
(www.esri.com/mappingourworld)
for print, media, and Internet resources on the topics of climate and global temperatures.

Student handout
Global perspective: Running Hot and Cold
MODULE 3
• PHYSICAL GEOGRAPHY II: ECOSYSTEMS, CLIMATE, AND VEGETATION
121
PHOTO
C
OPY
NAME __________________________________________________ DATE _________________________
Running Hot and Cold
A map investigation
Directions: In the spaces below, list the three cities on the map on the next page that you believe are the hottest in July and the three cities that you believe are the coldest in January.
Hottest in July:
________________________________________________________________________________________
________________________________________________________________________________________
________________________________________________________________________________________
Coldest in January:
________________________________________________________________________________________
________________________________________________________________________________________
________________________________________________________________________________________

Global perspective: Running H
ot and Cold
Stu
den
t ha
nd
out
MO
DU
LE 3
•PH
YSIC
AL G
EOG
RAPH
Y II: EC
OSY
STEMS, C
LIMA
TE, AN
D V
EGETA
TION
122
PHOTO
C
OPY
NAME ________________________________________________________________ DATE ________________________________
Running Hot and Cold
Outline map of the world
Vancouver
Minneapolis
Miami
Quito
Buenos Aires
London
Helsinki
Tunis
Irkutsk
Lhasa
Singapore
Wellington
Khartoum

GIS investigation
Global perspective: Running Hot and Cold
MODULE 3
• PHYSICAL GEOGRAPHY II: ECOSYSTEMS, CLIMATE, AND VEGETATION
123
PHOTO
C
OPY
NAME __________________________________________________ DATE _________________________
Running Hot and Cold
A GIS investigation
Answer all questions on the student answer sheet handout
In this activity, you will analyze monthly and annual temperature patterns in cities around the world. You will explore how latitude, elevation, and proximity to the ocean influence tempera-ture patterns in the world’s tropical, temperate, and polar zones.
Step 1 Start ArcMap
a
Double-click the ArcMap icon on your computer’s desktop.
b
If the ArcMap start-up dialog appears, click
An existing map
and click OK. Then go to step 2b.

Global perspective: Running Hot and Cold
GIS investigation
MODULE 3
• PHYSICAL GEOGRAPHY II: ECOSYSTEMS, CLIMATE, AND VEGETATION
124
PHOTO
C
OPY
Step 2 Open the Global3.mxd file
a
In this exercise, a map document has been created for you. To open it, go to the File menu and choose
Open
.
b
Navigate to the module 3 folder (
C:\MapWorld9\Mod3
) and choose
Global3.mxd
(or
Global3
) from the list.
c
Click Open.
When the map document opens, you see a world map.
d
Turn on the Average Yearly Temperature layer.

GIS investigation
Global perspective: Running Hot and Cold
MODULE 3
• PHYSICAL GEOGRAPHY II: ECOSYSTEMS, CLIMATE, AND VEGETATION
125
PHOTO
C
OPY
Step 3 Observe annual world temperature patterns
The symbols on the map represent cities around the world. The color of each symbol reflects an average of temperatures recorded throughout the year in that city (in degrees Fahrenheit).
a
Look at the global temperature patterns displayed in the map.
b
Write three observations about the pattern of temperatures displayed on the map. Your observations should be global in scope, not focused on a specific country or city.
c
Click the check mark next to the Average Yearly Temperature layer to turn it off.
Step 4 Label the latitude zones
a
Turn on the Latitude and Longitude layer.
b
In the table of contents, right-click Latitude and Longitude and click Properties. Click the Labels tab.
c
At the top of the Labels tab, click the check box next to “Label features in this layer.” Notice that NAME is already chosen as the field to use for labeling.
d
In the Text Symbol section, use the drop-down arrows to set the font to Arial and the size to 9. Set the style to Bold.
e
Click OK.
The major latitude and longitude lines are labeled on the map.
Note: In order to display the label for the prime meridian, you may need to zoom in or enlarge your map document window.

Global perspective: Running Hot and Cold
GIS investigation
MODULE 3
• PHYSICAL GEOGRAPHY II: ECOSYSTEMS, CLIMATE, AND VEGETATION
126
PHOTO
C
OPY
For the purposes of this exercise, the areas between the major latitude lines repre-sent five zones of latitude. The table below names each latitude zone and the area it covers.
Now you will label each of these zones on your map.
f
On the Draw toolbar at the bottom of the ArcMap window, use the drop-down arrows to set the font to Arial, the size to 9, and the style to Bold.
Note: If you don’t see the Draw toolbar, right-click in the gray area near the top of the ArcMap window and click Draw to turn it on.
g
Click the Font Color drop-down arrow and choose a deep violet color.
h
Zoom in to the area between the Arctic Circle and the North Pole.
i
On the Draw toolbar, click the New Text tool. The cursor turns into a plus sign with the letter A when you move it over the map.
NAME OF LATITUDE ZONE AREA IT COVERS IS BETWEEN THESE LATITUDES
North Polar Zone Arctic Circle and North Pole
North Temperate Zone Tropic of Cancer and Arctic Circle
Tropical Zone Tropic of Cancer and Tropic of Capricorn
South Temperate Zone Tropic of Capricorn and Antarctic Circle
South Polar Zone Antarctic Circle and South Pole

GIS investigation Global perspective: Running Hot and Cold
MODULE 3 • PHYSICAL GEOGRAPHY II: ECOSYSTEMS, CLIMATE, AND VEGETATION
127
PHOTOCOPY
j Click the map somewhere above the Arctic Circle. A Text box appears.
k Type North Polar Zone in the box and press Enter. The North Polar Zone is now labeled in violet on the map.
l Label each of the remaining zones using the same procedure you used to label the North Polar Zone.
Note: You can use the scroll bar to the right of the map display or the Pan tool to move up or down on your map.
m Click the Full Extent button to see the whole world.
n In the table of contents, right-click Latitude and Longitude and click Label Features to turn off the latitude and longitude (black) labels. Now you are left with the new lati-tude zones (violet) labels.
Note: You can toggle labels on and off by right-clicking a layer and clicking Label Features. A check mark on the menu next to Label Features indicates that labels are turned on.
o Click the Select Elements tool. Click and drag any label on the map that you want to move. Move the labels so they cover ocean area and very little of the continents.
p Turn on the Average Yearly Temperature layer. Observe the temperature patterns as they correspond to the latitude zones.
q Click the Identify tool. The Identify Results window opens.
r Click the Layers drop-down arrow and choose Average Yearly Temperature.
s Use the Identify tool to click on cities and get the necessary information to complete the table on your answer sheet.
Remember: Each dot represents a city.
(1) Why do you think there aren’t any cities in the North or South Polar Zones?
(2) How is the North Temperate Zone different from the South Temperate Zone?
t Turn off Average Yearly Temperature and close the Identify Results window.

Global perspective: Running Hot and Cold GIS investigation
MODULE 3 • PHYSICAL GEOGRAPHY II: ECOSYSTEMS, CLIMATE, AND VEGETATION
128
PHOTOCOPY
Step 5 Observe climate distribution
a Click the Add Data button.
b Navigate to the module 3 layer files folder (C:\MapWorld9\Mod3\Data\LayerFiles). Select Climate.lyr and click Add.
The Climate layer displays the regions of the world characterized by different types of climate.
(1) Complete the table on your answer sheet.
(2) Which zone has the greatest number of climates?
c Turn on the Average Yearly Temperature layer.
Give an example of a city in each of the climate zones listed in the answer sheet.
Hint: Use the Identify tool to get the names of the different cities.
d Ask your teacher for instructions on how to rename and save this map document. Record the new name of the map document and its new location on your answer sheet.
e Ask your teacher if you should exit ArcMap now. Skip to step 6b if you are continuing to work.
f From the File menu, click Exit.
Step 6 Observe monthly temperature patterns in the Northern Hemisphere
a Start ArcMap and navigate to the folder where you saved your map document. Refer to your answer sheet for its name and location. Open the map document.
b In the table of contents, click the minus sign in front of the World Temperature Patterns data frame to collapse it.
c Click the plus sign in front of the World Cities data frame to expand it. Right-click World Cities and click Activate.

GIS investigation Global perspective: Running Hot and Cold
MODULE 3 • PHYSICAL GEOGRAPHY II: ECOSYSTEMS, CLIMATE, AND VEGETATION
129
PHOTOCOPY
You see a map centered on North America showing cities, rivers, and lakes. The symbol for Boston is highlighted on the map.
Note: If your map looks different than the one pictured above, use the Zoom In tool to drag a box around North America.
d Click the Tools menu, point to Graphs, and click Monthly Temperature.
The graph, Monthly Temperature, displays the monthly temperatures for Boston. You’re going to select additional cities on the map, but first you’ll reposition the graph and set the selectable layer to Cities.
e Click the graph’s title bar and drag it to a location where you can still see the map.
f At the bottom of the table of contents, click the Selection tab. Notice that one city (Boston) is selected.
g Click the check box for every layer except Cities to uncheck them.
h Click the Display tab to show the table of contents again.
i Click the Select Features tool.
j Click on Miami at the southern tip of Florida.
Note: Hold your mouse pointer over a city to display its name.
Notice that both the map and the graph have changed.
(1) What does the graph show now?
(2) What city is highlighted on the map?
k Hold down the Shift key and select Boston again on the map.
(1) What does the graph show now?
(2) What city or cities are highlighted on the map?
l Use the Monthly Temperature graph to compare the pattern of monthly temperatures in Miami to the pattern of monthly temperatures in Boston.
Complete the table on your answer sheet.
m Hold down the Shift key and click on the city northeast of Boston.
(1) What is the name of the city?
(2) How does its monthly temperature pattern differ from Boston’s?
n Hold down the Shift key and click on the closest city south of Miami.
(1) What is the name of the city?
(2) How does its monthly temperature pattern differ from Miami’s?
o List the name of each of the cities displayed in the graph and complete the information in the table on the answer sheet.

Global perspective: Running Hot and Cold GIS investigation
MODULE 3 • PHYSICAL GEOGRAPHY II: ECOSYSTEMS, CLIMATE, AND VEGETATION
130
PHOTOCOPY
Note: To find a city’s latitude, pause your cursor over the city symbol on the map. When you do this, the coordinates of that city are displayed on the status bar at the bottom of the ArcMap window. The coordinates are displayed in decimal degrees, which means that the coordinates are expressed as a decimal rather than in degrees, minutes, and seconds. Latitudes north of the equator and longitudes east of the prime meridian are positive numbers, whereas latitudes south and longitudes west are negative numbers.
p Based on the information displayed in the graph, the map, and the table on your answer sheet, state a hypothesis about how the monthly temperature patterns change as latitude increases.
Step 7 Test your hypothesis
a At the top of the ArcMap window, click the Selection menu and click Clear Selected Features.
Note: The Monthly Temperature graph now shows many lines. ArcMap graphs all of the features in the Cities layer when none are selected.
b Click the Pan tool. Click the map and pan over to Western Europe.
c Click the Find tool. The Find dialog displays.
d Type Stockholm in the Find text box and click Find. A record (row) displays in the white box at the bottom of the dialog.
e Right-click the row and click Select Feature(s). Stockholm is highlighted in blue on the map.
f Close the Find dialog.
g Click the Select Features tool. Hold down the Shift key and select three more European cities that are increasingly south of Stockholm. The city names appear in the graph and the cities are highlighted on the map.
Note: To unselect a city that you selected by mistake, hold down the Shift key and click on it. To make the legend on the graph more readable, enlarge the graph window by dragging any of its borders.
(1) Complete the table on the answer sheet.
(2) Do the cities you selected confirm or dispute your hypothesis? Explain.

GIS investigation Global perspective: Running Hot and Cold
MODULE 3 • PHYSICAL GEOGRAPHY II: ECOSYSTEMS, CLIMATE, AND VEGETATION
131
PHOTOCOPY
Step 8 Analyze temperature patterns in the Southern Hemisphere
You’ve already made a hypothesis about how latitude affects monthly temperature patterns in the Northern Hemisphere. Now you will explore the effect of latitude on the monthly temperature patterns within the Southern Hemisphere.
a Click the Selection menu and click Clear Selected Features.
b Click the Pan tool and reposition the map so it is centered on Australia.
c Click the Find tool to locate and select the city of Darwin as you did in steps 7d–7e.
d Close the Find dialog.
e Click the Select Features tool. Hold down the Shift key and click the three cities on Australia’s eastern and southern coasts.
Complete the table on your answer sheet.
f Based on the information displayed on the graph, the map, and the table you just completed, compare the monthly temperature patterns in the Southern Hemisphere to those in the Northern Hemisphere.
Formulate a hypothesis about the relationship between monthly temperature patterns and increases in latitude.
Step 9 Test your hypothesis on how latitude affects monthly temperature patterns in the Southern Hemisphere
a Click the Selection menu and click Clear Selected Features.
b Click the Pan tool and reposition the map so it is centered on Africa.
Hint: Zoom in or out to include all of Africa if you need to.
c Use the Find tool to locate Cape Town.
d Close the Find dialog.
e Select two or three more African cities located between Cape Town and the equator.
(1) Complete the table on your answer sheet.
(2) Based on your observations, do the cities you selected confirm or dispute your hypothesis about how latitude affects monthly temperature patterns in the Southern Hemisphere? Explain.
f Click the Selection menu and click Clear Selected Features.
g Reposition your map so it’s centered on North America.
h Ask your teacher if you should stop and exit ArcMap. If you should stop, be sure to save your changes. To exit ArcMap, click Exit from the File menu. If you do not need to exit ArcMap, proceed to the next step.

Global perspective: Running Hot and Cold GIS investigation
MODULE 3 • PHYSICAL GEOGRAPHY II: ECOSYSTEMS, CLIMATE, AND VEGETATION
132
PHOTOCOPY
Step 10 Investigate the ocean’s influence on temperature
In addition to latitude and hemisphere, a city’s proximity to the ocean also influences its temperature. Now you will investigate how the ocean influences the air temper-ature of coastal cities.
a Make sure that World Cities is the active data frame.
b One at a time, select all the cities in Canada.
(1) In which Canadian city would you experience the coldest winter temperatures?
(2) In which Canadian city would you experience the warmest winter temperatures?
(3) Looking at the map, why do you think the warmest city has temperatures that are so much warmer than the others in the winter? (Hint: How is this city different from all the others in terms of its location?)
c Clear the selected features.
d Reposition your map so that it is centered on Western Europe.
e In the table of contents, right-click Cities and click Open Attribute Table.
f Click the title bar for the Attributes of Cities table and move it so you can still see all of Western Europe on the map.
Hint: Use your mouse to resize the table if it is too big.

GIS investigation Global perspective: Running Hot and Cold
MODULE 3 • PHYSICAL GEOGRAPHY II: ECOSYSTEMS, CLIMATE, AND VEGETATION
133
PHOTOCOPY
g Click the column heading called Name. The heading looks like a button that’s been pushed in and the column highlights in blue.
h Right-click the column heading and click Sort Ascending to make the list alphabetical.
i Select Amsterdam in the list by clicking the small gray box in the first column of that row. The row that Amsterdam is in highlights in blue.
j Scroll down the list. Hold down the Ctrl key, and select the following cities, taking note of where each one is on the map as you select it: Berlin, Kiev, London, and Warsaw.
All of the cities are highlighted in the table and on the map, and they display on the graph.
k Move the table out of the way or minimize it if necessary so you can see the map and graph. Analyze the map and graph.
(1) Complete the table on your answer sheet.
(2) What do these cities have in common as to their location on the earth?
(3) Which cities have the mildest temperatures?
(4) What happens to the winter temperatures as you move from London to Kiev?
(5) Why do you think some cities have milder temperatures than the others?
l Take a look at how you answered the questions about the Canadian city tempera-tures (step 10b).
Based on your observations of Canada and Western Europe, state a hypothesis about the influence of proximity to the ocean (or distance from it) on patterns of temperature.

Global perspective: Running Hot and Cold GIS investigation
MODULE 3 • PHYSICAL GEOGRAPHY II: ECOSYSTEMS, CLIMATE, AND VEGETATION
134
PHOTOCOPY
Step 11 Investigate the impact of elevation on temperature patterns
Elevation of a city significantly affects the temperature of that city. In this step, you will investigate the relationship between elevation and temperature.
a Click the Full extent button.
b Restore the Attributes of Cities table if you minimized it.
c Scroll up in the table until you find the city of Kisangani. Click on the small gray box to the left of this record to select it.
d Hold down the Ctrl key, scroll down in the table, and select the following cities: Libreville, Quito, Singapore. Take note of where each one is on the map as you select it in the table.
e Move the table out of the way or minimize it so you can see the map and the graph.
(1) Complete the table on your answer sheet.
(2) What do these cities have in common as to their location on the earth?
(3) What temperature pattern do these four cities have in common?
(4) How is Quito different from the other three?
(5) Since all these cities are located on or very near the equator, what other factor could explain the difference in their temperature patterns?
f Restore the Attributes of Cities table if necessary.
g Click the Selected button at the bottom of the table. Only the selected records are displayed in the table.
h Right-click on the NAME column heading and click Freeze/Unfreeze Column. Scroll to the right until the ELEV_FT field is adjacent to the NAME field.
Analyze the selected records and complete the table on your answer sheet.
i Close the Attributes of Cities table.
j Compare the elevation table on your answer sheet to the graph on your computer.
Based on your observation of temperatures along the equator and the information in the table, state a hypothesis about the influence of elevation on patterns of temperature.
k Click the Selection menu and click Clear Selected Features.

GIS investigation Global perspective: Running Hot and Cold
MODULE 3 • PHYSICAL GEOGRAPHY II: ECOSYSTEMS, CLIMATE, AND VEGETATION
135
PHOTOCOPY
Step 12 Revisit your initial ideas
Before you began this GIS Investigation, you were asked to identify the three coldest cities in January and the three hottest cities in July from a map on which those cities were labeled.
a Take out the paper map you used at the beginning of the GIS Investigation.
b Select the 13 cities listed on your paper map in the Attributes of Cities table.
c Click the Selected button.
d Scroll to the right until you see the first column heading named J. (This is for January.) Note: The NAME field should still be frozen.
e Click the first J column heading to select it. The column is highlighted yellow.
f Right-click the J column heading and click Sort Ascending. The table is sorted from lowest (coldest) to highest (hottest) January temperatures.
g On your answer sheet, rank the 13 cities from coldest to hottest according to their average January temperatures.
h Scroll to the right in the table and click on the third column heading named J. (This is for July.)
i Right-click the J column heading and click Sort Descending. The table is sorted from highest to lowest July temperatures.
j On your answer sheet, rank the 13 cities from hottest to coldest according to their average July temperatures.
k Compare your original predictions from your paper map with the correct answers on your answer sheet.

Global perspective: Running Hot and Cold GIS investigation
MODULE 3 • PHYSICAL GEOGRAPHY II: ECOSYSTEMS, CLIMATE, AND VEGETATION
136
PHOTOCOPY
l On your answer sheet, put a check mark (✔ ) next to those answers that you predicted correctly.
m At the bottom of the attribute table, click the All button.
n Also at the bottom of the attribute table, click the Options button and click Clear Selection on the menu.
o Close the attribute table and the graph.
There are no cities selected on the map at this time.
Step 13 Exit ArcMap
Through this GIS Investigation, you explored temperature data from 96 world cities. You explored the different latitude zones and have identified the variety of climates in each zone. You made different hypotheses to explain temperature patterns, and tested each hypothesis. Now you know how latitude, hemisphere, proximity to the ocean, and elevation affect temperature patterns around the world.
a Save your changes.
b Exit ArcMap by choosing Exit from the File menu.

Student answers Global perspective: Running Hot and Cold
MODULE 3 • PHYSICAL GEOGRAPHY II: ECOSYSTEMS, CLIMATE, AND VEGETATION
137
PHOTOCOPY
NAME __________________________________________________ DATE ________________________
Student answer sheetModule 3Physical Geography II: Ecosystems, Climate, and Vegetation
Global perspective: Running Hot and Cold
Step 3 Observe annual world temperature patternsb Write three observations about the pattern of temperatures displayed on the map. Your observations
should be global in scope, not focused on a specific country or city.____________________________________________________________________________________
____________________________________________________________________________________
____________________________________________________________________________________
Step 4 Label the latitude zoness Use the Identify tool to get information on cities and complete the table below.
s-1 Why do you think there aren’t any cities in the North or South Polar Zones?____________________________________________________________________________________
____________________________________________________________________________________
____________________________________________________________________________________
ZONETYPICAL TEMPERATURE
RANGE
EXAMPLE CITY(IT REFLECTS TYPICAL
TEMPERATURES OF THAT ZONE)
ANOMALIES(CITIES THAT DO NOT FIT THE
PATTERN OF THEIR ZONE)
Tropical
North Temperate Zone
South Temperate Zone

Global perspective: Running Hot and Cold Student answers
MODULE 3 • PHYSICAL GEOGRAPHY II: ECOSYSTEMS, CLIMATE, AND VEGETATION
138
PHOTOCOPY
s-2 How is the North Temperate Zone different from the South Temperate Zone?___________________________________________________________________________________
___________________________________________________________________________________
___________________________________________________________________________________
Step 5 Observe climate distributionb-1 Complete the table.
b-2 Which zone has the greatest number of climates?___________________________________________________________________________________
c Give an example of a city in each of the following climate zones:Arid __________________________________________________________________
Tropical Wet __________________________________________________________________
Tropical Wet and Dry __________________________________________________________________
Humid Subtropical __________________________________________________________________
Mediterranean __________________________________________________________________
Marine __________________________________________________________________
Humid Continental __________________________________________________________________
Subarctic __________________________________________________________________
Highland __________________________________________________________________
d Write the new name you gave the map document and where you saved it.______________________________________ ______________________________________
(Name of map document. (Navigation path to where map document is saved.For example: ABC_Global3.mxd) For example: C:\Student\ABC)
Step 6 Observe monthly temperature patterns in the Northern Hemispherej-1 What does the graph show now?
___________________________________________________________________________________
j-2 What city is highlighted on the map? _______________________________________________________
k-1 What does the graph show now?___________________________________________________________________________________
k-2 What city or cities are highlighted on the map? ______________________________________________
LATITUDE ZONES CHARACTERISTIC CLIMATE(S)
Tropical zones
Temperate zones
Polar zones

Student answers Global perspective: Running Hot and Cold
MODULE 3 • PHYSICAL GEOGRAPHY II: ECOSYSTEMS, CLIMATE, AND VEGETATION
139
PHOTOCOPY
l Use the Monthly Temperature graph to complete the table below.
m-1 What is the name of the city? ______________________________________________________________
m-2 How does its monthly temperature pattern differ from Boston’s?____________________________________________________________________________________
____________________________________________________________________________________
n-1 What is the name of the city? _____________________________________________________________
n-2 How does its monthly temperature pattern differ from Miami’s?____________________________________________________________________________________
____________________________________________________________________________________
o List the name of each of the cities displayed in the graph and complete the information in the table below.
p Based on the information displayed in the graph, the map, and the table on your answer sheet, state a hypothesis about how the monthly temperature patterns change as latitude increases.____________________________________________________________________________________
____________________________________________________________________________________
Step 7 Test your hypothesisg-1 Complete the table below.
CITIES COLDEST MONTHLOWEST
TEMPERATURE HOTTEST MONTHHIGHEST
TEMPERATURE
TEMPERATURE RANGE OVER 12 MONTHS
Boston
Miami
CITY LATITUDECOLDEST MONTH
LOWEST TEMPERATURE
(°F)HOTTEST MONTH
HIGHEST TEMPERATURE
(°F)
TEMPERATURE RANGE OVER 12 MONTHS
Boston
Miami
CITY LATITUDE
Stockholm

Global perspective: Running Hot and Cold Student answers
MODULE 3 • PHYSICAL GEOGRAPHY II: ECOSYSTEMS, CLIMATE, AND VEGETATION
140
PHOTOCOPY
g-2 Do the cities you selected confirm or dispute your hypothesis? Explain.___________________________________________________________________________________
___________________________________________________________________________________
___________________________________________________________________________________
Step 8 Analyze temperature patterns in the Southern Hemispheree Complete the table below.
f Compare the monthly temperature patterns in the Southern Hemisphere to those in the Northern Hemisphere.___________________________________________________________________________________
___________________________________________________________________________________
___________________________________________________________________________________
Formulate a hypothesis about the relationship between monthly temperature patterns and increases in latitude.___________________________________________________________________________________
___________________________________________________________________________________
___________________________________________________________________________________
Step 9 Test your hypothesis on how latitude affects monthly temperature patterns in the Southern Hemispheree-1 Complete the table below.
e-2 Based on your observations, do the cities you selected confirm or dispute your hypothesis about how latitude affects monthly temperature patterns in the Southern Hemisphere? Explain.___________________________________________________________________________________
___________________________________________________________________________________
___________________________________________________________________________________
___________________________________________________________________________________
CITY LATITUDECOLDEST MONTH
LOWEST TEMPERATURE
(°F)HOTTEST MONTH
HIGHEST TEMPERATURE
(°F)
TEMPERATURE RANGE OVER 12 MONTHS
Darwin
CITY LATITUDE
Cape Town

Student answers Global perspective: Running Hot and Cold
MODULE 3 • PHYSICAL GEOGRAPHY II: ECOSYSTEMS, CLIMATE, AND VEGETATION
141
PHOTOCOPY
Step 10 Investigate the ocean’s influence on temperatureb-1 In which Canadian city would you experience the coldest winter temperatures?
____________________________________________________________________________________
b-2 In which Canadian city would you experience the warmest winter temperatures?____________________________________________________________________________________
b-3 Looking at the map, why do you think the warmest city has temperatures that are so much warmer than the others in the winter?____________________________________________________________________________________
____________________________________________________________________________________
____________________________________________________________________________________
____________________________________________________________________________________
k-1 Complete the table below.
k-2 What do these cities have in common as to their location on the earth?____________________________________________________________________________________
k-3 Which cities have the mildest temperatures?____________________________________________________________________________________
k-4 What happens to the winter temperatures as you move from London to Kiev?____________________________________________________________________________________
k-5 Why do you think some cities have milder temperatures than the others?____________________________________________________________________________________
l Based on your observations of Canada and Western Europe, state a hypothesis about the influence of proximity to the ocean (or distance from it) on patterns of temperature.____________________________________________________________________________________
____________________________________________________________________________________
____________________________________________________________________________________
____________________________________________________________________________________
CITY LATITUDE
London
Amsterdam
Berlin
Warsaw
Kiev

Global perspective: Running Hot and Cold Student answers
MODULE 3 • PHYSICAL GEOGRAPHY II: ECOSYSTEMS, CLIMATE, AND VEGETATION
142
PHOTOCOPY
Step 11 Investigate the impact of elevation on temperature patternse-1 Complete the table below.
e-2 What do these cities have in common as to their location on the earth?___________________________________________________________________________________
e-3 What temperature pattern do these four cities have in common?___________________________________________________________________________________
e-4 How is Quito different from the other three?___________________________________________________________________________________
e-5 Since all these cities are located on or very near the equator, what other factor could explain the difference in their temperature patterns?___________________________________________________________________________________
h Analyze the selected records and complete the table below.
j Based on your observation of temperatures along the equator and the information in the table above, state a hypothesis about the influence of elevation on patterns of temperature.___________________________________________________________________________________
___________________________________________________________________________________
___________________________________________________________________________________
___________________________________________________________________________________
CITY LATITUDE
Kisangani
Libreville
Quito
Singapore
CITY ELEVATION (FEET)
Kisangani
Libreville
Quito
Singapore

Student answers Global perspective: Running Hot and Cold
MODULE 3 • PHYSICAL GEOGRAPHY II: ECOSYSTEMS, CLIMATE, AND VEGETATION
143
PHOTOCOPY
Step 12 Revisit your initial ideasg Rank the 13 cities from coldest to hottest according to their average January temperatures.
1. ______________________________________ 8. _______________________________________
2. ______________________________________ 9. _______________________________________
3. ______________________________________ 10. _______________________________________
4. ______________________________________ 11. _______________________________________
5. ______________________________________ 12. _______________________________________
6. ______________________________________ 13. _______________________________________
7. ______________________________________
j Rank the 13 cities from hottest to coldest according to their average July temperatures.1. ______________________________________ 8. _______________________________________
2. ______________________________________ 9. _______________________________________
3. ______________________________________ 10. _______________________________________
4. ______________________________________ 11. _______________________________________
5. ______________________________________ 12. _______________________________________
6. ______________________________________ 13. _______________________________________
7. ______________________________________
l Put a check mark (✔ ) next to those answers that you predicted correctly.

Global perspective: Running Hot and Cold Student assessment: Middle school
MODULE 3 • PHYSICAL GEOGRAPHY II: ECOSYSTEMS, CLIMATE, AND VEGETATION
144
PHOTOCOPY
NAME ___________________________________________________ DATE _________________________
Running Hot and ColdMiddle school assessment
Part 1Use the ArcMap map document and your answer sheet to complete the tables below. For each city, circle each factor that influences its temperature pattern.
Part 2Use your GIS Investigation, Global3 map document, and other resources such as an atlas to write an essay that compares monthly and annual temperature patterns typical of the Tropical Zone and the North and South temperate zones. Your essay should provide example cities and data to support your conclusions.
Create a paper map or an ArcMap-generated map that illustrates the conclusions you make in your essay.
THREE HOTTEST CITIES IN JULY CIRCLE THE FACTORS THAT INFLUENCE TEMPERATURE PATTERNS
Latitude Proximity to the ocean Elevation
Latitude Proximity to the ocean Elevation
Latitude Proximity to the ocean Elevation
THREE COLDEST CITIES IN JANUARY CIRCLE THE FACTORS THAT INFLUENCE TEMPERATURE PATTERNS
Latitude Proximity to the ocean Elevation
Latitude Proximity to the ocean Elevation
Latitude Proximity to the ocean Elevation

145
Running Hot and Cold Assessment rubricMiddle school
Assessm
ent ru
bric: Mid
dle sch
oolG
lobal perspective: Running Hot and C
old
MO
DU
LE 3
•PH
YSIC
AL G
EOG
RAPH
Y II: EC
OSY
STEMS, C
LIMA
TE, AN
D V
EGETA
TION
This is a four-point rubric based on the National Standards for Geographic Education. The “Mastery” level meets the target objective for grades 5–8.
STANDARD EXEMPLARY MASTERY INTRODUCTORY DOES NOT MEET REQUIREMENTS
The student understands how to use maps, graphs, and databases to analyze spatial distributions and patterns.
Uses GIS to analyze various aspects of climate such as monthly and annual temperature and precipitation and identifies cities with specific climate charac-teristics. Creates a detailed map that illustrates the points high-lighted in the essay.
Uses GIS to analyze various aspects of climate such as monthly and annual temperature and precipitation and identifies cities with specific climate charac-teristics. Creates a map that illus-trates points highlighted in the essay.
With some assistance, can use GIS to analyze various aspects of cli-mate such as monthly and annual temperature and precipitation. Correctly identifies some cities with specific climate characteris-tics. Creates a map that illustrates some of the points highlighted in the essay.
Has difficulty using GIS to analyze various aspects of climate and identifying cities with specific cli-mate characteristics. Creates a map, but has difficulty illustrating the points highlighted in the essay.
The student understands the elements and types of regions.
Writes an essay and creates a map that shows clear understand-ing of the climate patterns for var-ious zones of Earth, including the Tropics and the North and South temperate zones.
Writes an essay and creates a map that shows an understanding of the climate patterns for various zones of Earth, including the Trop-ics and the North and South tem-perate zones.
Writes an essay and creates a map that shows some under-standing of climate patterns, but does not clearly define differences between different zones, or only identifies characteristics of some zones.
Writes an essay and creates a map that shows limited under-standing of climate patterns and cannot identify differences between various zones.
The student understands how Earth–Sun relation-ships affect physical pro-cesses and patterns on Earth.
Identifies key reasons and pro-vides clear examples of why cities experience variations in climate patterns at different latitudes, in different hemispheres, at differ-ent elevations, and at different distances from the ocean.
Identifies key reasons why cities experience variations in climate patterns at different latitudes, in different hemispheres, at differ-ent elevations, and at different distances from the ocean.
Identifies some key reasons why cities experience variations in cli-mate patterns due to some of the following: different latitudes, in different hemispheres, at differ-ent elevations, or at different dis-tances from the ocean.
Identifies one or two reasons why cities experience variations in cli-mate patterns at different lati-tudes, in different hemispheres, at different elevations, or at different distances to the ocean.

Global perspective: Running Hot and Cold Student assessment: High school
MODULE 3 • PHYSICAL GEOGRAPHY II: ECOSYSTEMS, CLIMATE, AND VEGETATION
146
PHOTOCOPY
NAME ___________________________________________________ DATE _________________________
Running Hot and ColdHigh school assessment
Part 1Use the ArcMap map document and your answer sheet to complete the tables below. For each city, circle each factor that influences its temperature pattern.
Part 2Use your GIS Investigation, Global3 map document, and other resources such as an atlas to write an essay that compares monthly and annual temperature patterns typical of the Tropical Zone and the North and South temperate zones. Your essay should provide example cities and data to support your conclusions.
Create an ArcMap-generated map that illustrates the conclusions you make in your essay.
THREE HOTTEST CITIES IN JULY CIRCLE THE FACTORS THAT INFLUENCE TEMPERATURE PATTERNS
Latitude Proximity to the ocean Elevation
Latitude Proximity to the ocean Elevation
Latitude Proximity to the ocean Elevation
THREE COLDEST CITIES IN JANUARY CIRCLE THE FACTORS THAT INFLUENCE TEMPERATURE PATTERNS
Latitude Proximity to the ocean Elevation
Latitude Proximity to the ocean Elevation
Latitude Proximity to the ocean Elevation

147
Running Hot and Cold Assessment rubricHigh school
Assessm
ent ru
bric: High
school
Global perspective: Running H
ot and Cold
MO
DU
LE 3
•PH
YSIC
AL G
EOG
RAPH
Y II: EC
OSY
STEMS, C
LIMA
TE, AN
D V
EGETA
TION
This is a four-point rubric based on the National Standards for Geographic Education. The “Mastery” level meets the target objective for grades 9–12.
STANDARD EXEMPLARY MASTERY INTRODUCTORY DOES NOT MEET REQUIREMENTS
The student understands how to use technologies to represent and interpret Earth’s physical and human systems.
Uses GIS to analyze various aspects of climate such as monthly and annual temperature, precipitation, elevation, and prox-imity to the ocean and identifies cities with specific climate charac-teristics. Uses GIS to create a detailed map that illustrates the points highlighted in the essay.
Uses GIS to analyze various aspects of climate such as monthly and annual temperature, precipitation, elevation, and prox-imity to the ocean and identifies cities with specific climate charac-teristics. Uses GIS to create a map that illustrates points highlighted in the essay.
With some assistance, can use GIS to analyze various aspects of cli-mate such as monthly and annual temperature and precipitation. Correctly Identifies some cities with specific climate characteris-tics. Uses GIS to create a map that illustrates some of the points highlighted in the essay.
Has difficulty using GIS to analyze various aspects of climate and identifying cities with specific cli-mate characteristics. Uses GIS to create a map, but has difficulty illustrating the points highlighted in the essay.
The student understands the structure of regional systems.
Writes an essay and creates a GIS-generated map that shows clear understanding of the climate pat-terns for various zones of Earth, including the Tropics and the North and South temperate zones.
Writes an essay and creates a GIS-generated map that shows an understanding of the climate pat-terns for various zones of Earth, including the Tropics and the North and South temperate zones.
Writes an essay and creates a GIS-generated map that shows some understanding of climate patterns, but does not clearly define differ-ences between different zones, or only identifies characteristics of some zones.
Writes an essay and creates a GIS-generated map that shows limited understanding of climate patterns and cannot identify differences between various zones.
The student understands spatial variation in the consequences of physical processes across Earth’s surface.
Identifies key reasons and pro-vides clear examples of why cities experience variations in climate patterns at different latitudes, in different hemispheres, at differ-ent elevations, and at different distances from the ocean.
Identifies key reasons why cities experience variations in climate patterns at different latitudes, in different hemispheres, at differ-ent elevations, and at different distances from the ocean.
Identifies some key reasons why cities experience variations in cli-mate patterns due to some of the following: different latitudes, in different hemispheres, at differ-ent elevations, or at different dis-tances from the ocean.
Identifies one or two reasons why cities experience variations in cli-mate patterns at different lati-tudes, in different hemispheres, at different elevations, or at different distances from the ocean.


Seasonal Differences
A regional case study of South Asia
Lesson overview
Students will observe patterns of monsoon rainfall in South Asia and analyze the relationship of those patterns to the region’s physical features. The consequences of monsoon season on human life will be explored by studying South Asian agri-cultural practices and patterns of population distribution.
Estimated time
Two to three 45-minute class periods
Materials
✔
Four large pieces of butcher paper
✔
Four or more markers
✔
Student handouts from this lesson to be copied:
• GIS Investigation sheets (pages 153 to 159)• Student answer sheets (pages 161 to 165)• Assessment(s) (pages 166 to 169)
Standards andobjectives
National geography standards
Objectives
The student is able to:• Describe the patterns of monsoon rainfall in South Asia.• Explain the influence of landforms on patterns of precipitation in South Asia.• Describe the impact of South Asia’s climate and physical features on
agriculture and population density in the region.
GEOGRAPHY STANDARD MIDDLE SCHOOL HIGH SCHOOL
1
How to use maps and other geo-graphic representations, tools, and technologies to acquire, process, and report informa-tion from a spatial perspective
The student understands how to use maps, graphs, and databases to analyze spatial distributions and patterns.
The student understands how to use technologies to represent and interpret Earth’s physical and human systems.
4
The physical and human char-acteristics of places
The student understands how physi-cal processes shape places.
The student understands the chang-ing human and physical characteris-tics of places.
15
How physical systems affect human systems
The student understands how varia-tions within the physical environ-ment produce spatial patterns that affect human adaptation.
The student understands how the characteristics of different physical environments provide opportunities for or place constraints on human activities.
Module 3 Regional case study

150
Regional case study: Seasonal Differences
Lesson overview and teacher notes
MODULE 3
• PHYSICAL GEOGRAPHY II: ECOSYSTEMS, CLIMATE, AND VEGETATION
GIS skills and tools
• Display graphs stored with the map document• Analyze graphs in relation to a map• Understand the relationship between a graph and a map• Set selectable layers• Rearrange layers in the table of contents• Turn layers on and off
For more on geographic inquiry and these steps, see Geographic Inquiry and GIS (pages xxiii to xxv).
Select features on a map
Measure distance on a map
Add layers to a map

Lesson overview and teacher notes
Regional case study: Seasonal Differences
151
MODULE 3
• PHYSICAL GEOGRAPHY II: ECOSYSTEMS, CLIMATE, AND VEGETATION
Teacher notes
Lessonintroduction
Tell your students that they are going to explore seasonal differences in South Asia. They may be surprised to learn that students in South Asia would proba-bly describe their year in terms of three seasons rather than four. Engage them in a discussion of local and personal perceptions and assumptions about seasons. Tack up four large pieces of butcher paper and have them list images, descrip-tions, and memories relating to each season.
• How does the physical environment change from season to season?• How are those changes reflected in the activities, foods, and clothing they may
have listed on the sheets?• To what extent do seasonal changes in their environment affect their day-to-
day lives?
Student activity Before completing this lesson with students, we recommend that you complete it yourself. Doing so will allow you to modify the activity to suit the specific needs of your students.
After the initial discussion, have the students work on the computer component of the lesson. Ideally, each student should be at an individual computer, but the lesson can be modified to accommodate a variety of instructional settings.
Distribute the GIS Investigation sheets to your students. Explain that in this
activity, they will use GIS to observe and analyze the variable patterns of rainfall in South Asia that result from the region’s seasonal monsoon winds. In South Asia
it is rainfall, rather than temperature, that defines the seasons. The activity sheets will provide them with detailed instructions for their investigations. As
they investigate, they will explore the relationship between South Asia’s monsoon
rains and its physical features and analyze the climate’s impact on agriculture and population.
In addition to instructions, the handout includes questions to help students focus on key concepts. Some questions will have specific answers while others require creative thought.
Things to look for while the students are working on this activity:
• Are the students using a variety of GIS tools?• Are the students answering the questions as they work through the procedure?• Are the students experiencing any difficulty working with multiple windows
and toggling between windows in the map document?
Conclusion
Use a projection device to display the Region3.mxd in the classroom. As a group, compare student observations and conclusions from the lesson. Students can take turns being the “driver” on the computer to highlight patterns and relationships that are identified by members of the class. Focus on the following concepts about South Asia’s monsoon climate in your discussion.• Rainfall is limited to one season of the year in South Asia except in the desert
west, where little rain falls at all. (This would be an excellent point at which to elaborate on the seasonal shift in monsoon winds that produces the patterns of rainfall students observed in the map document.)

152
Regional case study: Seasonal Differences
Lesson overview and teacher notes
MODULE 3
• PHYSICAL GEOGRAPHY II: ECOSYSTEMS, CLIMATE, AND VEGETATION
Conclusion(continued)
• Typically, the rainy season lasts from June through September, although the actual length of the season and amounts of rainfall vary across the subcontinent. (Be sure to note the orographic patterns of precipitation along India’s southwest coast and in northeast India on the southern slopes of the Himalayas.)
• Agricultural activities are directly related to patterns of rainfall.• In general, population density varies with patterns of rainfall. However, the
importance of South Asia’s rivers as an additional source of water for agri-culture is apparent from the high density of population along their paths.
Close the lesson by challenging the students to identify the three seasons in South Asia. In general these seasons are the following:• The rainy season (approximately June–September)• The dry lush season after the rains when everything is growing and green
(approximately October–January)• The dry dusty season before the rains come (approximately February–May)
Assessment
Middle school: Highlights skills appropriate to grades 5 through 8
Students will assume the role of an American student living for a year in South Asia as an exchange student. They can choose to live in or around Bombay, New Delhi, or Calcutta. They will write a letter to friends back home on October 1, January 1, April 1, and July 1. Their letter will describe seasonal changes in their location and ways that their daily lives and the lives of people around them reflect those changes.
High school: Highlights skills appropriate to grades 9 through 12
Students will assume the role of an American student traveling for a year in South Asia. They will write a letter to friends back home on October 1, January 1, April 1, and July 1. Each letter will be from a different South Asian city. Their letter will describe seasonal characteristics in each city and ways that their daily lives and the lives of people around them reflect those characteristics.
Extensions
• Use the Internet to find rainfall data for South Asian cities in specific years such as 1990, 1995, and 2000 to see if the average patterns observed in this project are relatively consistent or if they vary significantly from year to year.
• Import downloaded data into ArcMap.• Research South Asian farming methods to find out how activities such as
planting and harvesting are coordinated with patterns of rainfall.• Research the monthly and yearly rainfall patterns in your own location and
compare these to the patterns observed in South Asia.• Check out the Resources by Module section of this book’s companion Web site
(www.esri.com/mappingourworld)
for print, media, and Internet resources on the topics of South Asia and monsoons.

GIS investigation
Regional case study: Seasonal Differences
MODULE 3
• PHYSICAL GEOGRAPHY II: ECOSYSTEMS, CLIMATE, AND VEGETATION
153
PHOTO
C
OPY
NAME __________________________________________________ DATE _________________________
Seasonal Differences
A GIS investigation
Answer all questions on the student answer sheet handout
In this activity, you will analyze the variable patterns of precipitation in South Asia that result from the region’s seasonal monsoon winds. As you investigate those patterns, you will explore relationships between rainfall and physical features and analyze the climate’s impact on agriculture and population.
Step 1 Start ArcMap
a
Double-click the ArcMap icon on your computer’s desktop.
b
If the ArcMap start-up dialog appears, click
An existing map
and click OK. Then go to step 2b.

Regional case study: Seasonal Differences
GIS investigation
MODULE 3
• PHYSICAL GEOGRAPHY II: ECOSYSTEMS, CLIMATE, AND VEGETATION
154
PHOTO
C
OPY
Step 2 Open the Region3.mxd file
a
In this exercise, a map document has been created for you. To open it, go to the File menu and choose
Open
.
b
Navigate to the module 3 folder (
C:\MapWorld9\Mod3
) and choose
Region3.mxd
(or
Region3
) from the list.
c
Click Open.
When the map document opens, you see a map of South Asia.
d
Click the Tools menu, point to Graphs, and click Monthly Rainfall. A graph of monthly rainfall for the city of Bombay opens.
e
Click the graph’s title bar and position it anywhere on your desktop that does not cover your map. Stretch or shrink the ArcMap window if you need to.
f
Repeat step d to open the Annual Rainfall graph. Position it next to the Monthly Rainfall graph.

GIS investigation
Regional case study: Seasonal Differences
MODULE 3
• PHYSICAL GEOGRAPHY II: ECOSYSTEMS, CLIMATE, AND VEGETATION
155
PHOTO
C
OPY
Step 3 Observe patterns of rainfall
The map allows you to explore and compare variations in the patterns of rainfall throughout the South Asian region. Look at the map and notice that the city of Bombay is selected—it is highlighted blue. The graphs to the right display rainfall information for the selected city—in this case, Bombay.
a
Analyze the graphs and answer the following questions on your answer sheet.
(1) Which month gets the most rainfall in Bombay?
(2) Which months appear to get little or no rainfall in Bombay?
(3) Approximately how much rainfall does Bombay get each year (in inches)?
(4) Write a sentence summarizing the overall pattern of rainfall in Bombay in an average year.
b
At the bottom of the table of contents, click the Selection tab. Click the check boxes to uncheck all the layers except Cities.
c
Click the Display tab to return to the table of contents.
d
Click the Select Features tool. Click a dot for another city.
(1) How did this change the map?
(2) How did this change the graphs?
e
Click the city of Mangalore to select it in the map.
Analyze the graphs and fill in the Mangalore section of the table on your answer sheet.
f
Hold down the Shift key and click the cities of Bombay and Ahmadabad.
Note: To enlarge the graphs and make them easier to read, drag any border with your mouse.
(1) Complete the table on the answer sheet.
(2) As you move northward along the subcontinent’s west coast, how does the pattern of rainfall change?
(3) Although the monthly rainfall amounts differ, what similarities do you see among the overall rainfall patterns of these three cities?
Step 4 Compare coastal and inland cities
a
Make sure the Select Feature tool is still active and select Bangalore.
Use the Monthly Rainfall and Yearly Rainfall graphs to complete the table on your answer sheet.
b
Hold down the Shift key and select Mangalore.
How does the rainfall pattern of Bangalore compare with that of Mangalore?
c
Click the Measure tool. Your cursor turns into a right-angle ruler with crosshairs .

Regional case study: Seasonal Differences
GIS investigation
MODULE 3
• PHYSICAL GEOGRAPHY II: ECOSYSTEMS, CLIMATE, AND VEGETATION
156
PHOTO
C
OPY
d
Click the dot that represents Bangalore once, then move it to the dot that represents Mangalore and double-click.
Note: If you accidentally clicked the wrong spot, you can double-click to end the line and start over.
A segment and total length appear on the status bar at the bottom left of the ArcMap window.
What is the distance between the two cities?
Although Bangalore is located only a short distance inland from Mangalore, it receives far less rainfall than the coastal city.
e
Turn on the Physical Features layer.
How can this data help you explain the differences between patterns of rainfall in inland Bangalore and coastal Mangalore?
f
Turn off Physical Features.
Step 5 Compare eastern and western South Asian cities
a
Click the Select Features tool. One at a time, select the Afghan cities of Kabul and Herat.
(1) Analyze the graphs and complete the table on your answer sheet.
Note: Your first impression may be that the Afghan cities get a fair amount of rainfall. But, notice that the inches scale along the left side of each graph (y-axis) changed to reflect the rainfall range of the selected cities.
(2) Describe the pattern of rainfall in these two cities.
(3) How do you think Afghanistan’s rainfall pattern will affect the way of life in that country?
b
Select the eastern cities of Calcutta and Dhaka.
(1) Analyze the graphs and complete the table on your answer sheet.
(2) Describe the pattern of rainfall in these two cities.
c
Hold down the Shift key and select four cities: Calcutta, Dhaka, Herat, and New Delhi.
What is happening to the patterns of rainfall as you move from west to east across South Asia?
d
Click in the white space surrounding South Asia to unselect the four cities.
e
Close the Monthly Rainfall and Annual Rainfall graphs.

GIS investigation
Regional case study: Seasonal Differences
MODULE 3
• PHYSICAL GEOGRAPHY II: ECOSYSTEMS, CLIMATE, AND VEGETATION
157
PHOTO
C
OPY
Step 6 Observe yearly precipitation
You’ve already looked at the monthly precipitation patterns for individual cities
across South Asia. In this step, you will add data and look at the total yearly rainfall
for regions of South Asia.
a
Click the Add Data button.
b
Navigate to the module 3 layer files folder (
C:\MapWorld9\Mod3\Data\LayerFiles
).
c Select Yearly Rain.lyr. Click Add.
d Drag the layer down in the table of contents so that it is just below the Country Borders layer.
e Turn off the Cities layer and turn on Yearly Rain.
Amounts of rainfall are given in millimeters rather than inches. Here is a conversion table that compares millimeters to inches (25.4 mm. = 1 in.).
(1) Which regions within South Asia get the least rainfall?
(2) Which regions within South Asia get the most rainfall?
(3) In step 5c you were comparing Calcutta, Herat, New Delhi, and Dhaka. Does the map of yearly rainfall that is on your screen now reflect the observation you made at that time? Explain.
f Turn off Yearly Rain and turn on Physical Features.
What relationships do you see between South Asia’s patterns of yearly rainfall and its physical features?
MM 100 200 600 1,600 2,800 5,600 12,000
IN 3.9 7.9 23.6 62.9 110.2 220.5 472.4

Regional case study: Seasonal Differences GIS investigation
MODULE 3 • PHYSICAL GEOGRAPHY II: ECOSYSTEMS, CLIMATE, AND VEGETATION
158
PHOTOCOPY
Step 7 Explore the monsoon’s impact on agriculture and population density
a Turn on the Country Borders layer.
The rain patterns and physical features of an area have a significant impact on the way of life of the people who live there. Now you will look at those layers and deter-mine the kind of impact they have on individual countries.
b Turn the Physical Features and Yearly Rain layers on and off to make your observations and to answer the questions below.
(1) Which regions or countries of South Asia are suitable for agriculture and which are not? Explain.
(2) In which regions of South Asia do you expect to see the lowest population density? Explain.
(3) In which regions of South Asia do you expect to see the highest population density? Explain.
c Turn off Physical Features and Yearly Rain layers.
Now you will add agricultural data for the region and will see if your predictions are correct.
d Click the Add Data button. Navigate to the module 3 layer files folder (C:\MapWorld9\Mod3\Data\LayerFiles). Select Agriculture.lyr and click Add.
e Drag Agriculture down in the table of contents so that it is just below the Country Borders layer. Turn on the Agriculture layer.
(1) Does the agriculture layer reflect the predictions you made in step 7b? Explain.
(2) Why are grazing, herding, and oasis agriculture the major activities in Afghanistan?
(3) What do you know about rice cultivation that would help explain its distribution on the agriculture map?
(4) Is there any aspect of the agriculture map that surprised you? Explain.
f Turn off the Agriculture layer.
You will now examine population density in relation to precipitation and land use.
g Click the Add Data button. Navigate to the module 3 layer files folder (C:\MapWorld9\Mod3\Data\LayerFiles). Add Population Density.lyr.
h Drag Population Density below Country Borders in the table of contents.
i Turn on Population Density.
(1) Does the Population Density layer reflect the population predictions you made in step 7b? Explain.
(2) Why is Afghanistan’s population density so low?
(3) Since most of Pakistan gets little to no rainfall, how do you explain the areas of high population density in that country?
(4) What is the relationship between population density and patterns of precipitation in South Asia?
(5) What is the relationship between population density and physical features in South Asia?

GIS investigation Regional case study: Seasonal Differences
MODULE 3 • PHYSICAL GEOGRAPHY II: ECOSYSTEMS, CLIMATE, AND VEGETATION
159
PHOTOCOPY
Step 8 Exit ArcMap
In this GIS Investigation, you explored the patterns of monsoon rainfall in South Asia. You used ArcMap to compare monthly and annual patterns of precipitation in cities throughout the region and explore the relationship between those patterns and the region’s physical features. After analyzing this data, you added layers reflecting patterns of agriculture and population density and analyzed the relation-ship between those human characteristics and the region’s climate and landforms.
a Ask your teacher for instructions on where to save this ArcMap map document and on how to rename the map document.
b If you are not going to save the map document, exit ArcMap by choosing Exit from the File menu. When asked if you want to save changes to Region3.mxd (or Region3), click No.


Student answers Regional case study: Seasonal Differences
MODULE 3 • PHYSICAL GEOGRAPHY II: ECOSYSTEMS, CLIMATE, AND VEGETATION
161
PHOTOCOPY
NAME __________________________________________________ DATE ________________________
Student answer sheetModule 3Physical Geography II: Ecosystems, Climate, and Vegetation
Regional case study: Seasonal Differences
Step 3 Observe patterns of rainfalla-1 Which month gets the most rainfall in Bombay? _____________________________________________
a-2 Which months appear to get little or no rainfall in Bombay? ___________________________________
a-3 Approximately how much rainfall does Bombay get each year (in inches)? _______________________
a-4 Write a sentence summarizing the overall pattern of rainfall in Bombay in an average year.____________________________________________________________________________________
____________________________________________________________________________________
____________________________________________________________________________________
d-1 How did this change the map?____________________________________________________________________________________
____________________________________________________________________________________
d-2 How did this change the graphs?____________________________________________________________________________________
____________________________________________________________________________________
e Analyze the graphs and fill in the Mangalore section of the table below.
f-1 Complete the rest of the table in step e, above.
f-2 As you move northward along the subcontinent’s west coast, how does the pattern of rainfall change?____________________________________________________________________________________
____________________________________________________________________________________
f-3 Although the monthly rainfall amounts differ, what similarities do you see among the overall rainfall patterns of these three cities?____________________________________________________________________________________
____________________________________________________________________________________
CITY MONTHS WITH RAINFALLHIGHEST MONTHLY RAINFALL (INCHES)
TOTAL ANNUAL RAINFALL (INCHES)
Mangalore
Bombay
Ahmadabad

Regional case study: Seasonal Differences Student answers
MODULE 3 • PHYSICAL GEOGRAPHY II: ECOSYSTEMS, CLIMATE, AND VEGETATION
162
PHOTOCOPY
Step 4 Compare coastal and inland citiesa Complete the table below.
b How does the rainfall pattern of Bangalore compare with that of Mangalore?Similarities: ______________________________________________________________________________Differences: ____________________________________________________________________________
d What is the distance between the two cities? ________________________________________________
e How can this data help you explain the differences between patterns of rainfall in inland Bangalore and coastal Mangalore?___________________________________________________________________________________
___________________________________________________________________________________
___________________________________________________________________________________
___________________________________________________________________________________
___________________________________________________________________________________
___________________________________________________________________________________
___________________________________________________________________________________
___________________________________________________________________________________
Step 5 Compare eastern and western South Asian citiesa-1 Analyze the graphs and complete the table below.
a-2 Describe the pattern of rainfall in these two cities.___________________________________________________________________________________
___________________________________________________________________________________
a-3 How do you think Afghanistan’s rainfall pattern will affect the way of life in that country?___________________________________________________________________________________
___________________________________________________________________________________
b-1 Analyze the graphs and complete the table below.
CITY MONTHS WITH RAINFALLHIGHEST MONTHLY RAINFALL (INCHES)
TOTAL ANNUAL RAINFALL (INCHES)
Bangalore
CITY MONTHS WITH RAINFALLHIGHEST MONTHLY RAINFALL (INCHES)
TOTAL ANNUAL RAINFALL (INCHES)
Kabul
Herat
CITY MONTHS WITH RAINFALLHIGHEST MONTHLY RAINFALL (INCHES)
TOTAL ANNUAL RAINFALL (INCHES)
Calcutta
Dhaka

Student answers Regional case study: Seasonal Differences
MODULE 3 • PHYSICAL GEOGRAPHY II: ECOSYSTEMS, CLIMATE, AND VEGETATION
163
PHOTOCOPY
b-2 Describe the pattern of rainfall in these two cities.____________________________________________________________________________________
____________________________________________________________________________________
c What is happening to the patterns of rainfall as you move from west to east across South Asia?____________________________________________________________________________________
____________________________________________________________________________________
Step 6 Observe yearly precipitatione-1 Which regions within South Asia get the least rainfall?
____________________________________________________________________________________
____________________________________________________________________________________
e-2 Which regions within South Asia get the most rainfall?____________________________________________________________________________________
____________________________________________________________________________________
e-3 In step 5c you were comparing Calcutta, Herat, New Delhi, and Dhaka. Does the map of yearly rainfall that is on your screen now reflect the observation you made at that time? Explain.____________________________________________________________________________________
____________________________________________________________________________________
____________________________________________________________________________________
____________________________________________________________________________________
f What relationships do you see between South Asia’s patterns of yearly rainfall and its physical features?____________________________________________________________________________________
____________________________________________________________________________________
____________________________________________________________________________________
____________________________________________________________________________________
Step 7 Explore the monsoon’s impact on agriculture and population densityb-1 Which regions or countries of South Asia are suitable for agriculture and which are not? Explain.
____________________________________________________________________________________
____________________________________________________________________________________
____________________________________________________________________________________
____________________________________________________________________________________
b-2 In which regions of South Asia do you expect to see the lowest population density? Explain.____________________________________________________________________________________
____________________________________________________________________________________
____________________________________________________________________________________
____________________________________________________________________________________
b-3 In which regions of South Asia do you expect to see the highest population density? Explain.____________________________________________________________________________________
____________________________________________________________________________________
____________________________________________________________________________________
____________________________________________________________________________________

Regional case study: Seasonal Differences Student answers
MODULE 3 • PHYSICAL GEOGRAPHY II: ECOSYSTEMS, CLIMATE, AND VEGETATION
164
PHOTOCOPY
e-1 Does the Agriculture layer reflect the predictions you made in step 7b? Explain.___________________________________________________________________________________
___________________________________________________________________________________
___________________________________________________________________________________
___________________________________________________________________________________
e-2 Why are grazing, herding, and oasis agriculture the major activities in Afghanistan?___________________________________________________________________________________
___________________________________________________________________________________
___________________________________________________________________________________
___________________________________________________________________________________
e-3 What do you know about rice cultivation that would help explain its distribution on the agriculture map?___________________________________________________________________________________
___________________________________________________________________________________
___________________________________________________________________________________
___________________________________________________________________________________
e-4 Is there any aspect of the agriculture map that surprised you? Explain.___________________________________________________________________________________
___________________________________________________________________________________
___________________________________________________________________________________
___________________________________________________________________________________
i-1 Does the Population Density layer reflect the population predictions you made in step 7b? Explain.___________________________________________________________________________________
___________________________________________________________________________________
___________________________________________________________________________________
___________________________________________________________________________________
i-2 Why is Afghanistan’s population density so low?___________________________________________________________________________________
___________________________________________________________________________________
___________________________________________________________________________________
___________________________________________________________________________________
i-3 Since most of Pakistan gets little to no rainfall, how do you explain the areas of high population density in that country?___________________________________________________________________________________
___________________________________________________________________________________
___________________________________________________________________________________
___________________________________________________________________________________

Student answers Regional case study: Seasonal Differences
MODULE 3 • PHYSICAL GEOGRAPHY II: ECOSYSTEMS, CLIMATE, AND VEGETATION
165
PHOTOCOPY
i-4 What is the relationship between population density and patterns of precipitation in South Asia?____________________________________________________________________________________
____________________________________________________________________________________
____________________________________________________________________________________
____________________________________________________________________________________
i-5 What is the relationship between population density and physical features in South Asia?____________________________________________________________________________________
____________________________________________________________________________________
____________________________________________________________________________________
____________________________________________________________________________________

Regional case study: Seasonal Differences Student assessment: Middle school
MODULE 3 • PHYSICAL GEOGRAPHY II: ECOSYSTEMS, CLIMATE, AND VEGETATION
166
PHOTOCOPY
NAME ___________________________________________________ DATE _________________________
Seasonal DifferencesMiddle school assessment
For this activity, you are to assume the role of an American student who is spending a year living in South Asia as an exchange student. Your task is to write four letters to friends or family back home about your experiences and observations during your year in South Asia. Your four letters should be dated January 1, April 1, July 1, and October 1. Using the ArcMap map document as a guide, describe seasonal changes in your city and ways that your daily life and the lives of people around you reflect those changes. You may choose to spend your year in or near any one of the following locations: Bombay, Calcutta, or Dhaka. You may use additional sources such as your geography book, encyclopedias, and the Internet to help you develop your letters.
Use the space below to brainstorm for your essay.
January 1
April 1
July 1
October 1

167
Seasonal Differences Assessment rubricMiddle school
Assessm
ent ru
bric: Mid
dle sch
oolRegional case study: Seasonal D
ifferences
MO
DU
LE 3
•PH
YSIC
AL G
EOG
RAPH
Y II: EC
OSY
STEMS, C
LIMA
TE, AN
D V
EGETA
TION
This is a four-point rubric based on the National Standards for Geographic Education. The “Mastery” level meets the target objective for grades 5–8.
STANDARD EXEMPLARY MASTERY INTRODUCTORY DOES NOT MEET REQUIREMENTS
The student understands how to use maps, graphs, and databases to analyze spatial distributions and patterns.
Uses GIS as a tool to analyze the patterns of monsoon rains in South Asia through mapping and creating original charts based on the data provided. Accurately depicts the seasonal weather con-ditions in a given city.
Uses GIS as a tool to analyze the patterns of monsoon rains in South Asia through mapping and viewing charts. Accurately depicts most of the seasonal weather conditions in a given city.
Identifies patterns of precipita-tion on maps and charts using GIS. Accurately depicts some of the seasonal weather conditions for a given city.
Has difficulty identifying patterns of precipitation using maps and charts in GIS. Has difficulty depict-ing any seasonal weather condi-tions for the given city.
The student understands how physical processes shape places.
Shows understanding of the effects of seasonal rains and other climate factors on the characteris-tics of many South Asian cities throughout an entire year. Cre-atively incorporates this into each letter.
Shows understanding of the effects of seasonal rains and other climate factors on the characteris-tics of one particular South Asian city throughout an entire year. Incorporates this into each letter.
Shows limited understanding of the effects of seasonal rains on the characteristics of one particu-lar South Asian city throughout an entire year. Incorporates some of this information into each letter.
Attempts to describe seasonal cli-mate changes in the region of South Asia. Has difficulty incorpo-rating this information into each letter.
The student understands how variations within the physical environment pro-duce spatial patterns that affect human adaptation.
Uses great detail and specific examples to illustrate the impact of seasonal climate changes on the daily life of people in a variety of South Asian cities throughout an entire year. Creatively incorpo-rates this into each letter.
Clearly illustrates the impact of seasonal climate changes on the daily life of people in a particular South Asian city throughout an entire year. Incorporates this into each letter.
Shows limited understanding of the impact of seasonal climate changes on the daily life of people in a particular South Asian city throughout an entire year. Incor-porates some of this information into each letter.
Attempts to describe the impact of seasonal climate changes on the daily life of people in South Asia. Has difficulty incorporating this information into each letter.

Regional case study: Seasonal Differences Student assessment: High school
MODULE 3 • PHYSICAL GEOGRAPHY II: ECOSYSTEMS, CLIMATE, AND VEGETATION
168
PHOTOCOPY
NAME ___________________________________________________ DATE _________________________
Seasonal DifferencesHigh school assessment
For this activity you are to assume the role of an American student who is spending a year traveling in South Asia. Your task is to write four letters to friends or family back home about your experiences and observations during your year abroad. Each letter should be written from a different South Asian city. Your four letters should be dated January 1, April 1, July 1, and October 1. Using the ArcMap map document as a guide, describe seasonal characteristics of each city on the date you are writing and ways that your daily life and the lives of people around you reflect those characteristics. You may use additional sources such as your geography book, encyclopedias, and the Internet to help you develop your letters.
Use the space below to brainstorm for your essay.
January 1
April 1
July 1
October 1

169
Seasonal Differences Assessment rubricHigh school
Assessm
ent ru
bric: High
school
Regional case study: Seasonal Differences
MO
DU
LE 3
•PH
YSIC
AL G
EOG
RAPH
Y II: EC
OSY
STEMS, C
LIMA
TE, AN
D V
EGETA
TION
This is a four-point rubric based on the National Standards for Geographic Education. The “Mastery” level meets the target objective for grades 9–12.
STANDARD EXEMPLARY MASTERY INTRODUCTORY DOES NOT MEET REQUIREMENTS
The student understands how to use technologies to represent and interpret the earth’s physical and human systems.
Uses GIS as a tool to analyze the patterns of monsoon rains in South Asia through mapping and creating original charts based on the data provided. Accurately depicts the seasonal weather con-ditions in the four cities.
Uses GIS as a tool to analyze the patterns of monsoon rains in South Asia through mapping and viewing charts. Accurately depicts most of the seasonal weather conditions in the four cities.
Identifies patterns of precipita-tion on maps and charts using GIS. Accurately depicts some of the seasonal weather conditions for some of the cities.
Has difficulty identifying patterns of precipitation using maps and charts in GIS. Has difficulty depict-ing the seasonal weather condi-tions for the cities.
The student understands the changing human and physical characteristics of places.
Shows understanding of the effects of seasonal rains and other climate factors on the characteris-tics of four South Asian cities. Describes the seasonal changes for an entire year for each city. Creatively incorporates this into each letter.
Shows understanding of the effects of seasonal rains and other climate factors on the characteris-tics of four different South Asian cities throughout an entire year (one city for each season). Incor-porates this into each letter.
Shows limited understanding of the effects of seasonal rains on the characteristics of one or two South Asian cities throughout an entire year. Incorporates some of this information into each letter.
Attempts to describe seasonal climate changes in the region of South Asia. Has difficulty incorpo-rating this information into each letter.
The student understands how the characteristics of different physical environ-ments provide opportuni-ties for or place constraints on human activities.
Uses great detail and specific examples to illustrate the impact of seasonal climate changes on the daily life of people in four South Asian cities. Describes the seasonal changes for an entire year for each city. Creatively incor-porates this into each letter.
Clearly illustrates the impact of seasonal climate changes on the daily life of people in four differ-ent South Asian cities throughout an entire year (one city for each season). Incorporates this into each letter.
Shows limited understanding of the impact of seasonal climate changes on the daily life of people in one or two South Asian cities throughout an entire year. Incor-porates some of this information into each letter.
Attempts to describe the impact of seasonal climate changes on the daily life of people in South Asia. Has difficulty incorporating this information into each letter.


Sibling Rivalry
An advanced investigation
Lesson overview
Students will study climatic phenomena El Niño and La Niña by downloading map images from the GLOBE (Global Learning and Observations to Benefit the Environment) Web site. They will incorporate these images into an ArcMap map document and identify patterns and characteristics of these phenomena, then assess the impact these anomalies have on the global and local environment.
Estimated time
One to two 45-minute class periods
Materials
✔
Internet access
✔
Student handouts from this lesson to be copied:• GIS Investigation sheets (pages 175 to 180)• Student answer sheets (pages 181 to 184)
Standards andobjectives
National geography standards
Objectives
The student is able to:• Create online maps using GLOBE datasets and download map images into
ArcView for analysis.
• Compare and contrast various controls of climate to determine characteristics of El Niño and La Niña weather patterns.
• Describe the potential impact of El Niño at a global, regional, and local level.
GEOGRAPHY STANDARD MIDDLE SCHOOL HIGH SCHOOL
7
The physical processes that shape the patterns of Earth’s surface
The student understands how to predict the consequences of physi-cal processes on Earth’s surface.
The student understands the dynamics of the four basic components of Earth’s physical systems: the atmosphere, bio-sphere, lithosphere, and hydrosphere.
15
How physical systems affect human systems
The student understands human responses to variations in physical systems.
The student understands strategies to respond to constraints placed on human systems by the physical environment.
18
How to apply geography to interpret the present and plan for the future
The student understands how to apply the geographic point of view to solve social and environmental problems by making geographically informed decisions.
The student understands how to use geographic knowledge, skills, and perspectives to analyze prob-lems and make decisions.
Module 3 Advanced investigation

172
Advanced investigation: Sibling Rivalry
Lesson overview and teacher notes
MODULE 3
• PHYSICAL GEOGRAPHY II: ECOSYSTEMS, CLIMATE, AND VEGETATION
GIS skills and tools
• Create maps using the GLOBE Web site and download them• Georeference GLOBE map images using a world file• Add georeferenced images to ArcMap• Analyze images to determine temperature and precipitation patterns • Compare images and feature classes
For more on geographic inquiry and these steps, see Geographic Inquiry and GIS (pages xxiii to xxv).
Teacher notes
Lessonintroduction
Begin the lesson with a brainstorming session on what El Niño is. Record your
students’ responses on the board. Discuss their ideas: identify correct impressions
and important points. Be sure to record this information in a way and place that will allow your students to compare investigative findings with preconceptions.
After the initial discussion, provide a brief overview of what El Niño and La Niña are. Use the section of the companion Web site (
www.esri.com/mappingourworld
)
to locate additional information if you need it. Explain to the students that in the following GIS Investigation, they will be making observations and comparing El Niño to its countervariation, La Niña.
Student activity Before completing this lesson with students, we recommend that you complete it yourself. Doing so will allow you to modify the activity to suit the specific needs of your students. The lesson is designed for students working individually at the computer, but it can be modified to accommodate a variety of instructional settings.
Distribute the GIS Investigation sheets to the class. Explain that this investiga
-tion will have them create maps on the Internet using data from the GLOBE Web
site. The GLOBE program is a joint effort between several U.S. agencies: NASA
(National Aeronautics and Space Administration), NSF (National Science Founda-tion), and the U.S. State Department, along with more than 100 other countries, to bring real-world environmental science into the classroom. The data displayed at the GLOBE site is a combination of the work of students from around the world
Add layers to a map
Zoom in to specific areas of a map

Lesson overview and teacher notes
Advanced investigation: Sibling Rivalry
173
MODULE 3
• PHYSICAL GEOGRAPHY II: ECOSYSTEMS, CLIMATE, AND VEGETATION
and scientists using techniques ranging from visual observation with the naked eye to analysis of data from satellites. GLOBE has a special series of maps dedi-cated to observation of El Niño and La Niña global events. Your students will
create maps online, then download the images into ArcMap with the GIS Investi-
gation as their guide. They will then be free to download other maps and data that might help them to predict the overall impact of El Niño.
The GIS Investigation has the students saving images from the Internet into a folder named Images in the module 3 data folder. If you would like students to save to another location, be sure to provide them instruction on where and how to save.
Step 5 can be done as part of the assessment. It includes instructions for down-loading additional images to analyze El Niño and La Niña.
Things to look for while the students are working on this activity:
• Are students selecting appropriate datasets for gaining an understanding of El Niño and La Niña?
• Are they saving their images into an appropriate folder?
Conclusion
After students have identified a variety of characteristics of El Niño and La Niña,
have them share their observations with the class. Compare those observations with notes from the original discussion.
Assessment
Middle school: Highlights skills appropriate to grades 5 through 8
Students will write an essay that describes the effects of El Niño and La Niña years on their local area or an area you designate for research. Their observa-tions should be focused on weather patterns (temperature and precipitation). They should provide data and printed maps to support their findings.
High school: Highlights skills appropriate to grades 9 through 12
Students will write an essay that describes the effects of El Niño and La Niña
years on their local area or an area you designate for research. Their observations should include weather patterns (temperature and precipitation) and other factors that affect the local economy. For example, if the research area is highly agricul-tural, then greater than normal rainfall could cause damage to crops. They should provide data and printed maps to support their findings.
Extensions
• Download local precipitation and temperature data for the past 10 years. Identify patterns and attempt to predict future weather events based on historic patterns.
• Have students collect and enter their local climate data into ArcMap for analysis.
• Select a region as unlike your own as possible, and have students study the consequences of El Niño in an unfamiliar setting.
• Check out the Resources by Module section of this book’s companion Web site
(www.esri.com/mappingourworld)
for print, media, and Internet resources on the topics of El Niño, La Niña, and the Southern Oscillation.


GIS investigation
Advanced investigation: Sibling Rivalry
MODULE 3
• PHYSICAL GEOGRAPHY II: ECOSYSTEMS, CLIMATE, AND VEGETATION
175
PHOTO
C
OPY
NAME __________________________________________________ DATE ________________________
Sibling Rivalry
An advanced investigation
Note: Due to the dynamic nature of the Internet, the URLs listed in this lesson may have changed, and the graphics shown below may be out of date. If the URLs do not work, refer to this book’s Web site for an updated link: www.esri.com/mappingourworld.
Answer all questions on the student answer sheet handout
Every two to seven years, the climatic phenomenon El Niño occurs over the tropics just south of the equator and off the western coast of Central and South America. In this GIS Investigation, you will record your observations of this event and identify characteristics of both El Niño and its counterpart, La Niña.
Step 1 Visualize and acquire GLOBE data
The GLOBE program (Global Learning and Observations to Benefit the Environ-ment) is a joint effort between several U.S. agencies: NASA (National Aeronautics and Space Administration), NSF (National Science Foundation), and the U.S. State Department, along with more than 100 other countries, to bring real-world environ-mental science into the classroom. The data that is displayed at the GLOBE site is a combination of the work of students and scientists from around the world using everything from the naked human eye to satellites to make their observations. GLOBE has a special series of maps dedicated to El Niño and La Niña. You will create your maps online and then download the images into ArcMap for further analysis.
a
Go to the GLOBE home page on the Internet at www.globe.gov and click
Enter the GLOBE Site
.
b
Under
GLOBE DATA
, click
Maps and Graphs
.

Advanced investigation: Sibling Rivalry
GIS investigation
MODULE 3
• PHYSICAL GEOGRAPHY II: ECOSYSTEMS, CLIMATE, AND VEGETATION
176
PHOTO
C
OPY
c
click the
GLOBE Maps
link.
The Globe Maps page opens and you see options to click and create your own map.
d
Change the following parameters to create your map:
•
Change the Map size to large.
•
Change the Data Category to La Niña/El Niño/SO
e
Click the Redraw Map button .
Now you see the default map for this particular data source. It is the El Niño Pre-dicted Temperature Anomaly for the month ending March 31, 1999. This is the
default map because the winter of 1998–1999 was determined to be an El Niño year. You will change the map parameters so you get a map for sea surface temperatures.
f
Scroll down and change the map parameters to match the settings in the graphic below.

GIS investigation
Advanced investigation: Sibling Rivalry
MODULE 3
• PHYSICAL GEOGRAPHY II: ECOSYSTEMS, CLIMATE, AND VEGETATION
177
PHOTO
C
OPY
g
Click the Redraw map button .
An anomaly means any significant variation from the norm. In this case, the map shows any deviation from the normal average quarterly sea surface temperatures. Any temperature that is within the normal range is identified by the color gray on the map. Temperatures that are above normal are identified in the color range of yellow-orange-red. Temperatures that are below normal are in the color range of aqua-blue-purple. A color legend is located at the top left-hand corner of the map image.
In order to se this map image in ArcMap, you need to save it.
h
Right-click on the map image. If you don’t see the Save Picture As menu option, right-click again. Click the Save Picture As option to save the image.
i
In the Save Picture dialog that opens, navigate to the module 3 images folder (
C:\MapWorld9\Mod3\Data\Images
) or a location your teacher designates.
j
Change the name of the image to
ABC_sstemp1297.gif
, where ABC are your initials. Click Save.
k
Repeat steps 1f–1j to draw and save a map with the following parameters:
•
Sea Surface Temperature (Quarterly)
•
Date: 1999-03-31
•
Save picture as:
ABC_sstemp0399.gif
(ABC are your initials)
l
Minimize your Web browser.
Step 2 Georeference the images
a
Use “My Computer” or “Windows Explorer” to navigate to the Images folder (
C:\MapWorld9\Mod3\Data\Images
).
b
Copy the file
master.flw
and paste it twice into the same Images folder. Now you have three copies of master.flw in the Images folder.
Note: If you did not save your downloaded images to this images folder, you need to paste the two copies of master.flw into the folder where the two images are saved.
Master.flw is a master georeferencing file (also known as a world file) to use with all the large-format images you retrieve from the GLOBE home page. It will “tell” ArcMap where to place the image.

Advanced investigation: Sibling Rivalry
GIS investigation
MODULE 3
• PHYSICAL GEOGRAPHY II: ECOSYSTEMS, CLIMATE, AND VEGETATION
178
PHOTO
C
OPY
c
Rename one of the world files to match the file name of the first image you down-loaded. You also need to change the file extension from .flw to .gifw. The “gif” tells ArcMap to georeference the .gif file with the same name; the “w” tells ArcMap that it is a world file. For the image named ABC_sstemp1297.gif, you need to rename the world file
ABC_sstemp1297.gifw
.
d
Change the file name of the other pasted world file to match the other downloaded image. It now reads
ABC_sstemp0399.gifw
.
You still have a copy of the original master.flw file in the Images folder. When you need to download additional images later, you can copy this file again.
Step 3 Start ArcMap and add the georeferenced images
a
Start ArcMap. Navigate to the module 3 folder (
C:\MapWorld9\Mod3
) and open
Adv3.mxd
(or
Adv3
).
When the map document opens, you see the following layers displayed: Latitude & Longitude, Climate, Countries, and Ocean.
b
Stretch the ArcMap window so the map is bigger.
c
Click the Add Data button and navigate to the folder where the georeferenced images are saved (
C:\MapWorld9\Mod3\Data\Images
).
d
Add both images (
ABC_sstemp1297.gif
and
ABC_sstemp0399.gif
).
e
A message displays, warning you that the images are missing spatial reference infor-mation. In this case, the spatial reference information is not missing—it is simply stored in the “world” file instead of with the image. Click OK to dismiss the message.
f
Drag the two images up in the table of contents and place them just below Latitude & Longitude.
The two images match up with the other layers in the map. This is because the images are in the same projection (Mollweide) as the World Climate data frame.
Note: If you cannot see the images display properly, it is because there was an error in georeferencing. Go back to step 2 and check that you changed the world file to match the file name of the image. Also, check that the extension is “gifw.” If the file name or extension is incorrect by even one character, you will not see the image properly. After you correct the file names, replace the image layers in ArcMap.
g Save your map document according to your teacher’s instructions.
Record the new name of the map document and its location on your answer sheet.

GIS investigation Advanced investigation: Sibling Rivalry
MODULE 3 • PHYSICAL GEOGRAPHY II: ECOSYSTEMS, CLIMATE, AND VEGETATION
179
PHOTOCOPY
Step 4 Analyze characteristics of El Niño and La Niña
El Niño and La Niña are climate anomalies that affect sea surface temperature and precipitation. The scientific term for El Niño/La Niña is the “Southern Oscillation.” The image maps you are exploring are Predicted Anomaly Maps. They show and describe scientists’ predictions for anomalies in sea surface temperature.
a Click the Window menu and click Magnifier. Drag the Magnification window by its title bar and center it over the legend in the upper left of the map image. (Note: The legend is the colored bar, not the zoom scale above it.) When you let go, you will see a magnified view of the legend.
You will reduce the magnification so you can see the entire legend.
b Right-click the Magnifier window title bar and click Properties. Change the zoom factor to 200%. Click Apply.
c In the Magnifier Properties, click the Snapshot option. Click OK.
Now the view in the Magnification window is locked on the legend location and will not change when you drag it around or zoom the map.
Note: The Snapshot window displays the legend for the topmost image that is turned on in the table of contents.
d Zoom in on the area of the Pacific Ocean just west of the coast of South America.
e Record your temperature observations in the table on your answer sheet, taking note of the legend in the Snapshot window.
f Go back to the GLOBE Web site and download precipitation maps for the same time period. Follow the procedure in steps 1–3 to create and add the images to ArcMap.
Record your observations of precipitation characteristics for the same time period and location on your answer sheet.
g Save your map document.

Advanced investigation: Sibling Rivalry GIS investigation
MODULE 3 • PHYSICAL GEOGRAPHY II: ECOSYSTEMS, CLIMATE, AND VEGETATION
180
PHOTOCOPY
The impact of El Niño and La Niña is felt at a global scale; it is not limited to the small region of the Pacific where these climate anomalies are born.
h If time permits, download other GLOBE map images that you think will help you create a detailed definition for the global climate events of El Niño and La Niña. Compare these patterns with the Climate layer already in the table of contents.
Synthesize the information you’ve recorded and develop a definition of El Niño and La Niña. Write these definitions on your answer sheet.
i Save your map document.
Step 5 Are El Niño and La Niña equal and opposite?
According to Sir Isaac Newton’s third law of motion, for every action there is an equal and opposite reaction. The same holds true for the weather—which is, after all, influenced by physical elements and properties. Is La Niña the “equal and opposite” reaction to El Niño? Is one event better than the other? Your answer depends on where you live.
a Look at the images you’ve downloaded and focus on different regions of the world. Complete the table on your answer sheet by filling in your observations for El Niño and La Niña’s effect on the different regions of the world. Consult your teacher for what kinds of weather phenomena you should investigate under “Other.“
b Based on the data you recorded in the previous question, do you think La Niña is equal and opposite to El Niño? Explain your answer.
c Analyze the climate in your region and local area during the 1997 El Niño and the 1999 La Niña. Consult basic climate data (temperature, precipitation, and storms). Refer to the following questions to guide you, and record your answers on the answer sheet:
(1) Was one year better than the other for you and your community?
(2) If in one year you received greater than normal rainfall, did your town have problems with flooding?
(3) If weather was unseasonably warm and mild, did outdoor activities such as amusement parks have greater turnout?
(4) How did these things affect the local economy?
d As an assessment for this GIS Investigation, write an essay that answers the questions above and create ArcMap maps to support your conclusions. Check with your teacher for additional guidelines for this assignment.
Step 6 Exit ArcMap
When you are finished analyzing the El Niño and La Niña data, you may exit ArcMap.
a Save your map document.
b Exit ArcMap by choosing Exit from the File menu.

Student answers Advanced investigation: Sibling Rivalry
MODULE 3 • PHYSICAL GEOGRAPHY II: ECOSYSTEMS, CLIMATE, AND VEGETATION
181
PHOTOCOPY
NAME __________________________________________________ DATE ________________________
Student answer sheetModule 3Physical Geography II: Ecosystems, Climate, and Vegetation
Advanced investigation: Sibling Rivalry
Step 3 Start ArcMap and add the georeferenced imagesg Write the new name you gave the map document and where you saved it.
______________________________________ ______________________________________(Name of map document. (Navigation path to where map document is saved.
For example: ABC_Adv3.mxd) For example: C:\Student\ABC)
Step 4 Analyze characteristics of El Niño and La Niñae, f Record your temperature observations in the table. Record your observations of precipitation character-
istics for the same time period.
h Synthesize the information you’ve recorded and develop a definition of El Niño and La Niña. Write these definitions below.El Niño:____________________________________________________________________________________
____________________________________________________________________________________
____________________________________________________________________________________
____________________________________________________________________________________
La Niña:____________________________________________________________________________________
____________________________________________________________________________________
____________________________________________________________________________________
____________________________________________________________________________________
YEAR / SO TEMPERATURE CHARACTERISTICS PRECIPITATION CHARACTERISTICS
1997 / El Niño
1999 / La Niña

Advanced investigation: Sibling Rivalry Student answers
MODULE 3 • PHYSICAL GEOGRAPHY II: ECOSYSTEMS, CLIMATE, AND VEGETATION
182
PHOTOCOPY
Step 5 Are El Niño and La Niña equal and opposite?a Complete the table below by filling in your observations for El Niño and La Niña’s effect on the different
regions of the world.
WO
RLD
RE
GIO
N
TEM
PERA
TURE
PREC
IPIT
ATI
ON
OTH
ERO
THER
DEC
. 199
7 EL
N
IÑO
MA
RCH
199
9LA
NIÑ
AD
EC. 1
997
EL N
IÑO
MA
RCH
199
9LA
NIÑ
AD
EC. 1
997
EL N
IÑO
MA
RCH
199
9LA
NIÑ
AD
EC. 1
997
EL N
IÑO
MA
RCH
199
9LA
NIÑ
A
Nor
thAm
erica
Sout
hAm
erica
Euro
pe
Afric
a

Student answers Advanced investigation: Sibling Rivalry
MODULE 3 • PHYSICAL GEOGRAPHY II: ECOSYSTEMS, CLIMATE, AND VEGETATION
183
PHOTOCOPY
Step 5 Are El Niño and La Niña equal and opposite? (continued)a (continued)
WO
RLD
RE
GIO
N
TEM
PERA
TURE
PREC
IPIT
ATI
ON
OTH
ERO
THER
DEC
. 199
7 EL
N
IÑO
MA
RCH
199
9LA
NIÑ
AD
EC. 1
997
EL N
IÑO
MA
RCH
199
9LA
NIÑ
AD
EC. 1
997
EL N
IÑO
MA
RCH
199
9LA
NIÑ
AD
EC. 1
997
EL N
IÑO
MA
RCH
199
9LA
NIÑ
A
Asia
Oce
ania
Pacifi
cO
cean

Advanced investigation: Sibling Rivalry Student answers
MODULE 3 • PHYSICAL GEOGRAPHY II: ECOSYSTEMS, CLIMATE, AND VEGETATION
184
PHOTOCOPY
b Based on the data you recorded in the previous question, is La Niña equal and opposite to El Niño? Explain your answer.___________________________________________________________________________________
___________________________________________________________________________________
___________________________________________________________________________________
___________________________________________________________________________________
c-1 Was one year better than the other for you and your community?___________________________________________________________________________________
___________________________________________________________________________________
___________________________________________________________________________________
___________________________________________________________________________________
c-2 If in one year you received greater than normal rainfall, did your town have problems with flooding?___________________________________________________________________________________
___________________________________________________________________________________
___________________________________________________________________________________
___________________________________________________________________________________
c-3 If weather was unseasonably warm and mild, did outdoor activities such as amusement parks have greater turnout?___________________________________________________________________________________
___________________________________________________________________________________
___________________________________________________________________________________
___________________________________________________________________________________
c-4 How did these things affect the local economy?___________________________________________________________________________________
___________________________________________________________________________________
___________________________________________________________________________________
___________________________________________________________________________________
___________________________________________________________________________________
___________________________________________________________________________________
___________________________________________________________________________________
___________________________________________________________________________________