GRAAD 12 NATIONAL SENIOR CERTIFICATE GRADE 12 - Western Cape
15
Copyright reserved Please turn over MARKS: 150 TIME: 2½ hours This question paper consists of 15 pages. GRAAD 12 LIFE SCIENCES P2 NOVEMBER 2017 NATIONAL SENIOR CERTIFICATE GRADE 12
Transcript of GRAAD 12 NATIONAL SENIOR CERTIFICATE GRADE 12 - Western Cape
Copyright reserved Please turn over
MARKS: 150 TIME: 2½ hours
This question paper consists of 15 pages.
GRAAD 12
LIFE SCIENCES P2
NOVEMBER 2017
NATIONAL SENIOR CERTIFICATE
GRADE 12

Life Sciences/P2 2 DBE/November 2017 NSC
Copyright reserved Please turn over
INSTRUCTIONS AND INFORMATION Read the following instructions carefully before answering the questions. 1. 2. 3. 4. 5. 6. 7. 8. 9. 10. 11.
Answer ALL the questions. Write ALL the answers in the ANSWER BOOK. Start the answers to EACH question at the top of a NEW page. Number the answers correctly according to the numbering system used in this question paper. Present your answers according to the instructions of each question. Do ALL drawings in pencil and label them in blue or black ink. Draw diagrams, tables or flow charts only when asked to do so. The diagrams in this question paper are NOT necessarily drawn to scale. Do NOT use graph paper. You must use a non-programmable calculator, protractor and a compass, where necessary. Write neatly and legibly.

Life Sciences/P2 3 DBE/November 2017 NSC
Copyright reserved Please turn over
SECTION A QUESTION 1 1.1 Various options are provided as possible answers to the following questions.
Choose the answer and write only the letter (A to D) next to the question number (1.1.1 to 1.1.10) in the ANSWER BOOK, for example 1.1.11 D.
1.1.1 In a DNA molecule … A
B C D
guanine pairs with adenine. adenine pairs with thymine. cytosine pairs with adenine. guanine pairs with thymine.
1.1.2 The genotype for an individual with blood group A is … A
B C D
IAIA only. IAIA or ii. IAi only. IAIA or IAi.
1.1.3 Charles Darwin based the theory of evolution through natural selection on many observations.
Which ONE of his observations is represented in the diagram
above?
A
B C D
Limited environmental resources Populations remain stable over time Individuals within a population may vary widely Only the fittest will survive
Life Sciences/P2 4 DBE/November 2017 NSC
Copyright reserved Please turn over
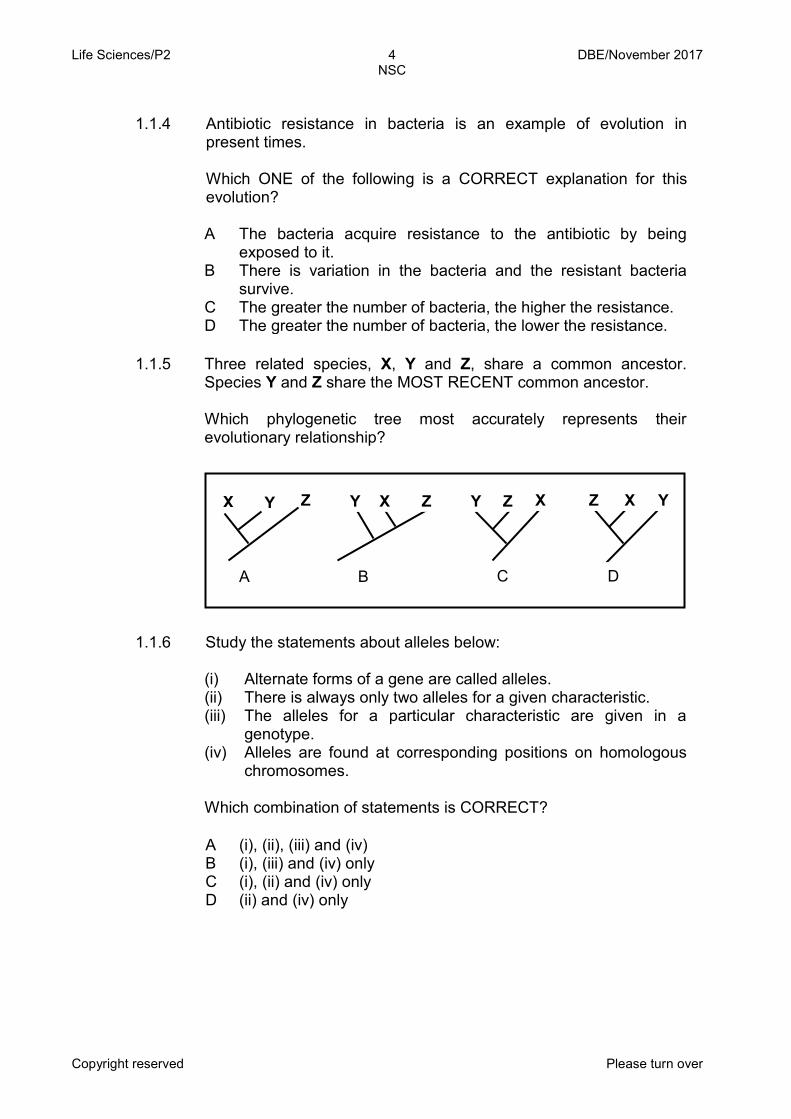
1.1.4 Antibiotic resistance in bacteria is an example of evolution in
present times. Which ONE of the following is a CORRECT explanation for this evolution?
A
B C D
The bacteria acquire resistance to the antibiotic by being exposed to it. There is variation in the bacteria and the resistant bacteria survive. The greater the number of bacteria, the higher the resistance. The greater the number of bacteria, the lower the resistance.
1.1.6 Study the statements about alleles below:
(i) Alternate forms of a gene are called alleles.
(ii) There is always only two alleles for a given characteristic. (iii) The alleles for a particular characteristic are given in a
genotype. (iv) Alleles are found at corresponding positions on homologous
chromosomes.
Which combination of statements is CORRECT?
A
B C D
(i), (ii), (iii) and (iv) (i), (iii) and (iv) only (i), (ii) and (iv) only (ii) and (iv) only
1.1.5 Three related species, X, Y and Z, share a common ancestor. Species Y and Z share the MOST RECENT common ancestor. Which phylogenetic tree most accurately represents their evolutionary relationship?
X Y Z Y X Z Y Z X Y Z X
A B C D

Life Sciences/P2 5 DBE/November 2017 NSC
Copyright reserved Please turn over
Fly 1 Fly 3 Fly 4 Fly 2
Body with stripes (S)
Body without stripes (s)
Abnormal antennae (n)
Key:
Normal antennae (N)
1.1.7 Which ONE of the following is a reproductive isolating mechanism? A
B C D
Breeding at different times of the year Same pollinators for different species of plants Absence of a geographic barrier Cloning
QUESTIONS 1.1.8 TO 1.1.10 ARE BASED ON THE DIAGRAM BELOW.
The diagram shows one pair of homologous chromosomes found in each of
four fruit flies. The alleles for antenna shape (normal or abnormal) and body pattern (with stripes or without stripes) are indicated on the chromosomes.
1.1.8 Which fly is homozygous for antennae shape and heterozygous for
body pattern?
A
B C D
Fly 4 Fly 3 Fly 2 Fly 1
1.1.9 What is the genotype of Fly 3? A
B C D
NnSS NNSs NnSs NNss
1.1.10 Which ONE of the following will represent the possible gametes for
Fly 4?
A
B C D
Ns, NS NS nS Ns, ns (10 x 2)
(20)

Life Sciences/P2 6 DBE/November 2017 NSC
Copyright reserved Please turn over
1.2 Give the correct biological term for each of the following descriptions.
Write only the term next to the question number (1.2.1 to 1.2.9) in the ANSWER BOOK.
1.2.1 1.2.2 1.2.3 1.2.4 1.2.5 1.2.6 1.2.7 1.2.8 1.2.9
Nitrogenous base found only in RNA molecules The use of biological processes, organisms or systems to improve the quality of human life Type of variation within a population in which there is a range of intermediate phenotypes An upright posture and walking only on two legs A sugar molecule found in a nucleotide of DNA Genetic disorder resulting in the abnormal clotting of blood Study of fossils Present-day distribution of living organisms across the continents Family to which humans belong (9 x 1)
(9)
1.3 Indicate whether each of the statements in COLUMN I applies to A ONLY,
B ONLY, BOTH A AND B or NONE of the items in COLUMN II. Write A only, B only, both A and B, or none next to the question number (1.3.1 to 1.3.3) in the ANSWER BOOK.
COLUMN I COLUMN II
1.3.1 Feature of chimpanzee skulls A: B:
Prognathism Forward position of foramen magnum
1.3.2 Similarity between humans and African apes
A: B:
Opposable thumb A short and wide pelvis
1.3.3 Discovered the fossil called 'Little Foot'
A: B:
Raymond Dart Ron Clarke
(3 x 2) (6)
Life Sciences/P2 7 DBE/November 2017 NSC
Copyright reserved Please turn over
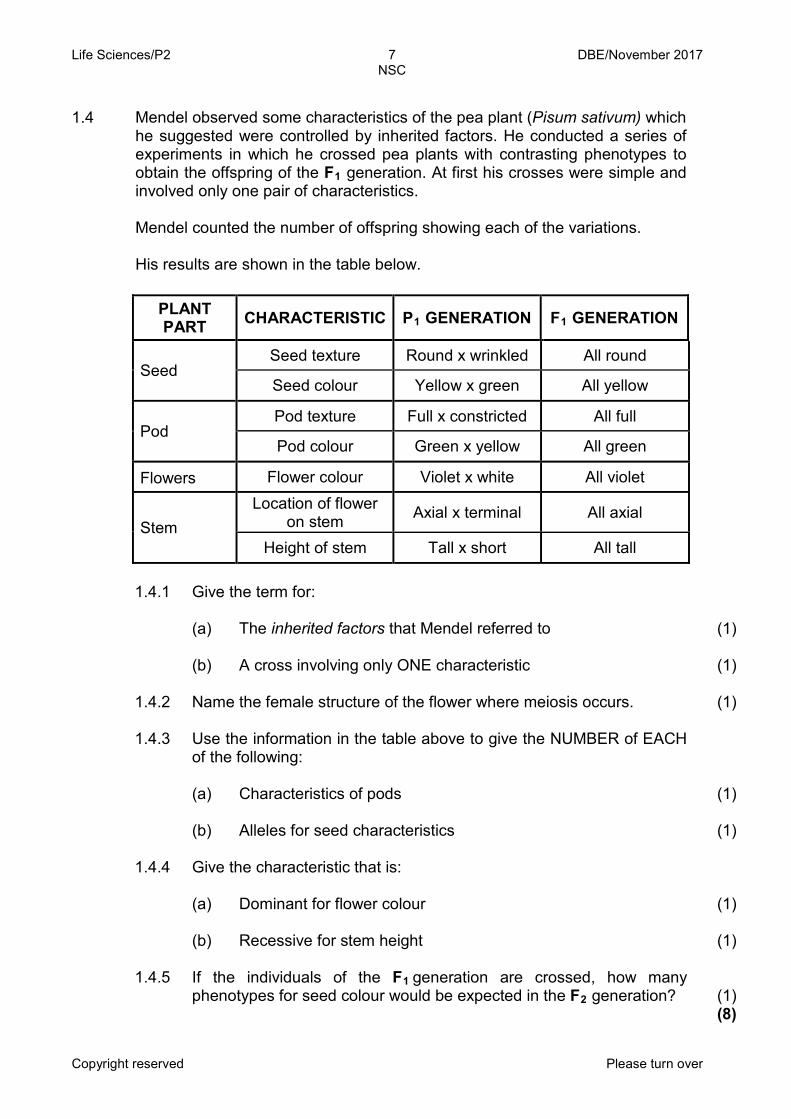
1.4 Mendel observed some characteristics of the pea plant (Pisum sativum) which
he suggested were controlled by inherited factors. He conducted a series of experiments in which he crossed pea plants with contrasting phenotypes to obtain the offspring of the F1 generation. At first his crosses were simple and involved only one pair of characteristics. Mendel counted the number of offspring showing each of the variations. His results are shown in the table below.
PLANT
PART CHARACTERISTIC P1 GENERATION F1 GENERATION
Seed Seed texture Round x wrinkled All round
Seed colour Yellow x green All yellow
Pod Pod texture Full x constricted All full
Pod colour Green x yellow All green
Flowers Flower colour Violet x white All violet
Stem
Location of flower on stem
Axial x terminal All axial
Height of stem Tall x short All tall
1.4.1
Give the term for:
(a) (b)
The inherited factors that Mendel referred to A cross involving only ONE characteristic
(1) (1)
1.4.2 Name the female structure of the flower where meiosis occurs.
(1)
1.4.3 Use the information in the table above to give the NUMBER of EACH of the following:
(a) (b)
Characteristics of pods Alleles for seed characteristics
(1) (1)
1.4.4 Give the characteristic that is:
(a) (b)
Dominant for flower colour Recessive for stem height
(1) (1)
1.4.5 If the individuals of the F1 generation are crossed, how many phenotypes for seed colour would be expected in the F2 generation?
(1) (8)

Life Sciences/P2 8 DBE/November 2017 NSC
Copyright reserved Please turn over
1.5 The diagram below represents a process that occurs during protein synthesis.
1.5.1 Identify the process above.
(1)
1.5.2
Identify:
(a) (b) (c)
Organelle A Molecule B The bond at E
(1) (1) (1)
1.5.3 Give only the LETTER of the molecule that:
(a) (b) (c)
Carries the amino acid Is copied from DNA Is the monomer/building block of proteins
(1) (1) (1) (7)
TOTAL SECTION A: 50
B
A
D
C
E

Life Sciences/P2 9 DBE/November 2017 NSC
Copyright reserved Please turn over
SECTION B QUESTION 2 2.1 The sequence of amino acids in a protein molecule is coded for by DNA and
RNA. The table below shows some mRNA codons and the corresponding amino acids.
mRNA CODONS AMINO ACID
AGC Serine GAU Aspartate CUA Leucine UAU Tyrosine UUC Phenylalanine AGU Serine GAC Aspartate UUU Phenylalanine CUC Leucine GAG Glutamic acid
2.1.1
2.1.2 2.1.3
According to the table, how many codons code for phenylalanine? What is the anticodon for glutamic acid? A section of mRNA has the following base sequence and is read from left to right:
GAU CUC GAC AGC AUG ACC Give the:
(1) (1)
(a) (b)
DNA base triplet for the LAST codon on this section of mRNA FIRST amino acid coded for by this section of mRNA
(1) (1)
2.1.4
A mutation occurred which resulted in the following base sequence on the mRNA molecule:
GAU CUC GAC AGU AUG ACC
(a) (b)
Describe the mutation that occurred. Explain the effect that the mutation described in QUESTION 2.1.4(a) will have on the resulting protein.
(2) (2)
2.1.5 Name and describe the process occurring in the nucleus which results in the formation of an mRNA molecule.
(6) (14)

Life Sciences/P2 10 DBE/November 2017 NSC
Copyright reserved Please turn over
2.2 A mutation occurred within a population of squirrels. This population was then
separated by a river. Many years later it was discovered that the original population had undergone speciation. The process of speciation is shown in the diagram below.
2.2.1 2.2.2 2.2.3 2.2.4 2.2.5
Define a population. Other than mutations, give THREE causes of variation in a population. Explain why there were eventually more squirrels with the mutation on one side of the river. Explain what effect the process above has on the biodiversity in this ecosystem. It was discovered that species A and B were TWO separate species. Describe what can be done to confirm that the squirrels belong to two different biological species.
(2) (3) (3) (2) (2) (12)
Mutation
Original squirrel population
RIVER
Species B
Species A
Life Sciences/P2 11 DBE/November 2017 NSC
Copyright reserved Please turn over
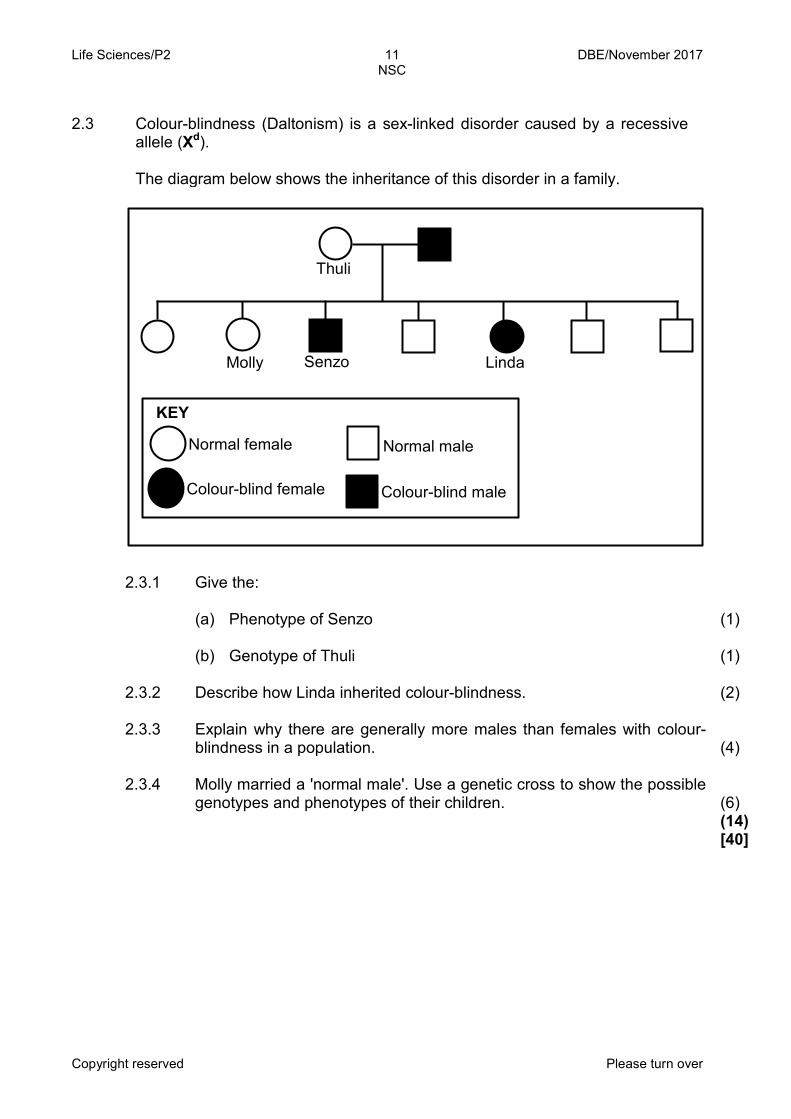
Thuli
Molly
Senzo
Linda
Normal male Normal female
Colour-blind female
KEY
Colour-blind male
2.3 Colour-blindness (Daltonism) is a sex-linked disorder caused by a recessive
allele (Xd). The diagram below shows the inheritance of this disorder in a family.
2.3.1 Give the:
(a) (b)
Phenotype of Senzo Genotype of Thuli
(1) (1)
2.3.2 Describe how Linda inherited colour-blindness.
(2)
2.3.3 Explain why there are generally more males than females with colour- blindness in a population.
(4)
2.3.4 Molly married a 'normal male'. Use a genetic cross to show the possible genotypes and phenotypes of their children.
(6) (14) [40]

Life Sciences/P2 12 DBE/November 2017 NSC
Copyright reserved Please turn over
QUESTION 3 3.1 Scientists use fossils as evidence for human evolution. The brain volume of
some extinct primates has been estimated from their fossils and have been compared to the brain volumes of living primates. The results are shown in the table below.
PRIMATE PERIOD OF
EXISTENCE (million years ago)
AVERAGE BRAIN VOLUME (cm3)
Ardipithecus ramidus 5,8 to 4,4 400 Australopithecus afarensis 4 to 2,7 450 Australopithecus africanus 3 to 2 450 Homo habilis 2,2 to 1,6 750 Homo erectus 2 to 0,4 1 000 Homo neanderthalensis 0,3 to 0,23 1 500 Homo sapiens 0,2 to present 1 400 Modern apes 0,2 to present 500
3.1.1 Apart from fossil evidence, give TWO other types of evidence for
human evolution.
(2)
3.1.2 Which primate became extinct first?
(1)
3.1.3 The brain of an organism is not preserved as a fossil. How do scientists determine the brain volume of extinct primates?
(2)
3.1.4 Calculate the difference in brain volume (in cm3) between the two living primates. Show ALL calculations.
(2)
3.1.5 Give evidence in the table that suggests that:
(a) (b)
Homo habilis and Homo erectus may have existed at the same time Ardipithecus was the most primitive of all the primate genera
(1) (1)
3.1.6 Draw a bar graph to show the average brain volume of EACH of the species of the genus Homo.
(6) (15)

Life Sciences/P2 13 DBE/November 2017 NSC
Copyright reserved Please turn over
3.2 Read the extract below. Long before the development of agricultural crops, South African villagers
would pick the sweetest and largest fruits of the marula tree and scatter them around their camps. The seeds of these fruit would germinate and grow into fruit-bearing trees. The best fruit would then be chosen from these trees and the process would be repeated. In recent times, farmers use a process called marcotting. This involves peeling away the bark in one area around a branch. This area is stimulated to form roots. The branch is then removed from the tree and planted in the soil to produce more marula trees.
3.2.1
3.2.2 3.2.3 3.2.4 3.2.5 3.2.6
Name the characteristics that the villagers were selecting. Explain how this practice is an example of artificial selection. Give ONE environmental factor that could affect the characteristics named in QUESTION 3.2.1. Explain ONE disadvantage of a plantation of marula trees grown through marcotting compared to a population of marula trees that have reproduced naturally. Explain whether the fruits from marcotted marula trees could be classified as genetically modified (GM). State TWO benefits of genetic modification.
(2) (3) (1) (2) (2) (2) (12)

Life Sciences/P2 14 DBE/November 2017 NSC
Copyright reserved Please turn over
3.3 A species of mice have different fur colours in different habitats. Scientists
observed that there were more mice with a lighter fur colour in a beach habitat where the sand was lighter in colour. Also, there were more mice with a darker fur colour in the mainland habitat where the sand was darker in colour. Owls attack and prey on the mice. Scientists wanted to investigate how the colour of the fur affects the chances of the mice being attacked. They conducted a simulation where they used models to represent the mice. While conducting the investigation they: • Made clay models of the mice • Painted 200 clay models to resemble the lighter fur colour and
200 models to resemble the darker fur colour • Placed an equal number of mice of each colour randomly in the beach
habitat and in the mainland habitat • Allowed enough time for predators to attack the mice models • Collected all the models and recorded the number that were damaged
after being attacked The results of the investigation are shown in the diagram below.
HABITAT FUR COLOUR NUMBER OF MODELS ATTACKED
Mainland Lighter 80 Darker 20
Beach Lighter 26 Darker 78
3.3.1
3.3.2 3.3.3 3.3.4 3.3.5 3.3.6
State TWO independent variables. How many mice with a lighter fur colour were placed in the beach habitat? State TWO ways in which the scientists ensured the reliability of the results. Give a conclusion for the investigation conducted in the mainland habitat. Explain the results obtained for the beach habitat. Explain why the simulation may not be an accurate representation of the survival of the mice.
(2) (1) (2) (2) (4) (2) (13) [40]
. TOTAL SECTION B: 80

Life Sciences/P2 15 DBE/November 2017 NSC
Copyright reserved
SECTION C QUESTION 4
Describe the structure and arrangement of chromosomes making up the normal human karyotype. Also describe the behaviour of the chromosomes during the different phases of meiosis I.
Content: Synthesis:
(17) (3)
NOTE: NO marks will be awarded for answers in the form of tables, flow charts or
diagrams.
TOTAL SECTION C:
GRAND TOTAL: 20
150