
GPW 2007 – NOWA JAKOŚĆ
27
GPW 2007 – NOWA JAKOŚĆ INVESTORS AND EXCHANGE TRADING IN 2010 Survey Summary
-
Upload
amena-hunt -
Category
Documents
-
view
27 -
download
0
description
INVESTORS AND EXCHANGE TRADING IN 2010 Survey Summary. GPW 2007 – NOWA JAKOŚĆ. Methodology. Survey format: questionnaire survey; respondents provided exact figures; Respondents: 28 domestic WSE Members; Timing: January-February 2011; - PowerPoint PPT Presentation
Transcript of GPW 2007 – NOWA JAKOŚĆ
GPW 2007 – NOWA JAKOŚĆINVESTORS
AND EXCHANGE TRADING
IN 2010
Survey Summary
2
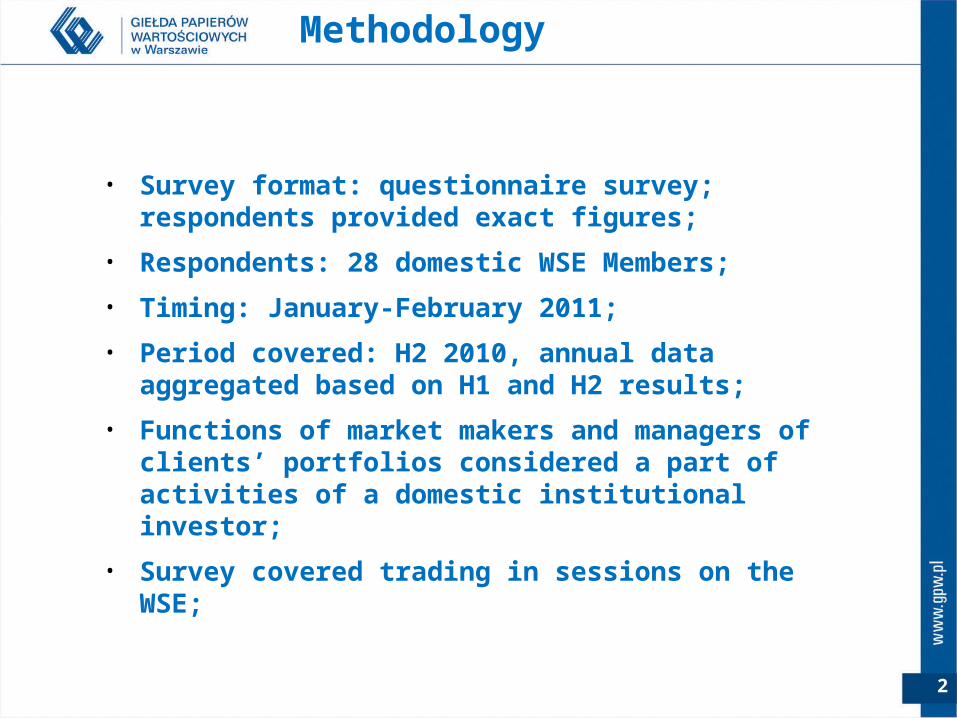
• Survey format: questionnaire survey; respondents provided exact figures;
• Respondents: 28 domestic WSE Members;
• Timing: January-February 2011;
• Period covered: H2 2010, annual data aggregated based on H1 and H2 results;
• Functions of market makers and managers of clients’ portfolios considered a part of activities of a domestic institutional investor;
• Survey covered trading in sessions on the WSE;
Methodology
3
MAIN LIST – SHARES
4
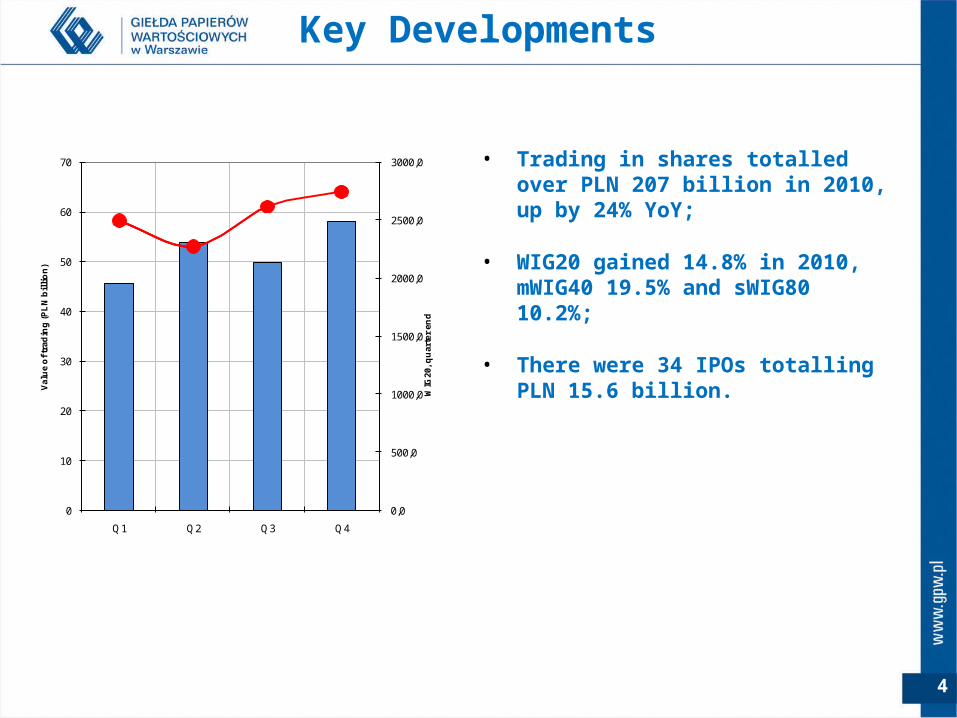
Key Developments
• Trading in shares totalled over PLN 207 billion in 2010, up by 24% YoY;
• WIG20 gained 14.8% in 2010, mWIG40 19.5% and sWIG80 10.2%;
• There were 34 IPOs totalling PLN 15.6 billion.
0,0
500,0
1000,0
1500,0
2000,0
2500,0
3000,0
0
10
20
30
40
50
60
70
Q1 Q2 Q3 Q4
WIG
20
, qu
arte
r e
nd
Va
lue
of
tra
din
g (
PL
N b
illi
on
)
5
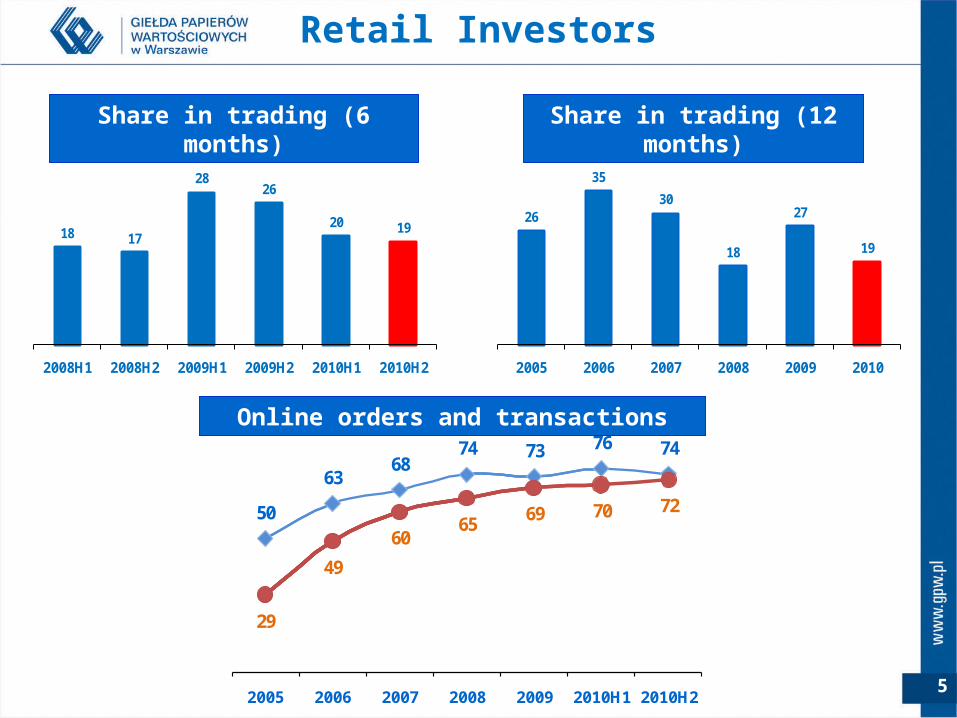
Retail Investors
18 17
2826
20 19
2008H1 2008H2 2009H1 2009H2 2010H1 2010H2
26
35
30
18
27
19
2005 2006 2007 2008 2009 2010
50
6368
74 73 76 74
29
49
6065 69 70 72
2005 2006 2007 2008 2009 2010H1 2010H2
orders transactions
Share in trading (6 months) Share in trading (12 months)
Online orders and transactions
6
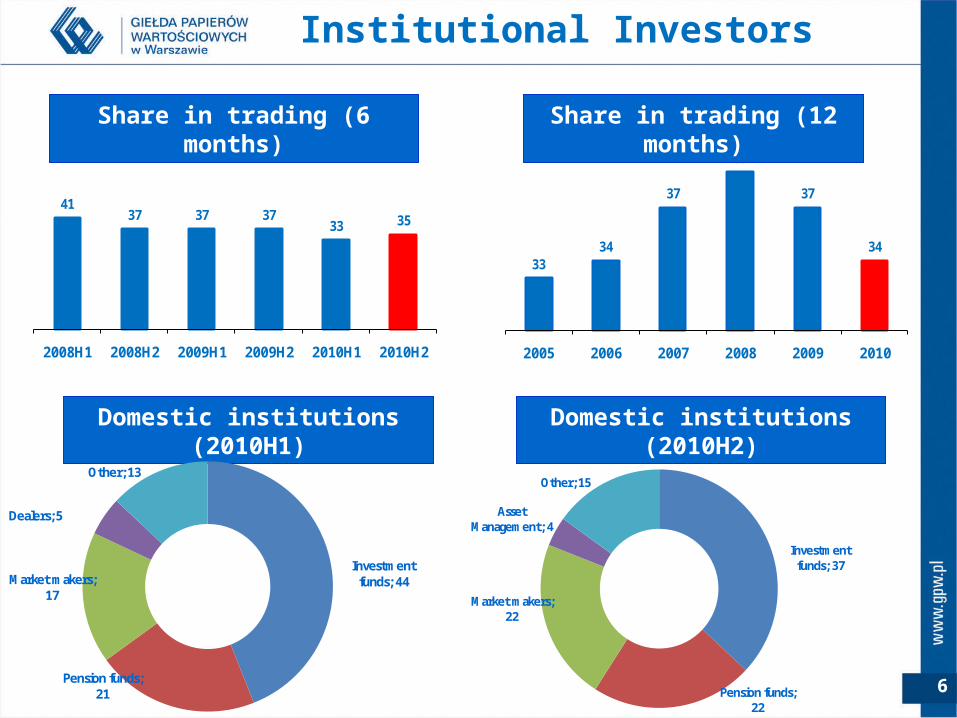
Institutional Investors
4137 37 37
33 35
2008H1 2008H2 2009H1 2009H2 2010H1 2010H2
Domestic institutions (2010H1)
Investment funds; 44
Pension funds; 21
Market makers; 17
Dealers; 5
Other; 13
Investment funds; 37
Pension funds; 22
Market makers; 22
Asset Management; 4
Other; 15
3334
37
39
37
34
2005 2006 2007 2008 2009 2010
Share in trading (6 months) Share in trading (12 months)
Domestic institutions (2010H2)
7
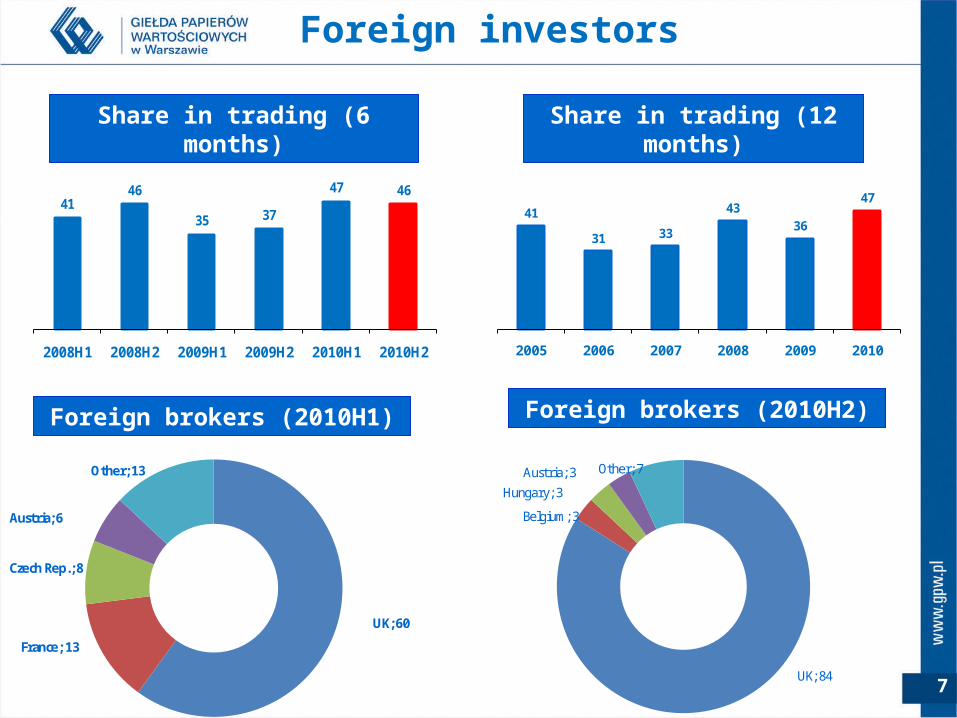
UK; 60
France; 13
Czech Rep.; 8
Austria; 6
Other; 13
41
31 33
4336
47
2005 2006 2007 2008 2009 2010
Foreign investors
4146
35 37
47 46
2008H1 2008H2 2009H1 2009H2 2010H1 2010H2
Foreign brokers (2010H1)
Share in trading (12 months)Share in trading (6 months)
Foreign brokers (2010H2)
UK; 84
Belgium; 3
Hungary; 3Austria; 3 Other; 7
8
NEWCONNECT
9
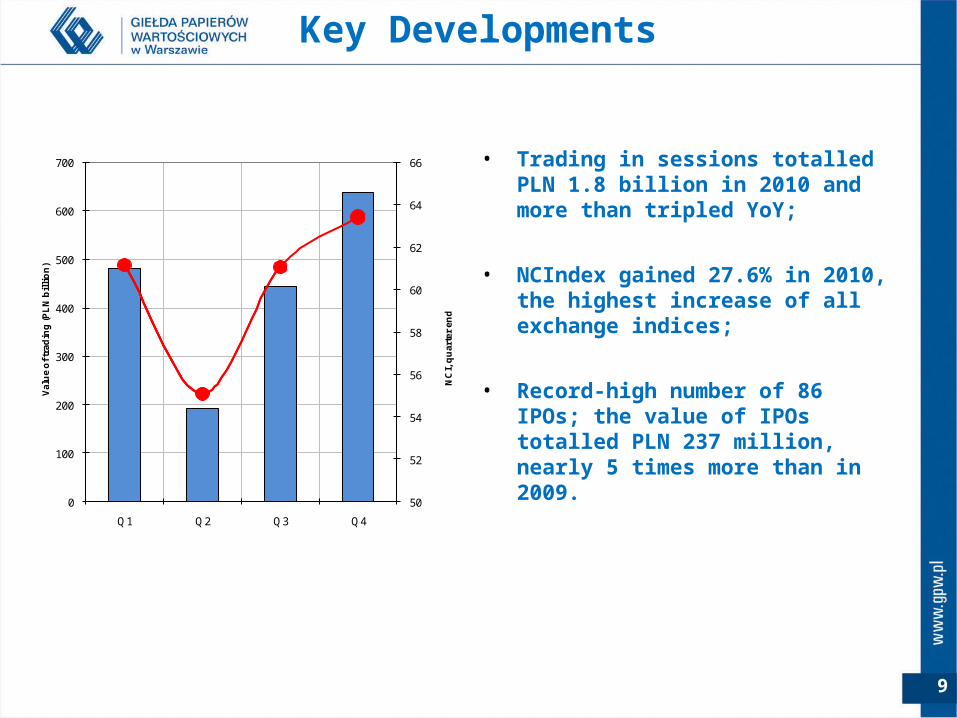
Key Developments
• Trading in sessions totalled PLN 1.8 billion in 2010 and more than tripled YoY;
• NCIndex gained 27.6% in 2010, the highest increase of all exchange indices;
• Record-high number of 86 IPOs; the value of IPOs totalled PLN 237 million, nearly 5 times more than in 2009.
50
52
54
56
58
60
62
64
66
0
100
200
300
400
500
600
700
Q1 Q2 Q3 Q4
NC
I, q
uar
ter
end
Val
ue
of t
rad
ing
(PL
N b
illi
on
)
10
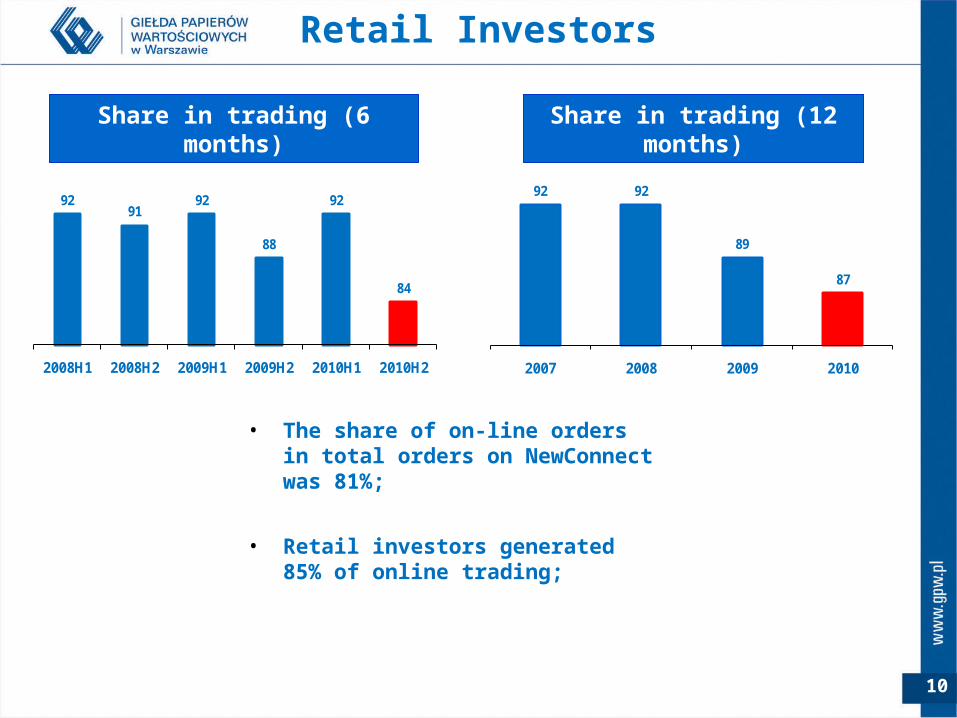
Retail Investors
9291
92
88
92
84
2008H1 2008H2 2009H1 2009H2 2010H1 2010H2
Share in trading (6 months) Share in trading (12 months)
92 92
89
87
2007 2008 2009 2010
• The share of on-line orders in total orders on NewConnect was 81%;
• Retail investors generated 85% of online trading;
11
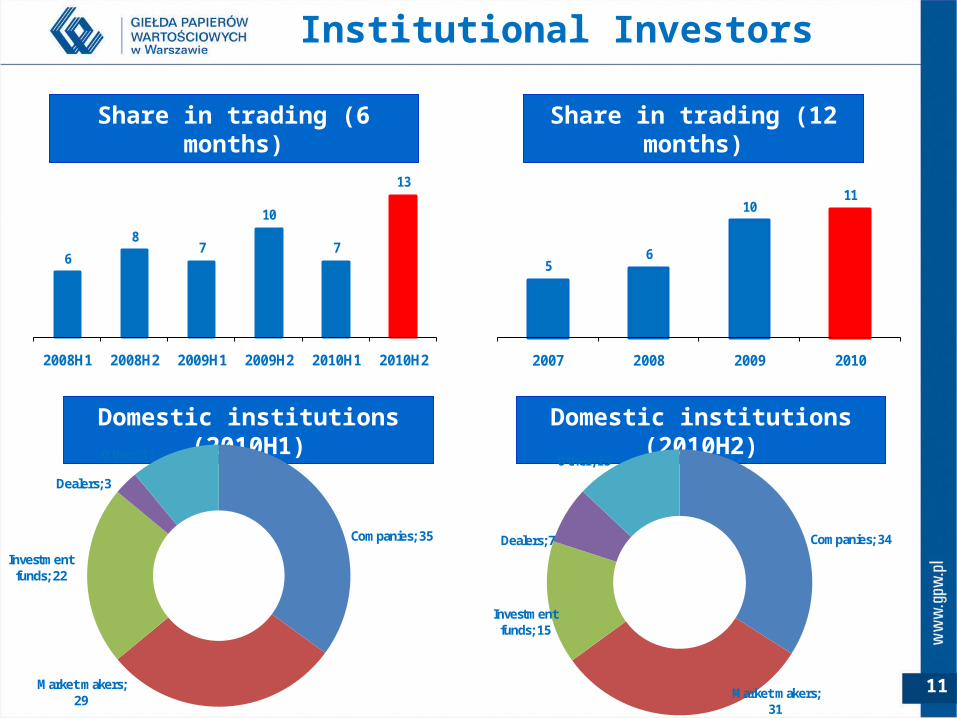
Institutional Investors
6
87
10
7
13
2008H1 2008H2 2009H1 2009H2 2010H1 2010H2
Domestic institutions (2010H1)
Share in trading (6 months) Share in trading (12 months)
Domestic institutions (2010H2)
56
1011
2007 2008 2009 2010
Companies; 35
Market makers; 29
Investment funds; 22
Dealers; 3
Other; 11
Companies; 34
Market makers; 31
Investment funds; 15
Dealers; 7
Other; 13
12
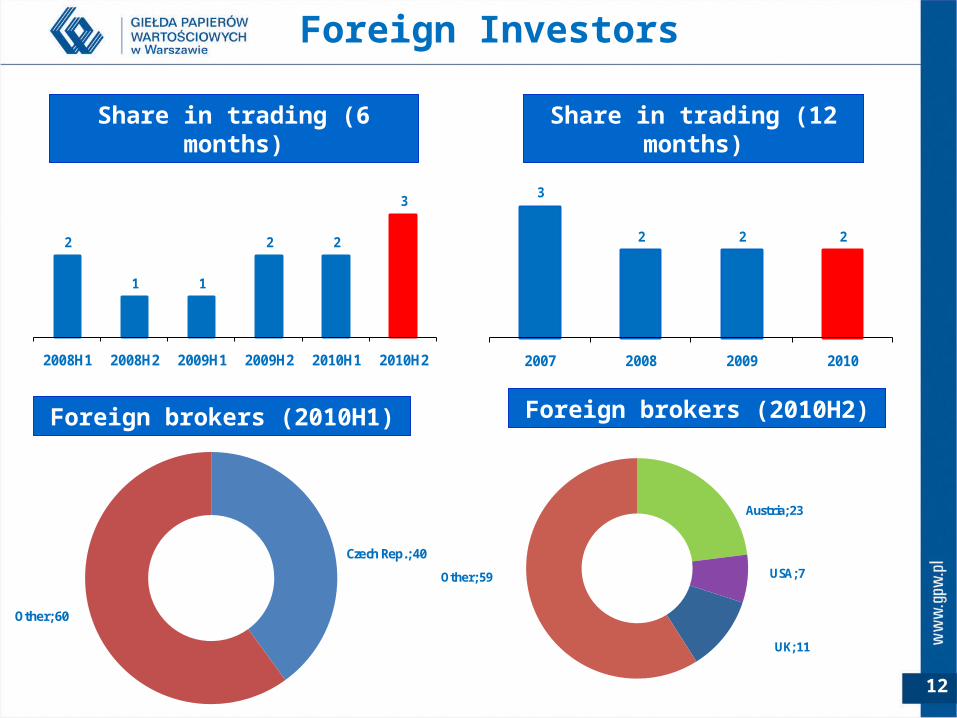
Foreign Investors
2
1 1
2 2
3
2008H1 2008H2 2009H1 2009H2 2010H1 2010H2
Foreign brokers (2010H1)
Share in trading (12 months)Share in trading (6 months)
Foreign brokers (2010H2)
3
2 2 2
2007 2008 2009 2010
Czech Rep.; 40
Other; 60
Austria; 23
USA; 7
UK; 11
Other; 59
13
DERIVATIVES

14
Key Developments
• The volume of trading in futures contracts and options was record-high at 14.7 million instruments in 2010;
• New futures contracts on shares of listed companies were introduced to trading, the number of market makers of derivative instruments increased;
• New short selling rules introduced in H2 will drive further growth of derivatives trading;
135
140
145
150
155
160
165
170
175
180
185
0
500
1000
1500
2000
2500
3000
3500
4000
4500
Q1 Q2 Q3 Q4
Nu
mb
er o
f op
en in
tere
st (t
ho
u.)
Vo
lum
e o
f tra
din
g (t
ho
u.)
15
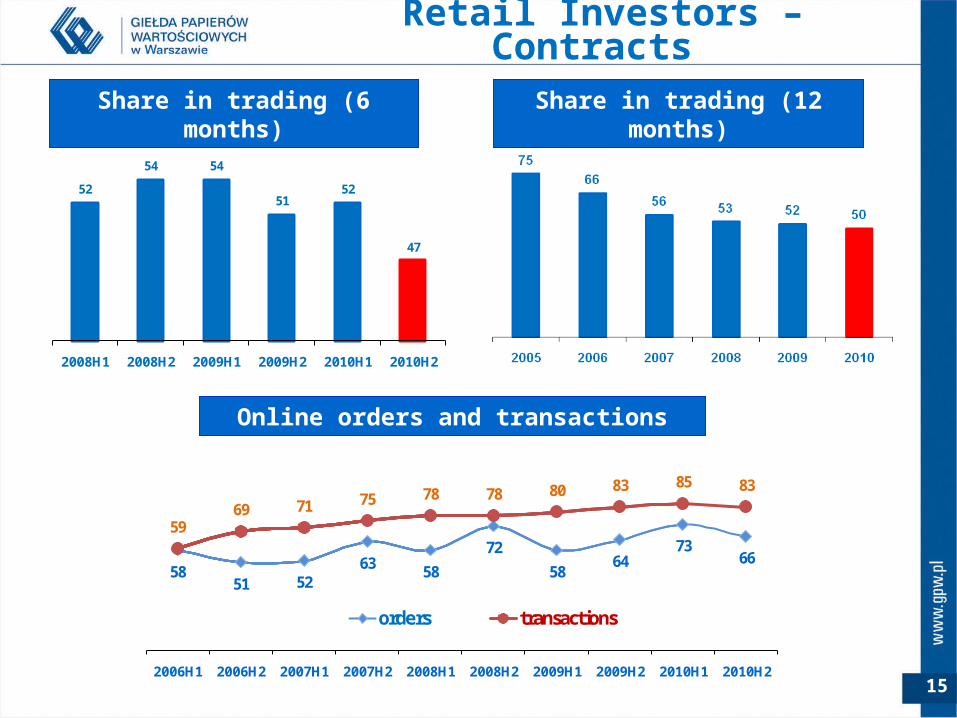
52
54 54
5152
47
2008H1 2008H2 2009H1 2009H2 2010H1 2010H2
Retail Investors – Contracts
5851 52
63 58
72
5864
7366
5969 71 75 78 78 80 83 85 83
2006H1 2006H2 2007H1 2007H2 2008H1 2008H2 2009H1 2009H2 2010H1 2010H2
orders transactions
Share in trading (6 months) Share in trading (12 months)
Online orders and transactions
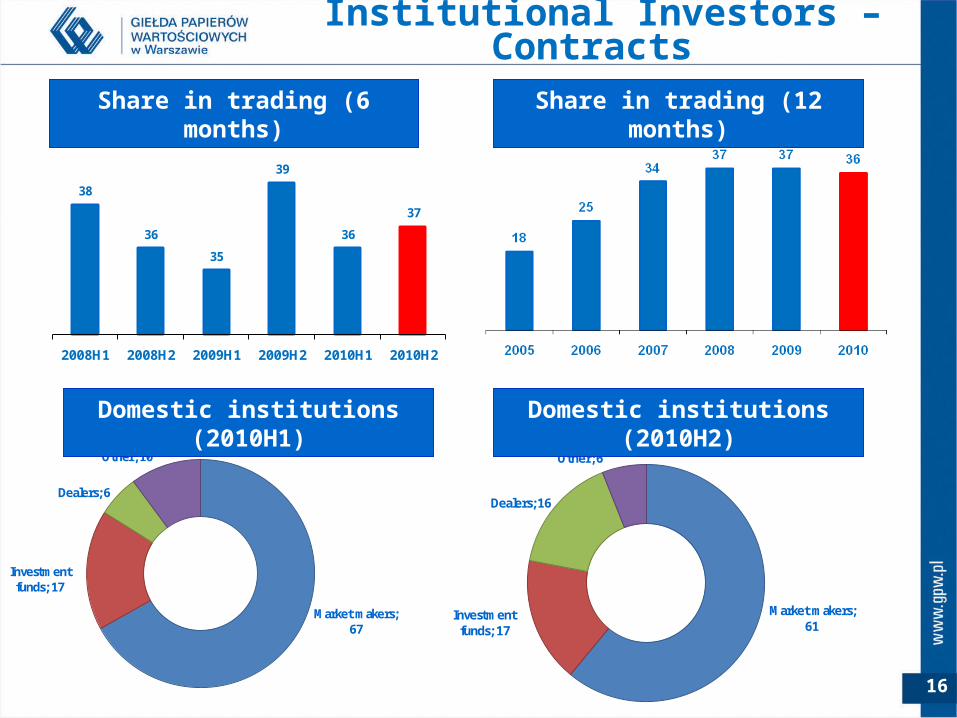
16
Market makers; 67
Investment funds; 17
Dealers; 6
Other; 10
38
36
35
39
36
37
2008H1 2008H2 2009H1 2009H2 2010H1 2010H2
Institutional Investors – Contracts
Market makers; 61
Investment funds; 17
Dealers; 16
Other; 6
Share in trading (6 months) Share in trading (12 months)
Domestic institutions (2010H1) Domestic institutions (2010H2)
17
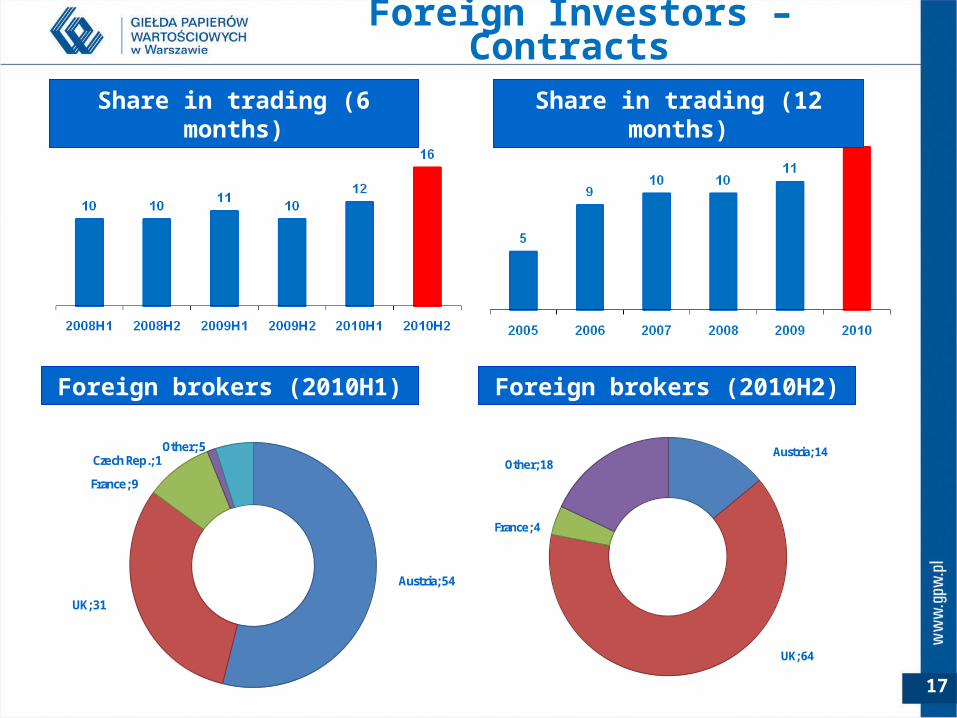
Foreign Investors – Contracts
Austria; 54
UK; 31
France; 9
Czech Rep.; 1Other; 5 Austria; 14
UK; 64
France; 4
Other; 18
Share in trading (6 months) Share in trading (12 months)
Foreign brokers (2010H1) Foreign brokers (2010H2)
18
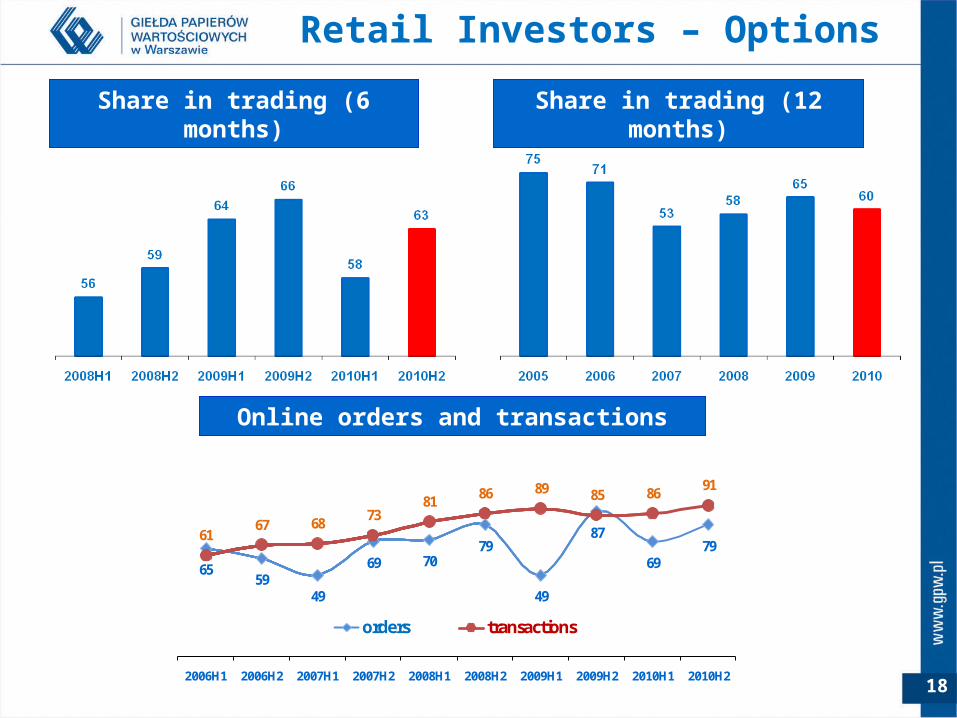
Retail Investors – Options
6559
49
69 7079
49
87
6979
6167 68 73
81 86 89 85 86 91
2006H1 2006H2 2007H1 2007H2 2008H1 2008H2 2009H1 2009H2 2010H1 2010H2
orders transactions
Share in trading (6 months) Share in trading (12 months)
Online orders and transactions
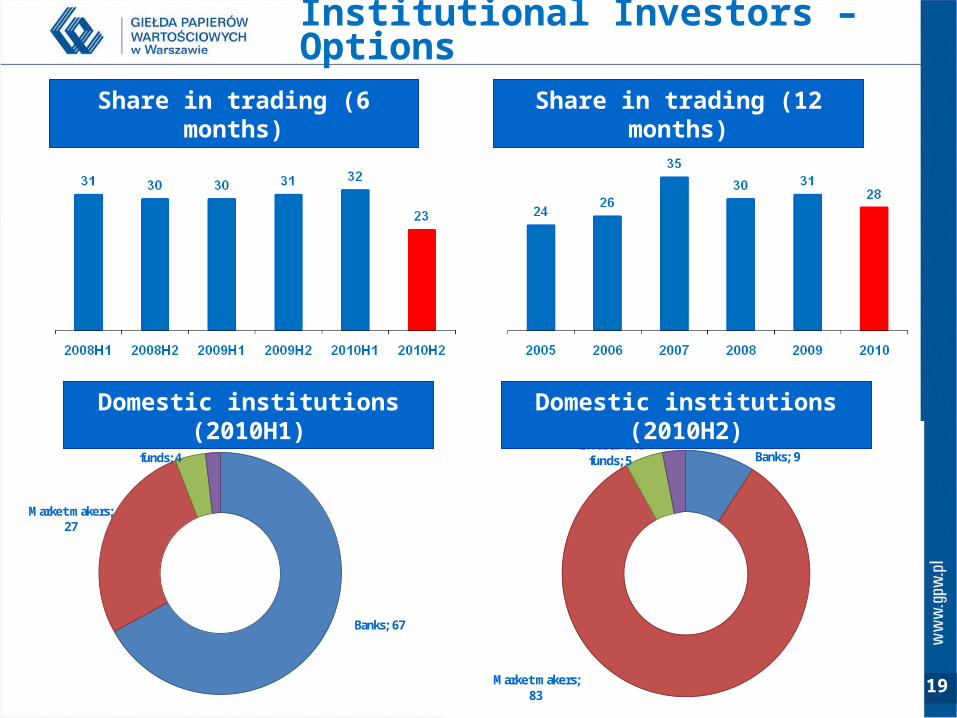
Banks; 67
Market makers; 27
Investment funds; 4
Other; 2
Institutional Investors – Options
Banks; 9
Market makers; 83
Investment funds; 5
Other; 3
19
Share in trading (6 months) Share in trading (12 months)
Domestic institutions (2010H2)Domestic institutions (2010H1)
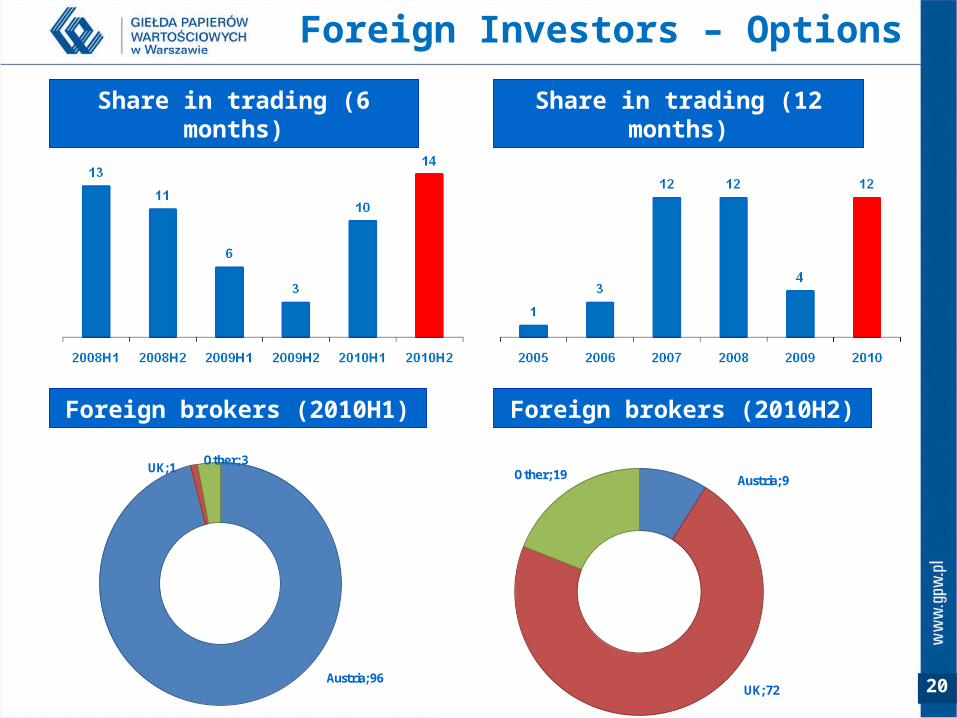
20Austria; 96
UK; 1Other; 3
Foreign Investors – Options
Austria; 9
UK; 72
Other; 19
Share in trading (6 months) Share in trading (12 months)
Foreign brokers (2010H1) Foreign brokers (2010H2)
21
CATALYST
22
Key Developments
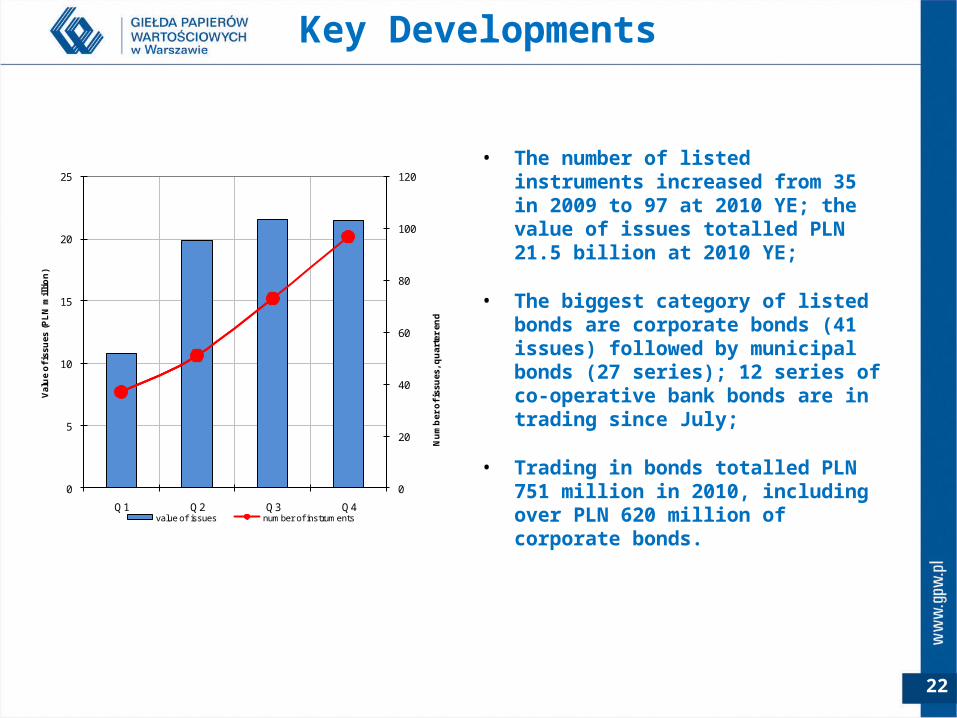
• The number of listed instruments increased from 35 in 2009 to 97 at 2010 YE; the value of issues totalled PLN 21.5 billion at 2010 YE;
• The biggest category of listed bonds are corporate bonds (41 issues) followed by municipal bonds (27 series); 12 series of co-operative bank bonds are in trading since July;
• Trading in bonds totalled PLN 751 million in 2010, including over PLN 620 million of corporate bonds.0
20
40
60
80
100
120
0
5
10
15
20
25
Q1 Q2 Q3 Q4
Nu
mb
er o
f iss
ues
, qu
arte
r en
d
Val
ue
of i
ssu
es (
PL
N m
illi
on
)
value of issues number of instruments
23
SUMMARY
24
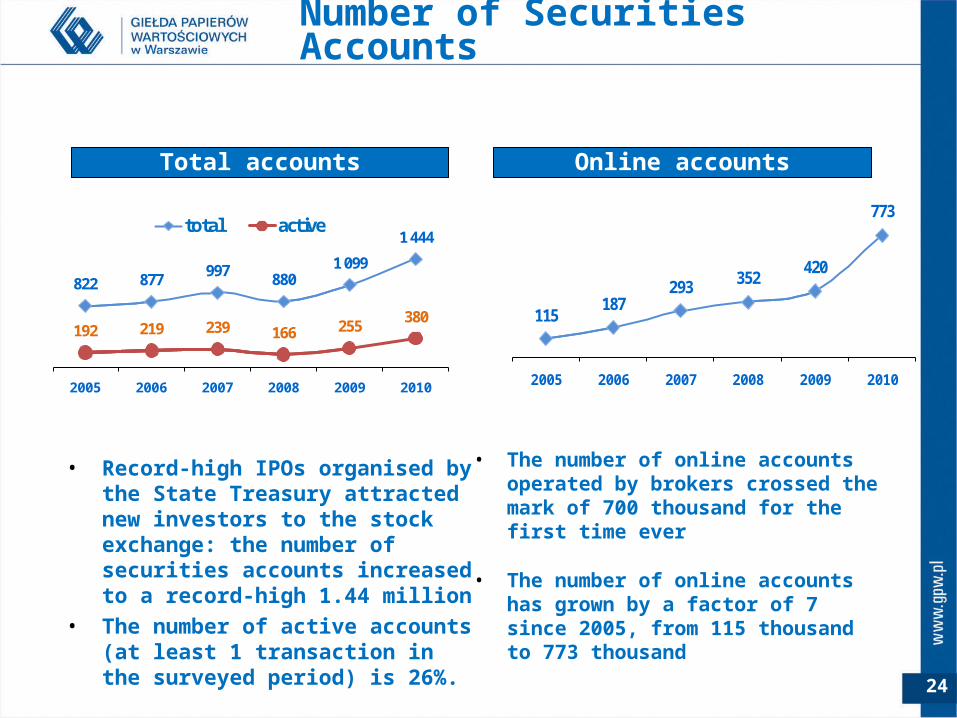
• The number of online accounts operated by brokers crossed the mark of 700 thousand for the first time ever
• The number of online accounts has grown by a factor of 7 since 2005, from 115 thousand to 773 thousand
Number of Securities Accounts
822 877 997 8801 099
1 444
192 219 239 166 255 380
2005 2006 2007 2008 2009 2010
total active
115187
293 352420
773
2005 2006 2007 2008 2009 2010
• Record-high IPOs organised by the State Treasury attracted new investors to the stock exchange: the number of securities accounts increased to a record-high 1.44 million
• The number of active accounts (at least 1 transaction in the surveyed period) is 26%.
Total accounts Online accounts
25
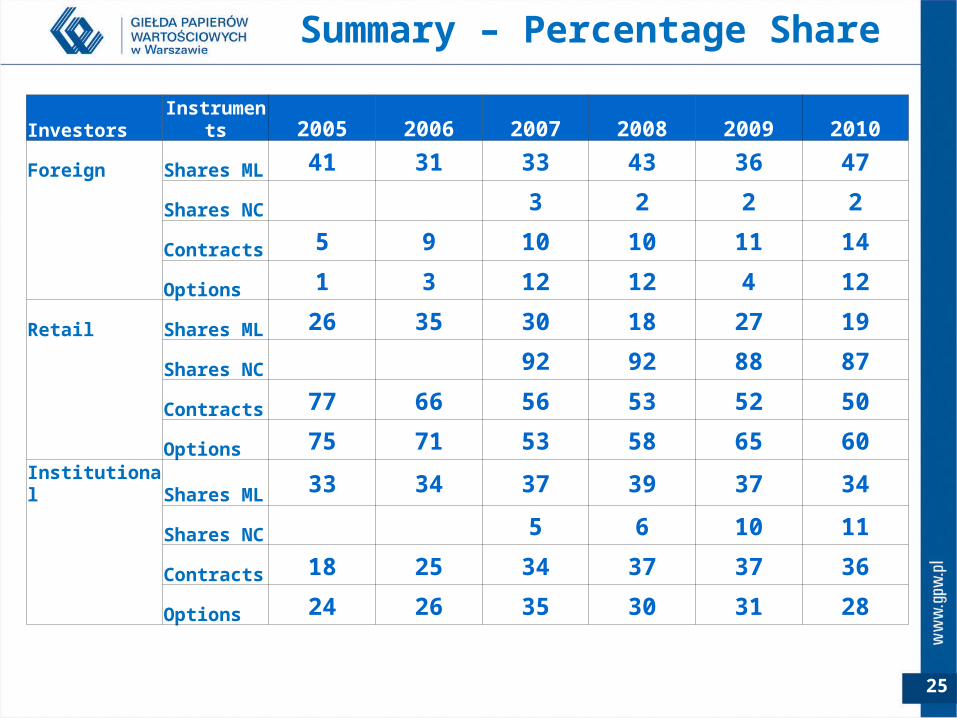
Investors Instruments 2005 2006 2007 2008 2009 2010
Foreign Shares ML 41 31 33 43 36 47
Shares NC 3 2 2 2
Contracts 5 9 10 10 11 14
Options 1 3 12 12 4 12
Retail Shares ML 26 35 30 18 27 19
Shares NC 92 92 88 87
Contracts 77 66 56 53 52 50
Options 75 71 53 58 65 60
Institutional Shares ML 33 34 37 39 37 34
Shares NC 5 6 10 11
Contracts 18 25 34 37 37 36
Options 24 26 35 30 31 28
Summary – Percentage Share
26
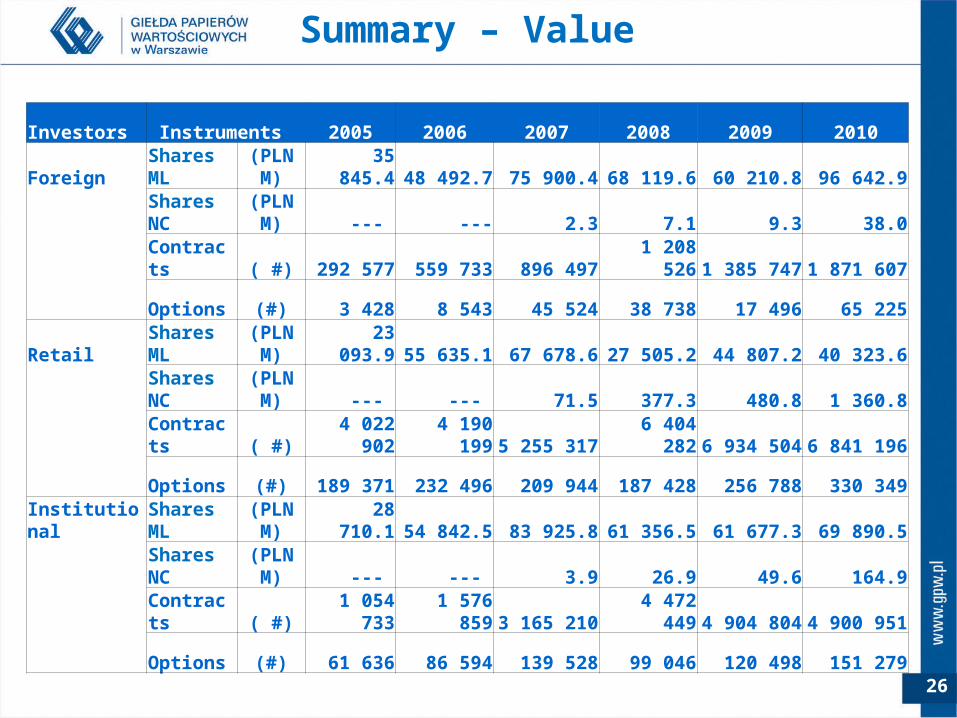
Summary – Value
Investors Instruments 2005 2006 2007 2008 2009 2010
Foreign Shares ML (PLN M) 35 845.4 48 492.7 75 900.4 68 119.6 60 210.8 96 642.9
Shares NC (PLN M) --- --- 2.3 7.1 9.3 38.0
Contracts ( #) 292 577 559 733 896 497 1 208 526 1 385 747 1 871 607
Options (#) 3 428 8 543 45 524 38 738 17 496 65 225
Retail Shares ML (PLN M) 23 093.9 55 635.1 67 678.6 27 505.2 44 807.2 40 323.6
Shares NC (PLN M) --- --- 71.5 377.3 480.8 1 360.8
Contracts ( #) 4 022 902 4 190 199 5 255 317 6 404 282 6 934 504 6 841 196
Options (#) 189 371 232 496 209 944 187 428 256 788 330 349
Institutional Shares ML (PLN M) 28 710.1 54 842.5 83 925.8 61 356.5 61 677.3 69 890.5
Shares NC (PLN M) --- --- 3.9 26.9 49.6 164.9
Contracts ( #) 1 054 733 1 576 859 3 165 210 4 472 449 4 904 804 4 900 951
Options (#) 61 636 86 594 139 528 99 046 120 498 151 279
27
More Information:WSE Marketing Communication Department
Marcin Przeszł[email protected]
Anna [email protected]