GPS Research and Monitoring of the Yellowstone Volcanic ... · Salt Lake City , Utah October 14 ......
46
GPS Research and Monitoring of the Yellowstone Volcanic System, WY-ID-MT, and the Wasatch Fault, UT A White Paper Christine M. Puskas, Robert B. Smith, Wu-Lung Chang, and Jamie Farrell University of Utah Seismology and Active Tectonics Research Group University of Utah Salt Lake City, Utah October 14, 2010 Introduction The University of Utah operates two Global Positioning System (GPS) networks of permanent stations: one in the Yellowstone volcanic field, Yellowstone National Park, Wyoming, Montana, and Idaho, and the second spanning the Wasatch fault (Wasatch Front) of northern and central Utah. The Yellowstone volcanic field and the Wasatch fault and are actively deforming regions of the Basin-Range extensional tectonic regime with high seismic hazards and a superimposed volcanic hazard at Yellowstone. These GPS networks are supplemented by temporary GPS arrays that have been operated during field campaigns since 1987. The University of Utah GPS networks are the key elements of crustal deformation monitoring of the Yellowstone hotspot and Wasatch fault zone, designed to measure ground deformation in parallel with seismic monitoring networks operated by the University of Utah Seismograph Stations (UUSS ). Ground deformation is related to active volcanic processes and faulting in Yellowstone, and to faulting in Utah, hence the importance of GPS measurements in understanding the distribution of volcanic and hydrothermal features, active faults, contemporary fault loading, fault geometry, etc. The Yellowstone and Wasatch networks
Transcript of GPS Research and Monitoring of the Yellowstone Volcanic ... · Salt Lake City , Utah October 14 ......

GPS Research and Monitoring of the Yellowstone Volcanic System, WY-ID-MT, and the Wasatch Fault, UT
A White Paper
Christine M. Puskas, Robert B. Smith, Wu-Lung Chang, and Jamie FarrellUniversity of Utah Seismology and Active Tectonics Research Group
University of UtahSalt Lake City, Utah
October 14, 2010
Introduction
The University of Utah operates two Global Positioning System (GPS) networks of
permanent stations: one in the Yellowstone volcanic field, Yellowstone National Park,
Wyoming, Montana, and Idaho, and the second spanning the Wasatch fault (Wasatch Front) of
northern and central Utah. The Yellowstone volcanic field and the Wasatch fault and are
actively deforming regions of the Basin-Range extensional tectonic regime with high seismic
hazards and a superimposed volcanic hazard at Yellowstone. These GPS networks are
supplemented by temporary GPS arrays that have been operated during field campaigns since
1987.
The University of Utah GPS networks are the key elements of crustal deformation
monitoring of the Yellowstone hotspot and Wasatch fault zone, designed to measure ground
deformation in parallel with seismic monitoring networks operated by the University of Utah
Seismograph Stations (UUSS). Ground deformation is related to active volcanic processes and
faulting in Yellowstone, and to faulting in Utah, hence the importance of GPS measurements in
understanding the distribution of volcanic and hydrothermal features, active faults,
contemporary fault loading, fault geometry, etc. The Yellowstone and Wasatch networks

2
extend across seismically active regions, with the potential for moderate to large earthquakes as
documented in historic and Late Quaternary geologic time. Moreover, magmatic and
hydrothermal activity at Yellowstone produces up to centimeters per year of deformation. Thus
GPS data provide important constraints on modeling and interpretation of active Yellowstone
volcanic processes.
This report provides an overview of the University of Utah GPS monitoring of these
active geologic regions, including network operations, data recording and processing, a
summary of data products, and a synopsis of key research findings based on our GPS
measurements.
Earthquakes and Volcanism in Yellowstone and the Wasatch Fault
Earthquakes in the Yellowstone and the Wasatch fault regions are part of the
Intermountain Seismic Belt (ISB), a 1400-km long geographic region of earthquakes and active
faulting extending from southern Utah north to Montana that bounds the actively extending
Basin-Range Province to the west and stable North America to the east [Smith and Arabasz,
1991]. The ISB is thus a region of elevated seismic hazard and active crustal deformation.
The Yellowstone-Snake River Plain (YSRP) volcanic field is a 17 Ma track of explosive
silicic volcanic centers that formed as the North America plate moved southwest across the
Yellowstone mantle hotspot (Figure 1) [Smith and Braile, 1994; Smith et al., 2009]. The
current center of YSRP volcanic activity is centered at the Yellowstone Plateau in Yellowstone
National Park [Christiansen, 2001, 2007].
October 14, 2010

3
Figure 1. Index map showing topography, earthquakes, and faults in the Intermountain seismic belt. The Yellowstone Plateau and Wasatch Front are marked by boxes. The Wasatch fault is represented by the heavy line in Utah. Earthquakes (81,411 events from the UUSS catalog, 1981-2010) of the Intermountain seismic belt are represented by red circles. Tectonic provinces are labeled in italics.
October 14, 2010

4
Yellowstone National Park is subject to a variety of geologic hazards because of its
combination of tectonic and volcanic activity: large earthquakes, hydrothermal explosions, and
volcanic eruptions ranging in style from small lava flows of a few cubic kilometers to giant,
caldera-forming explosive eruptions of over 1000 cubic kilometers. Over 3 million people visit
Yellowstone annually, primarily in the summer. Because Yellowstone National Park is remote
and the majority of the population is transient, there is limited infrastructure to deal with large-
scale disasters. Thus an understanding of its geologic hazards is critical for emergency
preparedness.
The Wasatch Front, centered on the Late Cenozoic Wasatch fault, is an urban corridor in
northern Utah (Figure 1). Approximately 2.2 million people, or 80% of the population of Utah,
live along the populated Wasatch Front, including Salt Lake City. The population is
concentrated in cities built upon deep alluvial basins bounded to the east by the Wasatch fault
and to the west by the Great Salt Lake, Oquirrh Mountains, and Utah Lake.
The Wasatch fault is the largest and most hazardous of the faults in the Wasatch Front,
capable of producing earthquakes with magnitudes greater than M7. Though the Wasatch fault
has not experienced large earthquakes in historic time, the Wasatch Front is active on a
microearthquake level (Figure 1) [Smith and Arabasz, 1995; Smith and Sbar, 1974]. The
largest historic earthquake in Utah was the 1934 Mw6.6 Hansel Valley earthquake to the north
of the Great Salt Lake [Doser, 1990] and persistent activity occurs east and west of the Wasatch
fault along nearby Late Quaternary faults.
October 14, 2010

5
Yellowstone Volcanic Field GPS Network
The Yellowstone GPS network presently contains 71 permanent stations in the
Yellowstone-Snake River Plain (YSRP) and surrounding area (Figure 2, Table S-1). Many of
these stations were originally installed and operated by the University of Utah (UU) starting in
1996 under the NSF Continental Dynamics program funding of the Yellowstone Hotspot
Geodynamics project. Many other stations were installed by the EarthScope Plate Boundary
Observatory (PBO) after 2005. Since 2007, network operations have transitioned to PBO
(Figure 3).
Figure 2. Map of the Yellowstone permanent GPS network. GPS stations are represented by white circles. The Yellowstone caldera is outlined in orange. Abbreviations for major regional faults are: LR=Lost River fault, LM=Lemhi fault, BV=Beaverhead fault, MD=Madison fault, HL=Hebgen Lake fault, TE=Teton fault, and GV=Grand Valley fault. Orange line marks the location of the Yellowstone caldera.
October 14, 2010
6
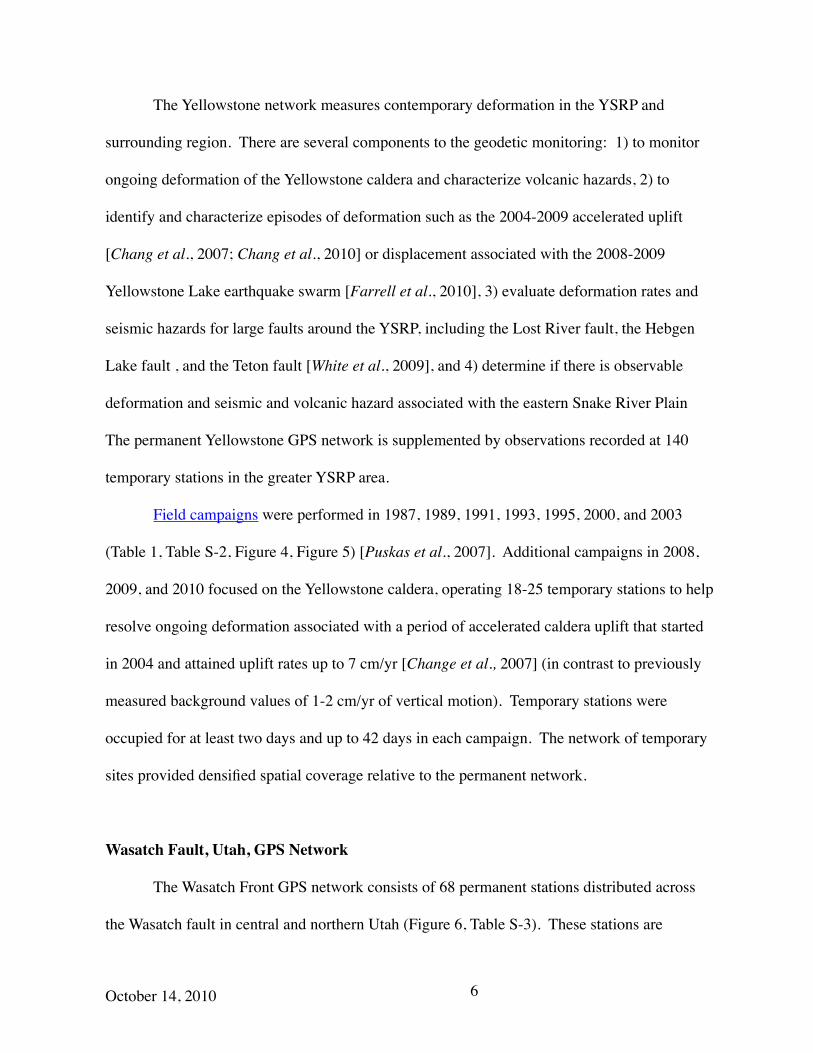
The Yellowstone network measures contemporary deformation in the YSRP and
surrounding region. There are several components to the geodetic monitoring: 1) to monitor
ongoing deformation of the Yellowstone caldera and characterize volcanic hazards, 2) to
identify and characterize episodes of deformation such as the 2004-2009 accelerated uplift
[Chang et al., 2007; Chang et al., 2010] or displacement associated with the 2008-2009
Yellowstone Lake earthquake swarm [Farrell et al., 2010], 3) evaluate deformation rates and
seismic hazards for large faults around the YSRP, including the Lost River fault, the Hebgen
Lake fault , and the Teton fault [White et al., 2009], and 4) determine if there is observable
deformation and seismic and volcanic hazard associated with the eastern Snake River Plain
The permanent Yellowstone GPS network is supplemented by observations recorded at 140
temporary stations in the greater YSRP area.
Field campaigns were performed in 1987, 1989, 1991, 1993, 1995, 2000, and 2003
(Table 1, Table S-2, Figure 4, Figure 5) [Puskas et al., 2007]. Additional campaigns in 2008,
2009, and 2010 focused on the Yellowstone caldera, operating 18-25 temporary stations to help
resolve ongoing deformation associated with a period of accelerated caldera uplift that started
in 2004 and attained uplift rates up to 7 cm/yr [Change et al., 2007] (in contrast to previously
measured background values of 1-2 cm/yr of vertical motion). Temporary stations were
occupied for at least two days and up to 42 days in each campaign. The network of temporary
sites provided densified spatial coverage relative to the permanent network.
Wasatch Fault, Utah, GPS Network
The Wasatch Front GPS network consists of 68 permanent stations distributed across
the Wasatch fault in central and northern Utah (Figure 6, Table S-3). These stations are
October 14, 2010

7
operated by the University of Utah, PBO, and the National Geodetic Survey (NGS). The
network began operation in 1997 with 8 stations installed during the first year.
The purpose of the network is to measure the contemporary distribution of deformation
across the Wasatch fault. The data are used to estimate slip rates and loading rates of the fault
for seismic hazard analysis. Variations in slip rates for different segments of the Wasatch fault
are being investigated, with consequent variations in hazard level for different parts of the
Wasatch fault. The GPS data are also being examined to identify possible loading on other
large regional faults.
Figure 3. History of installation of new stations for: a) the Yellowstone GPS network and b) the Wasatch GPS network. Heavy dark lines represent the cumulative number of stations in the network. Figure 4. Distribution of temporary GPS
station in the Yellowstone hotspot network (white circles) and Wasatch fault network (red circles).
October 14, 2010

8
The University of Utah has pioneered the use of GPS to measure deformation of the
Wasatch as a proxy for fault loading in a Probabilistic Seismic Hazard Assessment (PSHA)
described in Chang et al. [2002]. This study was very important for demonstrating the use of
GPS observations in area of low contemporary seismicity but high Late Quaternary fault slip
rate that characterizes this area of the Basin-Range.
The Wasatch fault permanent GPS network has been supplemented by field campaigns
at established surveyor benchmarks. There are 93 stations in the temporary network, and each
site typically had measurements taken over a period of two days or more during each campaign
(Table 1, Table S-4). Field campaigns were conducted in 1992, 1993, 1994, 1995, 1999, and
2001 [Chang, 2004; Martinez et al., 1998].
Table 1. List of University of Utah Yellowstone and Wasatch fault GPS field campaigns.
Year Area of Campaign Number of Stations
1987 Yellowstone-Teton 791989 Yellowstone-Teton 661991 Yellowstone-Teton 901992 Wasatch Front 261993 Wasatch Front 461993 Yellowstone-Teton 611994 Wasatch Front 1501995 Wasatch Front 411995 Greater YSRP region 1041999 Wasatch Front 432000 Greater YSRP region 1402001 Wasatch Front 52003 Yellowstone-Teton 792008 Yellowstone caldera 172009 Yellowstone caldera 172010 Yellowstone-Teton 25
Figure 5. Time distribution of GPS field campaigns. Colored bars represent the number of stations surveyed in a campaign, with Yellow for Yellowstone and orange for Wasatch campaigns.
October 14, 2010
9
University of Utah GPS Data Recording
The University of Utah GPS data are recorded at 15 to 30-second intervals in sessions
of 8 hours (for campaign stations) to 24 hours (for campaign and permanent stations). The data
file for each session is then converted to the Receiver Independent Exchange (RINEX) format,
the standard format for processing.
The GPS data are processed using the Bernese GPS software [Dach et al., 2007;
Rothacher and Mervart, 1996] using differential GPS techniques. For a given network, the
processing algorithms solve for the daily position of each station. These daily position
solutions are combined to obtain the change in position over time, or velocity. For permanent
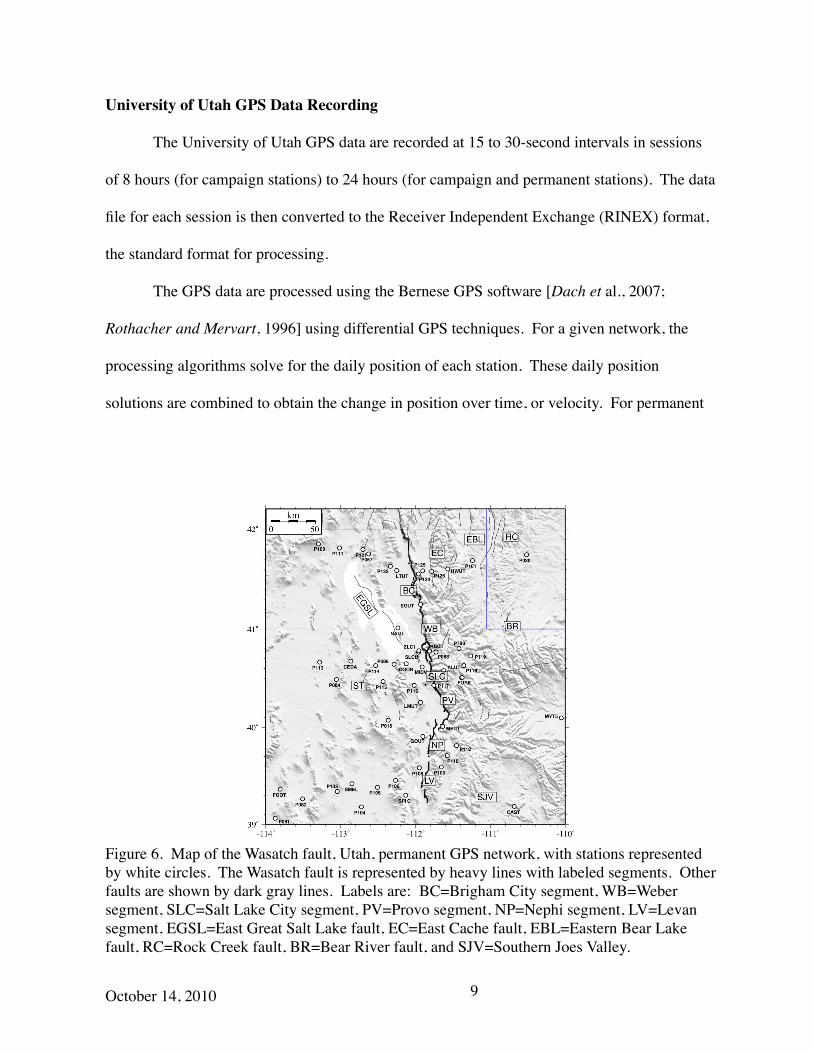
Figure 6. Map of the Wasatch fault, Utah, permanent GPS network, with stations represented by white circles. The Wasatch fault is represented by heavy lines with labeled segments. Other faults are shown by dark gray lines. Labels are: BC=Brigham City segment, WB=Weber segment, SLC=Salt Lake City segment, PV=Provo segment, NP=Nephi segment, LV=Levan segment, EGSL=East Great Salt Lake fault, EC=East Cache fault, EBL=Eastern Bear Lake fault, RC=Rock Creek fault, BR=Bear River fault, and SJV=Southern Joes Valley.
October 14, 2010

10
networks, hundreds of days’ worth of data are combined. For campaign data, campaigns may
be separated by months or years, so only the net change in position is determined.
GPS Satellite Ranging
Satellite ranging, or calculating the distance between a GPS receiver and GPS satellite,
is the basis of all GPS processing. Given the known position of at least four satellites and the
distance between the satellite and GPS station, it is possible to solve for the three components
of the station position (either x, y, z in an earth-centered Cartesian coordinate system, or
latitude, longitude, elevation in a spherical coordinate system). In practice there are many
sources of errors and biases, from satellite and station clocks, atmospheric effects, satellite
position errors, station equipment errors, relativistic effects, random errors, etc. Data
processing reduces or eliminates these errors and biases through various analytical and numeric
methods, as well as modeling.
The constellation of navigation satellites orbiting the Earth is the basis of the Global
Positioning System. The GPS satellites broadcast two carrier signals, generally referred to as
L1 and L2, with wavelengths of λ1=19 cm and λ2=24.4 cm [Dach et al., 2007]. The carrier
signals are modulated by two pseudo-random codes and a navigation message. The navigation
message contains information on the satellite clock, health, and orbit. The two pseudo-random
codes are called the P-code and C/A-code, or precise and coarse-acquisition code, respectively.
These codes contain sequences of pseudo-random noise, with unique segments of code
assigned to each satellite. The P-code has frequency 10 times that of the C/A-code, with a
consequent increase in precision by a factor of 10. Both the P and C/A-codes have lower
frequencies than the carrier frequencies.
October 14, 2010

11
Satellite positions at any given time are required to obtain the station position. The
broadcast orbit data are real-time but only accurate to ~2 m, and greater precision is required
for geodetic network monitoring. Instead, precise orbits from the International GNSS Service
(IGS) are downloaded from the IGS data center [Dow et al., 2009]. The IGS produces orbit
solutions that are accurate to less than 5 cm, the files are released with a latency of ~10 days.
The distance between a satellite and a receiver is known as the range. However, biases
and errors will limit the precision to which the range can be determined, and what is actually
measured is called the pseudorange. The pseudorange can be calculated from either the
broadcast codes or the phase of the carrier signals.
The code pseudorange is obtained by multiplying the travel time by the speed of light to
get the distance between satellite and receiver. The receiver generates a P or C/A-code
sequence and compares it to the signal received from a satellite. The time offset between the
two codes is equal to the travel time.
The phase pseudorange is calculated by solving for the integer number of cycles of the
carrier wave between the satellite and receiver. The integer number of cycles is known as the
phase ambiguity. The receiver actually measures the fractional phase at the time of signal
reception and counts the number of cycles since the satellite was first observed, i.e., the
receiver tracks the change in position of the satellite. Multiplying the phase ambiguity plus the
fractional phase by the wavelength will give the total distance to the satellite. The phase
ambiguity cannot be calculated directly but must be solved for using linear combinations of
multiple observations over time or eliminated using differencing techniques.
The precision of the pseudorange measurements depend on the frequency of the signal
used as the basis of the measurement [Wells et al., 1986; Hofmann-Wellenhof et al., 1992]. For
October 14, 2010

12
code pseudoranges based on the P and C/A codes, the predicted precision values are
approximately 30 cm and 3 m, respectively. For the phase pseudoranges based on the L1 and
L2 carrier signals, the precision would be 2 mm and 2.4 mm, respectively.
Future developments in navigation technology will lead to improved precision over the
coming years. The original GPS satellites are operated by the U.S. Department of Defense, but
other nations are planning or have launched new satellites. These satellites will broadcast on
different frequencies, opening new possibilities for processing. The GLONASS constellation,
launched by the Russian Federation Ministry of Defense, is already operational, while the
European Space Agency’s Galileo satellites and China’s Compass satellites will be launched
over the next decade. Although the new satellites have or will have different orbital parameters
and broadcast signals, the underlying mathematical principles for calculating receiver positions
will remain the same.
Differential GPS Processing
The University of Utah uses the techniques of differential GPS to attain the level of
precision required for scientific analysis. Ground deformation rates in the Yellowstone and
Wasatch networks range from less than 1 mm/yr to several cm/yr, necessitating careful
processing to resolve the lower velocities.
The purpose of differential GPS processing is to use various linear combinations and
numerical techniques to reduce or eliminate biases and errors where possible. For smaller
networks with baselines of tens of kilometers (less than ~30 km), there will be little variation in
atmospheric refraction over the network area, so the atmospheric errors will be approximately
October 14, 2010

13
the same at all stations. Each station will have its own receiver clock error, and each satellite
will have it own satellite clock and position errors.
Zero differences are basic pseudorange estimates with clock errors, troposphere and
ionosphere errors, and, in the case of phase observations, the phase ambiguities. Single
differences are the differences between two stations observing the same satellite at the same
time, i.e., baselines. Double differences are computed by subtracting two single difference
observations for two different satellites. Double differencing will eliminate satellite clock
errors and reduce receiver clock errors. Triple differences are computed by taking double
differences at different time epochs. Assuming that the receivers did not lose lock with the
satellite between the two time epochs, the triple differencing will eliminate phase ambiguities
and troposphere errors. Various combinations of the double difference observations are used
during processing to solve for phase ambiguities, ionospheric delays, and tropospheric models.
GPS processing begins with the downloading of data files (Figure 7). Data files include
GPS RINEX observation files, precise orbit files, satellite clock files, and earth rotation
parameters. Data files are imported into the Bernese format. Receiver clock errors are
calculated from code observations and satellite orbit and clock data. Single-difference
baselines are formed and checked for outliers and other problems. Double differences are
formed, and the Bernese code estimates the station coordinates along with various biases and
the phase ambiguities.
October 14, 2010

14
Figure 7. Flow chart illustrating the different steps in Bernese GPS processing (modified from Dach et al., 2007).
GPS Data Products
The GPS processing outputs daily position solutions along with relevant statistical data.
The daily coordinates typically have uncertainties less than 1 mm for the horizontal
components and less than 2 mm in the vertical component (Figure 8).
Earthquake and volcano hazard analysis and research require the change in position of
the ground with time, i.e., the ground velocity. Station velocities are estimated separately from
the daily solutions. The daily position solutions for all the stations in a network are all
correlated and in the same reference frame because they were processed together with
differential techniques, but each day is processed independently of the previous day.
October 14, 2010

15
To rigorously combine multiple days, each day’s network solution must be transformed
into the same reference frame through a Helmert transformation. In the Helmert
transformation, uniform rotations, translations, and scaling factors are applied to all stations in
the network for one day to bring the network into the desired reference frame. The reference
frame is defined by reference stations whose coordinates and velocities are known a priori. For
the permanent network data, the reference stations are typically IGS stations in a global
reference frame such as ITRF2000 [Calais et al., 2006], ITRF2005 [Altamimi et al., 2007], or
Stable North America [Blewitt et al., 2005]. Campaign network data before ~2000 used local
reference frames or an earlier version of the Stable North America reference frame [Bennett et
al., 2001]. The Stable North America reference frame is frequently used in studies of western
U.S. deformation, and holds the interior of the North America continent (i.e., North America
east of the Rocky Mountains) fixed so that deformation is with respect to the fixed interior.
Figure 8. Distribution of errors for components of station positions for all stations in the Yellowstone permanent GPS network in 2010 (January 1 – June 30). Colored bars represent the number of times a particular value or uncertainty was obtained for each component. Thelatitude (north) component is white, the longitude (east) component is red, and the vertical (up) component is blue. Uncertainties are given to the nearest 0.1 mm, but bars are scaled smaller to show north and east components.
October 14, 2010

16
Once the daily solutions are all in the same reference frame, the velocity of each station
can be estimated through a weighted least squares fit [Brockmann, 1996]. The station velocities
give the magnitude and direction of ground motion in the Wasatch Front and the YSRP (Figure
9).
Strain rates are a measure of the change in velocity over a geographical area and are
generally interpolated from the velocity data [Haines and Holt, 1993; Shen et al., 1996]. The
interpolations determine strain on a grid, where each grid square is assumed to deform
homogeneously. High strain rates are associated with regions of active deformation,
particularly active fault zones and volcanoes (Figure 10).
Figure 9. Velocity fields of a) the Yellowstone-Snake River Plain region and b) the Wasatch Front.
Figure 10. Strain rates of the Yellowstone-Snake River Plain and Wasatch fault zone from Puskas [2009]. Blue arrows represent contraction and red arrows represent extension in parts per billion.
October 14, 2010

17
The combination of daily solutions in the velocity estimate will produce a single set of
coordinates for the stations in the network. The residuals with respect to the combined
coordinate solutions can be plotted in a time series as an alternate way to represent change in
position over time (Figure 11). The velocity calculations assume a constant rate at the station
for a given time period. This assumption is generally true in non-volcanic settings over long
time periods of many years [Langbein, 2008], but short-term fluctuations can bias velocities at
stations operating for less than 2-3 years. Such short-term fluctuations from seasonal water
cycles, earthquakes, or volcanic activity can be identified from time series data.
Figure 11. Example of GPS coordinate time series for station at the Lake Junction (LKWY) in Yellowstone National Park showing the change in position over time. The time series reveals the accelerated uplift of the Yellowstone caldera beginning in 2004 and ending in 2009 [Chang et al., 2007]. The red points represent the daily position change and the black lines represent the filtered deformation trend.
October 14, 2010

18
The University of Utah Seismology and Active Tectonics Research Group posts station
velocities for the Wasatch network and Yellowstone network to their web site. Time series of
individual stations’ position changes are also available for the Yellowstone and Wasatch
regions. Additionally, PBO (GAMIT) and the USGS (Gypsy) processes most of the University
of Utah stations and posts them daily. These organizations use different processing software
and provide comparisons with our Bernese-determined solutions.
Analysis of GPS Time Series
The time series of individual stations are analyzed for temporal variations, frequency
content, and noise characteristics. In addition, GPS time series are affected by white and
colored noise [Langbein, 2008; Mao et al., 1999] that is related to GPS monument stability and
local site and atmospheric effects. The time series also contain geologically related low-
frequency signals with periods ranging from months to years (Figure 12). The low-frequency
signals can be related to magmatic processes [Chang et al., 2007; Chang et al., 2010], post-
seismic deformation [Chang and Smith, 2010], co-seismic deformation [Farrell et al., 2010], or
hydrologic loading. Much of the research at the University of Utah is focused on the
Yellowstone caldera as well as earthquake behavior, so the ability to distinguish between
contributing sources of deformation is important.
Over long time periods of several (>3-5) years, GPS-derived velocities will generally
average out to long-term rates (Figure 13). However, data from stations for shorter time
periods are subject to noise and seasonal variations that may bias velocity calculations.
Seasonal variations (Figure 13) are generally related to hydrological processes such as
groundwater recharge and discharge in aquifers, surface water flow, and snow and lake loading.
October 14, 2010

19
These cycles depend on annual precipitation, how much of the precipitation is stored as
snowpack over the winter, and the rate at which meteoric water enters the groundwater system
or lakes and reservoirs.
GPS position time series can be converted to velocity time series by taking the time
derivative. This is done by using a least-squares method to fit the change in deformation in a
given time period (Figure 12). The velocity time series are very sensitive to the time window
Figure 12. Power spectrum for components of GPS station LKWY at Lake, Wyoming. The power represents the distribution of energy over a range of frequencies. Most of the energy is in the low-frequency signals.
Figure 13. Sample coordinate time series for station LKWY. Black lines represent fitted data that use different parameters: a) long-term trend when deformation signals with periods less than 365 days are removed, b) intermediate trend when signals with periods less than 180 days are removed, and c) short-term deformation from detrended data. The long-term trend was subtracted from the data to get the detrended time series, and the fit was then smoothed with a 30-day lowpass filter.
October 14, 2010

20
Figure 14. Vertical velocity changes for station LKWY, Wyoming: a) velocities calculated for deformation data filtered with a 1-year lowpass filter, and b) velocities calculated for deformation data filtered with a 6-month lowpass filter. Velocities were taken by calculating the slope of a 30-day time window of the filtered deformation time series (Figure 13).
length and the lowpass filtering parameters used to remove seasonal and other high-
frequency motion. Filtering parameters are being analyzed to best constrain the transition
from uplift to subsidence in the Yellowstone caldera (Figure 14).
Seasonal Variations in Deformation
One project uses seasonal-trend decomposition [Cleveland et al., 1990] and
frequency analysis to separate long-term trends into short-term seasonal deformation and
long-term trends (Figure 12, 13). Applied to stations in the Yellowstone network,
filtering reveals that the seasonal components of deformation (period=365 days) have a
October 14, 2010

21
peak-to-peak amplitude of up to 2 cm in the vertical component and 0.5-1 cm in the
horizontal component. In the Yellowstone caldera peak uplift occurs from winter through
spring and maximum subsidence is observed during the summer (Figure 13). Not all
stations exhibit regular seasonal deformation.
Hydrologic factors not only affect short-term deformation but can bias long-term
measurements as well. Climatic variations in precipitation rates are known to affect lake
levels on a decadal scale, and groundwater dynamics can be similarly affected. In
populated and agricultural areas, groundwater pumping is known to cause permanent
subsidence that can continue for many years after pumping has ceased [Galloway et al.,
1999].
Groundwater pumping is expected to affect the Wasatch Front, where there are
numerous wells in the various valleys, but not the Yellowstone Plateau, where there is
minimal infrastructure development. Deformation response to hydrologic changes also
depends on the characteristics of the regional aquifers. Groundwater in the Wasatch
Front is stored in the unconsolidated sediments of the interconnected, shallow basins of
the Basin-Range tectonic province [Robson and Banta, 1995]. In Yellowstone,
groundwater is stored in basin fill, alluvial deposits, and glacial sediments as well as
volcanic rocks [Whitehead, 1996].
Real-Time GPS Measurements For Deformation Monitoring and Seismic Recording
The Yellowstone GPS network is being partially updated to real-time streaming
by the UNAVCO engineering team and with support from the USGS ARRA funds. In
2010, seven stations will be upgraded to full real-time streaming. The Yellowstone
October 14, 2010
22
streamed GPS data will be processed for real-time coordinates by the PBO GPS facility
then imported into the University of Utah GPS recording facility. Our goal is to employ
real-time GPS coordinate data for rapid response in case of earthquake or volcanic
activity in Yellowstone as well as importing the processed coordinate data into the
University of Utah Seismograph Stations AQMS earthquake recording network, where
the data will be treated as seismic coordinate data and integrated into the earthquake
analysis.
University of Utah GPS-Related Research Projects
The GPS stations of the University of Utah networks measure ground deformation
on the scale of days to years. These data are suitable for examining a range of tectonic
and volcanic processes and have been the basis of research projects on the earthquake
cycle, Yellowstone magma migration and intrusion, and large-scale intraplate
deformation. Recent GPS research projects are summarized in Table 2. The University
of Utah and partners have published a number of papers focusing on the YSRP or
Wasatch, and many of the more recent papers incorporate GPS data into models of
faulting, magmatism, and regional tectonics.
Projects involve studies of magma/volcanic fluid migration [Chang et al., 2010;
Farrell et al., 2010; Waite and Smith, 2002] and earthquakes and related interseismic
loading at the Yellowstone Plateau and the Wasatch Front [Chang and Smith, 2002; White
et al., 2009] (Figure 13). The expansion of the EarthScope Plate Boundary Observatory
(PBO) GPS network between 2006 and 2008 has supplemented the concomitantly
expanding University of Utah networks and allows kinematic analysis of
October 14, 2010

23
Table 2. List of recently published University of Utah research papers that incorporate GPS data.Reference SubjectChang and Smith [2002] Seismic hazards of the Wasatch Front; stress contagion between fault
segmentsWaite and Smith [2004] Stress field in the Yellowstone PlateauChang et al. [2006] Deformation of the Wasatch FrontPuskas et al. [2007] Cycles of deformation in the Yellowstone caldera and regional deformation
of the YSRP from 1987 to 2003Vasco et al. [2007] Source models of Yellowstone deformationChang et al. [2007] Rapid uplift of Yellowstone caldera starting in 2004Puskas and Smith [2009] Block modeling of western U.S. deformationWhite et al. [2009] Seismic hazards of the Teton-Yellowstone regionFarrell et al. [2010 The 2008-2009 Yellowstone Lake earthquake swarmChang et al. [2010] The extraordinary Yellowstone caldera uplift episode, 2004-2010, from
GPS and InSAR observations
several large faults including the Wasatch, Teton, and Hebgen Lake faults. The western
U.S. deformation data are further being used to constrain regional stress models based on
lithospheric structure.
Numerous recent research projects have focused on understanding the relationship
between ground deformation and faulting or volcanism. The use of GPS data has helped
constrain seismic hazard assessments of the Wasatch fault [Chang and Smith, 2002;
Chang et al., 2006] and Teton fault [White et al., 2009], magma migration and storage in
the Yellowstone Plateau [Chang et al., 2007; Vasco et al., 2007; Chang et al., 2010],
earthquakes and volcanism in Yellowstone [Waite and Smith, 2002; Farrell et al., 2010],
and regional tectonics and geodynamics [Waite and Smith, 2004; Puskas and Smith,
2009; Puskas, 2009].
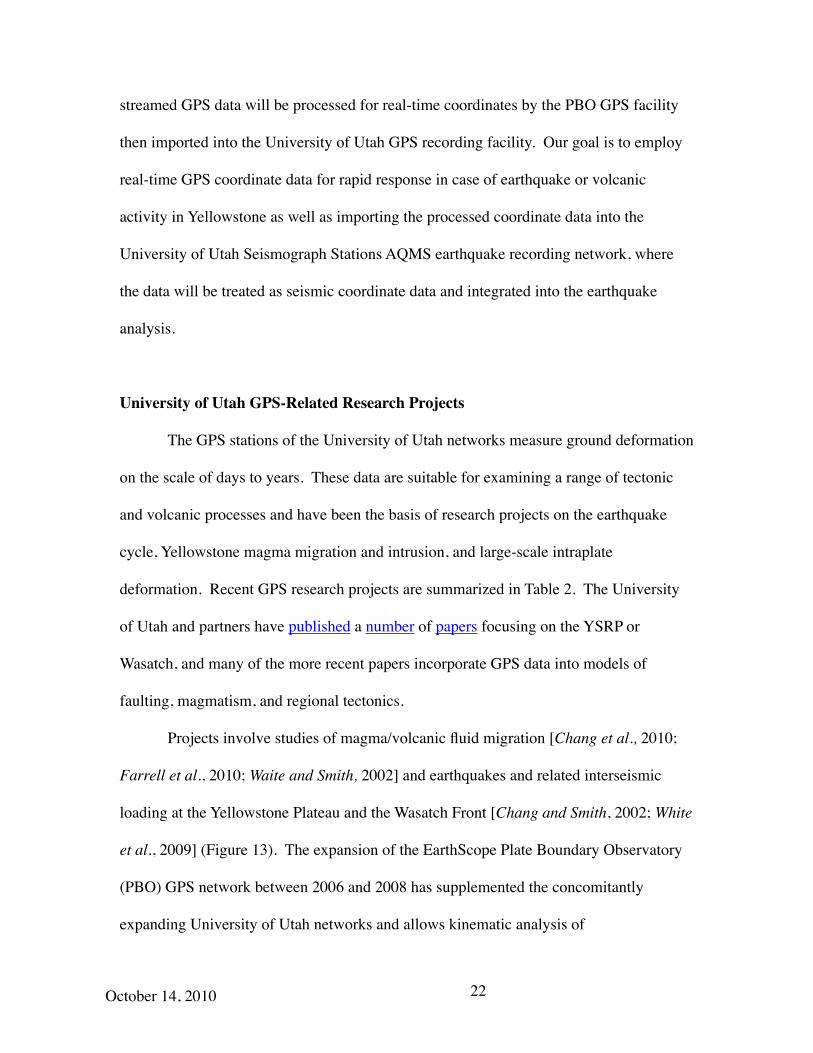
Chang and Smith [2002, 2006] integrated GPS data, historic earthquakes, and
prehistoric earthquakes to characterize the seismic hazards and kinematics of the Wasatch
October 14, 2010

24
fault. Their models of stress contagion following large earthquakes and examination of
prehistoric earthquakes was consistent with multi-segment ruptures of the Wasatch fault
clustered together in time, with earthquakes having characteristic magnitudes of M>6.6.
They found GPS-derived slip rates exceeded geologic slip rates derived from past large
earthquakes and proposed that aseismic creep may contribute to the discrepancy, or that
earthquake loading may be irregular in time. The inclusion of GPS data in the calculation
of annual frequencies of exceedence of peak ground acceleration >0.25 g resulted in an
increase in annual frequencies by a factor of 4 compared to the values from historic
seismicity only (Figure 15). They also resolved 1.6 ± 0.4 mm/yr extension across the
fault, with approximately 50% of the deformation of the 200-km wide eastern Basin-
Range tectonic province being concentrated at the Wasatch fault.
Puskas et al. [2007] processed campaign GPS data from 1987 through 2003 in the
Yellowstone Plateau and eastern Snake River Plain and identified cycles of uplift and
subsidence in the Yellowstone caldera (Figure 16). Deformation sources associated with
these cycles were modeled by Vasco et al. [2007], who combined GPS velocity data with
Interferometric Synthetic Aperture Radar (InSAR) for the periods 1996-2000 (northwest
caldera uplift) and 2000-2002 (caldera subsidence). The deformation sources were
imaged as inflating or deflating bodies at 6-10 km depths, at the top of the
tomographically imaged magma reservoir [Husen et al., 2004]. When the Yellowstone
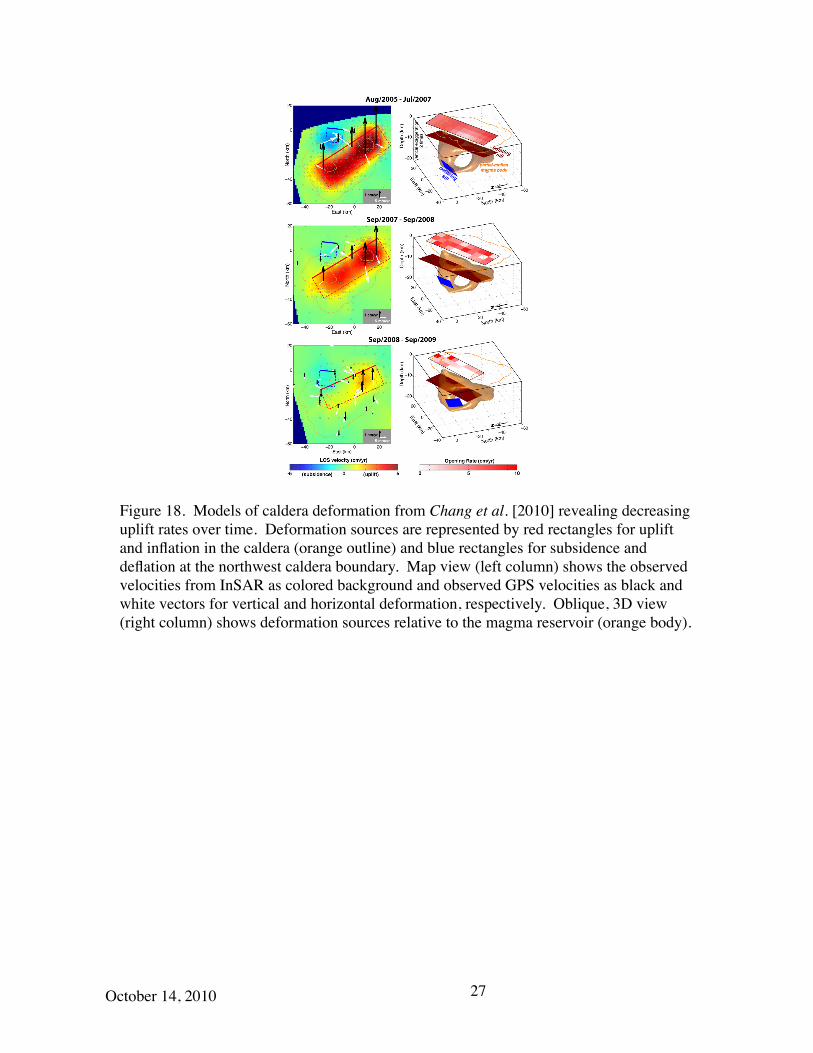
caldera began a rapid uplift episode in 2004, Chang et al. [2007] similarly used
permanent GPS data and InSAR data to model the source as a sill near the top of the
magma reservoir (Figure 17). They interpreted the accelerated uplift as the effect of
October 14, 2010
25
Figure 15. Probabilistic seismic hazard determinations (a) and ground-shaking hazard (b) of the Wasatch fault [Chang and Smith, 2002]. The cumulative annual frequency depends on the loading rate of the fault. The loading rate is estimated from historic earthquake rates, prehistoric large earthquake rates, and GPS measurements.
magma recharge in the reservoir and modeled the surface deformation as the result of a
volcanic sill (Figure 18).
Puskas and Smith [2009] compiled over 2000 GPS velocity measurements in the
western U. S. and used the data to model the kinematics of western U.S. deformation.
The southwest motion of the YSRP and westward extension at the Wasatch Front are
components of a large-scale rotation of the direction of deformation (Figures 19, 20).
October 14, 2010

26
Figure 16. GPS time windows of Puskas et al. [2007]. Vectors represent horizontal motion measured during GPS campaigns. Colored backgrounds represent vertical motion.
Figure 17. Rapid uplift (a) and sill model at top of magma reservoir (b) of Chang et al. [2007]. White vectors represent GPS-measured horizontal motion and black vectors represent GPS-measured vertical motion. The colored background represents near-vertical deformation measured by InSAR interferometry.
October 14, 2010
27
Figure 18. Models of caldera deformation from Chang et al. [2010] revealing decreasing uplift rates over time. Deformation sources are represented by red rectangles for uplift and inflation in the caldera (orange outline) and blue rectangles for subsidence and deflation at the northwest caldera boundary. Map view (left column) shows the observed velocities from InSAR as colored background and observed GPS velocities as black and white vectors for vertical and horizontal deformation, respectively. Oblique, 3D view (right column) shows deformation sources relative to the magma reservoir (orange body).
October 14, 2010

28
Figure 19. Compilation of western U.S. velocity vectors (a) and interpolated model of deformation (b).
Figure 20. Summary of western U.S. deformation from GPS measurements [Puskas and Smith [2009]. Block velocities are shown as black arrows, while the large white arrows indicate the general sense of regional motion and are not to scale. Colored regions highlight deformation types: blue represents extensional domains, red represents shear domains, and orange represents contracting domains.
October 14, 2010

29
The pattern of deformation is interpreted as being caused by interplate
interactions at the western North America plate boundary, gravitational collapse of the
Basin-Range, and stress perturbations from the topographic swell associated with the
Yellowstone hotspot. Western U.S. stress modeling [Puskas, 2009] indicates that the
Yellowstone hotspot swell contributes significantly to regional extension, while plate
boundary interactions between the North America tectonic plate and the Juan de Fuca
plate in the Cascadia subduction zone and Pacific plate at the San Andreas fault zone also
help determine the regional pattern of rotation. Earlier regional stress studies of the
YSRP [Waite and Smith, 2004] had noted the changes in stress direction associated with
the Yellowstone hotspot swell and its importance in western U.S. tectonics.
The Yellowstone topographic swell increases the potential energy by increasing
the regional crustal density structure. The gravitational potential energy can be calculated
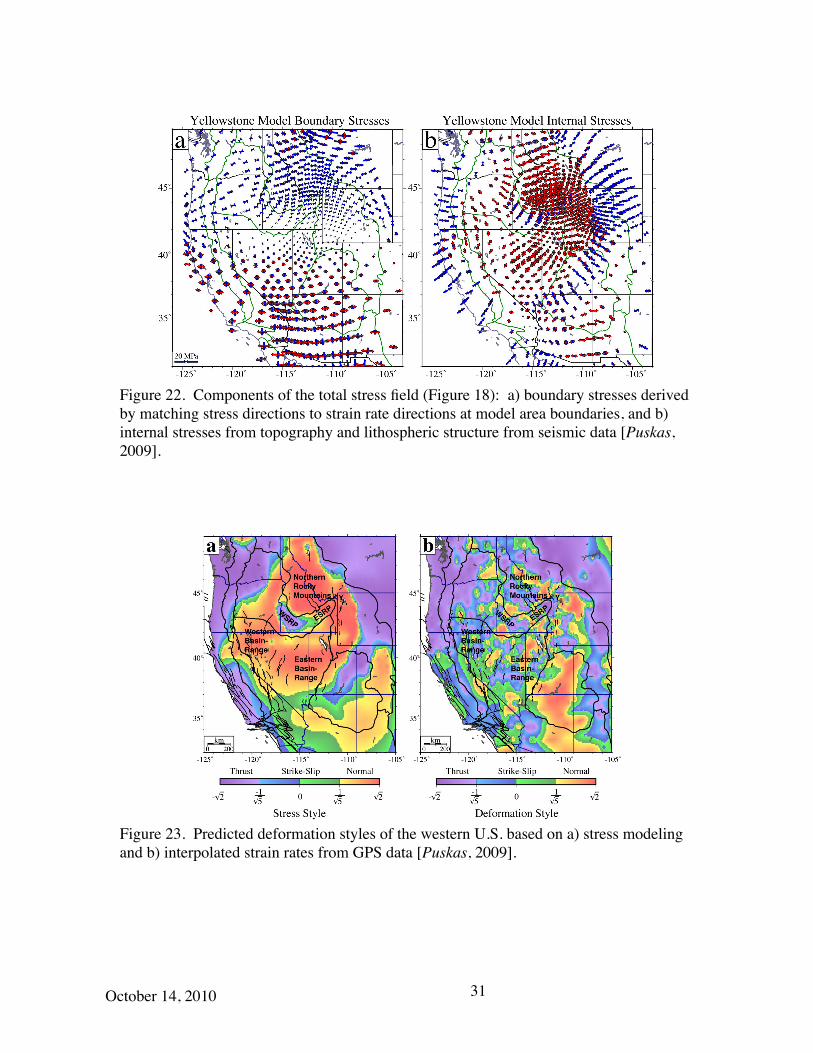
based on topography and lithospheric density structure (Figure 21) [Puskas, 2009]. The
average horizontal stress field was derived from the gravitational potential energy and
constrained by the western U.S. strain rate field (Figure 22). The resulting stress models
confirmed the importance of interplate interactions driving rotation in western U.S.
deformation, and revealed how the high elevations of the Yellowstone hotspot
topographic swell produce regional extension (Figure 23). However, thermal subsidence
of the eastern Snake River Plain, combined with magmatic intrusions into the crust, act to
reduce the gravitational potential energy and stress magnitudes in the YSRP (Figure 21).
The reduced stresses may contribute to the reduced earthquake activity within the Snake
River Plain (Figure 1). However, the stress model does not match the strain rate model
exactly (Figure 23), and it is hypothesized that combinations of time-dependent
October 14, 2010

30
deformation, shallow deformation sources, and small-scale variations in the stress field
below the model’s resolution all contribute variations in the observed GPS velocities and
lead to localized misfit with the stress model. Other factors such as coupling of the
lithosphere to mantle flow can also lead to misfit, because they are not accounted for in
the stress modeling.
Figure 21. Gravitational potential energy (color background) of the western U.S., with average horizontal stresses in the lithosphere represented by red arrows (tension) and blue arrows (compression). The Yellowstone hotspot swell is marked by the shaded region.
October 14, 2010
31
Figure 22. Components of the total stress field (Figure 18): a) boundary stresses derived by matching stress directions to strain rate directions at model area boundaries, and b) internal stresses from topography and lithospheric structure from seismic data [Puskas, 2009].
Figure 23. Predicted deformation styles of the western U.S. based on a) stress modeling and b) interpolated strain rates from GPS data [Puskas, 2009].
October 14, 2010

32
The interaction of the Yellowstone mantle plume with the North America tectonic
plate was explored by Smith et al. [2009]. This study reveals the importance of
Yellowstone’s plume as the source driving volcanism of the Columbia flood basalts
starting 16 million years ago and then the volcanism of the YSRP. This volcanic activity
has altered the topography and lithospheric structure of the YSRP and altered the regional
stress field, resulting in volcanic landforms and processes observed today.
Research based on GPS-measured ground motion leads to a better understanding
of the processes of faulting and volcanism, and the subsurface structures that are the
sources of deformation. With combined seismic data, fault-slip data, other geodetic
measurements, it has become possible to model the stresses driving deformation.
Furthermore, we can integrate our knowledge of the Wasatch fault and Yellowstone
volcanic field into the larger tectonic framework. In this framework, the Wasatch fault is
part of a major tectonic boundary between the stable North America plate interior and the
rapidly deforming western U.S., while the Yellowstone hotspot is a mantle-derived source
of volcanism that has affected deformation rates and directions over a large part of the
western U.S.
Acknowledgements
Collaborators in the Yellowstone and Wasatch fault GPS projects included Charles
Meertens, Suzette Payne, Ronald Harris, Dan Dzurisin, Anthony Lowry, Henry Heasler
and Rob Reilinger. Field and technical assistance was provided by David Drobeck. We
appreciate the support for data acquisition of our Yellowstone projects from the National
Science Foundation, the U.S. Geological Survey Volcano Hazards Program (Cooperative
Agreement #07HQAG0024), Yellowstone and Grand Teton National Parks, the Idaho
October 14, 2010

33
National Laboratory, the EarthScope Plate Boundary Observatory, and the Utah
Geological Survey. Long-term Yellowstone hotspot research was primarily supported by
the NSF Continental Dynamics program grants #EAR 9725431, 0314298, 9725431, and
9316289. The Wasatch fault GPS project was supported by the U.S. Geological Survey
NEHRP (National Earthquake Hazard Reduction Program) grants 02HQGR0098,
04HQAG0023, 07HQAG0027, G10AC00159. The University of Utah provided
computational support and the University of Utah Seismograph Stations provided
engineering support for GPS monitoring. UNAVCO provided GPS instruments for
campaign surveys and the EarthScope PBO program has supported the Yellowstone and
Wasatch fault continuous GPS networks under the NSF EarthScope Plate Boundary
Observatory (EAR-0350028 and EAR-0732947). Support for the UNAVCO equipment
and services that we used during the Wasatch and Yellowstone campaigns came from the
National Science Foundation and National Aeronautics and Space Administration under
NSF Cooperative Agreement EAR-0735156.
The University of Utah originally installed and operated the permanent GPS
stations in the Yellowstone and Wasatch GPS networks. After the implementation of the
EarthScope program and the installation of the PBO network, most of the university
stations have been transferred to PBO (see supplementary material for current status of
stations).
October 14, 2010

34
ReferencesAltamimi, Z., X. Collilieux, J. Legrand, B. Garayt, and C. Boucher (2007), ITRF2005: A
new release of the International Terrestrial Reference Frame based on time series of station positions and earth orientation parameters, J. Geophys. Res., 112(B9), doi: 10.1029/2007JB004949.
Bennett, R, A., J. L. Davis, J. E. Normandeau, and B. P. Wernicke, (2001), Space geodetic measurements of plate boundary deformation in the western U.S. Cordillera, in Plate Boundary Zones, edited by S. Stein and J. Freymueller, pp. 27-55, AGU, Washington, D.C.
Blewitt, G., D. Argus, R. Bennett, Y. Bock, E. Calais, M. Craymer, J. Davis, T. Dixon, J. Freymueller, T. Herring, D. Johnson, K. Larson, M. Miller, G. Sella, R. Snay, M. Tamisiea, (2005), A Stable North American Reference Frame (SNARF): First Release, Proceedings of the Joint UNAVCO/IRIS Workshop, Stevenson, WA, USA, June 9–11.
Brockmann, E. (1996), Combination of solutions for geodetic and geodynamic applications of the Global Positioning System (GPS), Ph.D dissertation, 211 pp., University of Bern, Bern, Switzerland.
Byrd, J.O.D., R.B. Smith, and J.W. Geissman, (1994), The Teton Fault, Wyoming: topographic signature, neotectonics and mechanisms of deformation, J. Geophys. Res., 99, 20,095-20,122.
Calais, E., J. Y. Han, C. DeMets, and J. M. Nocquet, (2006), Deformation of the North American plate interior from a decade of continuous GPS measurements, J. Geophys. Res., 111, B06402, doi:10.1029/2005JB004523.
Chang, W. L., (2004), GPS (Global Positioning System) studies of the Wasatch Fault Zone, Utah, with implications for elastic and viscoelastic fault behavior and earthquake hazard, Ph.D dissertation, 201 pp., University of Utah, Salt Lake City, Utah.
Chang, W. L., and R. B. Smith, (2002), Integrated seismic-hazard analysis of the Wasatch Front, Utah, Bull. Seis. Soc. Am., 92(5), 1904-1922.
Chang, W. L., and R. B. Smith, (2010), Lithospheric rheology from postseismic deformation of a M=7.5 normal-faulting earthquake with implications for continental kinematics, unpublished manuscript.
Chang, W. L., R. B. Smith, C. Wicks, J. Farrell, and C. M. Puskas, (2007), Accelerated uplift and magma intrusion of the Yellowstone caldera, 2004-2006, Science, doi:10.1126/science.1146842.
Chang, W. L., R. B. Smith, C. M. Meertens, and R. A. Harris, (2006), Contemporary
October 14, 2010

35
deformation of the Wasatch Fault, Utah, from GPS measurements with implications for interseismic fault behavior and earthquake hazard: Observations and kinematic analysis, J. Geophys. Res., 111, B11405, doi:10.1029/2006JB004326.
Chang, W.L., R. B. Smith, C. Wicks, J. Farrell, and C. M. Puskas, (2010), Magmatic source modeling of temporal variations of high uplift rates in the Yellowstone caldera, 2004-2009, Geophys. Res. Lett., (in press).
Christiansen, R. L., (2001), The Quaternary and Pliocene Yellowstone Plateau volcanic field of Wyoming, Idaho, and Montana, U. S. Geol. Surv. Prof. Pap. 729-G, 120 pp., U. S. Geol. Surv., Denver, CO.
Christiansen, R. L., J. B. Lowenstern, R. B. Smith, H. Heasler, L. A. Morgan, M. Natenson, L. G. Mastin, L. J. P. Muffler, and J. E. Robinson, (2007), Preliminary assessment of volcanic and hydrothermal hazards in Yellowstone National Park and vicinity, U. S. Geol. Surv. Open-file Report 2007-1071, 94 pp., U. S. Geol. Surv., Denver, CO.
Cleveland, R. B., W. S. Cleveland, J. E. McRae, and I. Terpenning, 1990, STL: A seasonal-trend decomposition procedure based on Loess, J. Off. Sta., 6(1), 3-73.
Dach, R., U. Hugentobler, P. Fridez, M. Meindl, (Eds.), (2007), Bernese GPS Software Version 5.0, 612 pp., Astronomical Institute Univ. of Berne, Berne, Switzerland.
Dow, J. M., R. E. Neilan, and C. Rizos, (2009), The International GNSS Service in a changing landscape of Global Navigational Satellite Systems, J. Geod., 83, 191-198, doi:10.1007/s00190-008-0300-3.
Farrell, J., S. Husen and R.B. Smith, (2009), Earthquake swarm identification and b-value mapping of the Yellowstone volcanic-tectonic system, J. Vol. Geotherm. Res., 188, 260-276, doi:10.1016/j.jvolgeores.2009.08.008.
Farrell, J., R.B. Smith, T. Taira, W.L. Chang, and C.M. Puskas, (2010), Dynamics of the intense 2008-2009 Yellowstone Lake earthquake swarm, Geophys. Res. Lett., (in press).
Galloway, D. I., D. R. Jones, and S. E. Ingebritsen, (1999), Land subsidence in the United States, U.S. Geol. Surv. Circular 1182, 177p.
Haines, A. J., and W. E. Holt, (1993), A procedure for obtaining the complete horizontal motions within zones of distributed deformation from the inversion of strain rate data, J. Geophys. Res., 98(B7), 12,057-12,082.
Hofmann-Wellenhof, B., H. Lichtenegger, and J. Collins, (1992), Global Positioning System: Theory and Practice, 2nd ed., 326 pp., Springer-Verlag, New York.
October 14, 2010
36
Husen, S., R. B. Smith, and G. P. Waite, (2004), Evidence for gas and magmatic sources beneath the Yellowstone volcanic field from seismic tomographic imaging, J. Volc. and Geotherm. Res., 131, 397-410, doi:10.1016/S0377-0273(03)00416-5.
Langbein, J., (2008), Noise in GPS displacement measurements from Southern California and Southern Nevada, J. Geophys. Res., 113, B05405, doi:10.1029/2007JB005247.
Mao, A., C. G. A. Harrison, and T. H. Dixon, (1999), Noise in GPS coordinate time series, J. Geophys. Res., 104(B2), 2797-2816.
Martinez, L., C.M. Meertens, and R.B. Smith, (1998), Rapid deformation rates along the Wasatch fault zone, Utah, from first GPS measurements with implications for earthquake hazard, Geophys. Res. Lett., 25, 567-570.
Pechmann, J. C., and W. J. Arabasz, (1995), The problem of the random earthquake in seismic hazard analysis: Wasatch Front region, Utah, in Environmental and Engineering Geology of the Wasatch Front Region: 1995 Symposium and Field Conference, W. R. Lund (Editor), Utah Geol. Assoc., 77-93.
Puskas, C. M., (2009), Contemporary deformation, kinematics, and dynamics of the Yellowstone hotspot and western U.S interior from GPS, fault slip rates, and earthquake data, Ph.D dissertation, 368 pp., University of Utah, Salt Lake City, Utah.
Puskas, C. M., and R. B. Smith, (2009), Intraplate Deformation and Microplate Tectonics of the Yellowstone Hotspot and Surrounding Western U.S. Interior, J. Geophys. Res., 114, B04410, doi:10.1029/2008JB005940.
Puskas, C. M., R. B. Smith, C. M. Meertens, and W. L. Chang, (2007), Crustal deformation of the Yellowstone-Snake River Plain volcanic system: campaign and continuous GPS observations, 1987-2004, J. Geophys. Res., 112, B03401, doi:10.1029/2006JB004325.
Robson, S. G., and E. R. Banta, (1995), Ground water atlas of the United States Arizona, Colorado, New Mexico, Utah, U.S. Geol. Surv. Hydrological Investigations Atlas, HA 730-C.
Rothacher, M., and L. Mervart (Eds.) (1996), Bernese GPS Software Version 4.0, 418 pp., Astronomical Institute Univ. of Berne, Berne, Switzerland.
Shen, Z. K., D. D. Jackson, B. X. Ge, (1996), Crustal deformation across and beyond the Los Angeles basin from geodetic measurements, J. Geophys. Res., 101, 27,957-27,980.
October 14, 2010

37
Smith, R. B., and W. J. Arabasz, (1991), Seismicity of the Intermountain Seismic Belt, in Neotectonics of North America, edited by D.B. Slemmons, E.R. Engdahl, M.D. Zoback, and D.D. Blackwell, pp. 185-228, Geological Survey of America.
Smith, R. B., and L. W. Braile, (1994), The Yellowstone hotspot, J. Volc. and Geotherm. Res., 61, 121-187.
Smith, R. B., and M. L. Sbar, (1974), Contemporary tectonics and seismicity of the western United States with emphasis on the Intermountain Seismic Belt, Geol. Soc. Am. Bull., 85, 1205-1218.
Smith, R.B., M. Jordan, B. Steinberger, C. Puskas, J. Farrell, G. P. Waite, S. Husen, W. Chang, and R. O’Connell, (2009), Geodynamics of the Yellowstone hotspot and mantle plume: Seismic and GPS imaging, kinematics, mantle flow, J. Volc. and Geotherm. Res., 188(103), 26-65, doi:10.1016/j.jvolgeores.2009.08.020.
Spudich, P., J., W. B. Joyner, A. G. Lindh, D. M. Boore, B. M. Margaris, and J. B. Fletcher, (1999), SEA99: A revised ground motion prediction relation for use in extensional tectonic regimes, Bull. Seismol. Soc. Am. 89, 1156-1170.
Vasco, D. W., C. M. Puskas, R. B. Smith, and C. M. Meertens, (2007), Crustal deformation and source models of the Yellowstone volcanic field from geodetic data, J. Geophys. Res., 112, B07402, doi:10.1029/2006JB004641.
Waite, G. P., and R. B. Smith, (2002), Seismic evidence for fluid migration accompanying subsidence of the Yellowstone caldera, J. Geophys. Res., 107(B9), 2177, doi:10.1029/2001JB000586.
Waite, G. P., and R. B. Smith, (2004), Seismotectonics and stress field of the Yellowstone volcanic plateau from earthquake first-motions and other indicators, J. Geophys. Res., 109, B02301, doi:10.1029/2003JB00267.
Wells, D. E., N. Beck, D. Delikaraoglou, A. Kleusberg, E. J. Krakiwsky, G. Lachapelle, R. B. Langley, M. Nakiboglu, K. P. Schwartz, J. M. Tranquilla, and P. Vanicek, (1986), Guide to GPS Positioning, Canadian GPS associates, Fredericton, N.B., Canada.
White, B. J. P., R. B. Smith, S. Husen, J. Farrell and I. Wong, 2009, Seismicity and earthquake hazard analysis of the Teton-Yellowstone region, Wyoming, , J. Vol. Geotherm. Res, 188, 277-296, doi:10.1016/j.jvolgeores.2009.08.015.
Whitehead, R. L., (1996), Ground water atlas of the United States Montana, North Dakota, South Dakota, Wyoming, U.S. Geol. Surv. Hydrological Investigations Atlas, HA 730-C.
October 14, 2010

38
Supplemental MaterialThis section contains GPS station coordinate lists from the University of Utah’s
permanent networks and campaign networks.
October 14, 2010

39
Table S-1. Permanent GPS Stations in the Yellowstone Network.
Station Longitude LatitudeOperating Agency
AHID -111.064 42.773PBOBBID -111.526 44.185PBOBCYI -113.406 44.316PBOBLW2 -109.558 42.767PBOBLWYa -109.558 42.767PBOGTRG -113.241 43.244PBOHLID -114.414 43.563PBOHPIG -113.100 43.713PBOHVWY -110.536 44.614PBOLKWY -110.400 44.565PBOMAWY -110.689 44.973PBONOMT -111.630 45.597PBOOFW2 -110.831 44.451PBOOFWYa -110.832 44.452PBONRWY -110.678 44.715PBOTCSG -113.478 43.619PBOTSWY -110.597 43.674PBOWLWY -110.287 44.640PBOP045 -112.617 45.383PBOP048 -111.204 45.653PBOP051 -108.546 45.807PBOP351 -114.719 43.874PBOP352 -114.096 43.849PBOP353 -113.979 44.055PBOP354 -113.979 44.109PBOP355 -113.722 44.218PBOP356 -110.489 43.817PBOP357 -113.582 44.227PBOP358 -113.241 44.402PBOP359 -111.529 43.482PBOP360 -111.451 44.318PBOP361 -111.440 44.560PBOP455 -112.729 44.486PBOP456 -111.225 44.863PBOP457 -111.273 45.041PBOP458 -111.302 44.766PBOP459 -110.746 43.748PBO
Table S-1. Continued.
Station Longitude LatitudeOperating Agency
P460 -111.029 45.140PBOP461 -110.759 45.354PBOP675 -112.719 42.212PBOP676 -111.338 44.654PBOP677 -113.868 42.879PBOP678 -112.805 43.449PBOP679 -113.306 44.040PBOP680 -111.099 44.598PBOP681 -112.636 44.400PBOP682 -110.908 42.503PBOP683 -111.735 42.827PBOP684 -111.450 43.919PBOP685 -111.830 44.068PBOP686 -111.155 44.252PBOP686 -111.155 44.252PBOP706 -112.524 45.043PBOP707 -111.837 44.719PBOP708 -110.934 43.786PBOP709 -110.286 44.392PBOP710 -110.732 44.096PBOP711 -110.861 44.636PBOP712 -111.072 44.957PBOP713 -110.544 44.390PBOP714 -110.744 44.896PBOP715 -109.690 43.501PBOP716 -110.512 44.718PBOP717 -109.897 44.485PBOP718 -109.376 44.753PBOP719 -111.789 45.218PBOP720 -110.306 44.943PBOP721 -110.002 45.003PBOP722 -109.571 45.457PBOIDPO -112.432 42.866NGSIDSS -111.584 42.686NGSIDDR -111.064 43.445NGSIDPO -112.432 42.866NGSIDSS -111.584 42.686NGSIDDR -111.064 43.445NGS
aStation has been retired and is no longer operating.
October 14, 2010

40
Table S-2. Temporary stations from the Yellowstone-Snake River Plain field campaigns.Station Longitude Latitude1404 -110.635 44.2675223 -113.193 43.5580026 -113.841 44.2230A37 -113.202 43.5640Z36 -113.222 43.57910RD -110.614 44.61216EM -116.466 42.65625MD -110.486 44.67832FM -113.677 43.292A047 -109.571 43.511A162 -110.787 45.102ABDI -112.471 43.223AECU -112.950 43.595AIRP -111.111 44.700AIRP -111.853 41.787ANDR -114.024 44.198ARBE -110.439 44.631B118 -113.264 43.496BAIR -112.064 41.539BATT -111.843 42.215BEAR -111.421 41.934BECH -111.046 44.149BF10 -112.788 41.716BIGB -113.023 43.396BIGT -110.569 44.405BIGU -111.192 44.898BIRC -112.757 43.960BLUF -110.375 44.662BOGS -110.381 44.696BORD -111.047 42.195BOXM -112.015 41.636BOZE -111.046 45.663BUSH -112.338 43.540BUTT -112.518 45.968C157 -110.702 44.970CALM -112.233 41.785CEDA -112.689 41.640CIRC -112.633 43.830CNDR -113.345 43.619COBB -112.920 43.508
Table S-2. Continued.Station Longitude LatitudeCORA -111.543 41.237CRAT -113.148 43.592CURV -112.003 41.757CV17 -110.298 44.550CV23 -110.386 44.568CV24 -110.276 44.517D092 -111.356 44.656DICK -113.927 44.179DIKE -112.094 41.342DILL -112.615 45.232DONK -113.560 44.266DRYC -111.788 41.735E11A -110.455 44.641E138 -111.958 44.598ECWA -110.383 44.508ELKA -110.455 44.641F011 -111.326 44.473F014 -111.783 45.693F145 -111.783 45.693F575 -111.697 45.498FLAG -110.667 44.100FRAN -110.354 44.413G103 -111.250 45.269G498 -111.742 45.794GILM -113.251 44.504GOLD -112.601 41.668GPSB -104.867 41.134GRAF -113.056 43.665GRAN -110.993 43.769GRAS -110.820 44.132GREY -108.028 44.493GRNT -113.970 43.994GRTA -110.993 43.769GT01 -110.613 43.761GT12 -110.668 43.754GT24 -110.726 43.750GT35 -110.755 43.767GT39 -110.785 43.764GWM2 -110.245 44.903H146 -111.679 45.232HAET -112.787 41.776HANS -112.667 41.918
October 14, 2010
41
Table S-2. Continued.Station Longitude LatitudeHARD -113.032 41.835HARL -110.889 44.640HEBG -111.335 44.864HELE -111.992 46.586HOLL -110.495 44.723HOLM -110.856 44.819HORS -111.197 44.751HOTS -110.257 44.744HOWE -112.544 41.794HULL -110.992 44.660HUNT -108.851 45.038I107 -112.068 43.481I762 -112.222 42.696ID76 -112.222 42.696IDTD -116.230 43.634INDI -113.307 41.911IUTW -111.047 42.002J011 -111.312 44.387J041 -110.636 43.805J161 -111.215 45.096JOHN -110.950 43.890K092 -111.514 44.598KAYG -110.464 44.663KELT -113.252 41.696L011 -111.305 44.317LARD -111.975 41.383LATH -111.145 44.448LEHA -110.387 44.600LEWI -110.635 44.268LION -111.348 44.724M146 -111.656 45.112M157 -110.733 44.888MALL -110.785 44.467MASN -110.330 42.714MEER -110.819 44.454MISS -114.090 46.924MONT -111.518 41.422MORA -110.721 43.866N056 -112.698 43.326N144 -111.479 44.830NEZP -110.820 44.573O033 -111.144 44.658
Table S-2. Continued.Station Longitude LatitudeODGD -111.882 41.200P012 -110.002 44.490PELI -110.193 44.648PIHA -112.591 42.913PITS -110.473 44.520POCR -112.423 42.855POON -111.445 44.563PORP -113.955 43.931PROM -112.420 41.298R011 -110.390 44.890R015 -113.927 44.179R046 -110.851 43.498R161 -111.075 44.964R415 -115.780 43.181REST -111.592 44.902RGBY -111.920 43.657ROCK -112.508 41.490ROOF -111.463 44.942ROSE -113.619 41.626S058 -112.956 43.456S138 -111.236 44.801SALM -113.869 45.166SALN -112.491 41.243SARG -110.643 43.938SHOG -114.417 42.936SHOS -110.644 44.434SIDE -112.148 41.795SKYU -111.649 44.713SODA -111.584 42.654SOUT -110.355 44.330SPLT -112.635 43.445SPRU -110.615 44.552STAN -114.944 44.226STON -110.325 44.594TERN -110.260 44.668TERR -112.230 43.839TESA -110.511 43.840THAT -112.342 41.721THER -110.833 44.516TONI -110.956 44.413TREM -112.184 41.711TROU -110.505 44.616
October 14, 2010

42
Table S-2. Continued.
Station Longitude LatitudeU11X -111.806 43.834U127 -111.780 41.767U146 -111.651 44.989U419 -115.890 42.466U59A -111.106 43.738V297 -111.263 44.684W367 -110.457 44.642WARR -112.239 41.255WASH -110.434 44.798WELL -111.909 41.651WHEE -113.105 41.746WOOD -114.030 43.433X137 -111.756 44.592Y053 -108.790 45.714Y368 -110.063 44.979Y425 -113.739 42.567Y538 -108.790 45.714YELL -110.394 44.552Z139 -111.718 45.597Z145 -111.732 45.359Z157 -110.699 44.738Z161 -111.105 44.796Z367 -110.489 44.679Z425 -113.987 44.008
October 14, 2010

43
Table S-3. Permanant GPS stations in the Wasatch Network.
Station Longitude LatitudeOperating Agency
ALUT -111.620 40.584UUDCUT -111.527 40.414UUGOUT -111.897 39.914UUMOUT -111.666 41.046UUNAIU -112.230 41.016UURBUT -111.809 40.781UUCAST -110.677 39.191PBOCEDA -112.860 40.681PBOCOON -112.121 40.653PBOEOUT -111.929 41.253PBOFORE -111.380 40.512PBOHEBEa -111.373 40.514PBOHWUT -111.565 41.607PBOLMUT -111.928 40.261PBOLTUT -112.247 41.592PBOMPUT -111.634 40.016PBOSMEL -112.845 39.426PBOSPIC -112.127 39.306PBOP016 -112.361 40.078PBOP030 -110.513 41.750PBOP057 -112.623 41.757PBOP081 -113.871 39.067PBOP082 -113.505 39.269PBOP084 -113.054 40.494PBOP086 -112.282 40.649PBOP088 -111.723 40.772PBOP089 -111.415 40.807PBOP100 -113.294 41.857PBOP101 -111.236 41.692PBO
Table S-3. Continued.
Station Longitude LatitudeOperating Agency
P103 -113.042 39.345PBOP103 -113.042 39.345PBOP104 -112.717 39.186PBOP105 -112.504 39.388PBOP106 -112.262 39.459PBOP108 -111.945 39.589PBOP109 -111.651 39.597PBOP110 -111.571 39.715PBOP111 -113.012 41.817PBOP112 -111.450 39.817PBOP113 -113.278 40.671PBOP114 -112.528 40.634PBOP115 -112.428 40.474PBOP116 -112.014 40.434PBOP117 -111.751 40.435PBOP118 -111.350 40.635PBOP119 -111.258 40.732PBOP121 -112.698 41.803PBOP122 -112.332 41.635PBOP124 -111.957 41.558PBOP125 -111.899 41.589PBOP126 -111.781 41.583PBOP675 -112.719 42.212PBOP783 -111.415 40.808PBOP783 -111.415 40.808PBOMIDV -111.907 40.621NGSMYT1a -110.048 40.103NGSMYT5 -110.048 40.103NGSSLCU -111.955 40.772NGSZLC1 -111.952 40.786NGS
aStation has been retired and is no longer operating.
October 14, 2010

44
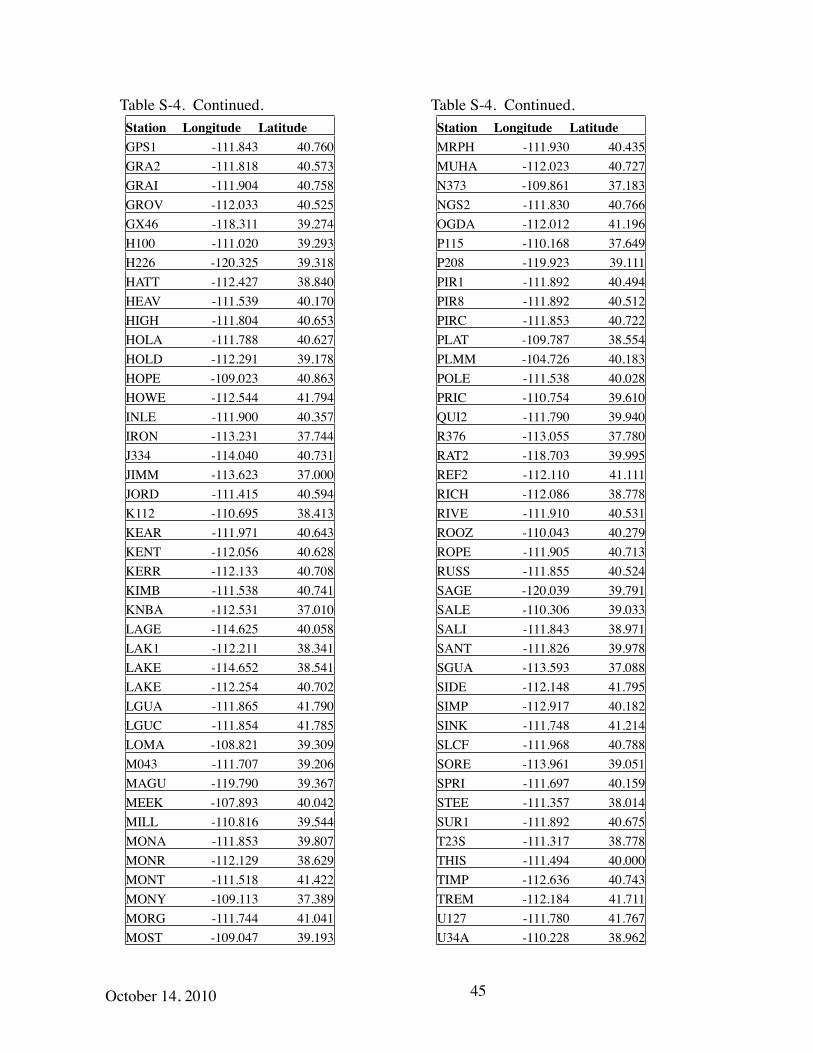
Table S-4. Temporary stations from the Wasatch field campaigns.Station Longitude Latitude1010 -111.717 40.7521012 -120.177 38.6331710 -111.639 40.6443207 -116.746 39.0560006 -113.520 39.0940007 -110.352 38.964010B -119.697 39.285026A -112.030 40.8470H64 -111.949 40.162120F -112.852 41.2201S2E -111.717 40.7522S3E -111.651 40.64736UA -111.426 40.4833S3E -111.621 40.58443JD -119.658 39.84867LA -114.055 36.83384DO -113.565 36.97988JD -114.701 41.905A121 -111.720 40.219ABRA -112.110 41.111AERO -112.513 39.387AIRP -114.044 36.098ANTE -112.216 40.962B300 -119.244 38.988B365 -113.636 37.126B423 -115.110 41.099BAIR -112.064 41.539BARR -113.474 40.728BEAR -111.421 41.934BENN -112.235 41.042BF10 -112.788 41.716BLAC -113.604 37.095BLAC -119.058 39.579BLAN -109.483 37.581BLMB -111.951 40.720BLUE -110.284 40.216BOUN -111.818 40.964BRYC -112.154 37.704BRZ2 -112.157 37.699C021 -109.369 38.134C137 -112.498 37.030
Table S-4. Continued.Station Longitude LatitudeC313 -115.220 37.529CANE -112.901 36.846CAPS -112.047 39.662CARL -111.888 40.728CDAR -111.945 39.625CDCA -113.094 37.700CESS -112.355 38.964CHAL -119.876 39.514CHER -111.835 40.515CHIL -119.203 39.358CISC -109.303 38.959CLIF -117.418 39.351CNYA -109.751 38.762CORA -111.543 41.237CURV -112.003 41.757D104 -110.745 40.209DALE -111.751 40.755DAVI -117.884 38.760DELO -108.976 38.683DEVI -114.031 37.728DRYL -114.842 37.615DUDE -111.838 40.831EAGL -119.483 39.552ELBE -111.950 39.952ENVB -114.024 40.726ERDA -112.253 40.635ERM2 -114.843 39.293F182 -112.985 38.617F381 -113.809 41.430FERN -112.104 39.762FLAT -119.203 39.944FLOR -112.027 40.588FOOT -111.746 39.744FRPK -111.852 41.082G100 -112.148 39.601G101 -112.151 39.602G200 -112.242 39.140G250 -111.738 38.904G365 -113.701 37.165GENE -111.719 40.298GOG2 -112.049 40.813GOGA -112.049 40.813
October 14, 2010
45
Table S-4. Continued.Station Longitude LatitudeGPS1 -111.843 40.760GRA2 -111.818 40.573GRAI -111.904 40.758GROV -112.033 40.525GX46 -118.311 39.274H100 -111.020 39.293H226 -120.325 39.318HATT -112.427 38.840HEAV -111.539 40.170HIGH -111.804 40.653HOLA -111.788 40.627HOLD -112.291 39.178HOPE -109.023 40.863HOWE -112.544 41.794INLE -111.900 40.357IRON -113.231 37.744J334 -114.040 40.731JIMM -113.623 37.000JORD -111.415 40.594K112 -110.695 38.413KEAR -111.971 40.643KENT -112.056 40.628KERR -112.133 40.708KIMB -111.538 40.741KNBA -112.531 37.010LAGE -114.625 40.058LAK1 -112.211 38.341LAKE -114.652 38.541LAKE -112.254 40.702LGUA -111.865 41.790LGUC -111.854 41.785LOMA -108.821 39.309M043 -111.707 39.206MAGU -119.790 39.367MEEK -107.893 40.042MILL -110.816 39.544MONA -111.853 39.807MONR -112.129 38.629MONT -111.518 41.422MONY -109.113 37.389MORG -111.744 41.041MOST -109.047 39.193
Table S-4. Continued.Station Longitude LatitudeMRPH -111.930 40.435MUHA -112.023 40.727N373 -109.861 37.183NGS2 -111.830 40.766OGDA -112.012 41.196P115 -110.168 37.649P208 -119.923 39.111PIR1 -111.892 40.494PIR8 -111.892 40.512PIRC -111.853 40.722PLAT -109.787 38.554PLMM -104.726 40.183POLE -111.538 40.028PRIC -110.754 39.610QUI2 -111.790 39.940R376 -113.055 37.780RAT2 -118.703 39.995REF2 -112.110 41.111RICH -112.086 38.778RIVE -111.910 40.531ROOZ -110.043 40.279ROPE -111.905 40.713RUSS -111.855 40.524SAGE -120.039 39.791SALE -110.306 39.033SALI -111.843 38.971SANT -111.826 39.978SGUA -113.593 37.088SIDE -112.148 41.795SIMP -112.917 40.182SINK -111.748 41.214SLCF -111.968 40.788SORE -113.961 39.051SPRI -111.697 40.159STEE -111.357 38.014SUR1 -111.892 40.675T23S -111.317 38.778THIS -111.494 40.000TIMP -112.636 40.743TREM -112.184 41.711U127 -111.780 41.767U34A -110.228 38.962
October 14, 2010

46
Table S-4. Continued.Station Longitude LatitudeU42E -111.995 40.628U43A -109.347 37.936U69A -110.385 40.194U836 -120.325 39.318UNI2 -111.886 40.582UNIN -111.886 40.582UNIO -111.886 40.582UTES -111.847 40.768V175 -112.409 40.337V209 -119.544 39.083VABM -111.810 40.730VELA -109.512 40.444VER2 -109.570 40.337VIEW -111.853 40.463VIST -119.698 39.533WARR -112.239 41.255WASZ -113.432 36.502WELL -111.909 41.651WEST -112.063 40.565WHEE -113.105 41.746WILL -112.007 40.435X364 -113.556 37.114Y078 -113.208 39.629Y419 -109.049 40.271YARD -111.941 40.731ZLCA -111.953 40.785ZLCB -111.951 40.785
October 14, 2010