GPC Q1 2021 Earnings Deck - Final 4.21
30
Genuine Parts 1Q21 Earnings Presentation April 22, 2021
Transcript of GPC Q1 2021 Earnings Deck - Final 4.21

Genuine Parts 1Q21 Earnings PresentationApril 22, 2021

2GPC 1Q21 EARNINGS PRESENTATION |
Genuine Parts Company Snapshot (NYSE: GPC)
Leading Global Distributor in Diversified End Markets
GLOBAL FOOTPRINTTTM Revenue by Region1
KEY STATISTICS1
Founded 1928
Headquarters Atlanta, GA
Countries Served 14
Locations• Warehouses• Distribution Facilities• Retail (Owned/Independent)
10,469823182
9,464
Employees ~50,000
Market Capitalization2 ~$17.3B
TTM FINANCIAL HIGHLIGHTS1
Revenue• Automotive• Industrial
$16.9B66%34%
Segment Profit Margin3 8.6%
Free Cash Flow3 ~$2.1B
Dividend Yield4 2.8%
74%North
America 11%Australasia
15%Europe
1 As of 3/31/21 2 As of 4/16/21 3 See Appendix C for Segment Profit Margin 4 Calculated based on annual dividend per share divided by share price as of 3/31/21

3GPC 1Q21 EARNINGS PRESENTATION |
Safe Harbor Statement
FORWARD-LOOKING STATEMENTS: Some of the comments made during this conference call and information contained in our presentation constitute forward-looking statements that aresubject to the safe harbor provisions of the Private Securities Litigation Reform Act of 1995. All statements in the future tense and all statements accompanied by words such as “expect,”“likely,” “outlook,” “forecast,” “preliminary,” “would,” “could,” “should,”, “position”, “will,” “project,” “intend,” “plan,” “on track,” “anticipate,” “to come,” “may,” “possible,” “assume,” or similarexpressions are intended to identify such forward-looking statements. These forward-looking statements include the Company’s view of business and economic trends for the remainder of theyear, the Company’s ability to execute our strategic priorities and capitalize in light of these business and economic trends, and the updated full-year 2021 financial guidance for the Company.The Company cautions that all forward-looking statements involve risks and uncertainties, and while we believe that our expectations for the future are reasonable in view of currently availableinformation, you are cautioned not to place undue reliance on our forward-looking statements. Actual results or events may differ materially from those indicated as a result of various importantfactors. Such factors may include, among other things, the extent and duration of the disruption to our business operations caused by the global health crisis associated with the COVID-19pandemic, including the effects on the financial health of our business partners and customers, on supply chains and our suppliers, on vehicle miles driven as well as other metrics that affectour business, and on access to capital and liquidity provided by the financial and capital markets; the Company’s ability to maintain compliance with its debt covenants; the Company's ability tosuccessfully integrate acquired businesses into the Company’s operations and to realize the anticipated synergies and benefits; the Company's ability to successfully implement its businessinitiatives in its two business segments; changes in demand for the Company's products; the ability to maintain favorable supplier arrangements and relationships; disruptions in global supplychains and in our suppliers' operations, including as a result of the impact of COVID-19 on our suppliers and our supply chain; changes in national and international legislation or governmentregulations or policies, including changes to import tariffs, environmental and social policy, infrastructure programs and privacy legislation, and their impact to the Company and its suppliersand customers; changes in general economic conditions, including unemployment, inflation (including the impact of tariffs) or deflation and the United Kingdom's exit from the European Unionand the unpredictability of the impact following such exit; changes in tax laws, regulations, treaties and policies, including the interpretation and enforcement of any of the foregoing; volatileexchange rates; volatility in oil prices; significant cost increases, such as rising fuel and freight expenses; the Company's ability to successfully attract and retain employees in the current labormarket; uncertain credit markets and other macroeconomic conditions; competitive product, service and pricing pressures; failure or weakness in our disclosure controls and procedures andinternal controls over financial reporting, including as a result of the work from home environment; the uncertainties and costs of litigation; disruptions caused by a failure or breach of theCompany's information systems, and the other risks and uncertainties discussed in the Company’s latest SEC filings. The statements speak only as of the date they are made, and theCompany undertakes no duty to update any forward-looking statements made during this presentation or in these materials except as required by law. Actual results may vary materially and,as such, you are cautioned not to place undue reliance on these forward-looking statements.
NON-GAAP MEASURES: This presentation contains adjusted net income from continuing operations, adjusted diluted earnings per share from continuing operations, adjusted EBIT andadjusted EBITDA from continuing operations, segment profit margin and free cash flow, which are financial measures that are not derived in accordance with United States generally acceptedaccounting principles ("GAAP"). The Company considers these non-GAAP measures useful to investors because they provide greater transparency into management’s view and assessmentof the Company’s core operating performance. These measures are widely used by analysts, investors and competitors in our industry, although our calculation of the measure may not becomparable to similar measures disclosed by other companies, because not all companies and analysts calculate these measures in the same manner. The Company does not, nor does itsuggest investors should, consider non-GAAP financial measures superior to, in isolation from, or as a substitute for, GAAP financial information. The Company has included reconciliations ofthis additional information to the most comparable GAAP measure in the appendix of this presentation.

4GPC 1Q21 EARNINGS PRESENTATION |
1Q21 HighlightsPaul DonahueChairman & CEO

5GPC 1Q21 EARNINGS PRESENTATION |
Key Messages
Focus on Teammates as we Deliver Strong Results
01
Focused on execution and demonstrated agility in delivering strong financial results03
02
Operated with the physical and mental well-being of our employees the top priority, as our 50,000+ teammates are the core of our success
04
05
Pleased with the strong start to 2021
Ongoing recovery in our Automotive and Industrial businesses
Improving sales trends, increasing operational efficiencies and enhancing customer value
6GPC 1Q21 EARNINGS PRESENTATION |
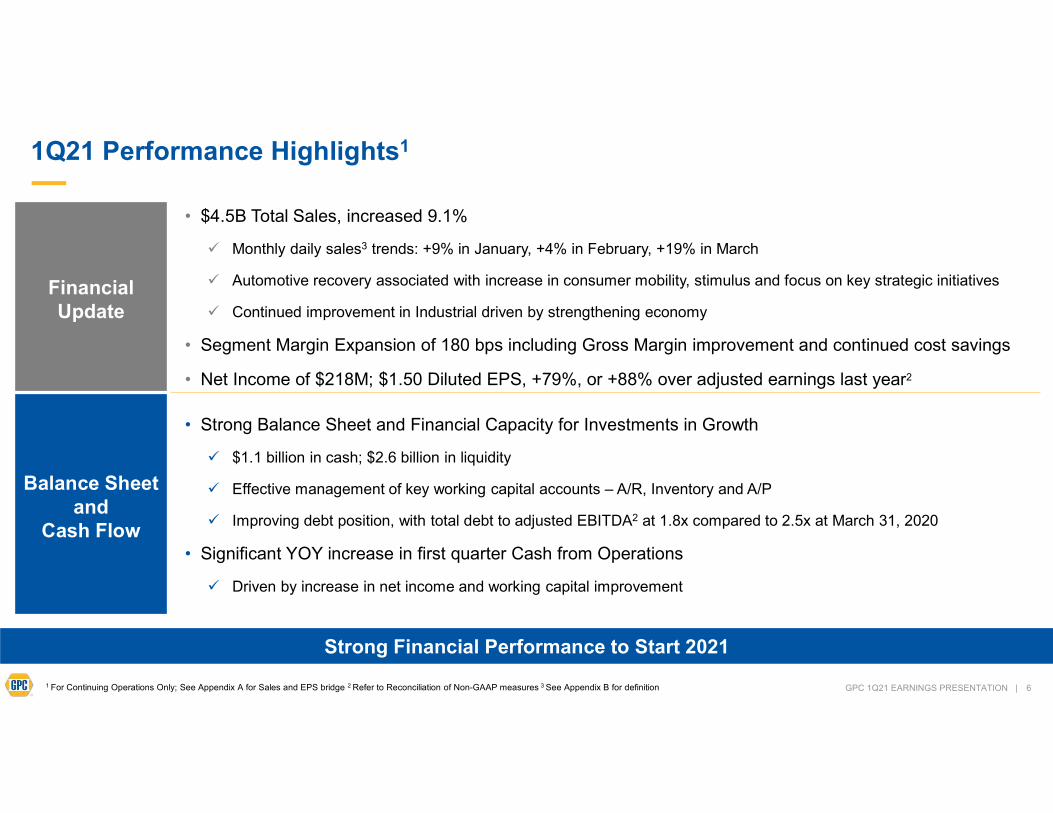
1Q21 Performance Highlights1
Strong Financial Performance to Start 2021
1 For Continuing Operations Only; See Appendix A for Sales and EPS bridge 2 Refer to Reconciliation of Non-GAAP measures 3 See Appendix B for definition
Financial Update
• $4.5B Total Sales, increased 9.1%
Monthly daily sales3 trends: +9% in January, +4% in February, +19% in March
Automotive recovery associated with increase in consumer mobility, stimulus and focus on key strategic initiatives
Continued improvement in Industrial driven by strengthening economy
• Segment Margin Expansion of 180 bps including Gross Margin improvement and continued cost savings
• Net Income of $218M; $1.50 Diluted EPS, +79%, or +88% over adjusted earnings last year2
Balance Sheet and
Cash Flow
• Strong Balance Sheet and Financial Capacity for Investments in Growth
$1.1 billion in cash; $2.6 billion in liquidity
Effective management of key working capital accounts – A/R, Inventory and A/P
Improving debt position, with total debt to adjusted EBITDA2 at 1.8x compared to 2.5x at March 31, 2020
• Significant YOY increase in first quarter Cash from Operations
Driven by increase in net income and working capital improvement

7GPC 1Q21 EARNINGS PRESENTATION |
Automotive: Highlights, Trends and Initiatives
1 See Appendix B for definition
Automotive – Total sales +14%Comp sales1 up 8% compared to a 2% decrease in 4Q; Segment Profit Margin +250 bps
MACRO NORTH AMERICA EUROPE AUSTRALASIA
• Tailwinds:
− Continued economic recovery
− Cold weather in Jan/Feb
− Financial stimulus
− High volume of used car sales
• Headwinds:
− Uncertainties associated with COVID-19
− Supply chain disruption
− Inflation
• Strong long-term industry fundamentals
− Growing and older car parc
− Expectation for improved miles driven trends over longer-term
• U.S. comp sales1 +7%
− Improved from 6% decrease in 4Q
• Positive DIY and DIFM sales
• Retail on-line sales growth +150% YOY
• Commercial sales driven by NAPA AutoCare, Major Accounts and Other
• Traffic and ticket both positive
• Profit margin expansion +180 bps
• Canada comp sales1 +3%
− Improved from 2% decrease in 4Q
• Profit margin expansion +130 bps
• Comp sales1 +15%
− Improved from flat in 4Q
• Strengthening sales environment associated with economic recovery
− Outperformance in UK and Benelux
• Solid growth across operations
− Focus on key accounts
− Leading inventory availability
• Ongoing benefit of NAPA Launch across markets – 16 product lines available today
• Profit margin expansion +500 bps
• Comp sales1 +15%
− In-line with mid-teen growth in 2H 2020
• In-line with mid-teen growth in 2H 2020
• Robust DIY and DIFM sales growth
• Maximizing sales opportunities through short-term lockdowns
• Continued strength in on-line sales, 3x-4xpre-COVID levels
• Expansion of NAPA store strategy across Asia Pac
− 38 NAPA stores with plans for more in 2021
• Profit margin expansion +150 bps
STRATEGIC INITIATIVES IN AUTOMOTIVE
• Sales team effectiveness – more sales reps focused on end-user customer
• Commercial sales programs and promotions – NAPA AutoCare
• Improving inventory availability to ensure more parts for more cars
• Strengthen supply chain through supplier relationships and network optimization
• Omni-channel investments – B2B and B2C – new catalog and search capabilities
• Strategic pricing services and tools to maximize competitiveness
• Value-add services and roll-out of NAPA brand in Europe and Australasia
• Investments to expand our global store footprint across geographies

8GPC 1Q21 EARNINGS PRESENTATION |
Industrial: Highlights, Trends and Initiatives
1 See Appendix B for definition
Industrial – Total sales +0.1%Comp sales1 down 2% compared to a 4% decrease in 4Q; Segment Profit Margin +80 bps
MACRO NORTH AMERICA AUSTRALASIA
• Continued improvement in Industrial sales trends
• Sequential strengthening of industrial economy, despite continued market uncertainties
• Strong growth outlook for plant automation and robotics solutions
• Following manufacturing PMI and industrial production as industrial demand indicators – both showing improving trends
− PMI +4.2% YTD 2021
− Industrial Production +2.5% in 1Q
• Projecting positive comp sales over balance of 2021
• Strengthening industrial economy and growth initiatives driving improved sales trends
• Third consecutive quarter of sequential sales improvement
− Improved sales trends among virtually all product categories and industries served
• Continuing expansion of value-add businesses
− Automation, Conveyance and Repairs
• Customers operating at higher run rates and releasing capital project orders
• Profit margin expansion of +70 bps
• Mi Asia Pac operated well, despite sales decrease
• Benefiting from resiliency of mining industry
• Profit margin expansion +110 bps
• Consistently strong operational performance despite challenging times
• Steady recovery to pre-pandemic sales levels
STRATEGIC INITIATIVES IN INDUSTRIAL / IMPROVING COMP SALES1 TRENDS
• Omni-channel buildout to accelerate e-commerce growth
• Expand industrial services and solutions capabilities
• Considering strategic M&A to further boost products/services offering
• Strategically enhanced pricing and product category management
• Network optimization and automation to further improve productivity
2%
-3%
-17%
-9%
-4%-2%
2019 1Q20 2Q20 3Q20 4Q20 1Q21 2021E
4%

9GPC 1Q21 EARNINGS PRESENTATION |
Continued Progress Towards ESG Initiatives
Providing for our Environment, our Employees and the Communities We Serve
Focused on mission to be good corporate citizens where we work and live
Advanced our corporate commitment to diversity and inclusion by actively recruiting talent representative of the communities we serve
Enhanced our comprehensive wellbeing program focused on emotional, financial, physical and social health of teammates
Expanded training and development programs to ensure personal growth
Giving back to communities and causes that make a difference

10GPC 1Q21 EARNINGS PRESENTATION |
Strategy UpdateWill StengelPresident

11GPC 1Q21 EARNINGS PRESENTATION |
Understanding Customer Needs to Exceed Expectations…
…and Deliver A Best-in-class Customer Experience
Initiatives
• Realign teams
• Streamline processes
• Consolidate facilities
• Improve operational productivity
• Simplify technologies
• Reduce costs
Goals
• Operating efficiencies
• Faster team execution
• Deliver a better customer experience
• Accelerate profitable growth
Executing Multi-year Plans
Simplification and Integration
Optimize facilities footprint and coverage
Simplify and integrate disparate legacy IT systems
Streamline back-office support functions
Offshore non-customer facing functional support activities
Centralize GPC indirect sourcing processes

12GPC 1Q21 EARNINGS PRESENTATION |
• Recognize high potential talent, infuse new capabilities into the organization and recruit diverse talent that is representative of the communities we serve
• Examples include category management, digital, emerging technology and field leadership roles
• Data and analytics to understand our unique customer segments, the different needs of each segment and associated strategies to serve the segment is a foundational element
• Reflect our omnichannel initiatives and include an increasing mix of both traditional selling and digital strategies
• A foundational priority as we deliver a best-in-class customer experience and profitable growth
• Invest in foundational digital elements including catalog, search, and other critical customer experience elements such as ease of ordering, pricing and analytics
• Ensure we have the “right” product, available in the “right” market at the “right” time through continuous improvements in inventory, facility, productivity, logistics and technology
• Recent facility automation investments delivered 500% labor productivity improvement
• Aspire to lead in emerging technologies present for our industries
• Unique positioning to leverage opportunities including our scaled global footprint, diverse portfolio, leading global brands, established customer and supplier relationships and One GPC team approach
Investing In Our Core Business…
…with Focus to Execute Initiatives and Deliver Performance
TalentTalentSalesforce
EffectivenessSalesforce
EffectivenessDigitalDigital
Supply Chain
Supply Chain
Emerging TechnologyEmerging
Technology
Strategic bolt-on acquisitions remain a key part of our GPC growth strategy
Acquisition pipeline remains active and actionable
Continue to refine our processes to move faster, be disciplined and create value

13GPC 1Q21 EARNINGS PRESENTATION |
1Q21 Financial PerformanceCarol YanceyEVP and CFO

14GPC 1Q21 EARNINGS PRESENTATION |
1Q21 Financial Results
Sales1 Gross Profit1 Adj. Op/Non-Op Expenses1 Segment Profit1 Adj. EPS1
+9.1% +11% +2.1% +40.7% +87.5%
• Reported sales up 9.1%
• +4.6%2 comp sales
− Business and economic recovery across regions
• +0.8% acquisitions
• +3.8% foreign currency
• Minimal benefit from price inflation YTD
• 14 consecutive quarterly increases in Gross Margin
• Driven by benefits of:
− Sales mix
− Product mix
− Strategic category mgmt. initiatives
− Pricing initiatives
− Global sourcing
• Adj. SG&A1 +5.3% YOY
• 2020 permanent and temporary cost savings initiatives
• Ongoing expense management
• Additional tailwinds:
− Gains on sale of real estate
− Favorable retirement plan valuation adjustments
− Lower provision for doubtful accounts and interest
• Headwinds:
− Potential for cost increases
• Gross margin expansion
• SG&A cost management
• Strong margin expansion in both Automotive and Industrial
− Margin expansion in all four Automotive and in both Industrial markets/regions for the third consecutive quarter
• 3rd consecutive quarter of double-digit Adj. EPS growth
• Reported earnings per diluted share $1.50
• Tax rate improved to 23.8% compared to an adjusted rate of 26.5%1 in 1Q20
$4,093 $4,465
1Q20 1Q21
($M, except per share data)
$1,388
$1,541
33.9%34.5%
30.0%
31.0%
32.0%
33.0%
34.0%
35.0%
36.0%
37.0%
38.0%
39.0%
40.0%
$1,200
$1,250
$1,300
$1,350
$1,400
$1,450
$1,500
$1,550
$1,600
1Q20 1Q21
+60 bps
$1,229 $1,255
30.0% 28.1%
0.0%
1.0%
2.0%
3.0%
4.0%
5.0%
6.0%
7.0%
8.0%
9.0%
10.0%
11.0%
12.0%
13.0%
14.0%
15.0%
16.0%
17.0%
18.0%
19.0%
20.0%
21.0%
22.0%
23.0%
24.0%
25.0%
26.0%
27.0%
28.0%
29.0%
30.0%
31.0%
32.0%
33.0%
34.0%
35.0%
36.0%
37.0%
38.0%
39.0%
40.0%
41.0%
42.0%
43.0%
44.0%
45.0%
46.0%
47.0%
48.0%
49.0%
50.0%
51.0%
52.0%
53.0%
54.0%
55.0%
56.0%
57.0%
58.0%
59.0%
60.0%
61.0%
62.0%
63.0%
64.0%
65.0%
66.0%
67.0%
68.0%
69.0%
70.0%
$0
$200
$400
$600
$800
$1,000
$1,200
$1,400
1Q20 1Q21
-190 bps
$257
$361
6.3%
8.1%
1.0%
2.0%
3.0%
4.0%
5.0%
6.0%
7.0%
8.0%
9.0%
10.0%
11.0%
12.0%
13.0%
14.0%
15.0%
16.0%
17.0%
18.0%
19.0%
20.0%
$0
$50
$100
$150
$200
$250
$300
$350
$400
$450
1Q20 1Q21
+180 bps
Note: All comparisons are YoY unless otherwise stated 1 Excludes discontinued operations. For 1Q20, adjusted SG&A, adjusted op / non-op expenses, adjusted EPS and adjusted tax rate exclude restructuring, gain on insurance proceeds related to SPR fire and transaction and other costs. These amounts are non-GAAP measures (See Reconciliation of Non-GAAP Measures) 2 See Appendix B for definition
$0.80
$1.50
1Q20 1Q21

15GPC 1Q21 EARNINGS PRESENTATION |
1Q21 Segment Performance
($M)
Note: All comparisons are YoY unless otherwise stated. 1Sales exclude divestitures. These amounts are non-GAAP measures (See Reconciliation of Non-GAAP Measures).
Automotive Industrial
Sales Segment Profit Sales Segment Profit
+14.3% +65.3% +0.1% +10%
Automotive Highlights
• Total sales +14.3% compared to +0.7% in 4Q20 and +6% in 3Q20
• Positive DIY and DIFM growth
• Sales improvement a function of economic recovery and growth initiatives
• Record U.S. Automotive sales in March
• Sales in Europe and Australasia outperformed with mid-teen growth
• Improved profit margin in every market/region for the 3rd consecutive quarter
Industrial Highlights
• Total sales +0.1% compared to (3.3%) in 4Q and (9%)1 in 3Q
− Record Motion North America sales in March
• Includes benefit of three strategic bolt-on acquisitions closed in 3Q20
− Strengthens position in automation and hydraulics
• Improved profit margin in both markets/regions for the 3rd consecutive quarter
• Mi Asia Pac – performing well with steady and consistent operating results
1Q20 1Q21
$2,583
$2,953
5.5%
8.0%
0.0%
2.0%
4.0%
6.0%
8.0%
10.0%
12.0%
14.0%
16.0%
18.0%
20.0%
$0
$50
$100
$150
$200
$250
$300
1Q20 1Q21
$143
$236
1Q20 1Q21
$1,510 $1,512
7.5%8.3%
0.0%
2.0%
4.0%
6.0%
8.0%
10.0%
12.0%
14.0%
16.0%
18.0%
20.0%
$0
$20
$40
$60
$80
$100
$120
$140
$160
1Q20 1Q21
$114$125
+250 bps+80 bps

16GPC 1Q21 EARNINGS PRESENTATION |
Strong Balance Sheet and Robust Cash Generation
• Continued strong cash flow to support growth initiatives and effective allocation of capital
• Steady debt position and favorable financial arrangements
• Total debt to adjusted EBITDA4 improved to 1.8x at March 31, 2021from 2.5x in the prior year
DEBT MATURITY SCHEDULE1BALANCE SHEET HIGHLIGHTS1 LIQUIDITY PROFILE1
Cash / Cash Equivalents $1.1
Accounts Receivable $1.8
Inventory $3.6
Total Assets $13.9
Accounts Payable $4.5
Total Debt $2.6
Total Liabilities $10.6
Working Capital2 $1.3
$160$248
$380 $367 $413
$205
$845
2021 2022 2023 2024 2025 2026 2027 2028 2029 2030+
Ample Liquidity and Financial Strength to Support Growth Strategy
2.65% 1Q21 Average Interest Rate
($B)
1 As of 3/31/2021 2 Working capital is defined as current assets less current liabilities 3 Total credit capacity represents total committed capacity under the revolving credit facility plus the amount of all other debt outstanding 4 These amounts are Non-GAAP measures (See Reconciliation of Non-GAAP Measures )
Total Credit Capacity3 $4.1
Less Total Debt: ($2.6)
Unused Credit Capacity $1.5
Cash $1.1
Total Available Liquidity $2.6
Total debt to adj EBITDA (TTM)4 1.8x
($B) ($M)
$1,057$833
$2,015
$1,100
$28$301
2018 2019 2020 2021E Q1 2020 Q1 2021
CASH FLOW FROM OPERATIONS
Drivers:
• Earnings• Working Capital• Sale of receivables• Cost Savings
($M)

17GPC 1Q21 EARNINGS PRESENTATION |
Disciplined Capital Allocation
Resuming Normalized Levels of Capital Allocation in 2021
37%
36%
18%
9%
M&A Dividend Reinvestment Share Repurchases
2017-2020 Capital Deployment
17
Current Priorities
Dividend
• 2021 cash dividend of $3.26 per share, +3% from 2020
• 65th consecutive year of increased dividends paid to our shareholders
Reinvestment
• Projecting 2021 CapEx of ~$300M
M&A
• Targeting strategic bolt-on acquisitions for 2021
Share Repurchases
• Reinstated plan for opportunistic share repurchases
1 Includes proceeds from divestitures.
~$4.7B1

18GPC 1Q21 EARNINGS PRESENTATION |
2021 Outlook
2021 Guidance*
Total Sales Growth 5% to 7%
Automotive 5% to 7%
Industrial 4% to 6%
EPS $5.85 to $6.05
EPS Growth 11% to 15%
Cash from Operations $1.0B to $1.2B
Free Cash Flow1 $700M to $900M
Corporate expenses of ~$150 million
Capex of ~$300 million
Depreciation and amortization $280 to $290 million
Interest expense of $70 to $72 million
Tax rate of 24.5% to 25.5%
ASSUMPTIONS
*Our guidance considers several factors, including the continued uncertainty related to the COVID-19 pandemic and its potential impact on our results. We will update full-year guidance during 2021, as appropriate. 1These amounts are non-GAAP measures (See Reconciliation of Non-GAAP Measures)
Strong Outlook with Strategic Growth Plans

19GPC 1Q21 EARNINGS PRESENTATION |
Closing Remarks
Well-Positioned to Drive Profitable Growth, Cash Flow and Shareholder Value
Optimistic for strong financial results in quarters ahead
Entering the second quarter with positive sales and operating momentum
Excited for ongoing recovery in the global economy and future growth prospects for our Automotive and Industrial business segments
Strong balance sheet provides financial flexibility to pursue strategic growth opportunities
Focused on executing plans to capture profitable growth, generate strong cash flow and drive shareholder value
Thank you to our teammates for their continued support, dedication and commitment to serving our customers and being the best

20GPC 1Q21 EARNINGS PRESENTATION |
Q&A

21GPC 1Q21 EARNINGS PRESENTATION |
Appendix

22GPC 1Q21 EARNINGS PRESENTATION |
Consolidated Net Sales and Diluted EPS Bridge Appendix A
$189$32
$162
($11)
$4,093
$4,465
1Q20 Core Sales Acquisitions FX Other 1Q21
Net Sales ($M) Diluted Earnings Per Share
$0.80
$0.70
($0.04)
$0.84
$1.50
1Q20 GAAP EPS Adjustments 1Q20 Adj. EPS Core Operations 1Q21 Adj. EPS
23GPC 1Q21 EARNINGS PRESENTATION |
Other Information Appendix B
Comparable Sales: Comparable sales refer to period-over-period comparisons of our sales excluding the impact of acquisitions, divestitures and foreign currency. The Company considers this metric useful to investors because it provides greater transparency into management’s view and assessment of the Company’s core ongoing operations. This metric is widely used by analysts, investors and competitors in our industry, although our calculation of the metric may not be comparable to similar measures disclosed by other companies, because not all companies and analysts calculate this metric in the same manner.
Daily Sales: Daily sales represents the amounts invoiced to the Company's customers each day. Daily sales do not represent GAAP-based sales because, among other things, invoices are not always generated at the same time goods and services are delivered to customers and the amounts do not include adjustments for estimates of returns, rebates or other forms of variable consideration. Management uses this metric to monitor demand trends at each of its subsidiaries throughout each month for the purposes of monitoring performance against forecasts and to make operational decisions. The Company considers this metric useful to investors because it provides greater transparency into management’s view and assessment of the Company’s core ongoing operations. The calculation of this metric may not be comparable to similar measures disclosed by other companies, because not all companies and analysts calculate this metric in the same manner.

24GPC 1Q21 EARNINGS PRESENTATION |
Segment Data Appendix C
2021 2021 2020(in thousands) TTM Q1 Q1 Q1 Q2 Q3 Q4Net sales:
Automotive $ 11,231,175 $ 2,953,165 $ 2,582,685 $ 2,495,799 $ 2,960,379 $ 2,821,832 Industrial 5,678,446 1,511,549 1,509,841 1,327,428 1,409,707 1,429,762
Total net sales 16,909,621 4,464,714 4,092,526 3,823,227 4,370,086 4,251,594 Segment profit:
Automotive 960,843 235,678 142,578 218,906 266,124 240,135 Industrial 493,213 125,292 113,933 108,928 125,620 133,373
Total segment profit 1,454,056 360,970 256,511 327,834 391,744 373,508 Interest expense, net (89,504) (18,324) (19,868) (24,876) (25,221) (21,083)Intangible asset amortization (97,766) (25,544) (22,740) (23,256) (24,223) (24,743)Corporate expense (125,936) (31,243) (55,061) (28,613) (33,379) (32,701)Other unallocated costs (636,216) — 1,751 (555,525) (11,256) (69,435)Income (Loss) before income taxes from continuing operations 504,634 285,859 160,593 (304,436) 297,665 225,546 Income taxes from continuing operations (245,875) (68,149) (38,247) (59,065) (64,747) (53,914)Net income from continuing operations $ 258,759 $ 217,710 $ 122,346 $ (363,501) $ 232,918 $ 171,632
Segment profit margin:Automotive 8.6% 8.0% 5.5% 8.8% 9.0% 8.5%Industrial 8.7% 8.3% 7.5% 8.2% 8.9% 9.3%
Total segment profit margin 8.6% 8.1% 6.3% 8.6% 9.0% 8.8%

25GPC 1Q21 EARNINGS PRESENTATION |
Reconciliation of Non-GAAP Financial Measures Appendix D
Adjusted Net Income from Continuing Operations2021 2021 2020
(in thousands) TTM Q1 Q1 Q1 Q2 Q3 Q4GAAP net income (loss) from continuing operations $ 258,759 $ 217,710 $ 122,346 $ (363,501) $ 232,918 $ 171,632
Adjustments:Goodwill impairment charge (1) 506,721 — — 506,721 — —Restructuring costs (2) 47,037 — 2,982 25,059 10,968 11,010 Realized currency loss on divestitures (3) 11,356 — — 11,356 — —Gain on insurance proceeds related to SPR Fire (4) (1,166) — (12,282) (1,166) — —Inventory adjustment (5) 40,000 — — — — 40,000 Transaction and other costs (6) 32,268 — 7,549 13,555 288 18,425
Total adjustments 636,216 — (1,751) 555,525 11,256 69,435 Tax impact of adjustments (29,012) — (3,810) (1,500) (7,423) (20,089)Adjusted net income from continuing operations $ 865,963 $ 217,710 $ 116,785 $ 190,524 $ 236,751 $ 220,978
2021 2021 2020(in thousands, except per share and per share data) TTM Q1 Q1 Q1 Q2 Q3 Q4Diluted net income (loss) from continuing operations per common share $ 1.78 $ 1.50 $ 0.84 $ (2.52) $ 1.61 $ 1.18
Adjustments:Goodwill impairment charge (1) 3.49 — — 3.51 — —Restructuring costs (2) 0.32 — 0.02 0.17 0.07 0.08 Realized currency loss on divestitures (3) 0.08 — — 0.08 — —Gain on insurance proceeds related to SPR Fire (4) (0.01) — (0.08) (0.01) — —Inventory adjustment (5) 0.28 — — — — 0.28 Transaction and other costs (6) 0.22 — 0.05 0.10 — 0.12
Total adjustments 4.38 — (0.01) 3.85 0.07 0.48 Tax impact of adjustments (0.20) — (0.03) (0.01) (0.05) (0.14)Adjusted net income from continuing operations $ 5.96 $ 1.50 $ 0.80 $ 1.32 $ 1.63 $ 1.52 Weighted average common shares outstanding — assuming dilution 145,300 145,300 145,623 144,262 145,035 145,160

26GPC 1Q21 EARNINGS PRESENTATION |
Reconciliation of Non-GAAP Financial Measures (Cont.) Appendix D
Adjusted EBIT and Adjusted EBITDA2021 2021 2020
(in thousands) TTM Q1 Q1 Q1 Q2 Q3 Q4GAAP net income (loss) from continuing operations $ 258,759 $ 217,710 $ 122,346 $ (363,501) $ 232,918 $ 171,632
interest expense, net 89,504 18,324 19,868 24,876 25,221 21,083 Income taxes from continuing operations 245,875 68,149 38,247 59,065 64,747 53,914
EBIT 594,138 304,183 180,461 (279,560) 322,886 246,629 Goodwill impairment charge (1) 506,721 — — 506,721 — —Restructuring costs (2) 47,037 — 2,982 25,059 10,968 11,010 Realized currency loss on divestitures (3) 11,356 — — 11,356 — —Gain on insurance proceeds related to SPR Fire (4) (1,166) — (12,282) (1,166) — —Inventory adjustment (5) 40,000 — — — — 40,000 Transaction and other costs (6) 32,268 — 7,549 13,555 288 18,425
Adjusted EBIT $ 1,230,354 $ 304,183 $ 178,710 $ 275,965 $ 334,142 $ 316,064
2021 2021 2020(in thousands) TTM Q1 Q1 Q1 Q2 Q3 Q4GAAP net income (loss) from continuing operations $ 258,759 $ 217,710 $ 122,346 $ (363,501) $ 232,918 $ 171,632
Depreciation and amortization 277,884 72,296 67,254 66,733 69,097 69,758 interest expense, net 89,504 18,324 19,868 24,876 25,221 21,083 Income taxes from continuing operations 245,875 68,149 38,247 59,065 64,747 53,914
EBITDA 872,022 376,479 247,715 (212,827) 391,983 316,387 Goodwill impairment charge (1) 506,721 — — 506,721 — —Restructuring costs (2) 47,037 — 2,982 25,059 10,968 11,010 Realized currency loss on divestitures (3) 11,356 — — 11,356 — —Gain on insurance proceeds related to SPR Fire (4) (1,166) — (12,282) (1,166) — —Inventory adjustment (5) 40,000 — — — — 40,000 Transaction and other costs (6) 32,268 — 7,549 13,555 288 18,425
Adjusted EBITDA $ 1,508,238 $ 376,479 $ 245,964 $ 342,698 $ 403,239 $ 385,822

27GPC 1Q21 EARNINGS PRESENTATION |
Explanation of Adjustments Appendix D
(1) Goodwill Impairment Charge: Adjustment reflects a second quarter goodwill impairment charge related to our European reporting unit.
(2) Restructuring Costs: Adjustment reflects restructuring costs related to the execution of the 2019 Cost Savings Plan announced in the fourth quarter of 2019. The costs are primarily associated with severance and other employee costs, including a voluntary retirement program, and facility and closure costs related to the consolidation of operations.
(3) Realized Currency Loss: Adjustment reflects realized currency losses related to divestitures.
(4) Gain on Insurance Proceeds Related to SPR Fire: Adjustment reflects insurance recoveries in excess of losses incurred on inventory, property, plant and equipment and other fire-related costs related to the S.P. Richards Headquarters and Distribution Center.
(5) Inventory Adjustment: Adjustment reflects a $40 million charge to cost of goods sold due to the correction of an immaterial error related to the accounting in prior years for consideration received from vendors.
(6) Transaction and Other Costs: Adjustment includes $6.0 million of incremental costs associated with COVID-19 for the three months ended March 31, 2020 and costs associated with certain divestitures. COVID-19 related costs include incremental costs incurred relating to fees to cancel marketing events and increased cleaning and sanitization materials, among other things. For the twelve months ended December 31, 2020, adjustments include a $17 million loss on investment, $10 million of incremental costs associated with COVID-19 and costs associated with certain divestitures.

28GPC 1Q21 EARNINGS PRESENTATION |
Reconciliation of Non-GAAP Financial Measures (Cont.) Appendix D
Adjusted SG&A
Adjusted Operating and Non-Operating Expenses
Three Months Ended March 31, QTD Change(in thousands) 2021 2020 $ Change % ChangeGAAP Selling, administrative and other $ 1,195,164 $ 1,142,697 $ 52,467 4.6%Transaction and other costs - (7,549) 7,549 (100.0)%Adjusted Selling, administrative and other $ 1,195,164 $ 1,135,148 $ 60,016 5.3%Adjusted Selling, administrative and other as a percent of GAAP net sales 26.8% 27.7% (90) bps
Three Months Ended March 31, QTD Change(in thousands) 2021 2020 $ Change % ChangeGAAP operating and non-operating expenses $ 1,254,956 $ 1,227,585 $ 27,371 2.2%
Adjustments:Transaction and other costs - 7,549 (7,549) (100.0)%Restructuring costs - 2,982 (2,982) (100.0)%Gain on insurance proceeds related to SPR Fire - (12,282) 12,282 (100.0)%
Less: Total Adjustments (1) - (1,751) 1,751 (100.0)%Adjusted operating and non-operating expenses $ 1,254,956 $ 1,229,336 $ 25,620 2.1%Adjusted operating and non-operating expenses as a percent of GAAP net sales 28.1% 30.0% (190) bps

29GPC 1Q21 EARNINGS PRESENTATION |
Reconciliation of Non-GAAP Financial Measures (Cont.) Appendix D
Adjusted Tax Rate
(1) Refer to adjusted net income from continuing operations and adjusted diluted earnings per share from continuing operations reconciliation for explanation of pre-tax adjustments
Three Months Ended March 31,(in thousands) 2021 2019GAAP Income before taxes $ 285,859 $ 160,593 Total adjustments (1) - (1,751)Adjusted income before taxes $ 285,859 $ 158,842
GAAP Income taxes $ 68,149 $ 38,247 Tax impact of adjustments - 3,810 Adjusted income taxes $ 68,149 $ 42,057
GAAP tax rate 23.8% 23.8%Adjusted tax rate 23.8% 26.5%
2019 2020
(in thousands) GAAP Total Net Sales DivestituresNet Sales Excluding
Divestitures GAAP Total Net Sales $ Change % ChangeAutomotive $ 2,792,453 $ - $ 2,792,453 $ 2,960,379 167,926 6.0%Industrial 1,732,831 189,626 1,543,205 1,409,707 (133,498) (8.7)%Total Net Sales $ 4,525,284 $ 189,626 $ 4,335,658 $ 4,370,086 34,428 0.8%
Sales excluding divestitures for the three months ended September 30, 2020

30GPC 1Q21 EARNINGS PRESENTATION |
Reconciliation of Non-GAAP Financial Measures Appendix D
Free Cash Flow
Updated OutlookYE December 31, 2021
Net cash provided by operating activities from continuing operations $1.0 billion to $1.2 billion Purchases of property, plant and equipment Approximately $300 million Free Cash Flow $700 million to $900 million
(in thousands) TTM March 31, 2021Net cash provided by operating activities $ 2,287,604 Less: Purchases of property, plant and equipment (162,979)Free Cash Flow $ 2,124,625