gov.uk - LEEDS BRADFORD INTERNATIONAL …...1.2 Study Area 1.2.1LBIA is located 11km north west of...
161
LEEDS BRADFORD INTERNATIONAL AIRPORT CONNECTIVITY STUDY Option Assessment Report FINAL November 2014 This document is out of date. The latest information on the government's aviation and airports policy is available on GOV.UK.
Transcript of gov.uk - LEEDS BRADFORD INTERNATIONAL …...1.2 Study Area 1.2.1LBIA is located 11km north west of...

LEEDS BRADFORD INTERNATIONAL AIRPORT CONNECTIVITY STUDY Option Assessment Report
FINAL
November 2014 This document is out of date. The latest information on the government's aviation and airports policy is available on GOV.UK.

Project number: Dated: 26/11/2014 2 | 162 Revised:
Quality Management
Issue/revision Issue 1 Revision 1 Revision 2 Revision 3 Revision 4
Remarks Draft v1 Draft v2 Draft Final Draft Final Combined
Final Combined
Date 04th Aug 2014 27th Aug 2014 12th Sept 2014 29th Sept 2014 26th November 2014 (v2)
Prepared by Vinny Holden (PB) Vinny Holden (PB)
Vinny Holden (PB)
Adam Truman/Helen Caschetto
Mike Holmes
Signature
Checked by Richard Jones (PB) Richard Jones (PB)
Richard Jones (PB)
Mike Holmes Mike Holmes
Signature
Authorised by Mike Holmes (WSP)
Mike Holmes (WSP)
Vinny Holden (PB)
Adrian Kemp Adrian Kemp
Signature
Project number
Report number
File reference
3 | 162
LEEDS BRADFORD INTERNATIONAL AIRPORT CONNECTIVITY STUDY Option Assessment Report 26th November 2014 (v2)
Client Department for Transport Great Minster House 33 Horseferry Road London SW1P 4DR
Consultant WSP 3 White Rose Office Park Leeds LS11 0DL UK Tel: 0113 395 6444 Fax: 0113 395 6201 www.wspgroup.co.uk
Registered Address WSP UK Limited 01383511 WSP House, 70 Chancery Lane, London, WC2A 1AF
WSP Contacts Mike Holmes ([email protected])

Project number: Dated: 26/11/2014 4 | 162 Revised:
Table of Contents Introduction ............................................................................ 5 1 Study Objectives .................................................................. 10 2 Evidence Review and Identified Issues ............................... 12 3 Future Situation ................................................................... 19 4 Underlying Causes, Objectives and Study Area .................. 25 5 Option Generation ............................................................... 29 6 Appraisal and Sifting Process .............................................. 36 7 Shortlisted Schemes ............................................................ 48 8 Option Assessment.............................................................. 53 9
Public Transport Appraisal Results ...................................... 62 10 Highway Scheme Appraisal Results .................................... 89 11 Conclusions and Recommendations ................................. 129 12
APPENDICES Appendix A – Highway Network Constraints – LBIA Appendix B – EAST Summary Appraisal Forms Appendix C – Harrogate Rail Sensitivity Test Appendix D – Rodley Roundabout Sensitivity Test Appendix E – SATURN Link Road Plots Appendix F – SATURN Do Minimum Plots Appendix G – Cordon Results Appendix H – Linsig Details Appendix I – SATURN Plots – Junction Package 1 Appendix J – Technical Appendix

5 | 162
Introduction 1
Background and Overview 1.1WSP and Parsons Brinckerhoff (WSPPB) were jointly commissioned in March 2014 to undertake a study into the connectivity and accessibility of Leeds Bradford International Airport (LBIA). This study is one of six ‘notorious and longstanding road hot spot’ studies being undertaken, as identified in the governments strategic document “Investing in Britain’s Future” (2013).
The objective of the study is to identify and appraise potential improvements that would substantially improve the connectivity of LBIA to its catchment area. The study will take account of the aspiration of the airport to grow and the surface access improvements that would be required to facilitate and serve this growth, including both road and public transport options. It will draw on the knowledge and expertise of local stakeholders, all previous work and proposals, and include a full examination of all pre-existing assumptions and conclusions.
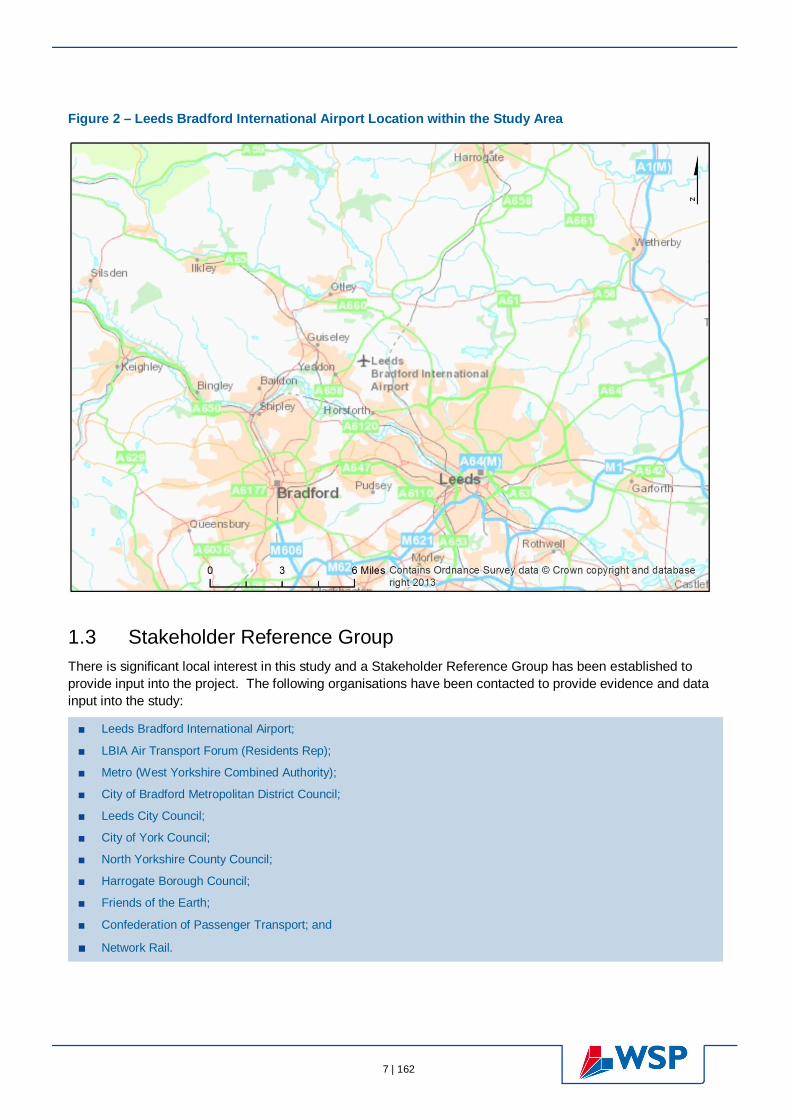
Study Area 1.21.2.1LBIA is located 11km north west of Leeds City Centre, 10km north east of Bradford and 16km south west of Harrogate. The airport is 208 metres above mean sea level (CAA 2013), making this Airport the highest in England. Whilst the main catchment area for LBIA has been shown to be the wider Yorkshire and The Humber region, scheme interventions are likely to be most effective within the Leeds city region boundary as displayed in Figure 1, particularly on routes close to the LBIA. Figure 2 shows the airport in the context of Leeds, Bradford and Harrogate.

Project number: Dated: 26/11/2014 6 | 162 Revised:
Figure 1 – Leeds Bradford International Airport Location within the Leeds City Region
7 | 162
Figure 2 – Leeds Bradford International Airport Location within the Study Area
Stakeholder Reference Group 1.3There is significant local interest in this study and a Stakeholder Reference Group has been established to provide input into the project. The following organisations have been contacted to provide evidence and data input into the study:
Leeds Bradford International Airport;
LBIA Air Transport Forum (Residents Rep);
Metro (West Yorkshire Combined Authority);
City of Bradford Metropolitan District Council;
Leeds City Council;
City of York Council;
North Yorkshire County Council;
Harrogate Borough Council;
Friends of the Earth;
Confederation of Passenger Transport; and
Network Rail.

Project number: Dated: 26/11/2014 8 | 162 Revised:
Purpose of the Report and Report Structure 1.4This Connectivity Study follows the step by step approach for Option Development as set out in the Department for Transport’s Transport Analysis Guidance. Figure 3 displays the work flow of this approach.
This document summarises the findings of the Connectivity Study, providing an overview of the current and future issues facing LBIA and discussing the methodology employed to formulate a preferred package of interventions to support the development goals of LBIA.
The remainder of the Option Assessment Report (OAR) provides an overview of the modelling and appraisal process, and the results from this, along with conclusions and recommendations for further review which will be taken forward into the associated Appraisal Summary report (ASR).
After this introduction, the following sections of the report are set out as follows:
Chapter 2 Study Objectives Chapter 3 Evidence review and Identified Issues Chapter 4 Future Situation Chapter 5 Underlying Causes, Scheme Objectives and Study Area Chapter 6 Option Generation Chapter 7 Appraisal and Sifting Process Chapter 8 Shortlisted Schemes Chapter 9 Option Assessment Chapter 10 Public Transport Appraisal Results Chapter 11 Highway Scheme Appraisal Results Chapter 12 Conclusions

9 | 162
Figure 3 – LBIA Connectivity Study Work Flow
Project number: Dated: 26/11/2014 10 | 162 Revised:
Study Objectives 2
Introduction 2.1Objectives set out what a project is trying to achieve. Specific and Measurable objectives provide a definition of the success of a project or initiative when the options are appraised. Achievable and Realistic objectives ensure that the group remains engaged and motivated to accept the outcomes of the assessment and to deliver. Time Based objectives ensure that all stakeholders agree with the potential deliverability of the proposed schemes, and ensure they remain realistic, within the constraints that may exist (such as funding and planning horizons, or scheme dependencies and interactions). Together this ensures the objectives are SMART.
Objectives for the study were set out within the project brief issued by DfT and further clarified through the inception and evidence building stage. It was important to ensure that the study objectives were fully reflected in the evidence gathered, and that the method of appraisal and the indicators selected to measure the impact of schemes demonstrated alignment with the objectives.
Objectives 2.2The overarching strategic objective of this study is to
For the purposes of assessing the impact of, and benefits resulting from, potential improvements (scheme proposals) the project team has further clarified the way connectivity will be identified and appraised. This provides Specific and Measureable outcomes. Recent statistical releases from the DfT in June 20141 also start to define how transport connectivity could be measured. Measures included in this final release include:
We propose to use the first two of these measures, as the study is focussed on one particular journey destination, rather than a range. The objectives are expressed as to reduce journey times to and from LBIA, and increase the catchment of LBIA (within a given travel time).
The impact on objectives can then be measured using a mix of transport model data and accessibility analysis.
A secondary objective has been set relating to the aspiration of the airport to grow and in particular:
1 Connectivity Travel Time Indicators: England, 2011 data (experimental)
1. Identify and appraise measures to help improve the existing connectivity between LBIA and its catchment area.
Travel time indicators: the average travel time from origins to destinations;
‘Access to destination’ indicators: these provide a measure of the number/percentage of people able to access particular destinations (e.g. LBIA). This will be expressed as the number of households multiplied by the average occupation within defined travel times; and
‘Number of destination’ indicators: These count the number of destinations of a certain type (e.g. airports) within a given travel time of an origin area.
2. Understand the transport connectivity constraints to the future growth of LBIA and identify and appraise surface access measures (including road and public transport) required to help facilitate this future growth.

11 | 162
In order to ensure the study objectives remain Time Based, Achievable and Realistic, a further set of sub objectives was agreed to guide the subsequent selection of schemes for detailed appraisal.
The following areas have been investigated to gain a thorough understanding of the existing barriers to the future growth of LBIA:
By understanding the barriers to growth we have developed an informed and robust mitigation strategy, identifying measures that will both facilitate and help support the future growth aspirations of LBIA.
To establish short / medium term solutions (up to 10 years) and long term (beyond 10 years) solutions;
To provide a range of transport solutions covering all modes of surface transport; and
Identify a number of distinct and feasible options for further development and assessment within the scope of the study.
Existing levels of congestion on highway links and at junctions within the study area;
Levels of public transport accessibility, relative to airport catchment;
Growth projections at the airport and resultant trip generation by mode; and
Scheme interventions by mode and timescale that are required to address the issues identified above.
Project number: Dated: 26/11/2014 12 | 162 Revised:
Evidence Review and Identified Issues 3
Introduction 3.1This section presents a review of the evidence relating to the existing connectivity of LBIA.
Review of Previous Studies 3.2A number of previous studies pertinent to the connectivity of LBIA have been reviewed including:
Policy Review 3.3A number of previous studies pertinent to the connectivity of LBIA have been reviewed including:
Socio-Demographic Analysis 3.4An analysis of existing socio-demographic indicators for Leeds, Bradford and Harrogate authorities was undertaken and considered the following:
Leeds City Region DaSTS Connectivity Study (2010);
Yorkshire and Humber Route Utilisation Strategy (2009);
Yorkshire Rail Network Strategy (2012);
Review of Proposed Rail schemes to Leeds Bradford International Airport (2013);
Leeds – Harrogate – York Rail Line Business Case (2013);
UK Aviation Forecasts (2013); and
Leeds Bradford Economic Hub Report (2013).
The Future of Air Transport White Paper (2003);
Leeds Bradford International Airport Masterplan (2005-2016);
Surface Access Strategy (2006);
Investing in Britain’s Future (2013);
Aviation Policy Framework (2013);
Airports Commission Interim Report (2013); and
Leeds City Region Strategic Economic Plan (2014).
Population Density: persons per square km, 2014 (source: NTEM, 2014);
Ageing Population: percent of persons aged 65 or over, 2014 (source: NTEM, 2014);
Car Availability: average number of cars per household, 2014 (source: NTEM, 2014);
Employment Density: jobs per square km, 2014 (source: NTEM, 2014);
Gross Weekly Household Income, 2014 (source: NTEM, 2014); and
Unemployment: job-seekers allowance claimant rate, 2014 (source: NTEM, 2014).

13 | 162
In addition, Index of Multiple Deprivation (IMD) data produced by the Department for Communities and Local Government was considered to gain an understanding of deprivation in the LBIA vicinity. IMD data is a combination of the following indicators:
Key findings from this analysis are summarised in Section 3.10 of this report.
LBIA Travel Patterns 3.5An analysis of existing travel patterns of LBIA users and connectivity to LBIA via road and public transport was undertaken using a variety of data sources.
The Civil Aviation Authority (CAA) has undertaken a series of airport passenger surveys since 1968, providing information about air travellers and the determinants of the travel market. The latest CAA survey for Leeds Bradford Airport was undertaken in 2010 and was structured so that all scheduled routes and flights within a route were regularly sampled. An analysis of the 2010 CAA data was conducted, considering the following indicators:
LBIA passenger arrival and departure patterns were also investigated with data sourced from Halcrow’s 2008 transport assessment for the proposed LBIA Terminal expansion.
Key outcomes of this analysis are summarised in Section 3.10 of this report
Road Network, Traffic Flows and Congestion 3.6The following was reviewed to ascertain a better understanding of the existing road network and associated connectivity issues via private and non-motorised transport modes:
Income;
Employment;
Health;
Education;
Barriers; and
Living Environment.
Origin and destination from regional airports;
Origin and destination from LBIA within Yorkshire and the Humber by flight type;
Origin and destination from LBIA within Yorkshire and the Humber by journey type;
‘Leakage’ from the Yorkshire & Humber Region;
Mode of transport from regional airports;
Mode of transport from LBIA by trip purpose type; and
Mode of transport from LBIA to each Region.
Audit of the highway network audit and identification of critical junctions for further analysis;
Audit of the non-motorised user networks in the LBIA vicinity including footpaths and cycleways;
Evaluation of junction performance and capacity constraints based on data from the 2008 base year Saturn highway model;
Drive time analysis to and from airport based on 2014 Traffic Master data; and
Congestion analysis using 2013 Streetmap Premium traffic data.
Project number: Dated: 26/11/2014 14 | 162 Revised:
The key findings of this analysis are summarised in Section 3.10 of this report.
Public Transport and Accessibility 3.7A detailed review of existing public transport provision to LBIA was conducted in order to understand any barriers or constraints. The review considered the following:
Key public transport and accessibility findings are summarised in Section 3.10 of this report.
Road Safety 3.8A strategic assessment of the collision history was been undertaken to identify collision hot spots on the road network surrounding LBIA. EuroRap risk mapping data was also incorporated into the assessment to identify the relative risk rating of the roads surrrounding LBIA.
Key findings of the road safety review are summarised in Section 3.10 of this report.
Environmental Constraints 3.9A review of the natural and built environment constraints, noise levels and existing habitat areas in the vicinity of LBIA was conducted as part of the evidence review. Key findings summarised in Section 3.10 of this report.
Key Existing Transport Related Issues 3.10Through our review of the evidence base and consultation with stakeholders, the following key transport-related issues have been identified.
3.10.1Passenger Leakage to Adjacent Airports
Existing rail provision including routing, timetable and facilities audits at stations in closest proximity to LBIA;
Existing bus service provision between key population centres and LBIA;
Existing bus services providing connections between LBIA and rail stations;
Comparative accessibility analysis of both private and public transport modes;
Review of existing private taxi arrangements at LBIA;
Existing car parking arrangements at LBIA and current visitor parking profiles; and
The Airport attracts only 12% of its passengers from outside the Yorkshire and Humber Region. 66% of all passengers are from within the West Yorkshire Authority.
More passengers in the Yorkshire and the Humber Region travel to Manchester Airport (3.5 million) than Leeds Bradford (2.3 million). Collectively, the number of passengers not using Leeds Bradford in the Region is high; the total ‘leakage’ from the Yorkshire and the Humber region is 5.47 million passengers.
The Airport is currently developing, implementing and monitoring an appropriate Surface Access Strategy which maximises the potential for increasing the journeys made to the Airport by public transport

15 | 162
3.10.2Mode of travel to the Airport
3.10.3Rail and Interchange Facilities
3.10.4Bus Provision and Connectivity
Figure 4 – Bus Frequency Map
Imagery, Google Earth (© 2013 Google, © 2013 Infoterra Ltd & Bluesky, © 2013. The GeoInformation Group, © 2013 Bluesky) 2013
93.2% of passengers arriving at LBIA are by private vehicle. International travellers are more dependent on public and other transport modes as they do not have access to a private car.
17.9% of passengers at LBIA are business travellers.
Peak departure passenger demand on the local road network is between 05:00 – 06:00 (AM peak) and 17:00 – 18:00 (PM peak)
Peak arrival passenger demand on the local road network is between 09:00 – 10:00 (AM peak) and 19:00 – 20:00 (PM peak).
There are currently no direct rail services to LBIA. The closest rail stations to LBIA are Horsforth (4km south east on the Harrogate Line) and Guiseley (5km west on the Wharfedale Line).
Poor Interchange facilities exist at Horsforth with no provision of a bus interchange to the airport and the nearest airport serving bus stop is 1.5 km away. Guiseley does not connect well to the existing bus service with the bus stop located 450 metres away from the train station.
LBIA is served by direct and non-direct bus services from Leeds, Bradford, Harrogate and Otley. Service patterns are displayed in Figure 4.

Project number: Dated: 26/11/2014 16 | 162 Revised:
Table 1 – Average Timetabled Journey Times to LBIA (minutes)
Route Time Period Car Bus Only Rail then Bus
Leeds Railway Station to LBIA AM 29 41 - IP 29 36 -
PM 29 41 -
Bradford Railway Station to LBIA AM 22 16 54 IP 22 16 42
PM 22 44 63
Harrogate Railway Station to LBIA AM 23 30 36 IP 23 30 56
PM 23 27 39
Figure 5 – PT Journey Time Isochrones to LBIA (left) and Bus Accessibility Travel Time Isochrones (right)
Private Car (and Taxi) provide superior journey times compared to Bus as shown in Table 1.
Public Transport Accessibility to the airport from outside the Leeds City Region is limited as demonstrated in Figure 5.
Bus accessibility is relatively constrained to those corridors with direct access also displayed in Figure 5. The corridors to Harrogate, Otley and Ilkley also have relatively good direct access.
When compared to other regional airports in this part of the UK, Leeds Bradford is the worst performing in terms of public transport accessibility and road access as shown below in Figure 6.
Connecting LBIA into the railway network. This is identified in a number of previous study documents and evidence suggests that direct and reliable rail services maximise rail mode share and this consistent with findings from across the world.
Deliverability of a rail link from the Airport. The deliverability of a rail link into the existing rail network is challenging and existing studies have shown a relatively lower impact in the context of competing local priorities.

17 | 162
Figure 6 – Comparison of Airport Catchment Areas
Source: Department for Transport, 2013
3.10.5Traffic Levels and Congestion
3.10.6Interchange Information Management and Route Signing Strategies
High Traffic Flows are located on:
A658;
A6120 (Leeds Outer Ring Road);
A65; and
A660 (between A658 and Leeds).
Congestion and queuing – at peak periods occurs around the following junctions:
A658 / A660 (Signals);
A657 / A658 Greengates Junction (Signals);
A65 / A658 (Roundabout);
A65 / A6120 (Roundabout); and
A657 / A6210 (Roundabout).
North Yorkshire County Council (NYCC) have identified LBIA as a regional airport that serves North Yorkshire, York and beyond. NYCC observe that highway links from the Airport to the A1(M) are particularly poor requiring the use of either the A658 via Harrogate to J47, the A659 via Harewood and Collingham to J45 or the A6120 Leeds Ring Road and A64 to J44.
Route Signing Strategy – Through meetings with stakeholders, it has been identified that interchange information (Leeds and Bradford Rail Stations) and highway signage to the Airport is not clear and requires improving along the key corridors.
Project number: Dated: 26/11/2014 18 | 162 Revised:
3.10.7Road Safety
3.10.8Environmental Constraints
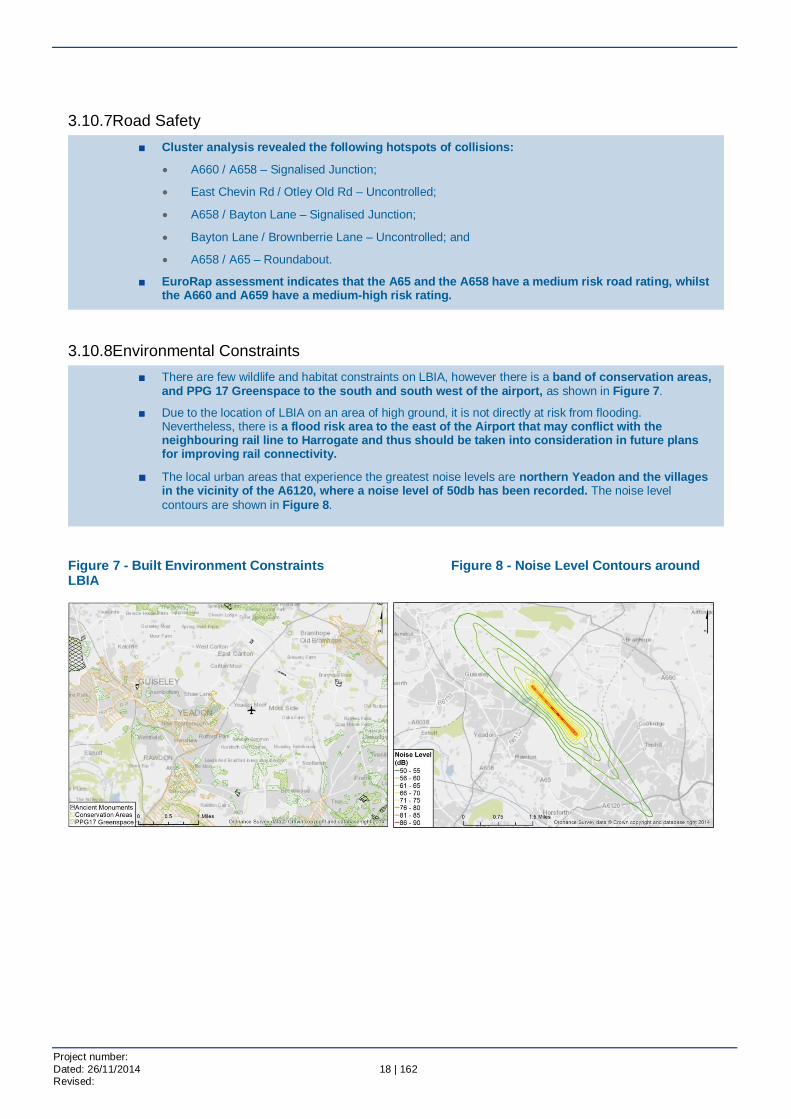
Figure 7 - Built Environment Constraints Figure 8 - Noise Level Contours around LBIA
Cluster analysis revealed the following hotspots of collisions:
A660 / A658 – Signalised Junction;
East Chevin Rd / Otley Old Rd – Uncontrolled;
A658 / Bayton Lane – Signalised Junction;
Bayton Lane / Brownberrie Lane – Uncontrolled; and
A658 / A65 – Roundabout.
EuroRap assessment indicates that the A65 and the A658 have a medium risk road rating, whilst the A660 and A659 have a medium-high risk rating.
There are few wildlife and habitat constraints on LBIA, however there is a band of conservation areas, and PPG 17 Greenspace to the south and south west of the airport, as shown in Figure 7.
Due to the location of LBIA on an area of high ground, it is not directly at risk from flooding. Nevertheless, there is a flood risk area to the east of the Airport that may conflict with the neighbouring rail line to Harrogate and thus should be taken into consideration in future plans for improving rail connectivity.
The local urban areas that experience the greatest noise levels are northern Yeadon and the villages in the vicinity of the A6120, where a noise level of 50db has been recorded. The noise level contours are shown in Figure 8.

19 | 162
Future Situation 4
Introduction 4.1This section presents a review of the evidence relating to the future growth aspirations of LBIA.
Regional and Local Policies Relating to the future of LBIA 4.2A number of national, regional and local plans, strategies and policies relevant to the connectivity of LBIA have been reviewed including:
Policy Type Details Documents Reviewed
Aviation To understand the national regional and local need and demand for aviation growth, which can be supported by LBIA.
National DfT, Aviation Policy Framework
(2013) DfT, UK Aviation Forecasts (2013)
Regional Connecting with the World: An
Aviation Strategy for Leeds City Region (2013)
Local LBIA Economic Hub (2013)
LBIA Masterplan (2005-2016)
Spatial Planning
The local policies summarised within this section present the aspirations for growth at a regional and local level, including support for airport growth.
Regional Leeds City Region Economic
Partnership Strategic Economic Plan (2014)
Local Leeds City Council Core Strategy
(2013) The Development Plan for Bradford
(2014) Harrogate Borough Council Local
Plan (2009)
Local Transport Plans
To identify regional and local transport strategies, including proposed schemes and implementation plans, to identify future transport measures that will improve access to LBIA.
Regional Leeds City Region Transport
Strategy Local
West Yorkshire Local Transport Plan North Yorkshire Local Transport
Plan York Local Transport Plan
Housing Growth 4.3The projected increase in households at the local level has been investigated using a variety of recent planning documents including:
Leeds City Region Spatial Economic Plan (2014);
Draft Leeds Core Strategy (2013);
Draft Bradford Core Strategy Development Plan Document (2014); and
Harrogate Adopted Core Strategy (2009).
Project number: Dated: 26/11/2014 20 | 162 Revised:
Key findings from this analysis are summarised in Section 4.9 of this report.
Employment Change 4.4A variety of policy documents have been reviewed to assess the quantum of future employment development in the region. These include:
Key findings from this analysis are summarised in Section 4.9 of this report.
Economic Performance 4.5A review of documents and various data sources has been conducted in order to estimate the economic benefits of investment in Leeds Bradford International Airport. The review considered the following:
Key findings from this analysis are summarised in Section 4.9 of this report.
Socio-Demographic Changes 4.6A review of the socio-demographic characteristics in regards to demographics, economics, health and education enabled the evaluation of current and anticipated trends in the quality of life for people living in the Leeds City Region. The key findings of the forecasted trends in these areas are summarised in Section 4.9 of this report.
Environmental Issues 4.7The Leeds City Region area has a range of environmental issues that must be taken into consideration when evaluating packages of interventions to improve the connectivity to Leeds Bradford International Airport. To understand the environmental issues the following have been investigated:
Leeds City Region Spatial Economic Plan (2014);
Draft Leeds Core Strategy (2013);
Draft Bradford Core Strategy Development Plan Document (2014);
Harrogate Adopted Core Strategy (2009); and
Leeds Bradford International Airport Masterplan 2006-2016.
ONS Average Total Headline Workplace GVA statistics;
Leeds Bradford International Airport Economic Impact Assessment (2009)
Bradford City & District: How we earn for a living (2014);
Carbon and Greenhouse Gas Emissions;
Flood Risk; and
Tranquillity.

21 | 162
Transport Futures 4.8To understand future travel demand a review of estimated traffic growth in West Yorkshire and North Yorkshire has been conducted, along with an examination of schemes and policies contained within Local Transport Plans and Policy documents for the area. Resources used to inform this review include:
Key findings summarised in Section 4.9 of this report.
Summary of Future Transport Related Issues 4.9
4.9.1Growth in Passenger Demand
4.9.2Growth in Housing
4.9.3Growth in Employment
TEMPRO estimates to calculate Traffic Growth to 2030;
Local Plans
West Yorkshire Metro Local Transport Plan;
North Yorkshire County Council Local Transport Plan;
Harrogate Borough Council Corporate Plan;
Leeds City Region Transport Strategy;
York Local Plan Preferred Options and Transport Links; and
LBIA Terminal Expansion Planning Commitments.
Airports other than Heathrow need to improve their international offering to support long term growth in passenger forecasts, with Heathrow and other south-east airports expected to be full by 2030.
UK Aviation Forecasts for constrained central demand suggest LBIA could grow from the 3.3mppa level in 2013 to 6.4mppa in 2030, an increase of 94%.
Leeds – Growth in housing with 15,000 new houses to be built within 5km of the Airport. Pockets of growth are identified at Guiseley and Otley. Leeds has proposals for 66,000 houses across the district over the plan period.
Bradford – Growth in housing across the district of 42,000 house over the plan period, although no substantial housing developments within 5km of the airport.
Harrogate – 390 houses per year from 2004 to 2023. No major settlements planned within 10km of LBIA
Leeds – Growth in employment of approximately 16 ha office space, concentrated in Leeds City Centre and an additional 143 ha of land for general employment use.
Bradford - The council will support the delivery of 2,897 new jobs per year up to 2030. To enable this, the policy includes plans to supply at least 135 ha of developable employment land. The Esholt Estate is located on the A658 and is identified in the Core Strategy as a key employment site.
Harrogate - Anticipated provision of 45 ha employment land up to 2021 to be achieved through the development of land with existing planning permissions, plus the allocation of new development land concentrated in Ripon and Knaresborough. Build rates are currently under review.

Project number: Dated: 26/11/2014 22 | 162 Revised:
4.9.4Development of LBIA
4.9.5LBIA Terminal Expansion Planning Commitments
Table 2 – Example Surface Access Improvement Measures
No Measure Approx. Cost
1 The introduction of MOVA control and improved pedestrian detectors at the junction of Harrogate Road, Bayton Lane £34k
2 The introduction of MOVA control at Rawdon Crossroads £23k
3 The introduction of bus priority equipment at the above two signal junctions £21k
4 Contribution to Airport Link Road Feasibility Study Work £75k
5 Tram – train (after 2016) Feasibility Study £90k
Of the above commitments, at the time of writing, it is understood that only the Travel Plan and Rawdon Crossroad upgrades have been completed, although not as part of the 2009 application transport commitments.
Ambitious growth targets up to 2030 will not require an extension to the airport’s runway and it is anticipated that all airside needs will be accommodated within current airport boundaries.
From the analysis undertaken by LBIA, it is considered that the creation of a wider economic hub well established at airports of all scales across the UK and abroad, represents the most effective way of developing the airport and maximising its potential for the City Region. This requires co-ordinated efforts across all partners to define the strategy, deliver the land, attract the investment, and secure significant improvements in surface access infrastructure. However, as yet, this is not an adopted policy
LBIA has a number of Transport Commitments as part of its planning application for a two storey extension to the terminal building submitted in 2009. These are summarised as:
In the event of expiry or termination of bus contributions paid by LBIA to West Yorkshire Metro and/or North Yorkshire County Council, then the bus contributions should instead be paid to Leeds City Council who will use the contributions to deliver bus services to the airport, with any surplus used for public transport or surface access improvements. Contributions can only cease if 10% of passengers use public transport, or the airport has a throughput of 5 million passengers per annum.
Leeds Bradford International Airport will pay Leeds City Council a number of contributions towards transport improvements as stated below. LBIA will pay for monitoring.
First Improvements – Contribution of £125,000 prior to commencement of development. Second Improvements – Contribution of £425,000 once annual throughput of airport reaches
3.8 million passengers and AM Peak (0800 – 0900) entrances/exits to the airport is over 831 vehicles, or 1332 during the PM Peak (1700 – 1800).
Third Improvements – Contribution of £500,000 after the first two contributions have been made and not spent on highways improvements, and traffic flows have not fallen below the above thresholds (831 AM Peak, 1332 PM Peak), OR highways improvements have been undertaken and traffic flows have increased to either 893 during AM Peak or 1432 during PM Peak.
LBIA’s Travel Plan will be managed by an appointed Travel Plan Co-ordinator. LBIA will pay for Travel Plan monitoring undertaken.
A Steering Group chaired by Leeds City Council will decide how the bus contributions and improvements contributions will be allocated. The S106 lists a number of schemes and projects that could be funded by the contributions. This is replicated in Table 2 below.

23 | 162
The 2009 planning application proposal has yet to be started; however, an £11 million upgrade to the existing building, not requiring planning permission, has been completed.
4.9.6Growth in Gross Value added
4.9.7Changes in Socio Demographics
4.9.8Traffic Growth
The average GVA per head for Yorkshire and Humber in 2012 was £17,556. This is in comparison to the national average headline workplace GVA per head of £21,674. Since 1997 this difference has been increasing, and Yorkshire and Humber has been declining in performance relative to the UK. The Yorkshire and Humber GVA per head average in 1997 was 14% lower than the UK average, whereas in 2012 the difference was 19%.
Total GVA in 2012 for Yorkshire and Humber was approximately £93,339 million. The two largest GVA output contributing sectors in Yorkshire and Humber in the years 1997 to 2011 are manufacturing; and wholesale and retail trade. Manufacturing contributed £13,197 million in 2011, whilst wholesale and retail trade contributed £11,420 million. These two sectors equates to 27% of the 2011 total GVA in Yorkshire and Humber.
An assessment of existing (in 2009) employment at Leeds Bradford International Airport revealed that the airport contributed to 2,668 net jobs to the Leeds City Region and Yorkshire. This translates to a GVA of £98.5 million.
The proposed terminal extension (2009) was part of a £70 million investment to enhance LBIA. This was anticipated to create in the region of 5,876 jobs in 2015 and 7,974 jobs by 2020, generating £218 million in GVA by 2015 and £269 million by 2020.
The Yorkshire and Humber region is becoming increasingly an ageing population as life expectancy increases and birth rates remain low. The region is expected to have over 400,000 residents over 80 years old by 2020.
In 2014, the predominantly rural area to the north of LBIA has a relatively high proportion of over 65’s although this proportion is anticipated to decline by 2030. In the Leeds and Bradford urban areas, there is a smaller proportion of over 65s, and again there is anticipated to be reductions in these proportions in most local regions up to 2030.
At 20.5%, West Yorkshire is anticipated to experience the greatest level of traffic growth in the country. Growth in North Yorkshire is expected to be marginally below the national average.
Regional Traffic Growth is expected to be 23.5% for Leeds, 20.9% for Bradford and 9.3% for Harrogate.
Although Airport Traffic contributes a low percentage of traffic during the peak periods, the general growth in traffic will exacerbate the impedance of traffic to and from the airport.

Project number: Dated: 26/11/2014 24 | 162 Revised:
4.9.9Transport Plans and Futures
Leeds City Region Transport Strategy (2009) identified improved connectivity to LBIA as a spatial priority. To improve connectivity, the Transport Strategy suggested the following short-term proposals:
Improved bus connections for longer distance journeys;
Bus priority to reduce journey times and improve reliability;
Review of technology options on Harrogate rail line to deliver service to LBIA; and
Improve highway access.
To achieve this, the following potential projects and schemes were proposed:
Improved bus links to LBIA including feeder links from local centres and rail stations (Yorkshire Tiger Service now in operation between Leeds and LBIA);
A new A65/A558 link road;
A65 Quality Bus Corridor (completed scheme); and
Tram Train Link.
The West Yorkshire Local Transport Plan supports the allocation of expenditure towards improved links to the Airport and identifies LBIA as a key spatial priority and states support for the Surface Access Strategy. In addition, the LTP identifies that improved public transport connectivity and improved road links with reduced congestion is beneficial to the airport and the local economy. The plan has also identified a fixed public transport link, including a possible tram-train link to the airport, are specifically identified as schemes that would improve surface access.
High Speed Rail – Current Government proposals to deliver a north-south High Speed Rail link (HS2) are being supported by the Leeds City region, and will have the potential to offer 80 minute journey times to London from Leeds, freeing capacity on the existing rail network and creating a significant transport hub for the City Region.
In support of this, and the potential for a second east-west high speed rail link from Liverpool to Newcastle via Leeds, the refocussing of transport plans to ensure the City region can become HS2 Ready is ongoing.
A connectivity study is currently being carried out by the LCR Stakeholders to identify the details of what is required in terms of transport schemes, but it is expected this will include both road and rail based improvements to make the most of the economic benefits that improved connectivity can deliver.

25 | 162
Underlying Causes, Objectives and Study Area 5
5.1.1Introduction This section outlines the underlying causes of the connectivity issues facing LBIA as identified in Sections 3 and 4 and links these to the core study objectives and identification of the geographic area of focus.
5.1.2Underlying Causes The Underlying Causes of the Connectivity Issues of LBIA can be categorised into the following headings:
The following section summarises the causes of the current, and future, likely constraints and connectivity issues associated with the Airport.
5.1.3Historical Context of LBIA LBIA is located 11km north west of Leeds City Centre, 10km north east of Bradford and 16km south west of Harrogate. The airport is 208 metres above mean sea level (CAA 2013), making this Airport the highest in England.
The Airport was originally Yeadon Aerodrome, which began operating in October 1931 with club flying and training flights being predominant activities. At this time it was on 60 acres of grassland along the Bradford Harrogate Road.
In 1978 a Government White Paper on Airports Policy identified that Yorkshire could sustain a Category B regional airport, and concluded that Leeds Bradford could fulfil this role provided that the main runway was extended. However, the Paper positioned Manchester Airport as the key international gateway in the north, proposing expansion to relieve the pressure on South East airports and promote regional development.
In 1979 a Public Inquiry was held to consider the planning application to extend the runway and terminal facilities at Leeds Bradford Airport, and in December 1980 the Secretary of State approved the application but imposed a restriction on operating hours.
Construction work started in 1982 of a £23 million scheme to extend the main runway to 2,250 metres, improve and divert the A658 Bradford to Harrogate road (including incorporating a twin tunnel under the runway) and substantial improvements to the terminal facilities. By 1986 half a million passengers passed through the airport and Air France's Concorde visited for the first time.
In 1996 the Airport saw its millionth passenger, and in 2005 just over 2.6 million passengers passed through the Airport. Since 1996 the terminal building has virtually doubled in size with new and improved arrivals and departure facilities, lounges and two new air bridges.
Extensive development also took place during 2003 on the south side of the airport. Multiflight Ltd invested £8 million to create two new hangars, together with a new taxiway and apron to provide world class aircraft maintenance facilities and a new business executive aviation terminal.
1) Historical Context;
2) Passenger Demand;
3) Regional Growth;
4) Road Network Constraints; and
5) Public Transport Network Constraints.
Project number: Dated: 26/11/2014 26 | 162 Revised:
The airport was in public ownership until 2007 when it was sold to Bridgepoint Capital. Since 2009, there has been an application for a two-storey extension of the terminal building, This has yet to be completed, however, an £11 million upgrade to the terminal building, not requiring planning permission, has been completed.
5.1.4Passenger Demand The UK Aviation Forecasts report sets out the DfT’s estimates of air passenger numbers, aircraft movements and aviation carbon emissions at UK airports from 2013 to 2050.
The UK Aviation Forecasts for constrained central demand forecasts indicates that the LBIA could grow by 121% by 2030, handling up to 6.4mppa by 2030. With this growth, there will be an increased demand on the transport network connecting LBIA. In order to facilitate sustainable growth, improvements will be required to upgrade the current transport network to cater and encourage travel to and from the airport.
5.1.5Growth of the Leeds City Region The Leeds City Region Enterprise Partnership’s Strategic Economic Plan (SEP) provides the Leeds City Region’s long term vision for its economy:
To achieve this vision, the SEP has set out the following investment priorities:
Of Leeds Bradford International Airport, the SEP identifies the Airport’s role as a major hub in the region for national and international connectivity. Growth of the Airport and improved links to it to it are considered within the SEP through the promotion of trade and attracting inward investment.
With this growth, there is a need to facilitate connections between a wider geographical area and greater number of people.
5.1.6Surrounding Road Network The surrounding road network and its constraints are illustrated in Appendix A. The urban areas of Yeadon and Rawdon adjacent to the airport present particular local constraints as these are on route to the Airport from Bradford and Leeds centres. From Harrogate and the A1, the route is rural single carriageway to the Airport for most of the route and passes through the small urban settlements of Weeton and Pool on the approach to the Airport.
Main corridors on the approach to the airport are heavily trafficked and there are numerous signalised intersections along these routes causing journey time delay and reliability issues. The majority of the route from Leeds and Bradford City Centres are within an urban area and subject to 30 or 40mph restrictions.
To unlock the potential of the City Region, developing an economic powerhouse that will create jobs and prosperity.
Supporting growing business – developing growth hubs that drive economic growth through innovation and exports, and development of a world-class business support system;
Developing a skilled and flexible workforce – better jobs with a skilled and flexible workforce to sustain them;
Building a resource smart City Region – to become lean and resource efficient economy underpinned by 21s century energy infrastructure; and
Developing the infrastructure for growth through building a 21st century physical and digital infrastructure.

27 | 162
5.1.7Public Transport Network As is well documented, there is no rail or tram link to the airport. It has been demonstrated in the evidence base that currently, the interchange facilities at the nearest rails stations provide a poor alternative to the private car. Express bus services from Leeds City Centre have recently been improved although Bradford City Centre is not served by a direct express service to the Airport. Harrogate is connected by bus, although services direct to York ceased operation in 2009 due to lack of demand.
5.1.8Summary Having established the existing and future problems and identifying the underlying causes, the next step in the process is to Identify Intervention Specific Objectives to address the identified need and Define the Geographical area for the intervention to address. This is discussed in Section 5.2 and 5.3 below.
Defining Objectives 5.2The overarching strategic and secondary objectives of the study have been defined in Section 2 of this report. These have been agreed with the stakeholder group following analysis of the evidence base (summarised in Section 3), considering the expected future trends in the region (summarised in Section 4) and understanding the reasons for connectivity issues to LBIA (summarised in Section 5).
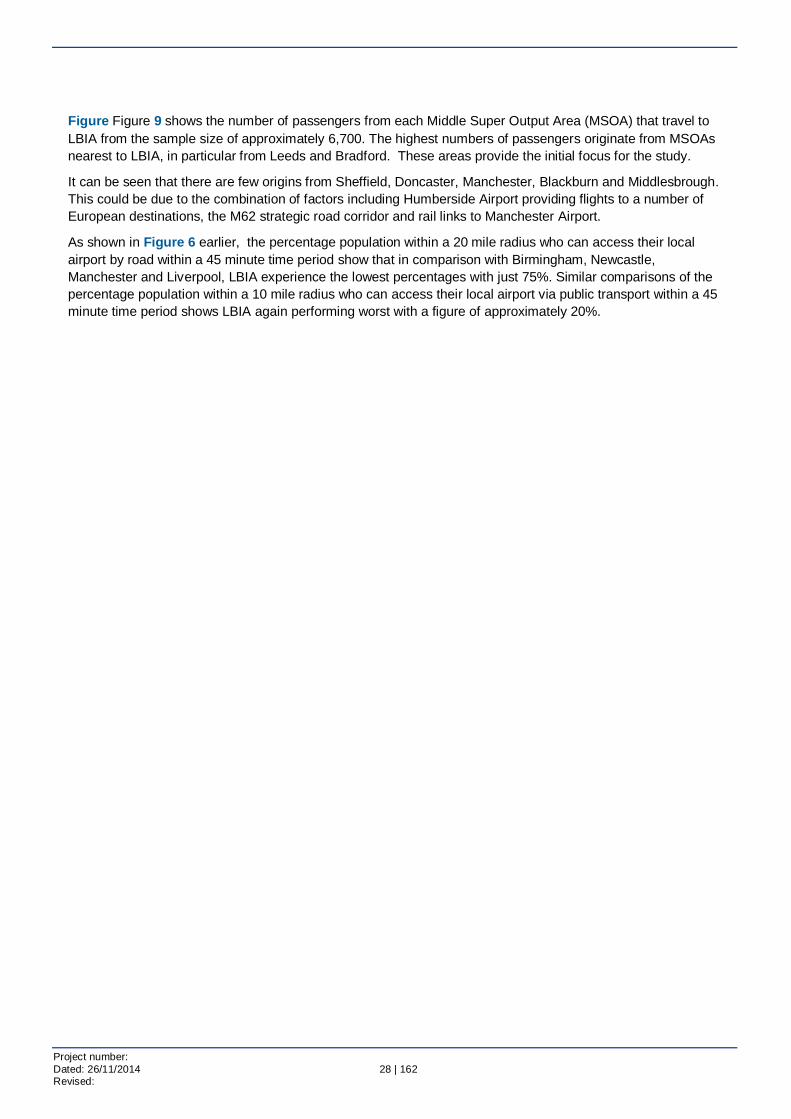
Defining the Geographic Area 5.3The geographic study has been defined using the 2010 Civil Aviation Authority (CAA) survey data extracted for Leeds Bradford. A total of 2,695,000 passengers were recorded as terminating a journey at Leeds Bradford Airport in 2010 and of these, 2,370,000 (88%) journeys originated in the Yorkshire and The Humber region. This represents the main catchment area of Leeds Bradford Airport and is therefore defined as the geographic area for the study. To provide further definition, the original postcode information from the CAA was used to plot the survey responses, shown in Figure 9.
Figure 9 – Number of passengers from each MSOA
Source: CAA Original Survey Data (2010 – sample size ~6,700)
Project number: Dated: 26/11/2014 28 | 162 Revised:
Figure Figure 9 shows the number of passengers from each Middle Super Output Area (MSOA) that travel to LBIA from the sample size of approximately 6,700. The highest numbers of passengers originate from MSOAs nearest to LBIA, in particular from Leeds and Bradford. These areas provide the initial focus for the study.
It can be seen that there are few origins from Sheffield, Doncaster, Manchester, Blackburn and Middlesbrough. This could be due to the combination of factors including Humberside Airport providing flights to a number of European destinations, the M62 strategic road corridor and rail links to Manchester Airport.
As shown in Figure 6 earlier, the percentage population within a 20 mile radius who can access their local airport by road within a 45 minute time period show that in comparison with Birmingham, Newcastle, Manchester and Liverpool, LBIA experience the lowest percentages with just 75%. Similar comparisons of the percentage population within a 10 mile radius who can access their local airport via public transport within a 45 minute time period shows LBIA again performing worst with a figure of approximately 20%.
29 | 162
Option Generation 6
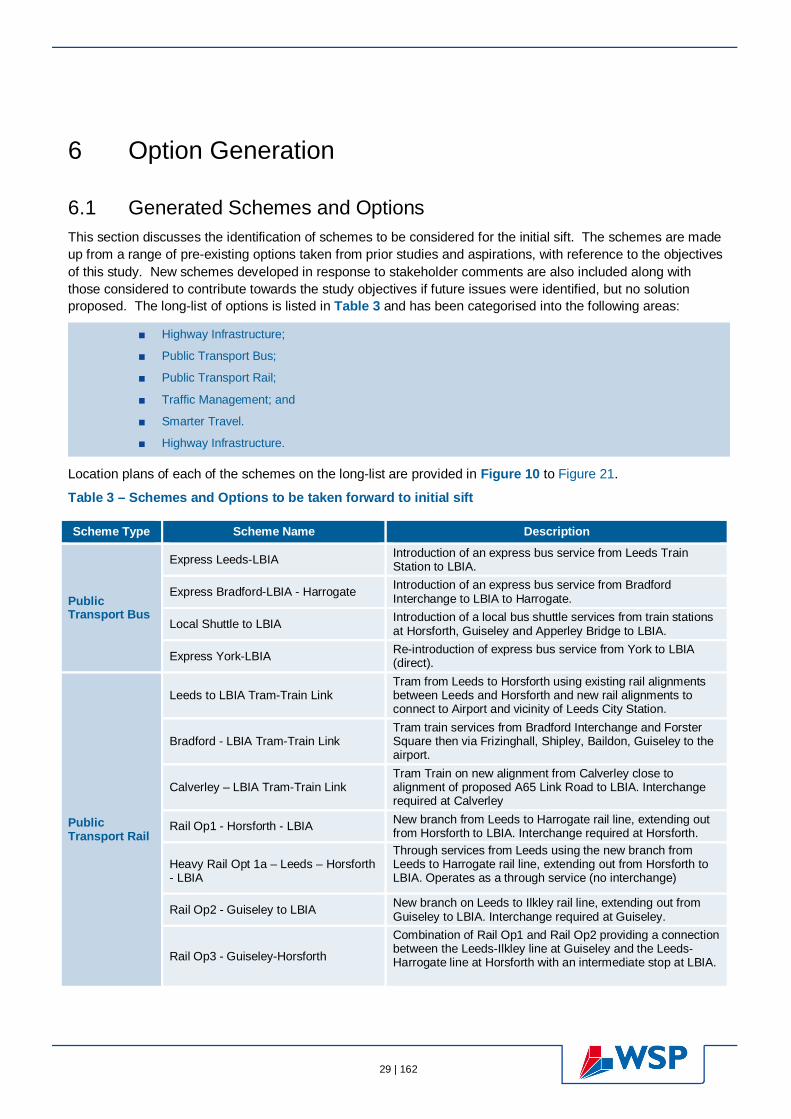
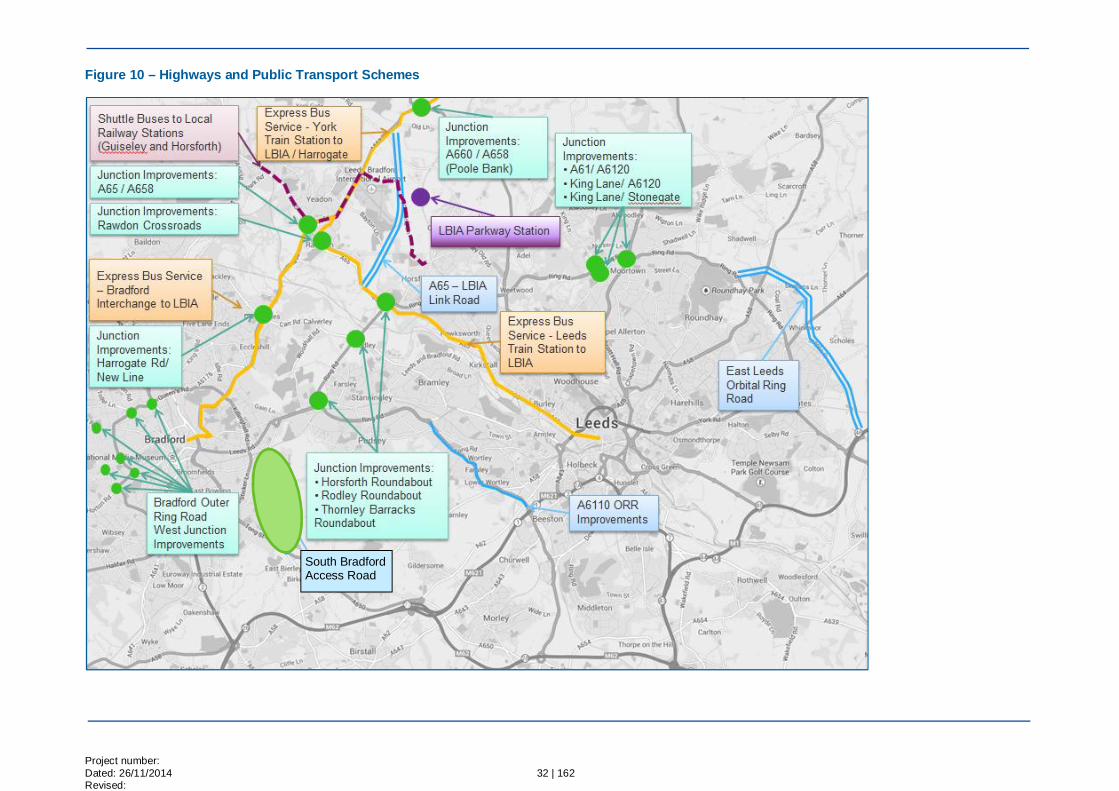
Generated Schemes and Options 6.1This section discusses the identification of schemes to be considered for the initial sift. The schemes are made up from a range of pre-existing options taken from prior studies and aspirations, with reference to the objectives of this study. New schemes developed in response to stakeholder comments are also included along with those considered to contribute towards the study objectives if future issues were identified, but no solution proposed. The long-list of options is listed in Table 3 and has been categorised into the following areas:
Location plans of each of the schemes on the long-list are provided in Figure 10 to Figure 21.
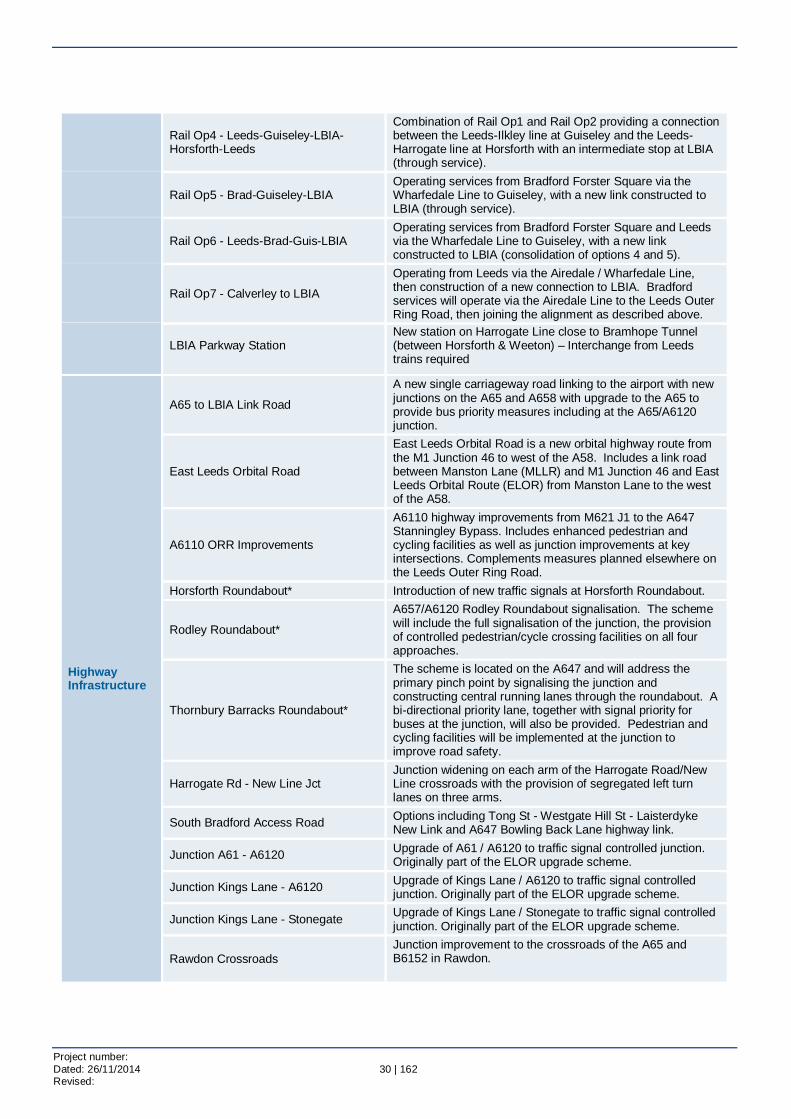
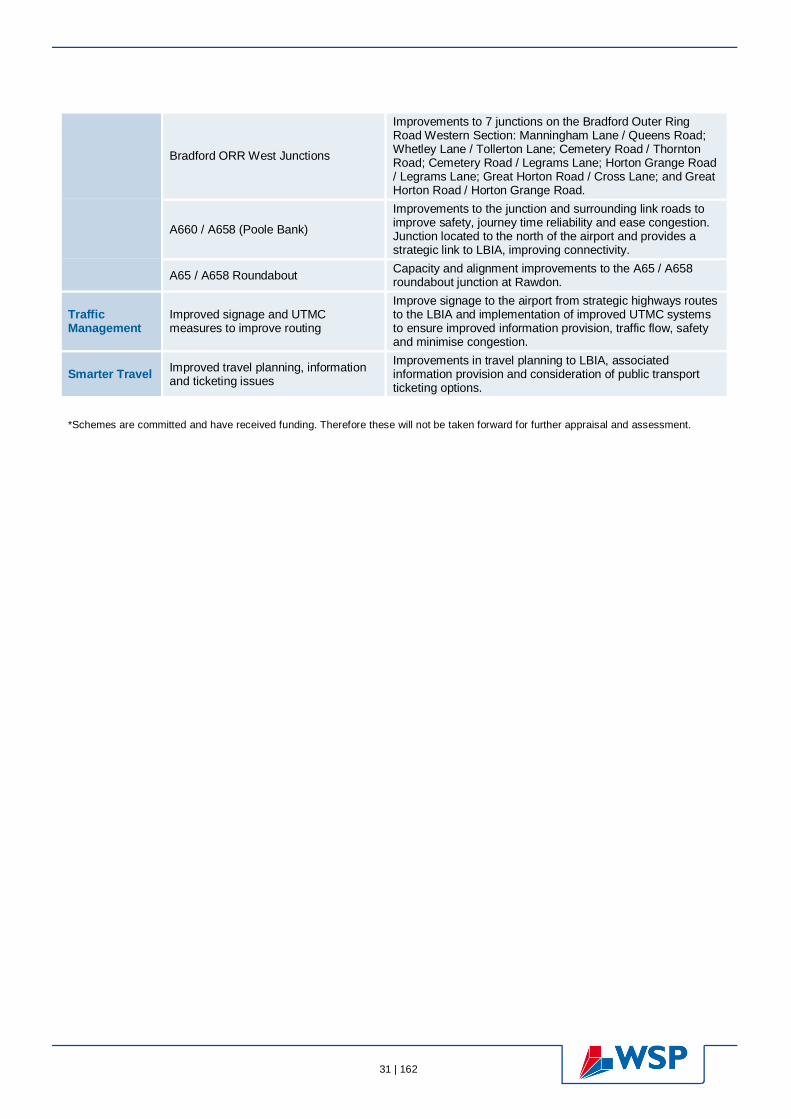
Table 3 – Schemes and Options to be taken forward to initial sift
Scheme Type Scheme Name Description
Public Transport Bus
Express Leeds-LBIA Introduction of an express bus service from Leeds Train Station to LBIA.
Express Bradford-LBIA - Harrogate Introduction of an express bus service from Bradford Interchange to LBIA to Harrogate.
Local Shuttle to LBIA Introduction of a local bus shuttle services from train stations at Horsforth, Guiseley and Apperley Bridge to LBIA.
Express York-LBIA Re-introduction of express bus service from York to LBIA (direct).
Public Transport Rail
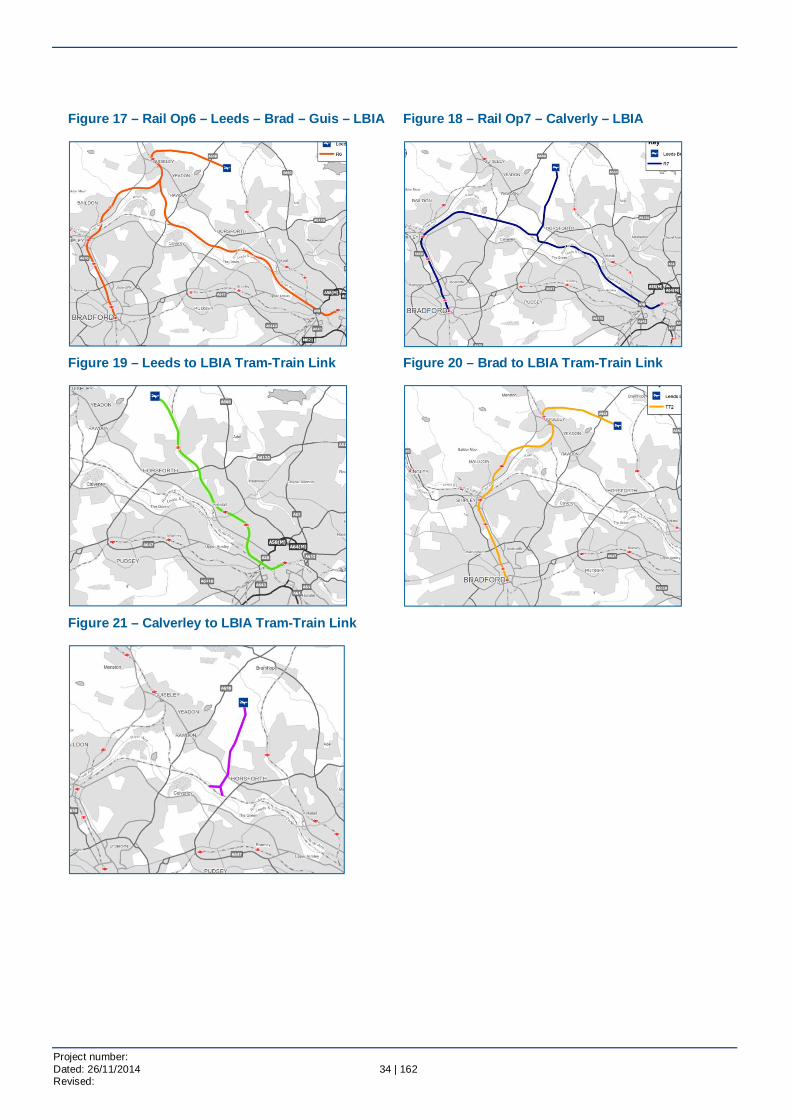
Leeds to LBIA Tram-Train Link Tram from Leeds to Horsforth using existing rail alignments between Leeds and Horsforth and new rail alignments to connect to Airport and vicinity of Leeds City Station.
Bradford - LBIA Tram-Train Link Tram train services from Bradford Interchange and Forster Square then via Frizinghall, Shipley, Baildon, Guiseley to the airport.
Calverley – LBIA Tram-Train Link Tram Train on new alignment from Calverley close to alignment of proposed A65 Link Road to LBIA. Interchange required at Calverley
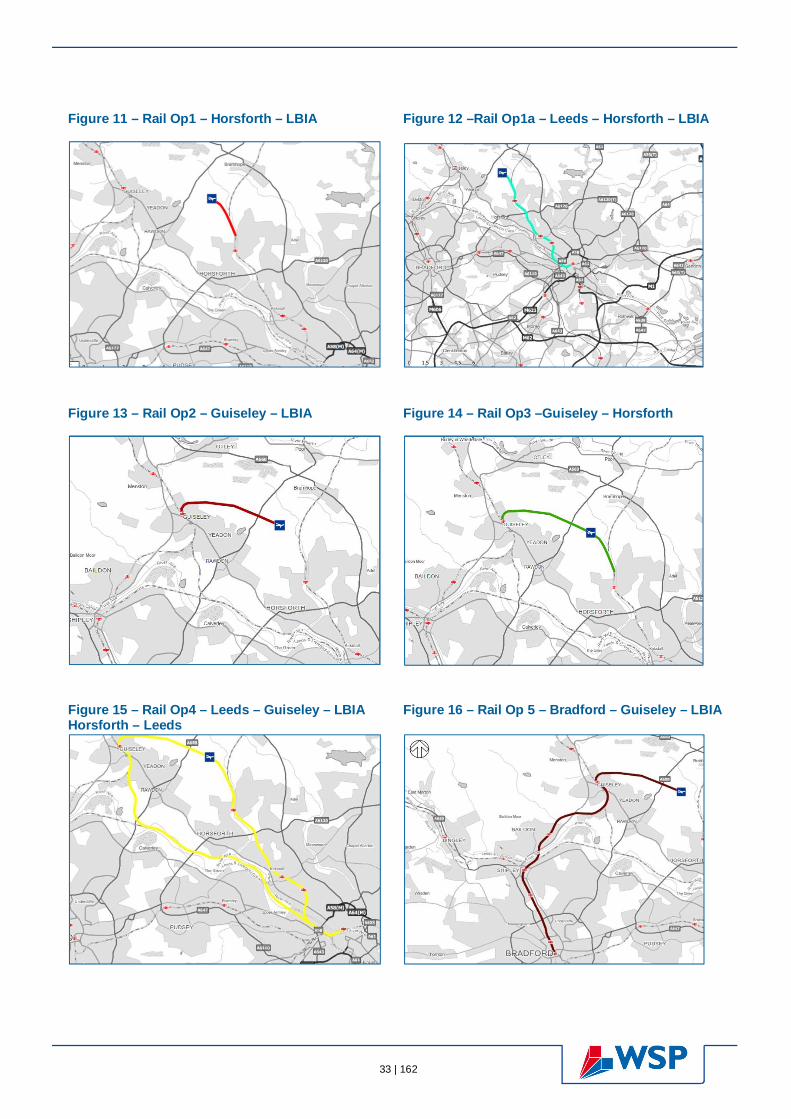
Rail Op1 - Horsforth - LBIA New branch from Leeds to Harrogate rail line, extending out from Horsforth to LBIA. Interchange required at Horsforth.
Heavy Rail Opt 1a – Leeds – Horsforth - LBIA
Through services from Leeds using the new branch from Leeds to Harrogate rail line, extending out from Horsforth to LBIA. Operates as a through service (no interchange)
Rail Op2 - Guiseley to LBIA New branch on Leeds to Ilkley rail line, extending out from Guiseley to LBIA. Interchange required at Guiseley.
Rail Op3 - Guiseley-Horsforth
Combination of Rail Op1 and Rail Op2 providing a connection between the Leeds-Ilkley line at Guiseley and the Leeds-Harrogate line at Horsforth with an intermediate stop at LBIA.
Highway Infrastructure;
Public Transport Bus;
Public Transport Rail;
Traffic Management; and
Smarter Travel.
Highway Infrastructure.
Project number: Dated: 26/11/2014 30 | 162 Revised:
Rail Op4 - Leeds-Guiseley-LBIA- Horsforth-Leeds
Combination of Rail Op1 and Rail Op2 providing a connection between the Leeds-Ilkley line at Guiseley and the Leeds-Harrogate line at Horsforth with an intermediate stop at LBIA (through service).
Rail Op5 - Brad-Guiseley-LBIA Operating services from Bradford Forster Square via the Wharfedale Line to Guiseley, with a new link constructed to LBIA (through service).
Rail Op6 - Leeds-Brad-Guis-LBIA Operating services from Bradford Forster Square and Leeds via the Wharfedale Line to Guiseley, with a new link constructed to LBIA (consolidation of options 4 and 5).
Rail Op7 - Calverley to LBIA
Operating from Leeds via the Airedale / Wharfedale Line, then construction of a new connection to LBIA. Bradford services will operate via the Airedale Line to the Leeds Outer Ring Road, then joining the alignment as described above.
LBIA Parkway Station New station on Harrogate Line close to Bramhope Tunnel (between Horsforth & Weeton) – Interchange from Leeds trains required
Highway Infrastructure
A65 to LBIA Link Road
A new single carriageway road linking to the airport with new junctions on the A65 and A658 with upgrade to the A65 to provide bus priority measures including at the A65/A6120 junction.
East Leeds Orbital Road
East Leeds Orbital Road is a new orbital highway route from the M1 Junction 46 to west of the A58. Includes a link road between Manston Lane (MLLR) and M1 Junction 46 and East Leeds Orbital Route (ELOR) from Manston Lane to the west of the A58.
A6110 ORR Improvements
A6110 highway improvements from M621 J1 to the A647 Stanningley Bypass. Includes enhanced pedestrian and cycling facilities as well as junction improvements at key intersections. Complements measures planned elsewhere on the Leeds Outer Ring Road.
Horsforth Roundabout* Introduction of new traffic signals at Horsforth Roundabout.
Rodley Roundabout*
A657/A6120 Rodley Roundabout signalisation. The scheme will include the full signalisation of the junction, the provision of controlled pedestrian/cycle crossing facilities on all four approaches.
Thornbury Barracks Roundabout*
The scheme is located on the A647 and will address the primary pinch point by signalising the junction and constructing central running lanes through the roundabout. A bi-directional priority lane, together with signal priority for buses at the junction, will also be provided. Pedestrian and cycling facilities will be implemented at the junction to improve road safety.
Harrogate Rd - New Line Jct Junction widening on each arm of the Harrogate Road/New Line crossroads with the provision of segregated left turn lanes on three arms.
South Bradford Access Road Options including Tong St - Westgate Hill St - Laisterdyke New Link and A647 Bowling Back Lane highway link.
Junction A61 - A6120 Upgrade of A61 / A6120 to traffic signal controlled junction. Originally part of the ELOR upgrade scheme.
Junction Kings Lane - A6120 Upgrade of Kings Lane / A6120 to traffic signal controlled junction. Originally part of the ELOR upgrade scheme.
Junction Kings Lane - Stonegate Upgrade of Kings Lane / Stonegate to traffic signal controlled junction. Originally part of the ELOR upgrade scheme.
Rawdon Crossroads Junction improvement to the crossroads of the A65 and B6152 in Rawdon.
31 | 162
Bradford ORR West Junctions
Improvements to 7 junctions on the Bradford Outer Ring Road Western Section: Manningham Lane / Queens Road; Whetley Lane / Tollerton Lane; Cemetery Road / Thornton Road; Cemetery Road / Legrams Lane; Horton Grange Road / Legrams Lane; Great Horton Road / Cross Lane; and Great Horton Road / Horton Grange Road.
A660 / A658 (Poole Bank)
Improvements to the junction and surrounding link roads to improve safety, journey time reliability and ease congestion. Junction located to the north of the airport and provides a strategic link to LBIA, improving connectivity.
A65 / A658 Roundabout Capacity and alignment improvements to the A65 / A658 roundabout junction at Rawdon.
Traffic Management
Improved signage and UTMC measures to improve routing
Improve signage to the airport from strategic highways routes to the LBIA and implementation of improved UTMC systems to ensure improved information provision, traffic flow, safety and minimise congestion.
Smarter Travel Improved travel planning, information and ticketing issues
Improvements in travel planning to LBIA, associated information provision and consideration of public transport ticketing options.
*Schemes are committed and have received funding. Therefore these will not be taken forward for further appraisal and assessment.
Project number: Dated: 26/11/2014 32 | 162 Revised:
Figure 10 – Highways and Public Transport Schemes
South Bradford Access Road
33 | 162
Figure 11 – Rail Op1 – Horsforth – LBIA Figure 12 –Rail Op1a – Leeds – Horsforth – LBIA
Figure 13 – Rail Op2 – Guiseley – LBIA Figure 14 – Rail Op3 –Guiseley – Horsforth
Figure 15 – Rail Op4 – Leeds – Guiseley – LBIA Figure 16 – Rail Op 5 – Bradford – Guiseley – LBIA Horsforth – Leeds
Project number: Dated: 26/11/2014 34 | 162 Revised:
Figure 17 – Rail Op6 – Leeds – Brad – Guis – LBIA Figure 18 – Rail Op7 – Calverly – LBIA
Figure 19 – Leeds to LBIA Tram-Train Link Figure 20 – Brad to LBIA Tram-Train Link
Figure 21 – Calverley to LBIA Tram-Train Link

35 | 162
Appraisal Methodology 6.2
6.2.1EAST Tool To aid with the initial sifting process, each identified scheme has been recorded using the Department for Transport’s Early Assessment and Sifting Tool (EAST). EAST is a decision support tool that has been developed to summarise and present evidence on options in a clear and consistent format. It provides relevant, high level, information to enable decision makers to form an early view of how options perform.
EAST is a suitable tool to use as it can be applied without having to obtain detailed evidence. Many of the schemes listed above are at a very early or concept stage. It is also suitable for assessing and comparing all types of transport-related intervention across all modes and places. It can be used to assess individual options, packages, strategies and plans.
EAST Scheme Appraisal forms are provided in Appendix B for each of the schemes featured on the initial long-list of options.

Project number: Dated: 26/11/2014 36 | 162 Revised:
Appraisal and Sifting Process 7
Introduction 7.1The long list of schemes detailed in Table 3 was collated through consultation with representatives from the Stakeholder Reference Group. Information about the individual schemes was recorded in EAST (Early Assessment and Sifting Tool) appraisal forms which allow summary information to be presented about schemes in a clear and consistent format. However, EAST is not designed to make recommendations and Transport Analysis Guidance (TAG) recommends that specific criteria or thresholds are set to determine which options pass or fail the sifting process and ensure that this is clearly explained in reporting.
Following this recommendation, the Project Study Team developed a project focused LBIA Appraisal Framework which assesses each of the long-list schemes against a range of criteria, with greater weightings applied to those that address the two main objectives of the study. Table 4 below summarises the linkages between the core assessment areas of both tools. This section explains the development of the LBIA Appraisal Framework and its integral role to the sifting of the long-list of options.
Table 4 - Comparative Assessment Areas: EAST Tool and Appraisal Framework
EAST Criteria Comparative Appraisal Framework Criteria Economic Growth Economy and Growth Accessibility & Wellbeing Accessibility and Wellbeing Carbon Emissions Environmental Managerial
Scheme Acceptability & Funding Risks Financial Commercial
LBIA Appraisal Framework 7.2As discussed above, the LBIA Appraisal Framework consists of four key assessment areas, each with several related sub-criteria against which each of the identified schemes were assessed.
Details of the sub categories / criteria and justification for their inclusion in the assessment are provided in Table 5.
Table 5 – Scheme Scoring Categories
Group Headings Sub Category Reason for Category
Economy and Growth
A) Connecting People to LBIA (providing greater coverage of the population to LBIA)
Indicator of connectivity of the Airport, specifically whether an intervention pro-vides access to a larger catchment area.
B) Support Future Housing
Indicator of those schemes which support growth in housing, providing additional benefit of the scheme.
C) Creation of New Jobs
Indicator of those schemes which support growth in employment, providing an addi-tional benefit of the scheme.

37 | 162
D) Journey Time Improvements and Reliability Indicator of improved connectivity of the Airport relating to reduced journey times for existing travellers.
Environmental
E) Carbon Reduction Indicator of whether intervention is likely to reduce carbon emissions over the long term.
F) Air Quality and Noise Indicator of whether intervention will im-prove air quality and noise for the affected area.
G) Impact on areas of Environmental Significance Indicator of whether intervention will im-pact on areas of environmental signifi-cance.
Accessibility & Well Being
H) Accessibility for LBIA Staff to LBIA Indicator of impact of accessibility for LBIA Staff to LBIA.
I) Active Travel Indicator of likely improvements to active travel such as walking and cycling through provision of intervention.
J) Severance Indicator of impact of intervention on sev-erance of the affected area.
K) Road Safety Indicator of the likely impact on collisions on the Transport Network.
Scheme Acceptability and Funding Risks
L) Timescales / Stage of Scheme Development and Practicality
Indicator of the risks to delivery of the in-tervention and / or the likely timeline of delivery of the scheme.
M) Acceptability Indicator of public acceptability of the scheme.
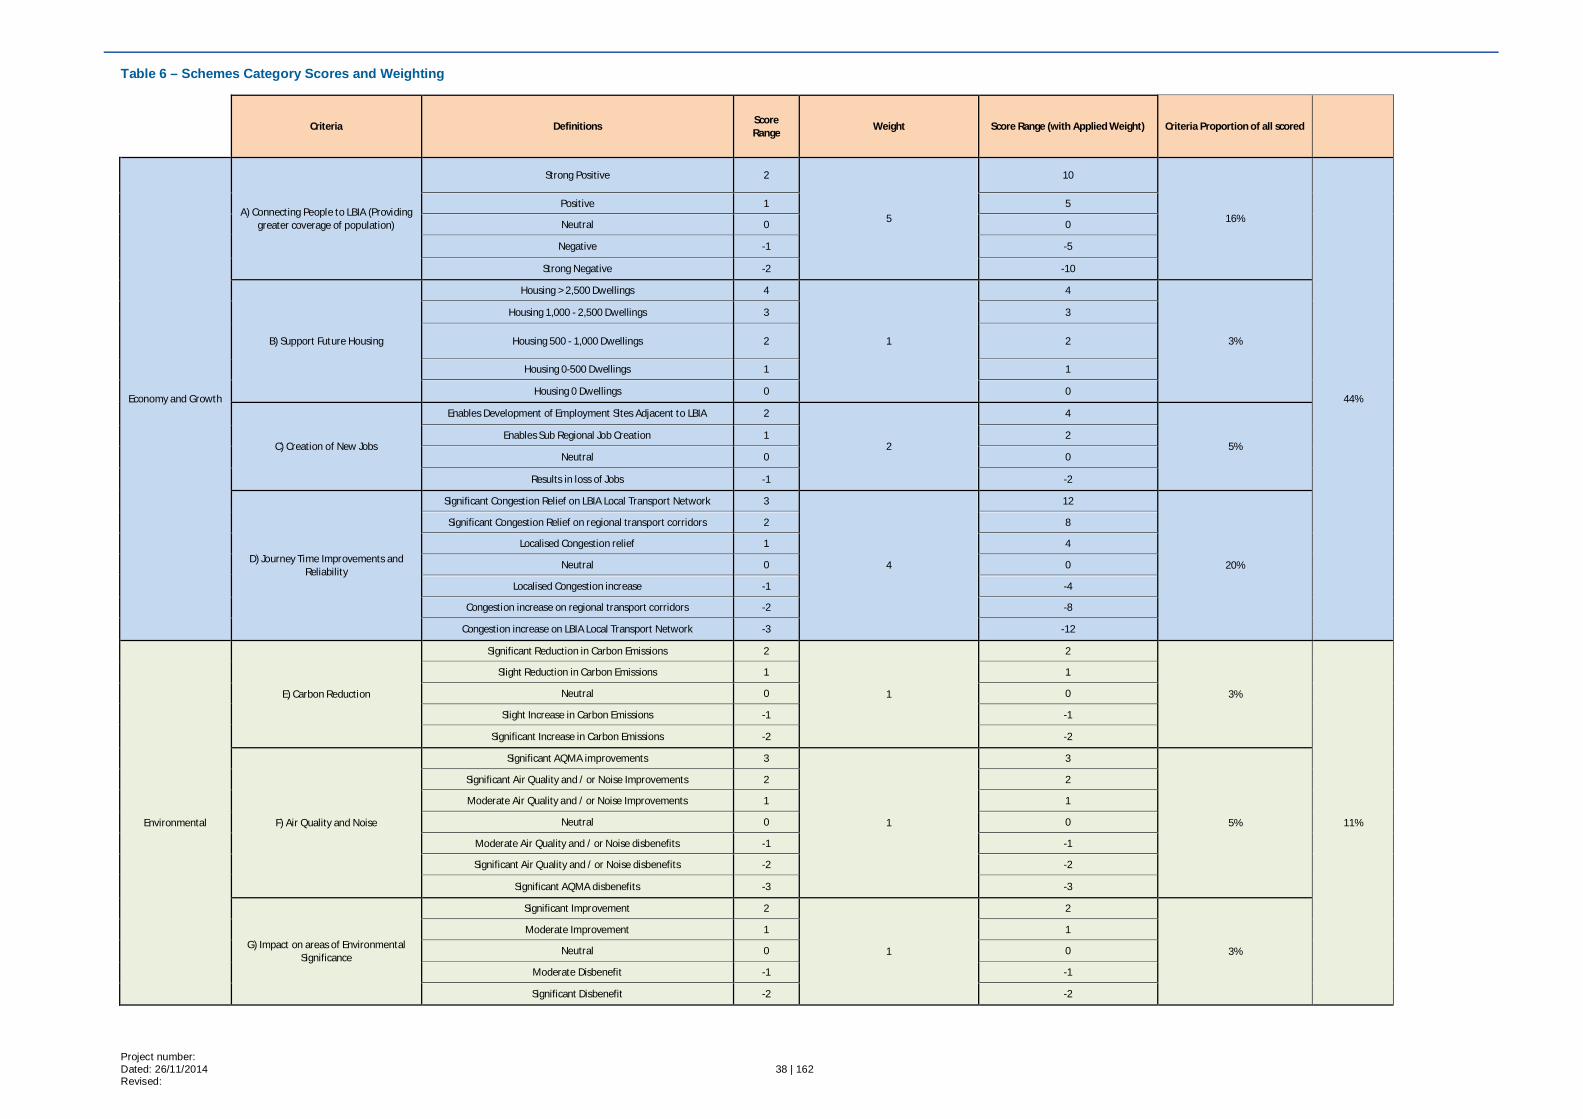
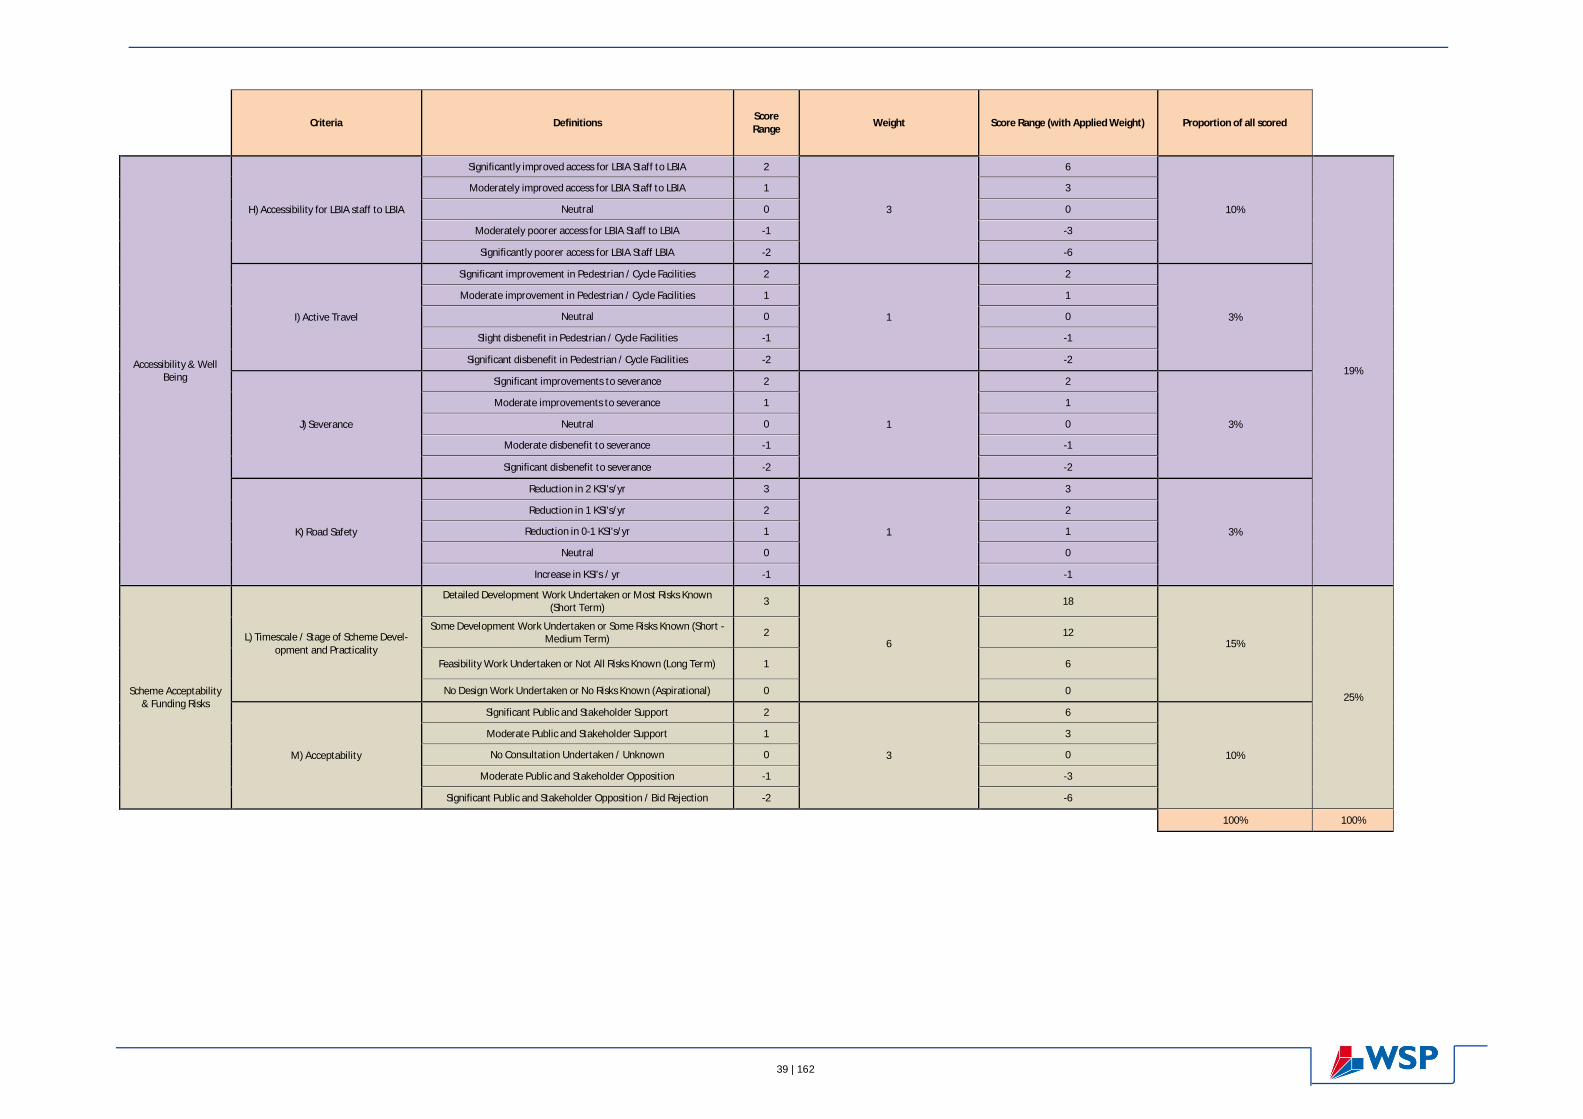
Each identified scheme option was then scored against the definitions set out in Table 6. Weightings were applied to each of the criteria and definitions to reflect the objectives of the study, which are to:
The appraisal categories have been weighted such that indices relating to improving connectivity to the LBIA catchment area and measures to support the growth aspirations of the airport are provided a greater weight in the assessment (categories A, C, D and H). We have also weighted categories L and M as these elements are important to identifying schemes that can be delivered successfully.
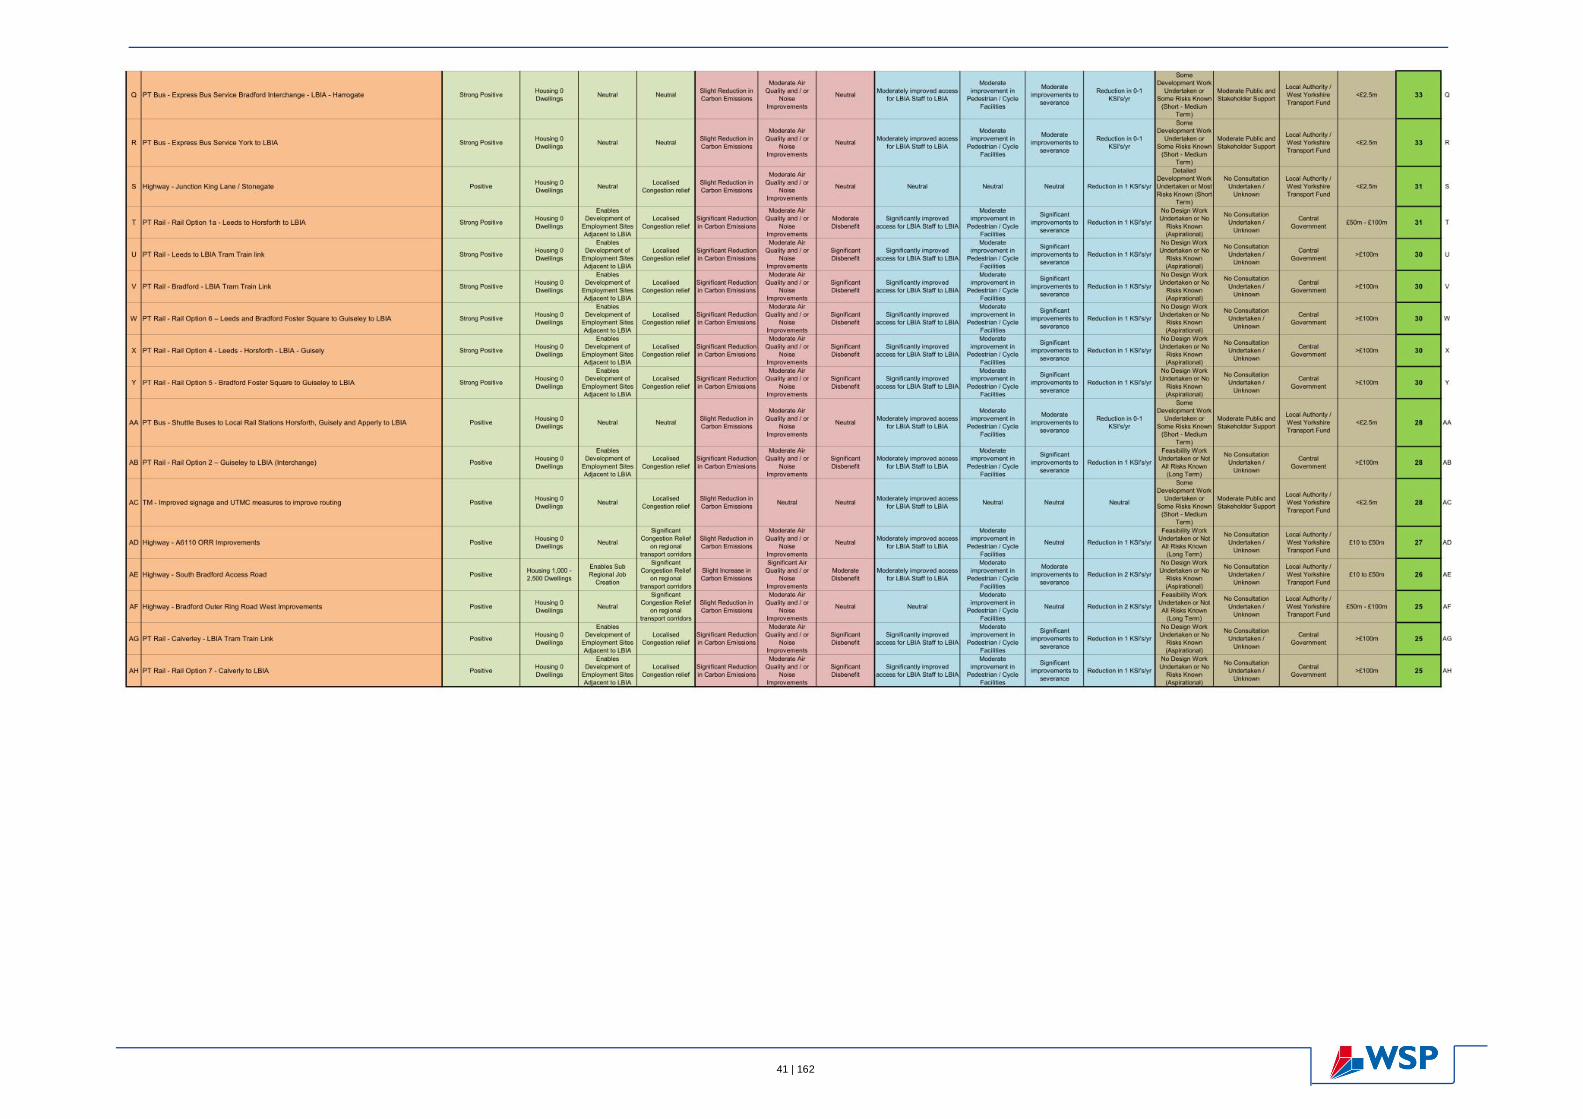
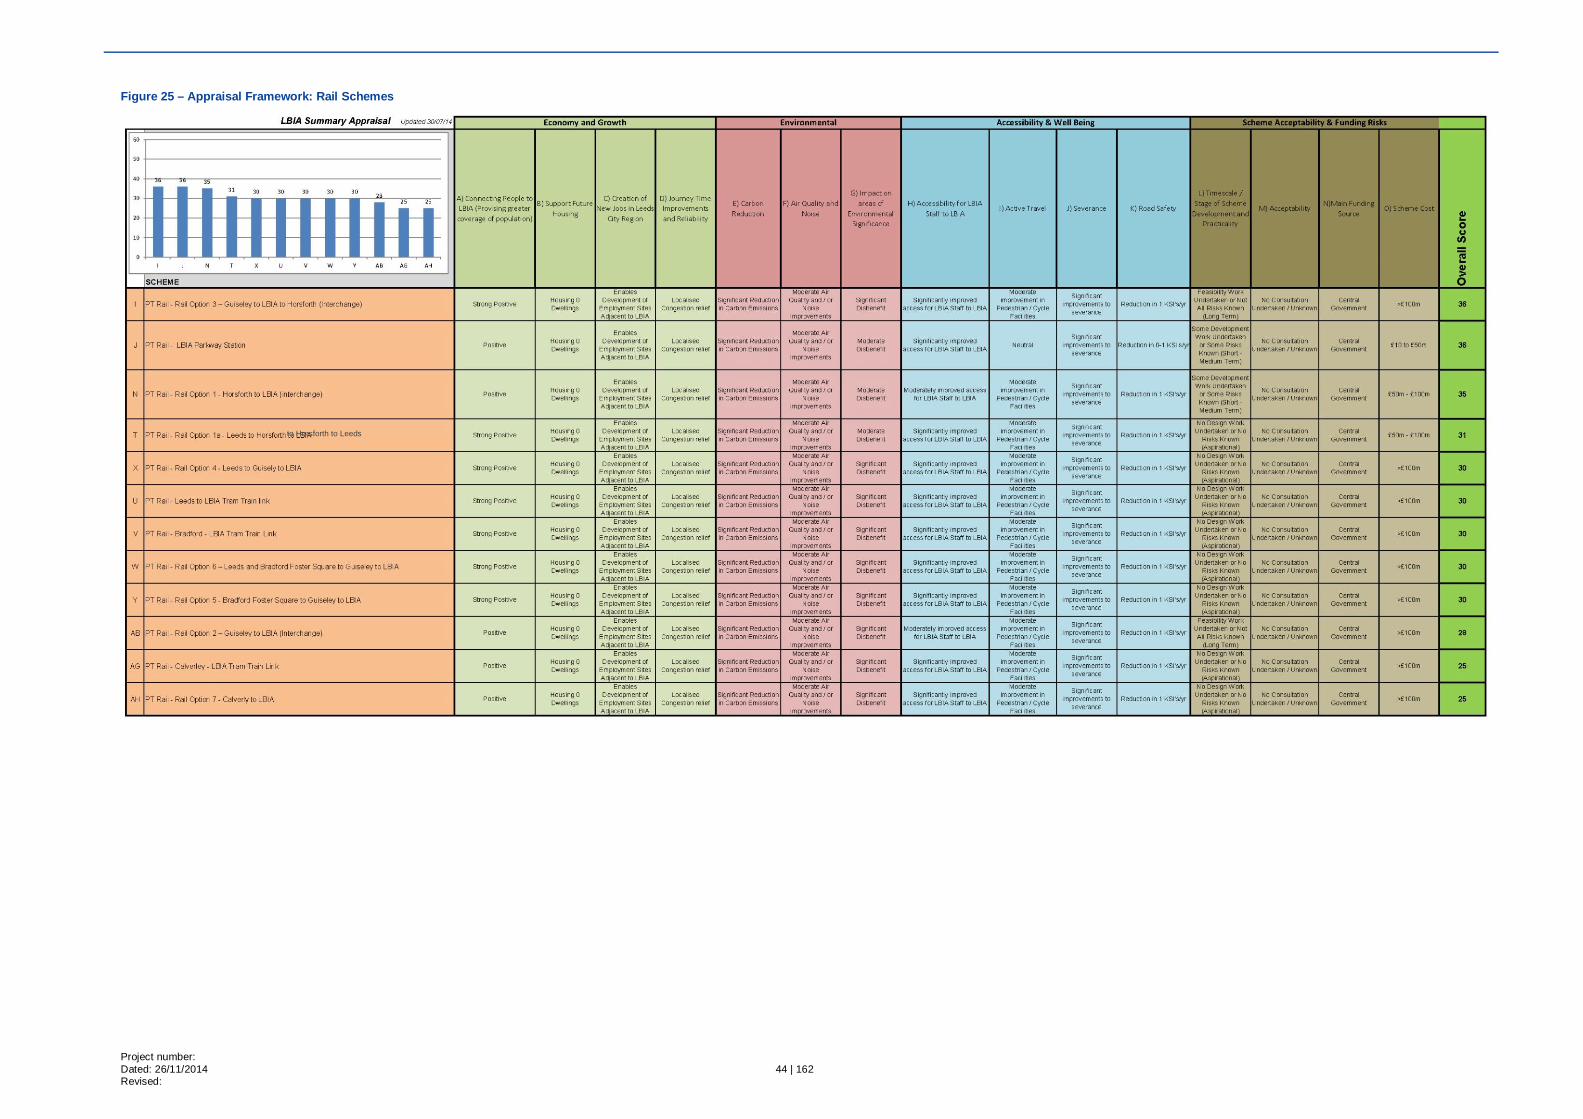
Once schemes are assessed against the four core categories and the thirteen associated sub-categories they are ranked based on total score. This overall ranking enables us to easily filter out schemes that perform poorly against the objectives and prioritise the inclusion of those more closely aligned to the preferred objectives and criteria. The full assessment is displayed in Figure 22, with assessments split by mode in Figure 23 to Figure 32.
1. Identify and appraise measures to improve the existing connectivity between LBIA and its catchment area; and
2. Understand the constraints to the future growth of LBIA and identify and appraise surface access measures (including road and public transport) required to facilitate this future growth.
Project number: Dated: 26/11/2014 38 | 162 Revised:
Table 6 – Schemes Category Scores and Weighting
Criteria Definitions Score Range Weight Score Range (with Applied Weight) Criteria Proportion of all scored
Economy and Growth
A) Connecting People to LBIA (Providing greater coverage of population)
Strong Positive 2
5
10
16%
44%
Positive 1 5
Neutral 0 0
Negative -1 -5
Strong Negative -2 -10
B) Support Future Housing
Housing > 2,500 Dwellings 4
1
4
3%
Housing 1,000 - 2,500 Dwellings 3 3
Housing 500 - 1,000 Dwellings 2 2
Housing 0-500 Dwellings 1 1
Housing 0 Dwellings 0 0
C) Creation of New Jobs
Enables Development of Employment Sites Adjacent to LBIA 2
2
4
5% Enables Sub Regional Job Creation 1 2
Neutral 0 0
Results in loss of Jobs -1 -2
D) Journey Time Improvements and Reliability
Significant Congestion Relief on LBIA Local Transport Network 3
4
12
20%
Significant Congestion Relief on regional transport corridors 2 8
Localised Congestion relief 1 4
Neutral 0 0
Localised Congestion increase -1 -4
Congestion increase on regional transport corridors -2 -8
Congestion increase on LBIA Local Transport Network -3 -12
Environmental
E) Carbon Reduction
Significant Reduction in Carbon Emissions 2
1
2
3%
11%
Slight Reduction in Carbon Emissions 1 1
Neutral 0 0
Slight Increase in Carbon Emissions -1 -1
Significant Increase in Carbon Emissions -2 -2
F) Air Quality and Noise
Significant AQMA improvements 3
1
3
5%
Significant Air Quality and / or Noise Improvements 2 2
Moderate Air Quality and / or Noise Improvements 1 1
Neutral 0 0
Moderate Air Quality and / or Noise disbenefits -1 -1
Significant Air Quality and / or Noise disbenefits -2 -2
Significant AQMA disbenefits -3 -3
G) Impact on areas of Environmental Significance
Significant Improvement 2
1
2
3%
Moderate Improvement 1 1
Neutral 0 0
Moderate Disbenefit -1 -1
Significant Disbenefit -2 -2
39 | 162
Criteria Definitions Score Range Weight Score Range (with Applied Weight) Proportion of all scored
Accessibility & Well Being
H) Accessibility for LBIA staff to LBIA
Significantly improved access for LBIA Staff to LBIA 2
3
6
10%
19%
Moderately improved access for LBIA Staff to LBIA 1 3
Neutral 0 0
Moderately poorer access for LBIA Staff to LBIA -1 -3
Significantly poorer access for LBIA Staff LBIA -2 -6
I) Active Travel
Significant improvement in Pedestrian / Cycle Facilities 2
1
2
3%
Moderate improvement in Pedestrian / Cycle Facilities 1 1
Neutral 0 0
Slight disbenefit in Pedestrian / Cycle Facilities -1 -1
Significant disbenefit in Pedestrian / Cycle Facilities -2 -2
J) Severance
Significant improvements to severance 2
1
2
3%
Moderate improvements to severance 1 1
Neutral 0 0
Moderate disbenefit to severance -1 -1
Significant disbenefit to severance -2 -2
K) Road Safety
Reduction in 2 KSI's/yr 3
1
3
3%
Reduction in 1 KSI's/yr 2 2
Reduction in 0-1 KSI's/yr 1 1
Neutral 0 0
Increase in KSI's / yr -1 -1
Scheme Acceptability & Funding Risks
L) Timescale / Stage of Scheme Devel-opment and Practicality
Detailed Development Work Undertaken or Most Risks Known (Short Term) 3
6
18
15%
25%
Some Development Work Undertaken or Some Risks Known (Short - Medium Term) 2 12
Feasibility Work Undertaken or Not All Risks Known (Long Term) 1 6
No Design Work Undertaken or No Risks Known (Aspirational) 0 0
M) Acceptability
Significant Public and Stakeholder Support 2
3
6
10%
Moderate Public and Stakeholder Support 1 3
No Consultation Undertaken / Unknown 0 0
Moderate Public and Stakeholder Opposition -1 -3
Significant Public and Stakeholder Opposition / Bid Rejection -2 -6
100% 100%

Project number: Dated: 26/11/2014 40 | 162 Revised:
Figure 22 – Appraisal Framework
41 | 162
Project number: Dated: 26/11/2014 42 | 162 Revised:
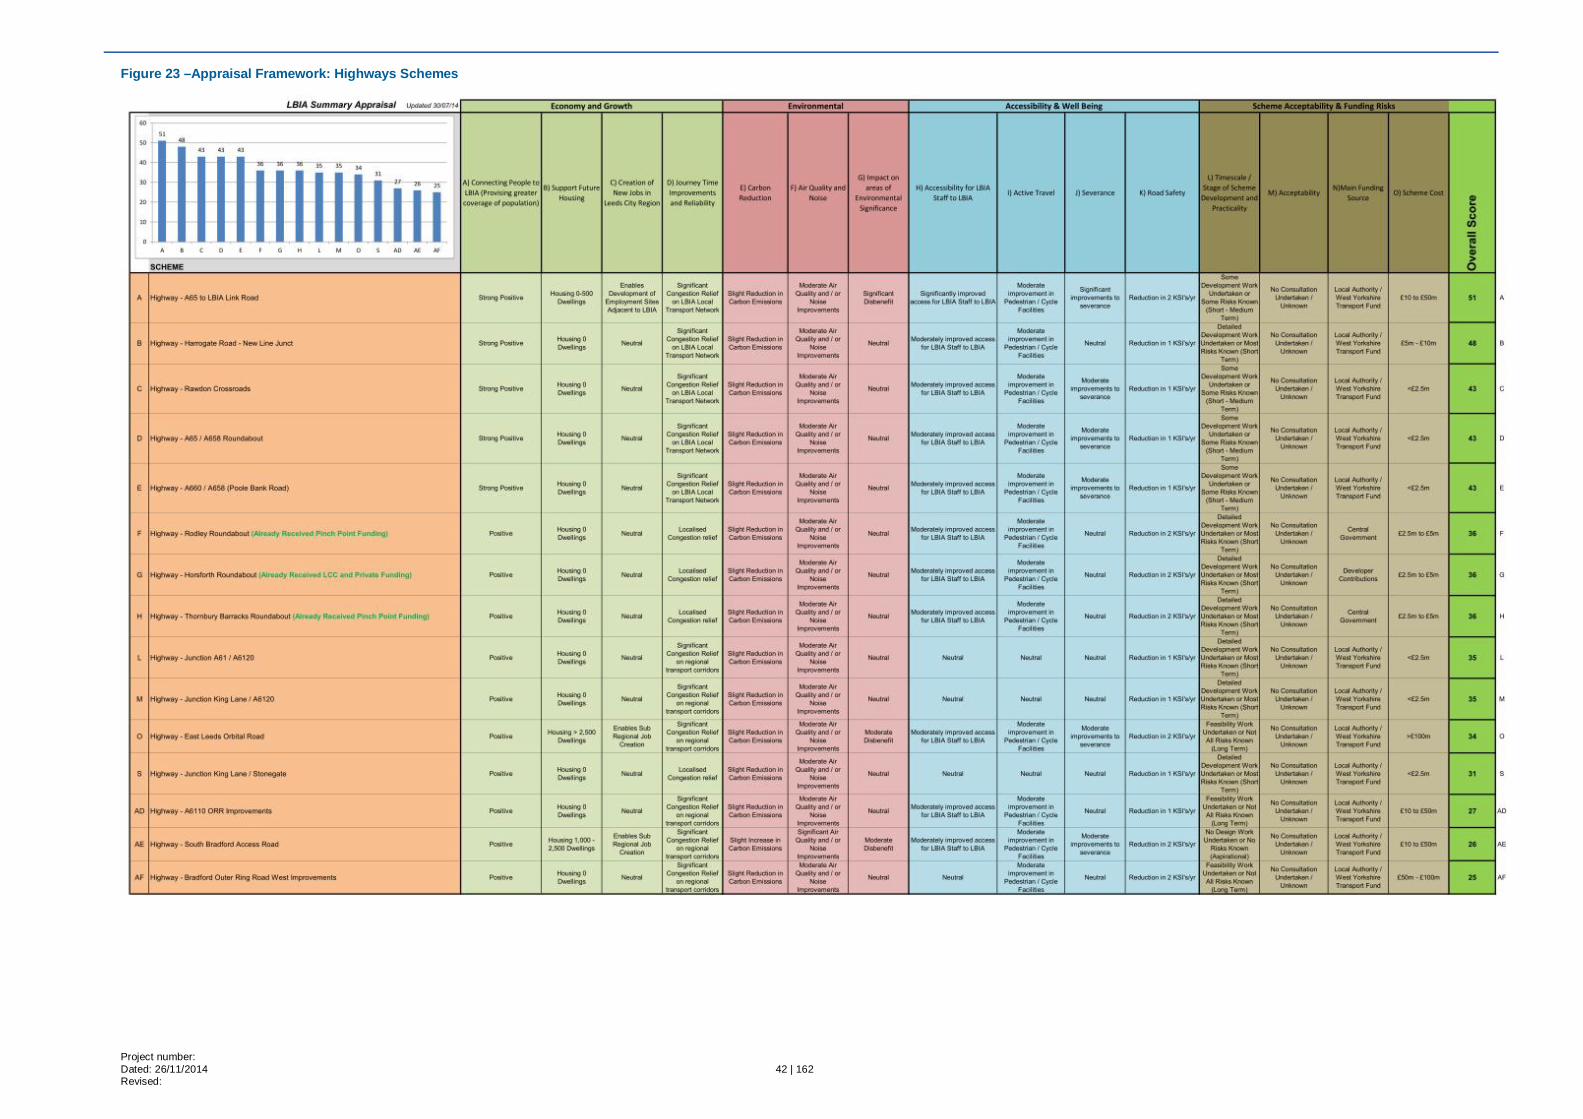
Figure 23 –Appraisal Framework: Highways Schemes
43 | 162
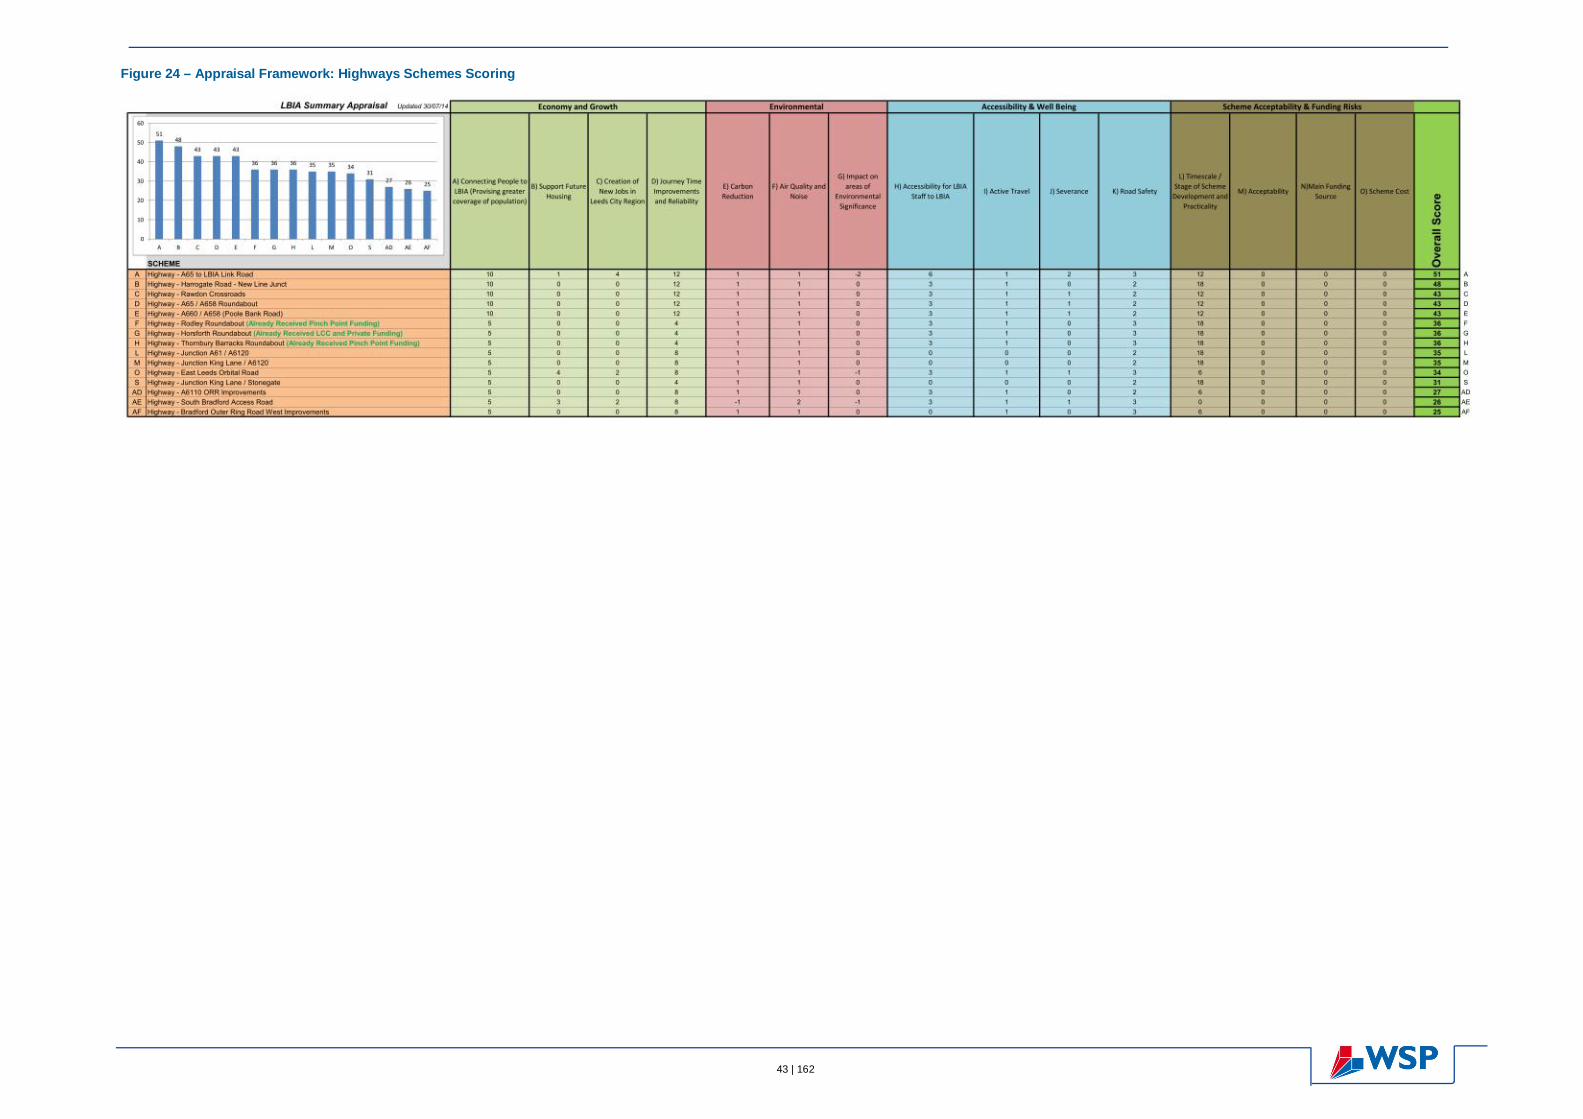
Figure 24 – Appraisal Framework: Highways Schemes Scoring
Project number: Dated: 26/11/2014 44 | 162 Revised:
Figure 25 – Appraisal Framework: Rail Schemes
to Horsforth to Leeds
45 | 162
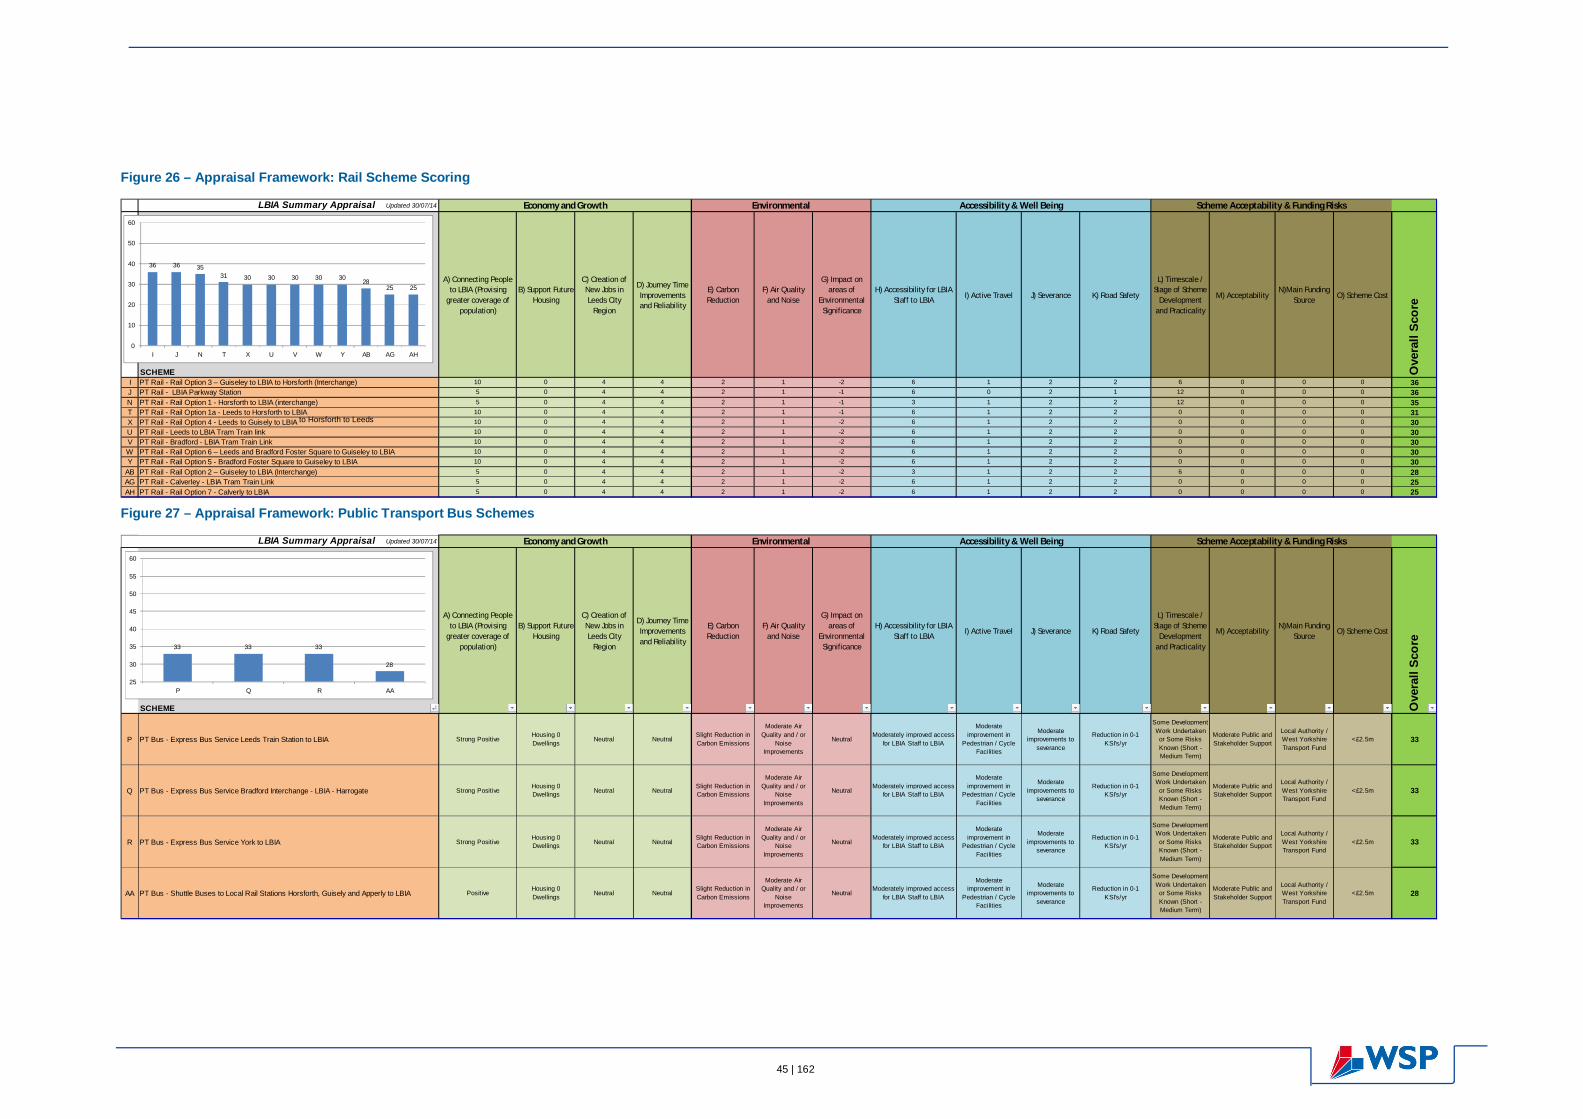
Figure 26 – Appraisal Framework: Rail Scheme Scoring
Figure 27 – Appraisal Framework: Public Transport Bus Schemes
LBIA Summary Appraisal Updated 30/07/14
SCHEME
A) Connecting People to LBIA (Provising
greater coverage of population)
B) Support Future Housing
C) Creation of New Jobs in Leeds City
Region
D) Journey Time Improvements and Reliability
E) Carbon Reduction
F) Air Quality and Noise
G) Impact on areas of
Environmental Significance
H) Accessibility for LBIA Staff to LBIA I) Active Travel J) Severance K) Road Safety
L) Timescale / Stage of Scheme
Development and Practicality
M) AcceptabilityN)Main Funding
Source O) Scheme Cost
Ove
rall
Scor
e
I PT Rail - Rail Option 3 – Guiseley to LBIA to Horsforth (Interchange) 10 0 4 4 2 1 -2 6 1 2 2 6 0 0 0 36J PT Rail - LBIA Parkway Station 5 0 4 4 2 1 -1 6 0 2 1 12 0 0 0 36N PT Rail - Rail Option 1 - Horsforth to LBIA (interchange) 5 0 4 4 2 1 -1 3 1 2 2 12 0 0 0 35T PT Rail - Rail Option 1a - Leeds to Horsforth to LBIA 10 0 4 4 2 1 -1 6 1 2 2 0 0 0 0 31X PT Rail - Rail Option 4 - Leeds to Guisely to LBIA 10 0 4 4 2 1 -2 6 1 2 2 0 0 0 0 30U PT Rail - Leeds to LBIA Tram Train link 10 0 4 4 2 1 -2 6 1 2 2 0 0 0 0 30V PT Rail - Bradford - LBIA Tram Train Link 10 0 4 4 2 1 -2 6 1 2 2 0 0 0 0 30W PT Rail - Rail Option 6 – Leeds and Bradford Foster Square to Guiseley to LBIA 10 0 4 4 2 1 -2 6 1 2 2 0 0 0 0 30Y PT Rail - Rail Option 5 - Bradford Foster Square to Guiseley to LBIA 10 0 4 4 2 1 -2 6 1 2 2 0 0 0 0 30
AB PT Rail - Rail Option 2 – Guiseley to LBIA (Interchange) 5 0 4 4 2 1 -2 3 1 2 2 6 0 0 0 28AG PT Rail - Calverley - LBIA Tram Train Link 5 0 4 4 2 1 -2 6 1 2 2 0 0 0 0 25AH PT Rail - Rail Option 7 - Calverly to LBIA 5 0 4 4 2 1 -2 6 1 2 2 0 0 0 0 25
Economy and Growth Environmental Accessibility & Well Being Scheme Acceptability & Funding Risks
36 36 3531 30 30 30 30 30
2825 25
0
10
20
30
40
50
60
I J N T X U V W Y AB AG AH
LBIA Summary Appraisal Updated 30/07/14
SCHEME
A) Connecting People to LBIA (Provising
greater coverage of population)
B) Support Future Housing
C) Creation of New Jobs in Leeds City
Region
D) Journey Time Improvements and Reliability
E) Carbon Reduction
F) Air Quality and Noise
G) Impact on areas of
Environmental Significance
H) Accessibility for LBIA Staff to LBIA
I) Active Travel J) Severance K) Road Safety
L) Timescale / Stage of Scheme
Development and Practicality
M) AcceptabilityN)Main Funding
SourceO) Scheme Cost
Ove
rall
Scor
e
P PT Bus - Express Bus Service Leeds Train Station to LBIA Strong PositiveHousing 0 Dwellings Neutral Neutral
Slight Reduction in Carbon Emissions
Moderate Air Quality and / or
Noise Improvements
NeutralModerately improved access
for LBIA Staff to LBIA
Moderate improvement in
Pedestrian / Cycle Facilities
Moderate improvements to
severance
Reduction in 0-1 KSI's/yr
Some Development Work Undertaken or Some Risks Known (Short - Medium Term)
Moderate Public and Stakeholder Support
Local Authority / West Yorkshire Transport Fund
<£2.5m 33
Q PT Bus - Express Bus Service Bradford Interchange - LBIA - Harrogate Strong PositiveHousing 0 Dwellings Neutral Neutral
Slight Reduction in Carbon Emissions
Moderate Air Quality and / or
Noise Improvements
NeutralModerately improved access
for LBIA Staff to LBIA
Moderate improvement in
Pedestrian / Cycle Facilities
Moderate improvements to
severance
Reduction in 0-1 KSI's/yr
Some Development Work Undertaken or Some Risks Known (Short - Medium Term)
Moderate Public and Stakeholder Support
Local Authority / West Yorkshire Transport Fund
<£2.5m 33
R PT Bus - Express Bus Service York to LBIA Strong PositiveHousing 0 Dwellings Neutral Neutral
Slight Reduction in Carbon Emissions
Moderate Air Quality and / or
Noise Improvements
NeutralModerately improved access
for LBIA Staff to LBIA
Moderate improvement in
Pedestrian / Cycle Facilities
Moderate improvements to
severance
Reduction in 0-1 KSI's/yr
Some Development Work Undertaken or Some Risks Known (Short - Medium Term)
Moderate Public and Stakeholder Support
Local Authority / West Yorkshire Transport Fund
<£2.5m 33
AA PT Bus - Shuttle Buses to Local Rail Stations Horsforth, Guisely and Apperly to LBIA PositiveHousing 0 Dwellings Neutral Neutral
Slight Reduction in Carbon Emissions
Moderate Air Quality and / or
Noise Improvements
NeutralModerately improved access
for LBIA Staff to LBIA
Moderate improvement in
Pedestrian / Cycle Facilities
Moderate improvements to
severance
Reduction in 0-1 KSI's/yr
Some Development Work Undertaken or Some Risks Known (Short - Medium Term)
Moderate Public and Stakeholder Support
Local Authority / West Yorkshire Transport Fund
<£2.5m 28
Economy and Growth Environmental Accessibility & Well Being Scheme Acceptability & Funding Risks
33 33 33
28
25
30
35
40
45
50
55
60
P Q R AA
to Horsforth to Leeds
Project number: Dated: 26/11/2014 46 | 162 Revised:
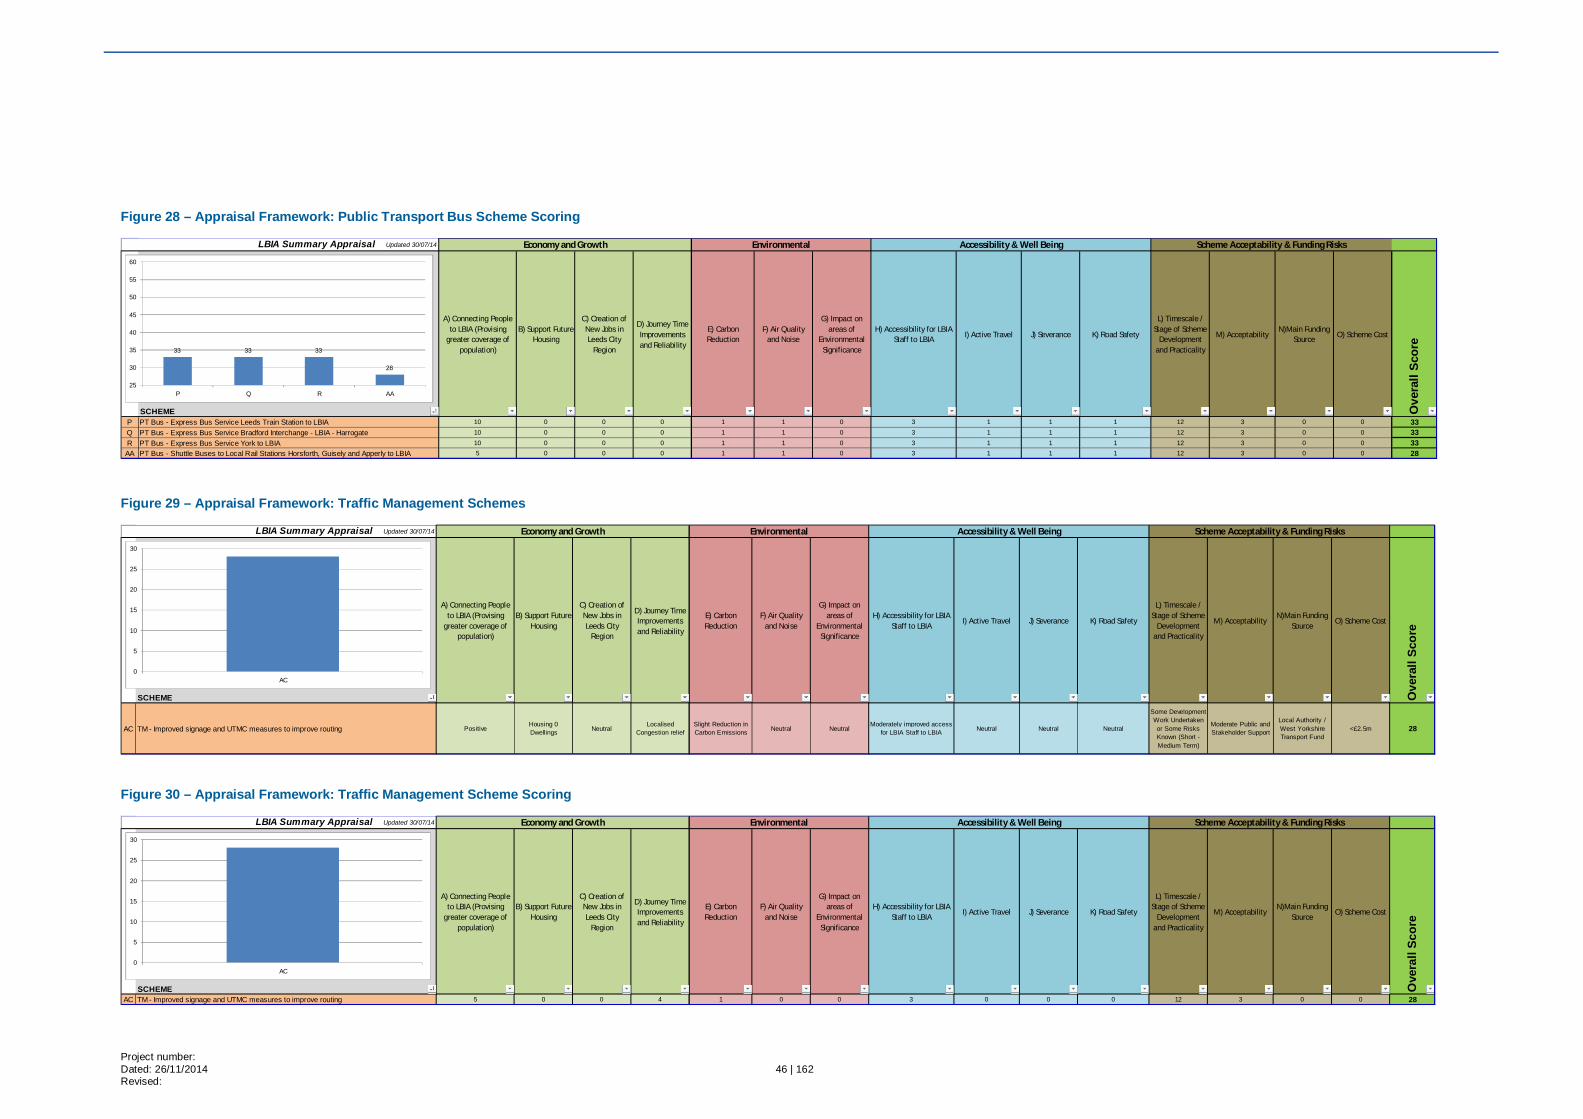
Figure 28 – Appraisal Framework: Public Transport Bus Scheme Scoring
Figure 29 – Appraisal Framework: Traffic Management Schemes
Figure 30 – Appraisal Framework: Traffic Management Scheme Scoring
LBIA Summary Appraisal Updated 30/07/14
SCHEME
A) Connecting People to LBIA (Provising
greater coverage of population)
B) Support Future Housing
C) Creation of New Jobs in Leeds City
Region
D) Journey Time Improvements and Reliability
E) Carbon Reduction
F) Air Quality and Noise
G) Impact on areas of
Environmental Significance
H) Accessibility for LBIA Staff to LBIA I) Active Travel J) Severance K) Road Safety
L) Timescale / Stage of Scheme
Development and Practicality
M) AcceptabilityN)Main Funding
Source O) Scheme Cost
Ove
rall
Scor
e
P PT Bus - Express Bus Service Leeds Train Station to LBIA 10 0 0 0 1 1 0 3 1 1 1 12 3 0 0 33Q PT Bus - Express Bus Service Bradford Interchange - LBIA - Harrogate 10 0 0 0 1 1 0 3 1 1 1 12 3 0 0 33R PT Bus - Express Bus Service York to LBIA 10 0 0 0 1 1 0 3 1 1 1 12 3 0 0 33AA PT Bus - Shuttle Buses to Local Rail Stations Horsforth, Guisely and Apperly to LBIA 5 0 0 0 1 1 0 3 1 1 1 12 3 0 0 28
Economy and Growth Environmental Accessibility & Well Being Scheme Acceptability & Funding Risks
33 33 33
28
25
30
35
40
45
50
55
60
P Q R AA
LBIA Summary Appraisal Updated 30/07/14
SCHEME
A) Connecting People to LBIA (Provising
greater coverage of population)
B) Support Future Housing
C) Creation of New Jobs in Leeds City
Region
D) Journey Time Improvements and Reliability
E) Carbon Reduction
F) Air Quality and Noise
G) Impact on areas of
Environmental Significance
H) Accessibility for LBIA Staff to LBIA
I) Active Travel J) Severance K) Road Safety
L) Timescale / Stage of Scheme
Development and Practicality
M) AcceptabilityN)Main Funding
SourceO) Scheme Cost
Ove
rall
Scor
e
AC TM - Improved signage and UTMC measures to improve routing PositiveHousing 0 Dwellings Neutral
Localised Congestion relief
Slight Reduction in Carbon Emissions Neutral Neutral
Moderately improved access for LBIA Staff to LBIA Neutral Neutral Neutral
Some Development Work Undertaken or Some Risks Known (Short - Medium Term)
Moderate Public and Stakeholder Support
Local Authority / West Yorkshire Transport Fund
<£2.5m 28
Economy and Growth Environmental Accessibility & Well Being Scheme Acceptability & Funding Risks
0
5
10
15
20
25
30
AC
LBIA Summary Appraisal Updated 30/07/14
SCHEME
A) Connecting People to LBIA (Provising
greater coverage of population)
B) Support Future Housing
C) Creation of New Jobs in Leeds City
Region
D) Journey Time Improvements and Reliability
E) Carbon Reduction
F) Air Quality and Noise
G) Impact on areas of
Environmental Significance
H) Accessibility for LBIA Staff to LBIA
I) Active Travel J) Severance K) Road Safety
L) Timescale / Stage of Scheme
Development and Practicality
M) AcceptabilityN)Main Funding
SourceO) Scheme Cost
Ove
rall
Scor
e
AC TM - Improved signage and UTMC measures to improve routing 5 0 0 4 1 0 0 3 0 0 0 12 3 0 0 28
Economy and Growth Environmental Accessibility & Well Being Scheme Acceptability & Funding Risks
0
5
10
15
20
25
30
AC
47 | 162
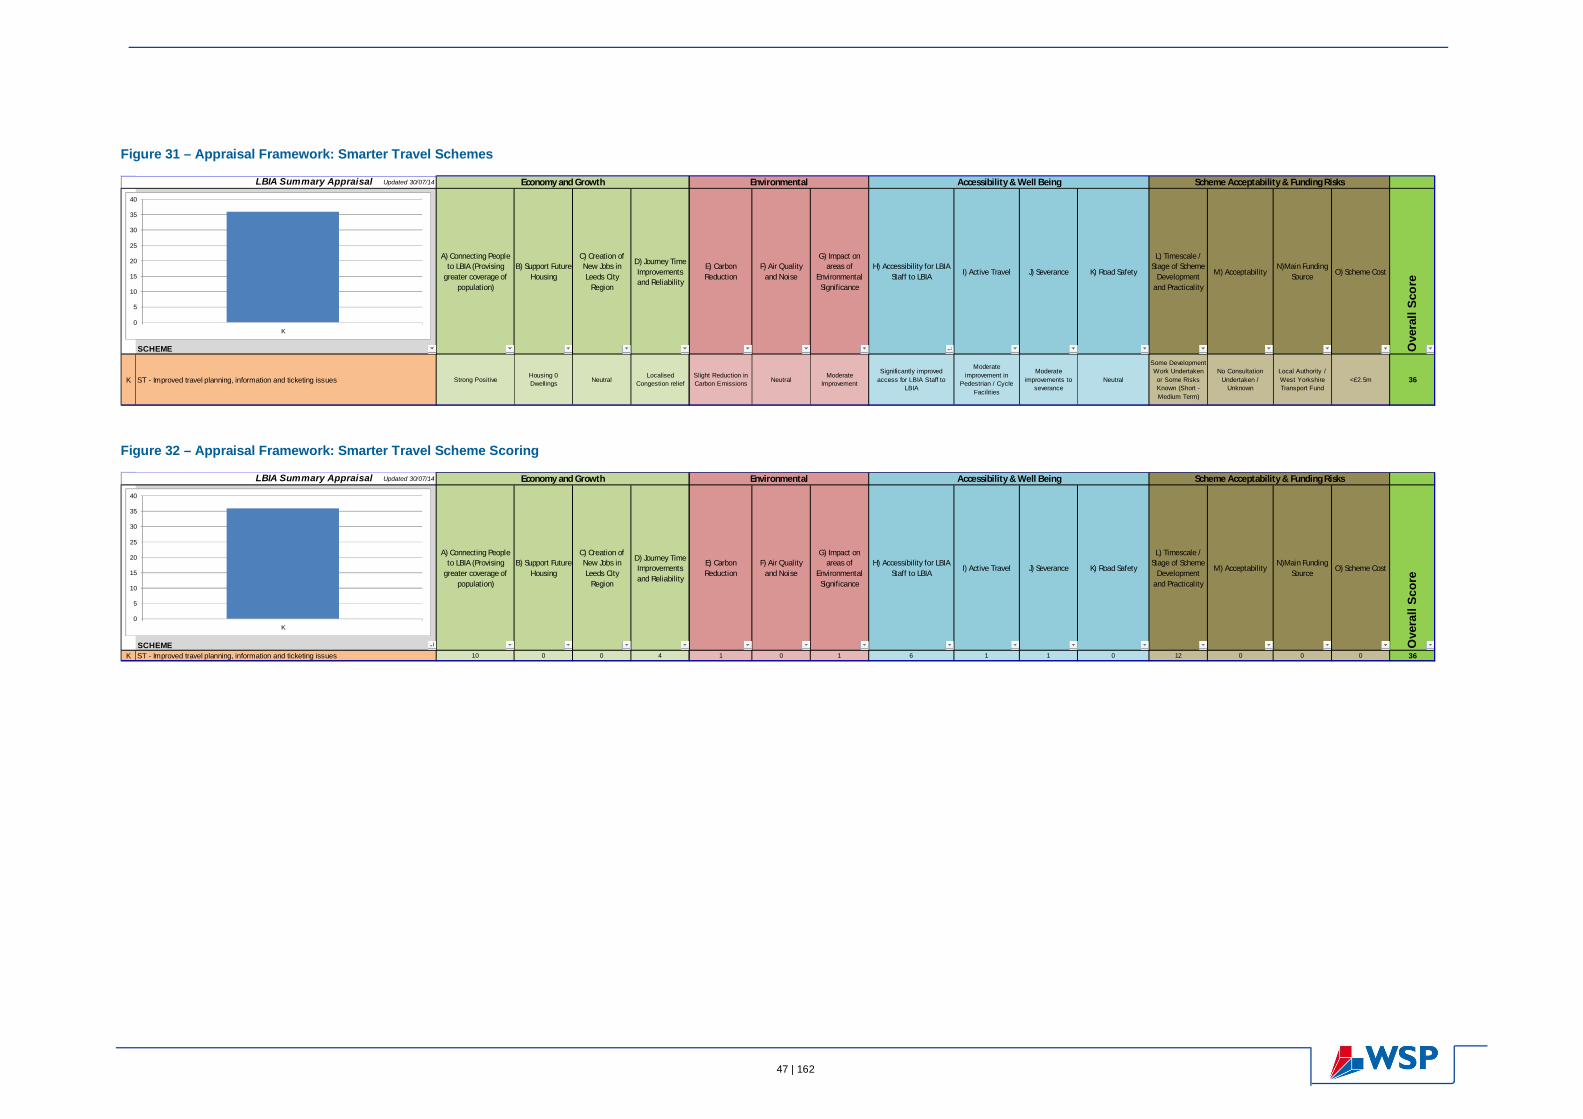
Figure 31 – Appraisal Framework: Smarter Travel Schemes
Figure 32 – Appraisal Framework: Smarter Travel Scheme Scoring
LBIA Summary Appraisal Updated 30/07/14
SCHEME
A) Connecting People to LBIA (Provising
greater coverage of population)
B) Support Future Housing
C) Creation of New Jobs in Leeds City
Region
D) Journey Time Improvements and Reliability
E) Carbon Reduction
F) Air Quality and Noise
G) Impact on areas of
Environmental Significance
H) Accessibility for LBIA Staff to LBIA I) Active Travel J) Severance K) Road Safety
L) Timescale / Stage of Scheme
Development and Practicality
M) AcceptabilityN)Main Funding
Source O) Scheme Cost
Ove
rall
Scor
e
K ST - Improved travel planning, information and ticketing issues Strong PositiveHousing 0 Dwellings Neutral
Localised Congestion relief
Slight Reduction in Carbon Emissions Neutral
Moderate Improvement
Significantly improved access for LBIA Staff to
LBIA
Moderate improvement in
Pedestrian / Cycle Facilities
Moderate improvements to
severanceNeutral
Some Development Work Undertaken or Some Risks Known (Short - Medium Term)
No Consultation Undertaken /
Unknown
Local Authority / West Yorkshire Transport Fund
<£2.5m 36
Economy and Growth Environmental Accessibility & Well Being Scheme Acceptability & Funding Risks
0
5
10
15
20
25
30
35
40
K
LBIA Summary Appraisal Updated 30/07/14
SCHEME
A) Connecting People to LBIA (Provising
greater coverage of population)
B) Support Future Housing
C) Creation of New Jobs in Leeds City
Region
D) Journey Time Improvements and Reliability
E) Carbon Reduction
F) Air Quality and Noise
G) Impact on areas of
Environmental Significance
H) Accessibility for LBIA Staff to LBIA
I) Active Travel J) Severance K) Road Safety
L) Timescale / Stage of Scheme
Development and Practicality
M) AcceptabilityN)Main Funding
SourceO) Scheme Cost
Ove
rall
Scor
e
K ST - Improved travel planning, information and ticketing issues 10 0 0 4 1 0 1 6 1 1 0 12 0 0 0 36
Economy and Growth Environmental Accessibility & Well Being Scheme Acceptability & Funding Risks
0
5
10
15
20
25
30
35
40
K

Project number: Dated: 26/11/2014 48 | 162 Revised:
Shortlisted Schemes 8
Introduction 8.1The shortlisting of schemes was undertaken within the following context:
Addressing the first element above, the schemes complied in the long list covered the following types of transport interventions (and mode):
As such, the shortlisting of interventions has ensured that at least one scheme which falls in one of the above categories has been selected for further appraisal.
Addressing the second element regarding appraising a sensible number of options, it was agreed by the study team that the packaging of some individual schemes into ‘an option’ would provide a greater benefit to the study so that more schemes can be appraised, although as combinations of schemes. This allows sensible number of options to be appraised further. This section provides details of how individual schemes are packaged together.
Short / Medium-term Measures 8.2Through discussions with stakeholders, and following the outline appraisal of the schemes, a number of short / medium-term measures have come forward from the sifting process as detailed above.
8.2.1Road Improvements Two road improvement options have been prioritised for further assessment:
To establish short / medium term solutions and long term solutions;
To provide a range of transport solutions covering all modes of surface transport; and
Identify a sensible number of distinct and feasible options for further development and assessment.
Road Improvements (Private Vehicle);
Public Transport Improvements (Bus);
Public Transport Improvements (Rail);
Smarter Travel (multi-modal); and
Demand Management (multi-modal).
A65 to LBIA Link Road (51 points)
Package 1 - Bradford Corridor Junction Improvements:
New Line / Harrogate Rd (48 points);
Rawdon Crossroads (New Rd / Harrogate Rd); (43 points);
A65 / A658 Roundabout; and (43 points); and
A660 / A658 (Poole Bank Road). (43 points).
49 | 162
The A65 to LBIA Link Road scores the highest number of points in the Appraisal Framework for highway schemes (51 points). It is a significant infrastructure scheme on its own and is therefore identified for further appraisal as an isolated scheme.
The next placed road scheme in the Appraisal Framework for highways is the New Line / Harrogate Road Junction (scoring 48). Then, three other road schemes (junctions) within close proximity of LBIA are next placed in the Appraisal Framework scoring 43 each. As the four road schemes described are in close proximity and are likely to interact with each other, the project team have combined these individual schemes together as one option termed Package 1 – Bradford Corridor Junction Improvements.
It should be noted that the next 3 placed schemes in the highways category (all scoring 36) have already received funding, namely:
Rodley Roundabout, (36 points); and
Horsforth Roundabout (36 points)
Rodley Barracks Roundabout (36 points)
These road schemes have therefore not been taken forward for further appraisal as they are to be constructed in the near future.
There is a clear distinction between the scores of A65 to LBIA Link Road, Package 1 – Bradford Corridor Junction Improvements and the remaining highway schemes (which score 35 or less). Therefore, no other highway options identified in the long list of schemes are to be taken forward for further assessment.
8.2.2Rail / Light Rail Two rail schemes have been prioritised for further assessment.
For the short / medium term rail schemes, LBIA Parkway Station scores the highest number of points in the Appraisal Framework (with 36 points). It is a significant infrastructure scheme on its own and is therefore identified for further appraisal as an isolated scheme.
Placed next in the for the short / medium term rail schemes is Rail Option 1 – Horsforth to LBIA (with 35 points). As there is no clear difference in the score (just 1 point) between Parkway Station, this scheme has also been prioritised for further appraisal as an isolated scheme.
No other rail schemes were identified in the long list falling into the short / medium term category.
8.2.3Bus A public transport bus package has been prioritised for further assessment.
The three bus schemes above are ranked top in the Appraisal Framework for Bus Schemes (scoring 33). As the bus options are similar in nature, they have been packaged together as Package 2 – Express Bus Services.
LBIA Parkway Station (Harrogate Line) (36 points); and
Rail Option 1 - Horsforth to LBIA (Interchange at Horsforth) (35 points).
Package 2 - Express Bus Services:
Express Bus Service Leeds Train Station to LBIA (33 points);
Express Bus Service Bradford Interchange to LBIA to Harrogate (33 points); and
Express Bus Service York to LBIA (33 points).

Project number: Dated: 26/11/2014 50 | 162 Revised:
One other bus scheme was identified in the short / medium term (shuttle bus services to Horsforth, Guiseley and Apperley Bridge rail stations) and, as there was a clear distinction in scoring between this scheme (scoring 28 points) to those in Package 2, it has been omitted from further assessment.
8.2.4Traffic Management One traffic management scheme has been prioritised for further assessment.
This scheme was identified in the long list and scores 28 in the Appraisal Framework. It has been included for further appraisal as it is the only scheme in the demand management category and it ensures that all transport intervention types are evaluated in further appraisal work.
8.2.5Smarter Travel One smarter travel scheme has been prioritised for further assessment.
This scheme was identified in the long list and scores 36 in the Appraisal Framework. It has been included for further appraisal as it is the only scheme in the Smarter Travel category and it ensures that all transport intervention types are evaluated in further appraisal work.
Long-term Measures 8.3A number of long-term measures have also been prioritised through the sifting process. For the following intervention types, no long term schemes have been identified:
8.3.1Road Improvements Long Term Highways Schemes have been assessed in the Appraisal Framework:
However, the scoring in the Appraisal Framework for these highway schemes is relatively low (34 or less) compared to other road improvement schemes that have been prioritised for further appraisal in the short / medium term (43 and above).
Therefore, no long term road schemes have been identified for further appraisal.
Improved signage and UTMC measures to improve routing (28 points)
Improved travel planning, information and ticketing issues (36 points).
Bus;
Traffic Management; and
Smarter Travel
East Leeds Orbital Road (34 points);
A6110 Improvements (27 points);
South Bradford Access Road (25 points); and
Bradford Outer Ring Road West (25 points).

51 | 162
8.3.2Rail / Light Rail One rail scheme has been prioritised for further assessment.
This scheme scores 36 in the Appraisal Framework with a marked difference between the next highest scoring long term rail scheme (scoring 31 or less). Therefore no other long term rail schemes are prioritised for further appraisal.
Schemes Excluded 8.4Table 7 and Table 8 display the respective short/medium and long term schemes that have been sifted out from further appraisal. The exclusion of these schemes is due to either scoring relatively lower in the Appraisal Framework for their mode category or having already received/secured funding.
Table 7 – Excluded Short / Medium Term Schemes
Scheme Type Scheme
Highway
Thornbury Barracks Roundabout Horsforth Roundabout Rodley Roundabout Leeds ORR - A61 /A6120 Junction Improvements Leeds ORR – King Lane / A6120 Junction Improvements East Leeds Orbital Road Leeds ORR – King Lane / Stonegate Junction Improvements A6110 ORR Improvements South Bradford Access Road Bradford ORR West Junctions
PT Bus Shuttle Buses to Local Rail stations
Table 8 – Excluded Long Term Schemes
Scheme Type Scheme
Rail / Light Rail
Heavy Rail Op1a – Leeds – Horsforth - LBIA Rail Op4 – Leeds- Guiseley-LBIA-Horsforth-Leeds Leeds to LBIA Tram-Train Link Bradford-LBIA Tram- Train Link Rail Op6 – Leeds - Bradford- Guiseley – LBIA Rail Op5 – Bradford- Guiseley – LBIA Rail Op2 – Guiseley to LBIA Rail Op7 – Calverley – LBIA Calverley to LBIA – Tram Train
Rail Option 3 – Guiseley-LBIA-Horsforth (Interchange) (36 points).

Project number: Dated: 26/11/2014 52 | 162 Revised:
Summary 8.5This section has outlined the requirement to develop a focused LBIA Appraisal Framework, which assesses each of the long-list schemes against certain criteria, weighted specifically to the core objectives of the study which are to:
Table 10 in the following section summarises the schemes and packages prioritised for further appraisal, as selected through the sifting and packaging process detailed in this report.
1. Identify and appraise measures to improve the existing connectivity between LBIA and its catchment area; and
2. Understand the constraints to the future growth of LBIA and identify and appraise surface access measures (including road and public transport) required to facilitate this future growth.
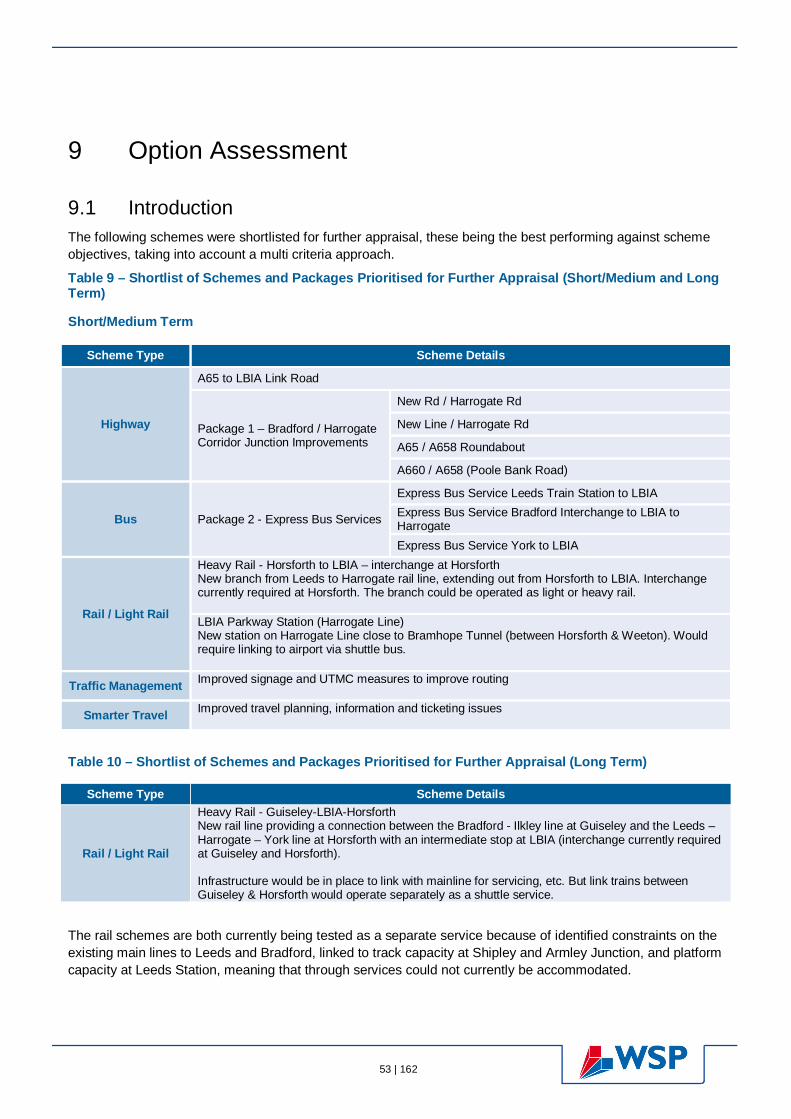
53 | 162
Option Assessment 9
Introduction 9.1The following schemes were shortlisted for further appraisal, these being the best performing against scheme objectives, taking into account a multi criteria approach.
Table 9 – Shortlist of Schemes and Packages Prioritised for Further Appraisal (Short/Medium and Long Term)
Short/Medium Term
Scheme Type Scheme Details
Highway
A65 to LBIA Link Road
Package 1 – Bradford / Harrogate Corridor Junction Improvements
New Rd / Harrogate Rd
New Line / Harrogate Rd
A65 / A658 Roundabout
A660 / A658 (Poole Bank Road)
Bus Package 2 - Express Bus Services
Express Bus Service Leeds Train Station to LBIA Express Bus Service Bradford Interchange to LBIA to Harrogate Express Bus Service York to LBIA
Rail / Light Rail
Heavy Rail - Horsforth to LBIA – interchange at Horsforth New branch from Leeds to Harrogate rail line, extending out from Horsforth to LBIA. Interchange currently required at Horsforth. The branch could be operated as light or heavy rail. LBIA Parkway Station (Harrogate Line) New station on Harrogate Line close to Bramhope Tunnel (between Horsforth & Weeton). Would require linking to airport via shuttle bus.
Traffic Management Improved signage and UTMC measures to improve routing
Smarter Travel Improved travel planning, information and ticketing issues
Table 10 – Shortlist of Schemes and Packages Prioritised for Further Appraisal (Long Term)
Scheme Type Scheme Details
Rail / Light Rail
Heavy Rail - Guiseley-LBIA-Horsforth New rail line providing a connection between the Bradford - Ilkley line at Guiseley and the Leeds –Harrogate – York line at Horsforth with an intermediate stop at LBIA (interchange currently required at Guiseley and Horsforth). Infrastructure would be in place to link with mainline for servicing, etc. But link trains between Guiseley & Horsforth would operate separately as a shuttle service.
The rail schemes are both currently being tested as a separate service because of identified constraints on the existing main lines to Leeds and Bradford, linked to track capacity at Shipley and Armley Junction, and platform capacity at Leeds Station, meaning that through services could not currently be accommodated.
Project number: Dated: 26/11/2014 54 | 162 Revised:
The method of assessment and results are included in the following sections.
Modelling Approach 9.2This section describes the modelling methodology used for the LBIA Connectivity Study, which is consistent with the Department for Transport’s Transport (DfT) Appraisal Guidance (TAG) Stage 1 (Option Development). The modelling supports the assessment of highway, bus and rail options, with the outcome of each presented in this report.
The modelling would then support scheme assessment at Stage 2 of the study only. A review of the models and any preparation work to update the models in readiness for use has been undertaken in Stage 1(b). Stage 1(a) involves an initial sift of schemes, carried out using Early Assessment & Sifting Tool (EAST) and our own bespoke Multi Criteria Assessment Tool (MCAT).
During the study inception meeting the DfT requested further detail on the modelling approach and how this will be used in the appraisal, expanding on the outline approach already set out in the project proposal. This was further reinforced with more recent detailed discussions as the project progressed. A more technical description of the process is included within a series of Technical Notes as an appendix to this report.
Modelling Overview 9.3The Leeds Transport Model (LTM) has been used as a basis for the modelling. The LTM is a multi-model modelling suite with variable demand capability. It comprises the following model components:
LTM_H (Highway model in the Saturn software);
LTM_PT (Public Transport model in the Cube Voyager software); and
LTM_D (Demand model primarily in the Emme software).
In scoping the modelling work, it was not considered appropriate to use the full LTM suite due to the anticipated lengthy scenario set up and model run times which would exceed the project time scales available for undertaking the option assessments. Instead the LTM_H was used as standalone component and the LTM_PT to inform the structure and some of the model parameters in a public transport spreadsheet model developed specifically for the study.
The LTM_PT significantly under represented the area of interest and so to overcome this it was agreed that a spreadsheet model would be developed as an alternative. While this only provides a simplistic representation of the public transport system it is considered sufficient and proportional to the requirements at this stage of scheme development.
The existing LTM model base year is 2008 with forecast years of 2016 and 2031.
The existing LTM model time periods are as follows:
Highway
AM peak hours 7-8, 8-9 & 9-10;
Inter-peak average hour 10-16; and
PM peak hours 16-17, 17-18, 18-19.
Public Transport
AM Peak period average hour 7-10;
Inter-peak average hour 10-16; and
PM peak hours average hour 16-18.

55 | 162
There is linkage between the LTM_H model hours within the peak periods where queue information is set to pass between subsequent model hours.
There is also linkage where congested travel times from the LTM_H as passed to the LTM_PT as part of a full variable demand mode run. These linkages were not retained for the study modelling. Prior to using the LTM_H for the study, the base model performance was reviewed in the vicinity of the airport and scheme areas in terms of validation, network, public transport services and zone systems.
Highway Modelling 9.4Overview
The LTM_H was used for the highway modelling. Following a review of the model performance in the vicinity of the LBIA and scheme areas some relatively minor changes were made to the base year model to ensure closer validation and taking into account changes in network performance, which were carried forward in to a new set of forecasts.
Time periods
The following time periods were used from the LTM_H, which in the AM peak aligns directly with peak airport arrivals and departures, and in the PM Peak is more aligned to peak general traffic. The transient nature of airport passengers and the difficulty in predicting their actual arrival for a particular timed aircraft departure makes aligning the assessment with those times slightly academic. As airport traffic also represents a small proportion of overall traffic it also makes more sense to assess the general peaks to ensure the full range of benefits is captured. The selected hours are:
AM peak hour 8-9;
Inter peak average hour 10-16; and
PM peak hour 17-18.
The other LTM_H periods were not used in order to limit the scope of the modelling work.
Base model changes
A review of the model performance in the vicinity of the airport revealed the following:
The model network coverage is simplified outside of the immediate Leeds district area (i.e. Bradford);
Comparison of the model against observed flows demonstrated that the model performs well at a screen line level but less so in terms of individual count sites. There are some potentially significant locations with high GEH values (i.e. GEH not within the recommended TAG criteria). The GEH value (named after its founder Geoffrey E. Havers) is a statistical formula used to compare two sets of traffic flows, ‘real world’ observed, with modelled. A lower value represents a better representation of reality);
Comparison of the model against observed journey times demonstrated that the model representation of journey times is mixed; and
Demand at the airport is under-represented.
Based on this assessment, changes were made in the model to the Greengates junction (A658 / A657) and the airport demand. The airport demand was adjusted to reflect benchmark values derived through data presented in the Airport Extension Transport Assessment.
Demand Response
A variable demand model test will be undertaken based on the guidance set out in TAG Unit M2 Variable Demand Modelling (described in Section 11.6).
Project number: Dated: 26/11/2014 56 | 162 Revised:
This will give an indication of the scale of the demand response and impact on the change in scheme benefits, should variable demand be included within the scheme appraisal, and whether variable demand should be incorporated into future assessment.
Forecasting
The shortlisted highway schemes were all short-medium term (5-10 years), based on the expected planning and delivery timescales. The agreed opening year agreed was 2021 and final model year 2031.
New forecasts were prepared for the study which involved pivoting off the existing LTM_H matrices using National Trip End Model (NTEM) growth, which is described later in the report. On the supply side, the schemes included in the existing LTM_H 2016 and 2031 forecasts are the same, and this approach was also followed or the study forecast networks.
Public Transport Modelling 9.5Overview
For the public transport modelling a bespoke spreadsheet model was developed. Its purpose was to provide a simple representation of the impacts of the scheme options being tested. It was structured to capture benefits based on a simplistic representation of demand and generalised costs between either end of the schemes being tested. Demand was provided in the form of observed patronage data received from Yorkshire Tiger who operate existing bus services between Leeds, Bradford, Harrogate and the airport.
Demand response and public transport route choice were based on logit choice. Logit choice represents the choice between travel alternatives (i.e. highway versus public transport, and then modes within public transport (in this case, bus or rail) based on an exponential function of generalised costs (i.e. the comparison between generalised costs of highway versus public transport travel).
Generalised costs were built up based on similar components represented in the LTM_PT (but not including crowding, access or egress times).
Time periods
The same time periods from the LTM_PT have been used. The time periods are as follows:
AM Peak period average hour 7-10;
Inter-peak average hour 10-16; and
PM peak average hour 16-18.
User classes
The same user classes from the LTM_PT have also been used:
Non concessionary fare payers; and
Concessionary fare payers.
Demand
Passenger boarding information was provided by Yorkshire Tiger, covering Dec 2013 to June 2014. This provided demand information between LBIA and Leeds, Bradford and Harrogate. The demand was aggregated by time period for the each of the model movements to and from LBIA. Only demand between the scheme start and end points was selected (i.e. between Leeds and LBIA, Bradford and LBIA etc.) as being the only ‘in scope’ trips considered for an express journey are from the central area to the airport.
57 | 162
The demand was benchmarked against data provided by the West Yorkshire Combined Authority (WYCA) as a means of data validation to ensure a realistic representation was included in the model. The outcome was that while the general magnitude of the demand was similar, the demand derived from the Yorkshire Tiger data was less than that derived from the WYCA data, albeit that the WYCA data was from a significantly smaller sample. It is also recognised that intermediate trips generated to and from the airport could have the potential to increase patronage (but only if the express (non-stop) service became limited stop).
Journey Times
Journey time information was sourced from current time table information, which it has been assumed would be unchanged going into the future. The basis for scheme journey times has been assumed as follows:
For express bus, the LTM_H has been used, assuming that there would be no stops between the start and end locations (i.e. Leeds city centre and LBIA) along the route, and therefore that the times would be same as the congested highway times; and
For rail, the existing timetable times have been assumed. For the connecting bus (between nearby rail station and LBIA) it has been assumed that this follows a realistic journey time, based on distance and average speed.
Interchanging
For the rail schemes it has been assumed that there will be a requirement to interchange between nearby station and LBIA, or between stages of the journey (between trains). The time assumed for the interchange is 10 minutes. However in the model an interchange time penalty (5 minutes) and time weight (factor of 2.85) are also applied, which is consistent with the LTM_PT and TAG, but considerable increases the perceived time. Therefore as a sensitivity the interchange time has been removed, or in the case of the Parkway Station scheme reduced to 5 minutes.
Demand Response
Demand response has been modelled using a simple two-tier logit mechanism which reflects the following choices:
Between highway and public transport (main mode choice); and
Between different public transport options (i.e. between bus and rail), effectively sub mode choice.
The choices are made based on differences in generalised costs. The scale of response (proportion of demand assigned to either option) is also based on differences in generalised cost as well as the selection of logit sensitivity parameter.
The main mode choice equations used align with those described in the LTM_D LMVR; an incremental model formula. The sub mode choice equation is an absolute model formula. Both formulas are described in TAG Unit M2 Variable Demand Modelling.
The main mode choice sensitivity parameter was derived based on the values set out in the LTM_D LMVR and aggregated using purpose proportions from the TAG data book. The sub mode choice parameter was based on the LTM_PT parameter used in the choice between NGT (New Generation Transport) and other modes. The sub mode choice parameter was subsequently calibrated against observed demand data for existing services supplied by the current operator Yorkshire Tiger, and supported by additional observed data from WYCA, based on average hourly flows so that the base model demand inputs reflected the demand outputs as closely as possible. Table 11 sets out the sensitivity parameters used.

Project number: Dated: 26/11/2014 58 | 162 Revised:
Table 11 – Sensitivity Parameters
Response Sensitivity Parameter (pre calibrated value in brackets)
Main mode choice 0.03
Sub mode choice 0.15 (0.08)
While the logit choice approach chosen is considered the most appropriate mechanism for dealing with demand response, the use of elasticities was also considered as an option during scoping. However, instead elasticities have been used as a means of sensitivity test as presented in Chapter 10 Public Transport Appraisal Results.
Highway Scope
Highway demand and generalised costs have been included as inputs to the demand response mechanism described above, which allows for a change in demand when the schemes are modelled. The demand and costs have been taken from LTM_H between similar locations at either end of the routes being modelled (I.e. LBIA to Leeds centre, LBIA to Bradford centre, etc.). 3 km radius areas have been selected for the non-LBIA trip ends to ensure a realistic demand catchment.
Fares
The public transport fares have been taken from the LTM_PT. These are described in detail in the LTM_PT LMVR, however in summary:
For the LTM_PT fares were constructed for:
Rail;
First Bus;
Arriva Bus; and
Leeds City Bus.
The fares were derived for each of the AM, IP and PM model time periods.
Rail fares were derived based on Metro card, rail operator season, half-return and single ticket prices between Metro zones across West Yorkshire. These were averaged using proportions taken from the Leeds rail station survey used to develop the model matrices. Outside of the Metro zone area a distance based relationship was derived using a sample of ticket prices between locations serving Leeds rail station.
First and Arriva Bus fares were derived based on combining the different ticket types available into a distance based relationship. These were averaged using proportions from the bus survey data collected for developing the model matrices.
All fares were collected in 2011 prices and converted to 2008 for the LTM_PT. Fare growth was calculated as RPI+ 3% per year up to Jan 2014 and RPI+1% per year after that.
These fares were also used for the study and growthed to the appropriate forecast years based on the assumption described above.
Yorkshire Tiger fares are not represented in the model but are in line with the averages calculated using the method set out above, indicated in Table 12 below.
A comparison of the existing service scheme fares used in the study against actual half return fares (adult return ticket fare divided by 2) is presented below. Note that the study fares reflect the full complement of different ticket types.
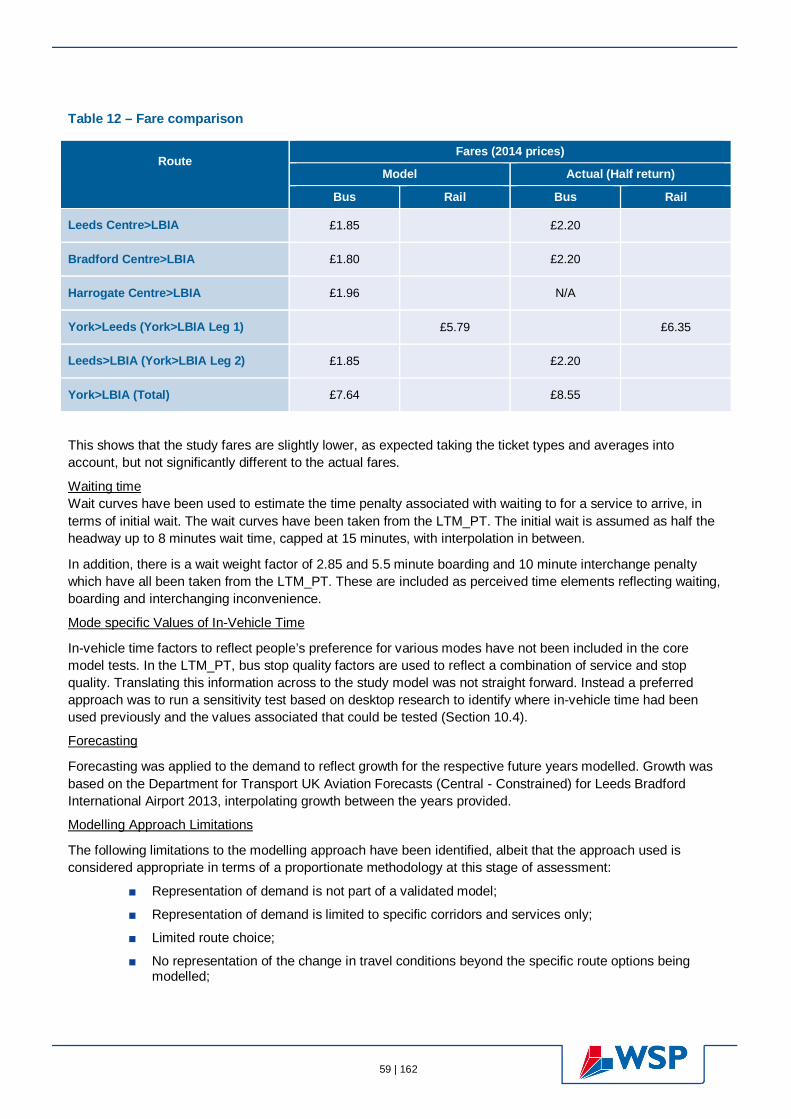
59 | 162
Table 12 – Fare comparison
Route
Fares (2014 prices)
Model Actual (Half return)
Bus Rail Bus Rail
Leeds Centre>LBIA £1.85 £2.20
Bradford Centre>LBIA £1.80 £2.20
Harrogate Centre>LBIA £1.96 N/A
York>Leeds (York>LBIA Leg 1) £5.79 £6.35
Leeds>LBIA (York>LBIA Leg 2) £1.85 £2.20
York>LBIA (Total) £7.64 £8.55
This shows that the study fares are slightly lower, as expected taking the ticket types and averages into account, but not significantly different to the actual fares.
Waiting time Wait curves have been used to estimate the time penalty associated with waiting to for a service to arrive, in terms of initial wait. The wait curves have been taken from the LTM_PT. The initial wait is assumed as half the headway up to 8 minutes wait time, capped at 15 minutes, with interpolation in between.
In addition, there is a wait weight factor of 2.85 and 5.5 minute boarding and 10 minute interchange penalty which have all been taken from the LTM_PT. These are included as perceived time elements reflecting waiting, boarding and interchanging inconvenience.
Mode specific Values of In-Vehicle Time
In-vehicle time factors to reflect people’s preference for various modes have not been included in the core model tests. In the LTM_PT, bus stop quality factors are used to reflect a combination of service and stop quality. Translating this information across to the study model was not straight forward. Instead a preferred approach was to run a sensitivity test based on desktop research to identify where in-vehicle time had been used previously and the values associated that could be tested (Section 10.4).
Forecasting
Forecasting was applied to the demand to reflect growth for the respective future years modelled. Growth was based on the Department for Transport UK Aviation Forecasts (Central - Constrained) for Leeds Bradford International Airport 2013, interpolating growth between the years provided.
Modelling Approach Limitations
The following limitations to the modelling approach have been identified, albeit that the approach used is considered appropriate in terms of a proportionate methodology at this stage of assessment:
Representation of demand is not part of a validated model;
Representation of demand is limited to specific corridors and services only;
Limited route choice;
No representation of the change in travel conditions beyond the specific route options being modelled;
Project number: Dated: 26/11/2014 60 | 162 Revised:
No crowding impacts;
Simplistic mechanism for testing demand response;
Existing public transport demand is based on bus patronage data. Highway demand from the LTM-H will also be included to model demand response. Where the airport has aspirations to increase public transport mode share, in line with the Surface Access Strategy and planning conditions, current forecasting based on existing demand may bias the result by underestimating impact of the scheme, and potential benefits;
The generalised costs are fixed;
The model will not be iterating to equilibrium; and
No representation of access and egress times.
Annualisation 9.6Annualisation follows the guidance set out in TAG unit A1.3 User and Provider Impacts.
Annualisation factors have been derived separately for highway and public transport as follows:
Highway factors were based on traffic count data provide by Leeds City Council for a selection of sites located in the vicinity of the airport; and
Public transport factors were based on passenger demand data provided by Yorkshire Tiger representing demand on services to and from the LBIA.
Transport User and Provider Impacts 9.7TUBA has been used to calculate transport user and provider benefits.
Public transport time costs have been weighted according to the advice set out in ‘TUBA: General Guidance and Advice’ changed from the behavioural model weightings.
Option Assessment Framework 9.8TAG, the Transport Appraisal Guidance, describes that for each potential option the results should be presented against the Option Assessment Framework (OAF), which comprises the following 5 cases:
Strategic Fit;
Value for Money – incorporating;
Impact on the Economy;
Impact on the Environment;
Impact on Society;
Public Accounts;
Distributional Impacts; and
Indicative Benefits Cost Ratio.
Financial Case;
Delivery Case; and
Commercial Case

61 | 162
Elements of this framework applicable to the economic outputs from Tuba have been used to present the public transport and highway scheme appraisal results.
In order to demonstrate the reasoning behind selection of recommended packages, and to incorporate measures beyond a traditional economic BCR, these OAFs are included for each of the options shortlisted.

Project number: Dated: 26/11/2014 62 | 162 Revised:
Public Transport Appraisal Results 10
Introduction 10.1This chapter sets out the modelling and appraisal results for the public transport schemes, described under the following headings:
Schemes modelled – describes the public transport schemes that have been setting out the core and sensitivity tests defined;
Modelling assumptions – describes the modelling assumptions in terms of forecast year, demand, travel time, service headway and fare inputs, and cost assumptions;
Appraisal results – describes the results setting out the economic outputs for benefits costs and indicative BCR;
Generalised cost components – illustrates the component parts that have been used to form generalised costs the represent the existing (Do Min) and with scheme (DS) scenarios for the modelling;
Mode shift – illustrates the scale of demand going from the existing (DM) and with scheme (DS) scenarios in the modelling;
Demand response sensitivity – illustrates the difference in demand response between the logit choice mechanism used for the study and an alternative elasticity approach; and
Summary – provides an overview of the appraisal results.
Public Transport Schemes Modelled 10.2The following schemes and sensitivity tests that have been appraised:
Short / Medium Term Schemes
Package 2 – Express Bus Services
Core Test (assumes existing service upgrade);
Competing service sensitivity (assumes competing express services);
Logit +50% sensitivity (assumes more sensitivity demand response);
Logit -50% sensitivity (assumes less sensitive demand response); and
Wait curve sensitivity (capping weight times at 7.5 minutes).
Heavy Rail – Horsforth to LBIA
Core Test (assuming a through service);
Interchange penalty sensitivity (replicating a service with interchange); and
In vehicle time sensitivity (assumes peoples preference for rail travel over bus).
LBIA Parkway Station
Core Test;
Interchange penalty sensitivity; and
In vehicle time sensitivity (assumes peoples preference for rail travel over bus).
63 | 162
Long Term Schemes
Heavy Rail – Guiseley – LBIA – Horsforth
Core Test (assuming a through service);
Interchange penalty sensitivity (replicating a service with interchange); and
In vehicle time sensitivity (assumes peoples preference for rail travel over bus).
Further details of the core test assumptions and sensitivity tests are described below.
Package 2 – Express Bus Services
For Package 2 – Express Bus Services, the results are presented both as a combined impact for all the services packaged, and on an individual component part basis as follows:
Leeds<>LBIA service;
Bradford/Harrogate <>LBIA service, Bradford to airport section;
Bradford/Harrogate <>LBIA service, Harrogate to airport section; and
York<>LBIA service.
The core test assumes that the existing bus services serving LBIA are upgraded by increasing the frequency (but with the exception of the York service where there is no existing service). The competing service sensitivity assumes that rather than upgrading the existing service, an additional express service is provided which operates in addition to the existing service.
A logit choice sensitivity test has been undertaken to get an understanding of the scale of impact when a different parameter is used. The tests have involved factoring both the mode choice and sub mode choice logit sensitivity parameters together, in the spreadsheet model, by +50% and -50%. This follows the guidance set out in TAG Unit M2 Variable Demand Modelling for sensitivity testing parameters where values have been imported from another source rather than calibrated to local data. The purpose of the logit function and the parameters used to determine demand response are described earlier in the report.
A wait curve sensitivity test has been carried out to get an understanding of the scale of impact when the wait assumptions are changed. For the core tests the assumption has been to use the wait curves from the LTM_PT. For the sensitivity test, the example wait curve has been used which is set out in TAG Unit M3.2 Public Transport Assignment, which caps wait time at 7.5 minutes (rather than 15 minutes for the core assumption).
Heavy Rail – Horsforth to LBIA
For Heavy Rail – Horsforth to LBIA, the core test assumes a direct service operating between Leeds and LBIA. Passengers between Harrogate and LBIA would physically interchange at Horsforth, but for demand modelling purposes the core scheme assumes a through service is available by removing the interchange penalty. This was considered the scheme which would most logically be aspired to. The impact of Harrogate passengers having to interchange was assessed by a sensitivity test that is reproduced at Appendix C. This shows only a marginal worsening of the economic case due to the relatively low demand forecasts from Harrogate.
A sensitivity test has also been run assuming that a 10 minute interchange is incurred at Horsforth station for Leeds and Harrogate passengers, followed by transfer to a separate rail shuttle onward to LBIA. This represents an alternative short term scheme of a separate rail spur which could be delivered without the need to address existing constraints elsewhere on the rail network, some of which are significant.
Discussions with Network Rail, and previous work by WSP on the Leeds – Harrogate – York Rail Line have identified existing constraints which would prevent additional through services operating at present including single track sections on the Harrogate Line, junction and line capacity on the approach between Armley Junction and Leeds Station, platform capacity at Leeds Station (particularly for terminating services), and track
Project number: Dated: 26/11/2014 64 | 162 Revised:
capacity at Shipley Junction. Some, if not all of these constraints, would need to be resolved before additional and/or through services could operate, and the cost of any solutions has not been considered as part of this study.
A sensitivity test has also been carried out assuming peoples preference for rail over bus. This is based on the following in-vehicle time factors which are applied as a perceived time penalty, increasing the bus travel time:
Bus = 1.28; and
Rail = 1
These factors have been sourced from the South Yorkshire Bus Rapid Transit (BRT) – Northern Route Scheme Appraisal using the Sheffield and Rotherham Public Transport Model (SRPTM3), 2009 (undertaken by WSP). Desktop research also identified values from the SEMMMS A6 to Manchester Airport Relief Road Public Transport Model (SPM2-PT), 2012 which reflected a narrower differential.
LBIA Parkway Station
For the LBIA Parkway Station, the core test assumes a new station on the Harrogate line close to Bramhope Tunnel (between Horsforth and Weeton) with a shuttle bus service linking to the airport. This is currently assumed to be an extension of the existing car park shuttle bus. A 5 minute interchange time has been assumed.
Sensitivity tests with 10 minute interchange and the in-vehicle time factors described above have also been carried out.
Heavy Rail – Guiseley-LBIA-Horsforth
For Heavy Rail – Guiseley-LBIA-Horsforth, the core test assumes a new rail line provide direct services connecting Leeds and Bradford with LBIA. In practical terms, a direct connection to Harrogate from Horsforth may be particularly difficult to deliver without additional infrastructure because of the current operating patterns and this infrastructure is not currently included in the capital costs of the scheme. Assuming a through service from Harrogate without these costs would inflate the benefits, although as this is only a very small proportion of overall demand, it is not considered significant at this stage in the assessment.
Sensitivity tests with 10 minute interchange and the in-vehicle time factors described above have also been carried out. Once again, the impact of Harrogate passengers having to interchange was assessed by a sensitivity test that is reproduced at Appendix C.
Modelling Assumptions 10.3Table 13 below shows the modelling assumptions. For the forecast years the demand shown has been growthed in line with the Department for Transport UK Aviation Forecasts (Central - Constrained) for Leeds Bradford International Airport 2013. Table 14 then sets out the public transport cost assumptions.

65 | 162
Table 13 - Modelling Assumptions
Scheme Type
Scheme Details
Opening Year
Demand Service Run Travel Time Service Headway Service Fares (all fares from the PT model, shown below
converted to 2014 prices)
Short / Medium Term
Package 2 - Express Bus Services
2016 2014 Bus Patronage Data:
Leeds Centre>LBIA AM Pk Hr 20 pass/hr IP Avg Hr 20 pass/hr PM Pk Hr 22 pass/hr
Bradford Centre>LBIA AM Pk Hr 2 pass/hr IP Avg Hr 4 pass/hr PM Pk Hr 7 pass/hr
Harrogate Centre>LBIA AM Pk Hr 1 pass/hr IP Avg Hr 1 pass/hr PM Pk Hr 2 pass/hr CAA data 2010: York Centre>LBIA AM Pk Hr 4 pass/hr IP Avg Hr 5 pass/hr PM Pk Hr 6 pass/hr
Leeds Centre>LBIA Base: 34 mins Scheme: 32 mins
Bradford Centre>LBIA Base: 38 mins Scheme: 30 mins
Harrogate Centre>LBIA Base: 36 mins Scheme: 36 mins
York Centre>LBIA Base: 72 mins (23 min rail + 34 min bus + 15 min int) Scheme: 59 mins
Leeds Centre>LBIA Base: 20 mins Scheme: 15 mins
Bradford Centre>LBIA Base: 30 mins Scheme: 20 mins
Harrogate Centre>LBIA Base: 60 mins Scheme: 20 mins
York Centre>LBIA Base: rail 10 mins, bus 20 mins, assume combined 20 mins Scheme: 30 mins
Leeds Centre>LBIA Base & Scheme: £1.85
Bradford Centre>LBIA Base & Scheme: £1.80
Harrogate Centre>LBIA Base & Scheme: £1.96
York Centre>LBIA Base: rail £5.79, bus £1.85 Scheme: £3.14

Project number: Dated: 26/11/2014 66 | 162 Revised:
Scheme Type
Scheme Details
Opening Year
Demand Service Run Travel Time Service Headway Service Fares (all fares from the PT model, shown below
converted to 2014 prices)
Heavy Rail - Horsforth LBIA (Interchange at Horsforth)
2021 2014 Bus Patronage Data: Leeds Centre>LBIA Harrogate Centre>LBIA (as above for Package 2)
Leeds Centre>LBIA Base: 34 mins Scheme: 16 mins (12 min rail leg_1 + 4 min rail leg_2)
Harrogate Centre>LBIA Base: 26 mins Scheme: 33 mins (19 min rail leg_1 + 4 min rail leg_2)
Leeds Centre>LBIA Base: 20 mins Scheme: 30 mins
Harrogate Centre>LBIA Base: 60 mins Scheme: 30 mins
Leeds Centre>LBIA Base: £1.85
Scheme: £2.29
Harrogate Centre>LBIA Base: £1.96
Scheme: £5.48
LBIA Parkway Station (Harrogate Line)
2021 2014 Bus Patronage Data: Leeds Centre>LBIA Harrogate Centre>LBIA (as above for Package 2)
Leeds Centre>LBIA Harrogate Centre>LBIA As above for Heavy Rail - Horsforth LBIA
Leeds Centre>LBIA Harrogate Centre>LBIA As above for Heavy Rail - Horsforth LBIA
Leeds Centre>LBIA Harrogate Centre>LBIA As above for Heavy Rail - Horsforth LBIA
Long Term
Heavy Rail - Guiseley - LBIA - Horsforth
2026 2014 Bus Patronage Data: Leeds Centre>LBIA Bradford Centre>LBIA Harrogate Centre>LBIA (as above for Package 2)
Leeds Centre>LBIA Harrogate Centre>LBIA As above for Heavy Rail - Horsforth LBIA
Bradford Centre>LBIA Base: 38 mins Scheme: 19 mins (15 min rail leg_1 + 4 min rail leg_2)
Leeds Centre>LBIA Harrogate Centre>LBIA As above for Heavy Rail - Horsforth LBIA
Bradford Centre>LBIA Base: 30 mins Scheme: 30 mins
Leeds Centre>LBIA Harrogate & Centre>LBIA As above for Heavy Rail - Horsforth LBIA
Bradford Centre>LBIA Base: Base: £1.80
Scheme: £2.30

67 | 162
Table 14 - Cost Assumptions
Scheme Type Scheme Details
Scheme Costs (£) Assumptions
Capital Costs Operating / Maintenance
Price Base
Delivery Period
Short / Medium Term
Package 2- Express Bus Services: For upgrading existing services (Core test)
1,814,400 1,053,000 per year 2014 1 year
All bus costs based on consultant estimates. Capital cost per vehicle = £140,000; £201,600 including 44% OB, Low Floor Single Deck operating 7 days over an 18 hour day span. Capital Cost per vehicle spread over 5 years (£28k/year). Operating cost per vehicle = £117,000 per year. Assumes low floor single deck operating 7 days over an 18 hour day span. Required vehicles: - Leeds Express = 1 veh/hr (15 min headway). - Bradford & Harrogate Express = 4 veh/hr (20 min headway). - York Express = 4 veh/hr (30 min headway).
Package 2- Express Bus Services: For competing express services (Sensitivity test)
2,822,400 1,638,000 per year 2014 1 year
Required vehicles: - Leeds Express = 4 veh/hr (15 min headway). - Bradford & Harrogate Express = 6 veh/hr (20 min headway). - York Express = 4 veh/hr (30 min headway).
Heavy Rail - Horsforth LBIA (Interchange at Horsforth)
70,230,000 590,000 per year 2012 5 years
Costs based on Aecom review of proposed scheme to LBIA. Light rail costs scaled for heavy rail estimates. Assuming electrified track and airport station with 30 minute service headway. Includes 66% OB.
LBIA Parkway Station (Harrogate Line)
7,784,000 161,000 per year 2011 5 years
Costs based on consultants estimates using costs for a similar size station. Validated against current WYCA estimates. Provision of station only (no additional services) with associated infrastructure (parking and access). Includes 44% OB.
Long Term Heavy Rail -
Guiseley - LBIA – Horsforth
168,220,000 1,360,000 per year 2012 5 years
Costs based on Aecom review of proposed scheme to LBIA. Light rail costs scaled for heavy rail estimates. Assuming electrified track and airport station with 30 minute service headway. Includes 66% OB.
Project number: Dated: 26/11/2014 68 | 162 Revised:
Appraisal Results 10.4The results presented in this section are the Economic outputs only. They are based on outputs from Tuba. Greenhouse gases have not been included.
Package 2 – Express Bus Services
Table 15 below presents the Package 2 – Express Bus Services results in terms of the core and sensitivity tests.

69 | 162
Table 15 - Package 2 – Express Bus Services (short / medium term), core test with component parts
Assessment Area
Test Packaged Component Parts
Core Core Leeds Bradford Harrogate York
Impact on the Economy Business Users and Transport Providers £ PVB Time Impacts 3,943 1,864 703 150 1,226 £ PVB Money Travel Costs 318 0 0 0 318 £ PVB Revenue -605 4,276 2,054 141 -7,076 Greenhouse Gases £ PVB Not quantified Impact on the Society Non-business Users £ PVB Time Impacts 24,533 11,604 4,254 947 7,728 £ PVB Money Travel Costs 9,815 0 0 0 9,815 Public Accounts Cost to broad transport budget £ PVC Central Government 0 0 0 0 0 £ PVC Local Government 31,387 3,487 6,975 6,975 13,950 Indirect Tax £ PVB Indirect Tax Revenues -94 665 319 22 -1,100 Indicative Benefit Cost Ratio Cost to Private Sector £ PVC Private Sector 0 0 0 0 0 Indicative Net Present Value £ NPV 6,523 14,922 355 -5,715 -3,039 Indicative Economic BCR BCR 1.2 5.3 1.1 0.2 0.8
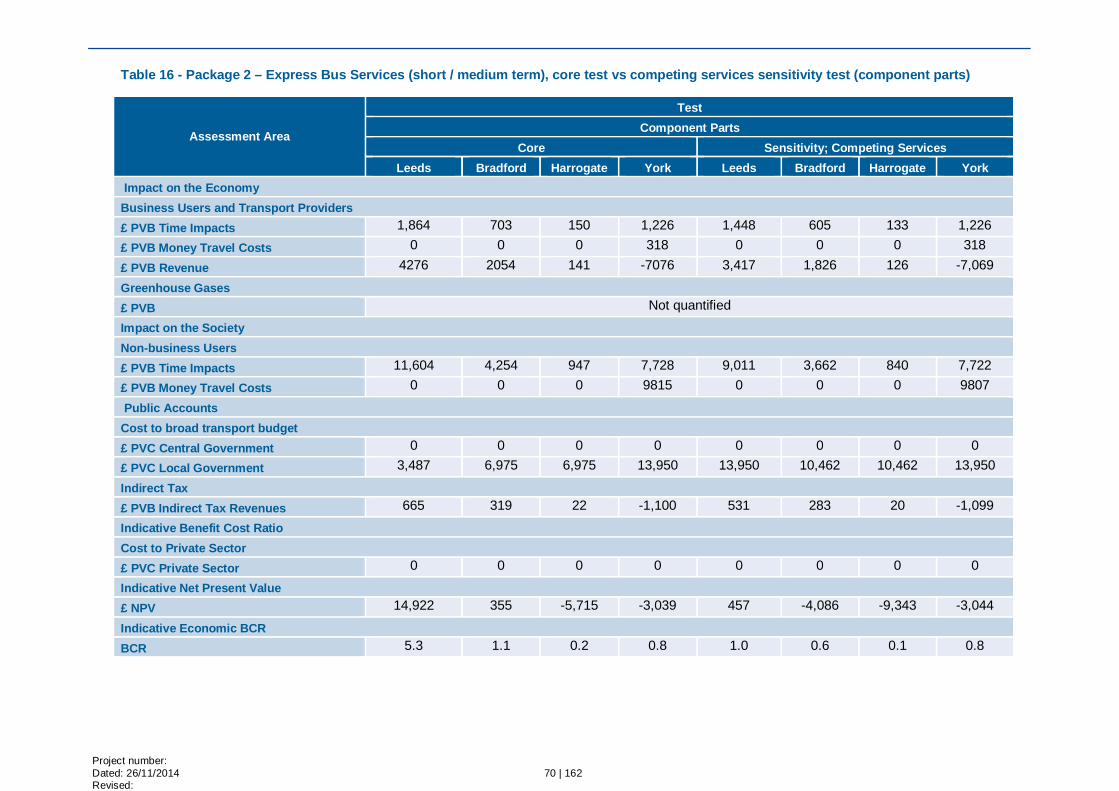
Project number: Dated: 26/11/2014 70 | 162 Revised:
Table 16 - Package 2 – Express Bus Services (short / medium term), core test vs competing services sensitivity test (component parts)
Assessment Area
Test Component Parts
Core Sensitivity; Competing Services Leeds Bradford Harrogate York Leeds Bradford Harrogate York
Impact on the Economy Business Users and Transport Providers £ PVB Time Impacts 1,864 703 150 1,226 1,448 605 133 1,226
£ PVB Money Travel Costs 0 0 0 318 0 0 0 318
£ PVB Revenue 4276 2054 141 -7076 3,417 1,826 126 -7,069
Greenhouse Gases £ PVB Not quantified
Impact on the Society Non-business Users £ PVB Time Impacts 11,604 4,254 947 7,728 9,011 3,662 840 7,722
£ PVB Money Travel Costs 0 0 0 9815 0 0 0 9807
Public Accounts Cost to broad transport budget £ PVC Central Government 0 0 0 0 0 0 0 0
£ PVC Local Government 3,487 6,975 6,975 13,950 13,950 10,462 10,462 13,950
Indirect Tax £ PVB Indirect Tax Revenues 665 319 22 -1,100 531 283 20 -1,099
Indicative Benefit Cost Ratio Cost to Private Sector £ PVC Private Sector 0 0 0 0 0 0 0 0
Indicative Net Present Value £ NPV 14,922 355 -5,715 -3,039 457 -4,086 -9,343 -3,044
Indicative Economic BCR BCR 5.3 1.1 0.2 0.8 1.0 0.6 0.1 0.8

71 | 162
Table 17 - Package 2 – Express Bus Services (short / medium term), core test vs wait time sensitivity test (component parts)
Assessment Area
Test Component Parts
Core Sensitivity; Wait time Leeds Bradford Harrogate York Leeds Bradford Harrogate York
Impact on the Economy Business Users and Transport Providers £ PVB Time Impacts 1,864 703 150 1,226 423 392 0 1,568
£ PVB Money Travel Costs 0 0 0 318 0 0 0 323
£ PVB Revenue 4,276 2,054 141 -7,076 943 1,210 0 -6,817
Greenhouse Gases £ PVB Not quantified
Impact on the Society Non-business Users £ PVB Time Impacts 11,604 4,254 947 7,728 2,630 2,383 0 9,882
£ PVB Money Travel Costs 0 0 0 9,815 0 0 0 9,966
Public Accounts Cost to broad transport budget £ PVC Central Government 0 0 0 0 0 0 0 0
£ PVC Local Government 3,487 6,975 6,975 13,950 3,487 6,975 6,975 13,950
Indirect Tax £ PVB Indirect Tax Revenues 665 319 22 -1,100 147 188 0 -1,060
Indicative Benefit Cost Ratio Cost to Private Sector £ PVC Private Sector 0 0 0 0 0 0 0 0
Indicative Net Present Value £ NPV 14,922 355 -5,715 -3,039 656 -2,802 -6,975 -88
Indicative Economic BCR BCR 5.3 1.1 0.2 0.8 1.2 0.6 0.0 1.0
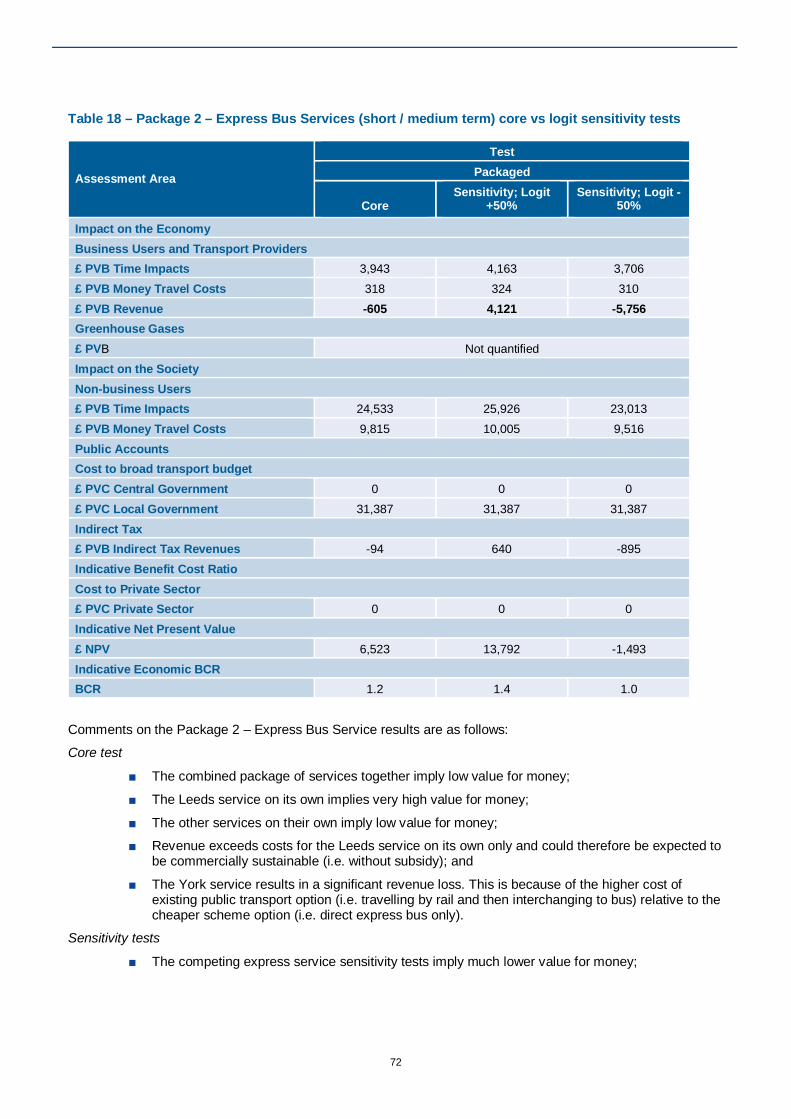
72
Table 18 – Package 2 – Express Bus Services (short / medium term) core vs logit sensitivity tests
Assessment Area
Test Packaged
Core Sensitivity; Logit
+50% Sensitivity; Logit -
50%
Impact on the Economy Business Users and Transport Providers £ PVB Time Impacts 3,943 4,163 3,706 £ PVB Money Travel Costs 318 324 310 £ PVB Revenue -605 4,121 -5,756 Greenhouse Gases £ PVB Not quantified Impact on the Society Non-business Users £ PVB Time Impacts 24,533 25,926 23,013 £ PVB Money Travel Costs 9,815 10,005 9,516 Public Accounts Cost to broad transport budget £ PVC Central Government 0 0 0 £ PVC Local Government 31,387 31,387 31,387 Indirect Tax £ PVB Indirect Tax Revenues -94 640 -895 Indicative Benefit Cost Ratio Cost to Private Sector £ PVC Private Sector 0 0 0 Indicative Net Present Value £ NPV 6,523 13,792 -1,493 Indicative Economic BCR BCR 1.2 1.4 1.0
Comments on the Package 2 – Express Bus Service results are as follows:
Core test
The combined package of services together imply low value for money;
The Leeds service on its own implies very high value for money;
The other services on their own imply low value for money;
Revenue exceeds costs for the Leeds service on its own only and could therefore be expected to be commercially sustainable (i.e. without subsidy); and
The York service results in a significant revenue loss. This is because of the higher cost of existing public transport option (i.e. travelling by rail and then interchanging to bus) relative to the cheaper scheme option (i.e. direct express bus only).
Sensitivity tests
The competing express service sensitivity tests imply much lower value for money;

73
Changing the wait time assumptions (i.e. capping wait times at 7.5 minutes in both the base case and the do something scenario) significantly reduces the benefits because there is less potential for wait time to be reduced for passengers when the scheme is introduced, for example the Leeds service on its own goes down to low value for money; and
Using a different set of logit choice parameters has a relatively minor impact, changing the parameters by 50% changes the benefits by 17%
Heavy Rail – Horsforth to LBIA
Table 109 below presents the Heavy Rail – Horsforth to LBIA results in terms of the core and sensitivity tests.
Table 109 - Heavy Rail – Horsforth to LBIA (short / medium term) core vs sensitivity tests
Assessment Area
Test
Core Sensitivity; 10
minute Interchange Penalty
Sensitivity; In vehicle time
Impact on the Economy Business Users and Transport Providers £ PVB Time Impacts 2,499 -11 5,844 £ PVB Money Travel Costs -85 -14 -125 £ PVB Revenue 7,081 -301 13,863 Greenhouse Gases £ PVB Not quantified Impact on the Society Non-business Users £ PVB Time Impacts 15,523 -64 36,472 £ PVB Money Travel Costs -2,725 -459 -4,003 Public Accounts Cost to broad transport budget £ PVC Central Government 0 0 0 £ PVC Local Government 75,181 75,181 75,181 Indirect Tax £ PVB Indirect Tax Revenues 1,101 -46 2,156 Indicative Benefit Cost Ratio Cost to Private Sector £ PVC Private Sector 0 0 0 Indicative Net Present Value £ NPV -51,787 -76,076 -20,974 Indicative Economic BCR BCR 0.3 -0.0 0.7
Comments on the Heavy Rail – Horsforth to LBIA results are as follows:
Core test
The core test implies poor value for money; and
Revenues do not exceed costs.

74
Sensitivity tests
Assuming a 10 minute interchange penalty significantly reduces the benefits; and
Including an in-vehicle time factor significantly increase the benefits (it approximately doubles the benefits), but still poor value for money.
LBIA Parkway Station
Table 20 below presents the LBIA Parkway Station results in terms of the core and sensitivity tests.
Table 20 - LBIA Parkway Station (short / medium term) core versus sensitivity tests
Assessment Area
Test
Core
Sensitivity; 10 minute Interchange
Penalty Sensitivity; In vehicle time
Impact on the Economy Business Users and Transport Providers £ PVB Time Impacts -9 -11 930 £ PVB Money Travel Costs -15 -14 -43 £ PVB Revenue -269 -301 1,565 Greenhouse Gases £ PVB Not quantified Impact on the Society Non-business Users £ PVB Time Impacts -52 -64 5,744 £ PVB Money Travel Costs -490 -459 -1,366 Public Accounts Cost to broad transport budget £ PVC Central Government 0 0 0 £ PVC Local Government 10,629 10,629 10,629 Indirect Tax £ PVB Indirect Tax Revenues 1,024 -47 220 Indicative Benefit Cost Ratio Cost to Private Sector £ PVC Private Sector 0 0 0 Indicative Net Present Value £ NPV -10,440 -11,525 -3,579 Indicative Economic BCR BCR 0.0 -0.1 0.7
Comments on the LBIA Parkway Station results are as follows:
Core test
The core test implies poor value for money; and
Revenues do not exceed costs.

75
Sensitivity tests
Assuming a 10 minute interchange penalty marginally reduces the benefits; and
Including an in-vehicle time factor significantly increase the benefits and the indicative BCR, but still implies poor value for money.
Heavy Rail – Guiseley – LBIA - Horsforth Table 1 below presents the Heavy Rail – Guiseley – LBIA – Horsforth results in terms of the core and sensitivity tests
Table 21 - Heavy Rail – Guiseley – LBIA – Horsforth (long term) core versus sensitivity tests
Assessment Area
Test
Core
Sensitivity; 10 minute Interchange
Penalty Sensitivity; In vehicle time
Impact on the Economy Business Users and Transport Providers £ PVB Time Impacts 3,324 -82 7,494 £ PVB Money Travel Costs -96 -3 -138 £ PVB Revenue 8,950 -287 16,627 Greenhouse Gases £ PVB Not quantified Impact on the Society Non-business Users £ PVB Time Impacts 20,474 -503 46,300 £ PVB Money Travel Costs -3,046 -93 -4,361 Public Accounts Cost to broad transport budget £ PVC Central Government 0 0 0 £ PVC Local Government 143,932 143,932 143,932 Indirect Tax £ PVB Indirect Tax Revenues 1,390 -44 2,583 Indicative Benefit Cost Ratio Cost to Private Sector £ PVC Private Sector 0 0 0 Indicative Net Present Value £ NPV -112,936 -144,944 -75,427 Indicative Economic BCR BCR 0.2 -0.0 0.5
Comments on the Heavy Rail – Guiseley – LBIA – Horsforth results are as follows:
Core test
The core test implies poor value for money; and
Revenues do not exceed costs.

76
Sensitivity tests
Assuming a 10 minute interchange penalty significantly reduces the benefits; and
Including an in-vehicle time factor significantly increase the benefits (it approximately doubles the benefits), but still poor value for money.
Generalised Cost Components 10.5Figures 33 to Figure 43 show the modelled generalised cost component parts for each of the core schemes. The results for each year and scenario are presented as an aggregation of the AM, IP and PM generalised costs averaged using the annualisation factor proportions.
Perceived (Perc) elements are shown in terms of their difference from the actual (Act) elements. So for example where the actual wait time is 1 minute, and the perceived wait time is 2.85 minutes, the charts show the actual wait time as 1 minute and the perceived as 2.85 - 1 minute = 1.85 minutes.
Perceived wait and transfer times include weight factors and boarding / transfer penalties from the Leeds Public Transport model.
Package 2 – Express Bus Services
Figure 33 - Package 2 – Express Bus Services: Leeds Service (Short / Med Term)
010203040
5060708090
100
2016_DM 2016_DS 2031_DM 2031_DS
Gen
eral
ised
Cos
t (m
in)
Year / Scenario
Transfer +Perc
Transfer Act
Fare
Transit +Perc
Transit Act
Wait +Perc
Wait Act
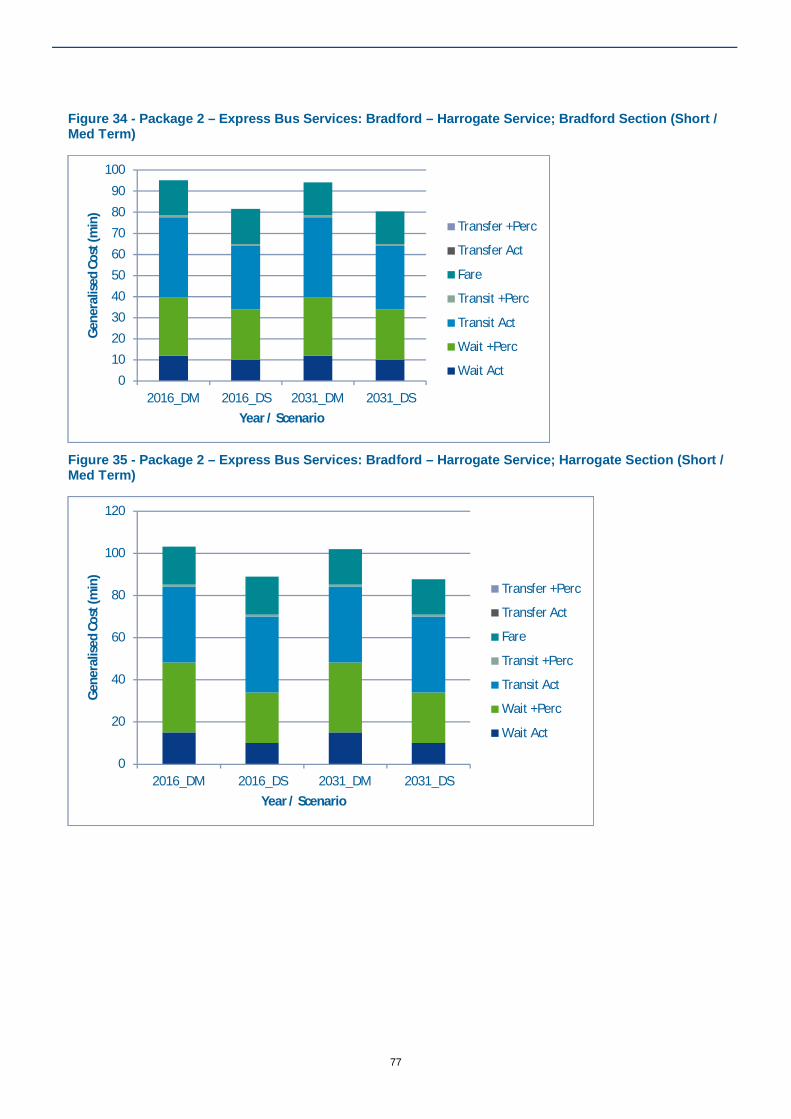
77
Figure 34 - Package 2 – Express Bus Services: Bradford – Harrogate Service; Bradford Section (Short / Med Term)
Figure 35 - Package 2 – Express Bus Services: Bradford – Harrogate Service; Harrogate Section (Short / Med Term)
0102030405060708090
100
2016_DM 2016_DS 2031_DM 2031_DS
Gen
eral
ised
Cos
t (m
in)
Year / Scenario
Transfer +Perc
Transfer Act
Fare
Transit +Perc
Transit Act
Wait +Perc
Wait Act
0
20
40
60
80
100
120
2016_DM 2016_DS 2031_DM 2031_DS
Gen
eral
ised
Cos
t (m
in)
Year / Scenario
Transfer +Perc
Transfer Act
Fare
Transit +Perc
Transit Act
Wait +Perc
Wait Act
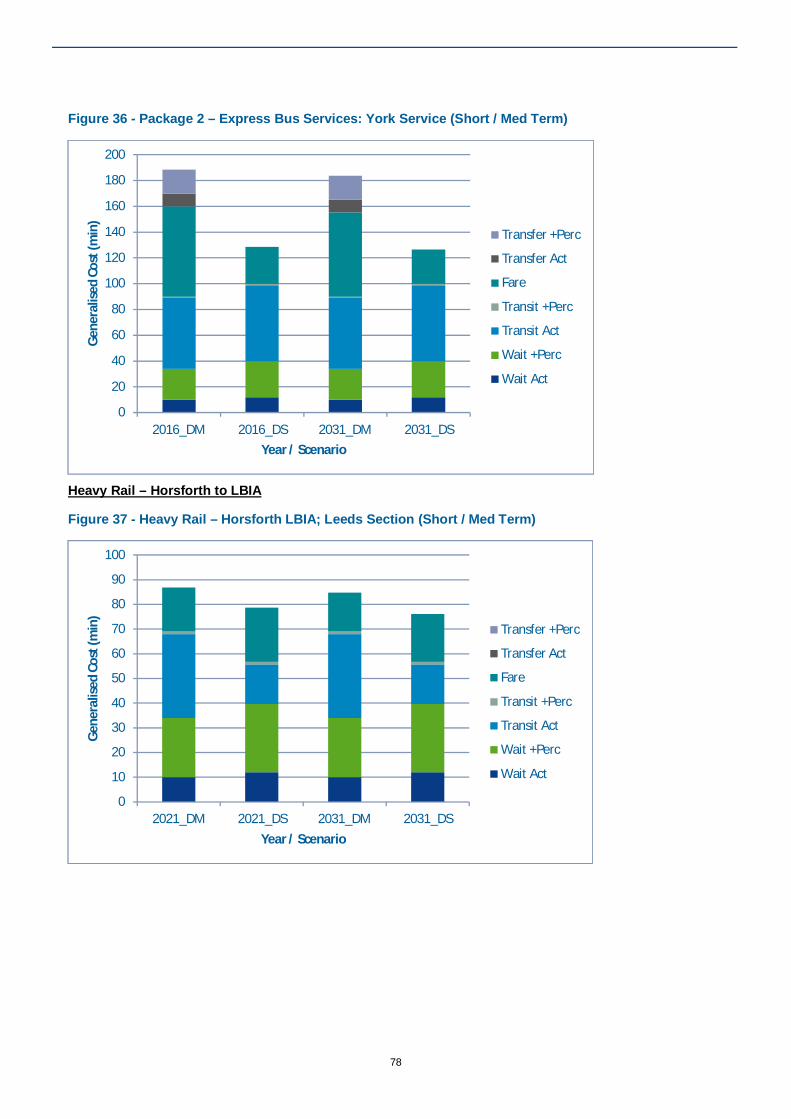
78
Figure 36 - Package 2 – Express Bus Services: York Service (Short / Med Term)
Heavy Rail – Horsforth to LBIA
Figure 37 - Heavy Rail – Horsforth LBIA; Leeds Section (Short / Med Term)
0
20
40
60
80
100
120
140
160
180
200
2016_DM 2016_DS 2031_DM 2031_DS
Gen
eral
ised
Cos
t (m
in)
Year / Scenario
Transfer +Perc
Transfer Act
Fare
Transit +Perc
Transit Act
Wait +Perc
Wait Act
0
10
20
30
40
50
60
70
80
90
100
2021_DM 2021_DS 2031_DM 2031_DS
Gen
eral
ised
Cos
t (m
in)
Year / Scenario
Transfer +Perc
Transfer Act
Fare
Transit +Perc
Transit Act
Wait +Perc
Wait Act
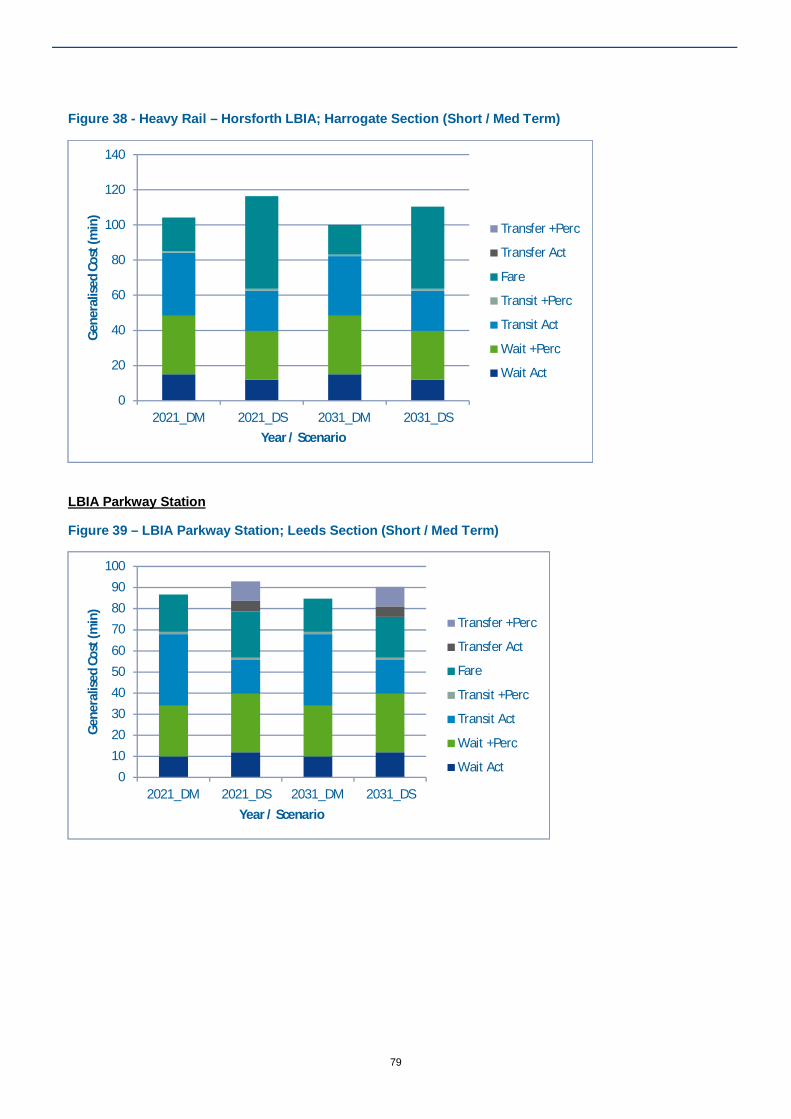
79
Figure 38 - Heavy Rail – Horsforth LBIA; Harrogate Section (Short / Med Term)
LBIA Parkway Station
Figure 39 – LBIA Parkway Station; Leeds Section (Short / Med Term)
0
20
40
60
80
100
120
140
2021_DM 2021_DS 2031_DM 2031_DS
Gen
eral
ised
Cos
t (m
in)
Year / Scenario
Transfer +Perc
Transfer Act
Fare
Transit +Perc
Transit Act
Wait +Perc
Wait Act
0102030405060
708090
100
2021_DM 2021_DS 2031_DM 2031_DS
Gen
eral
ised
Cos
t (m
in)
Year / Scenario
Transfer +Perc
Transfer Act
Fare
Transit +Perc
Transit Act
Wait +Perc
Wait Act

80
Figure 40 – LBIA Parkway Station; Harrogate Section (Short / Med Term)
Heavy Rail – Guiseley – LBIA - Horsforth
Figure 41 - Heavy Rail – Guiseley – LBIA – Horsforth; Leeds Section (Long Term)
0
20
40
60
80
100
120
140
2021_DM 2021_DS 2031_DM 2031_DS
Gen
eral
ised
Cos
t (m
in)
Year / Scenario
Transfer +Perc
Transfer Act
Fare
Transit +Perc
Transit Act
Wait +Perc
Wait Act
0
10
20
30
40
50
60
70
80
90
100
2026_DM 2026_DS 2031_DM 2031_DS
Gen
eral
ised
Cos
t (m
in)
Year / Scenario
Transfer +Perc
Transfer Act
Fare
Transit +Perc
Transit Act
Wait +Perc
Wait Act

81
Figure 42 - Heavy Rail – Guiseley – LBIA – Horsforth; Bradford Section (Long Term)
Figure 43 - Heavy Rail – Guiseley – LBIA – Horsforth; Harrogate Section (Long Term)
0
20
40
60
80
100
120
2026_DM 2026_DS 2031_DM 2031_DS
Gen
eral
ised
Cos
t (m
in)
Year / Scenario
Transfer +Perc
Transfer Act
Fare
Transit +Perc
Transit Act
Wait +Perc
Wait Act
0
20
40
60
80
100
120
140
2026_DM 2026_DS 2031_DM 2031_DS
Gen
eral
ised
Cos
t (m
in)
Year / Scenario
Transfer +Perc
Transfer Act
Fare
Transit +Perc
Transit Act
Wait +Perc
Wait Act
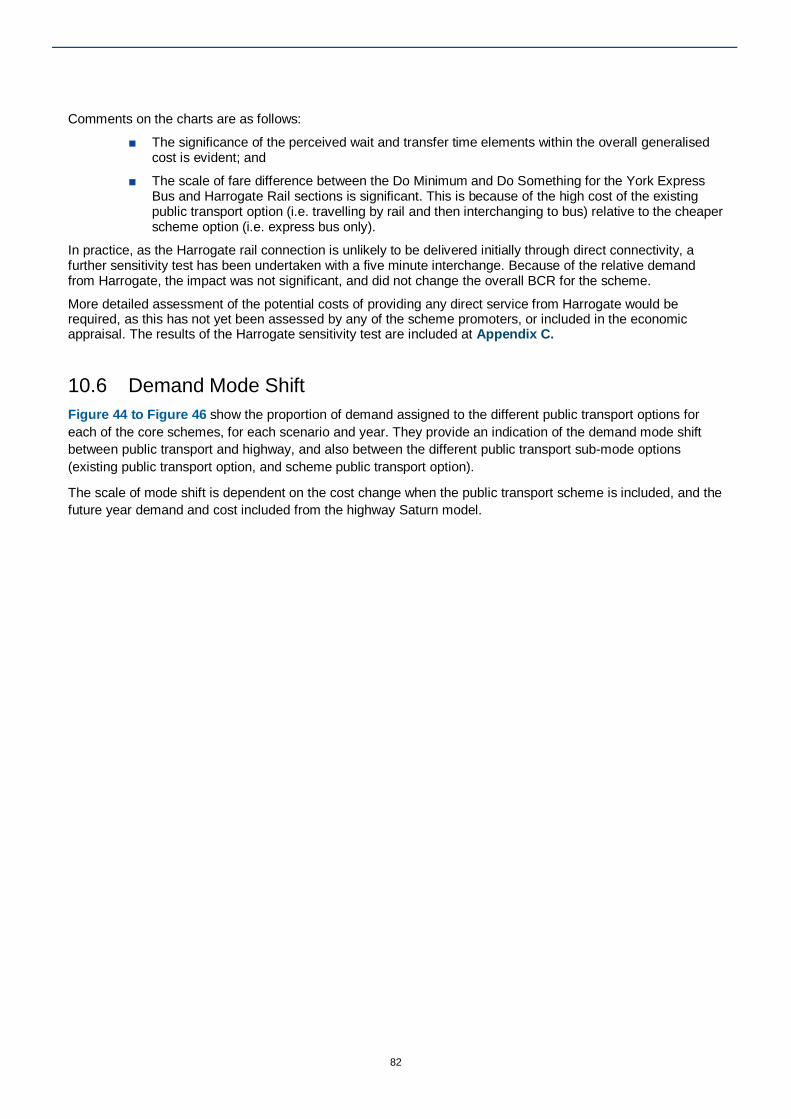
82
Comments on the charts are as follows:
The significance of the perceived wait and transfer time elements within the overall generalised cost is evident; and
The scale of fare difference between the Do Minimum and Do Something for the York Express Bus and Harrogate Rail sections is significant. This is because of the high cost of the existing public transport option (i.e. travelling by rail and then interchanging to bus) relative to the cheaper scheme option (i.e. express bus only).
In practice, as the Harrogate rail connection is unlikely to be delivered initially through direct connectivity, a further sensitivity test has been undertaken with a five minute interchange. Because of the relative demand from Harrogate, the impact was not significant, and did not change the overall BCR for the scheme.
More detailed assessment of the potential costs of providing any direct service from Harrogate would be required, as this has not yet been assessed by any of the scheme promoters, or included in the economic appraisal. The results of the Harrogate sensitivity test are included at Appendix C.
Demand Mode Shift 10.6Figure 44 to Figure 46 show the proportion of demand assigned to the different public transport options for each of the core schemes, for each scenario and year. They provide an indication of the demand mode shift between public transport and highway, and also between the different public transport sub-mode options (existing public transport option, and scheme public transport option).
The scale of mode shift is dependent on the cost change when the public transport scheme is included, and the future year demand and cost included from the highway Saturn model.
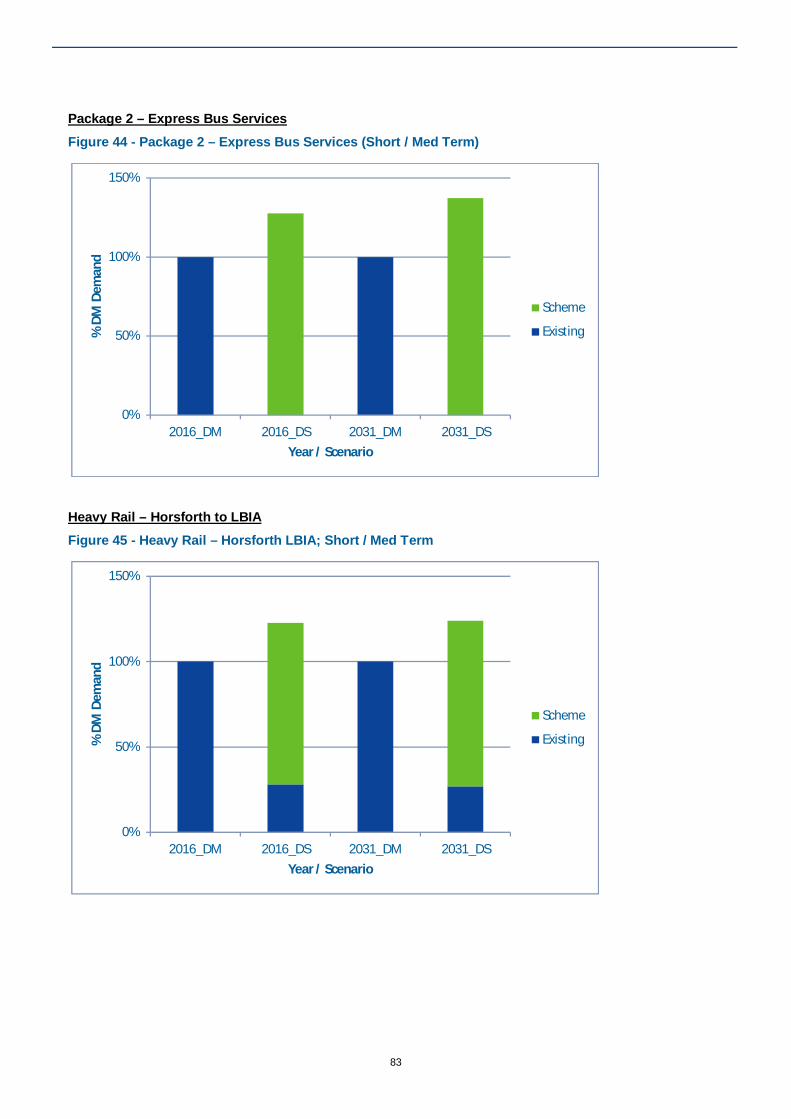
83
Package 2 – Express Bus Services Figure 44 - Package 2 – Express Bus Services (Short / Med Term)
Heavy Rail – Horsforth to LBIA Figure 45 - Heavy Rail – Horsforth LBIA; Short / Med Term
0%
50%
100%
150%
2016_DM 2016_DS 2031_DM 2031_DS
% D
M D
eman
d
Year / Scenario
Scheme
Existing
0%
50%
100%
150%
2016_DM 2016_DS 2031_DM 2031_DS
% D
M D
eman
d
Year / Scenario
Scheme
Existing

84
Heavy Rail – Guiseley – LBIA – Horsforth Figure 46 - Heavy Rail – Guiseley – LBIA – Horsforth; Long Term
Comments on the charts are as follows:
The Package 2 Express Bus Services are upgrades to the existing services therefore there is no sub mode choice and 100% of demand is allocated to the Do Something (scheme) option; and
The scale of mode shift is reflective of the scale of benefits.
Demand Response Sensitivity 10.7Demand response for the public transport modelling has been undertaken using logit choice. Use of elasticities was also considered, although this was considered a less robust approach. Nevertheless elasticities have been used in hindsight as a sensitivity test / benchmarking the logit choice demand response.
The following elasticities have been sourced from the rail Passenger Demand Forecasting Handbook (PDFH) version 5.1
For forecasting demand based on Generalised Journey Time (GJT), Non-London flows up to 20 miles, -1.1 for both season and other ticket types; and
For forecasting demand based on fares, Non-London flows less than 20 miles, -0.4 and -0.7 for season and other types respectively.
These have been applied following the method described in PDFH to generate demand response. The following charts at Figure 47 – Figure 49 compare the logit choice versus the elasticity approach.
0%
50%
100%
150%
2016_DM 2016_DS 2031_DM 2031_DS
% D
M D
eman
d
Year / Scenario
Scheme
Existing
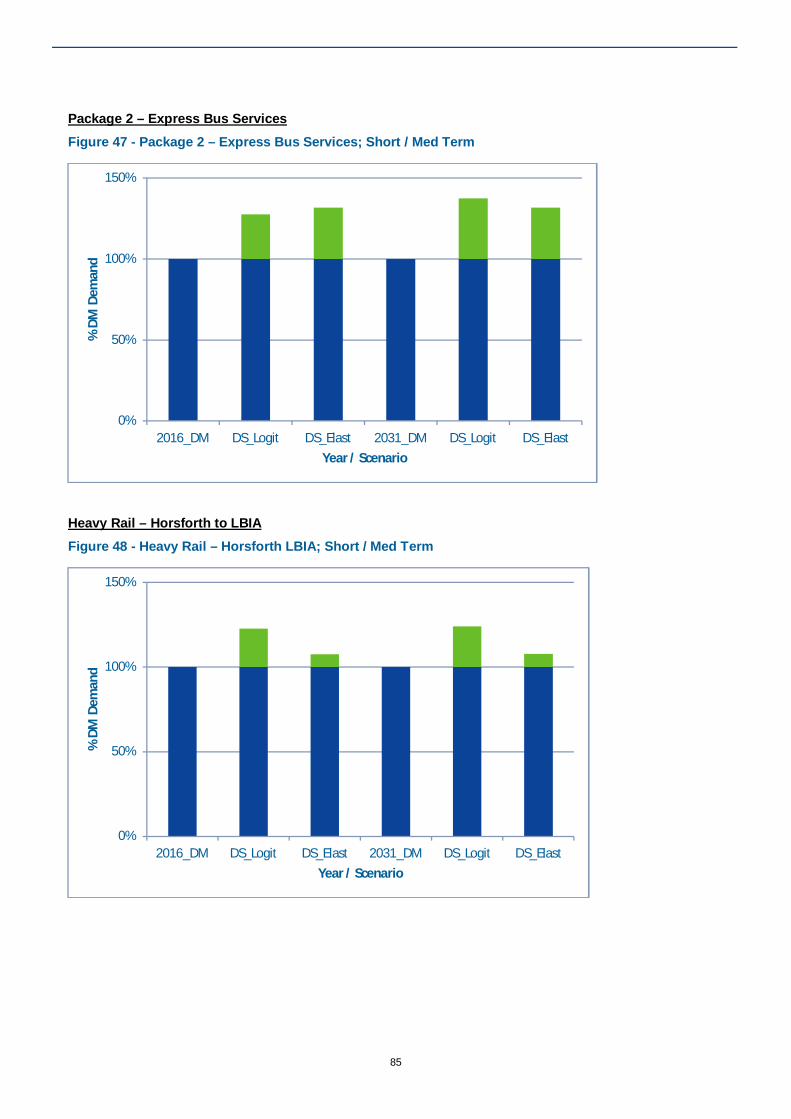
85
Package 2 – Express Bus Services Figure 47 - Package 2 – Express Bus Services; Short / Med Term
Heavy Rail – Horsforth to LBIA Figure 48 - Heavy Rail – Horsforth LBIA; Short / Med Term
0%
50%
100%
150%
2016_DM DS_Logit DS_Elast 2031_DM DS_Logit DS_Elast
% D
M D
eman
d
Year / Scenario
0%
50%
100%
150%
2016_DM DS_Logit DS_Elast 2031_DM DS_Logit DS_Elast
% D
M D
eman
d
Year / Scenario

86
Heavy Rail – Guiseley – LBIA - Horsforth Figure 49 - Heavy Rail – Guiseley – LBIA – Horsforth; Long Term
Comments on the charts are as follows:
The Package 2 – Express Bus Services test shows a broadly similar scale of demand response;
The rail options show a significantly lower response using the elasticity approach; and
The logit choice approach is very much driven by the highway generalised cost and demand inputs, whereas the elasticity approach is not.
The conclusion of this test is that the elasticity approach results in less mode shift between highway and public transport, and between bus and rail, providing a different outcome to the logit choice approach. This is only marginal for the express bus options, but more noticeably for the rail options. However the logit approach has been used for the tests because it is considered to more accurately reflect mode shift response represented in the model, and provides a better, more realistic, outcome for rail.
Summary 10.8The summary of the public transport appraisal is as follows:
Core tests
The core tests imply either low or poor Value for Money (VfM).
Bus
The Express Bus Services Package performs better than most individual components (but with low VfM);
For the Express Bus Service Package, unpacking the component parts reveals the following:
The Leeds service implies very high VfM;
The Bradford, Harrogate and York services imply low or poor VfM;
0%
50%
100%
150%
2016_DM DS_Logit DS_Elast 2031_DM DS_Logit DS_Elast
% D
M D
eman
d
Year / Scenario

87
In terms of revenue;
Only the Leeds service revenues exceed the costs; and
The York service revenues represent a significant loss due to the difference between the existing rail interchanging to bus option fare, and the scheme bus only option fare (the latter is significantly less). This is consistent with previous experience of actual service operation.
Rail
The Heavy Rail – Horsforth to LBIA (short / medium term) generates the highest indicative BCR. However the Heavy Rail – Guiseley – LBIA - Horsforth (long term) generates a indicative BCR of similar scale, but marginally lower;
The Parkway Station indicative BCR performs worst, due to the higher proportion of wait time and interchange penalty;
All revenues are less than costs.
Sensitivity Tests
Bus
The competing service sensitivity tests imply much lower value for money;
Changing the wait time assumptions (i.e. increasing the wait time) significantly reduced the value for money, for example the Leeds service on its own implies low VfM; and
Using a different set of logit choice parameters has a relatively minor impact, changing the parameters by 50% changes the benefits by approximately 17%
Rail
Assuming a 10 minute interchange penalty significantly reduces the benefits; and
Including an in-vehicle time factor significantly increase the benefits, approximately doubling the benefits for the Heavy Rail – Horsforth to LBIA (short / medium term) and Heavy Rail – Horsforth to LBIA (long term) but both still imply poor VfM.
Conclusions
In summary the core public transport schemes perform relatively poorly in terms of indicative BCR and implied VfM. The Package 2 – Express Bus Services perform best and the rail services worst. Of the Express Bus Service elements, the Leeds service performs best and in fact on its own implies a very high VfM. The Bradford service shows the potential to provide a positive financial and economic case.
A series of sensitivity and benchmarking tests have been carried out to understand model uncertainty. These have tested alternative assumptions in terms of changes to the scheme and modelling parameter assumptions. Changes to demand and fares have not been tested, however earlier commentary has been provided describing how both demand and fare input data has been benchmarked against other sources.
The results of the sensitivity tests (and which option they apply to) have been interpreted as follows:
Express Bus competing services – running competing services results in a significantly higher cost and therefore lower VfM. It would also have a detrimental abstractive effect on the existing bus services. It is considered unlikely that the scheme would be taken forward under this assumption, however a useful test to understand the impact on the results;
Logit Choice parameter (test based on Package 2 – Express Bus) – the impact of using alternative logit parameters are evident, but only has a relatively small impact on the scheme benefits. The conclusion is that there is only a small degree of uncertainty associated;
Wait curve (test based on Package 2 – Express Bus) – the alternative wait time test has revealed that there is a significant degree of uncertainty associated. The alternative assumptions used in the sensitivity test resulted in significantly lower indicative BCR’s for the majority of schemes;

88
Interchange penalty (test based on rail options) – assuming a 10 minute interchange penalty for the rail scheme, with a connecting rail shuttle service between Horsforth, LBIA and Guiseley station rather than direct services connecting the airport, has a significant negative impact on the scheme benefits;
In vehicle time (test based on rail options) – the core modelling does not account for peoples preference for rail over bus, due to the robustness of any assumption considered within the study scope. Including as sensitivity based on factors used in a previous study results in a significant increase in the scheme benefits, highlighting a significant degree of uncertainty; and
As a demand response sensitivity an elasticity approach as opposed to logit choice was tested. The charts presented show demand response of a broadly similar scale for Express Bus Services, but significantly less for the rail schemes. Using elasticities is considered a less robust approach, and therefore the outcome of this test does not necessarily highlight a significant level of uncertainty in the modelling. However it is worth noting that the outputs of the logit choice mechanism are very much dependent on the highway generalised cost and demand inputs, which does flag up a degree of uncertainty.
The scale of demand allocation between the existing and scheme options (sub mode level) shown in the demand mode shift charts appears sensible.
Demand and fares were not tested, however the following conclusions have been drawn based on the benchmarking exercise undertaken:
Demand – The demand used for the study represented passenger boardings over the period December 2013 to June 2014 (data supplied by the current operator, Yorkshire Tiger). Demand representing a smaller sample was later provided by WYCA as a means of benchmarking. The outcome was that the study demand might be under-represented to a certain extent, highlighting a degree of uncertainty in the modelling, but also bearing in mind the scope of data captured in the two data sets.
Further to this, one of the model limitations is that it captures the demand impacts only between the locations modelled (i.e. between the locations of Leeds, Bradford, Harrogate, and the LBIA) and not intermediate trips. The impacts on passenger not accessing LBIA, but still using the schemes are not captured, and this has a potential to improve the economic performance and BCR; and
Fares – The model fares represent all ticket types. As a benchmark these were compared against actual half return adult fares to reveal the scale of difference. The conclusion was that there is only negligible difference and that there is only low level uncertainty in the modelling of fares, but this could also improve economic performance, particularly considering there could be a larger proportion of adult single fares on journeys to the airport which would raise the average fare. As an aside, the charts presenting the breakdown of generalised cost components reveals the significance of the Harrogate rail fare compared to bus.
On balance therefore the modelling provides a simplistic representation of the impacts of the schemes on passengers accessing LBIA. However the above conclusions highlight a number of modelling uncertainties, some more significant than others, that could have a material impact on the outcome.
Significant findings were as follows:
The wait curve sensitivity reduced benefits;
The in-vehicle time sensitivity increased benefits; and
The use of an elasticity approach reduced benefits.
However, all of the public transport schemes have been modelled using the same approach which ensures that there is a degree of certainty in the comparative performance of scheme to one another. Therefore if the modelling assumptions change, while the scale of benefits might change, the relative scheme performance is perhaps less likely to change. The approach taken to the modelling has also taken account of project scope bearing in mind the stage of scheme appraisal and proportionality.
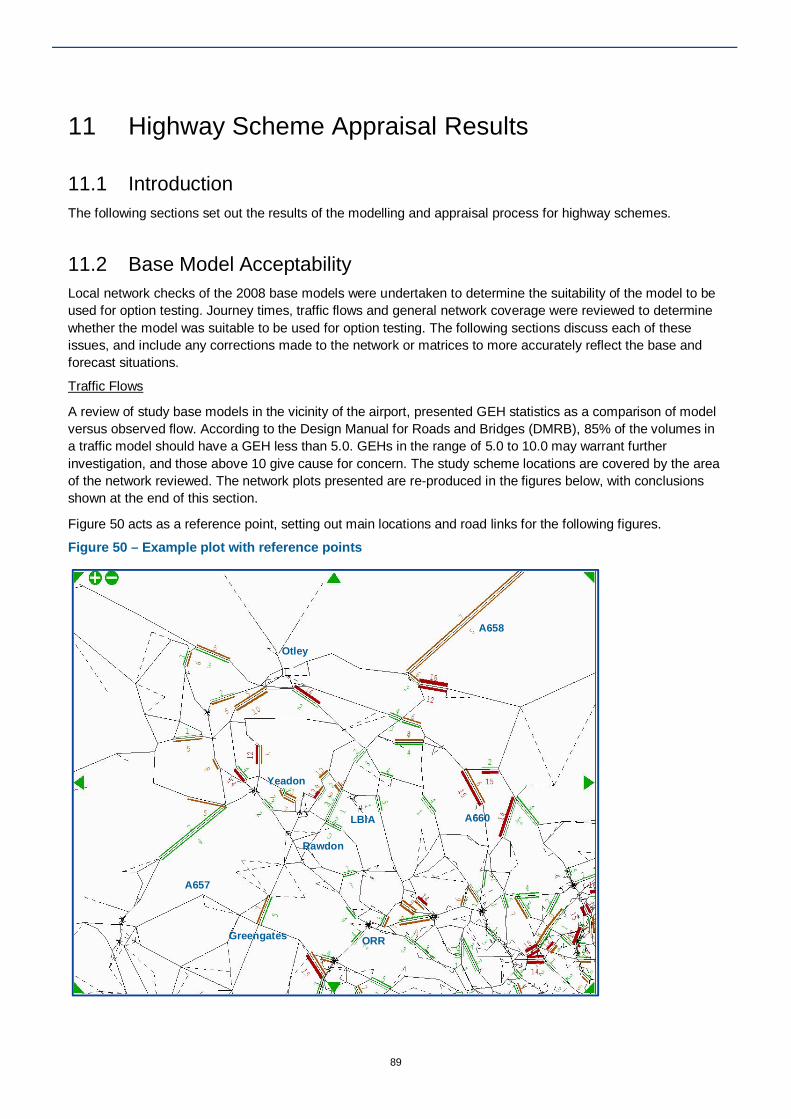
89
Highway Scheme Appraisal Results 11
Introduction 11.1The following sections set out the results of the modelling and appraisal process for highway schemes.
Base Model Acceptability 11.2Local network checks of the 2008 base models were undertaken to determine the suitability of the model to be used for option testing. Journey times, traffic flows and general network coverage were reviewed to determine whether the model was suitable to be used for option testing. The following sections discuss each of these issues, and include any corrections made to the network or matrices to more accurately reflect the base and forecast situations.
Traffic Flows
A review of study base models in the vicinity of the airport, presented GEH statistics as a comparison of model versus observed flow. According to the Design Manual for Roads and Bridges (DMRB), 85% of the volumes in a traffic model should have a GEH less than 5.0. GEHs in the range of 5.0 to 10.0 may warrant further investigation, and those above 10 give cause for concern. The study scheme locations are covered by the area of the network reviewed. The network plots presented are re-produced in the figures below, with conclusions shown at the end of this section.
Figure 50 acts as a reference point, setting out main locations and road links for the following figures.
Figure 50 – Example plot with reference points
A660
A658
A657
LBIA
Greengates
Otley
ORR
Rawdon
Yeadon
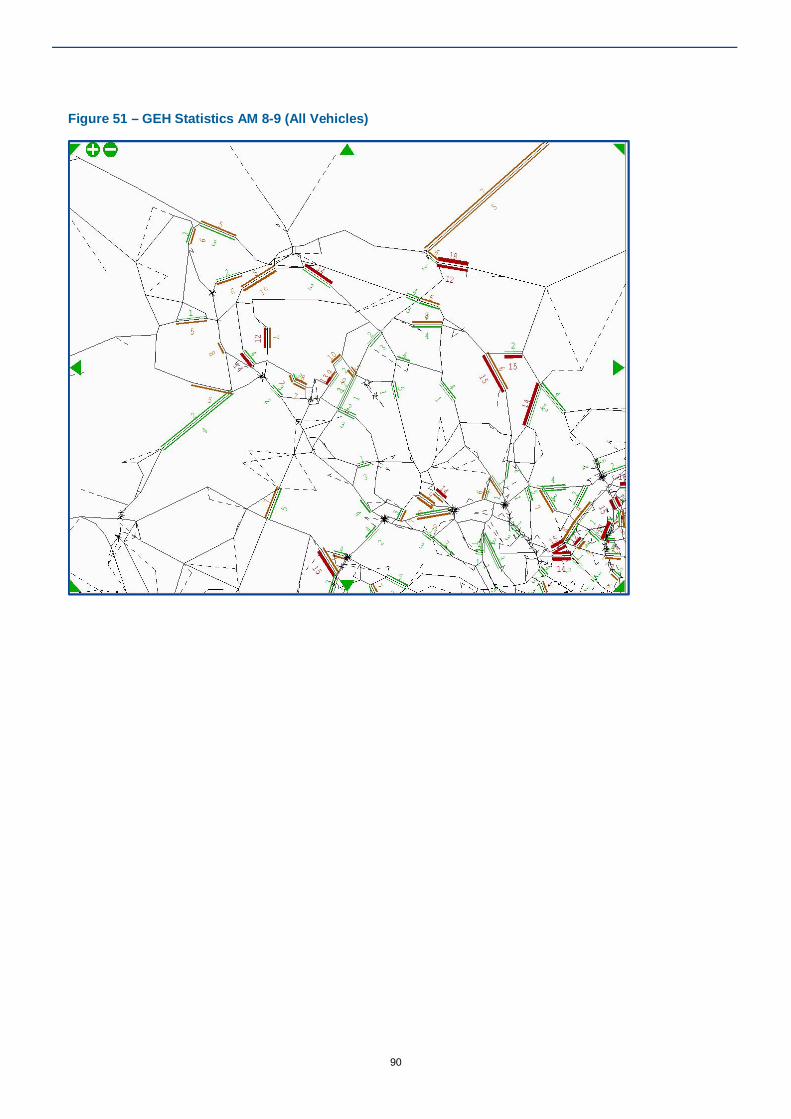
90
Figure 51 – GEH Statistics AM 8-9 (All Vehicles)
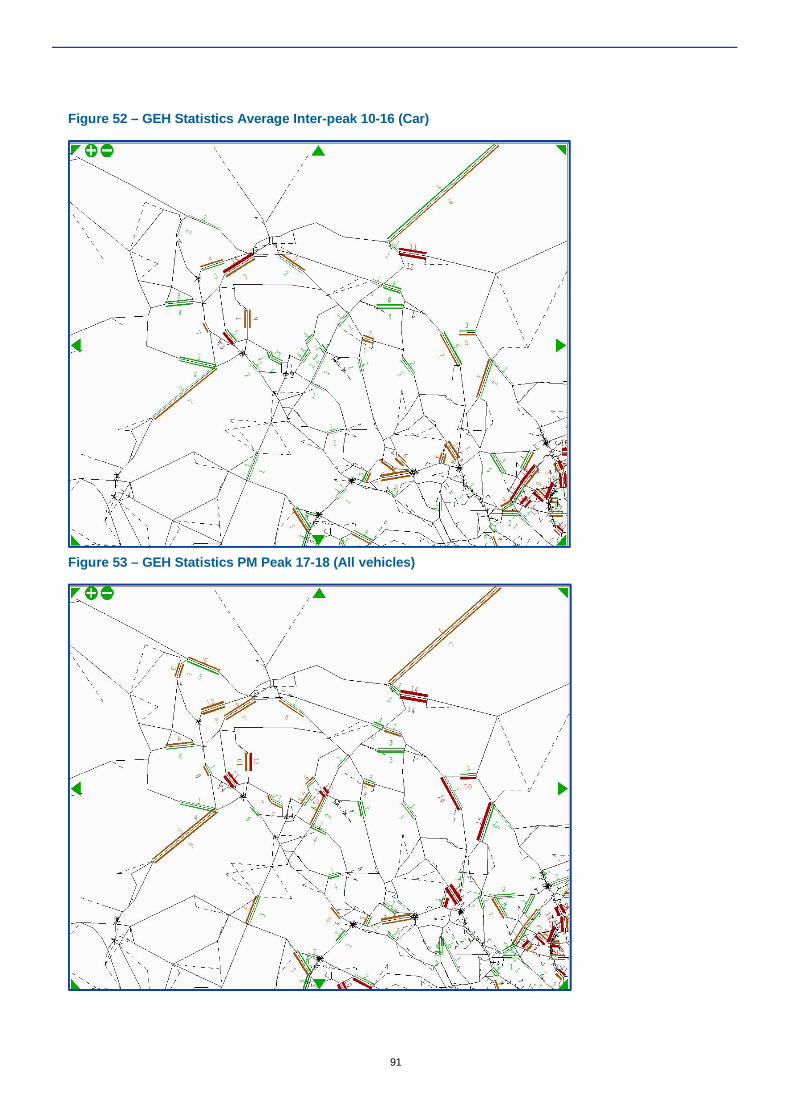
91
Figure 52 – GEH Statistics Average Inter-peak 10-16 (Car)
Figure 53 – GEH Statistics PM Peak 17-18 (All vehicles)
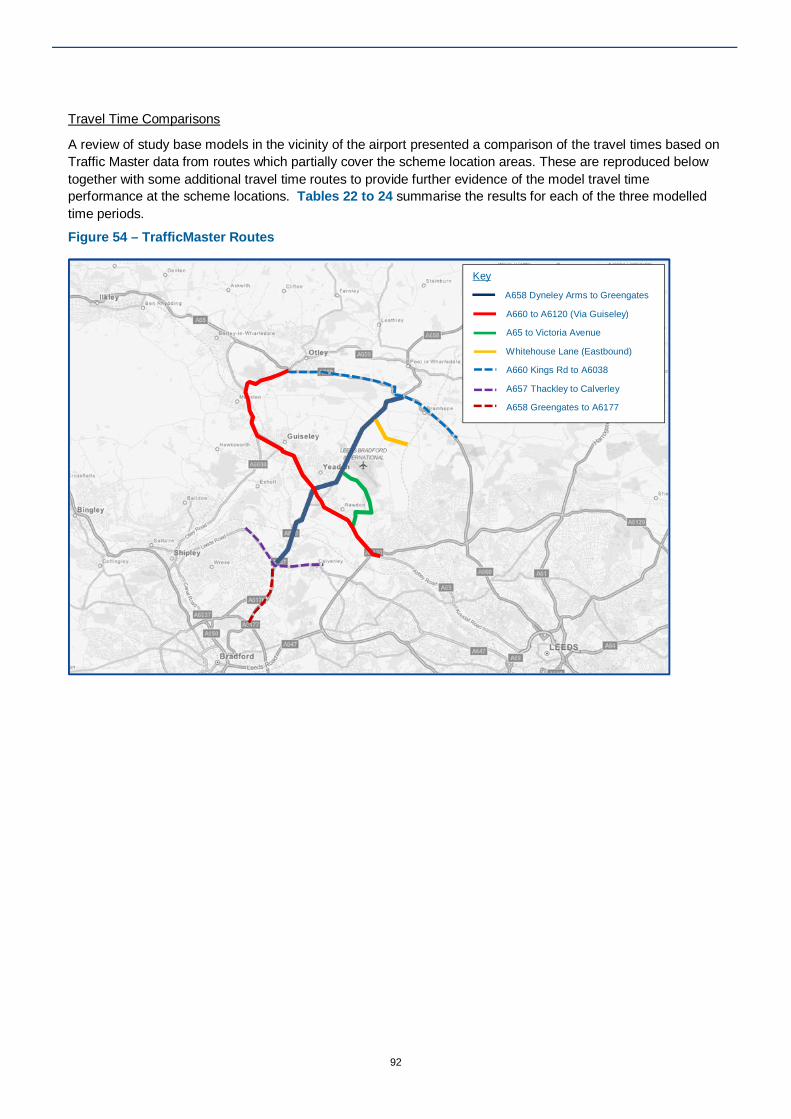
92
Travel Time Comparisons
A review of study base models in the vicinity of the airport presented a comparison of the travel times based on Traffic Master data from routes which partially cover the scheme location areas. These are reproduced below together with some additional travel time routes to provide further evidence of the model travel time performance at the scheme locations. Tables 22 to 24 summarise the results for each of the three modelled time periods.
Figure 54 – TrafficMaster Routes
Key
A658 Dyneley Arms to Greengates
A660 to A6120 (Via Guiseley)
A65 to Victoria Avenue
Whitehouse Lane (Eastbound)
A660 Kings Rd to A6038
A657 Thackley to Calverley A658 Greengates to A6177
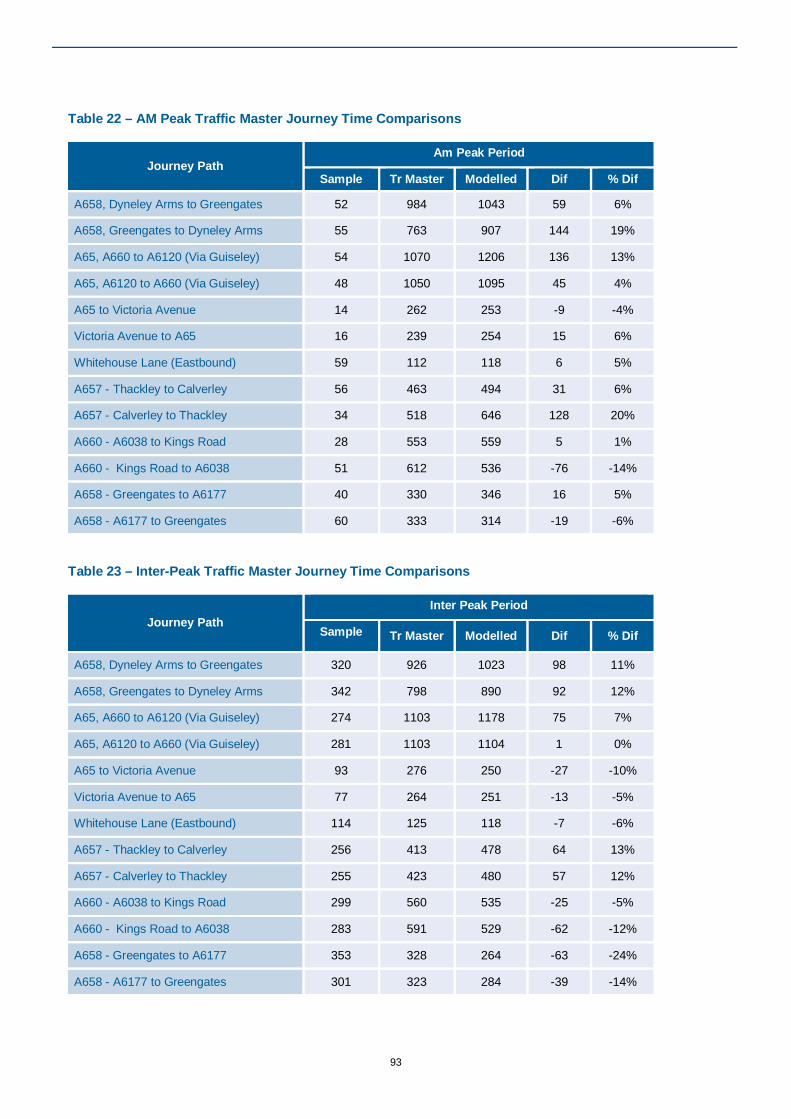
93
Table 22 – AM Peak Traffic Master Journey Time Comparisons
Journey Path Am Peak Period
Sample Tr Master
Modelled Dif % Dif
A658, Dyneley Arms to Greengates 52 984 1043 59 6%
A658, Greengates to Dyneley Arms 55 763 907 144 19%
A65, A660 to A6120 (Via Guiseley) 54 1070 1206 136 13%
A65, A6120 to A660 (Via Guiseley) 48 1050 1095 45 4%
A65 to Victoria Avenue 14 262 253 -9 -4%
Victoria Avenue to A65 16 239 254 15 6%
Whitehouse Lane (Eastbound) 59 112 118 6 5%
A657 - Thackley to Calverley 56 463 494 31 6%
A657 - Calverley to Thackley 34 518 646 128 20%
A660 - A6038 to Kings Road 28 553 559 5 1%
A660 - Kings Road to A6038 51 612 536 -76 -14%
A658 - Greengates to A6177 40 330 346 16 5%
A658 - A6177 to Greengates 60 333 314 -19 -6%
Table 23 – Inter-Peak Traffic Master Journey Time Comparisons
Journey Path Inter Peak Period
Sample Tr Master Modelled Dif % Dif
A658, Dyneley Arms to Greengates 320 926 1023 98 11%
A658, Greengates to Dyneley Arms 342 798 890 92 12%
A65, A660 to A6120 (Via Guiseley) 274 1103 1178 75 7%
A65, A6120 to A660 (Via Guiseley) 281 1103 1104 1 0%
A65 to Victoria Avenue 93 276 250 -27 -10%
Victoria Avenue to A65 77 264 251 -13 -5%
Whitehouse Lane (Eastbound) 114 125 118 -7 -6%
A657 - Thackley to Calverley 256 413 478 64 13%
A657 - Calverley to Thackley 255 423 480 57 12%
A660 - A6038 to Kings Road 299 560 535 -25 -5%
A660 - Kings Road to A6038 283 591 529 -62 -12%
A658 - Greengates to A6177 353 328 264 -63 -24%
A658 - A6177 to Greengates 301 323 284 -39 -14%

94
Table 24 – PM Peak Traffic Master Journey Time Comparisons
Journey Path Pm Peak Period
Sample Tr Master Modelled Dif % Dif
A658, Dyneley Arms to Greengates 45 936 1035 99 11%
A658, Greengates to Dyneley Arms 54 816 937 121 15%
A65, A660 to A6120 (Via Guiseley) 43 1001 1238 237 24%
A65, A6120 to A660 (Via Guiseley) 38 1042 1241 199 19%
A65 to Victoria Avenue 20 274 251 -23 -8%
Victoria Avenue to A65 12 235 254 19 8%
Whitehouse Lane (Eastbound) 18 105 118 13 12%
A657 - Thackley to Calverley 50 450 507 57 11%
A657 - Calverley to Thackley 47 799 496 -303 -61%
A660 - A6038 to Kings Road 52 564 607 43 7%
A660 - Kings Road to A6038 50 644 622 -22 -4%
A658 - Greengates to A6177 35 299 304 5 2%
A658 - A6177 to Greengates 48 511 332 -179 -54%
Model Performance Conclusions
The conclusions on model performance around the area of the proposed A65 to Leeds Bradford International Airport Link Road are summarised below.
Traffic flows on the A65 (to the south) and the A658 (to the north) adjacent to where the scheme joins the existing network are reflected reasonably well.
Travel times are also reflected reasonably well on network supporting traffic that could be expected to use the scheme, the main exception being the A65 / A660 to A6120 (via Guiseley) where the model is 24% slower than the observed data in the PM.
Package 1 consists of junction improvements to four critical junctions along the A658 / B1062 corridor linking the Bradford and Harrogate approaches to the airport. The network suitability around each of the junctions has been reviewed and summarised below.
At the A660 / A658 (Poole Bank Road) traffic flows are reflected reasonably well where there is observed data for comparison against the model on the eastern and western junction arms (A660 Leeds Rd), however the GEH values are marginally greater than 5 on the eastern arm travelling towards Leeds in the AM and away from Leeds in the PM. Further afield the GEH values are poor on the A659 (Arthington Road), and between 5 and 10 in most cases on the A658 north of Pool in Wharfedale across all time periods.
The New Rd / Harrogate Rd (A65 / B6152) and A65 / A658 Roundabout junctions are situated in close proximity to one another. There is no observed data on the network directly connecting the junctions. However there is data further afield on the A658 and A65. Here, the GEH values demonstrate a reasonably good fit with the observed data (as already commented on in the context of the A65 to LBIA link road).

95
At the New Line / Harrogate Rd (Greengates) junction there is data for the northern arm which generally reflect very well, but with an exception for the northbound traffic flow where the GEH is 7 and 8 for the AM and PM respectively.
Travel times on the A658 Dyneley Arms to Greengates section are in the main within 15% of observed data (except for the AM NB where the difference is 19%).
The A658, Greengates to A6177 (in the direction of Bradford centre), is satisfactorily represented in the AM, but less so in the IP and PM. The PM northbound the model is 54% too fast.
The A657, Thackley to Calverley, and which interests the Greengates junction from west to east, is well satisfactorily represented in the IP. In the AM the EB times are 20% too slow. In the PM the WB times are 61% too fast.
The A660, A6038 to Kings Road is satisfactorily represented across all time periods.
The models we are running are the forecast models provided by Leeds. From further interrogation of the model, and LTM Forecasting Report, it is clear that proposed Horsforth roundabout improvements have been included but improvements at Rodley Roundabout have not. A sensitivity test using the Rodley Roundabout improvement coding supplied by LCC has been included at Appendix D.
Do Minimum 11.3Two future year modelled years have been used, based on discussions and subsequent agreements between WSP and the DfT. These agreed years are based on the current forecast years within the Leeds SATURN Highways model, of 2021 and 2031.
The forecasts were developed using the existing LTM model matrices, produced as core scenarios from the variable demand model taking account of uncertainty log development and scheme inputs and background growth.
A review of developments in the vicinity of the airport identified a ‘step change’ in land use assumptions during 2026. Based on this it was decided that a 2021 forecast would more closely align with the existing 2016 forecast than 2031.
The 2021 forecast was therefore created by pivoting off the existing 2016 using 2016 – 2021 NTEM growth disaggregated by local authority area within west Yorkshire and county within the wider Yorkshire region (and the UK as a whole beyond). For the 2031 study forecast the existing 2031 model was used with no need to apply NTEM growth.
A review of the airport demand in the existing model, compared with actual demand, revealed that it was being underrepresented. A benchmarking exercise was undertaken based on data collected as part of the airport extension transport assessment. This benchmark was then extrapolated to the 2021 and 2031 future years using the DfT aviation forecasts 2013 (Central - Constrained) for LBIA and included in the study forecasts at the airport zone. Wider model demand was adjusted down to control the forecasts.
Traffic Flow Distribution
Forecast airport trips distribution in 2031, for the AM Peak, average inter-peak hour, and PM Peak are shown in the figures below. Plots are shown for both trips going to the airport and coming from the airport in all three time periods.
SATURN plots showing the 2021 forecast airport distribution in the Do Minimum network can be found in Appendix E.

96
Figure 55 – 2031 AM Peak hour (Airport Origin Trips)
Figure 56 – 2031 AM Peak hour (Airport Destination Trips)
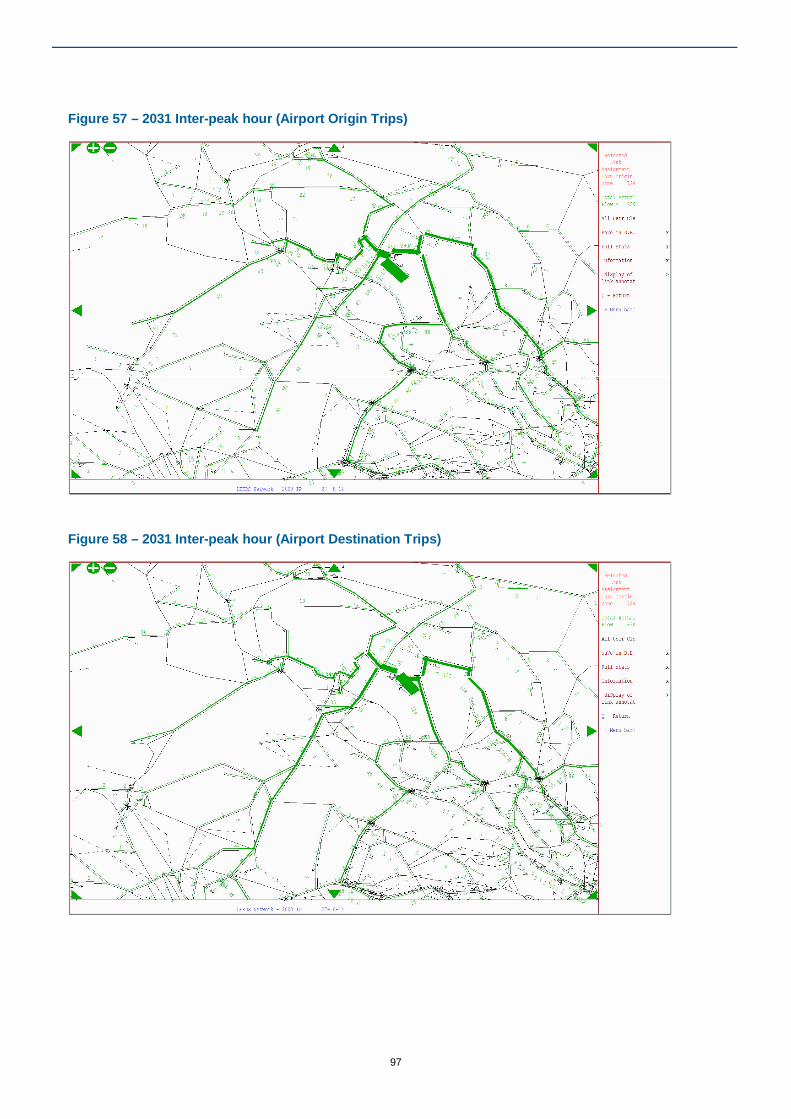
97
Figure 57 – 2031 Inter-peak hour (Airport Origin Trips)
Figure 58 – 2031 Inter-peak hour (Airport Destination Trips)

98
Figure 59 – 2031 PM Peak hour (Airport Origin Trips)
Figure 60 – 2031 PM Peak hour (Airport Destination Trips)

99
Delays
Figures 61 to 63 show the current locations forecast to experience delays exceeding 1 minute in 2031. These are generally consistent between the AM and PM Peak time periods, with some comparisons in the inter-peak period. Key junctions forecast to have delays exceeding 1 minute are:
Hollins Hill;
Micklefield Lane / A658;
A658 / A660;
A657 / Apperley Lane;
A65 / Oxford Road;
Bayton Lane / A658;
Old Otley Road / A660; and,
Junctions on the Outer Ring Road.
Figure 61 – 2031 AM Peak hour (Delays (seconds) exceeding 60s)

100
Figure 62 – 2031 Inter-peak hour (Delays (seconds) exceeding 60s)
Figure 63 – 2031 PM Peak hour (Delays (seconds) exceeding 60s)
SATURN plots showing the 2021 delays in the Do Minimum network can be found in Appendix F. The locations forecasting delays over 1 minute are similar to those forecasts in 2031.
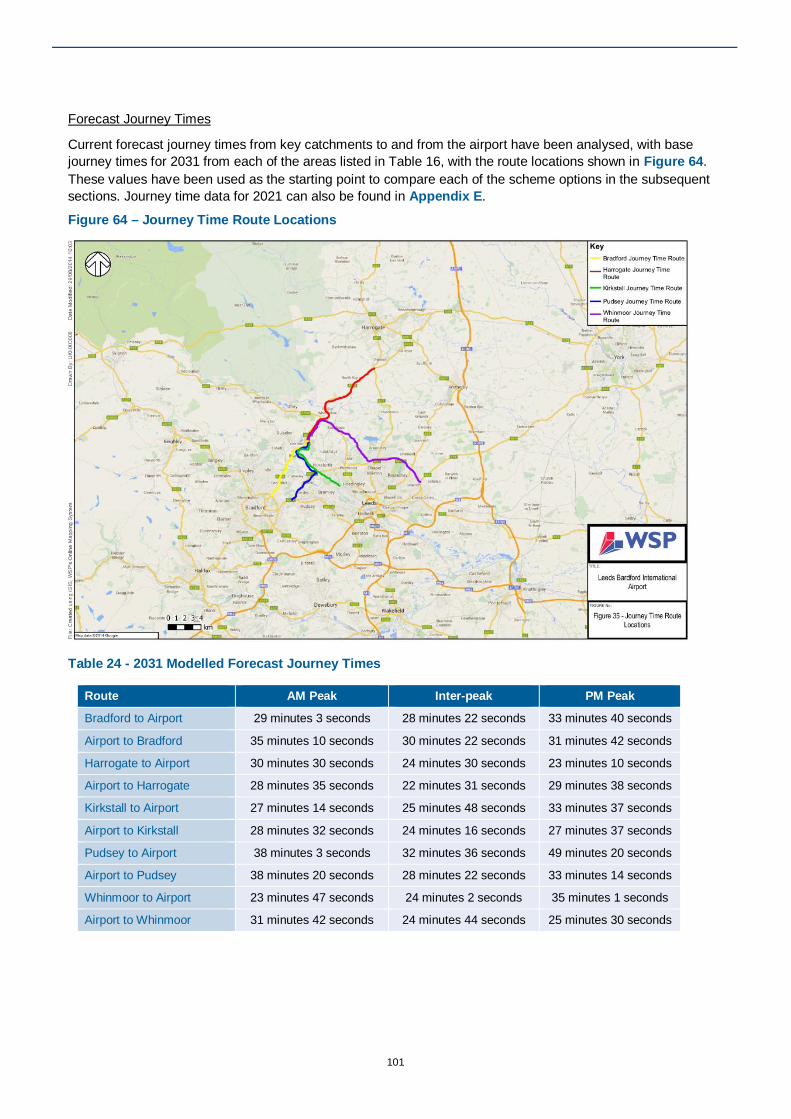
101
Forecast Journey Times
Current forecast journey times from key catchments to and from the airport have been analysed, with base journey times for 2031 from each of the areas listed in Table 16, with the route locations shown in Figure 64. These values have been used as the starting point to compare each of the scheme options in the subsequent sections. Journey time data for 2021 can also be found in Appendix E.
Figure 64 – Journey Time Route Locations
Table 24 - 2031 Modelled Forecast Journey Times
Route AM Peak Inter-peak PM Peak
Bradford to Airport 29 minutes 3 seconds 28 minutes 22 seconds 33 minutes 40 seconds
Airport to Bradford 35 minutes 10 seconds 30 minutes 22 seconds 31 minutes 42 seconds
Harrogate to Airport 30 minutes 30 seconds 24 minutes 30 seconds 23 minutes 10 seconds
Airport to Harrogate 28 minutes 35 seconds 22 minutes 31 seconds 29 minutes 38 seconds
Kirkstall to Airport 27 minutes 14 seconds 25 minutes 48 seconds 33 minutes 37 seconds
Airport to Kirkstall 28 minutes 32 seconds 24 minutes 16 seconds 27 minutes 37 seconds
Pudsey to Airport 38 minutes 3 seconds 32 minutes 36 seconds 49 minutes 20 seconds
Airport to Pudsey 38 minutes 20 seconds 28 minutes 22 seconds 33 minutes 14 seconds
Whinmoor to Airport 23 minutes 47 seconds 24 minutes 2 seconds 35 minutes 1 seconds
Airport to Whinmoor 31 minutes 42 seconds 24 minutes 44 seconds 25 minutes 30 seconds
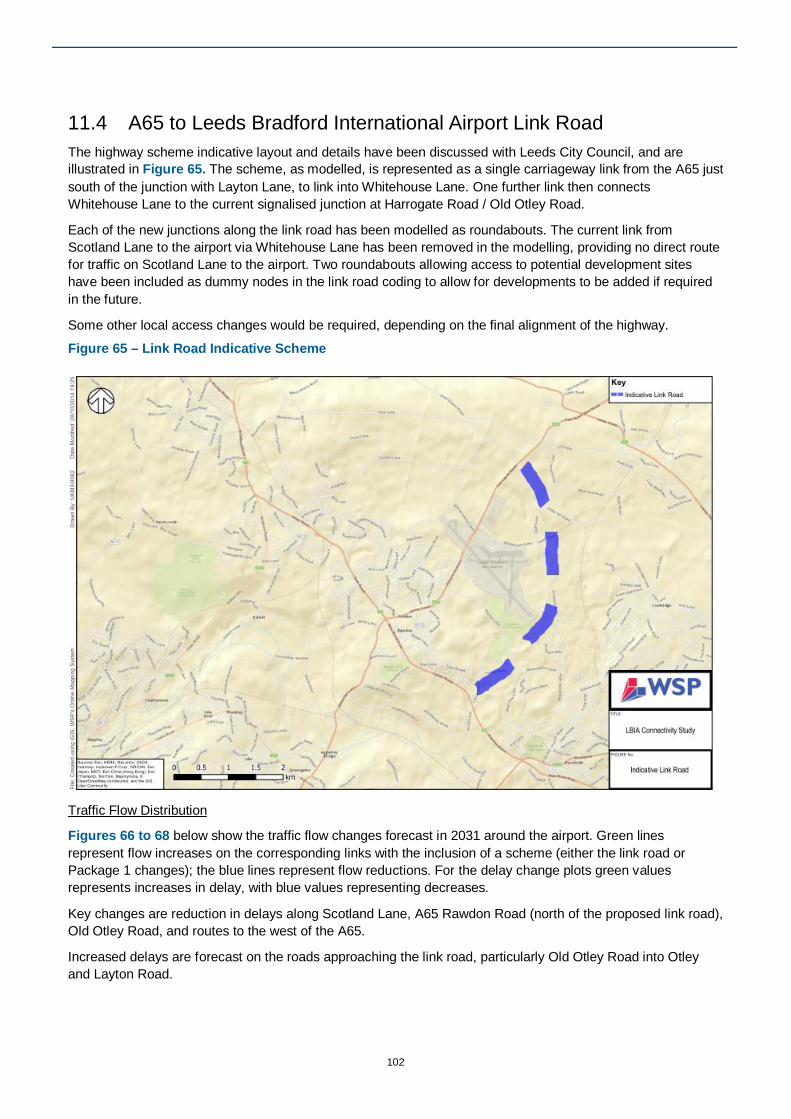
102
A65 to Leeds Bradford International Airport Link Road 11.4The highway scheme indicative layout and details have been discussed with Leeds City Council, and are illustrated in Figure 65. The scheme, as modelled, is represented as a single carriageway link from the A65 just south of the junction with Layton Lane, to link into Whitehouse Lane. One further link then connects Whitehouse Lane to the current signalised junction at Harrogate Road / Old Otley Road.
Each of the new junctions along the link road has been modelled as roundabouts. The current link from Scotland Lane to the airport via Whitehouse Lane has been removed in the modelling, providing no direct route for traffic on Scotland Lane to the airport. Two roundabouts allowing access to potential development sites have been included as dummy nodes in the link road coding to allow for developments to be added if required in the future.
Some other local access changes would be required, depending on the final alignment of the highway.
Figure 65 – Link Road Indicative Scheme
Traffic Flow Distribution
Figures 66 to 68 below show the traffic flow changes forecast in 2031 around the airport. Green lines represent flow increases on the corresponding links with the inclusion of a scheme (either the link road or Package 1 changes); the blue lines represent flow reductions. For the delay change plots green values represents increases in delay, with blue values representing decreases.
Key changes are reduction in delays along Scotland Lane, A65 Rawdon Road (north of the proposed link road), Old Otley Road, and routes to the west of the A65.
Increased delays are forecast on the roads approaching the link road, particularly Old Otley Road into Otley and Layton Road.

103
Figure 66 - AM Peak (Link Road 40mph) Traffic Flow Changes
Figure 67 - Inter-peak (Link Road 40mph) Traffic Flow Changes

104
Figure 68 - PM Peak (Link Road 40mph) Traffic Flow Changes
SATURN outputs showing the distribution of trips using the proposed link road along the stretch running parallel to Scotland Lane can be found in Appendix F for both the 2021 and 2031 model runs. Plots showing the distribution of trips (traffic flow in Passenger Car Units – PCUs) to and from the airport, incorporating trips along the new link road are also shown in Appendix F.
Table 25a below summarises the number of trips using the link road, both northbound and southbound; and the number of trips to and from the airport. Percentage splits are shown for the proportion of trips using the link road going to and from the airport. This shows that between 22% and 44% use the link road to travel to the airport with, 15% to 31% using the link road when leaving the airport dependent on time period.
Percentage splits are also provided for the number of trips to and from the airport using the link road. This shows that generally between 30% and 40% of trips to and from the airport are forecast to use the proposed link road.
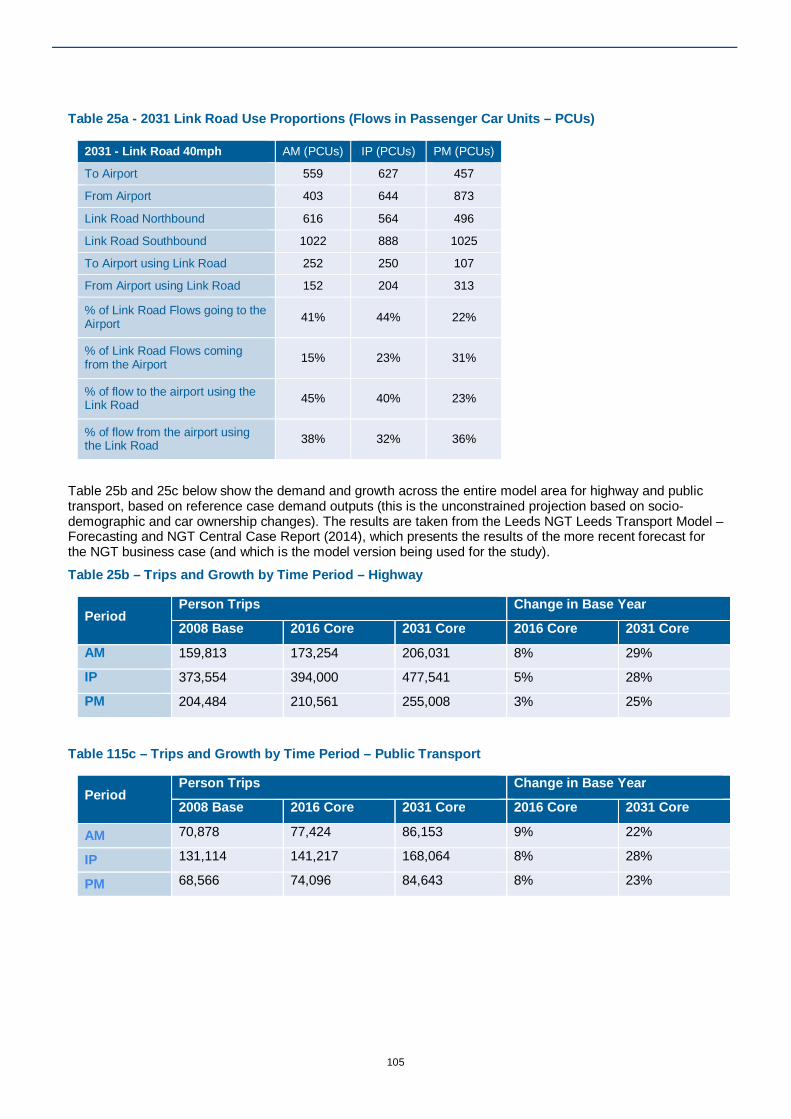
105
Table 25a - 2031 Link Road Use Proportions (Flows in Passenger Car Units – PCUs)
2031 - Link Road 40mph AM (PCUs) IP (PCUs) PM (PCUs)
To Airport 559 627 457
From Airport 403 644 873
Link Road Northbound 616 564 496
Link Road Southbound 1022 888 1025
To Airport using Link Road 252 250 107
From Airport using Link Road 152 204 313
% of Link Road Flows going to the Airport 41% 44% 22%
% of Link Road Flows coming from the Airport 15% 23% 31%
% of flow to the airport using the Link Road 45% 40% 23%
% of flow from the airport using the Link Road 38% 32% 36%
Table 25b and 25c below show the demand and growth across the entire model area for highway and public transport, based on reference case demand outputs (this is the unconstrained projection based on socio-demographic and car ownership changes). The results are taken from the Leeds NGT Leeds Transport Model – Forecasting and NGT Central Case Report (2014), which presents the results of the more recent forecast for the NGT business case (and which is the model version being used for the study).
Table 25b – Trips and Growth by Time Period – Highway
Period Person Trips Change in Base Year
2008 Base 2016 Core 2031 Core 2016 Core 2031 Core
AM 159,813 173,254 206,031 8% 29%
IP 373,554 394,000 477,541 5% 28%
PM 204,484 210,561 255,008 3% 25%
Table 115c – Trips and Growth by Time Period – Public Transport
Period Person Trips Change in Base Year
2008 Base 2016 Core 2031 Core 2016 Core 2031 Core
AM 70,878 77,424 86,153 9% 22%
IP 131,114 141,217 168,064 8% 28%
PM 68,566 74,096 84,643 8% 23%

106
For comparison, the weekday average growth for the Leeds area has been extracted from Tempro.
Table 25d– Tempro Growth (NTEM v6.2)
Year Car driver Rail Underground + Bus Coach
2008 - -
2016 10% 4%
2031 34% 20%
It appears that the model growth compared with Tempro for the Leeds area is marginally under represented for highway, and slightly over-represented for public transport
Delays
Figures 69 to 71 show the 2031 change in delays in seconds with the proposed link road. Key changes are forecast at:
A600 / A658 (Dyneley Arms);
Bayton Lane / Victoria Avenue;
Layton Road / Link Road;
Outer Ring Road / A65; and,
Outer Ring Road / A657.
With increased forecast traffic flow through these locations in all three time periods the increase in delays are to be expected. The majority of the increase delays are less than 30 seconds, with the exception at the Dyneley arms junction were delays are forecast to increase on both the A658 northbound arm and A660 westbound.
Reduced delays are forecast at the junction of the A658 and Old Otley Road, potentially largely explained by the changed layout from the current traffic signal operation to a roundabout incorporating the new link road. Other significant decreased delays are noted around the junctions on the A65 where the A658 and Harrogate Road meet in Rawdon. With traffic routing onto the link road further south on the A65, reduced flow is forecast through these junctions which is reflected in the reduced delay forecast.
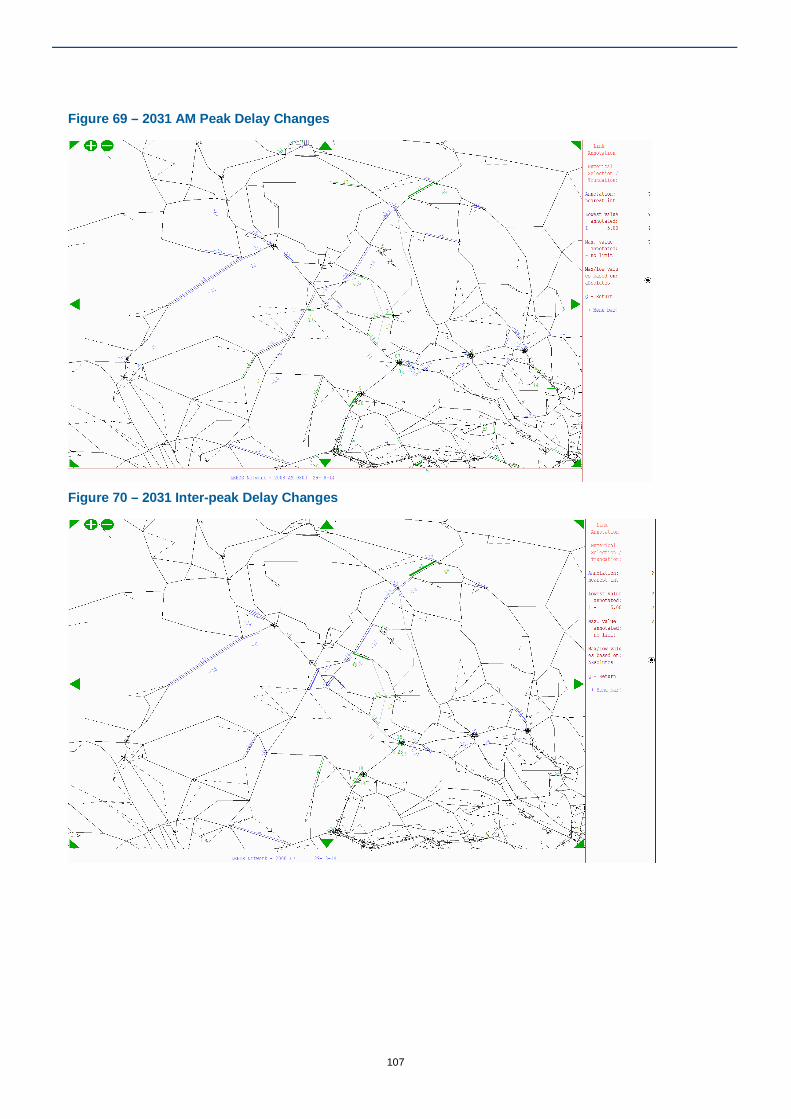
107
Figure 69 – 2031 AM Peak Delay Changes
Figure 70 – 2031 Inter-peak Delay Changes

108
Figure 71 – 2031 PM Peak Delay Changes
Journey Time Benefits
Table 25 below shows the 2031 journey time comparisons for key routes to and from the airport. The figures in black show the actual forecast journey time between each of the locations. The figures in red and green represent changes in journey time compared to the Do Minimum values. Green values represent reductions in journey time, and red values increased time.
The figures show that some areas of West and North Yorkshire would benefit more than others, largely due to the current proposed alignment of the link road and its entry points.
Trips from the south and west of the airport are forecast to benefit most due to the natural rerouting onto the new link road. Trips from Bradford are forecast to benefit by up to 2 minutes across all time periods, with trips from Pudsey and Kirkstall benefiting with journey time savings of up to 8 minutes in the peak periods when travelling to the airport.
Some benefits are forecast for trips from eastern Leeds travelling to the airport, with slight disbenefits for trips away from the airport in the inter-peak and PM peak. Trips to and from Harrogate benefit least, with increased journey times. This is partly due to the increasing traffic flows leading to increased delays along the route to Harrogate through Dyneley Arms.
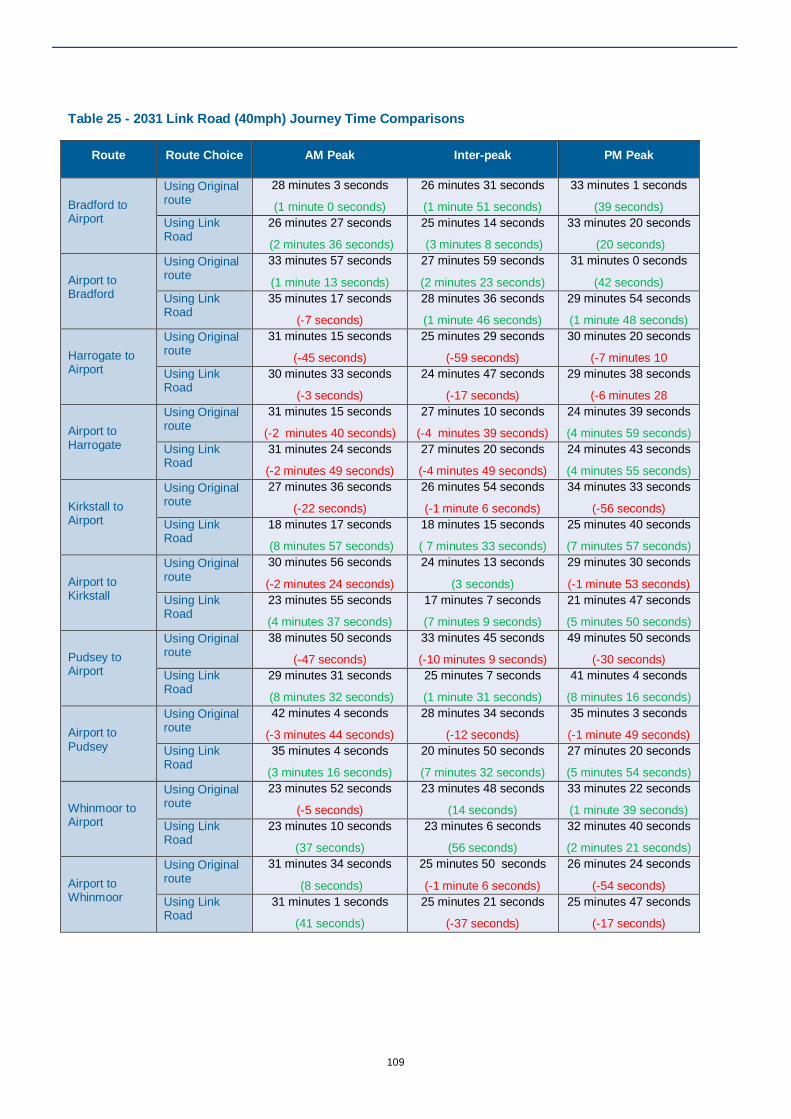
109
Table 25 - 2031 Link Road (40mph) Journey Time Comparisons
Route Route Choice AM Peak Inter-peak PM Peak
Bradford to Airport
Using Original route
28 minutes 3 seconds
(1 minute 0 seconds)
26 minutes 31 seconds
(1 minute 51 seconds)
33 minutes 1 seconds
(39 seconds) Using Link Road
26 minutes 27 seconds
(2 minutes 36 seconds)
25 minutes 14 seconds
(3 minutes 8 seconds)
33 minutes 20 seconds
(20 seconds)
Airport to Bradford
Using Original route
33 minutes 57 seconds
(1 minute 13 seconds)
27 minutes 59 seconds
(2 minutes 23 seconds)
31 minutes 0 seconds
(42 seconds) Using Link Road
35 minutes 17 seconds
(-7 seconds)
28 minutes 36 seconds
(1 minute 46 seconds)
29 minutes 54 seconds
(1 minute 48 seconds)
Harrogate to Airport
Using Original route
31 minutes 15 seconds
(-45 seconds)
25 minutes 29 seconds
(-59 seconds)
30 minutes 20 seconds
(-7 minutes 10 seconds) Using Link
Road
30 minutes 33 seconds
(-3 seconds)
24 minutes 47 seconds
(-17 seconds)
29 minutes 38 seconds
(-6 minutes 28 seconds)
Airport to Harrogate
Using Original route
31 minutes 15 seconds
(-2 minutes 40 seconds)
27 minutes 10 seconds
(-4 minutes 39 seconds)
24 minutes 39 seconds
(4 minutes 59 seconds) Using Link Road
31 minutes 24 seconds
(-2 minutes 49 seconds)
27 minutes 20 seconds
(-4 minutes 49 seconds)
24 minutes 43 seconds
(4 minutes 55 seconds)
Kirkstall to Airport
Using Original route
27 minutes 36 seconds
(-22 seconds)
26 minutes 54 seconds
(-1 minute 6 seconds)
34 minutes 33 seconds
(-56 seconds) Using Link Road
18 minutes 17 seconds
(8 minutes 57 seconds)
18 minutes 15 seconds
( 7 minutes 33 seconds)
25 minutes 40 seconds
(7 minutes 57 seconds)
Airport to Kirkstall
Using Original route
30 minutes 56 seconds
(-2 minutes 24 seconds)
24 minutes 13 seconds
(3 seconds)
29 minutes 30 seconds
(-1 minute 53 seconds) Using Link Road
23 minutes 55 seconds
(4 minutes 37 seconds)
17 minutes 7 seconds
(7 minutes 9 seconds)
21 minutes 47 seconds
(5 minutes 50 seconds)
Pudsey to Airport
Using Original route
38 minutes 50 seconds
(-47 seconds)
33 minutes 45 seconds
(-10 minutes 9 seconds)
49 minutes 50 seconds
(-30 seconds) Using Link Road
29 minutes 31 seconds
(8 minutes 32 seconds)
25 minutes 7 seconds
(1 minute 31 seconds)
41 minutes 4 seconds
(8 minutes 16 seconds)
Airport to Pudsey
Using Original route
42 minutes 4 seconds
(-3 minutes 44 seconds)
28 minutes 34 seconds
(-12 seconds)
35 minutes 3 seconds
(-1 minute 49 seconds) Using Link Road
35 minutes 4 seconds
(3 minutes 16 seconds)
20 minutes 50 seconds
(7 minutes 32 seconds)
27 minutes 20 seconds
(5 minutes 54 seconds)
Whinmoor to Airport
Using Original route
23 minutes 52 seconds
(-5 seconds)
23 minutes 48 seconds
(14 seconds)
33 minutes 22 seconds
(1 minute 39 seconds) Using Link Road
23 minutes 10 seconds
(37 seconds)
23 minutes 6 seconds
(56 seconds)
32 minutes 40 seconds
(2 minutes 21 seconds)
Airport to Whinmoor
Using Original route
31 minutes 34 seconds
(8 seconds)
25 minutes 50 seconds
(-1 minute 6 seconds)
26 minutes 24 seconds
(-54 seconds) Using Link Road
31 minutes 1 seconds
(41 seconds)
25 minutes 21 seconds
(-37 seconds)
25 minutes 47 seconds
(-17 seconds)

110
Initial TUBA Run
TUBA version 1.9.3 has been used model the economic benefits of the proposed scheme.
The estimated scheme costs used have been taken from the WY+TF Pro-forma originally submitted to the West Yorkshire Combined Authority by Leeds City Council and are based on an overall capital cost of £38,180,000 inclusive of 44% optimism bias (at 2012 Prices). Maintenance costs used are based on COBA values for a D2AP road type and are valued at £69,856 per annum. Whilst this is marginally above those used for a single carriageway road, it reflects the expected additional drainage and general maintenance expected considering the highway terrain and topography. The model results demonstrate a single carriageway road can deal with the forecast traffic and a dual carriageway is not required.
Construction is assumed to take place aver a three year period from 2018 to 2021 based on a 2021 delivery year. Construction costs are assumed to be evenly split between the three years.
The initial BCR calculation using the full model is 0.000 suggesting no benefits to the scheme.
Cordoned Model Run
Benefits of the proposed link road are largely focused in the immediate vicinity of the airport in an area surrounded by the A660 to the north, A61 Harrogate Road to the east, A6038 to the west and B6157 to the south. Changes further away from the airport are presenting fewer benefits, with some disbenefits, and are assumed to be influencing the overall benefits of the proposed scheme.
A cordoned run of the model has been undertaken to target the benefits specific to the proposed link road and to ensure model noise (i.e. changes in the model outside the scheme area) are not impacting unduely on the outcomes of the assessment.
Figure 72 shows the extent of the cordoned model used, with full model outputs in terms of traffic flow changes, and delay changes for both 2021 and 2031 presented in Appendix G. A review of the outputs confirms that cordoning the model has had limited impact on the overall forecast delays and distribution of flow changes. This review is included at Appendix G.
Further analysis of the impact of cordoning, and the detailed reasons for the disbenefits outside the scheme area have not been undertaken at this stage. This would need further investigation, in line with updates to the model for future scheme testing as the scheme becomes more defined.
Figure 72 – Cordoned Model Extent
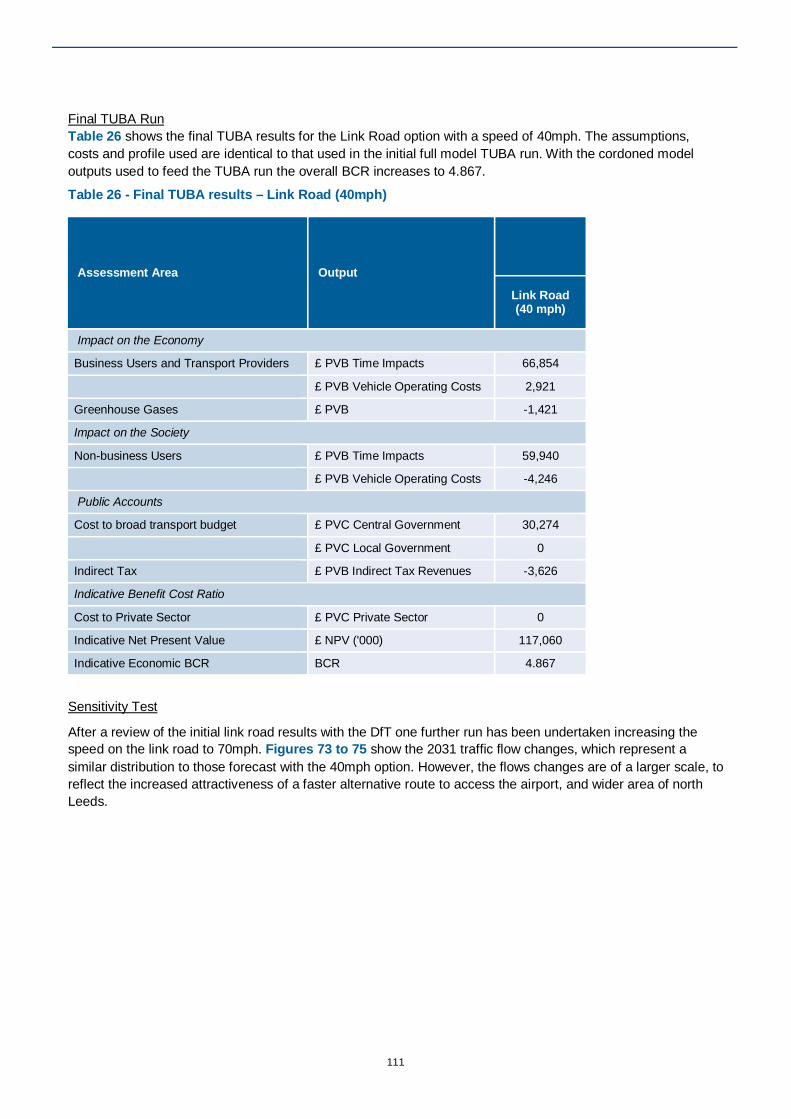
111
Final TUBA Run Table 26 shows the final TUBA results for the Link Road option with a speed of 40mph. The assumptions, costs and profile used are identical to that used in the initial full model TUBA run. With the cordoned model outputs used to feed the TUBA run the overall BCR increases to 4.867.
Table 26 - Final TUBA results – Link Road (40mph)
Assessment Area Output
Link Road (40 mph)
Impact on the Economy
Business Users and Transport Providers £ PVB Time Impacts 66,854
£ PVB Vehicle Operating Costs 2,921
Greenhouse Gases £ PVB -1,421
Impact on the Society
Non-business Users £ PVB Time Impacts 59,940
£ PVB Vehicle Operating Costs -4,246
Public Accounts
Cost to broad transport budget £ PVC Central Government 30,274
£ PVC Local Government 0
Indirect Tax £ PVB Indirect Tax Revenues -3,626
Indicative Benefit Cost Ratio
Cost to Private Sector £ PVC Private Sector 0
Indicative Net Present Value £ NPV ('000) 117,060
Indicative Economic BCR BCR 4.867
Sensitivity Test
After a review of the initial link road results with the DfT one further run has been undertaken increasing the speed on the link road to 70mph. Figures 73 to 75 show the 2031 traffic flow changes, which represent a similar distribution to those forecast with the 40mph option. However, the flows changes are of a larger scale, to reflect the increased attractiveness of a faster alternative route to access the airport, and wider area of north Leeds.

112
Figure 73 - AM Peak (Link Road 70mph) Traffic Flow Changes
Figure 74 - Inter-peak (Link Road 70mph) Traffic Flow Changes

113
Figure 75 - PM Peak (Link Road 70mph) Traffic Flow Changes
Table 27 below summarises the number of trips using the link road, both northbound and southbound; and the number of trips to and from the airport. Percentage splits are shown for the proportion of trips using the link road going to and from the airport. This shows that between 16% and 21% use the link road to travel to the airport with, 13% to 24% using the link road when leaving the airport dependent on time period. This is a reduction compared with the 40mph option, suggesting the link road become more attractive to non-airport traffic.
Percentage splits are also provided for the number of trips to and from the airport using the link road. This shows that generally between 30% and 40% of trips to and from the airport are forecast to use the proposed link road. These are similarly to those with the 40mph option.
Table 27 - 2031 Link Road (70mph) Use Proportions (Flows in Passenger Car Units – PCUs)
2031 - Link Road 70mph AM (PCUs)
IP (PCUs)
PM (PCUs)
To Airport 557 627 454 From Airport 404 645 858 Link Road Northbound 1109 1209 1043 Link Road Southbound 1065 1127 1112 To Airport using Link Road 232 269 166 From Airport using Link Road 143 241 270 % of Link Road Flows going to the Airport 21% 22% 16% % of Link Road Flows coming from the Airport 13% 21% 24% % of flow to the airport using the Link Road 42% 43% 37% % of flow from the airport using the Link Road 35% 37% 31%

114
Figures 76 to 78 highlight the locations forecast to experience changes in 2031 with the proposed link road speed of 70mph. The locations are similar to those forecast with the 40mph option, however the delays at the A660 / A658 junction are forecast to be more significant.
This would support the current view that the link road could not be built in isolation and consideration on the impact at this junction, and potential improvement works would need to be considered.
Figure 76 – 2031 AM Peak Delay Changes
Figure 77 – 2031 Inter-peak Delay Changes

115
Figure 78 – 2031 PM Peak Delay Changes
The journey time changes with a 70mph option are similar to those forecast with the 40mph option. The main change is a further benefit of an additional two to three minutes for trips from Bradford, Pudsey and Kirkstall providing benefits for general traffic and bus services to the airport.
These comparisons are shown in Table 28.

116
Table 28 - 2031 Link Road (70mph) Journey Time Comparisons
Route Route Choice AM Peak Inter-peak PM Peak
Bradford to Airport
Using Original route
27 minutes 19 seconds
(1 minute 42 seconds)
25 minutes 38 seconds
(2 minutes 44 seconds)
33 minutes 1 seconds
(49 seconds) Using Link Road
26 minutes 30 seconds
(2 minutes 33 seconds)
24 minutes 37 seconds
(3 minute 45 seconds)
32 minutes 1 seconds
(-19 seconds)
Airport to Bradford
Using Original route
33 minutes 42 seconds
(1 minute 28 seconds)
27 minutes 58 seconds
(2 minutes 24 seconds)
30 minutes 37 seconds
(1 minute 5 seconds) Using Link Road
36 minutes 57 seconds
(-1 minute 47 seconds)
28 minutes 27 seconds
(1 minute 55 seconds)
31 minutes 41 seconds
(1 second)
Harrogate to Airport
Using Original route
31 minutes 25 seconds
(-55 seconds)
26 minutes 53 seconds
(-2 minutes 23 seconds)
30 minutes 27 seconds
(-7 minutes 17 seconds) Using Link Road
29 minutes 56 seconds
(34 seconds)
25 minutes 24 seconds
(-54 seconds)
28 minutes 57 seconds
(41 seconds)
Airport to Harrogate
Using Original route
32 minutes 14 seconds
(-3 minutes 39 seconds)
27 minutes 41 seconds
(-5 minutes 10 seconds)
25 minutes 10 seconds
(4 minutes 28 seconds) Using Link Road
31 minutes 47 seconds
(-3 minutes 12 seconds)
27 minutes 19 seconds
(-4 minutes 48 seconds)
25 minutes 2 seconds
(4 minutes 36 seconds)
Kirkstall to Airport
Using Original route
27 minutes 17 seconds
(-3 seconds)
27 minutes 5 seconds
(-1 minute 17 seconds)
34 minutes 18 seconds
(-41 seconds) Using Link Road
17 minutes 14 seconds
(10 minutes 0 seconds)
17 minutes 26 seconds
(8 minutes 22 seconds)
24 minutes 27 seconds
(9 minutes 10 seconds)
Airport to Kirkstall
Using Original route
31 minutes 2 seconds
(-2 minutes 30 seconds)
24 minutes 59 seconds
(-43 seconds)
29 minutes 35 seconds
(-1 minute 58 seconds) Using Link Road
26 minutes 9 seconds
(2 minutes 23 seconds)
17 minutes 24 seconds
(7 minutes 8 seconds)
24 minutes 11 seconds
(3 minutes 26 seconds)
Pudsey to Airport
Using Original route
38 minutes 22 seconds
(-19 seconds)
33 minutes 52 seconds
(-1 minute 16 seconds)
50 minutes 26 seconds
(-1 minute 6 seconds) Using Link Road
28 minutes 19 seconds
(9 minutes 44 seconds)
24 minutes 13 seconds
(8 minutes 23 seconds)
40 minutes 35 seconds
(8 minutes 45 seconds)
Airport to Pudsey
Using Original route
42 minutes 6 seconds
(-3 minutes 46 seconds)
30 minutes 17 seconds
(-1 minute 55 seconds)
35 minutes 16 seconds
(-2 minutes 2 seconds) Using Link Road
37 minutes 13 seconds
(1 minute 7 seconds)
22 minutes 42 seconds
(5 minutes 40 seconds)
29 minutes 51 seconds
(3 minutes 23 seconds)
Whinmoor to Airport
Using Original route
23 minutes 52 seconds
(-5 seconds)
23 minutes 36 seconds
(26 seconds)
33 minutes 16 seconds
(1 minute 45 seconds) Using Link Road
22 minutes 22 seconds
(1 minute 25 seconds)
22 minutes 6 seconds
(1 minute 56 seconds)
31 minutes 46 seconds
(1 minute 15 seconds)
Airport to Whinmoor
Using Original route
31 minutes 48 seconds
(-6 seconds)
26 minutes 5 seconds
(-1 minute 21 seconds)
26 minutes 30 seconds
(-1 minute 0 seconds) Using Link Road
30 minutes 38 seconds
(1 minute 4 seconds)
25 minutes 2 seconds
(-18 seconds)
25 minutes 41 seconds
(-11 seconds)
As with the 40mph option the full model presented a BCR of less than 1, so a cordoned version of the model has been used to calculate the economic benefits of the scheme.
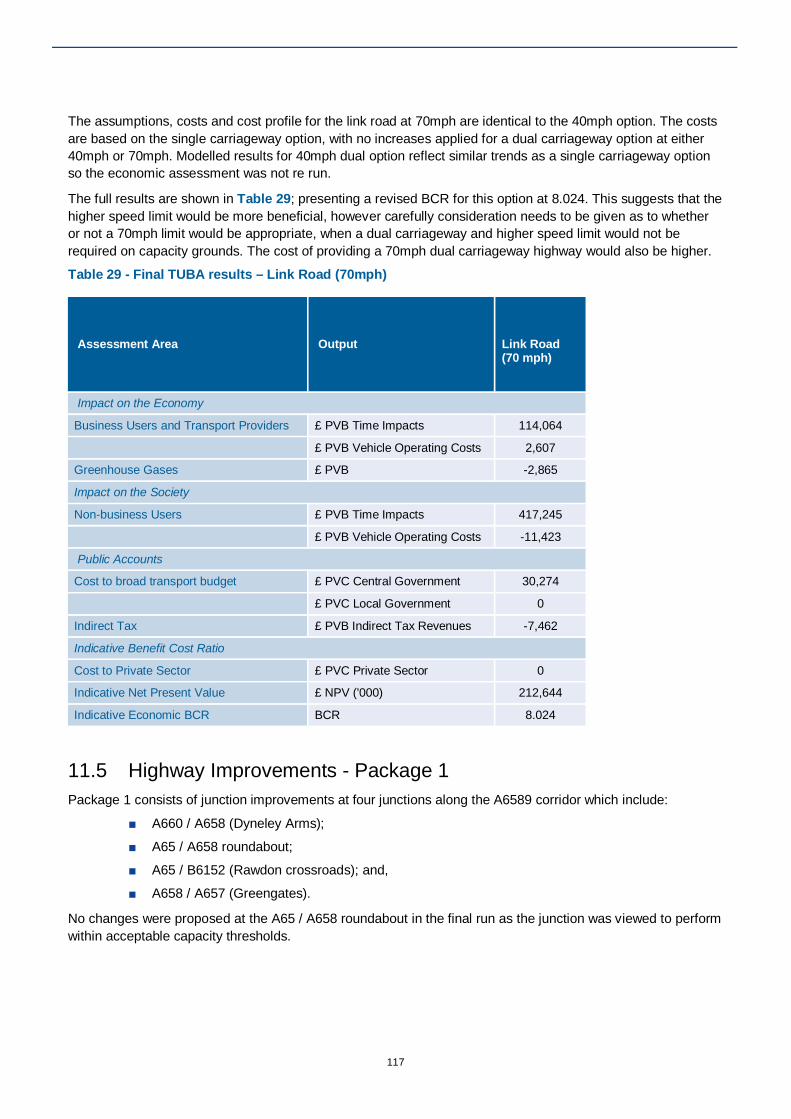
117
The assumptions, costs and cost profile for the link road at 70mph are identical to the 40mph option. The costs are based on the single carriageway option, with no increases applied for a dual carriageway option at either 40mph or 70mph. Modelled results for 40mph dual option reflect similar trends as a single carriageway option so the economic assessment was not re run.
The full results are shown in Table 29; presenting a revised BCR for this option at 8.024. This suggests that the higher speed limit would be more beneficial, however carefully consideration needs to be given as to whether or not a 70mph limit would be appropriate, when a dual carriageway and higher speed limit would not be required on capacity grounds. The cost of providing a 70mph dual carriageway highway would also be higher.
Table 29 - Final TUBA results – Link Road (70mph)
Assessment Area Output
Link Road (70 mph)
Impact on the Economy
Business Users and Transport Providers £ PVB Time Impacts 114,064
£ PVB Vehicle Operating Costs 2,607
Greenhouse Gases £ PVB -2,865
Impact on the Society
Non-business Users £ PVB Time Impacts 417,245
£ PVB Vehicle Operating Costs -11,423
Public Accounts
Cost to broad transport budget £ PVC Central Government 30,274
£ PVC Local Government 0
Indirect Tax £ PVB Indirect Tax Revenues -7,462
Indicative Benefit Cost Ratio
Cost to Private Sector £ PVC Private Sector 0
Indicative Net Present Value £ NPV ('000) 212,644
Indicative Economic BCR BCR 8.024
Highway Improvements - Package 1 11.5Package 1 consists of junction improvements at four junctions along the A6589 corridor which include:
A660 / A658 (Dyneley Arms);
A65 / A658 roundabout;
A65 / B6152 (Rawdon crossroads); and,
A658 / A657 (Greengates).
No changes were proposed at the A65 / A658 roundabout in the final run as the junction was viewed to perform within acceptable capacity thresholds.

118
No physical structural or layout changes have been proposed at the Dyneley arms junction or Rawdon crossroads, only revised signal timings. Both junctions were run through several iterations in Linsig to find the most efficient junction operation. Appendix H provides a summary of the assumptions and changes made to the signal operation.
The location of the Greengates junction is shown in Figure 79 and proposed changes were discussed with Bradford City Council in line with their WY+TF Pro-forma submission to the West Yorkshire Combined Authority. The proposals were also modelled in Linsig to identify the most efficient signal operation based on the layout supplied.
Figure 79 – Greengates Junction Location
Traffic Flow Distribution
Figures 76 to 78 show the forecast 2031 traffic flow changes around the area of the airport as a result of the Package 1 measures.
The most significant change is the re-routing of traffic around the Greengates junction from the Shipley arm. Traffic previously routing along Apperley Road to avoid the Greengates junction is routing via the junction with the proposed changes in place.
The chanages at Rawdon Crossroads seem particularly sensitive to route switching in the AM Peak and inter-peak period with traffic avoiding the junction by rat running along Larkfield Road and Carr Lane back onto the A65. This is a popular route currently, especially during the AM Peak hour and indicates that it is heavily influenced by the operation of the junction at Rawdon.
Similarly slight variations in the signal operation at Dyneley arms encourage more traffic to use the A660 through the junction rather than Old Otley Road during both peak period.
The 2021 flow distribution plots for Package 1 can be found in Appendix I.
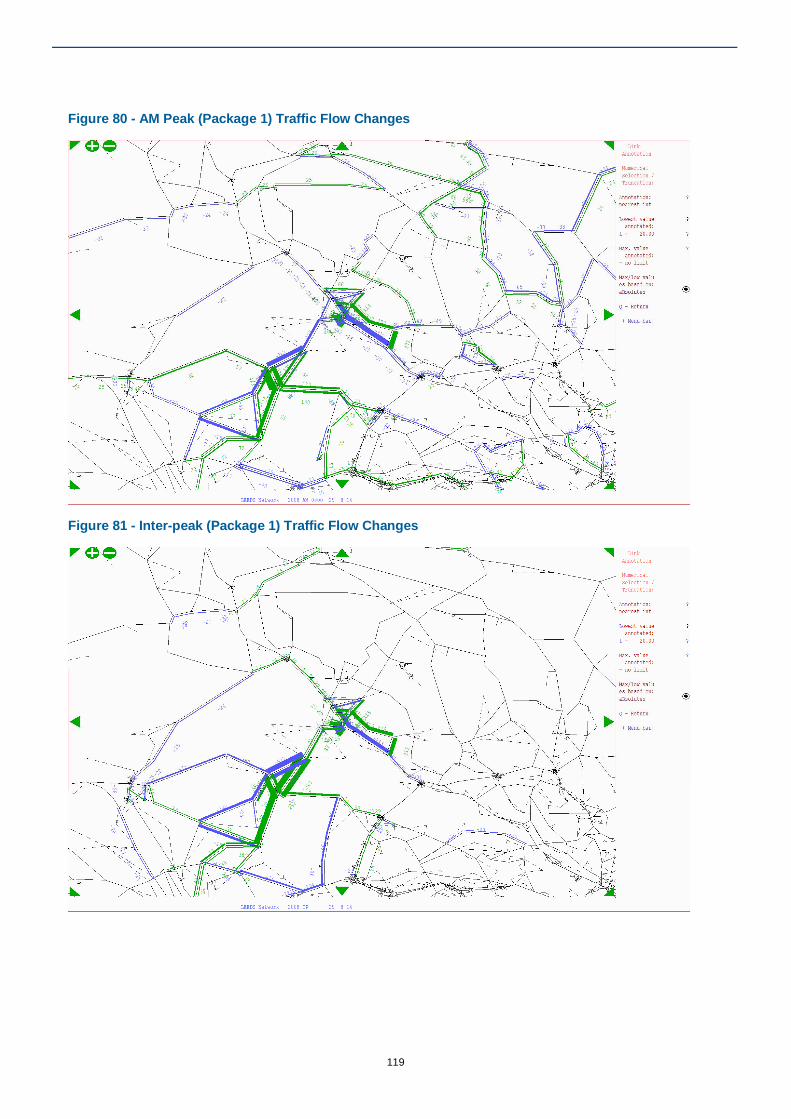
119
Figure 80 - AM Peak (Package 1) Traffic Flow Changes
Figure 81 - Inter-peak (Package 1) Traffic Flow Changes
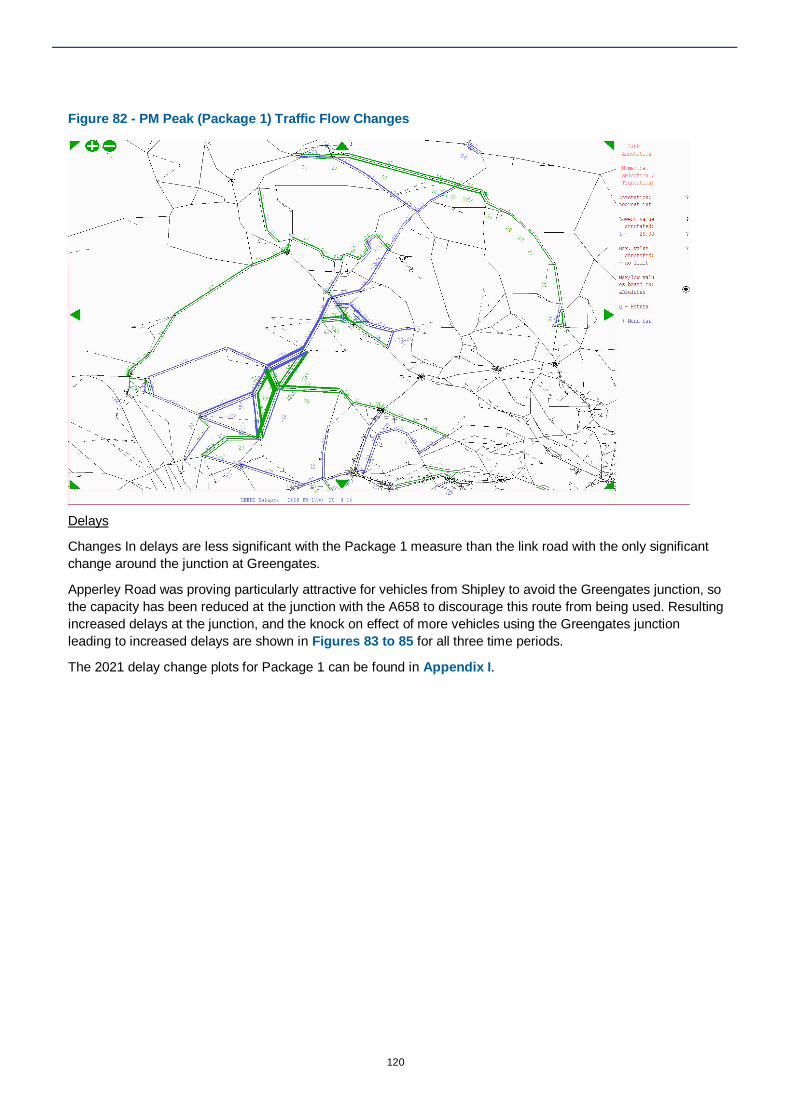
120
Figure 82 - PM Peak (Package 1) Traffic Flow Changes
Delays
Changes In delays are less significant with the Package 1 measure than the link road with the only significant change around the junction at Greengates.
Apperley Road was proving particularly attractive for vehicles from Shipley to avoid the Greengates junction, so the capacity has been reduced at the junction with the A658 to discourage this route from being used. Resulting increased delays at the junction, and the knock on effect of more vehicles using the Greengates junction leading to increased delays are shown in Figures 83 to 85 for all three time periods.
The 2021 delay change plots for Package 1 can be found in Appendix I.

121
Figure 83 – 2031 AM Peak Delay Changes
Figure 84 – 2031 Inter-peak Delay Changes

122
Figure 85 – 2031 PM Peak Delay Changes
Journey Time Benefits
Table 30 shows the journey time changes for trips to and from the airport with the introduction of the Package 1 junction improvements.
Most routes forecast a change of less than one minute, with a few forecasting changes up to one minute 30 seconds. The most significant benefit is for trips from the airport to Harrogate in the PM Peak.
Few journey time changes are observed on the route to Whinmoor, with the most significant changes to the airport in the PM Peak, and away from the airport in the AM Peak, potentially due to the changes at Dyneley Arms.
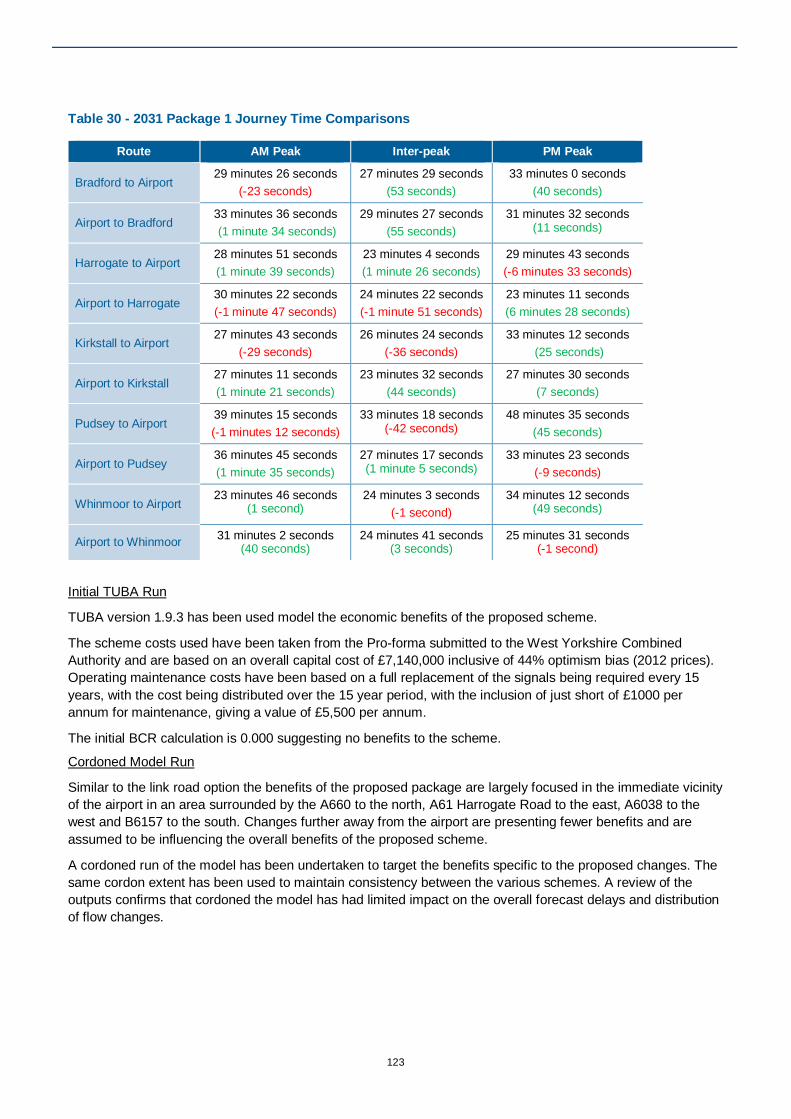
123
Table 30 - 2031 Package 1 Journey Time Comparisons
Route AM Peak Inter-peak PM Peak
Bradford to Airport 29 minutes 26 seconds
(-23 seconds) 27 minutes 29 seconds
(53 seconds) 33 minutes 0 seconds
(40 seconds)
Airport to Bradford 33 minutes 36 seconds (1 minute 34 seconds)
29 minutes 27 seconds (55 seconds)
31 minutes 32 seconds (11 seconds)
Harrogate to Airport 28 minutes 51 seconds (1 minute 39 seconds)
23 minutes 4 seconds (1 minute 26 seconds)
29 minutes 43 seconds (-6 minutes 33 seconds)
Airport to Harrogate 30 minutes 22 seconds (-1 minute 47 seconds)
24 minutes 22 seconds (-1 minute 51 seconds)
23 minutes 11 seconds (6 minutes 28 seconds)
Kirkstall to Airport 27 minutes 43 seconds
(-29 seconds) 26 minutes 24 seconds
(-36 seconds) 33 minutes 12 seconds
(25 seconds)
Airport to Kirkstall 27 minutes 11 seconds (1 minute 21 seconds)
23 minutes 32 seconds (44 seconds)
27 minutes 30 seconds (7 seconds)
Pudsey to Airport 39 minutes 15 seconds (-1 minutes 12 seconds)
33 minutes 18 seconds (-42 seconds)
48 minutes 35 seconds (45 seconds)
Airport to Pudsey 36 minutes 45 seconds (1 minute 35 seconds)
27 minutes 17 seconds (1 minute 5 seconds)
33 minutes 23 seconds (-9 seconds)
Whinmoor to Airport 23 minutes 46 seconds
(1 second) 24 minutes 3 seconds
(-1 second) 34 minutes 12 seconds
(49 seconds)
Airport to Whinmoor 31 minutes 2 seconds (40 seconds)
24 minutes 41 seconds (3 seconds)
25 minutes 31 seconds (-1 second)
Initial TUBA Run
TUBA version 1.9.3 has been used model the economic benefits of the proposed scheme.
The scheme costs used have been taken from the Pro-forma submitted to the West Yorkshire Combined Authority and are based on an overall capital cost of £7,140,000 inclusive of 44% optimism bias (2012 prices). Operating maintenance costs have been based on a full replacement of the signals being required every 15 years, with the cost being distributed over the 15 year period, with the inclusion of just short of £1000 per annum for maintenance, giving a value of £5,500 per annum.
The initial BCR calculation is 0.000 suggesting no benefits to the scheme.
Cordoned Model Run
Similar to the link road option the benefits of the proposed package are largely focused in the immediate vicinity of the airport in an area surrounded by the A660 to the north, A61 Harrogate Road to the east, A6038 to the west and B6157 to the south. Changes further away from the airport are presenting fewer benefits and are assumed to be influencing the overall benefits of the proposed scheme.
A cordoned run of the model has been undertaken to target the benefits specific to the proposed changes. The same cordon extent has been used to maintain consistency between the various schemes. A review of the outputs confirms that cordoned the model has had limited impact on the overall forecast delays and distribution of flow changes.

124
Final (Cordoned) TUBA Run
The full results are shown in Table 31; presenting a revised BCR for this option is 10.327.
Table 31 - Final (Cordoned) TUBA results – Package 1
Cordoned Model
Assessment Area Output Package 1
Impact on the Economy
Business Users and Transport Providers £ PVB Time Impacts 26,093
£ PVB Vehicle Operating Costs 2,069
Greenhouse Gases £ PVB -492
Impact on the Society
Non-business Users £ PVB Time Impacts 20,781
£ PVB Vehicle Operating Costs -1,805
Public Accounts
Cost to broad transport budget £ PVC Central Government 5,603
£ PVC Local Government 0
Indirect Tax £ PVB Indirect Tax Revenues -1,263
Indicative Benefit Cost Ratio
Cost to Private Sector £ PVC Private Sector 0
Indicative Net Present Value £ NPV ('000) 52,261
Indicative Economic BCR BCR 10.327
Conclusions
In summary the (core) highway schemes perform relatively well in terms of indicative BCR implying high VfM for both subject to assessment of uncaptured impacts (e.g. landscape, etc.).
The sensitivity test for the Link Road involved increasing the speed to 70 mph, which significantly increased the benefits.
The following commentary is a discussion of uncertainty in the modelling and appraisal.
In preparing the study model the LTM_H performance was reviewed in the vicinity of LBIA and the scheme areas. This identified that the model was generally fit for purpose for use in the study albeit with some changes required, the most significant being to improve the network representation of the Greengates junction, and to increase airport demand.
While the performance of the model did not fully meet the validation criteria acceptability guidelines set out in TAG Unit M3.1 Highway Assignment Modelling, it was considered sufficient for the study. Nevertheless, the review of model performance does raise some uncertainty with the scheme modelling.
The Greengates junction was not represented very accurately in the LTM_H, the junction being located outside of the model area. It was improved in the study model; however the performance at that specific location raises some uncertainty with the scheme modelling.

125
The LTM_H distribution of trips at the airport was reviewed and compared against a CAA survey undertaken in 2010. This revealed some differences between the model and the observed (CAA survey) data. Changing the model trip distribution was considered beyond the scope of the study and so instead it was retained through the base and future year models, generating a further area of uncertainty.
The Link Road was tested as a single carriageway option in accordance with the original information supplied by Leeds City Council along with associated costs. Maintenance costs used were for a dual carriageway option and while there is a discrepancy here, it was felt appropriate considering the topographical challenges and additional maintenance this may cause.
To mask out model ‘noise’ (i.e. benefits / dis-benefits that couldn’t reasonably be a considered attributable to the scheme) a cordoned model approach was employed. Comparison of traffic flow indicators and sectored benefit outputs have been used to demonstrate that the cordoned model provides a similar result to the full model. There are some remaining issues with the detailed justification of this approach which would require further assessment should the schemes be taken forward for more detailed appraisal.
There is some uncertainty in the impact of using variable demand modelling in the scheme testing. The work undertaken for this study has involved running a variable demand model test only. This has identified that variable demand is likely to be significant and should be included as part of the modelling as the schemes are progressed. Nevertheless, the simplicity of the method used has identified uncertainty in the scale of impact.
To conclude, the discussion above identifies that there are areas that need addressing, as the scheme modelling and appraisal progresses to the next stage and these issues are picked up in the Appraisal Summary Report (ASR). For the study the scope of work undertaken was limited in terms of the modelling tools and data available and the time that could be spent representing the transport system and scheme impacts.
Traffic Management 11.6Included as one of the original identified scheme types, Traffic Management measures are harder to quantify and model within existing models. This type of approach normally requires the construction or use of a micro-simulation or mesoscopic model, able to accurately model relatively small changes to vehicle activity along a corridor.
One of the issues picked up as part of the evidence base was that relating to ‘Improved signage and Urban Traffic Management Control (UTMC) measures’ to improve routing, reduce unnecessary miles travelled be vehicles (therefore improving journey times and reducing carbon emissions) and increase the efficiency of the network.
It appears that, whilst a number of schemes have been delivered, or are being proposed, by Local Highway Authorities, these are not linked together in a coherent Route Management Strategy for the airport. Where adaptive signal control is implemented, significant reductions in variability can be achieved.
It also helps to maximise the use of available road space, something which is seen to be important for a destination which has a more variable demand profile (when compared to another destination such as an office park or residential development).
Adaptive signal control systems such as MOVA and SCOOT, particularly when linked to other information systems such as Bus Real Time tracking, allow changes to signal routines to be implemented on a reactive basis as traffic conditions change. Implementing this approach along a corridor, rather than at individual junctions has the potential to improve traffic flows with little need for infrastructure changes. If implemented alongside infrastructure improvements, the benefits can be increased. The operational strategy incorporates linking between junction nodes to maximise traffic throughput and minimise delay and stops.
Although specific modelling was not undertaken for this scheme, as a live comparison, WSP undertook modelling and feasibility assessment of schemes proposed to improve journey times on the Balby Road corridor in Doncaster. This incorporated the validation of the SCOOT network and MOVA controlled junctions to enhance performance of the existing infrastructure.

126
The validation undertaken by WSP resulted in reductions of almost 5 minutes in average morning peak hour inbound bus journey times as a result of congestion relief and improved junction control. The validation of a single existing MOVA junction removed a queue around 1km long through effective use of the control strategy to proactively manage traffic.
The following graph clearly shows that both the average journey time and the variability of journey times have been reduced, and the greatest benefit is obtained in the peak hour when demands are at their highest.
Figure 86 – Illustration of Potential Reductions in Variability
We would therefore recommend that an active corridor strategy be implemented by each respective Highway Authority on the main corridors serving the airport, in conjunction with whichever physical infrastructure schemes are taken forward through this project or parallel projects such as the WY+TF or Pinchpoint. This should include clearly signed Strategic Airport Routes, which can then be prioritised.
Smarter Travel 11.7One further area where is it felt improvements could be delivered is that of improved travel planning, information and ticketing. There is a definite perception that accessibility to the airport is poor, despite direct bus services being available from each of the closest main centres (Leeds, Bradford and Harrogate). These perceptions of poor connectivity are often not due to the physical network, but because of shortfalls in the supporting infrastructure of information, fares and ticketing.
Because of the fragmented nature of public transport ticketing for example, it is difficult to get a through ticket from other areas to connect onto the Airport Shuttle Bus services. Through tickets from rail to bus are available, but only through schemes such as PlusBus and the Metrocard scheme, both of which have to be purchased in advance.
These cannot be purchased through the same outlets as airline tickets, and there appears to be no evidence of airlines promoting the bus services to and from the airport. This work should also ensure that SATNAV systems correctly route travellers along strategic routes rather than local network roads.

127
We would therefore recommend that further work be carried out to improve accessibility to public transport information and ticketing, making through travel easier, and reducing some of the penalties of interchange created by having to pay separate fares. Improvements in bus service frequencies would also make the communication of seamless travel far easier.
Variable Demand Model Test 11.8The TAG Unit describes that it would be acceptable in general to use a fixed demand assessment where the resulting difference in suppressed/included traffic when using a variable demand model do not change benefits resulting from a scheme by more than 10% in the opening year and 15% in the forecast year (10 to 15 years later) relative to a fixed demand case.
The approach for undertaking this test has been to use an own-cost elasticity function to reflect demand response (model variable demand).
The own cost elasticity function follows the power function described in the TAG Unit Appendix A Elasticity Models.
At a network wide level the impact on demand was a marginal increase for all time periods and both model years.
The result of the test was that the benefits and BCR notably reduced for both schemes, as a result of the demand reassignment brought about by the net impact of the range of demand adjustments (both increases and decreases) across the model network.
While it is understood that using an elasticity approach has limitations in terms of representation of demand responses, the outcome of this test is that variable demand modelling is significant and should be scoped out further as the schemes are developed.
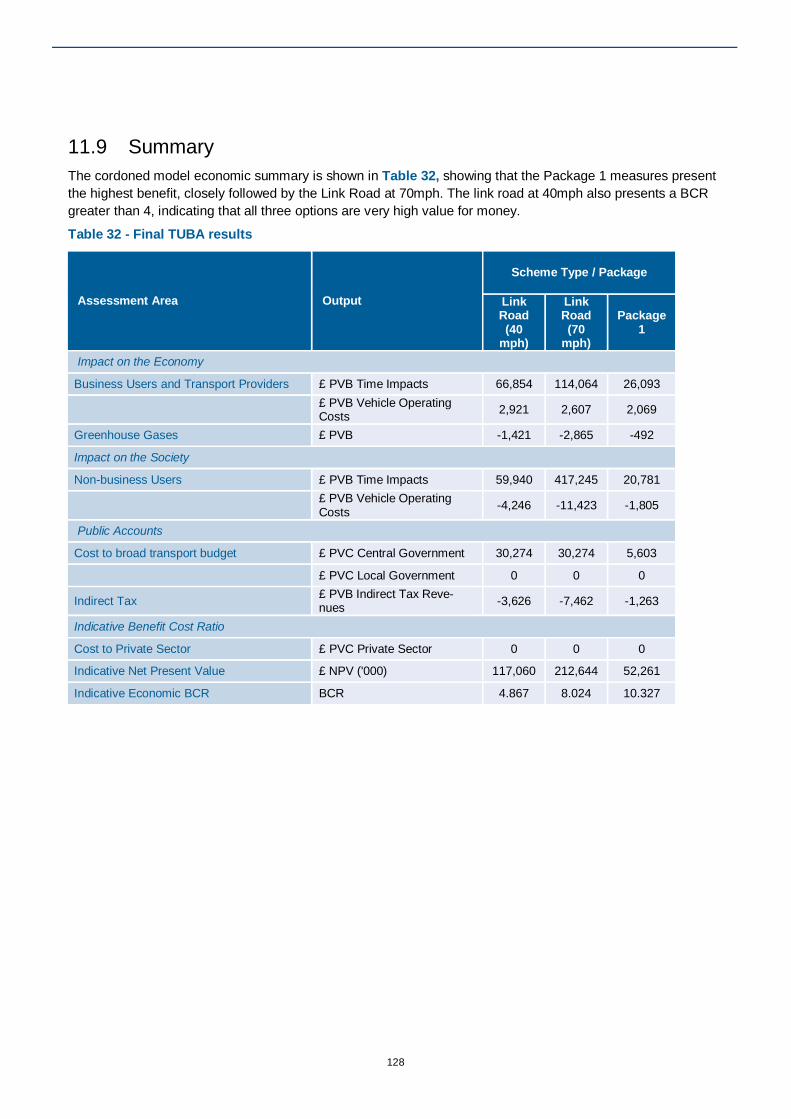
128
Summary 11.9The cordoned model economic summary is shown in Table 32, showing that the Package 1 measures present the highest benefit, closely followed by the Link Road at 70mph. The link road at 40mph also presents a BCR greater than 4, indicating that all three options are very high value for money.
Table 32 - Final TUBA results
Assessment Area Output
Scheme Type / Package
Link Road (40
mph)
Link Road (70
mph)
Package 1
Impact on the Economy
Business Users and Transport Providers £ PVB Time Impacts 66,854 114,064 26,093
£ PVB Vehicle Operating Costs 2,921 2,607 2,069
Greenhouse Gases £ PVB -1,421 -2,865 -492
Impact on the Society
Non-business Users £ PVB Time Impacts 59,940 417,245 20,781
£ PVB Vehicle Operating Costs -4,246 -11,423 -1,805
Public Accounts
Cost to broad transport budget £ PVC Central Government 30,274 30,274 5,603
£ PVC Local Government 0 0 0
Indirect Tax £ PVB Indirect Tax Reve-nues -3,626 -7,462 -1,263
Indicative Benefit Cost Ratio
Cost to Private Sector £ PVC Private Sector 0 0 0
Indicative Net Present Value £ NPV ('000) 117,060 212,644 52,261
Indicative Economic BCR BCR 4.867 8.024 10.327

129
Conclusions and Recommendations 12
Conclusions 12.1From the modelling and appraisal undertaken across the range of shortlisted public transport and highway schemes, the following conclusions can be drawn:
Public Transport
Appraisal of the public transport schemes has been carried out based the following tests:
A series of ‘core assumption’ shortlisted scheme and package options;
Unpacking the component parts of the bus package option; and
Sensitivity tests to inform uncertainty in the results, and varied delivery methods.
Conclusions for Bus
The core assumption tests imply low and poor value for money (VfM) for the bus options. Unpacking the bus options implies a very high VfM for the Leeds to LBIA express service option, assuming that the existing service is upgraded (as opposed to a competing service). Both assessments of VfM would be subject to the assessment of unquantified impacts
Only the Leeds to LBIA express service option generates revenues greater than costs. The York express service revenues reflect a significant loss due to the difference in existing public transport option (rail, interchanging with bus) and scheme fares (bus only).
The sensitivity tests results are summarised as follows:
Assuming competing rather than upgraded Express Bus Services results in a much lower VfM;
Changing the wait curve assumption to a maximum time of 7.5 minutes significantly reduces the benefits; and
Using a different set of logit choice parameters has a relatively minor impact.
Because of the capital costs involved in any frequency increase, taking advantage of the journey time and reliability improvements offered by the proposed Link Road would allow the frequency uplift to be delivered at far less cost, as the additional vehicles would not be required.
Conclusions for Rail
The core assumption tests imply low and poor value for money (VfM) for the rail options, with the Guiseley – LBIA – Horsforth option being the best performing. Whilst it produces a marginally lower BCR than other rail options because of the high capital cost, it provides far greater connectivity and accessibility benefits so provides a better overall Value for Money outcome and impact on objectives.
The sensitivity tests results are summarised as follows:
The assessment of options involving interchange (i.e. the parkway station and a self-contained rail shuttle involving interchange at Horsforth and/or Guiseley) do not give a positive economic assessment and are not recommended to be progressed;
Options with a through service give a positive but poor economic assessment indicating such schemes perform better than those requiring interchange but offer poor value for money;
Through services could only be delivered if existing network constraints around Shipley and Leeds were addressed and the line to Harrogate electrified (because of time and traction limitations) – the assessment assumes that these are provided as future network upgrades and are not included in the core scheme cost;
130
Including an in-vehicle time factor to reflect a preference for rail over bus travel significantly increases the benefit of rail options but not to a level where high value for money is likely;
Rail patronage is difficult to estimate where there is no existing demand, and as the approach taken does not factor in demand between intermediate stations, or from intermediate stations to/from the airport, the total demand may currently be understated; and
For the rail options to offer high value for money, patronage would need to be around 5 times that currently being forecast in the study. The current forecast for the through rail scheme between Leeds and Bradford (Guiseley to Horsforth link) is for around 121,000 passengers at opening year, which equates to around half the current public transport demand to and from the airport.
The forecast operating and maintenance cost for the Core Scheme is approx. £1.360m per annum. This would therefore require 593,886 passengers per annum at the assumed average fare (this equates to a 10% mode split by rail at an overall 6m airport passengers – the 2030 Forecast figure) to cover operating costs. This is clearly a significant challenge and would be impacted upon if airport patronage did not increase at the predicted level.
Highway
Appraisal of the highway scheme and package option has been carried out based on the following tests:
Core assumption tests appraised with the following Tuba runs:
Initial Tuba; and
Final (Cordoned) Tuba.
The A64 to LBIA Airport Link Road modelling results are presented in the report in terms of impacts on the following impacts:
Flow distribution - % of trips using the link road;
Delays; and
Journey Times.
In summary the link road is used more dominantly by traffic from the west and south of the airport with limited benefit to traffic from the east and north. Between 30% and 40% of trips to the airport are forecast to use the link road, with the proportion of airport to non-airport traffic using the link road reducing if the speed limit is increased to 70mph.
Increased delays are forecast on the approaches to the link road, and at the Dyneley Arms junction. Journey times are forecast to improve for the majority of movements, with the exception of trips to and from Harrogate as a result of the increased junction delays.
The link road provides a BCR exceeding 4 with either the 40mph or 70mph option, both of which imply very high value for money, subject to the assessment of unquantified impacts.
The Package 1 (Bradford junction corridor improvements) modelling results are also presented in the report in terms of impacts on the following:
Flow distribution - % of trips using the link road;
Delays; and
Journey times
In summary the roads immediately surrounding the proposed improvements are particularly sensitive to changes made at the junctions. Route switching as a result of the changes has been forecast; however few significant changes in delays are forecast. The most significant change in delay is forecast at the Greengates junction. Journey times are forecast to improve for many of the movements analysed.
131
The Package 1 option provides a BCR exceeding 4 which also implies very high value for money, subject to the assessment of unquantified impacts.
The link road economic assessment as a single carriage way road indicates it would offer value for money on the basis of a cordoned model, although future modelling would need to ensure that the model detail in the area around the airport allows sufficient analysis of demand;
The new Link Road has the potential to offer improvements to the bus based schemes, by improving journey times.
Modelling and Appraisal Limitations
The modelling and appraisal has been undertaken based on a proportionate approach bearing in mind the stage of scheme development. A broad spectrum of highway and public transport schemes has been assessed.
A number of limitations have been identified in the approach but which are justified in the context of the current development stage. These limitations will be used in scoping out the modelling and appraisal methodology to further progress the schemes, which will be set out in the project Appraisal Specification Report (ASR).
It should also be noted that in the assessment of Value for Money (VfM) a number of aspects are assessed in addition to the Benefit to Cost Ratio (BCR). For example, non-monetised impacts, e.g. impact on the landscape or journey time reliability and variability improvements, that could be very significant and therefore lead to a different VfM conclusion. The tabulation of scheme assessments shown in our Option Assessment Framework (OAF) draws out an overall view of VfM giving due consideration to what we know about all impacts in the economic case.
There are limitations in forecasting (for example the use of central case aviation forecasts and the uncertainty around these, there is no account taken of capturing passenger ‘leakage’ to Manchester Airport, and there is considerable uncertainty on future land use immediately around the airport).
Each option delivers different benefits and not all are mutually exclusive i.e. if the airport grows building a link road now will not rule out a rail link being delivered at a later stage. It is also worth acknowledging and understanding the impact each scheme has on another (for example the benefits of the link road on bus services, but the negative impact a rail link would have for bus demand).
Option Assessment Framework 12.2An initial Option Assessment Framework summarising the scheme impacts and benefits is included in the following tables for each appraised option. This is intended to demonstrate the logic underpinning the reason for selecting schemes taken forward for further assessment and capturing impacts in addition to the assessment of BCR.
Conclusions are based on a combination of the economic performance of the scheme, but also an assessment of delivery against the project objectives and other non-monetised impacts, with particular reference to improving airport connectivity and contributing towards growth at the airport.
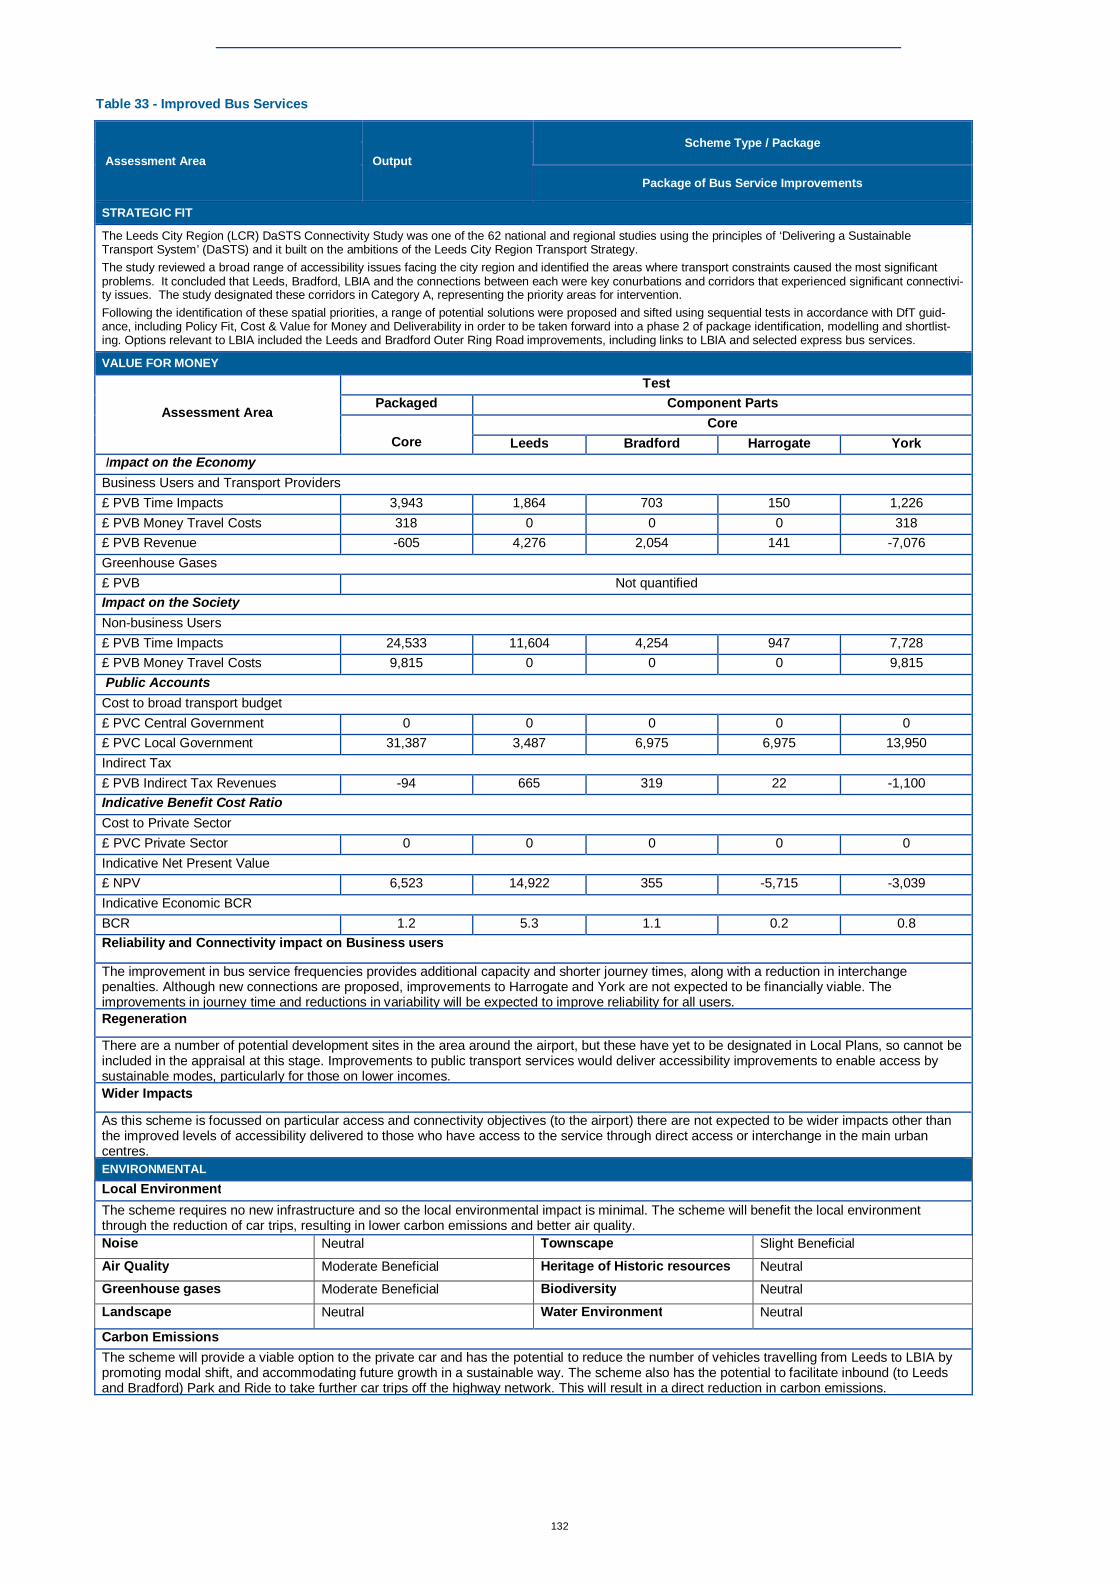
132
Table 33 - Improved Bus Services
Assessment Area Output Scheme Type / Package
Package of Bus Service Improvements
STRATEGIC FIT
The Leeds City Region (LCR) DaSTS Connectivity Study was one of the 62 national and regional studies using the principles of ‘Delivering a Sustainable Transport System’ (DaSTS) and it built on the ambitions of the Leeds City Region Transport Strategy. The study reviewed a broad range of accessibility issues facing the city region and identified the areas where transport constraints caused the most significant problems. It concluded that Leeds, Bradford, LBIA and the connections between each were key conurbations and corridors that experienced significant connectivi-ty issues. The study designated these corridors in Category A, representing the priority areas for intervention. Following the identification of these spatial priorities, a range of potential solutions were proposed and sifted using sequential tests in accordance with DfT guid-ance, including Policy Fit, Cost & Value for Money and Deliverability in order to be taken forward into a phase 2 of package identification, modelling and shortlist-ing. Options relevant to LBIA included the Leeds and Bradford Outer Ring Road improvements, including links to LBIA and selected express bus services.
VALUE FOR MONEY
Assessment Area
Test Packaged Component Parts
Core Core
Leeds Bradford Harrogate York Impact on the Economy Business Users and Transport Providers £ PVB Time Impacts 3,943 1,864 703 150 1,226 £ PVB Money Travel Costs 318 0 0 0 318 £ PVB Revenue -605 4,276 2,054 141 -7,076 Greenhouse Gases £ PVB Not quantified Impact on the Society Non-business Users £ PVB Time Impacts 24,533 11,604 4,254 947 7,728 £ PVB Money Travel Costs 9,815 0 0 0 9,815 Public Accounts Cost to broad transport budget £ PVC Central Government 0 0 0 0 0 £ PVC Local Government 31,387 3,487 6,975 6,975 13,950 Indirect Tax £ PVB Indirect Tax Revenues -94 665 319 22 -1,100 Indicative Benefit Cost Ratio Cost to Private Sector £ PVC Private Sector 0 0 0 0 0 Indicative Net Present Value £ NPV 6,523 14,922 355 -5,715 -3,039 Indicative Economic BCR BCR 1.2 5.3 1.1 0.2 0.8 Reliability and Connectivity impact on Business users
The improvement in bus service frequencies provides additional capacity and shorter journey times, along with a reduction in interchange penalties. Although new connections are proposed, improvements to Harrogate and York are not expected to be financially viable. The improvements in journey time and reductions in variability will be expected to improve reliability for all users. Regeneration
There are a number of potential development sites in the area around the airport, but these have yet to be designated in Local Plans, so cannot be included in the appraisal at this stage. Improvements to public transport services would deliver accessibility improvements to enable access by sustainable modes, particularly for those on lower incomes. Wider Impacts
As this scheme is focussed on particular access and connectivity objectives (to the airport) there are not expected to be wider impacts other than the improved levels of accessibility delivered to those who have access to the service through direct access or interchange in the main urban centres. ENVIRONMENTAL Local Environment The scheme requires no new infrastructure and so the local environmental impact is minimal. The scheme will benefit the local environment through the reduction of car trips, resulting in lower carbon emissions and better air quality. Noise Neutral Townscape Slight Beneficial
Air Quality Moderate Beneficial Heritage of Historic resources Neutral
Greenhouse gases Moderate Beneficial Biodiversity Neutral
Landscape Neutral Water Environment Neutral
Carbon Emissions The scheme will provide a viable option to the private car and has the potential to reduce the number of vehicles travelling from Leeds to LBIA by promoting modal shift, and accommodating future growth in a sustainable way. The scheme also has the potential to facilitate inbound (to Leeds and Bradford) Park and Ride to take further car trips off the highway network. This will result in a direct reduction in carbon emissions.
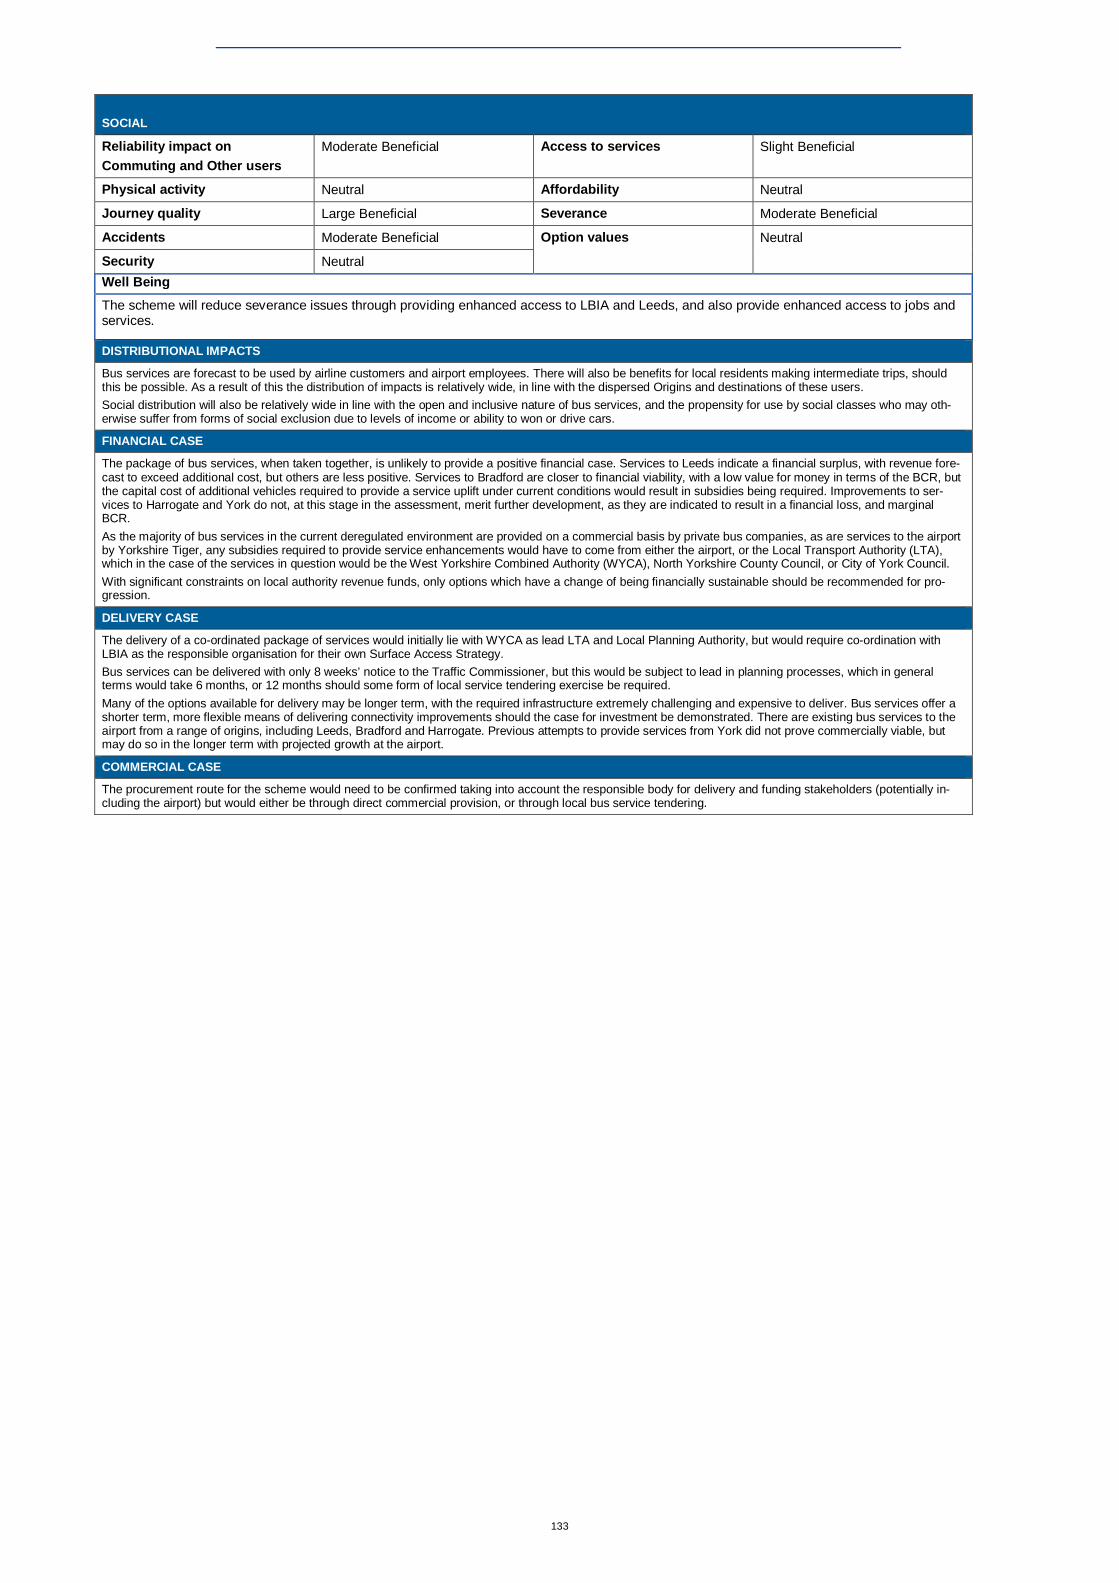
133
SOCIAL
Reliability impact on Commuting and Other users
Moderate Beneficial Access to services Slight Beneficial
Physical activity Neutral Affordability Neutral
Journey quality Large Beneficial Severance Moderate Beneficial
Accidents Moderate Beneficial Option values Neutral
Security Neutral Well Being The scheme will reduce severance issues through providing enhanced access to LBIA and Leeds, and also provide enhanced access to jobs and services.
DISTRIBUTIONAL IMPACTS
Bus services are forecast to be used by airline customers and airport employees. There will also be benefits for local residents making intermediate trips, should this be possible. As a result of this the distribution of impacts is relatively wide, in line with the dispersed Origins and destinations of these users. Social distribution will also be relatively wide in line with the open and inclusive nature of bus services, and the propensity for use by social classes who may oth-erwise suffer from forms of social exclusion due to levels of income or ability to won or drive cars.
FINANCIAL CASE
The package of bus services, when taken together, is unlikely to provide a positive financial case. Services to Leeds indicate a financial surplus, with revenue fore-cast to exceed additional cost, but others are less positive. Services to Bradford are closer to financial viability, with a low value for money in terms of the BCR, but the capital cost of additional vehicles required to provide a service uplift under current conditions would result in subsidies being required. Improvements to ser-vices to Harrogate and York do not, at this stage in the assessment, merit further development, as they are indicated to result in a financial loss, and marginal BCR. As the majority of bus services in the current deregulated environment are provided on a commercial basis by private bus companies, as are services to the airport by Yorkshire Tiger, any subsidies required to provide service enhancements would have to come from either the airport, or the Local Transport Authority (LTA), which in the case of the services in question would be the West Yorkshire Combined Authority (WYCA), North Yorkshire County Council, or City of York Council. With significant constraints on local authority revenue funds, only options which have a change of being financially sustainable should be recommended for pro-gression.
DELIVERY CASE
The delivery of a co-ordinated package of services would initially lie with WYCA as lead LTA and Local Planning Authority, but would require co-ordination with LBIA as the responsible organisation for their own Surface Access Strategy. Bus services can be delivered with only 8 weeks’ notice to the Traffic Commissioner, but this would be subject to lead in planning processes, which in general terms would take 6 months, or 12 months should some form of local service tendering exercise be required. Many of the options available for delivery may be longer term, with the required infrastructure extremely challenging and expensive to deliver. Bus services offer a shorter term, more flexible means of delivering connectivity improvements should the case for investment be demonstrated. There are existing bus services to the airport from a range of origins, including Leeds, Bradford and Harrogate. Previous attempts to provide services from York did not prove commercially viable, but may do so in the longer term with projected growth at the airport.
COMMERCIAL CASE
The procurement route for the scheme would need to be confirmed taking into account the responsible body for delivery and funding stakeholders (potentially in-cluding the airport) but would either be through direct commercial provision, or through local bus service tendering.

134
Table 34 - Heavy Rail (Horsforth - LBIA)
Assessment Area Output Scheme Type / Package
Rail Link between Horsforth and LBIA – through services assumed
STRATEGIC FIT
The Leeds City Region (LCR) DaSTS Connectivity Study was one of the 62 national and regional studies using the principles of ‘Delivering a Sustainable Transport System’ (DaSTS) and it built on the ambitions of the Leeds City Region Transport Strategy. The study reviewed a broad range of accessibility issues facing the city region and identified the areas where transport constraints caused the most significant problems. It concluded that Leeds, Bradford, LBIA and the connections between each were key conurbations and corridors that experienced significant connectivi-ty issues. The study designated these corridors in Category A, representing the priority areas for intervention. The Yorkshire Rail Network Study makes reference to previous evidence gathered by Eddington, and as part of the former Northern Way. This identifies the im-portant economic role played by LBIA and that surface access capacity is a constraint to future airport growth. Although now quite old, unpublished market research undertaken in 2005 for Trans Pennine Express (ORC International, 2005) cited in the YRNS demonstrated that air passengers have a high awareness of rail as an access option to Manchester Airport, but rail's operating hours does not allow them to arrive at the airport in time for their departing flight or to use rail for the return journey. The same research also shows that for those air passengers who consider using rail the three most significant deterrents were the frequency of service, journey reliability and lack of a direct service. The importance of direct services has also been quantified by Lythgoe and Wardman (2002) and was also cited in the YRNS. This demonstrated that air passengers using rail to access an airport have a greater values of time and that they place a greater penalty on interchange than other types of rail passenger. This must therefore be a key consideration for any solution at LBIA. The core option of through rail services is the only realistic option as an increased interchange penalty of changing trains would make the stand alone service perform even more poorly. In terms of other supporting evidence provided as part of the YRNS, The importance of direct rail services to airports has also been demonstrated in DfT-commissioned qualitative research on air passengers' journey experiences by Sykes and Desai (2009) which reported ‘where available, trains were regarded as a good alternative to road travel by some respondents, especially where the train route was straightforward and services frequent and reliable. The LBIA Surface Access Strategy (SAS) document outlines the issues and proposals to improve connectivity to LBIA from Leeds, Bradford, Harrogate and York. The SAS accepts that improvements in access are required and highlights the provision of a new direct road link from the A65 and a new fixed rail link, currently being investigated as part of a review of the Harrogate line, as examples of schemes that would better support growth and improve connectivity. The introduction of rail connectivity to the airport currently exists as a potential scheme in the West Yorkshire (Plus) Transport Fund. The transformational schemes that have been identified for further development and investment at a City region level include rail or tram train connections between Leeds and Bradford to Leeds Bradford International Airport.
VALUE FOR MONEY
Impact on the Economy
Business Users and Transport Providers £ PVB Time Impacts 5,844
£ PVB Money Travel Costs -125
£ PVB Revenue 13,863
Impact on the Environment
Greenhouse Gases £ PVB Not Quantified
Impact on the Society
Non-business Users £ PVB Time Impacts 36,472
£ PVB Money Travel Costs -4,003
Public Accounts
Cost to broad transport budget £ PVC Central Government 0
£ PVC Local Government 75,181
Indirect Tax £ PVB Indirect Tax Revenues 2,156
Indicative Benefit Cost Ratio
Cost to Private Sector £ PVC Private Sector 0
Indicative Net Present Value £ NPV ('000) -20,974
Indicative Economic BCR BCR 0.7 Reliability and Connectivity impact on Business users
The scheme delivers significant improvements in connectivity from the main centres and intermediate stations. This will be complemented by improved wider connectivity by interchange at Leeds. The provision of through rail services at Horsforth would clearly provide far greater connectivity improvements, and there would be the potential to operate services to onwards destinations through Leeds.
Regeneration
There are a number of potential development sites in the area around the airport, but these have yet to be designated in Local Plans, so cannot be included in the appraisal at this stage. Improvements to public transport services would deliver accessibility improvements to enable access by sustainable modes, particularly for those on lower incomes. Wider Impacts
As this scheme is focussed on particular access and connectivity objectives (to the airport) there are not expected to be wider impacts other than the improved levels of accessibility delivered to those who have access to the rail service through direct access or interchange in the main urban centres.

135
ENVIRONMENTAL Local Environment
The scheme would require significant infrastructure and civil engineering works to construct the link between Horsforth and the airport.
As the airport is situated in an elevated position from the main railway, even if taking gradients into consideration, it is expected that earthworks to create a cutting would be required at the Horsforth end. As the area is predominantly greenfield land, this would have a detrimental impact.
The image included here illustrates the area where the rail link would be constructed.
Noise Slight Negative Townscape Slight Beneficial
Air Quality Moderate Beneficial Heritage of Historic resources Neutral
Greenhouse gases Moderate Beneficial Biodiversity Slight Adverse
Landscape Moderate Adverse Water Environment Neutral
Carbon Emissions The scheme will provide a viable option to the private car and has the potential to reduce the number of vehicles travelling from Leeds to LBIA by promoting modal shift, and accommodating future growth in a sustainable way. The scheme also has the potential to facilitate inbound (to Leeds) Park and Ride to take further car trips off the highway network. This will result in a direct reduction in carbon emissions.
SOCIAL
Reliability impact on Commuting and Other users
Moderate Beneficial Access to services Slight Beneficial
Physical activity Neutral Affordability Neutral
Journey quality Large Beneficial Severance Moderate Beneficial
Accidents Moderate Beneficial Option values Neutral
Security Neutral Well Being The scheme will reduce severance issues by providing enhanced access to local centres and to the airport from intermediate stations. It will also support active travel through becoming a viable alternative to the private car, thus encouraging commuters to walk or cycle for a leg of the journey, with facilities to support this interchange. It is not expected to improve local accessibility and may create a degree of severance for some local residents through the construction of a fixed link. DISTRIBUTIONAL
The rail link is forecast to be used by airline customers, airport employees. It also has the potential to provide inbound (to Leeds only) Park and Ride facilities. As a result of this the distribution of impacts is wide, in line with the dispersed Origins and Destinations of these users. Distributional analysis has been completed as part of the model interrogation, but this has not been converted into a full GIS based demographic or spatial assessment.
FINANCIAL CASE
It is expected at this stage that the capital cost for the rail construction would be sourced from either central government (DfT) funds, specific competitive funding opportunities or through devolved funding available through the WY+TF. Any service subsidy for rail services would have to be provided through existing rail fran-chise arrangements, possibly administered by WYCA or Rail North in future, and with contributions from LBIA, until they became financially sustainable.
DELIVERY CASE
The primary delivery organisation for the rail link would be Network Rail as asset owner, but involvement from WYCA as the Local Transport Authority and WY+TF programme co-ordinator. There is wide stakeholder support for accessibility improvements, including by rail, and the potential for a rail link is currently being pro-moted by WYCA, Bradford and Leeds Councils through the WY+TF. There is however a degree of concern locally over the potential environmental and quality of life impacts the rail link could have, which will need to be mitigated against during the design and consultation process. There could be significant local resident opposition to the rail scheme, particularly amongst those directly af-fected, and there are significant engineering constraints that need to be overcome due to the topography of the area.
COMMERCIAL CASE
The procurement route for the scheme would need to be confirmed taking into account the responsible body for delivery and funding stakeholders (potentially in-cluding the airport)

136
Table 35 – LBIA Parkway Station
Assessment Area Output Scheme Type / Package
Parkway Station on the Leeds – Harrogate – York Rail Line close to Bramhope Tunnel
STRATEGIC FIT
The Leeds City Region (LCR) DaSTS Connectivity Study was one of the 62 national and regional studies using the principles of ‘Delivering a Sustainable Transport System’ (DaSTS) and it built on the ambitions of the Leeds City Region Transport Strategy. The study reviewed a broad range of accessibility issues facing the city region and identified the areas where transport constraints caused the most significant problems. It concluded that Leeds, Bradford, LBIA and the connections between each were key conurbations and corridors that experienced significant connectivi-ty issues. The study designated these corridors in Category A, representing the priority areas for intervention. The Yorkshire Rail Network Study makes reference to previous evidence gathered by Eddington, and as part of the former Northern Way. This identifies the im-portant economic role played by LBIA and that surface access capacity is a constraint to future airport growth. Although now quite old, unpublished market research undertaken in 2005 for Trans Pennine Express (ORC International, 2005) cited in the YRNS demonstrated that air passengers have a high awareness of rail as an access option to Manchester Airport, but rail's operating hours does not allow them to arrive at the airport in time for their departing flight or to use rail for the return journey. The same research also shows that for those air passengers who consider using rail the three most significant deterrents were the frequency of service, journey reliability and lack of a direct service. The importance of direct services has also been quantified by Lythgoe and Wardman (2002) and was also cited in the YRNS. This demonstrated that air passengers using rail to access an airport have a greater values of time and that they place a greater penalty on interchange than other types of rail passenger. This must therefore be a key consideration for any solution at LBIA. The core option of through rail services is the only realistic option as an increased interchange penalty of changing trains would make the stand alone service perform even more poorly. In terms of other supporting evidence provided as part of the YRNS, The importance of direct rail services to airports has also been demonstrated in DfT-commissioned qualitative research on air passengers' journey experiences by Sykes and Desai (2009) which reported ‘where available, trains were regarded as a good alternative to road travel by some respondents, especially where the train route was straightforward and services frequent and reliable. The LBIA Surface Access Strategy (SAS) document outlines the issues and proposals to improve connectivity to LBIA from Leeds, Bradford, Harrogate and York. The SAS accepts that improvements in access are required and highlights the provision of a new direct road link from the A65 and a new fixed rail link, currently being investigated as part of a review of the Harrogate line, as examples of schemes that would better support growth and improve connectivity. The introduction of rail connectivity to the airport currently exists as a potential scheme in the West Yorkshire (Plus) Transport Fund. The transformational schemes that have been identified for further development and investment at a City region level include rail or tram train connections between Leeds and Bradford to Leeds Bradford International Airport. The provision of a station on the existing rail line between Leeds, Harrogate and York, which is the closest current rail line to the airport, is seen as a potential short term delivery option to deliver rail access to the airport. Reference should be made however to longer term aspirations to deliver direct rail access which this scheme could have a direct impact on, as it may take some of the demand, and therefore benefit, from any future scheme.
VALUE FOR MONEY
Impact on the Economy
Business Users and Transport Providers £ PVB Time Impacts -11
£ PVB Money Travel Costs -14
£ PVB Revenue -301
Impact on the Environment
Greenhouse Gases £ PVB Not Quantified
Impact on the Society
Non-business Users £ PVB Time Impacts -64
£ PVB Money Travel Costs -459
Public Accounts
Cost to broad transport budget £ PVC Central Government 0
£ PVC Local Government 10,629
Indirect Tax £ PVB Indirect Tax Revenues -47
Indicative Benefit Cost Ratio
Cost to Private Sector £ PVC Private Sector 0
Indicative Net Present Value £ NPV ('000) -11,525
Indicative Economic BCR BCR -0.1 Reliability and Connectivity impact on Business users The station would mainly benefit airport users due to its remote location (i.e. not close to existing housing, etc.) and does not really have a dual function.
Regeneration
There are a number of potential development sites in the area around the airport, but these have yet to be designated in Local Plans, so cannot be included in the appraisal at this stage. Improvements to public transport services would deliver accessibility improvements to enable access by sustainable modes, particularly for those on lower incomes.
Wider Impacts
As this scheme is focussed on particular access and connectivity objectives (to the airport) there are not expected to be wider impacts other than the improved levels of accessibility delivered to those who have access to the rail service through direct access or interchange in the main urban centres. ENVIRONMENT Local Environment
The scheme will require additional land take to provide the station and thus have a slight adverse impact on the local environment. There will be an additional requirement for land to provide supporting infrastructure, including the car park and highway access.
The station would be located in a rural environment and would therefore need to be sympathetically designed. It is understood there may be restrictions on some of the rail infrastructure due to listed status of the cutting retaining wall designs on the approach to the Bramhope Tunnel southern entrance.
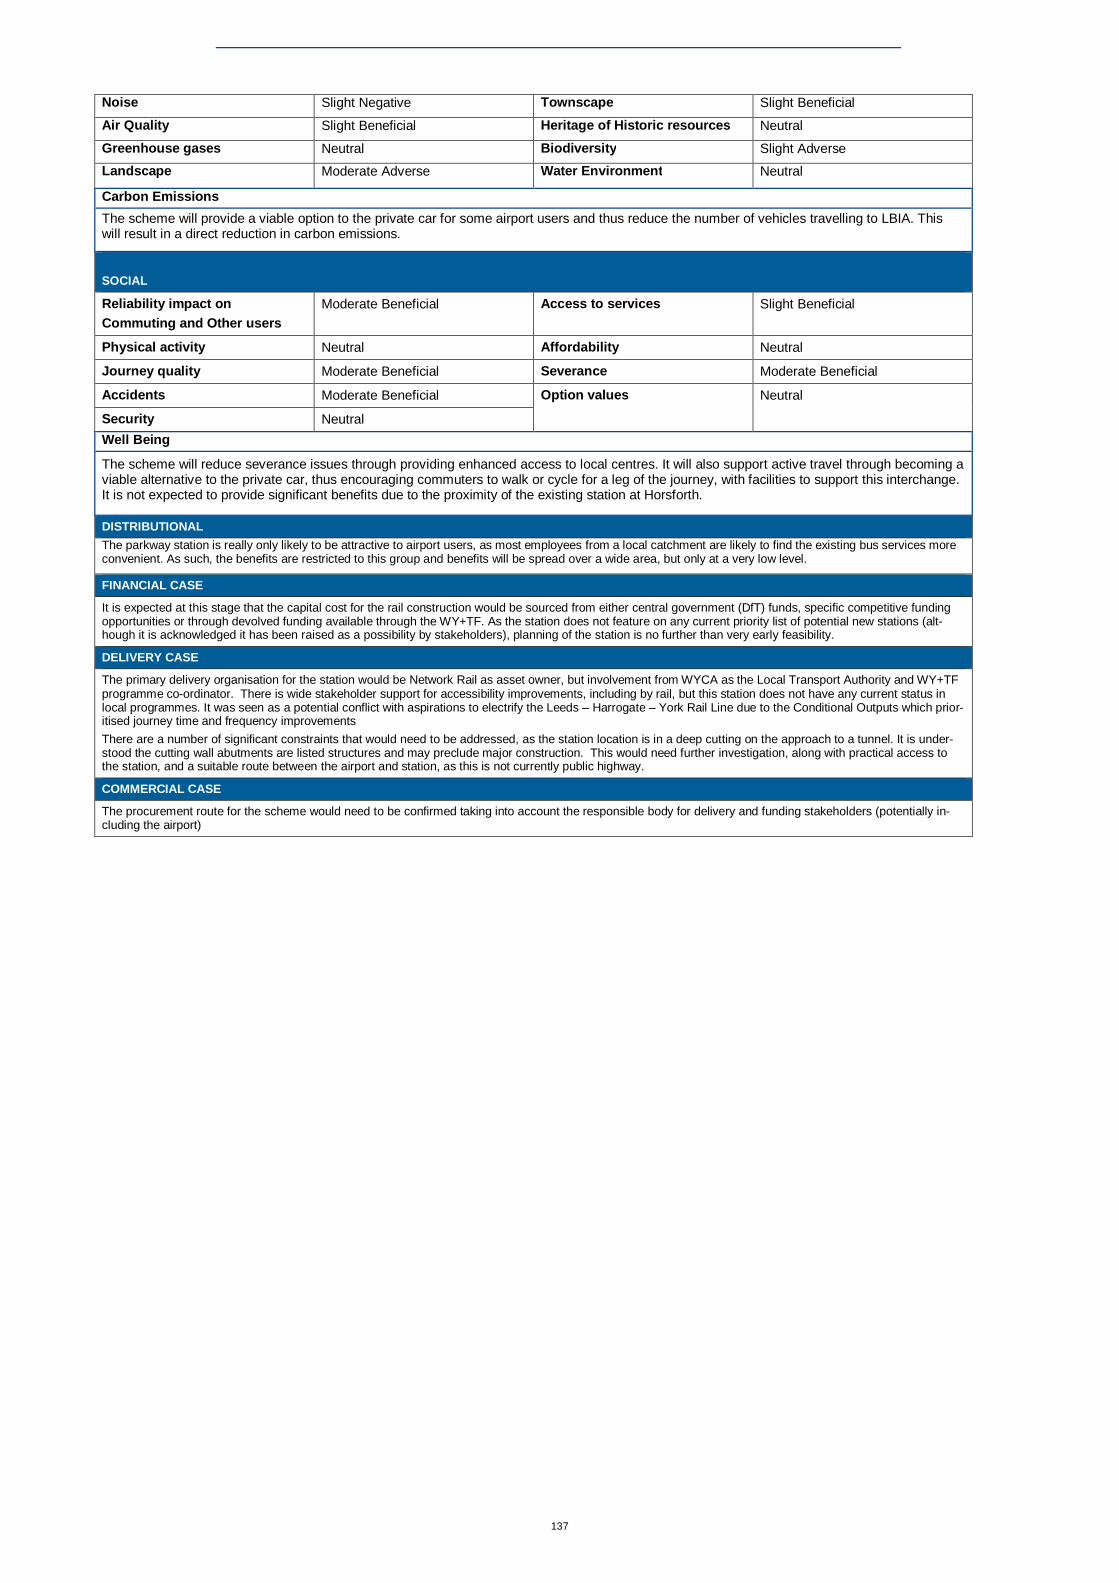
137
Noise Slight Negative Townscape Slight Beneficial
Air Quality Slight Beneficial Heritage of Historic resources Neutral
Greenhouse gases Neutral Biodiversity Slight Adverse
Landscape Moderate Adverse Water Environment Neutral
Carbon Emissions The scheme will provide a viable option to the private car for some airport users and thus reduce the number of vehicles travelling to LBIA. This will result in a direct reduction in carbon emissions.
SOCIAL
Reliability impact on Commuting and Other users
Moderate Beneficial Access to services Slight Beneficial
Physical activity Neutral Affordability Neutral
Journey quality Moderate Beneficial Severance Moderate Beneficial
Accidents Moderate Beneficial Option values Neutral
Security Neutral Well Being
The scheme will reduce severance issues through providing enhanced access to local centres. It will also support active travel through becoming a viable alternative to the private car, thus encouraging commuters to walk or cycle for a leg of the journey, with facilities to support this interchange. It is not expected to provide significant benefits due to the proximity of the existing station at Horsforth.
DISTRIBUTIONAL The parkway station is really only likely to be attractive to airport users, as most employees from a local catchment are likely to find the existing bus services more convenient. As such, the benefits are restricted to this group and benefits will be spread over a wide area, but only at a very low level.
FINANCIAL CASE
It is expected at this stage that the capital cost for the rail construction would be sourced from either central government (DfT) funds, specific competitive funding opportunities or through devolved funding available through the WY+TF. As the station does not feature on any current priority list of potential new stations (alt-hough it is acknowledged it has been raised as a possibility by stakeholders), planning of the station is no further than very early feasibility.
DELIVERY CASE
The primary delivery organisation for the station would be Network Rail as asset owner, but involvement from WYCA as the Local Transport Authority and WY+TF programme co-ordinator. There is wide stakeholder support for accessibility improvements, including by rail, but this station does not have any current status in local programmes. It was seen as a potential conflict with aspirations to electrify the Leeds – Harrogate – York Rail Line due to the Conditional Outputs which prior-itised journey time and frequency improvements There are a number of significant constraints that would need to be addressed, as the station location is in a deep cutting on the approach to a tunnel. It is under-stood the cutting wall abutments are listed structures and may preclude major construction. This would need further investigation, along with practical access to the station, and a suitable route between the airport and station, as this is not currently public highway.
COMMERCIAL CASE
The procurement route for the scheme would need to be confirmed taking into account the responsible body for delivery and funding stakeholders (potentially in-cluding the airport)
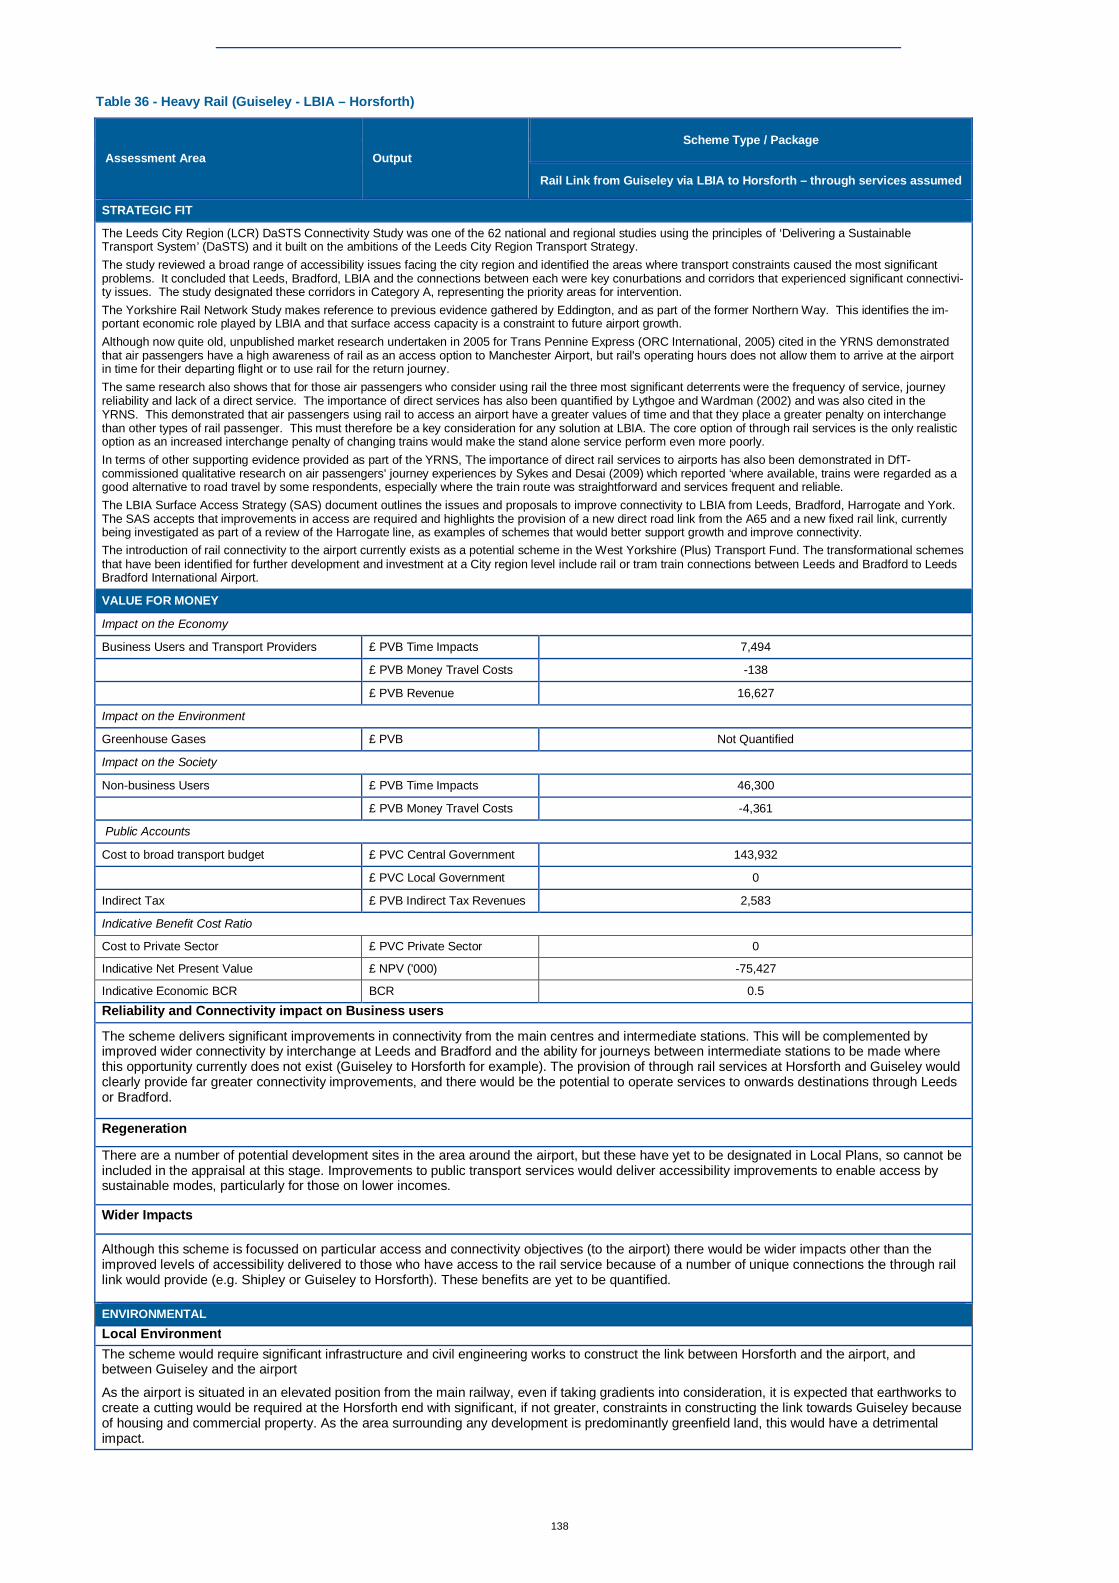
138
Table 36 - Heavy Rail (Guiseley - LBIA – Horsforth)
Assessment Area Output Scheme Type / Package
Rail Link from Guiseley via LBIA to Horsforth – through services assumed
STRATEGIC FIT
The Leeds City Region (LCR) DaSTS Connectivity Study was one of the 62 national and regional studies using the principles of ‘Delivering a Sustainable Transport System’ (DaSTS) and it built on the ambitions of the Leeds City Region Transport Strategy. The study reviewed a broad range of accessibility issues facing the city region and identified the areas where transport constraints caused the most significant problems. It concluded that Leeds, Bradford, LBIA and the connections between each were key conurbations and corridors that experienced significant connectivi-ty issues. The study designated these corridors in Category A, representing the priority areas for intervention. The Yorkshire Rail Network Study makes reference to previous evidence gathered by Eddington, and as part of the former Northern Way. This identifies the im-portant economic role played by LBIA and that surface access capacity is a constraint to future airport growth. Although now quite old, unpublished market research undertaken in 2005 for Trans Pennine Express (ORC International, 2005) cited in the YRNS demonstrated that air passengers have a high awareness of rail as an access option to Manchester Airport, but rail's operating hours does not allow them to arrive at the airport in time for their departing flight or to use rail for the return journey. The same research also shows that for those air passengers who consider using rail the three most significant deterrents were the frequency of service, journey reliability and lack of a direct service. The importance of direct services has also been quantified by Lythgoe and Wardman (2002) and was also cited in the YRNS. This demonstrated that air passengers using rail to access an airport have a greater values of time and that they place a greater penalty on interchange than other types of rail passenger. This must therefore be a key consideration for any solution at LBIA. The core option of through rail services is the only realistic option as an increased interchange penalty of changing trains would make the stand alone service perform even more poorly. In terms of other supporting evidence provided as part of the YRNS, The importance of direct rail services to airports has also been demonstrated in DfT-commissioned qualitative research on air passengers' journey experiences by Sykes and Desai (2009) which reported ‘where available, trains were regarded as a good alternative to road travel by some respondents, especially where the train route was straightforward and services frequent and reliable. The LBIA Surface Access Strategy (SAS) document outlines the issues and proposals to improve connectivity to LBIA from Leeds, Bradford, Harrogate and York. The SAS accepts that improvements in access are required and highlights the provision of a new direct road link from the A65 and a new fixed rail link, currently being investigated as part of a review of the Harrogate line, as examples of schemes that would better support growth and improve connectivity. The introduction of rail connectivity to the airport currently exists as a potential scheme in the West Yorkshire (Plus) Transport Fund. The transformational schemes that have been identified for further development and investment at a City region level include rail or tram train connections between Leeds and Bradford to Leeds Bradford International Airport.
VALUE FOR MONEY
Impact on the Economy
Business Users and Transport Providers £ PVB Time Impacts 7,494
£ PVB Money Travel Costs -138
£ PVB Revenue 16,627
Impact on the Environment
Greenhouse Gases £ PVB Not Quantified
Impact on the Society
Non-business Users £ PVB Time Impacts 46,300
£ PVB Money Travel Costs -4,361
Public Accounts
Cost to broad transport budget £ PVC Central Government 143,932
£ PVC Local Government 0
Indirect Tax £ PVB Indirect Tax Revenues 2,583
Indicative Benefit Cost Ratio
Cost to Private Sector £ PVC Private Sector 0
Indicative Net Present Value £ NPV ('000) -75,427
Indicative Economic BCR BCR 0.5 Reliability and Connectivity impact on Business users
The scheme delivers significant improvements in connectivity from the main centres and intermediate stations. This will be complemented by improved wider connectivity by interchange at Leeds and Bradford and the ability for journeys between intermediate stations to be made where this opportunity currently does not exist (Guiseley to Horsforth for example). The provision of through rail services at Horsforth and Guiseley would clearly provide far greater connectivity improvements, and there would be the potential to operate services to onwards destinations through Leeds or Bradford.
Regeneration
There are a number of potential development sites in the area around the airport, but these have yet to be designated in Local Plans, so cannot be included in the appraisal at this stage. Improvements to public transport services would deliver accessibility improvements to enable access by sustainable modes, particularly for those on lower incomes.
Wider Impacts
Although this scheme is focussed on particular access and connectivity objectives (to the airport) there would be wider impacts other than the improved levels of accessibility delivered to those who have access to the rail service because of a number of unique connections the through rail link would provide (e.g. Shipley or Guiseley to Horsforth). These benefits are yet to be quantified.
ENVIRONMENTAL Local Environment The scheme would require significant infrastructure and civil engineering works to construct the link between Horsforth and the airport, and between Guiseley and the airport
As the airport is situated in an elevated position from the main railway, even if taking gradients into consideration, it is expected that earthworks to create a cutting would be required at the Horsforth end with significant, if not greater, constraints in constructing the link towards Guiseley because of housing and commercial property. As the area surrounding any development is predominantly greenfield land, this would have a detrimental impact.
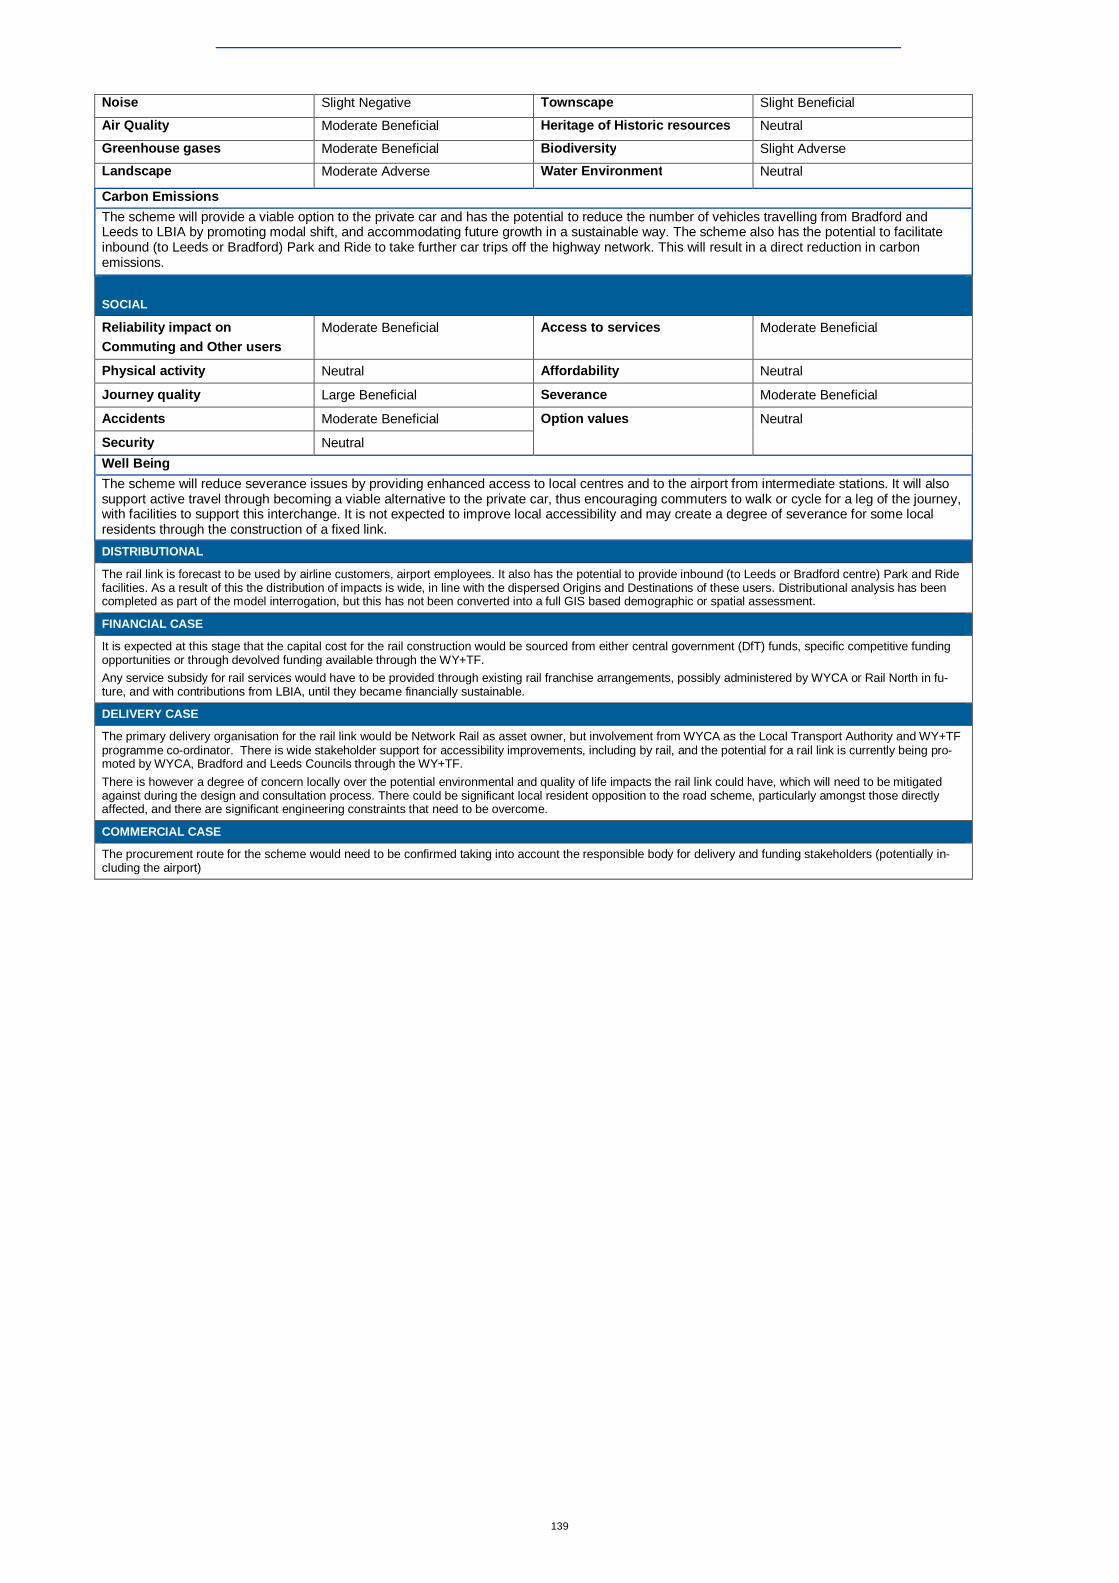
139
Noise Slight Negative Townscape Slight Beneficial
Air Quality Moderate Beneficial Heritage of Historic resources Neutral
Greenhouse gases Moderate Beneficial Biodiversity Slight Adverse
Landscape Moderate Adverse Water Environment Neutral
Carbon Emissions The scheme will provide a viable option to the private car and has the potential to reduce the number of vehicles travelling from Bradford and Leeds to LBIA by promoting modal shift, and accommodating future growth in a sustainable way. The scheme also has the potential to facilitate inbound (to Leeds or Bradford) Park and Ride to take further car trips off the highway network. This will result in a direct reduction in carbon emissions.
SOCIAL
Reliability impact on Commuting and Other users
Moderate Beneficial Access to services Moderate Beneficial
Physical activity Neutral Affordability Neutral
Journey quality Large Beneficial Severance Moderate Beneficial
Accidents Moderate Beneficial Option values Neutral
Security Neutral Well Being The scheme will reduce severance issues by providing enhanced access to local centres and to the airport from intermediate stations. It will also support active travel through becoming a viable alternative to the private car, thus encouraging commuters to walk or cycle for a leg of the journey, with facilities to support this interchange. It is not expected to improve local accessibility and may create a degree of severance for some local residents through the construction of a fixed link. DISTRIBUTIONAL
The rail link is forecast to be used by airline customers, airport employees. It also has the potential to provide inbound (to Leeds or Bradford centre) Park and Ride facilities. As a result of this the distribution of impacts is wide, in line with the dispersed Origins and Destinations of these users. Distributional analysis has been completed as part of the model interrogation, but this has not been converted into a full GIS based demographic or spatial assessment.
FINANCIAL CASE
It is expected at this stage that the capital cost for the rail construction would be sourced from either central government (DfT) funds, specific competitive funding opportunities or through devolved funding available through the WY+TF. Any service subsidy for rail services would have to be provided through existing rail franchise arrangements, possibly administered by WYCA or Rail North in fu-ture, and with contributions from LBIA, until they became financially sustainable.
DELIVERY CASE
The primary delivery organisation for the rail link would be Network Rail as asset owner, but involvement from WYCA as the Local Transport Authority and WY+TF programme co-ordinator. There is wide stakeholder support for accessibility improvements, including by rail, and the potential for a rail link is currently being pro-moted by WYCA, Bradford and Leeds Councils through the WY+TF. There is however a degree of concern locally over the potential environmental and quality of life impacts the rail link could have, which will need to be mitigated against during the design and consultation process. There could be significant local resident opposition to the road scheme, particularly amongst those directly affected, and there are significant engineering constraints that need to be overcome.
COMMERCIAL CASE
The procurement route for the scheme would need to be confirmed taking into account the responsible body for delivery and funding stakeholders (potentially in-cluding the airport)
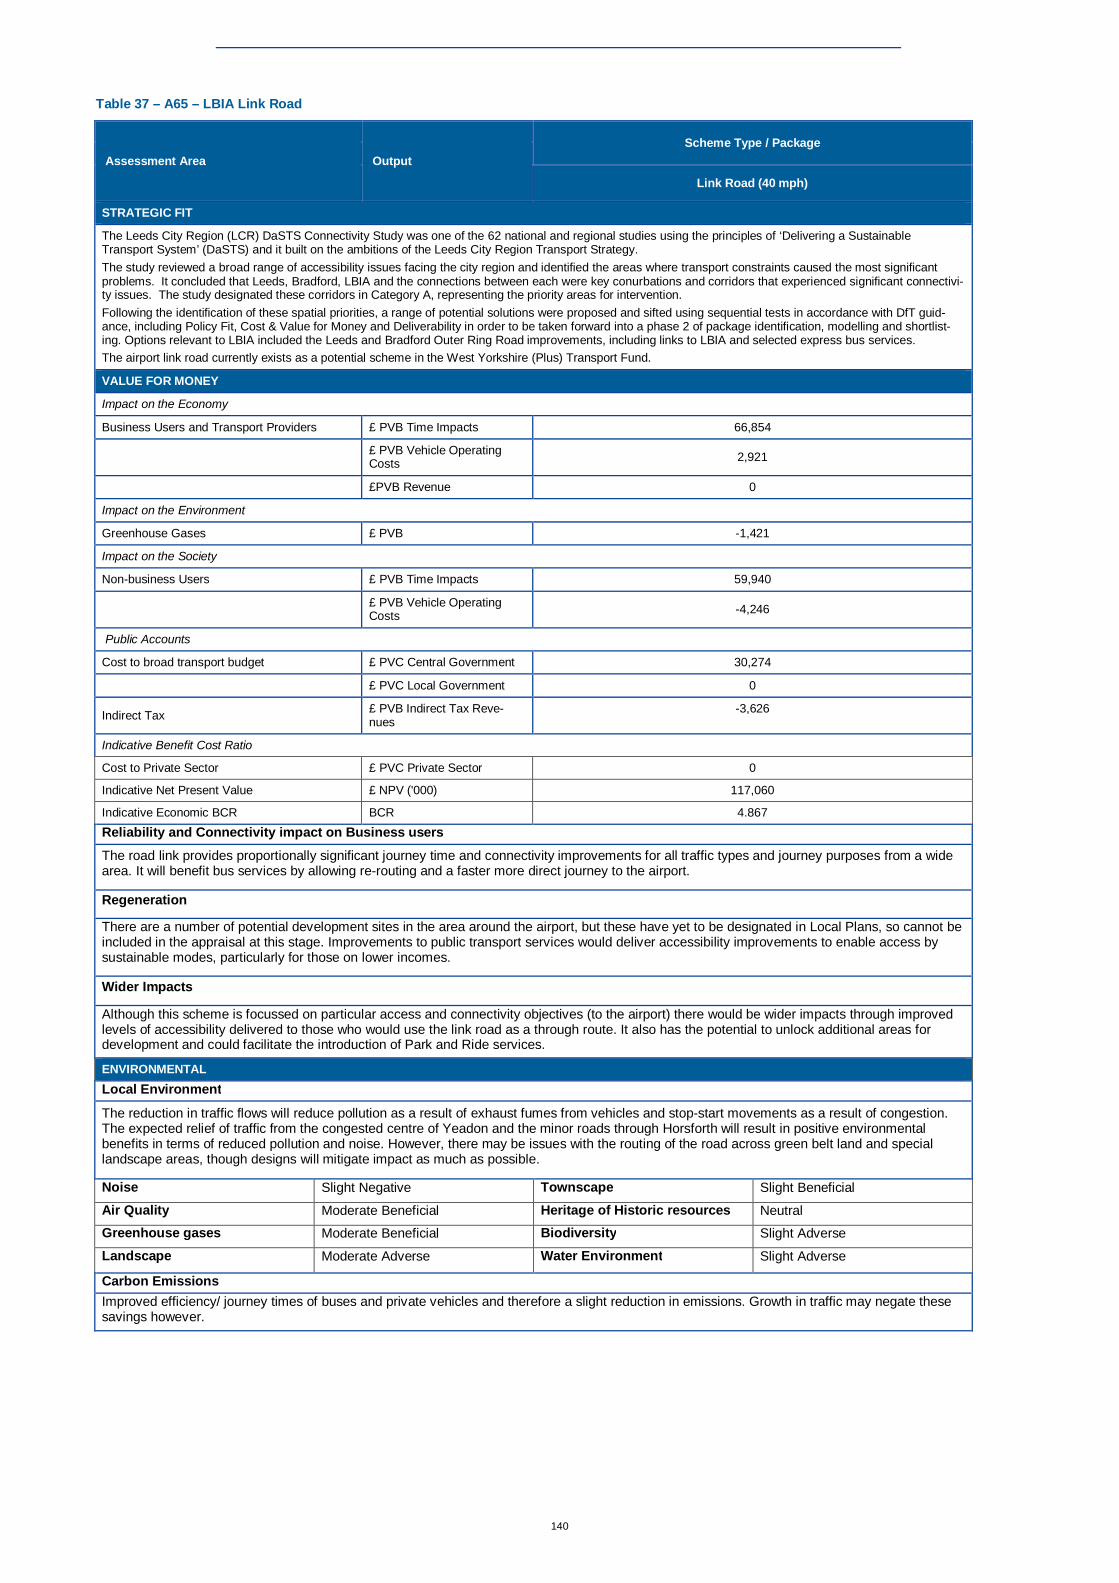
140
Table 37 – A65 – LBIA Link Road
Assessment Area Output Scheme Type / Package
Link Road (40 mph)
STRATEGIC FIT
The Leeds City Region (LCR) DaSTS Connectivity Study was one of the 62 national and regional studies using the principles of ‘Delivering a Sustainable Transport System’ (DaSTS) and it built on the ambitions of the Leeds City Region Transport Strategy. The study reviewed a broad range of accessibility issues facing the city region and identified the areas where transport constraints caused the most significant problems. It concluded that Leeds, Bradford, LBIA and the connections between each were key conurbations and corridors that experienced significant connectivi-ty issues. The study designated these corridors in Category A, representing the priority areas for intervention. Following the identification of these spatial priorities, a range of potential solutions were proposed and sifted using sequential tests in accordance with DfT guid-ance, including Policy Fit, Cost & Value for Money and Deliverability in order to be taken forward into a phase 2 of package identification, modelling and shortlist-ing. Options relevant to LBIA included the Leeds and Bradford Outer Ring Road improvements, including links to LBIA and selected express bus services. The airport link road currently exists as a potential scheme in the West Yorkshire (Plus) Transport Fund.
VALUE FOR MONEY
Impact on the Economy
Business Users and Transport Providers £ PVB Time Impacts 66,854
£ PVB Vehicle Operating Costs 2,921
£PVB Revenue 0
Impact on the Environment
Greenhouse Gases £ PVB -1,421
Impact on the Society
Non-business Users £ PVB Time Impacts 59,940
£ PVB Vehicle Operating Costs -4,246
Public Accounts
Cost to broad transport budget £ PVC Central Government 30,274
£ PVC Local Government 0
Indirect Tax £ PVB Indirect Tax Reve-nues
-3,626
Indicative Benefit Cost Ratio
Cost to Private Sector £ PVC Private Sector 0
Indicative Net Present Value £ NPV ('000) 117,060
Indicative Economic BCR BCR 4.867 Reliability and Connectivity impact on Business users The road link provides proportionally significant journey time and connectivity improvements for all traffic types and journey purposes from a wide area. It will benefit bus services by allowing re-routing and a faster more direct journey to the airport.
Regeneration
There are a number of potential development sites in the area around the airport, but these have yet to be designated in Local Plans, so cannot be included in the appraisal at this stage. Improvements to public transport services would deliver accessibility improvements to enable access by sustainable modes, particularly for those on lower incomes.
Wider Impacts
Although this scheme is focussed on particular access and connectivity objectives (to the airport) there would be wider impacts through improved levels of accessibility delivered to those who would use the link road as a through route. It also has the potential to unlock additional areas for development and could facilitate the introduction of Park and Ride services.
ENVIRONMENTAL Local Environment
The reduction in traffic flows will reduce pollution as a result of exhaust fumes from vehicles and stop-start movements as a result of congestion. The expected relief of traffic from the congested centre of Yeadon and the minor roads through Horsforth will result in positive environmental benefits in terms of reduced pollution and noise. However, there may be issues with the routing of the road across green belt land and special landscape areas, though designs will mitigate impact as much as possible.
Noise Slight Negative Townscape Slight Beneficial
Air Quality Moderate Beneficial Heritage of Historic resources Neutral
Greenhouse gases Moderate Beneficial Biodiversity Slight Adverse
Landscape Moderate Adverse Water Environment Slight Adverse
Carbon Emissions Improved efficiency/ journey times of buses and private vehicles and therefore a slight reduction in emissions. Growth in traffic may negate these savings however.
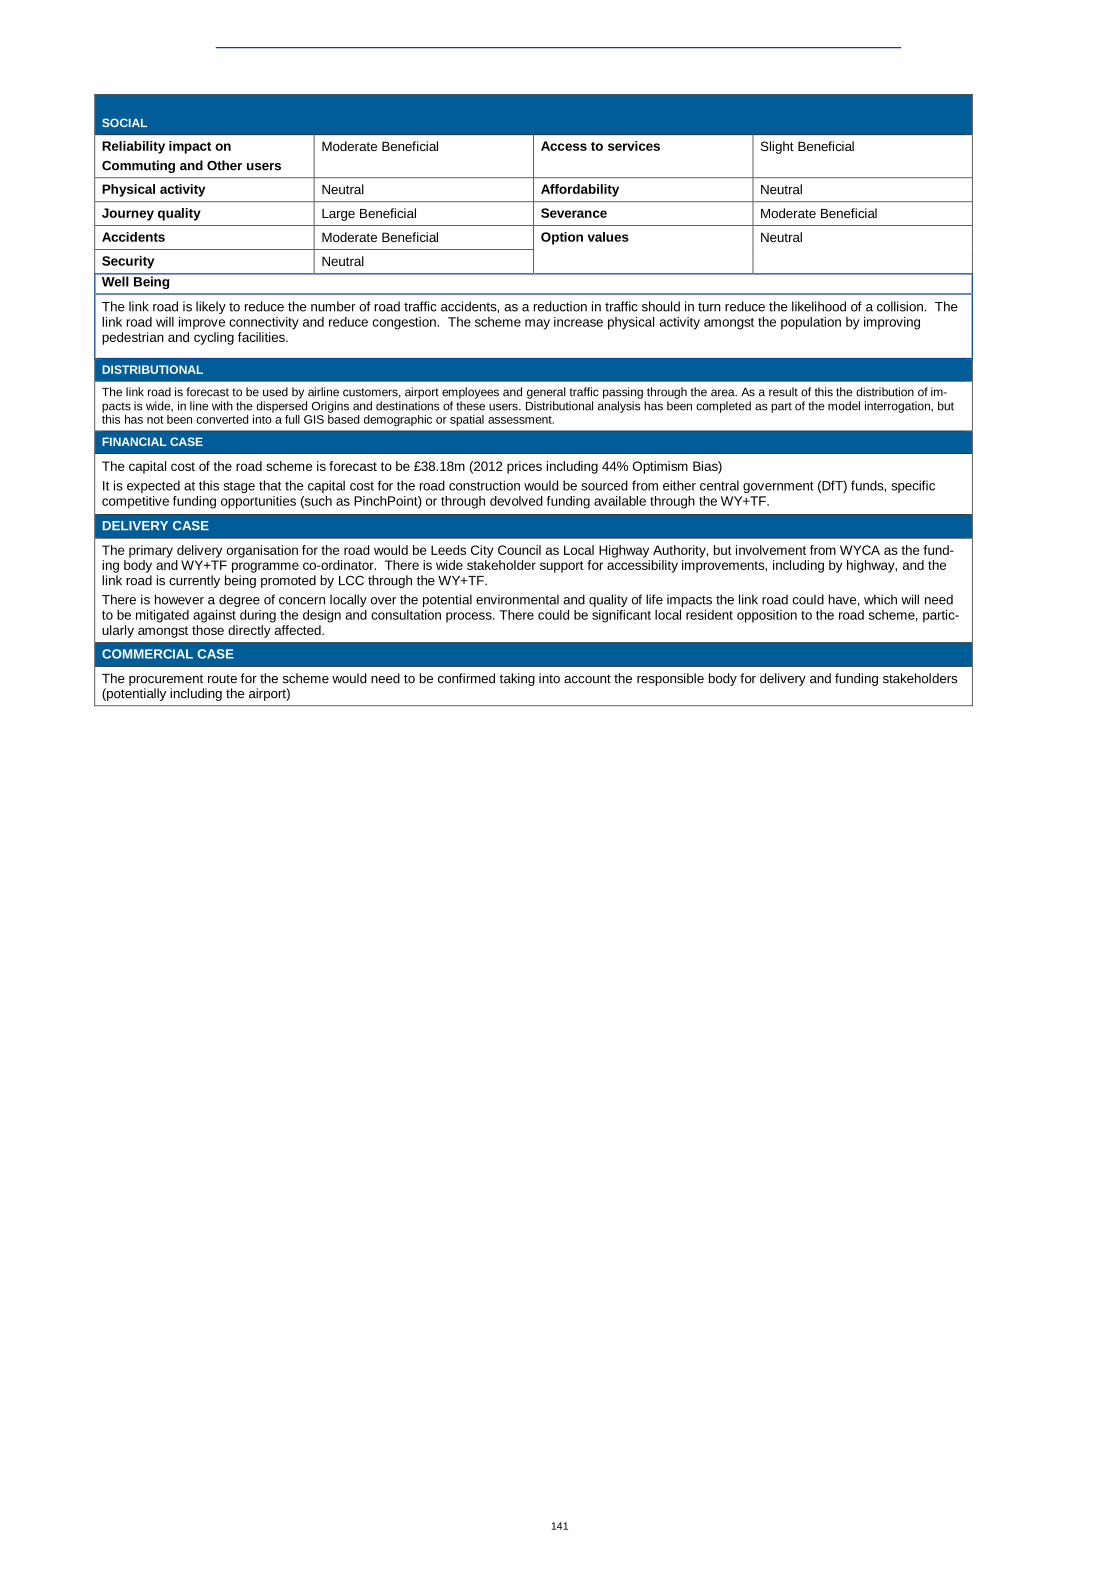
141
SOCIAL
Reliability impact on Commuting and Other users
Moderate Beneficial Access to services Slight Beneficial
Physical activity Neutral Affordability Neutral
Journey quality Large Beneficial Severance Moderate Beneficial
Accidents Moderate Beneficial Option values Neutral
Security Neutral Well Being
The link road is likely to reduce the number of road traffic accidents, as a reduction in traffic should in turn reduce the likelihood of a collision. The link road will improve connectivity and reduce congestion. The scheme may increase physical activity amongst the population by improving pedestrian and cycling facilities.
DISTRIBUTIONAL
The link road is forecast to be used by airline customers, airport employees and general traffic passing through the area. As a result of this the distribution of im-pacts is wide, in line with the dispersed Origins and destinations of these users. Distributional analysis has been completed as part of the model interrogation, but this has not been converted into a full GIS based demographic or spatial assessment.
FINANCIAL CASE
The capital cost of the road scheme is forecast to be £38.18m (2012 prices including 44% Optimism Bias) It is expected at this stage that the capital cost for the road construction would be sourced from either central government (DfT) funds, specific competitive funding opportunities (such as PinchPoint) or through devolved funding available through the WY+TF.
DELIVERY CASE
The primary delivery organisation for the road would be Leeds City Council as Local Highway Authority, but involvement from WYCA as the fund-ing body and WY+TF programme co-ordinator. There is wide stakeholder support for accessibility improvements, including by highway, and the link road is currently being promoted by LCC through the WY+TF. There is however a degree of concern locally over the potential environmental and quality of life impacts the link road could have, which will need to be mitigated against during the design and consultation process. There could be significant local resident opposition to the road scheme, partic-ularly amongst those directly affected.
COMMERCIAL CASE
The procurement route for the scheme would need to be confirmed taking into account the responsible body for delivery and funding stakeholders (potentially including the airport)

142
Table 38 – Package 1 Junction Improvements
Assessment Area Output Scheme Type / Package
Package 1 Junction Improvements
STRATEGIC FIT
The Leeds City Region (LCR) DaSTS Connectivity Study was one of the 62 national and regional studies using the principles of ‘Delivering a Sustainable Transport System’ (DaSTS) and it built on the ambitions of the Leeds City Region Transport Strategy. The study reviewed a broad range of accessibility issues facing the city region and identified the areas where transport constraints caused the most significant problems. It concluded that Leeds, Bradford, LBIA and the connections between each were key conurbations and corridors that experienced significant connectivi-ty issues. The study designated these corridors in Category A, representing the priority areas for intervention. Following the identification of these spatial priorities, a range of potential solutions were proposed and sifted using sequential tests in accordance with DfT guid-ance, including Policy Fit, Cost & Value for Money and Deliverability in order to be taken forward into a phase 2 of package identification, modelling and shortlist-ing. Options relevant to LBIA included the Leeds and Bradford Outer Ring Road improvements, including links to LBIA and selected express bus services. The option to improve certain key junctions close to the airport is already included as a number of separate schemes within the WY+TF, some of which have been delivered as part of the Governments’ PinchPoint scheme, and others through local developer contributions associated with adjacent development proposals (not airport related). Whilst there are localised benefits which, with a relatively low cost, provide a higher BCR, when compared to the connectivity and economic benefits of the Link Road, these schemes do not deliver against as wide a range of objectives.
VALUE FOR MONEY
Impact on the Economy
Business Users and Transport Providers £ PVB Time Impacts 26,093
£ PVB Vehicle Operating Costs 2,069
£PVB Revenue 0
Impact on the Environment
Greenhouse Gases £ PVB -492
Impact on the Society
Non-business Users £ PVB Time Impacts 20,781
£ PVB Vehicle Operating Costs -1,805
Public Accounts
Cost to broad transport budget £ PVC Central Government 5,603
£ PVC Local Government 0
Indirect Tax £ PVB Indirect Tax Reve-nues -1,263
Indicative Benefit Cost Ratio
Cost to Private Sector £ PVC Private Sector 0
Indicative Net Present Value £ NPV ('000) 52,261
Indicative Economic BCR BCR 10.327 Reliability and Connectivity impact on Business users Minor connectivity improvements are expected through the reduction in variability and journey time improvements at peak times.
Regeneration
Neutral impact. No expected benefits
Wider Impacts
These are very localised schemes are not expected to deliver wider benefits.
ENVIRONMENTAL Local Environment
Minor land take for improved junctions may be required, but otherwise the impact is not expected to be significant. Air quality benefits will be experienced because of better traffic flow and less standing traffic.
Noise Slight Positive Townscape Slight Beneficial
Air Quality Moderate Beneficial Heritage of Historic resources Neutral
Greenhouse gases Moderate Beneficial Biodiversity Neutral
Landscape Moderate Adverse Water Environment Neutral
Carbon Emissions There will be no change in the distance vehicles travel, however, with reduced journey times and congestion there will be a reduction in standing (queued) traffic and drivers will be able to drive more efficiently, improving the air quality.

143
SOCIAL
Reliability impact on Commuting and Other users
Moderate Beneficial Access to services Slight Beneficial
Physical activity Neutral Affordability Neutral
Journey quality Moderate Beneficial Severance Neutral
Accidents Moderate Beneficial Option values Neutral
Security Neutral
Well Being
The scheme will reduce journey times and will have a positive impact on accessibility. Road safety improvements linked to congestion reduction and better pedestrian interface is expected.
DISTRIBUTIONAL
The junctions in question would be used by airline customers, airport employees and general traffic passing through the area. As a result of this the distribution of impacts is wide, in line with the dispersed Origins and destinations of these users. Distributional analysis has been completed as part of the model interrogation, but this has not been converted into a full GIS based demographic or spatial as-sessment.
FINANCIAL CASE
It is expected at this stage that the capital cost for the road construction would be sourced from either central government (DfT) funds, specific competitive funding opportunities (such as PinchPoint) or through devolved funding available through the WY+TF.
DELIVERY CASE
The primary delivery organisation for the junction improvements would be Leeds City Council or Bradford MDC as Local Highway Authority, but with involvement from WYCA as the funding body and WY+TF programme co-ordinator. There is wide stakeholder support for accessibility improvements, including by highway. Whilst the junction improvements could be delivered separately, because of the close interdependency between each junction, and the potential ‘downstream’ im-pacts that could be experienced if on one junction constraint was addressed, it is recommended that these are delivered as a package.
COMMERCIAL CASE
The procurement route for the scheme would need to be confirmed taking into account the responsible body for delivery and funding stakeholders (potentially in-cluding the airport)
144
Recommendations 12.3There are a number of potential options that emerge from this study. Considering the overarching strategic objective of the study to Identify and appraise measures to improve the existing connectivity between LBIA and its catchment area, in addition to the standard economic calculations resulting in the Benefit to Cost Ratio (BCR), we need to consider the measures identified in the study to assess the impact of a particular scheme, these being:
Travel time indicators: the average travel time from origins to destinations; and
Accessibility indicator: providing a measure of the number/percentage of people able to access the airport. Expressed as the number of households multiplied by the average occupation within defined travel times. This is driven by improvements in journey time and changes in land use.
Changes to journey times as a result of the schemes are set out in the scheme assessments (for example in Table 25).
Taking these all aspects of into account, and considering the results of the economic appraisal and wider VfM assessment we would recommend the following schemes be taken forward from the study for further and more detailed appraisal at future stages as they provide the greatest impact on the range of project objectives and indicators, whilst also indicating a positive BCR:
Short/Medium Term - A65 to Leeds Bradford International Airport Link Road (40mph) with improved bus services to Leeds and Bradford – Although the Package 1 junction improvements provide a higher BCR, it does not provide as significant journey time and connectivity improvements as the Link Road, particularly when the benefits of journey time savings could be used to deliver improved bus service frequencies without significant capital cost as an integral part of the scheme.
The combined benefits of the two scheme components (Link Road and Bus Services) act in a synergistic way because the journey time benefits offered by the link road result in the ability to implement improved bus services at very little incremental cost, by improving operational efficiency. The time savings would enable increased frequencies to be delivered and remove the need to deploy additional vehicles, therefore removing this aspect of capital spend.
There would need to be more detailed analysis of intermediate journeys by bus to ensure trips being made (particularly on the Bradford service) are not left uncaptured following a change of route to use the Link Road. The reduction in capital costs from improved journey times (no additional buses would be needed) is likely to mean that both Bradford and Leeds services could be upgraded on an economic basis. Some short term pump prime funding may be required until airport demand builds.
The Link Road would also have other, as yet unquantified potential benefits, including the ability to facilitate Park and Ride and associated economic development opportunities, because of the access opportunities it unlocks. This option is therefore forecast to provide the greatest impact across all indicators; and
Long Term - Heavy Rail (Guiseley – LBIA – Horsforth) – Although currently presenting a relatively low (but positive) BCR, the limitations of the modelling approach highlighted during the study indicate that although the cost side of the equation appears relatively sound at this stage, the demand is likely to be understated particularly when considering intermediate journeys and the ability to provide longer distance through trips on the rail network. More detailed railhead and MOIRA demand modelling would help to understand the likely market for such a service.
Further engineering analysis would be required to demonstrate the work needed in order to deliver a rail link considering local topography, along with analysis of rail timetable requirements and more detailed revenue forecasting. This scheme can only be delivered if other infrastructure investment allowing through services from Leeds and Bradford is forthcoming.

145
Longer distance through services may be a step even further as this would involve a more complicated recast of the rail timetable and may have to be linked to changes delivered as part of the major investment for High Speed Rail.
This therefore has to be recognised as a longer term aspiration, linked to the shorter term highway and bus strategy set out above, but could present an opportunity to implement improvements cumulatively, in line with expected performance, with staged construction to Leeds and then Bradford as network constraints can be released.
The Highway and Rail options should not be seen as mutually exclusive as they deliver a different set of benefits. New, emerging technology such as Tram Train may present additional opportunities and provide lower capital and operating costs, with better traction performance. The delivery of schemes should also be viewed in the context of significant changes to the transport network resulting from the delivery of High Speed Rail to the City Region (both HS2 and now potentially HS3). It is seen as essential that all areas of LCR can gain the benefits of High Speed connectivity, and new infrastructure will no doubt be part of emerging plans in this respect.
Each of the projects taken forward should be accompanied by a complementary package of signage, information and traffic management measures, set out in this report, to maximise the attractiveness and improve the level of benefits from the proposed schemes and also to help make best use of existing assets.
Considering the objectives of this study, we have discounted, at this stage, the other options (highway and public transport) as they do not offer the same degree of connectivity improvements, do not contribute towards a staged strategy of connectivity improvements, or do not currently indicate they could be financially sustainable.
Taking into account the packaging of schemes, the final Option Assessment Framework for the two recommended schemes is shown in the following two tables. These are:
The A65 – LBIA Link Road, with associated improvements to bus services to Leeds and Bradford; and
The rail link between Leeds, Bradford and LBIA via Guiseley and Horsforth.

146
Table 39 - Link Road and Improved Bus Services
Assessment Area Output Scheme Type / Package
Link Road (40 mph) with improved bus services to Leeds & Bradford
STRATEGIC FIT
The Leeds City Region (LCR) DaSTS Connectivity Study was one of the 62 national and regional studies using the principles of ‘Delivering a Sustainable Transport System’ (DaSTS) and it built on the ambitions of the Leeds City Region Transport Strategy. The study reviewed a broad range of accessibility issues facing the city region and identified the areas where transport constraints caused the most significant problems. It concluded that Leeds, Bradford, LBIA and the connections between each were key conurbations and corridors that experienced significant connectivi-ty issues. The study designated these corridors in Category A, representing the priority areas for intervention. Following the identification of these spatial priorities, a range of potential solutions were proposed and sifted using sequential tests in accordance with DfT guid-ance, including Policy Fit, Cost & Value for Money and Deliverability in order to be taken forward into a phase 2 of package identification, modelling and shortlist-ing. Options relevant to LBIA included the Leeds and Bradford Outer Ring Road improvements, including links to LBIA and selected express bus services. The airport link road currently exists as a potential scheme in the West York-shire (Plus) Transport Fund. The transformational schemes that have been identified for further development and investment at a City region level include rail or tram train connections between Leeds and Brad-ford to Leeds Bradford International Airport.
VALUE FOR MONEY
Impact on the Economy
Business Users and Transport Providers £ PVB Time Impacts 69,421
£ PVB Vehicle Operating Costs 2,921
£PVB Revenue 6,330
Impact on the Environment
Greenhouse Gases £ PVB -1,421
Impact on the Society
Non-business Users £ PVB Time Impacts 75,798
£ PVB Vehicle Operating Costs -4,246
Public Accounts
Cost to broad transport budget £ PVC Central Government 30,274
£ PVC Local Government 10,462
Indirect Tax £ PVB Indirect Tax Reve-nues -2,642
Indicative Benefit Cost Ratio
Cost to Private Sector £ PVC Private Sector 0
Indicative Net Present Value £ NPV ('000) 110,709
Indicative Economic BCR BCR 4.00 Reliability and Connectivity impact on Business users The road link provides proportionally significant journey time and connectivity improvements for all traffic types and journey purposes from a wide area, including the benefits for bus services. It will benefit bus services by allowing re-routing and a faster more direct journey to the airport.
Regeneration
There are a number of potential development sites in the area around the airport, but these have yet to be designated in Local Plans, so cannot be included in the appraisal at this stage. Improvements to public transport services would deliver accessibility improvements to enable access by sustainable modes, particularly for those on lower incomes.
Wider Impacts
Although this scheme is focussed on particular access and connectivity objectives (to the airport) there would be wider impacts through improved levels of accessibility delivered to those who would use the link road as a through route and for the users of the bus services. It also has the potential to unlock additional areas for development and could facilitate the introduction of Park and Ride services.
ENVIRONMENTAL Local Environment
The reduction in traffic flows will reduce pollution as a result of exhaust fumes from vehicles and stop-start movements as a result of congestion. The expected relief of traffic from the congested centre of Yeadon and the minor roads through Horsforth will result in positive environmental benefits in terms of reduced pollution and noise. However, there may be issues with the routing of the road across green belt land and special landscape areas, though designs will mitigate impact as much as possible.
The bus scheme will benefit the local environment through the reduction of car trips, resulting in lower carbon emissions and better air quality than would otherwise have been observed with the road in isolation. .
Noise Slight Negative Townscape Slight Beneficial
Air Quality Moderate Beneficial Heritage of Historic resources Neutral
Greenhouse gases Moderate Beneficial Biodiversity Slight Adverse
Landscape Moderate Adverse Water Environment Slight Adverse
Carbon Emissions Improved efficiency/ journey times of buses and private vehicles and therefore a slight reduction in emissions. Growth in traffic may negate these savings however.

147
SOCIAL
Reliability impact on Commuting and Other users
Moderate Beneficial Access to services Slight Beneficial
Physical activity Neutral Affordability Neutral
Journey quality Moderate Beneficial Severance Slight Beneficial
Accidents Moderate Beneficial Option values Neutral
Security Neutral Well Being
The link road is likely to reduce the number of road traffic accidents, as a reduction in traffic should in turn reduce the likelihood of a collision. The link road will improve connectivity and reduce congestion. The scheme may increase physical activity amongst the population by improving pedestrian and cycling facilities.
DISTRIBUTIONAL
The link road and associated bus services are forecast to be used by airline customers, airport employees and general traffic passing through the area. As a result of this the distribution of impacts is wide, in line with the dispersed Origins and destinations of these users. Distributional analysis has been completed as part of the model interrogation, but this has not been converted into a full GIS based demographic or spatial assessment.
FINANCIAL CASE
The capital cost of the road scheme is forecast to be £38.18m (2012 prices including 44% Optimism Bias) with the gross revenue cost for bus services of £6.975m. Fares revenue of £6.330m means that the bus services are almost revenue neutral. It is expected at this stage that the capital cost for the road construction would be sourced from either central government (DfT) funds, specific competitive funding opportunities (such as PinchPoint) or through devolved funding available through the WY+TF. Any service subsidy for bus services would be provided through ex-isting arrangements administered by WYCA and with contributions from LBIA, until they became financially sustainable.
DELIVERY CASE
The primary delivery organisation for the road would be Leeds City Council as Local Highway Authority, but involvement from WYCA as the funding body and WY+TF programme co-ordinator. There is wide stakeholder support for accessibility improvements, including by highway, and the link road is currently being pro-moted by LCC through the WY+TF. There is however a degree of concern locally over the potential environmental and quality of life impacts the link road could have, which will need to be mitigated against during the design and consultation process. There could be significant local resident opposition to the road scheme, particularly amongst those directly affected.
COMMERCIAL CASE
The procurement route for the scheme would need to be confirmed taking into account the responsible body for delivery and funding stakeholders (potentially in-cluding the airport)
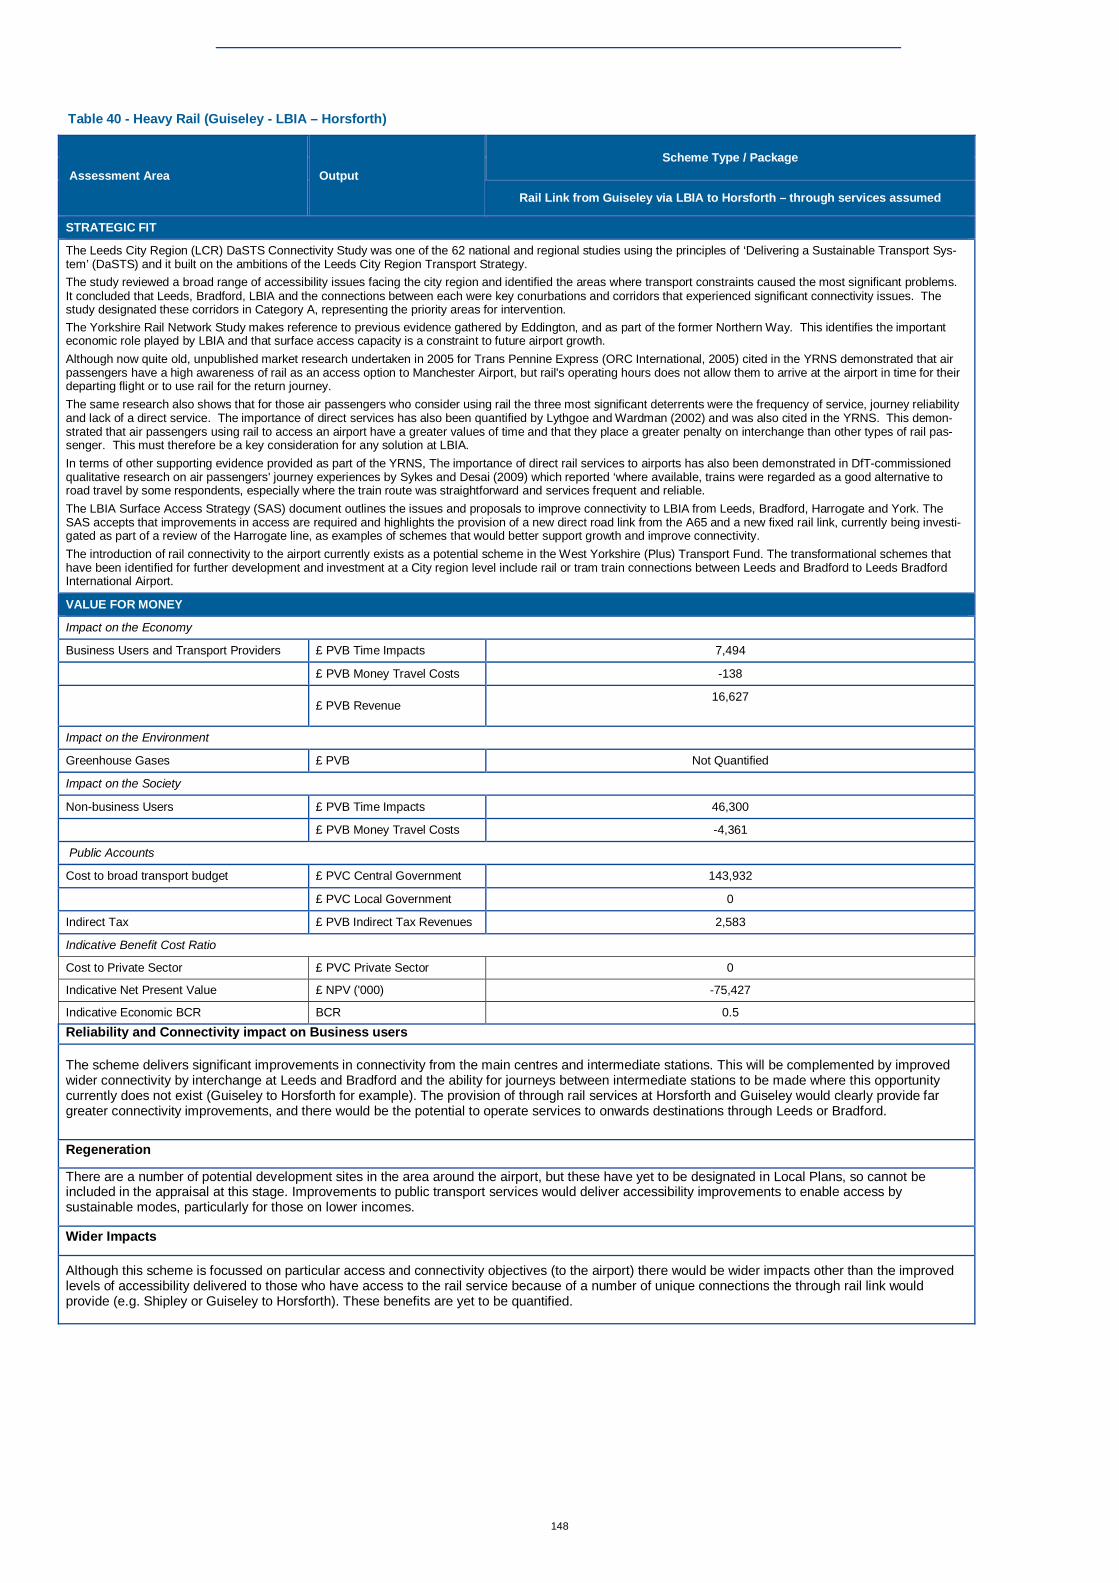
148
Table 40 - Heavy Rail (Guiseley - LBIA – Horsforth)
Assessment Area Output Scheme Type / Package
Rail Link from Guiseley via LBIA to Horsforth – through services assumed
STRATEGIC FIT
The Leeds City Region (LCR) DaSTS Connectivity Study was one of the 62 national and regional studies using the principles of ‘Delivering a Sustainable Transport Sys-tem’ (DaSTS) and it built on the ambitions of the Leeds City Region Transport Strategy. The study reviewed a broad range of accessibility issues facing the city region and identified the areas where transport constraints caused the most significant problems. It concluded that Leeds, Bradford, LBIA and the connections between each were key conurbations and corridors that experienced significant connectivity issues. The study designated these corridors in Category A, representing the priority areas for intervention. The Yorkshire Rail Network Study makes reference to previous evidence gathered by Eddington, and as part of the former Northern Way. This identifies the important economic role played by LBIA and that surface access capacity is a constraint to future airport growth. Although now quite old, unpublished market research undertaken in 2005 for Trans Pennine Express (ORC International, 2005) cited in the YRNS demonstrated that air passengers have a high awareness of rail as an access option to Manchester Airport, but rail's operating hours does not allow them to arrive at the airport in time for their departing flight or to use rail for the return journey. The same research also shows that for those air passengers who consider using rail the three most significant deterrents were the frequency of service, journey reliability and lack of a direct service. The importance of direct services has also been quantified by Lythgoe and Wardman (2002) and was also cited in the YRNS. This demon-strated that air passengers using rail to access an airport have a greater values of time and that they place a greater penalty on interchange than other types of rail pas-senger. This must therefore be a key consideration for any solution at LBIA. In terms of other supporting evidence provided as part of the YRNS, The importance of direct rail services to airports has also been demonstrated in DfT-commissioned qualitative research on air passengers' journey experiences by Sykes and Desai (2009) which reported ‘where available, trains were regarded as a good alternative to road travel by some respondents, especially where the train route was straightforward and services frequent and reliable. The LBIA Surface Access Strategy (SAS) document outlines the issues and proposals to improve connectivity to LBIA from Leeds, Bradford, Harrogate and York. The SAS accepts that improvements in access are required and highlights the provision of a new direct road link from the A65 and a new fixed rail link, currently being investi-gated as part of a review of the Harrogate line, as examples of schemes that would better support growth and improve connectivity. The introduction of rail connectivity to the airport currently exists as a potential scheme in the West Yorkshire (Plus) Transport Fund. The transformational schemes that have been identified for further development and investment at a City region level include rail or tram train connections between Leeds and Bradford to Leeds Bradford International Airport.
VALUE FOR MONEY
Impact on the Economy
Business Users and Transport Providers £ PVB Time Impacts 7,494
£ PVB Money Travel Costs -138
£ PVB Revenue 16,627
Impact on the Environment
Greenhouse Gases £ PVB Not Quantified
Impact on the Society
Non-business Users £ PVB Time Impacts 46,300
£ PVB Money Travel Costs -4,361
Public Accounts
Cost to broad transport budget £ PVC Central Government 143,932
£ PVC Local Government 0
Indirect Tax £ PVB Indirect Tax Revenues 2,583
Indicative Benefit Cost Ratio
Cost to Private Sector £ PVC Private Sector 0
Indicative Net Present Value £ NPV ('000) -75,427
Indicative Economic BCR BCR 0.5 Reliability and Connectivity impact on Business users
The scheme delivers significant improvements in connectivity from the main centres and intermediate stations. This will be complemented by improved wider connectivity by interchange at Leeds and Bradford and the ability for journeys between intermediate stations to be made where this opportunity currently does not exist (Guiseley to Horsforth for example). The provision of through rail services at Horsforth and Guiseley would clearly provide far greater connectivity improvements, and there would be the potential to operate services to onwards destinations through Leeds or Bradford.
Regeneration
There are a number of potential development sites in the area around the airport, but these have yet to be designated in Local Plans, so cannot be included in the appraisal at this stage. Improvements to public transport services would deliver accessibility improvements to enable access by sustainable modes, particularly for those on lower incomes.
Wider Impacts
Although this scheme is focussed on particular access and connectivity objectives (to the airport) there would be wider impacts other than the improved levels of accessibility delivered to those who have access to the rail service because of a number of unique connections the through rail link would provide (e.g. Shipley or Guiseley to Horsforth). These benefits are yet to be quantified.

149
ENVIRONMENTAL Local Environment The scheme would require significant infrastructure and civil engineering works to construct the link between Horsforth and the airport, and between Guiseley and the airport
As the airport is situated in an elevated position from the main railway, even if taking gradients into consideration, it is expected that earthworks to create a cutting would be required at the Horsforth end with significant, if not greater, constraints in constructing the link towards Guiseley because of housing and commercial property. As the area surrounding any development is predominantly greenfield land, this would have a detrimental impact.
Noise Slight Negative Townscape Slight Beneficial
Air Quality Moderate Beneficial Heritage of Historic resources Neutral
Greenhouse gases Moderate Beneficial Biodiversity Slight Adverse
Landscape Moderate Adverse Water Environment Neutral
Carbon Emissions The scheme will provide a viable option to the private car and has the potential to reduce the number of vehicles travelling from Leeds or Bradford to LBIA by promoting modal shift, and accommodating future growth in a sustainable way. The scheme also has the potential to facilitate inbound (to Leeds or Bradford centre) Park and Ride to take further car trips off the highway network. This will result in a direct reduction in carbon emissions.
SOCIAL
Reliability impact on Commuting and Other users
Moderate Beneficial Access to services Moderate Beneficial
Physical activity Neutral Affordability Neutral
Journey quality Large Beneficial Severance Moderate Beneficial
Accidents Moderate Beneficial Option values Neutral
Security Neutral Well Being The scheme will reduce severance issues by providing enhanced access to local centres and to the airport from intermediate stations. It will also support active travel through becoming a viable alternative to the private car, thus encouraging commuters to walk or cycle for a leg of the journey, with facilities to support this interchange. It is not expected to improve local accessibility and may create a degree of severance for some local residents through the construction of a fixed link. DISTRIBUTIONAL
The rail link is forecast to be used by airline customers, airport employees. It also has the potential to provide inbound (to Leeds or Bradford) Park and Ride facilities. As a result of this the distribution of impacts is wide, in line with the dispersed Origins and Destinations of these users. Distributional analysis has been completed as part of the model interrogation, but this has not been converted into a full GIS based demographic or spatial assessment.
FINANCIAL CASE
It is expected at this stage that the capital cost for the rail construction would be sourced from either central government (DfT) funds, specific competitive funding opportu-nities or through devolved funding available through the WY+TF. Any service subsidy for rail services would have to be provided through existing rail franchise arrange-ments, possibly administered by WYCA or Rail North in future, and with contributions from LBIA, until they became financially sustainable.
DELIVERY CASE
The primary delivery organisation for the rail link would be Network Rail as asset owner, but involvement from WYCA as the Local Transport Authority and WY+TF pro-gramme co-ordinator. There is wide stakeholder support for accessibility improvements, including by rail, and the potential for a rail link is currently being promoted by WYCA, Bradford and Leeds Councils through the WY+TF. There is however a degree of concern locally over the potential environmental and quality of life impacts the rail link could have, which will need to be mitigated against during the design and consultation process. There could be significant local resident opposition to the road scheme, particularly amongst those directly affected, and there are significant engineering constraints that need to be overcome.
COMMERCIAL CASE
The procurement route for the scheme would need to be confirmed taking into account the responsible body for delivery and funding stakeholders (potentially including the airport)

Project number: Dated: 26/11/2014 150 | 162 Revised:
APPENDICES
151
Appendix A – Highway Network Constraints – LBIA
153
Appendix B – EAST Summary Appraisal Forms

Project number: Dated: 26/11/2014 154 | 162 Revised:
Appendix C – Harrogate Rail Sensitivity Test

155
Appendix D – Rodley Roundabout Sensitivity Test

Project number: Dated: 26/11/2014 156 | 162 Revised:
Appendix E – SATURN Link Road Plots

157
Appendix F – SATURN Do Minimum Plots

Project number: Dated: 26/11/2014 158 | 162 Revised:
Appendix G – Cordon Results

159
Appendix H – Linsig Details
Project number: Dated: 26/11/2014 160 | 162 Revised:
Appendix I – SATURN Plots – Junction Package 1

161
Appendix J – Technical Appendix

WSP UK Limited 3 White Rose Office Park Leeds LS11 0DL UK Tel: 0113 395 6444 Fax: 0113 395 6201 www.wspgroup.co.uk