Governor John E. Baldacci March 3, 2004 A Responsible Solution Spending Reform and Property Tax...
38
Governor John E. Baldacci March 3, 2004 A Responsible Solution Spending Reform and Property Tax Relief
-
Upload
skylar-clare -
Category
Documents
-
view
215 -
download
1
Transcript of Governor John E. Baldacci March 3, 2004 A Responsible Solution Spending Reform and Property Tax...

Governor John E. Baldacci
March 3, 2004
A Responsible SolutionA Responsible Solution
Spending Reform andProperty Tax Relief
Spending Reform andProperty Tax Relief

Goals of Responsible Reform Goals of Responsible Reform
• Immediate, Targeted Property Tax Relief
• Longer-Term Property Tax Relief
• Competitiveness
• Immediate, Targeted Property Tax Relief
• Longer-Term Property Tax Relief
• Competitiveness
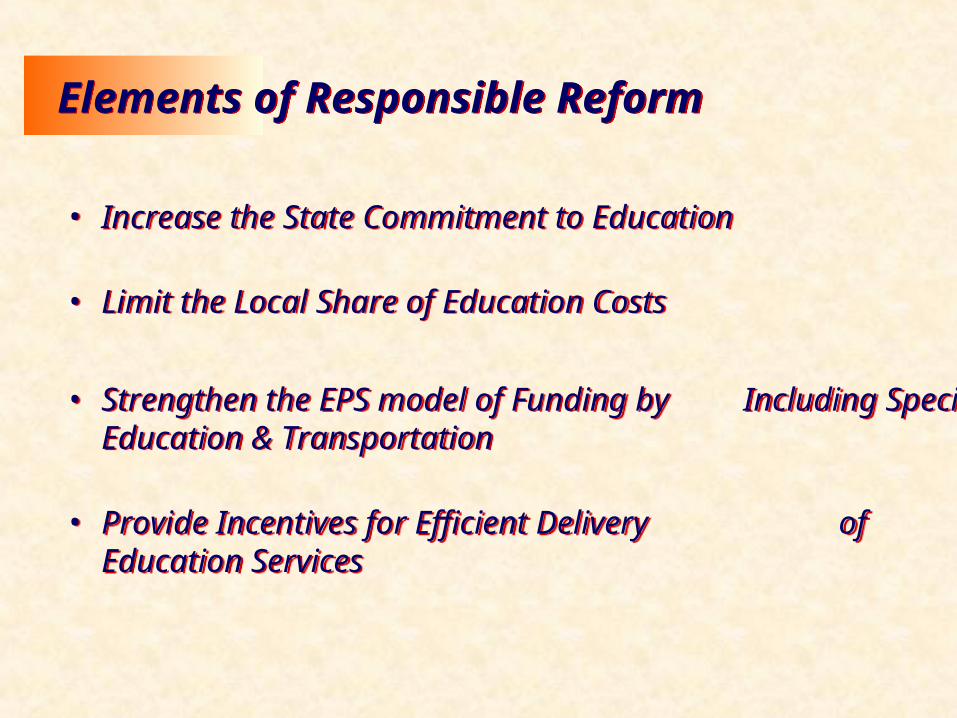
Elements of Responsible ReformElements of Responsible Reform
• Increase the State Commitment to Education
• Limit the Local Share of Education Costs
• Strengthen the EPS model of Funding by Including Special Education & Transportation
• Provide Incentives for Efficient Delivery of Education Services
• Increase the State Commitment to Education
• Limit the Local Share of Education Costs
• Strengthen the EPS model of Funding by Including Special Education & Transportation
• Provide Incentives for Efficient Delivery of Education Services
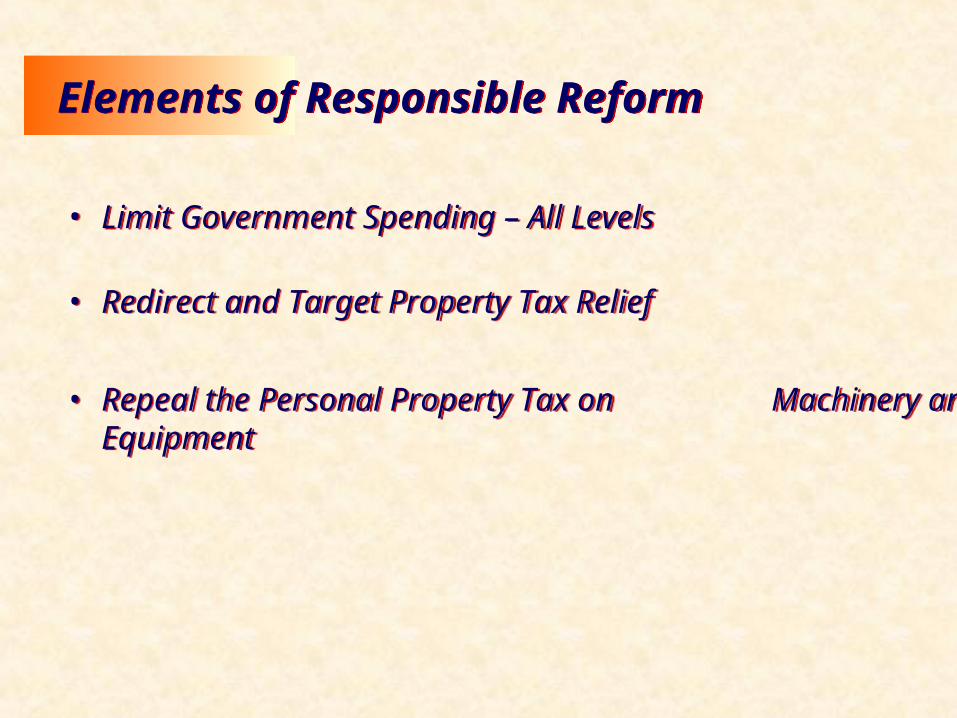
Elements of Responsible ReformElements of Responsible Reform
• Limit Government Spending – All Levels
• Redirect and Target Property Tax Relief
• Repeal the Personal Property Tax on Machinery and Equipment
• Limit Government Spending – All Levels
• Redirect and Target Property Tax Relief
• Repeal the Personal Property Tax on Machinery and Equipment

• Increase General Purpose Aid to Education for FY05 by $25 Million
• Expand The Property Tax Circuit Breaker Program & Increase Funding for FY05 by $25 Million
• Increase General Purpose Aid to Education for FY05 by $25 Million
• Expand The Property Tax Circuit Breaker Program & Increase Funding for FY05 by $25 Million
Immediate, Targeted Property Tax ReliefImmediate, Targeted Property Tax Relief
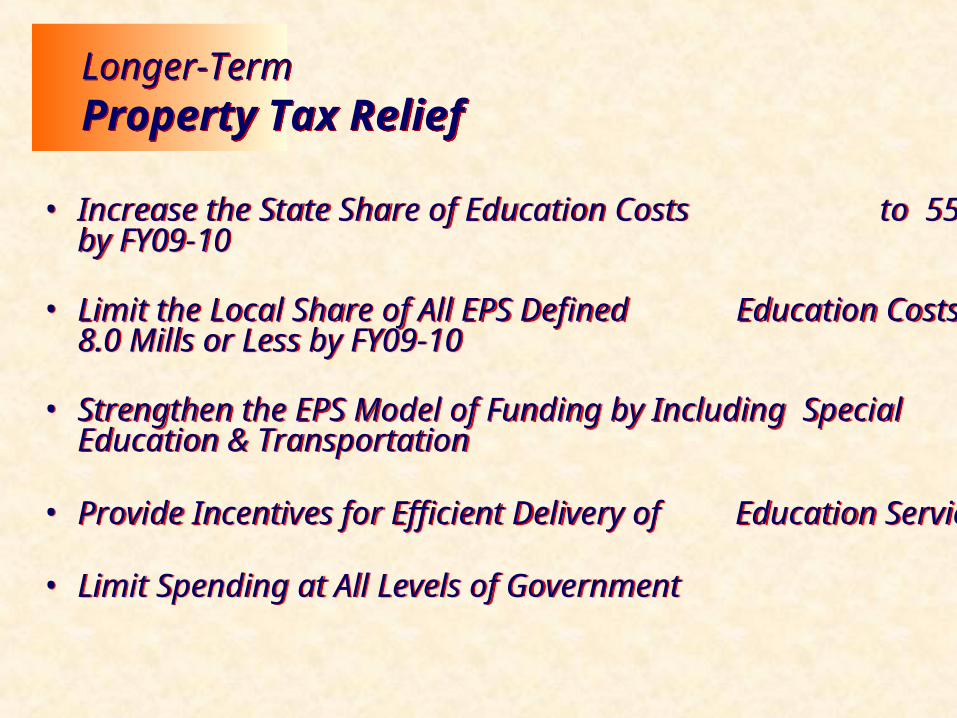
• Increase the State Share of Education Costs to 55% by FY09-10
• Limit the Local Share of All EPS Defined Education Costs to 8.0 Mills or Less by FY09-10
• Strengthen the EPS Model of Funding by Including Special Education & Transportation
• Provide Incentives for Efficient Delivery of Education Services
• Limit Spending at All Levels of Government
Longer-Term Property Tax ReliefLonger-Term Property Tax Relief

• Repeal Personal Property Tax on Machinery and Equipment
• Lower Overall Tax burden
• Repeal Personal Property Tax on Machinery and Equipment
• Lower Overall Tax burden
CompetitivenessCompetitiveness
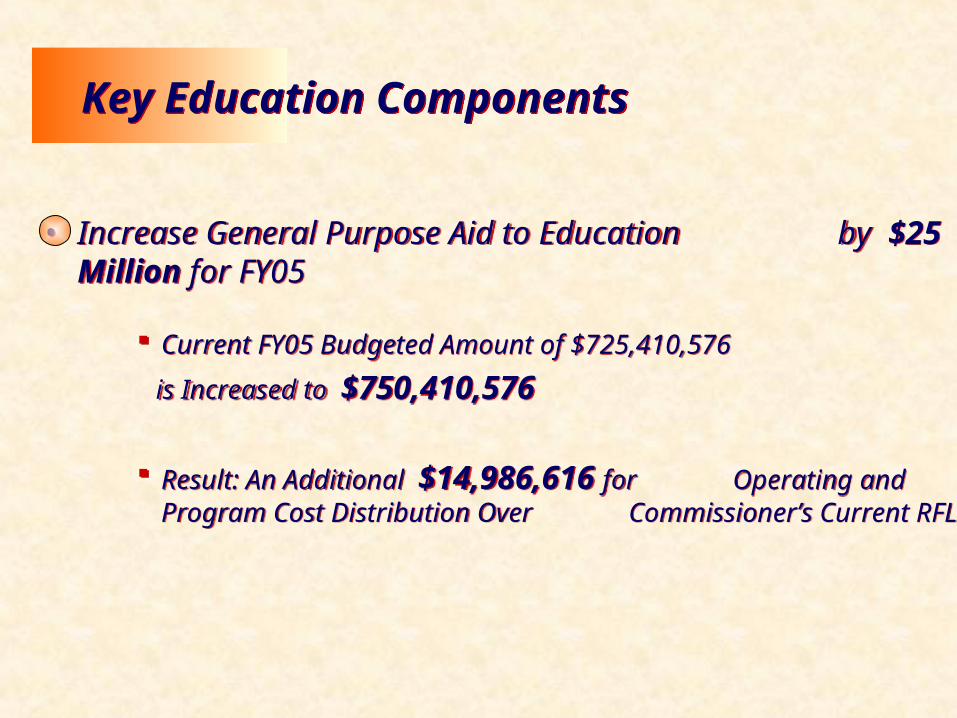
• Increase General Purpose Aid to Education by $25 Million for FY05
Current FY05 Budgeted Amount of $725,410,576
is Increased to $750,410,576
Result: An Additional $14,986,616 for Operating and Program Cost Distribution Over Commissioner’s Current RFL
• Increase General Purpose Aid to Education by $25 Million for FY05
Current FY05 Budgeted Amount of $725,410,576
is Increased to $750,410,576
Result: An Additional $14,986,616 for Operating and Program Cost Distribution Over Commissioner’s Current RFL
Key Education ComponentsKey Education Components

• Increase State Share of Education Costs to 55% by FY09-10
Provide the Increased State Share each Year Over the Specified Five-Year Period Necessary to Achieve the Statutorily Required 55% by FY2009-10
The Bill Does not Alter the Current Law Phase-in of
EPS but Will Require Additional State Share Each Year to Meet the FY2009-10 Required 55%
Key Education ComponentsKey Education Components

• Limit the Local Share of All EPS Defined Education Costs to 8.0 Mills or Less by FY2009-10
Establishes a New Method of Distribution for the State Share of Education Funding
Ensures That a Municipality, Single or Part of an SAU Will Not Be Required to Raise More Than 8.0 Mills of State Valuation for Their Share of Local Education Costs by FY2009-10
State Share Becomes the Difference Between the Established
Mill Rate Expectation and the EPS Defined Costs Each Year
Key Education ComponentsKey Education Components

0
2
4
6
8
10
12
14
16
18
MIL
LS R
AIS
ED
FO
R E
DU
CA
TIO
N 2
00
3-0
4M
ILLS
RA
ISED
FO
R E
DU
CA
TIO
N 2
00
3-0
4
Maine’s Municipalities (each line represents five Units )Maine’s Municipalities (each line represents five Units )
Education Funding & Property Tax ReliefEducation Funding & Property Tax ReliefMunicipal Mill Rate Commitment to Local Education 2003-04Municipal Mill Rate Commitment to Local Education 2003-04
Bangor (12.39)Bangor (12.39)
Augusta (12.33)Augusta (12.33)
S. Portland (11.76)S. Portland (11.76)
Portland (11.21) Portland (11.21)
Lewiston (9.93) Lewiston (9.93)
Auburn (11.09) Auburn (11.09)
Based on 2003 State Certified ValuationBased on 2003 State Certified Valuation
J.E. Rier 2-27-04Department of Education
Hallowell (16.20)Hallowell (16.20)
Thomaston (16.36)Thomaston (16.36)
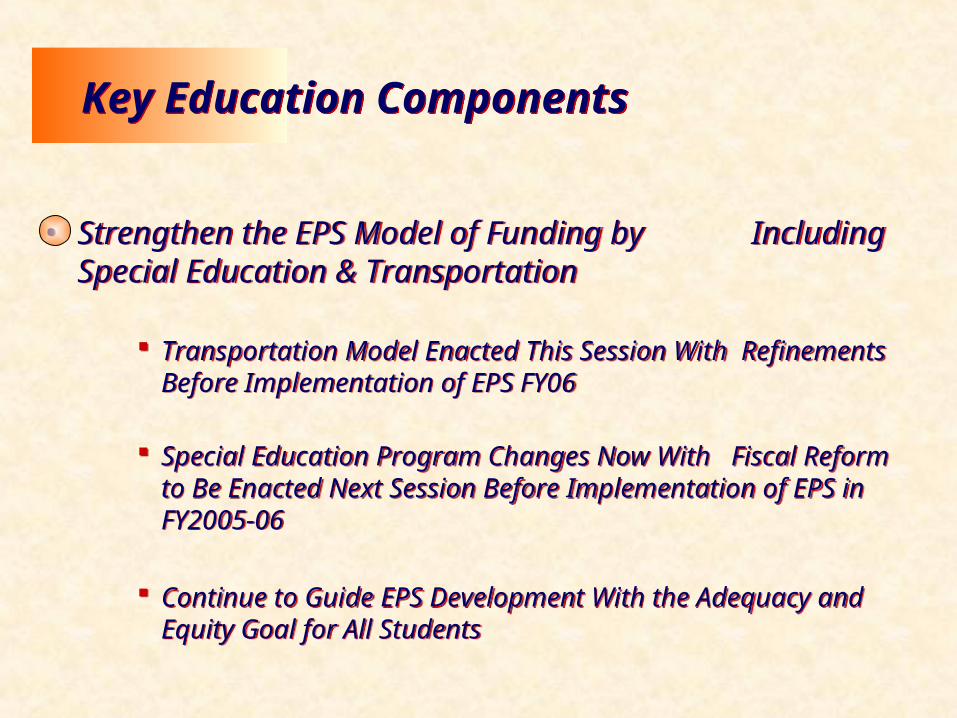
• Strengthen the EPS Model of Funding by Including Special Education & Transportation
Transportation Model Enacted This Session With Refinements Before Implementation of EPS FY06
Special Education Program Changes Now With Fiscal
Reform to Be Enacted Next Session Before Implementation of EPS in FY2005-06
Continue to Guide EPS Development With the Adequacy and Equity Goal for All Students
Key Education ComponentsKey Education Components

• Provide Incentives for Efficient Delivery of Education Services
Efficient School Units
Regional Collaboratives
Regional School Districts
• Provide Incentives for Efficient Delivery of Education Services
Efficient School Units
Regional Collaboratives
Regional School Districts
Key Education ComponentsKey Education Components

• Existing Efficient, High Performing School Units That Agree to Mentor Others Qualify for:
Under 1,000 Students 5% GPA Bonus for 5 Years State Assumes 25% of Local Construction Debt
1,000 to 2,500 Students 7.5% GPA Bonus for 5 Years State Assumes 25% of Local Construction Debt
2,500 + Students 10% GPA Bonus for 5 Years State Assumes 50% of Local Construction Debt
Efficient School UnitsEfficient School Units

• Five + School Administrative Units w/ Combined Enrollment of 2500+ That Agree to Cooperate in the Delivery of Administrative and Other Services
Salary and Benefits for One FTE Regional Staff Declining Scale for Five Years
Additional 25% Tuition Reimbursement Graduate Courses
State Purchase of Region-Wide Software
State Provides Technical Assistance and Training
State Grant Programs Favor RCs
Regional School CooperativesRegional School Cooperatives

• Combine Two or More Contiguous School Administrative Units
• Adopt 1 Governing Body, 1 Budget
1,000-2,500 Students 7.5% GPA Bonus for 5 Years State Assumes 25% of Local Construction Debt
2,500 + Students 10% GPA Bonus for 5 Years State Assumes 50% of Local Construction debt
• Combine Two or More Contiguous School Administrative Units
• Adopt 1 Governing Body, 1 Budget
1,000-2,500 Students 7.5% GPA Bonus for 5 Years State Assumes 25% of Local Construction Debt
2,500 + Students 10% GPA Bonus for 5 Years State Assumes 50% of Local Construction debt
Regional School DistrictsRegional School Districts

• 2004-05 1/2% of GPA
• 2005-06 1% of GPA
• 2006-07 2% of GPA
• 2007-08 2% of GPA
• 2008-09 2% of GPA
• 2009-10 2% of GPA
• 2004-05 1/2% of GPA
• 2005-06 1% of GPA
• 2006-07 2% of GPA
• 2007-08 2% of GPA
• 2008-09 2% of GPA
• 2009-10 2% of GPA
Fund for Efficient DeliveryFund for Efficient Delivery
Fiscal YearFiscal Year Amount of FundsAmount of Funds

• Expand Property Tax Circuit Breaker Program
Additional $25 Million for FY2005
Increase Maximum Refund from $1,000 to $2,000
Increase Income Eligibility from #30,300(s) / $46,900 (j) to $75,000 (s) / $100,000 (j)
Increase Household Eligibility
• Expand Property Tax Circuit Breaker Program
Additional $25 Million for FY2005
Increase Maximum Refund from $1,000 to $2,000
Increase Income Eligibility from #30,300(s) / $46,900 (j) to $75,000 (s) / $100,000 (j)
Increase Household Eligibility
Circuit Breaker ProgramCircuit Breaker Program

• Limit Spending for Municipal and County Budgets
Modeled on Current State Cap
Cap is 4.67% for FY2006-07 and 5.17% for FY2007-08
• Limit Spending for Municipal and County Budgets
Modeled on Current State Cap
Cap is 4.67% for FY2006-07 and 5.17% for FY2007-08
Limit Government SpendingLimit Government Spending

• Repeal Personal Property Tax on Machinery and Equipment
Repeal Effective April 1, 2004
BETR qualified Equipment Becomes Tax Exempt as it Exits The BETR Program
Towns reimbursed 50%
State Savings of $3.7 Million in FY2007 and $11.0 Million in FY2008
• Repeal Personal Property Tax on Machinery and Equipment
Repeal Effective April 1, 2004
BETR qualified Equipment Becomes Tax Exempt as it Exits The BETR Program
Towns reimbursed 50%
State Savings of $3.7 Million in FY2007 and $11.0 Million in FY2008
CompetitivenessCompetitiveness

Why Focus on Tax Relief ?Why Focus on Tax Relief ?
• Tax Burden 20% Above US and Among the Highest in the US for a Decade
• Property Tax Burden Among the Highest in the Nation
• Two Citizens’ Initiatives Demanding Property Tax Relief
• Maine’s High Tax Burden Weakens Our Competitive Position
• Tax Burden 20% Above US and Among the Highest in the US for a Decade
• Property Tax Burden Among the Highest in the Nation
• Two Citizens’ Initiatives Demanding Property Tax Relief
• Maine’s High Tax Burden Weakens Our Competitive Position

State & Local Taxes as % of Personal Income
0
2
4
6
8
10
12
14
1970 1975 1980 1985 1990 1995 2000
Maine and US Avg.
US Ave.
Maine

Maine Rank in S&L Taxes as % of Personal Income
96 6 5 5
7
1214
11 12
6 7 7 68 7
5 53 4
6 5 4 4 3 2 2 1 1 1 1 1 2 1
0
5
10
15
20
25
30
35
40
45
50
1970 1975 1980 1985 1990 1995 2000

Why Focus on Competitiveness ?Why Focus on Competitiveness ?
• Per Capita Income 10% Below US
• 1/3 of Jobs Do Not Pay Livable Wage
• Industrial Productivity 70% of US
• Lost 1/3 Manufacturing Jobs Since 1989
• Cost of Doing Business 10% Above US
• Our Manufacturing Job Loss Much Worse Than US
• Per Capita Income 10% Below US
• 1/3 of Jobs Do Not Pay Livable Wage
• Industrial Productivity 70% of US
• Lost 1/3 Manufacturing Jobs Since 1989
• Cost of Doing Business 10% Above US
• Our Manufacturing Job Loss Much Worse Than US

Per Capita Personal Income Gap(Pct. Points Me. PCPI Lags Natl. Avg.)
-20%
-18%
-16%
-14%
-12%
-10%
-8%
-6%
-4%
-2%
0%
80 81 82 83 84 85 86 87 88 89 90 91 92 93 94 95 96 97 98 99 00 01 02

Percent of Maine Jobs that Pay a Livable Wage, 1995-2002
65% 66% 67% 68% 67% 67% 67% 66%
0%
10%
20%
30%
40%
50%
60%
70%
80%
90%
100%
1995 1996 1997 1998 1999 2000 2001 2002 2003 2004 2005
pe
rce
nt
85%
Benchmark

Manufacturing Value Added per Manufacturing Worker, Maine and U.S., 1989-2001
$0.00
$10,000.00
$20,000.00
$30,000.00
$40,000.00
$50,000.00
$60,000.00
$70,000.00
$80,000.00
$90,000.00
$100,000.00
1989 1990 1991 1992 1993 1994 1995 1996 1997 1998 1999 2000 2001 2002 2003 2004 2005
do
llars
Benchmark: The value added per manufacturing worker in Maine will increase to within 10% of the value produced by manufacturing workers in the U.S. by 2005
Maine
United States
Gap: 30%

Index of Maine & US Manufacturing Employment (1960=100)
60
70
80
90
100
110
120
130
140
1960 1970 1980 1990 2000
US Maine

Cost of Doing Business, Maine, 1989-2002
108.7
106.3
75
77
79
81
83
85
87
89
91
93
95
97
99
101
103
105
107
109
111
113
115
1989 1990 1991 1992 1993 1994 1995 1996 1997 1998 1999 2000 2001 2002 2003 2004 2005
inde
x po
ints
United States (100 index points)
Benchmark: The cost of doing
business in Maine will decrease to less
than 103 index points by 2005
103
110.1

Why Focus on Education Spending?Why Focus on Education Spending?
• Largest Part of State and Local Budgets
• Expenditures Increasing Rapidly
• Enrollments Are Declining Rapidly
• Largest Part of State and Local Budgets
• Expenditures Increasing Rapidly
• Enrollments Are Declining Rapidly
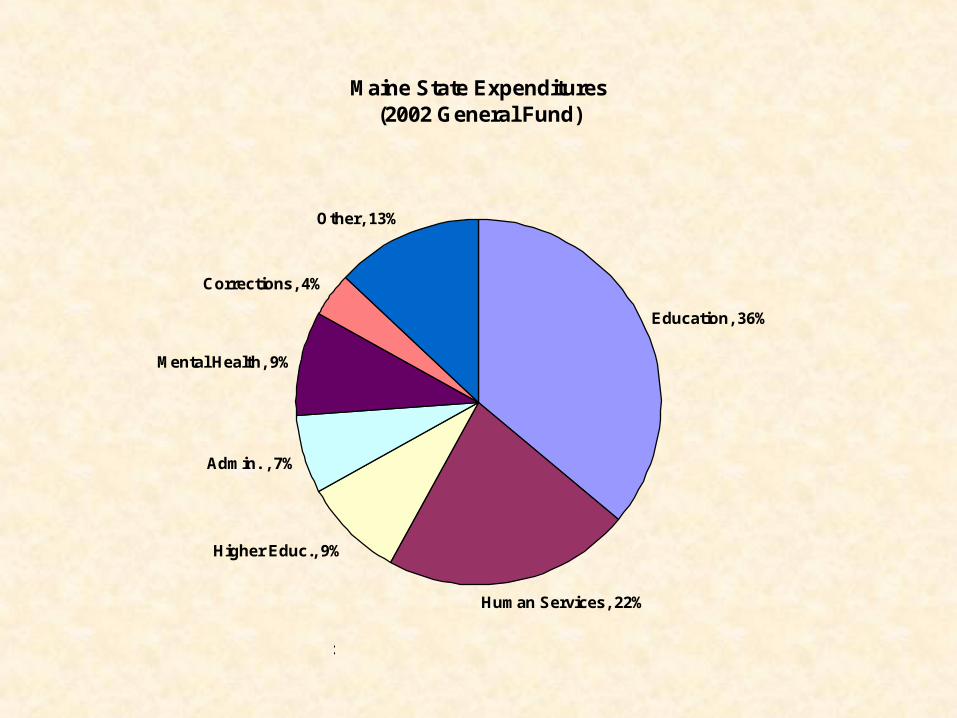
Maine State Expenditures(2002 General Fund)
Education, 36%
Human Services, 22%
Higher Educ., 9%
Admin. , 7%
Mental Health, 9%
Corrections, 4%
Other, 13%
Source data: Me. Bur. Of the Budget
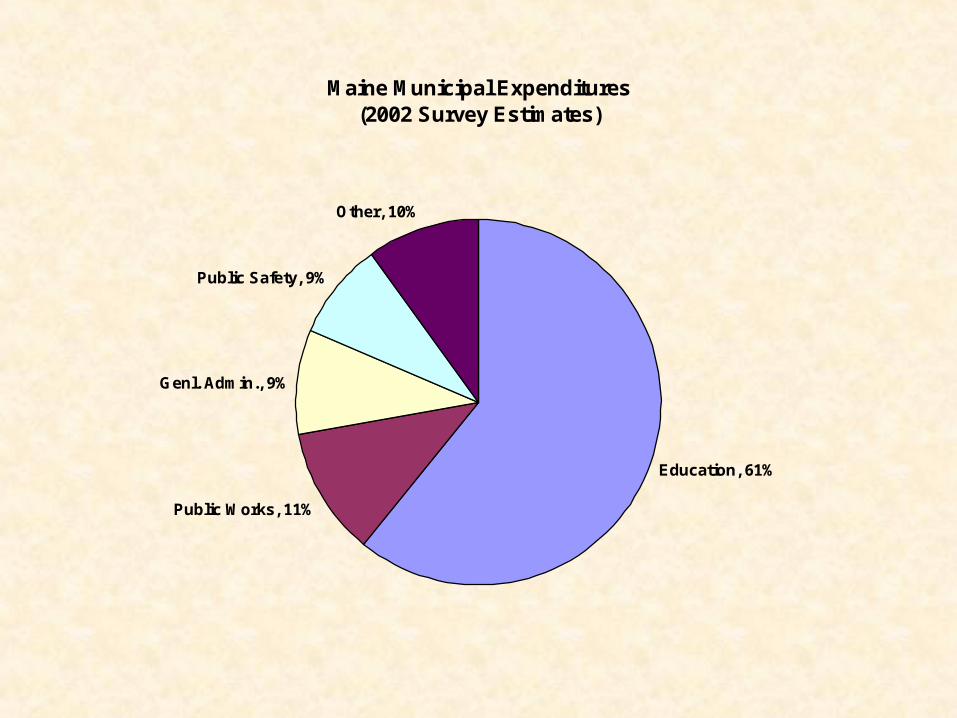
Maine Municipal Expenditures(2002 Survey Estimates)
Education, 61%
Public Works, 11%
Genl. Admin., 9%
Public Safety, 9%
Other, 10%
Source data: Me. Municipal Association

Maine Municipal Expenditures by Population Size(2002 Survey Estimates)
47%
58% 57%66%
71% 71%67%
10%
9% 11%
12%11% 12%
15%
17%
10% 9%
7%6% 6% 7%
13%11% 11%
7%5% 4% 3%
0%
10%
20%
30%
40%
50%
60%
70%
80%
90%
100%
20+ 10-20 5-10 3.5-5 2-3.5 1-2 <1
Population in Thousands
Public Safety
Gen. Admin.
Public Works
Education
Source data: Me. Municipal Association

Statewide K-12 Education Expenditures(in millions of $)
$339
$486
$841
$1,084
$1,347
$1,684
$0
$200
$400
$600
$800
$1,000
$1,200
$1,400
$1,600
$1,800
1978-79 1983-84 1988-89 1993-94 1998-99 2002-03

Statewide Special Education Expenditures(in millions of $)
$17
$36
$85
$133
$186
$247
$0
$50
$100
$150
$200
$250
$300
1978-79 1983-84 1988-89 1993-94 1998-99 2002-03

Real K-12 Expenditures vs K-12 EnrollmentIndexed to 1978-79 =100
0
20
40
60
80
100
120
140
160
180
200
1978-79 1983-84 1988-89 1993-94 1998-99 2002-03
Expenditures
Enrollment
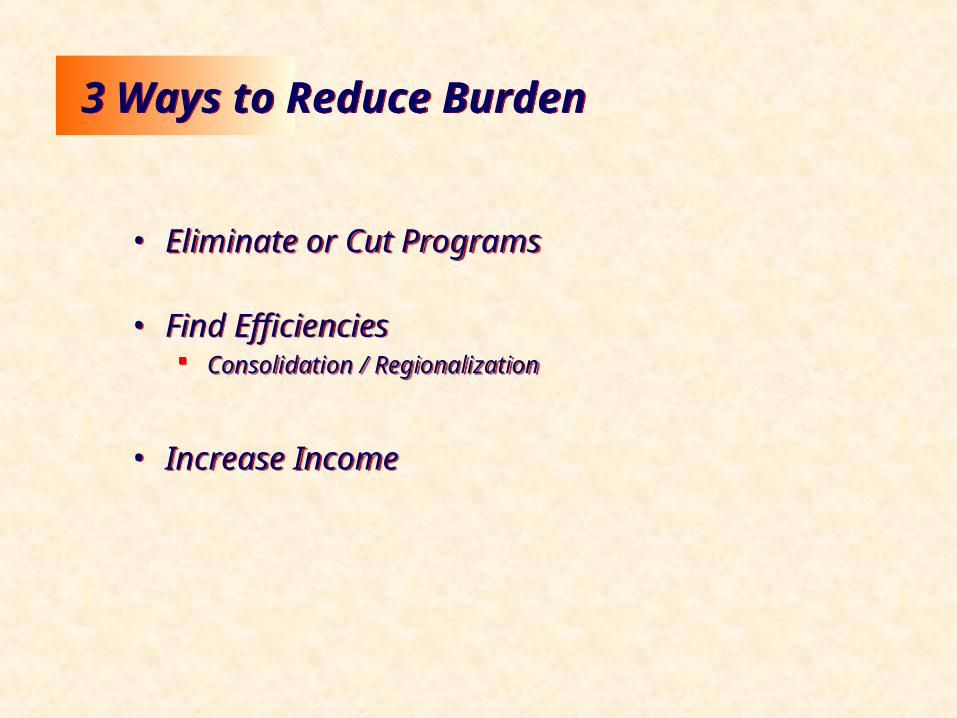
3 Ways to Reduce Burden3 Ways to Reduce Burden
• Eliminate or Cut Programs
• Find Efficiencies Consolidation / Regionalization
• Increase Income
• Eliminate or Cut Programs
• Find Efficiencies Consolidation / Regionalization
• Increase Income

Maine County Expenditures(2001 Survey Estimates)
Jails, 32%
Sheriff, 21%Employee Benefits, 10%
Other Admin., 13%
Dist. Attorney, 4%
Registry of Deeds, 4%
Other, 16%
Source data: Me. Municipal Association