Government Ownership of Banks - Faculty &...
50
Government Ownership of Banks RAFAEL LA PORTA, FLORENCIO LOPEZ-DE-SILANES, AND ANDREI SHLEIFER* ABSTRACT We assemble data on government ownership of banks around the world. The data show that such ownership is large and pervasive, and higher in countries with low levels of per capita income, backward financial systems, interventionist and inefficient governments, and poor protection of property rights. Higher government ownership of banks in 1970 is associated with slower subsequent financial development and lower growth of per capita income and productivity. This evidence supports “political” theories of the effects of government ownership of firms. * Harvard University. We are grateful to Thorsten Beck, Mihir Desai, Simeon Djankov, Edward Glaeser, Simon Johnson, David Laibson, Ross Levine, Dani Rodrik, René Stulz, and two anonymous referees for helpful comments, to Karine Del Paso, Magdalena Lopez-Morton, Dmitry Rozhkov and Ekaterina Trizlova for research assistance, and to the National Science Foundation, the Dean’s Research Fund at the Kennedy School of Government, Harvard University, and the Ira Katz Research Fund at the University of Michigan for financial support.
Transcript of Government Ownership of Banks - Faculty &...

Government Ownership of BanksRAFAEL LA PORTA, FLORENCIO LOPEZ-DE-SILANES, AND ANDREI SHLEIFER*
ABSTRACT
We assemble data on government ownership of banks around the world. The data showthat such ownership is large and pervasive, and higher in countries with low levels of per capitaincome, backward financial systems, interventionist and inefficient governments, and poorprotection of property rights. Higher government ownership of banks in 1970 is associated withslower subsequent financial development and lower growth of per capita income andproductivity. This evidence supports “political” theories of the effects of government ownershipof firms.
* Harvard University. We are grateful to Thorsten Beck, Mihir Desai, Simeon Djankov, EdwardGlaeser, Simon Johnson, David Laibson, Ross Levine, Dani Rodrik, René Stulz, and twoanonymous referees for helpful comments, to Karine Del Paso, Magdalena Lopez-Morton,Dmitry Rozhkov and Ekaterina Trizlova for research assistance, and to the National ScienceFoundation, the Dean’s Research Fund at the Kennedy School of Government, HarvardUniversity, and the Ira Katz Research Fund at the University of Michigan for financial support.

1
This paper discusses a neglected aspect of financial systems of many countries: government
ownership of banks. It shows that such ownership is pervasive around the world, and has had
significant consequences for economic and financial development.
There are two broad views of the government’s participation in financial markets. The
first, basically optimistic, “development” view is associated with Alexander Gerschenkron
(1962), who focuses on the necessity of financial development for economic growth.
Gerschenkron argues that privately owned commercial banks have been the crucial vehicle of
channeling savings into industry in several industrializing countries in the second half of the
nineteenth century, especially Germany. However, in some countries -- most conspicuously
Russia -- economic institutions were not sufficiently developed for private banks to play the
crucial development role. “The scarcity of capital in Russia was such that no banking system
could conceivably succeed in attracting sufficient funds to finance a large scale industrialization;
the standards of honesty in business were so disastrously low, the general distrust of the public so
great, that no bank could have hoped to attract even such small capital funds as were available,
and no bank could have successfully engaged in long term credit policies in an economy where
fraudulent bankruptcy had been almost elevated to the rank of a general business practice”
(Gerschenkron, p. 19). In such countries, the government could step in and through its financial
institutions jump start both financial and economic development. Thus in Russia in the 1890s,
“it was the government that generally fulfilled the function of industrial banks” (Gerschenkron,
p.22), with salutary effects.
Gerschenkron’s (1962) view was part of a broader sentiment in development economics
which advocated government ownership of firms in the strategic economic sectors (see Shleifer

2
(1998) for a summary). Hawtrey (1926), for example, sees such “strategic” advantages of the
nationalization of banks, along with utilities, coal mines, and education. W. Arthur Lewis (1950)
explicitly advocates government ownership of banks, as part of the “commanding heights”
approach whereby the government would develop certain strategic industries through both direct
ownership and control over finance. Myrdal (1968) is sympathetic toward government
ownership of banks in India and other Asian countries. In 1917, a few days before the October
Revolution, Lenin laid out his own perspective on banking: “Without big banks, socialism would
be impossible. The big banks are the ‘state apparatus’ which we need to bring about socialism,
and which we take ready-made from capitalism...” (Garvy (1977), p. 21). These ideas were
widely adopted around the world, as governments in the 1960s and the 1970s nationalized the
existing commercial banks and started new ones in Africa, Asia, and Latin America.
The alternative “political” view of government participation in finance shares with the
development view the desire of politicians to control investment by firms, but emphasizes
political rather than social objectives. In this view, governments acquire control of enterprises
and banks in order to provide employment, subsidies and other benefits to supporters, who return
the favor in the form of votes, political contributions, and bribes (see, e.g., Kornai (1979), and
Shleifer and Vishny (1994)). The attraction of such political control of banks is presumably the
greatest in countries with underdeveloped financial systems and poorly protected property rights,
because the government does not need to compete with the private sector as a source of funds.
This view of state ownership is buttressed by considerable evidence documenting the inefficiency
of government enterprises, the political motives behind public provision of services, and the
benefits of privatization (e.g, Megginson, Nash and Randenborgh (1994), Barberis et al. (1996),

3
Lopez-de-Silanes, Shleifer and Vishny (1997), Frydman et al. (1999), La Porta and Lopez-de-
Silanes (1999)). Gerschenkron (1962, p. 20) has some sympathy for this view: “There is no
doubt that the government as an agens movens of industrialization discharged its role in a far less
than perfectly efficient manner. Incompetence and corruption of bureaucracy were great. The
amount of waste that accompanied the process were formidable.” Still, Gerschenkron considers
government financing of industrialization in Russia a great success.
A government can participate in the financing of firms in a variety of ways: it can provide
subsidies directly, it can encourage private banks through regulation and suasion to lend to
politically desirable projects, or it can own financial institutions, completely or partially, itself.
The advantage of owning banks -- as opposed to regulating banks or owning all projects outright
-- is that ownership allows the government extensive control over the choice of projects being
financed while leaving the implementation of these projects to the private sector. Ownership of
banks thus promotes the government’s goals in both the “development” and the “political”
theories. In the former, ownership of banks enables the government both to collect savings and
to direct them toward strategic long term projects. Through such project finance, the government
overcomes institutional failures undermining private capital markets, and generates aggregate
demand and other externalities fostering growth. In the political theories, ownership of banks
enables the government to finance the inefficient but politically desirable projects. In both
theories, the government finances projects that would not get privately financed. In the
development theories, these projects are socially desirable. In the political theories, they are not.
Using data on government ownership of banks from 92 countries around the world, we
address four related questions. First, how significant is government ownership of banks in

4
different countries? Second, what types of countries have more government ownership of banks?
Third, does government ownership of banks promote subsequent financial development? Fourth,
does government ownership of banks promote subsequent economic growth and, relatedly, how
does it effect factor accumulation, savings, and growth of productivity?
Both the development and the political view imply that government ownership of banks
should be more prevalent in poorer countries, countries with less developed financial markets,
and more generally, countries with less well functioning institutions. The development theories
also imply that, other things equal, government ownership of banks should benefit subsequent
financial and economic development, factor accumulation, and especially productivity growth.
The political theories, in contrast, imply that, other things equal, government ownership of banks
should displace (crowd out) the financing of private firms. Moreover, while government
financing through its banks can encourage savings and capital accumulation, the projects the
government finances are likely to be inefficient and have an adverse effect on productivity
growth. By looking at financial development and productivity growth, we can thus attempt to
distinguish the two theories of government ownership of banks.
Although our results support some elements of the development view, they are overall
more favorable to the political view. We show, first, that government ownership of banks was
and still is common around the world: in an average country, 59 percent of the equity of the 10
largest banks was owned by the government in 1970, and 42 percent was still state-owned in
1995. Such ownership is especially common in poor countries, as well as in countries with
poorly protected property rights, heavy government intervention in the economy, and
underdeveloped financial systems. The latter findings are consistent with Gerschenkron’s (1962)
5
idea of where governments are likely to own banks. However, our results on the effects of
government ownership of banks in 1970 on subsequent financial and economic development do
not support Gerschenkron’s optimism. We find that higher government ownership of banks is
associated with slower subsequent development of the financial system, lower economic growth,
and, in particular, lower growth of productivity. These results, and particularly the finding of
low productivity growth in countries with high government ownership of banks, are broadly
supportive of the political view on the effects of government interference in markets.
This research is related to the recent literature of financial development and economic
growth. King and Levine (1993), Levine and Zervos (1998), Rajan and Zingales (1998), Beck,
Levine, Loayza (2000), Levine (1999, 2000), Wurgler (2000), and Cetorelli and Gambera (2001)
examine the relationship between financial structure and economic growth. Young (1995) shows
that in several East Asian countries growth has taken the form of factor accumulation rather than
productivity growth. Since the allocation of financial resources in East Asian economies is
heavily politicized, our results suggest that the problems that have undermined productivity
growth in East Asia may be pervasive when the government controls the flow of capital.
Two recent papers consider government ownership of banks. Sapienza (1999) finds that
Italian state-owned banks pursue political objectives in their lending policies, consistent with the
political view. Barth, Caprio and Levine (1999) present a comprehensive database on
government regulation of banks around the world. As with our paper, they find that government
ownership of banks is higher in countries with less developed financial systems. This result is
consistent with both the political and the development views.
The remainder of the paper is organized as follows. Sections I through IV deal with the

6
four questions raised above: the pervasiveness of government ownership of banks, the
characteristics of countries that have it, its effect on financial development, and its effect on the
growth of output, factor accumulation, and growth of productivity. Section V concludes.
I. How common is government ownership of banks?
A. Variable Definitions
All the variables used in this paper are summarized in the Appendix. We describe them
as they come up in the analysis.
To begin, we analyze recent government ownership of large banks in 92 countries. We
use Polk’s World Banking Profiles and the Thomson Bank Directory 1996 to determine the
number of countries with sufficient data on banks. For each country in the sample, we identify
the 10 largest commercial or development banks (in terms of assets) that lend money to firms,
regardless of their ownership structure and of whether or not they take deposits. We include
development banks because their function is precisely to finance long term development projects
where private finance may fail (Myrdal (1968)), and hence they constitute one prominent form of
government entry into bank lending. Below we discuss the role of such banks at some length.
We do not include Central Banks, Postal Banks (which generally do not lend money to firms and
are described as non-banking institutions), investment banks, other specialized financial
intermediaries (trust companies, home loan banks) or world-wide development banks such as the
World Bank. If a country has fewer than 10 banks in Polk and Thomson, we add information
where we can from Europa Yearbook and Euromoney Bank Register 1996.
We identify ownership structures of banks in this sample using company reports as well
7
as national and international sources. Identifying state versus private ownership is usually
straightforward, but there are a few judgment calls. First, we classify ownership by foreign
governments as private rather than state ownership. This reduces estimates of state ownership,
but makes analytical sense since foreign governments are less likely to support money-losing
firms abroad. Second, we keep subsidiaries of foreign banks in the sample as long as they make
loans and extend credit locally. Third, some development banks in the sample are regional, and
owned by the governments of several countries. Some of these banks also have private owners,
as well as ownership by multilateral agencies such as the World Bank. We take the equity
ownership in a regional bank by a country’s government as the estimate of the proportion of the
bank’s assets that are in that country. These steps give us estimates of government ownership of
the 10 largest banks in each country1.
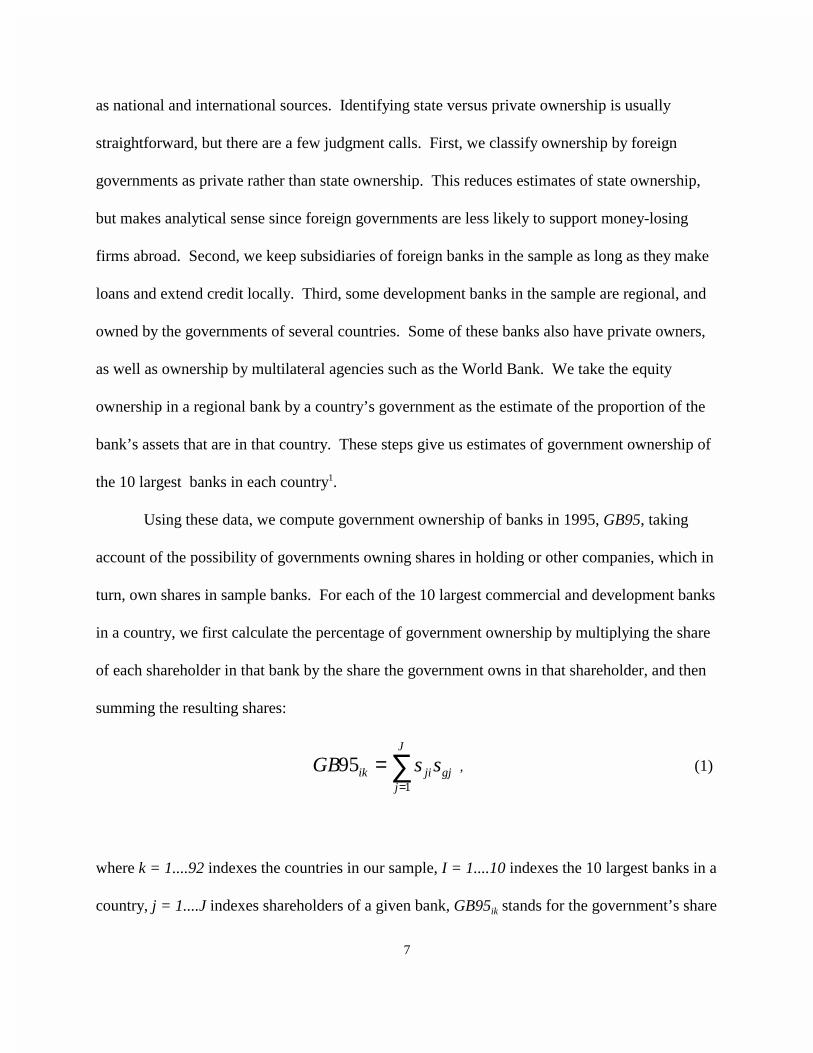
Using these data, we compute government ownership of banks in 1995, GB95, taking
account of the possibility of governments owning shares in holding or other companies, which in
turn, own shares in sample banks. For each of the 10 largest commercial and development banks
in a country, we first calculate the percentage of government ownership by multiplying the share
of each shareholder in that bank by the share the government owns in that shareholder, and then
summing the resulting shares:
, (1)∑=
=J
jgjjiik ssGB
1
95
where k = 1....92 indexes the countries in our sample, I = 1....10 indexes the 10 largest banks in a
country, j = 1....J indexes shareholders of a given bank, GB95ik stands for the government’s share

8
in bank I in country k, sji is the share of bank I owned by shareholder j, and sgj is the share of
equity the government owns in j (sgj = 0 if j is a private individual). For example, the
government of Korea owns 47.9 percent of the shares in Bank of Korea, which in turns owns 100
percent of Korea Exchange Bank. For this bank, j = 1, s1i = 1.00 and sgi = 0.48.
Government ownership of banks GB95 for country k is computed by multiplying GB95ik
of every sampled bank I by its total assets aik, summing the resulting numbers and dividing the
sum by total assets of the top 10 banks:
. (2)
∑
∑
=
== 10
1
10
1
9595
iik
iikik
k
a
aGBGB
Thus, GB95 captures the share of the assets of the top 10 banks in a given country that is
“owned” as opposed to “controlled” by the government.
The variable GB95 does not take into account the possibility that the extent of
government control of a bank, particularly when the government is a large shareholder, may
exceed its equity ownership. The next three variables classify banks as “government-owned”
when the government’s equity ownership exceeds certain thresholds.
To construct GC20, we start with government ownership measures for each of the 10
largest banks. We then classify a bank as government-owned if GB95ik > 0.2 and the
government is the largest known shareholder or if GB95ik >0.5 (in case we do not know the
percentage ownership by other shareholders). Using this definition, GC20 is the sum of assets of
all government-owned banks (among the 10 largest) divided by the total assets of 10 largest

9
banks in the country. This approach is in line with our earlier work which suggests that 20
percent ownership is typically sufficient for control (La Porta, Lopez-de-Silanes, and Shleifer
(1999)). Similarly, we construct GC50 as a ratio of the assets of the banks in which the
government holds over 50 percent of equity to the total assets of the 10 largest banks; and GC90
as a corresponding measure for banks where government equity ownership exceeds 90 percent.
These measures of government ownership of banks are highly correlated with each other: The
correlation between GB95 and GC20 is 0.95; the correlation between GB95 and GC50 is 0.97,
and the correlation between GB95 and GC90 is 0.92.
Both GB95 and the control variables reflect government ownership of banks at the end of
the period for which we have data on growth. Since we are interested in the effect of government
ownership of banks on the subsequent financial and economic development, we need an estimate
of the percentage of banking assets owned by the government at the beginning of the period over
which we compute growth. Our growth numbers are for the period 1960 to 1995, but we are not
able to find good quality data on government ownership of banks circa 1960. However, with
some effort, we are able to find data on government ownership of banks around 1970. In our
sample, six countries experienced bank nationalizations during the 1960s (Algeria, Egypt, India,
Korea, Libya, and Tanzania). We re-estimate the results presented later in the paper without
these six countries, as well as using growth numbers between 1970 and 1995 where possible.
Our results are robust to these alternative estimation strategies.
To construct GB70, we use Bankers’ Almanac, Polk World Banking Profiles and Europa
Yearbook to identify each country’s 10 largest commercial and development banks in 1970 for
the 92 countries in our sample.2 In general, to identify ownership structures we follow the same
10
procedure to construct GB70 as that for GB95. Because the data for 1970 are more limited than
those for 1995, we rely to a greater extent on country sources3. When the exact ownership
numbers are unavailable for some banks we proceed as follows. First, for 10 countries in the
sample it is not possible to get ownership information for each bank, so we rely on aggregate
measures from country sources that provided us with a percentage of the total banking assets that
were in the hands of the state.4 Second, for an additional 15 banks in the rest of the sample, we
know that government was a shareholder at the time but we do not have the exact share
ownership. When we know that the government was a shareholder, but another party was the
controlling shareholder, we assigned 0 percent of assets to government ownership (seven cases).
For government controlled banks (the remaining eight cases), we assign 100 percent of assets to
the government. (Alternative assumptions make virtually no difference). Finally, for 10 countries
some of the information is not available or its quality is very poor for the year of 1970. For these
countries, we gather information for the year closest to 1970. With two exceptions, we stay
within four years of 1970.5 The correlation between GB95 and GB70 is 0.77.
B. Findings
Table I presents our basic findings on the extent of government ownership of banks. We
divide countries into groups by the origin of their commercial laws (common law, French civil
law, German civil law, Scandinavian law, and socialist law). Our previous research shows that
the nature of both financial markets and government involvement in economic life differs
significantly across legal origins. In particular, civil law countries, and especially French civil
law countries, tend to intervene in economic activity to a greater extent than do common law

11
countries (La Porta et al., or LLSV, (1997, 1998, 1999, 2000)). The table presents both means
and medians by legal origin, although the discussion below focuses on the means.
(INSERT TABLE I APPROXIMATELY HERE)
Government ownership of banks is large and pervasive around the world. Even looking
at the 1995 data, after bank privatization had been completed in many countries, the world mean
of government ownership is 41.6 percent (median 33.4 percent), and a somewhat lower 38.5
percent (median 30 percent) if we exclude the former socialist countries. The corresponding
number for 1970 ownership is an even higher 58.9 percent (median 57.1 percent), and 52.7
percent (median 53 percent) if we exclude the former socialist countries. The comparison of
1995 and 1970 numbers suggests that privatization sharply reduced but far from eliminated
government ownership of banks.
Our adjustments for government control relative to cash flow ownership also increase the
world average compared to GB95. Using GC20 to measure government control, the world
average share of banking assets controlled by the government is 48 percent (42.3 percent without
former socialist countries). As we illustrate below, these magnitudes are considerably higher
than the measures of government participation in more general economic activity such as
production or investment. These findings establish our first proposition: government ownership
of banks remains very large, even after the wave of privatizations in the 1980s.
It is also pervasive across continents and legal origins of commercial laws. Outside of the
few rich common law countries and Japan (at the time we took the measurement), governments
nearly everywhere own a respectable share of bank equity. The common law average GB95 is
28.2 percent (median 12.3 percent), and statistically significantly lower than the French civil law

12
origin average of 45.5 percent (median 35.8 percent). The corresponding means for 1970 are
34.5 percent and 65.4 percent. As is often the case in these comparisons of financial structures,
the German and the Scandinavian averages are between the English and French ones, and close
to each other. The former socialist countries still have the highest average share of equity of the
largest banks owned by the government (61.8 percent), although this share is down sharply from
100 percent in 1970. The corrections for government control change these numbers somewhat,
but do not alter the picture of high and pervasive government ownership of banks, occurring
nearly everywhere but especially in French civil law and socialist law countries.
Table II examines the importance of development banks in our sample. An argument has
been made that because development banks are so important in some countries, our results are
driven by them alone. The first column shows, by legal origin, how much of the ownership of
the top 10 banks is accounted for by government ownership of development banks. On average,
about 5.3 percent out of 41.6 percent overall level of government ownership is accounted for by
development banks. Development banks are particularly prevalent in French legal origin
countries (largely in Latin America), and utterly uncommon in German, Scandinavian, and
socialist origin countries.
(INSERT TABLE II APPROXIMATELY HERE)
The second column of Table II reproduces the averages of GB95 from Table I, and the
third column shows how these averages change when we take development banks out of the
sample (i.e., both the numerator and the denominator in the definition of GB95). The corrected
variable, government ownership of commercial banks or GBCOM95, has a worldwide average of
38.3 percent (compared to 41.6 percent for GB95). The difference between French and English

13
origins remains large, but no longer statistically significant. The last two columns of Table II
show that the development bank correction does not change our conclusions for GB70 either.
Conceptually, we believe it is appropriate to include development banks in the sample,
since in some countries these are precisely the banks allegedly addressing the Gerschenkron-
Myrdal development problems. We therefore keep these banks in the results we present. For
completeness, we have redone every regression excluding them. The statistical significance of
some results falls, but the important results presented below remain statistically significant.
The results on the differences in government ownership of banks among legal origins are
in principle consistent with both the development and the political view. Earlier research (LLSV
1997, 1998) shows that countries with French legal origin laws have less investor protection and
less developed private financial markets than do common law countries, which on the
development view would increase the demand for government provision of finance. Other
research (LLSV (1999)) shows that French legal origin countries generally intervene more in
economic life. Consistent with the political view, government ownership of banks may then
reflect the greater politicization of economic activity in French legal origin (and socialist)
countries than in common law countries. In the subsequent sections, we present further evidence
that attempts to distinguish the two theories. Importantly, all the results presented below have
been rerun excluding socialist countries, and the conclusions we draw do not depend on them.
II. Which countries have high government ownership of banks?
In this section, we ask which characteristics of countries predict high government
ownership of banks. In Table III, we first consider the correlations between various country

14
characteristics and GB95. In general, we try to find the earliest available measures of country
characteristics, but most data are still from the 1990s, and hence, we cannot really say what
“causes” high government ownership of banks. In addition, because poorer countries generally
have higher GB95, Table III also presents the coefficients from the regression of GB95 on the
country characteristic in question, a constant, and the log of 1960 per capita GDP. These results
crudely correct for the differences in initial conditions.
(INSERT TABLE III APPROXIMATELY HERE)
We begin the analysis with the 1960 level of per capita income simply to point out that
poorer countries indeed have more government ownership of banks. We then examine a number
of indicators of the quality of government, some of which we have studied in an earlier paper
(LLSV (1999)). These include measures of government intervention in economic life (such as
regulation, price controls, black market premium, political rights, and government spending),
measures of the efficiency of government (such as tax compliance, corruption and bureaucratic
quality), measures of the security of property rights, rule of law, and investor protection,
measures of the importance of state-owned firms in the overall economy as opposed to just in
banking, measures of initial levels of financial development, and finally, measures of the
incidence of political and financial crises in the economy.
Panel A of Table III establishes that GB95 is higher in countries that were poorer in 1960.
Panel B shows that countries with more interventionist governments also have higher GB95.
Heavier regulation, higher frequency of price controls, heavier banking regulation, and higher
black market exchange rate premiums are all associated with greater government ownership of
banks, even controlling for initial per capita income. Both the correlations and the regression

15
coefficients are statistically significant. At the same time, there is no relationship between GB95
and the size of government, as measured by government consumption or government transfers
and subsidies relative to GDP. This may be partly due to the fact that government spending is
high in developed market economies, which generally have both big and good government
(LLSV (1999)).
Panel B also shows that government ownership of banks is lower in countries that have
wider political rights or are more democratic. This result actually helps distinguish the political
from the development view. If government ownership of banks served social goals, we would
expect that governments subject to greater public pressure, (i.e., the more democratic
governments) would have higher ownership, other things being equal. To the extent that per
capita income controls for the “need” for such ownership in the development view, the evidence
contradicts this view. In contrast, it supports a key prediction of the political story, namely that
governments are less able to use the banks they own to redistribute wealth to political supporters
when they are subject to greater oversight by the electorate. As a consequence, they have less
interest in owning such banks. Djankov et al. (2000) make a similar argument in the context of
government regulation of entry by new firms, which is lighter in more democratic countries.
Panel C considers government efficiency, which is related to interventionism but is not
necessarily the same thing. Countries with less efficient governments have greater government
ownership of banks. Higher tax compliance, higher bureaucratic quality, and lower corruption
are all associated with lower government ownership of banks. The corruption index is not
statistically significant in a regression controlling for income, but other variables are.
Panel D focuses on the security of property rights. The property rights index, rule of law,

16
and the likelihood of government repudiation of contracts all show that countries with greater
security of property rights have lower GB95. This result is consistent not only with
Gerschenkron’s (1962) views, but also with the prediction of the political story that government
ownership will be higher when the government gets a greater bang for the buck from its control
of finance (Shleifer and Vishny (1994)). There is no significant correlation between GB95 and
the LLSV (1998) measures of legal protection of either shareholders or creditors.
Panel E examines the relationship between government ownership of banks and
measures of the importance of state owned enterprises (SOEs) in the economy, including an
index of their prevalence as well as measures of relative output, investment, and employment of
SOEs. Not surprisingly, countries with greater roles of SOEs in the economy also have higher
government ownership of banks, although GB95 is on average higher than the measures of the
relative size of the SOEs in the economy. These numbers are not, however, directly comparable,
since we do not consider the smaller banks, where government ownership may be lower.
Panel F examines the relationship between GB95 and measures of initial financial
development. We use measures of banking development from Beck, Levine, and Loayza (2000),
who propose three variables: Credit by financial intermediaries to the private sector relative to
GDP, liquid liabilities of the financial system relative to GDP, and a ratio of commercial bank
domestic assets to commercial plus central bank domestic assets. Theoretically, the first variable
is the most suitable for our purposes, since unlike the other two it measures private as opposed to
overall financial development. The data show negative correlations between these measures of
financial development and GB95, though the results are insignificant6. In addition, we use the
ratio of stock market capitalization to GDP around 1976 as a measure of initial financial

17
development. Although the raw correlation with GB95 is insignificant, the regression coefficient
indicates that countries with more developed stock markets in the 1970s have lower government
ownership of banks in 1995.
Finally, in Panel G we examine the question of whether government ownership of banks
is associated with economic and political instability, as measured by inflation, the incidence of
political crises and coups, as well as the incidence and depth of banking crises. The data on
banking crises pertain to the period 1970 to1990. Here causality is a particularly thorny issue,
since government ownership may be a cause of instability because of politicized lending, but may
also be a response to instability through nationalizations. Ironically, except for some evidence
that countries with higher inflation have higher GB95, the association between GB95 and the
available measures of instability is weak. This may be because of the timing problems in the
data. Alternatively, such factors as the general interventionist stance of the government, its
efficiency, and the security of property rights may be more important correlates of government
bank ownership than are the assorted crises7.
The evidence in this section is generally consistent with both the development and the
political views of government ownership of banks. Countries with higher GB95 are more
backward and more statist: They are poorer, have more interventionist and inefficient
governments, and less secure property rights. Countries with less developed financial systems
also seem to have higher government ownership of banks. At the same time, consistent with the
political but not the development view, less democratic countries have higher government
ownership of banks, holding per capita income constant.
In the next two sections, we examine the consequences of government ownership of
18
banks. Are interventionist and inefficient governments able to step in and, through their
ownership of banks, jump start the financial system and accelerate development consistent with
the development view? Alternatively, do such governments simply politicize resource allocation
without much benefit to growth consistent with the political view?
III. Does government ownership of banks speed up financial development?
Gerschenkron (1962) suggests that the government, by participating in the financial
sector, can encourage the subsequent development of lending to the private sector. The
government may help to develop the institutions of lending such as standardized contracts or
specialized courts, show by example that long-term lending is possible and profitable, or simply
subsidize private banks. In contrast, in the political theory, government control of finance and
the resulting politicization of resource allocation would, other things being equal, slow down
financial development.
In Table IV, we examine the effect of GB70 on the measures of future financial
development controlling both for initial per capita income and initial financial development.
Because GB70 comes from the beginning of the sample period, it is more natural, though still
imperfect, to interpret this evidence as causal. In assessing financial development, we are mostly
interested in access of private firms to finance, as this is the dimension that Gerschenkron (1962)
himself emphasized as a measure of success. We use two approaches to this measurement, each
having some advantages and some problems. First, we consider the growth in Beck, Levine and
Loayza’s (2000) measures of financial development between 1960 and 1995 introduced in Panel
F of Table III, extending their sample to cover 82 countries. Recall that only the first of these

19
three variables measures the lending to the private sector specifically. In addition, we consider
the growth of the ratio of stock market capitalization to GDP. Second, we examine the efficiency
of the banking system at the end of the period. The three categories of efficiency measures we
look at are access of firms to credit, efficiency of the banking sector, and financial stability.
Again, these three variables are not constructed to pertain to private sector only.
(INSERT TABLE IV APPROXIMATELY HERE)
Panel A of Table IV examines financial development between 1960 and 1995. First, the
initial level of financial development is negatively correlated with its own subsequent growth,
possibly reflecting some convergence in financial development. Second, government ownership
of banks ceteris paribus reduces subsequent financial development. This effect is statistically
significant at the one percent level for the growth in the ratio of private credit to GDP and for the
change in the ratio of stock market capitalization to GDP8. It is less significant or insignificant
for the other measures. These results are inconsistent with the development view of government
ownership of banks, but consistent with the political view.
In Panel B, access to credit is measured first as the share of private credit that goes to
firms outside the top 20 and second as a survey measure of credit availability to firms. In both
cases, higher GB70 is associated with sharply lower measures of access of firms to credit at the
end of the period. These findings are particularly ironic in light of the development view that
government ownership broadens the access of firms to credit.
In Panel C, end-of-period efficiency of the banking sector is measured first as a ratio of
bank overhead costs to bank assets and second as the spread between the lending and the
borrowing rate. On both measures, the efficiency of the banking sector is sharply lower when

20
GB70 is higher. In panel D, we measure financial stability first as a survey measure of the
soundness of banks in 1999, second as inflation between 1970 and 1995, and third as an estimate
of the share of the banking assets affected by crises during this period. On all measures, a higher
GB70 is associated with greater subsequent financial instability. While one can quibble with
each of these individual measures, the evidence in this table shows that financial systems of
countries with higher initial government ownership of banks grow less fast, and are less efficient.
This evidence does not support the development theories of government banking.
IV. Does Government Ownership of Banks Speed Up Economic Growth?
In the development view, government ownership of banks should encourage savings,
capital accumulation, and productivity growth. The political view does not have strong
implications for savings and capital accumulation, but holds that political resource allocation is
likely to have detrimental effects on the growth of productivity.
Table V presents growth regressions, in which the dependent variable is the growth in per
capita income between 1960 and 1995. In the first regression, we include only the initial per
capita income and GB70 as independent variables. In subsequent regressions, we include
additional controls. The use of ownership data from the beginning of the sample, as well as the
inclusion of important controls that might be correlated with both GB70 and subsequent growth,
gives us a plausible though imperfect way of evaluating the effect of government bank ownership
on subsequent economic development.
(INSERT TABLE V APPROXIMATELY HERE)
To begin, the results confirm the “convergence” finding that initially poorer countries
21
grow faster (Barro (1991)). In addition, higher GB70 is associated with statistically significantly
slower economic growth. A parameter estimate of around -0.023 suggests that, as government
ownership of banks rises by 10 percentage points, growth falls by 0.23 percent per annum -- by
no means a small effect. Although this result requires a number of qualifications and robustness
checks, taken up below, it does not support the development view that government participation
in finance promotes economic development.
In the second regression, we control for average years of schooling, as is standard in
growth regressions. The coefficient on GB70 remains statistically significant. We then add
alternatively the three measures of initial financial development from Beck, Levine and Loayza
(2000), as well as the initial ratio of stock market capitalization to GDP. For all four measures,
the initial level of financial development exerts a positive influence on future growth, consistent
with the work of Levine and his co-authors9. Yet holding initial financial and economic
development and schooling constant, GB70 continues to exert a large and statistically significant
negative effect on subsequent growth. The coefficient remains between -0.015 and -0.018.
Controlling for the traditional variables in the growth regressions, government ownership of
banks reduces subsequent economic growth.
One concern with these specifications is that GB70 may simply proxy for some
alternative measure of distortionary economic policies or poorly protected property rights. These
policies, rather than government ownership of banks per se, may retard economic growth (Knack
and Keefer (1995)). After all, we have already shown that government ownership of banks is
more prevalent in countries with interventionist and inefficient governments, as well as poorly
protected property rights. In Table VI, we include some of the standard measures of government

22
intervention, using the earliest data available so that we can interpret these variables as having a
possible causal effect on growth. Because on the political view some of these variables should
be correlated with GB70, their inclusion may spuriously reduce the estimate below the true effect
of GB70. In all these regressions, we include initial private credit relative to GDP, initial
economic development, average years of schooling, as well as a number of geographic controls
to address the possible omitted variable bias.
Measures of government distortions reduce and sometimes eliminate the statistical
significance of the effect of GB70 on subsequent growth, although in part this is due to the
decrease in the number of observations. The coefficient falls to about -0.013 on average.
Interestingly, the distortions we measure do not themselves have statistically significant adverse
effects on future growth when included in the regression with GB70, which, among the measures
of government intervention, is the most significant variable.
Another possible concern is that smaller countries have near-monopoly banking, and
hence are more likely to have higher government ownership of banks. To address this concern,
we reestimate the regressions in Tables IV through VII using Weighted Least Squares. We try
as weights both the initial population of each country and the initial adult population. Our results
are robust to this alternative estimation strategy.
(INSERT TABLES VI AND VII APPROXIMATELY HERE)
Following Beck, Levine and Loayza (2000), we next consider specific channels through
which government ownership of banks can influence economic growth. Panel A of Table VII
focuses on savings and capital accumulation. Initial per capita income exerts a (statistically
insignificant) negative influence on capital accumulation, and a positive influence on savings.

23
Higher years of schooling are associated with higher capital accumulation. Greater initial
financial development is associated with faster subsequent capital accumulation, consistent with
Beck, Levine, and Loayza. However, GB70 has no significant influence on either capital
accumulation or savings. The positive but insignificant effect of government ownership of
banks on savings provides mild support for the development view, although we find no evidence
of an effect on capital accumulation, which is central to that view.
Panel B of Table VII focuses on the growth in productivity. Following Beck, Levine and
Loayza (2000), we consider three measures of productivity growth (see Table I for exact
definitions). The first measure derives productivity growth as output growth adjusted for capital
accumulation. The second and third measures also adjust output growth estimates by the growth
of human capital. We have been able to expand the Beck, Levine and Loayza sample from 61 to
77 countries for their first two measures of productivity growth, but not for the third one, since
the data needed for the last productivity measure were not available for the extra countries.
The results on productivity growth are striking: GB70 exerts a negative and, in most
specifications, statistically significant effect on future productivity growth, even controlling for
initial financial development and schooling. The coefficients in specifications with controls are
around -0.01, indicating that a 10 percentage point higher measure of government ownership is
associated with 0.1 percent per annum lower rate of productivity growth. Productivity appears to
be the place where government ownership of banks negatively impacts growth.
This evidence is broadly consistent with the political view according to which
government ownership leads to misallocation of resources that are detrimental to productivity
growth and ultimately economic growth itself. The evidence on resource misallocation is also

24
consistent with Sapienza’s (1999) findings for Italian banks, as well as with a large literature on
state firms. Finally, the data support Young’s (1995) interpretation of Asian growth. The
evidence is not, however, consistent with the development view of the beneficial effects of
government ownership of banks on productivity growth10.
Finally, it could be argued that the benefits of government ownership of banks appear
only in backward countries with poorly developed economic, financial, and property rights
regimes. By grouping all countries into a regression, we may have failed to test this theory
correctly. In Table VIII, we reproduce some of our analyses by dividing the sample into the
relatively rich and relatively poor countries as of 1960, relatively financially developed and
relatively financially underdeveloped countries as of 1960, and countries with good and poor
protection of property rights, for which an assessment is only available for the 1990s. In all
three instances, GB70 has a more adverse effect on income growth in less developed countries,
and in one case (sorting on initial financial development), the difference is statistically
significant. Perhaps the richer countries can better get around the distortions associated with
heavy government involvement in the financial sphere, in part because they have better access to
foreign capital. In contrast, the more backward countries cannot, and pay with a lower rate of
growth of output and productivity. In any case, these results do not support the development
thesis, according to which government ownership of banks should have a more positive -- as
opposed to negative -- effect on growth in the less developed countries.
(INSERT TABLE VIII APPROXIMATELY HERE)

25
V. Conclusion
In this paper, we investigate a neglected aspect of financial systems of many countries
around the world: government ownership of banks. The data shed light on four issues. First,
government ownership of banks is large and pervasive around the world even in the 1990s.
Second, such ownership is larger in countries with low levels of per capita income,
underdeveloped financial systems, interventionist and inefficient governments, and poor
protection of property rights. Third, government ownership of banks in 1970 is associated with
slower subsequent financial development. Finally, government ownership of banks is associated
with lower subsequent growth of per capita income, and in particular with lower productivity
growth rather than slower factor accumulation. These negative associations are not weaker in the
less developed countries. Of course, as with most growth regressions, these results are not
conclusive evidence of causality.
Some aspects of the empirical story are consistent with the 1960s development economics
view that government ownership of banks may arise as a response to institutional and financial
underdevelopment. However, the results are inconsistent with the optimistic assessment
inherent in this view of the beneficial consequences of such ownership for subsequent
development, advanced by Gerschenkron (1962), Myrdal (1968) and others. In contrast, the
results are consistent with the political view of government ownership of firms, including banks,
according to which such ownership politicizes the resource allocation process and reduces
efficiency. Ultimately, and in line with the latter theories, government ownership of banks is
associated with slower financial and economic development, including in poor countries.
26
REFERENCES
The Bankers' Almanac, Reed Information Services, London, 1972, 1997.
Barberis, Nicholas, Maxim Boycko, Andrei Shleifer, and Natalia Tsukanova, 1996, How does
privatization work? Evidence from the Russian shops, Journal of Political Economy
104, 764-790.
Barro, Robert, 1991, Economic growth in a cross-section of countries, Quarterly Journal of
Economics 56, 407-443.
Barro, Robert and Jong-Wha Lee,1996, International measures of schooling years and schooling
quality, American Economic Review Papers and Proceedings 86, 218-223.
Barth, James, Gerard Caprio, Jr., and Ross Levine, 1999, Banking systems around the globe:
Do regulation and ownership affect performance and stability? Mimeo, World Bank.
Beck, Thorsten, Levine, Ross and Norman Loayza, 2000, Finance and the sources of growth,
Journal of Financial Economics 58, 261-300.
Beck, Thorsten; Demirguc-Kunt, Asli, and Ross Levine, 2001, A new database on financial
systems around the world, in Financial Structure and Economic Growth: A Cross-
Country Comparison of Banks, Markets, and Development (MIT Press, Cambridge).
Caprio, Jr., Gerald, and Daniela Klingebiel, 1996, Banking insolvencies: Cross country
experience, Mimeo, World Bank.
Central Intelligence Agency, various years, CIA World Factbook, published online.
Cetorelli, Nicola and Michele Gambera, 2001, Banking market structure, financial
dependence and growth: International evidence from industry data, Journal of Finance
56, 617-648.
27
Djankov, Simeon, Rafael La Porta, Florencio Lopez-de-Silanes, and Andrei Shleifer, 2000, The
regulation of entry, NBER Working Paper #7892.
Easterly, William and Ross Levine, 1997, Africa’s growth tragedy: Policies and ethnic divisions,
Quarterly Journal of Economics 112, 1203-1250.
Euromoney Bank Register, 1996, Euromoney Publications, London.
The Europa Yearbook: a World Survey, 1971, 1995, Europa Publications Ltd, London.
Freedom House,1996, Freedom in the World: The Annual Survey of Political Rights and Civil
Liberties 1995-1996 Freedom House, New Brunswick, NY.
Frydman, Roman, Cheryl Gray, Mark Hessel, and Andrzej Rapaczynski,1999, Private ownership
and corporate performance: Evidence from the transition economies, Quarterly Journal
of Economics 114, 1153-1192.
Garvy, George, 1977, Money, Financial Flows, and Credit in the Soviet Union Ballinger
Publishing Company for the National Bureau of Economic Research, Cambridge, MA.
Gerschenkron, Alexander 1962, Economic Backwardness in Historical Perspective Harvard
University Press, Cambridge, MA.
Gwartney, James, Robert Lawson, and Walter Block, eds., 1996, Economic Freedom of the
World 1975-1995 The Fraser Institute, Vancouver, BC.
Hall, Robert and Charles Jones, 1999, Why do some countries produce so much more output per
worker than others?, Quarterly Journal of Economics 114, 83-116.
Hawtrey, Ralph G., 1926, The Economic Problem (Longmans, Green and Co., London).
Holmes, Kim R., Bryan T. Johnson, and Melanie Kirkpatrick, eds., 1997, 1997 Index of
Economic Freedom (The Heritage Foundation, Washington, DC and Dow Jones &

28
Company, New York).
International Monetary Fund, various, International Financial Statistics ( IMF, Washington,
DC).
Jaggers, Keith and Ted Robert Gurr, 1996, Polity III: Regime Change and Political Authority
1800-1994, [computer file] (Inter-university Consortium for Political and Social Research
Ann Arbor, MI).
King, Robert, and Ross Levine, 1993, Finance and growth: Schumpeter might be right, Quarterly
Journal of Economics 108, 717-738.
Knack, Stephen and Philip Keefer, 1995, Institutions and economic performance: Cross-country
tests using alternative institutional measures, Economics and Politics 7, 207-227.
Kornai, Janos, 1979, Resource-constrained versus demand-constrained systems, Econometrica
47, 801-819.
La Porta, Rafael and Florencio Lopez-de-Silanes, 1999, The benefits of privatization: Evidence
from Mexico, Quarterly Journal of Economics 114, 1193-1242.
La Porta, Rafael, Florencio Lopez-de-Silanes, Andrei Shleifer, 1999, Corporate ownership
around the world, Journal of Finance 54, 471-517.
La Porta, Rafael, Florencio Lopez-de-Silanes, Andrei Shleifer and Robert W. Vishny, 1997,
Legal determinants of external finance, Journal of Finance 52, 1131-1150.
La Porta, Rafael, Florencio Lopez-de-Silanes, Andrei Shleifer and Robert W. Vishny, 1998, Law
and finance, Journal of Political Economy 106, 1113-1155.
La Porta, Rafael, Florencio Lopez-de-Silanes, Andrei Shleifer and Robert W. Vishny, 1999, The
quality of government, Journal of Law, Economics and Organization 15, 222-279.

29
La Porta, Rafael, Florencio Lopez-de-Silanes, Andrei Shleifer, and Robert W. Vishny, 2000,
Investor protection and corporate governance, Journal of Financial Economics 58, 3-28.
Levine, Ross, 1999, Law, finance, and economic growth, Journal of Financial Intermediation 8,
113-136.
Levine, Ross, 2000, Bank-based or market-based financial systems: Which is better?, Mimeo,
University of Minnesota.
Levine, Ross and Sara Zervos, 1998, Stock markets, banks, and economic growth, American
Economic Review 88, 537-558.
Lewis, W. Arthur, 1950, The Principles of Economic Planning (G. Allen & Unwin, London).
Lopez-de-Silanes, Florencio, Andrei Shleifer and Robert Vishny, 1997, Privatization in the
United States, RAND Journal of Economics 28, 447-471.
Mankiw, Gregory, 1995, The growth of nations, Brookings Papers on Economic Activity, 275-
326.
Megginson, William L., Robert C. Nash and Mathias van Randenborgh, 1994, The financial and
operating performance of newly privatized firms: An international empirical analysis,
Journal of Finance 49, 403-452.
Mincer, Jacob, 1974, Schooling, Experience, and Earnings (Columbia University Press, New
York).
Myrdal, Gunnar, 1968, Asian Drama (Pantheon, New York).
Rajan, Raghuram and Luigi Zingales, 1998, Financial dependence and growth, American
Economic Review 88, 559-586.
Political Risk Services, 1996, International Country Risk Guide (Political Risk Services, East

30
Syracuse, NY).
Polk's World Bank Directory: International Section, 1973, (R.L. Polk & Co., Nashville, TN).
Polk's World Banking Profiles, 1997, (Thomson Financial Publishing, Skokie, IL).
Sapienza, Paola, 1999, What do state-owned firms maximize? Evidence from the Italian banks,
Mimeo, Northwestern University.
Schiavio-Campo, Salvatore, de Tommaso, Giulio and Amitabha Mukherjee, 1997, An
international statistical survey of government employment and wages, The World Bank
Policy Research Working Paper 1806.
Schwab, Klaus et al., eds., World Economic Forum, 1999, The Global Competitiveness Report
1999, (Oxford University Press, New York).
Shleifer, Andrei, 1998, State versus private ownership, Journal of Economic Perspectives 12,
133-150.
Shleifer, Andrei and Robert Vishny, 1994, Politicians and firms, Quarterly Journal of Economics
109, 995-1025.
Thomson Financial Publishing, 1996, Thomson Bank Directory 1996 (Thomson Financial
Publishing, Skokie, IL).
The World Bank, 1995, Bureaucrats in Business: the Economics and Politics of Government
Ownership (Oxford University Press, Washington, DC).
The World Bank, 1995, World Development Report (Oxford University Press, Washington, DC).
The World Bank, 1995, World Tables (Johns Hopkins University Press, Baltimore, MD).
The World Bank, 1997, World Development Indicators (The World Bank, Washington, DC).
World Banking 1971-1972, 1973, (Investors Chronicle and Stock Exchange Gazette, London).

31
WorldScope Global, 1996, (Disclosure, Inc., Bethesda, MD).
Wurgler, Jeffrey, 2000, Financial markets and the allocation of capital, Journal of Financial
Economics 58, 187-214.
Young, Alwyn, 1995, The tyranny of numbers: Confronting the statistical realities of East Asian
growth experience, Quarterly Journal of Economics 110, 641-680.
32
1. In all but nine countries in the sample (Colombia, Hong Kong, Indonesia, Japan, Malaysia,Paraguay, Peru, South Africa and the U.S.), our top 10 banks represent more than 75 percent ofthe total claims on the private sector. In only the U.S. and Hong Kong, do they represent lessthan 50 percent.
2. An earlier version of this paper presented data on ownership of banks in 1985. Thesenumbers are easier to find the sources for, and yield similar results to those for 1970. Thecorrelation between these two indices is 0.90. In general, government ownership of banks washigher in 1970 than in 1985.
3.These data sources are described in an Appendix available from the authors.
4. These countries are: Dominican Republic, Kenya, Oman, Panama, Paraguay, Saudi Arabia, SriLanka, Trinidad and Tobago, United Arab Emirates and Zimbabwe.
5. The specific countries and year of information are the following: Bahrain (ownership andassets are for 1974), Kenya (ownership and assets are for 1973), Qatar (ownership and assets arefor 1974), South Korea (ownership and assets are for 1972), United Arab Emirates (ownershipand assets are for 1975), El Salvador (ownership for 1967 and assets for 1970), Guatemala(ownership for 1963 and assets for 1970), Iran (ownership for 1974 and assets for 1970), Kuwait(ownership for 1974 and assets for 1970), Lebanon (ownership for 1974 and assets for 1970). For these countries, we know that there were no major privatizations or nationalizations betweenthe year of the ownership data and 1970.
6. Starting in 1970, we have further measures of financial development: the ratio of quasi-liquidliabilities to GDP, the ratio of domestic credit by the banking sector to GDP, and the ratio ofclaims on the private sector to GDP. The results for two out of these three variables, controllingfor 1970 per capita GDP, are statistically significant.
7. We have redone this analysis using GB70 rather than GB95. The results are similar both interms of the coefficients and in terms of the patterns of statistical significance.
8. Because many countries do not have stock markets in the 1970s, we can only properly defineand use the growth rate of the ratio of stock market capitalization to GDP for 47 countries.However, we can use the change in this ratio rather than the growth rate for 67 countries.
9. When we include the ratio of initial private credit to GDP and the ratio of initial stock marketcapitalization to GDP into the same regression, the former, but not the latter, is statisticallysignificant. In this regression as well, GB70 negatively affects growth.
10. In an earlier draft, we provided instrumental variable estimates of our growth of income,capital, and productivity regressions using legal origins and the percent of the population invarious religions in 1900 as instruments (see LLSV 1999). The results corroborated the OLS
Endnotes

33
evidence, and the statistical tests accepted the instruments.

34
AppendixDescription of the Variables
Variable name Description and sourceNumber of
observations
Government banking
Government ownershipof banks in 1995[GB95]
Share of the assets of the top 10 banks in a given country owned by the government of that country in 1995. Thepercentage of the assets owned by the government in a given bank is calculated by multiplying the share of eachshareholder in that bank by the share the government owns in that shareholder, and then summing the resulting shares. Source: Authors’ calculations based on various sources.
92
Government ownershipof banks in 1970[GB70]
Share of the assets of the top 10 banks in a given country owned by the government of that country in 1970. Thepercentage of the assets owned by the government in a given bank is calculated by multiplying the share of eachshareholder in that bank by the share the government owns in that shareholder, and then summing the resulting shares. Source: Authors’ calculations based on various sources.
92
Government control ofbanks at 20 percent[GC20]
Share of the assets of the top 10 banks in a given country controlled by the government at the 20 percent level in 1995.A bank is controlled by the government if GB is larger than 20 percent and the state is the largest shareholder. Source:Authors’ calculations based on various sources.
92
Government control ofbanks at 50 percent[GC50]
Share of the assets of the top 10 banks in a given country controlled by the government at the 50 percent level in1995. Government ownership at the 50 percent level is defined as the government having at least 50 percentownership. The percentage of assets owned by the government in a given bank is calculated following the samemethodology outlined for GB. Source: Authors’ calculations based on various sources .
92
Government control ofbanks at 90 percent[GC90]
Share of the assets of the top 10 banks in a given country controlled by the government at the 90 percent level in 1995. Government ownership at the 90 percent level is defined as the government having at least 90 percent ownership. Thepercentage of assets owned by the government in a given bank is calculated following the same methodology outlinedfor GB. Source: Authors’ calculations based on various sources.
92
Government ownershipof development banks[GBDEV95]
Share of the assets of the top 10 banks in a given country owned by the government and reported to be developmentbanks in 1995. The percentage of assets owned by the government is calculated following the same methodologyoutlined for GB. Source: Authors’ calculations based on various sources.
92
Government ownershipof Commercial banks[GBCOM95]
Same definition as GB95 except that it excludes development banks from the calculation of both governmentownership and total assets of the top 10 banks in a given country. Source: Authors’ calculations based on varioussources .
92
Government ownershipof commercial banksbefore privatization[GBCOM70]
Same definition as GB70 except that it excludes development banks from the calculation of both governmentownership and total assets of the top 10 banks in a given country. Source: Authors’ calculations based on varioussources.
92
Initial level of development
Log of GDP per capita Logarithm of GDP per capita expressed in current US dollars in 1960 and in 1970. Source: International MonetaryFund, World Development Indicators (1997).
91 (1960)92 (1970)
Government intervention
Business regulationindex
An index of regulation policies related to opening a business and keeping open a business (on a scale from 1 to 5).A high score indicates that regulations are straight-forward and applied uniformly to all businesses and that regulationsare less of a burden to business. The score refers to the index in 1997. Source: Holmes, Johnson and Kirkpatrick, eds.(1997).
87
Frequency of pricecontrols index
An index of frequency of price controls imposed by the government that interfere with the freedom of buyers andsellers to undertake exchanges even though the terms of trade are mutually agreeable. Indicates the extent to whichcompanies can set prices freely: 0=not at all, 10=very much so. Average of indices for 1989 and 1994, which are theonly available. Source: Gwartney, Lawson and Block, eds. (1996).
74
Government interventionin the banking sectorindex
An index of the degree of openness of a country’s banking system. Specifically, the index accounts for the following:How difficult it is to open domestic banks; how heavily regulated the banking system is; the degree of governmentinfluence over the allocation of credit; whether banks are free to provide customers with insurance, sell real estate, andinvest in securities; and whether foreign banks are able to operate freely. The scale is from 1 to 5. A high score means:There are very few restrictions on banks, they can engage in all types of financial services, government controls fewcommercial banks and that there is no government deposit insurance. The score refers to the index in 1997. Source:Holmes, Johnson and Kirkpatrick, eds. (1997).
87
Black market premium Natural logarithm of 1 plus the average exchange rate black market premium measured for the 1960s and the 1980sSource: Easterly and Levine (1997) and authors own calculations.
90 (1960s)75 (1980s)

Variable name Description and sourceNumber of
observations
35
Governmentconsumption / GDP
Government consumption expenditures as a percentage of GDP (scale from 0 to 100). Average for the years 1971to1995. Government consumption expenditures "include all spending on goods and services purchased by thegovernment, such as national defense, road maintenance, wages and salaries, office space, and government ownedvehicles. Since it is obtained from the national income accounts, it includes all levels of government spending. It doesnot include direct transfers and subsidies since these do not enter into the national income accounts." Source:Gwartney, Lawson and Block, eds. (1996) (with data from the World Bank and the International Monetary Fund).
87
Transfers and subsidies /GDP
Total government transfers and subsidies as a percentage of GDP (scale from 0 to 100). Average for the years 1974-1994. Source: Gwartney, Lawson and Block, eds. (1996) (with data from the World Bank and the InternationalMonetary Fund).
70
Top marginal tax rate The top marginal tax rate imposed by the government on high income levels. Average of the 1975-1995 period. Source: Gwartney, Lawson and Block, eds. (1996).
54
Index of governmentintervention in theeconomy 1975
A composite index constructed from all the government intervention measures in Economic Freedom of the World:government consumption to GDP, SOE in the economy index, frequency of price controls index, entry regulationindex, legal system (equality of citizens under the law and access to non-discriminatory judiciary), governmentintervention and regulation causing negative interest rates. Scale ranging from 0 to 10, 10 indicating minimal or nogovernment intervention. Source: Gwartney, Lawson and Block, eds. (1996).
52
Political rights index Index of political rights. Higher ratings indicate countries that come closer "to the ideals suggested by thechecklist questions of: (1) free and fair elections; (2) those elected rule; (3) there are competitive parties or othercompetitive political groupings; (4) the opposition has an important role and power; and, (5) the entities have selfdetermination or a very high degree of autonomy." Source: Freedom House (1996).
91
Democracy index Average of democracy score for the period 1970 to 1994. Scale from 0 to 10, with lower values indicating a lessdemocratic environment. Source: Jaggers and Gurr (1996).
90
Government efficiency
Tax compliance index An index of the assessment of the level of tax compliance. Scale from 0 to 6, where higher scores indicate highercompliance. The score refers to the index in 1995. Source: Schwab et al., eds. (1999).
47
Bureaucratic qualityindex
High scores indicate "autonomy from political pressure" and "strength and expertise to govern without drastic changesin policy or interruption in government services." Scale from 0 to 10, with higher score indicating greater efficiency.Average of the months of April and October of the monthly index between 1982 and 1995. Source: Political RiskServices (1996).
86
Corruption index An index of corruption in government. Scale from 0 to 10. Low ratings indicate "high government officials are likelyto demand special payments" and "illegal payments are generally expected throughout lower levels of government"in the form of "bribes connected with import and export licenses, exchange controls, tax assessment, policy protection,or loans." Average of the months of April and October of the monthly index between 1982 and 1995. Source:Political Risk Services (1996).
86
Property rights
Property rights index An index of property rights in each country (on a scale from 1 to 5). The more protection private property receives,the higher the score. The score is based, broadly, on the degree of legal protection of private property, the extent towhich the government protects and enforces laws that protect private property, the probability that the government willexpropriate private property, and the country’s legal protection to private property. Source: Freedom House (1996).
90
Rule of law index Assessment of the law and order tradition in the country produced by the country-risk rating agency InternationalCountry Risk Guide. Average of the month of April and October of the monthly index between 1982 and 1995. Scalefrom 0 to 6. Lower scores indicate less tradition for law and order. Source: Political Risk Services (1996).
86
Government repudiationof contracts index
An index of ICRG’s assessment of the "risk of a modification in a contract taking the form of a repudiation,postponement, or scaling down" due to "budget cutbacks, indigenization pressure, a change in government, or a changein government economic and social priorities." Average of the months of April and October of the monthly indexbetween 1982 and 1995. Scale from 0 to 10, with lower scores indicating higher risks. Source: Political Risk Services(1996).
86
Anti-director rightsindex
An index aggregating shareholder rights. The index is formed by adding 1 when: (1) the country allows shareholdersto mail their proxy vote to the firm; (2) shareholders are not required to deposit their shares prior to the GeneralShareholders’ Meeting; (3) cumulative voting or proportional representation of minorities in the board of directors isallowed; (4) an oppressed minorities mechanism is in place; (5) the minimum percentage of share capital that entitlesa shareholder to call for an Extraordinary Shareholders’ Meeting is less than or equal to 10 percent (the samplemedian); or ,(6) shareholders have preemptive rights that can only be waved by a shareholders’ vote. The index rangesfrom 0 to 6. Source: La Porta et al. (1998).
49

Variable name Description and sourceNumber of
observations
36
Creditor rights index An index aggregating different creditor rights. The index is formed by adding 1 when: (1) the country imposesrestrictions, such as creditors’ consent or minimum dividends to file for reorganization; (2) secured creditors are ableto gain possession of their security once the reorganization petition has been approved (no automatic stay); (3) securedcreditors are ranked first in the distribution of the proceeds that result from the disposition of the assets of a bankruptfirm; and, (4) the debtor does not retain the administration of its property pending the resolution of the reorganization.The index ranges from 0 to 4. Source: La Porta et al. (1998).
47
State owned enterprises
SOEs in the economyindex
An index of the prevalence of State-owned enterprises as a share of the economy (scale from 0 to 10). Higher scoresgiven to countries with fewer government-owned enterprises, where government owned enterprises are estimated toproduce a low percentage of the country’s output. As the estimated size and breadth of the SOE sector increases,countries are assigned lower ratings. Computed both for 1975 and as the average of 1975 to 1995. Source: Gwartney,Lawson and Block, eds. (1996).
76
SOE output / GDP SOE value added of all non-financial SOEs as percentage of total GDP of the economy at market prices. SOE valueadded is estimated as the sales revenue minus the cost of intermediate inputs, or as the sum of operating surplus(balance) and wage payments. Average for the period 1978 to1981. Source: The World Bank (1995), Bureaucratsin Business.
49
SOE investment / grossdomestic investment
Investment (fixed capital formation) by all non-financial SOEs as a percentage of total gross domestic investment ofthe economy. Average for the period 1978 to 1991. Source:The World Bank (1995), Bureaucrats in Business.
55
Public sectoremployment / totalemployment
Average of the ratio of public sector employment in general government to total employment for the period 1976 to1996. General government employment includes employment in "all government department offices, organizationsand other bodies which are agencies or instruments of the central or local authorities whether accounted for or financedin, ordinary or extraordinary budgets or extra-budgetary funds. They are not solely engaged in administration but alsoin defense and public order, in the promotion of economic growth and in the provision of education, health, culturaland social services." Source: Schiavio-Campo, de Tommaso and Mukherjee (1997, p. 47).
39
Financial development
Private credit / GDP Value of credits by deposit money banks and other financial institutions to the private sector divided by GDP. Itexcludes credit issues by the central bank, credit to the public sector and cross-claims of one of the group ofintermediaries to another. The variable is constructed following the methodology of Beck, Levine and Loayza (2000)based on data from the International Financial Statistics. Private credit is calculated using lines 22d and 42d, GDP usesline 99b, and CPI comes from line 64 and the monthly statistics from the IFS database. For most countries, the datais available for the period 1960-1995. Source: International Monetary Fund (various) and Beck, Levine and Loayza(2000).
91
Liquid liabilities / GDP Liquid liabilities of the financial system (currency plus demand and interest-bearing liabilities of the banks and non-banks financial intermediaries) divided by GDP. The variable is constructed following the methodology of Beck,Levine and Loayza (2000) based on data from the International Financial Statistics. Liquid liabilities are calculatedusing line 55l (liquid liabilities) or line 35l (money plus quasi money), if liquid liabilities are not available. If noneof these two numbers are available, we use line 25 (time and saving deposits). Data for GDP uses line 99b, and datafor CPI comes from line 64 and the monthly statistics from the IFS database. For most countries, the data is availablefor the period 1960 to 1995. Source: International Monetary Fund (various) and Beck, Levine and Loayza (2000).
89
Commercial bank assets/ total bank assets
Commercial banks domestic assets divided by commercial banks domestic assets plus central bank domestic assets. The variable is constructed following the methodology of Beck, Levine and Loayza (2000). Based on data from theInternational Financial Statistics using lines 22a-d for the assets of deposit money banks, and lines 12a-d for the assetsof the central bank. For most countries, the data is available for the period 1960 to 1995. Source: InternationalMonetary Fund (various) and Beck, Levine and Loayza (2000).
91
Private claims-claims ofnon- top 20 firms / GDP
Total private claims in the country minus the claims of the top 20 firms in each country as a proportion of GNP in theperiod 1992 to1994. Source: WorldScope Global (1996) and International Monetary Fund (various).
32
Stock marketcapitalization / GDP
Total stock market capitalization divided by GDP. The initial year of the data available for most countries is 1976. If 1976 is not available, we use the earliest year before 1980. The countries that did not have a stock market by1980 are given a value of zero for the 1976 to 1980 period. The measure "change in stock marketcapitalization/GDP" is the total percentage point change of stock market capitalization to GDP ratio from 1976 to1995 Source: Beck, Demirgüç-Kunt, Levine (2001). Supplemented by the authors.
82
Loan availability An index of WCR’s assessment of the "relative easiness to obtain loans with out a business plan and no collateral." Scale from 1 to 7, where higher scores indicate stronger agreement with the statement. The score refers to the indexin 1999. Source: World Economic Forum (1999).
59
Bank overhead costs /total bank assets
The accounting value of a bank’s overhead costs as a share of its total assets. The data is obtained from individualbank’s balance sheets. The measure refers to 1995. Source: Beck, Demirguc-Kunt and Levine (2001).
79
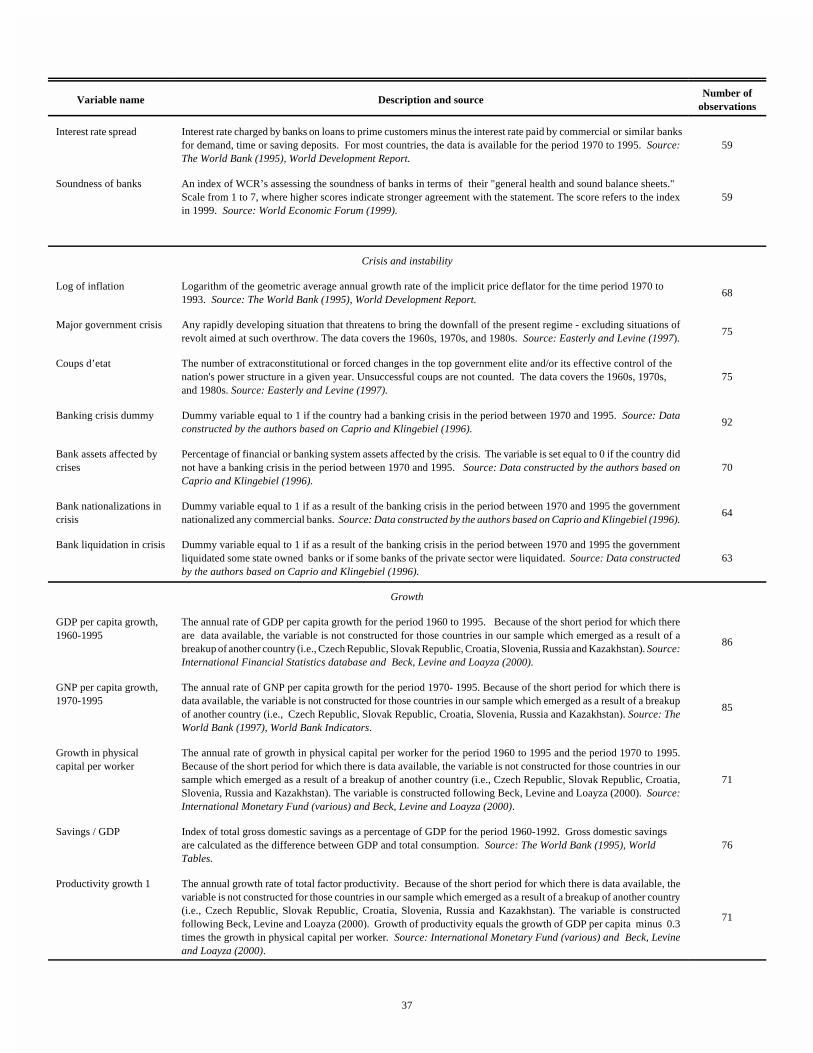
Variable name Description and sourceNumber of
observations
37
Interest rate spread Interest rate charged by banks on loans to prime customers minus the interest rate paid by commercial or similar banksfor demand, time or saving deposits. For most countries, the data is available for the period 1970 to 1995. Source:The World Bank (1995), World Development Report.
59
Soundness of banks An index of WCR’s assessing the soundness of banks in terms of their "general health and sound balance sheets." Scale from 1 to 7, where higher scores indicate stronger agreement with the statement. The score refers to the indexin 1999. Source: World Economic Forum (1999).
59
Crisis and instability
Log of inflation Logarithm of the geometric average annual growth rate of the implicit price deflator for the time period 1970 to1993. Source: The World Bank (1995), World Development Report.
68
Major government crisis Any rapidly developing situation that threatens to bring the downfall of the present regime - excluding situations ofrevolt aimed at such overthrow. The data covers the 1960s, 1970s, and 1980s. Source: Easterly and Levine (1997).
75
Coups d’etat The number of extraconstitutional or forced changes in the top government elite and/or its effective control of thenation's power structure in a given year. Unsuccessful coups are not counted. The data covers the 1960s, 1970s,and 1980s. Source: Easterly and Levine (1997).
75
Banking crisis dummy Dummy variable equal to 1 if the country had a banking crisis in the period between 1970 and 1995. Source: Dataconstructed by the authors based on Caprio and Klingebiel (1996).
92
Bank assets affected bycrises
Percentage of financial or banking system assets affected by the crisis. The variable is set equal to 0 if the country didnot have a banking crisis in the period between 1970 and 1995. Source: Data constructed by the authors based onCaprio and Klingebiel (1996).
70
Bank nationalizations incrisis
Dummy variable equal to 1 if as a result of the banking crisis in the period between 1970 and 1995 the governmentnationalized any commercial banks. Source: Data constructed by the authors based on Caprio and Klingebiel (1996).
64
Bank liquidation in crisis Dummy variable equal to 1 if as a result of the banking crisis in the period between 1970 and 1995 the governmentliquidated some state owned banks or if some banks of the private sector were liquidated. Source: Data constructedby the authors based on Caprio and Klingebiel (1996).
63
Growth
GDP per capita growth,1960-1995
The annual rate of GDP per capita growth for the period 1960 to 1995. Because of the short period for which thereare data available, the variable is not constructed for those countries in our sample which emerged as a result of abreakup of another country (i.e., Czech Republic, Slovak Republic, Croatia, Slovenia, Russia and Kazakhstan). Source:International Financial Statistics database and Beck, Levine and Loayza (2000).
86
GNP per capita growth,1970-1995
The annual rate of GNP per capita growth for the period 1970- 1995. Because of the short period for which there isdata available, the variable is not constructed for those countries in our sample which emerged as a result of a breakupof another country (i.e., Czech Republic, Slovak Republic, Croatia, Slovenia, Russia and Kazakhstan). Source: TheWorld Bank (1997), World Bank Indicators.
85
Growth in physicalcapital per worker
The annual rate of growth in physical capital per worker for the period 1960 to 1995 and the period 1970 to 1995.Because of the short period for which there is data available, the variable is not constructed for those countries in oursample which emerged as a result of a breakup of another country (i.e., Czech Republic, Slovak Republic, Croatia,Slovenia, Russia and Kazakhstan). The variable is constructed following Beck, Levine and Loayza (2000). Source:International Monetary Fund (various) and Beck, Levine and Loayza (2000).
71
Savings / GDP Index of total gross domestic savings as a percentage of GDP for the period 1960-1992. Gross domestic savingsare calculated as the difference between GDP and total consumption. Source: The World Bank (1995), WorldTables.
76
Productivity growth 1 The annual growth rate of total factor productivity. Because of the short period for which there is data available, thevariable is not constructed for those countries in our sample which emerged as a result of a breakup of another country(i.e., Czech Republic, Slovak Republic, Croatia, Slovenia, Russia and Kazakhstan). The variable is constructedfollowing Beck, Levine and Loayza (2000). Growth of productivity equals the growth of GDP per capita minus 0.3times the growth in physical capital per worker. Source: International Monetary Fund (various) and Beck, Levineand Loayza (2000).
71

Variable name Description and sourceNumber of
observations
38
Productivity growth 2 The annual growth rate of total factor productivity considering human capital accumulation as proposed by Mankiw(1995). Because of the short period for which there is data available, the variable is not constructed for those countriesin our sample which emerged as a result of a breakup of another country (i.e., Czech Republic, Slovak Republic,Croatia, Slovenia, Russia and Kazakhstan). The variable is constructed following the methodology suggested in Beck,Levine and Loayza ( 2000). Growth of productivity equals the growth of GDP per capita minus 0.3 times the growthin physical capital per worker minus 0.5 times the average growth rate in years of schooling. Source: InternationalMonetary Fund (various) and Beck, Levine and Loayza (2000).
63
Productivity growth 3 The annual growth rate of total factor productivity considering human capital accumulation as proposed by Hall andJones (1998). Because of the short period for which there is data available, the variable is not constructed for thosecountries in our sample which emerged as a result of a breakup of another country (i.e., Czech Republic, SlovakRepublic, Croatia, Slovenia, Russia and Kazakhstan). The variable is constructed following Beck, Levine and Loayza(2000). Growth of productivity equals the growth of GDP per capita minus 0.3 times the growth in physical capitalper worker, minus 0.7 times the product of the average number of years of schooling and the return to schoolingestimated in a Mincerian wage regression (Mincer (1974)) all divided by 0.7. Formally, productivity growth 3 = [GDPper capita growth - 0.3*Growth in physical capital per worker - 0.7*(Years of Schooling*the return to schooling)]/0.7.Source: International Monetary Fund (various) and Beck, Levine and Loayza (2000).
61
Average years ofschooling
Average of years of schooling for the total population aged 15 and over for the period 1960 to 1990 and 1970 to 1990.Source: Barro and Lee (1996).
89
Other variables
Legal origin Identifies the legal origin of the Company Law or Commercial Code of each country. There are five possibleorigins: (1) English Common Law; (2) French Commercial Code; (3) German Commercial Code; (4) ScandinavianCommercial Code; (5) Socialist/Communist Laws. Source: La Porta et al. (1998) and (1999).
92
High inflation dummy Equals 1 if the average rate of inflation during the period 1970 to1995 exceeds 20 percent and 0 otherwise. Source: World Bank Indicators 1997.
92
Latitude The absolute value of the latitude of the country, scaled to take values between 0 and 1. Source: CentralIntelligence Agency (various).
92

39
Table IThe Prevalence of Government Ownership of Banks
Panel A shows the data of government ownership of banks for all the 92 countries in the sample. The countries areclassified according to the legal origin of their commercial laws. Panel B shows the results of tests of means acrosslegal origins. Panel C shows the results of tests of medians across legal origins. Variable definitions are in the Appendix.
Panel A: Means by Legal Origin
Share of the assets of the top 10 banks owned or controlled by the government
Country GB95 GB70 GC20 GC50 GC90
Australia 12.33 20.89 20.99 20.99Bahrain 7.34 6.67 3.40 3.40 3.40Bangladesh 95.00 100.00 100.00 100.00 89.79Canada 0.00 10.95 0.00 0.00 0.00Cyprus 0.00 0.00 0.00 0.00 0.00Hong Kong 0.00 0.00 0.00 0.00 0.00India 84.94 100.00 100.00 94.61 59.61Ireland 4.48 3.78 4.50 4.50 4.50Israel 64.64 67.56 79.81 82.25 0.00Kenya 29.94 45.09 48.74 22.30 8.57Malaysia 9.93 20.00 9.93 9.93 9.94New Zealand 0.00 33.47 0.00 0.00 0.00Nigeria 9.91 57.53 13.05 7.82 7.82Pakistan 85.96 73.49 97.75 80.10 80.10Saudi Arabia 29.10 37.59 43.30 22.14 22.14Singapore 13.53 12.85 34.35 4.92 0.00South Africa 0.00 0.00 0.00 0.00 0.00Sri Lanka 71.39 100.00 76.29 68.64 68.64Tanzania 94.95 100.00 95.22 95.23 93.94Thailand 17.09 24.07 21.78 21.78 0.00Trinidad and Tobago 1.54 3.57 1.54 1.54 1.54 United Arab Emirates 41.93 45.86 37.08 59.11 9.81United Kingdom 0.00 0.00 0.00 0.00 0.00United States 0.00 0.00 0.00 0.00 0.00Zimbabwe 30.04 0.00 49.69 29.75 7.05English origin average 28.16 34.53 33.50 29.16 18.82English origin median 12.33 20.89 20.99 9.93 3.54
Afghanistan 100.00 100.00 100.00 100.00 100.00Algeria 99.96 100.00 99.96 99.96 99.96Argentina 60.50 71.94 60.50 60.50 60.50Belgium 27.59 39.87 22.29 22.29 16.64Bolivia 18.48 53.14 17.70 17.70 17.70Brazil 31.70 70.80 56.89 23.22 14.23Chile 19.72 91.49 19.72 19.73 19.73Colombia 53.92 57.67 52.47 52.47 52.47Costa Rica 90.92 100.00 90.92 90.92 90.92 Cote d’Ivoire 20.60 54.90 20.46 15.96 13.56Dominican Republic 38.93 70.08 38.93 38.93 38.93Ecuador 40.61 100.00 40.61 40.61 40.61El Salvador 26.43 100.00 39.03 39.03 13.90Egypt 88.62 53.08 96.02 86.32 80.87France 17.26 74.37 26.18 22.42 4.91Greece 77.82 92.69 85.47 84.09 68.65Guatemala 22.20 32.10 22.20 22.19 22.19Honduras 29.90 49.20 29.90 29.90 29.90Indonesia 42.90 74.89 42.90 42.90 42.90Iran 100.00 89.36 100.00 100.00 100.00Iraq 93.77 100.00 93.77 93.77 93.77Italy 35.95 75.69 27.81 27.81 16.61Jordan 26.03 28.08 28.96 28.96 21.61Kuwait 32.84 35.99 46.19 31.67 18.43Lebanon 7.18 15.31 7.40 7.40 7.40Lybia 95.12 100.00 100.00 100.00 73.11Mexico 35.62 82.66 35.62 35.62 35.62Morocco 37.90 59.11 50.89 42.23 24.03Netherlands 9.20 7.80 10.30 10.30 6.67Nicaragua 63.36 90.44 63.36 63.36 63.36Oman 25.84 4.50 27.27 27.27 24.16Panama 17.08 17.93 17.08 17.08 17.08Paraguay 48.02 55.00 48.02 48.02 48.02Peru 26.46 87.38 23.87 23.87 23.87
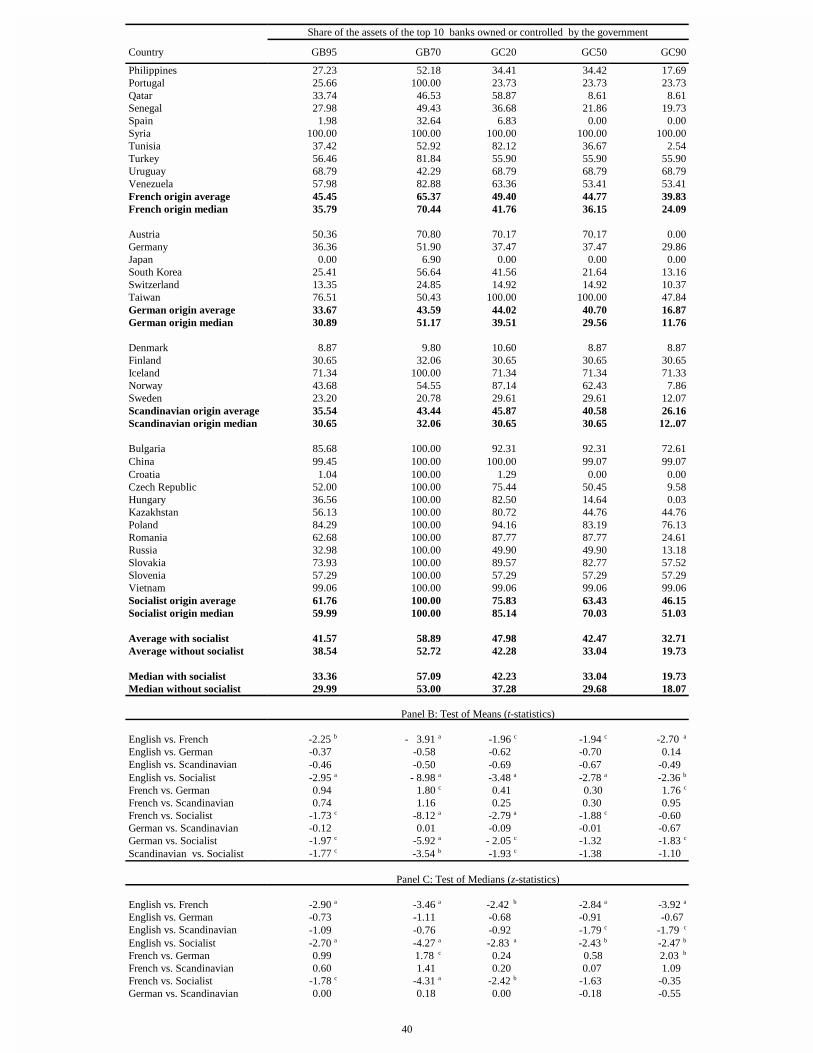
Share of the assets of the top 10 banks owned or controlled by the government
Country GB95 GB70 GC20 GC50 GC90
40
Philippines 27.23 52.18 34.41 34.42 17.69Portugal 25.66 100.00 23.73 23.73 23.73Qatar 33.74 46.53 58.87 8.61 8.61Senegal 27.98 49.43 36.68 21.86 19.73Spain 1.98 32.64 6.83 0.00 0.00Syria 100.00 100.00 100.00 100.00 100.00Tunisia 37.42 52.92 82.12 36.67 2.54Turkey 56.46 81.84 55.90 55.90 55.90Uruguay 68.79 42.29 68.79 68.79 68.79Venezuela 57.98 82.88 63.36 53.41 53.41French origin average 45.45 65.37 49.40 44.77 39.83French origin median 35.79 70.44 41.76 36.15 24.09
Austria 50.36 70.80 70.17 70.17 0.00Germany 36.36 51.90 37.47 37.47 29.86Japan 0.00 6.90 0.00 0.00 0.00South Korea 25.41 56.64 41.56 21.64 13.16Switzerland 13.35 24.85 14.92 14.92 10.37Taiwan 76.51 50.43 100.00 100.00 47.84German origin average 33.67 43.59 44.02 40.70 16.87German origin median 30.89 51.17 39.51 29.56 11.76
Denmark 8.87 9.80 10.60 8.87 8.87Finland 30.65 32.06 30.65 30.65 30.65Iceland 71.34 100.00 71.34 71.34 71.33Norway 43.68 54.55 87.14 62.43 7.86Sweden 23.20 20.78 29.61 29.61 12.07Scandinavian origin average 35.54 43.44 45.87 40.58 26.16Scandinavian origin median 30.65 32.06 30.65 30.65 12..07
Bulgaria 85.68 100.00 92.31 92.31 72.61China 99.45 100.00 100.00 99.07 99.07Croatia 1.04 100.00 1.29 0.00 0.00Czech Republic 52.00 100.00 75.44 50.45 9.58Hungary 36.56 100.00 82.50 14.64 0.03Kazakhstan 56.13 100.00 80.72 44.76 44.76Poland 84.29 100.00 94.16 83.19 76.13Romania 62.68 100.00 87.77 87.77 24.61Russia 32.98 100.00 49.90 49.90 13.18Slovakia 73.93 100.00 89.57 82.77 57.52Slovenia 57.29 100.00 57.29 57.29 57.29Vietnam 99.06 100.00 99.06 99.06 99.06Socialist origin average 61.76 100.00 75.83 63.43 46.15Socialist origin median 59.99 100.00 85.14 70.03 51.03
Average with socialist 41.57 58.89 47.98 42.47 32.71Average without socialist 38.54 52.72 42.28 33.04 19.73
Median with socialist 33.36 57.09 42.23 33.04 19.73Median without socialist 29.99 53.00 37.28 29.68 18.07
Panel B: Test of Means (t-statistics)
English vs. French -2.25 b - 3.91 a -1.96 c -1.94 c -2.70 a
English vs. German -0.37 -0.58 -0.62 -0.70 0.14 English vs. Scandinavian -0.46 -0.50 -0.69 -0.67 -0.49 English vs. Socialist -2.95 a - 8.98 a -3.48 a -2.78 a -2.36 b
French vs. German 0.94 1.80 c 0.41 0.30 1.76 c
French vs. Scandinavian 0.74 1.16 0.25 0.30 0.95 French vs. Socialist -1.73 c -8.12 a -2.79 a -1.88 c -0.60 German vs. Scandinavian -0.12 0.01 -0.09 -0.01 -0.67 German vs. Socialist -1.97 c -5.92 a - 2.05 c -1.32 -1.83 c
Scandinavian vs. Socialist -1.77 c -3.54 b -1.93 c -1.38 -1.10
Panel C: Test of Medians (z-statistics)
English vs. French -2.90 a -3.46 a -2.42 b -2.84 a -3.92 a
English vs. German -0.73 -1.11 -0.68 -0.91 -0.67 English vs. Scandinavian -1.09 -0.76 -0.92 -1.79 c -1.79 c
English vs. Socialist -2.70 a -4.27 a -2.83 a -2.43 b -2.47 b
French vs. German 0.99 1.78 c 0.24 0.58 2.03 b
French vs. Scandinavian 0.60 1.41 0.20 0.07 1.09 French vs. Socialist -1.78 c -4.31 a -2.42 b -1.63 -0.35 German vs. Scandinavian 0.00 0.18 0.00 -0.18 -0.55

Share of the assets of the top 10 banks owned or controlled by the government
Country GB95 GB70 GC20 GC50 GC90
41
German vs. Socialist -1.97 c -4.01 a - 1.73 c -1.08 -1.69 c
Scandinavian vs. Socialist - 1.79 c -3.40 a -2.11 c 1.37 1.05
a=Significant at 1 percent level; b= Significant at 5 percent level ; c=Significant at 10 percent level

42
Table IIDevelopment Banks and the Prevalence of Government Ownership of Banks
Panel A shows the average of government ownership of banks by legal origin. Panel B shows the results of tests of means across legal origins. Variable definitions are in the Appendix.
Panel A: Means by Legal Origin
Share of assets of the top banks owned or controlled by the government
Country
GBDEV95Development banks
owned by the government in 1995
GB95 GBCOM95Commercial banks
owned by the governmentin 1995
GB70 GBCOM70Commercial banks owned
by the government in 1970
English origin average 4.36 28.16 26.68 34.53 32.03French origin average 7.45 45.45 39.91 65.37 59.10German origin average 2.19 33.67 31.78 43.59 43.37Scandinavian origin average 1.11 35.55 35.04 43.44 43.44Socialist origin average 2.87 61.76 60.98 100.00 100.00
Average with socialist 5.33 41.57 38.27 58.89 55.20Average without socialist
5.70 38.54 34.86 52.73 48.48
Panel B: Test of Means (t-statistics)
English vs. French -1.36 -2.25 b -1.60 -3.19 a -3.22 a
English vs. German -0.73 -0.37 -0.34 -0.58 -0.73English vs. Scandinavian 1.06 -0.46 -0.53 -0.50 -0.64 English vs. Socialist -0.65 -3.01 a -2.98 -8.98 a -7.38 a
French vs. German 1.25 0.94 0.58 1.80 c 1.16French vs. Scandinavian 1.39 0.74 0.32 1.60 1.03French vs. Socialist 1.50 -1.73 c -2.02 b -8.13 a -8.49 a
German vs. Scandinavian -0.44 -0.12 -0.20 0.01 -0.01German vs. Socialist -0.23 -1.97 c 1.99 c -8.65 a 8.43 a
Scandinavian vs. Socialist 0.63 1.77 c 1.73 c -3.54 b 3.54 a
a=Significant at 1 percent level; b= Significant at 5 percent level ; c=Significant at 10 percent level

43
Table IIIWhich Countries Have More Government Ownership of Commercial Banks?
The first column of numbers shows the correlation between each variable and the extent of government ownership of commercial banks in 1995 (GB95). The second column shows coefficients and their significance resulting from ordinary least squares regressions on the cross-section of countries. The regression we run is GB95 = � + �x + QGDP per capita in1960, where "x" represents the independent variable. The independent variables are classified into seven different panels: (a) initial level of development; (b) government intervention; (c)government efficiency; (d) property rights; (e) state owned enterprises; (f) initial level of financial development; and, (g) crisis and instability. Robust standard errors are shown in parentheses. Variable definitions are in the Appendix.
Dependent variable: GB95
Independent variables Raw correlationsRegressioncoefficients
Number ofobservations
Panel A: Initial Level of Development
Log of GDP per capita in 1960 -0.3560 a -0.1133 a
(0.0302)91
Panel B: Government Intervention
Business regulation index -0.4511 a -0.1301 a
(0.0375)87
Frequency of price controls index -0.5088 a -0.0572 a
(0.0162)74
Government intervention in thebanking sector
-0.5151 a -0.1557 a
(0.0274)87
Black market premium 1980s 0.5236 a 0.2927 a
(0.0837)75
Government consumption/GDP 0.1019-0.2497(1.2331)
87
Transfers and subsidies/GDP -0.05631.1326 b
(0.5274)70
Political rights index -0.3398 c -0.0335 c
(0.0171)90
Democracy score -0.3569 b -0.0182 b
(0.0087)90
Panel C: Government Efficiency
Tax compliance -0.5048 a -0.1212 a
(0.0352)47
Bureaucratic quality index -0.4495 a -0.0450 a
(0.0139)85
Corruption index -0.3004 b -0.0182 (0.0176)
85
Panel D: Property Rights
Property rights index -0.5343 a -0.1416 a
(0.0300)89
Rule of law index -0.3202 b -0.0352(0.0261)
85
Government repudiation of contractsindex
-0.4386 a -0.0587 a
(0.0180)85
Anti-director rights index -0.2663-0.0499 c
(0.0257)49
Creditors rights index -0.1141-0.0086 (0.0257)
47
Panel E: State Owned Enterprises
SOEs in the economy index -0.4632 a -0.0559 a
(0.0122)76

Dependent variable: GB95
Independent variables Raw correlationsRegressioncoefficients
Number ofobservations
44
SOE output/GDP 0.35110.8289 a
(0.2740)49
SOE investment/gross domesticinvestment
0.5489 a 1.1696 a
(0.2220)55
Public sector employment / totalemployment
0.2548 1.0363 c
(0.6080)40
Panel F: Initial Level of Financial Development
Private credit/GDP in 1960 -0.2299-0.1634(0.1535)
88
Liquid liabilities/ GDP in 1960 -0.2325-0.1651 c
(0.1177)87
Commercial bank assets/total bankassets in 1960
-0.2699-0.2172 (0.1727)
89
Stock market capitalization / GDP in1976
-0.3298 -0.3091 b
(0.1485)82
Panel G: Crisis and Instability
Log of inflation 0.22460.4656 c
(0.2720)68
Major government crises -0.1198-0.0531(0.0496)
75
Number of coups d’etat 0.0665-0.0061(0.2881)
75
Banking crisis dummy 0.0584-0.0441(0.0629)
91
Bank assets affected by crises 0.20310.2216
(0.1400)69
Bank nationalizations in crisis dummy -0.0437-0.0602(0.0976)
63
Bank liquidations during crisis dummy -0.0801-0.1299(0.0988)
62
a=Significant at 1 percent level; b=Significant at 5 percent level; c=Significant at 10 percent level.

45
Table IVGovernment Ownership of Banks and Financial Development
Ordinary least squares regressions for the cross-section of countries. The definitions of all variables can be found in the Appendix. Thedependent variables are measured for 1999 or the most recent period for which information is available. Robust standard errors are shown in parentheses.
Independent Variables
Dependent variables: GB70 Log GDPper capitain 1960
Initialprivate
credit /GDP
Initial liquidliabilities
/GDP
+PKVKCN
EQOOGTEKCN
DCPM CUUGVU �
VQVCN DCPM
CUUGVU
Initial stock marketcapitalization /
GDP
Intercept Adjusted R2
[N]
Panel A: Financial Development
)TQYVJ QH RTKXCVG ETGFKV
� )&2
-0.0394 a
(0.0107)-0.0006(0.0043)
-0.0558 a
(0.0187)-0.0668 b
(0.0262)0.2111
[82]
)TQYVJ QH NKSWKF
NKCDKNKVKGU � )&2
-0.0138 c
(0.0079)-0.0015(0.0028)
-0.0470 a
(0.0147)-0.0520 a
(0.0186)0.2475
[82]
)TQYVJ QH EQOOGTEKCN
DCPM CUUGVU �VQVCN DCPM
-0.0050(0.0048)
0.0041 c
(0.0022)-0.0741a
(0.0178)0.0406 b
(0.0195)0.4456
[82]
Growth of stock marketcapitalization / GDP
0.0071(0.0341)
-0.0338 b
(0.0148)-0.0760 a
(0.0254)0.3117 a
(0.1012)0.2880
[47]
Change in stock marketcapitalization / GDP
-0.5306 a
(0.1620)-0.0305(0.0411)
-0.1000(0.3382)
0.7678 b
(0.3249)0.1910
[67]
Panel B: Access to Credit
Private claims-claims ofnon-top 20 firms / GDP
-0.3153 c
(0.1749)-0.0231(0.0595)
0.6118 c
(0.3121)0.6542 c
(0.3687)0.3551
[32]
Loan availability-0.5787 b
(0.2629)0.5152 a
(0.0914)0.2772
(0.2714)0.4156
(0.6019)0.4810
[54]
Panel C: Efficiency of the Banking System
Bank overheadcosts/total bank assets
0.0232 a
(0.0067)-0.0012(0.0026)
-0.0134(0.0107)
0.0374(0.0166)
0.1856[79]
Interest rate spread22.2802 a
(7.2241)4.1503
(4.1113)-27.6439 c
(14.4694)-8.6116
(22.0295)0.1539
[58]
Panel D: Instability
Soundness of banks-1.2416 b
(0.5205)0.7522 a
(0.1564)0.3818
(0.4794)0.5838
(1.1210)0.4387
[54]
Log of inflation0.1198 a
(0.0363)0.0095
(0.0146)-0.0719(0.0477)
0.0260(0.0880)
0.1537[68]
Panel E: Capital Market
Stock marketcapitalization in 1995
-0.7411 a
(0.2058)0.0089
(0.0422)0.7464 b
(0.3660)0.2570
[70]
Stock marketcapitalization in 1995
-0.5409 a
(0.1762)-0.0343 (0.0438)
0.9011 a
(0.3404)0.7938 b
(0.3460)0.5036
[62]
a=Significant at 1 percent level; b=Significant at 5 percent level; c=Significant at 10 percent level.

46
Table VSimple Growth Regressions
Ordinary least squares (OLS) regressions of the cross-section of countries. The dependent variable is the average annual growth rate of GDPper capita for 1960 to 1995. The independent variables are described in the Appendix. Robust standard errors are shown in parentheses.
Independent Variables
Dependent variables
)$�� +PKVKCN NQI QH
)&2 RGT
capita
Initial privatecredit/GDP
Initial liquid-liabilities/GDP
Initial commercialbank assets/total
bank assets
Initial stock marketcapitalization / GDP
Averageyears of
schooling
Intercept Adj. R2
[N]
GDP per capita growth 1960-95
-0.0235 a
(0.0077)-0.0065 b
(0.0032)0.0681 a
(0.0205)0.1240
[85]
GDP per capita growth 1960-95
-0.0199 a
(0.0071)-0.0160 a
(0.0033)0.0061 a
(0.0013)0.0911 a
(0.0171)0.3403
[85]
GDP per capita growth 1960-95
-0.0171 b
(0.0072)-0.0175 a
(0.0030)0.0302 a
(0.0103)0.0055 a
(0.0012)0.0942 a
(0.0163)0.4168[82]
GDP per capita growth 1960-95
-0.0152 c
(0.0079)-0.0166 a
(0.0032)0.0198 b
(0.0086)0.0057 a
(0.0013)0.0881 a
(0.0176)0.3835
[82]
GDP per capita growth 1960-95
-0.0180 b
(0.0084)-0.0160 a
(0.0037)0.0026
(0.0136)0.0062 a
(0.0014)0.0876 a
(0.0190)0.3216
[83]
GDP per capita growth 1960-95
-0.0160 c
(0.0082)-0.0134 a
(0.0034)0.0146 b
(0.0014)0.0050 a
(0.0014)0.0784 a
(0.0187)0.3028
[75]
GDP per capita growth 1960-95
-0.0140 c
(0.0083)-0.0151 a
(0.0032)0.0263 b
(0.0105)0.0107
(0.0084)0.0047 a
(0.0013)0.0826 a
(0.0180)0.3671
[73]
a=Significant at 1 percent level; b=Significant at 5 percent level; c=Significant at 10 percent level.
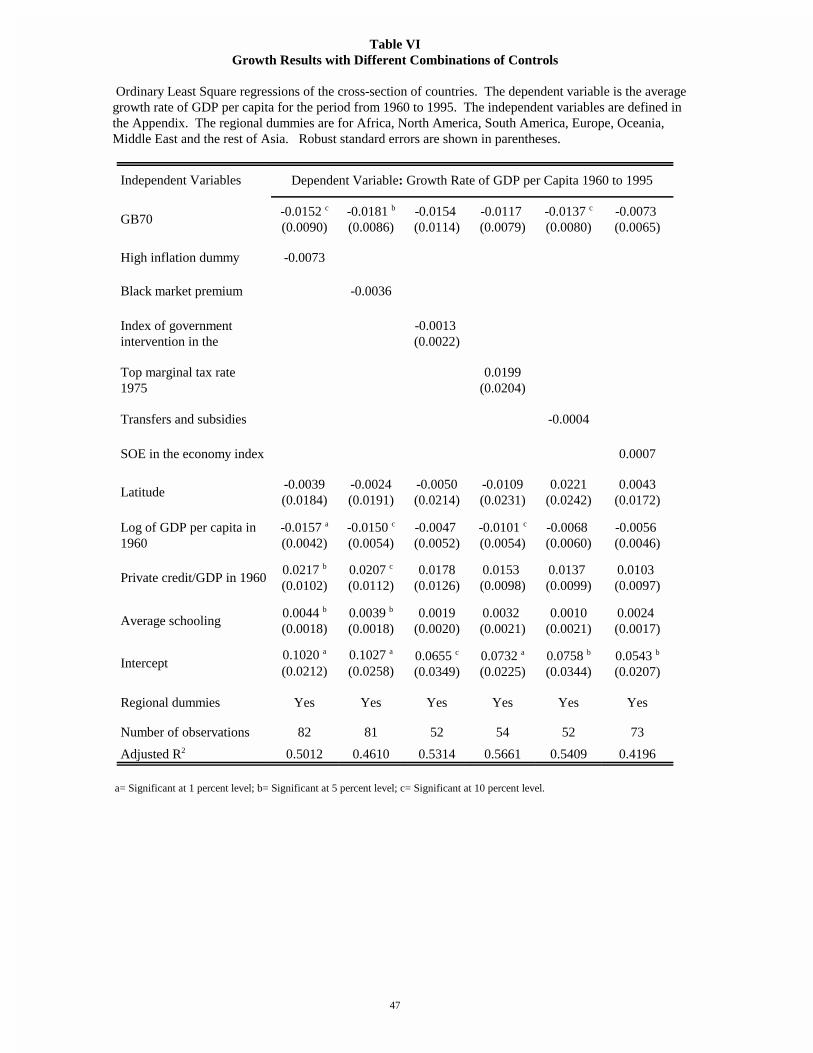
47
Table VIGrowth Results with Different Combinations of Controls
Ordinary Least Square regressions of the cross-section of countries. The dependent variable is the average growth rate of GDP per capita for the period from 1960 to 1995. The independent variables are defined in the Appendix. The regional dummies are for Africa, North America, South America, Europe, Oceania, Middle East and the rest of Asia. Robust standard errors are shown in parentheses.
Independent Variables Dependent Variable: Growth Rate of GDP per Capita 1960 to 1995
GB70-0.0152 c
(0.0090)-0.0181 b
(0.0086)-0.0154 (0.0114)
-0.0117 (0.0079)
-0.0137 c
(0.0080)-0.0073 (0.0065)
High inflation dummy -0.0073
Black market premium -0.0036
Index of governmentintervention in the
-0.0013 (0.0022)
Top marginal tax rate 1975
0.0199(0.0204)
Transfers and subsidies -0.0004
SOE in the economy index 0.0007
Latitude-0.0039(0.0184)
-0.0024(0.0191)
-0.0050(0.0214)
-0.0109(0.0231)
0.0221(0.0242)
0.0043(0.0172)
Log of GDP per capita in1960
-0.0157 a
(0.0042)-0.0150 c
(0.0054)-0.0047 (0.0052)
-0.0101 c
(0.0054)-0.0068 (0.0060)
-0.0056 (0.0046)
Private credit/GDP in 19600.0217 b
(0.0102)0.0207 c
(0.0112)0.0178
(0.0126)0.0153 (0.0098)
0.0137 (0.0099)
0.0103 (0.0097)
Average schooling0.0044 b
(0.0018)0.0039 b
(0.0018)0.0019
(0.0020)0.0032 (0.0021)
0.0010(0.0021)
0.0024 (0.0017)
Intercept0.1020 a
(0.0212)0.1027 a
(0.0258)0.0655 c
(0.0349)0.0732 a
(0.0225)0.0758 b
(0.0344)0.0543 b
(0.0207)
Regional dummies Yes Yes Yes Yes Yes Yes
Number of observations 82 81 52 54 52 73
Adjusted R2 0.5012 0.4610 0.5314 0.5661 0.5409 0.4196
a= Significant at 1 percent level; b= Significant at 5 percent level; c= Significant at 10 percent level.

48
Table VIICapital Accumulation, Productivity Growth and Government Ownership of Banks
Ordinary least square (OLS) regressions for the cross-section of countries. The dependent variables are: (1) the annual growth rate of physical capital per worker for the period 1960 to 1992; (2) the average of the savings to GDP ratio for the period 1960 to 1993; (3) the annual productivity per capita growth rate for the period 1960 to1995 (Productivity growth 1); (4) the annual productivity per capita growth rate considering human capital accumulation, following Mankiw (1995) for the period 1960 to 1995 (Productivity growth 2); and (5) the annual productivity per capita growth rate considering human capital accumulation, following Hall and Jones (1999), for the period 1960 to 1995 (Productivity growth 3). The independent variables are defined in the Appendix. Robust standard errors are shown in parentheses.
Independent Variables
Dependent VariablesGB70 Log of GDP
per capita in1960
Privatecredit / GDP
in 1960
Average years ofschooling
Intercept Adj. R2
[N]
Panel A: Capital Accumulation and Savings Rate
Growth in physicalcapital per worker
-0.0039(0.0096)
-0.0036(0.0035)
0.0542 b
(0.0250)0.0156
[77]
Savings / GDP0.0202
(0.0265)0.0363 a
(0.0128)0.0201
(0.0810)0.1757
[76]Growth in physicalcapital per worker
0.0029(0.0092)
-0.0137 a
(0.0044)0.0284 b
(0.0115)0.0044 b
(0.0017)0.0806 a
(0.0237)0.1615
[77]
Savings / GDP0.0140
(0.0261)0.0448 c
(0.0233)0.0461
(0.0574)-0.0082(0.0066)
0.0026(0.1066)
0.2061[75]
Panel B: Productivity Growth
Productivity growth 1-0.0134 b
(0.0054)-0.0024(0.0022)
0.0317 b
(0.0146)0.0857
[77]
Productivity growth 2-0.0162 b
(0.0066)-0.0007(0.0033)
0.0132(0.0211)
0.0870[77]
Productivity growth 3-0.0178 b
(0.0079)-0.0025(0.0023)
0.0343 b
(0.0166)0.0890
[61]
Productivity growth 1-0.0084 c
(0.0044)-0.0099 a
(0.0021)0.0199 a
(0.0069)0.0033 a
(0.0008)0.0514 a
(0.0108)0.3339 [77]
Productivity growth 2-0.0093 c
(0.0048)-0.0123 a
(0.0030)0.0186 b
(0.0074)0.0057 a
(0.0010)0.0439 a
(0.0142)0.4526
[77]
Productivity growth 3-0.0104 (0.0066)
-0.0129 a
(0.0032)0.0247 a
(0.0091)0.0039 b
(0.0015)0.0639 a
(0.0150)0.2743
[61]
a=Significant at 1 percent level; b=Significant at 5 percent level; c=Significant at 10 percent level.

49
Table VIIIGrowth by Groups of Countries
Ordinary least square regressions (OLS) of different groups of countries classified according to country characteristics. The dependent variable in all regressions shown is the average annual growth of GDP per capita for the period 1960-1995. The independent variables are described in Appendix A. The table has three panels corresponding to different classifications of the countries in the sample. Panel A divides the sample in those countries with initial GDP per capita in 1960 below the median and those above the median. Panel B divides the sample in those countries with initial level of financial development below and those above the median as measured by private credit as a proportion of GDP in 1960. Panel C divides the sample in those countries with property rights in the 1990s below the median and those above the median value for the sample.
Dependent Variable:Growth Rate of GDP per Capita1960-95
Independent Variables:
GB70 Log GDP percapita 1960
Initialprivate
credit/GDP
Averageyears of
schooling
Intercept Adj. R2
[N]
Panel A: Countries Ranked by Initial Level of Economic Development
Countries with Log GDP percapita in 1960 < median
-0.0207(0.0133)
-0.0232 a
(0.0080)0.0329 c
(0.0171)0.0070 b
(0.0026)0.1173 b
(0.0436)0.4297
[42]
Countries with Log GDP percapita in 1960 > median
-0.0140 c
(0.0079)-0.0206 a
(0.0045)0.0289 b
(0.0140)0.0030 b
(0.0012)0.1328 a
(0.0279)0.5368
[40]
Panel B: Countries Ranked by Initial Level of Financial Development
Countries with privatecredit/GDP per capita in 1960 <
-0.0342 a
(0.0097)-0.0204 a
(0.0033)-0.0219(0.0684)
0.0077 a
(0.0016)0.1131 a
(0.0184)0.5843
[41]
Countries with privatecredit/GDP per capita in 1960 >
-0.0089(0.0106)
-0.0132 b
(0.0053)0.0239 b
(0.0103)0.0029 (0.0019)
0.0839 b
(0.0319)0.2524
[41]
Panel C: Countries Ranked by Property Rights Index of the 1990s
Countries with property rightsindex < median
-0.0256 b
(0.0104)-0.0225 a
(0.0067)0.0656 a
(0.0154)0.0069 b
(0.0030)0.1123 a
(0.0339)0.4257
[36]
Countries with property rightsindex > median
-0.0080(0.0086)
-0.0189 a
(0.0036)0.0221 b
(0.0084)0.0039 a
(0.0014)0.1146 a
(0.0225)0.5174
[44]
a=Significant at 1 percent level; b=Significant at 5 percent level; c=Significant at 10 percent level.