
SYLLABUS EDTECH 597 – Introduction to Openness … EDTECH 597 – Introduction to Openness

DEPARTMENT OF ECONOMICS
GOVERNMENT, OPENNESS AND FINANCE: PAST AND PRESENT
Panicos Demetriades, University of Leicester, UK Peter L. Rousseau, Vanderbilt University and NBER
Working Paper No. 11/03 October 2010

GOVERNMENT, OPENNESS AND FINANCE: PAST AND PRESENT1
By
Panicos O. Demetriades University of Leicester
and
Peter L. Rousseau
Vanderbilt University and NBER
Abstract
We explore the role of government in the nexus of finance and trade starting from the earliest days of organised finance in England and then broadening the analysis to 84 countries from 1960 to 2004. For 18th century England, we find that the government expenditures and international trade did have a positive long-run effect on financial development when measured as the value of private loans made by the Bank of England. For the wider panel of countries and more recent data, we find that government expenditures and trade have positive effects on financial development for countries that are in the mid-ranges of economic development as measured by their per capita incomes, but have little effect for poor countries and strongly negative effects for the wealthiest ones.
October 2010
1 We are grateful to the ESRC and SSRC for financial support in the form of a Visiting Fellowship for Peter L. Rousseau at the University of Leicester and Birkbeck College of the University of London in the Summer of 2009.

1
1. Introduction
Economic historians have long recognised that governments are central to the
development of organised finance and the smooth operation of trading arrangements (e.g.,
North and Weingast, 1989). Indeed, the experiences of the 17th-century Dutch Republic,
18th-century England, and the 19th-century United States offer powerful narratives to
support this view.2
Much of the research on financial development in recent years, however, has shifted
from measuring the growth effects of finance to learning more about what determines
financial development itself. It is in this area that the link between finance and trade has
received some attention.
Yet the role of governments in fostering growth through improved
institutions has received less attention in modern macroeconomic and development studies
that use more recent data. This is not to say, however, that economists have ignored the role
of institutions in promoting growth over the post-World War II period. On the contrary, a
battery of empirical studies published over the past two decades point to a first-order
importance of financial development in promoting long-run economic growth, and have
elevated the proposition to something of a stylised fact (see Levine 1997; 2005). At the same
time, a largely independent literature indicates a positive role for trade openness and export
orientation in long-run growth, especially when tested over the latter half of the twentieth
century with data for a broad set of countries (e.g., Dollar, 1992; Ben-David, 1993; Sachs
and Warner, 1995; Edwards, 1998).
3
2 See, for example, de Vries (1976) and de Vries and van der Woude (1997) on the Dutch Republic, Dickson (1967) and Brewer (1989) on England, Neal (1990) on integration of the London and Amsterdam markets, and Sylla (1999) on the United States. More recent comparative studies of these countries and others include Rousseau (2003), Rousseau and Sylla (2003) and Andrianova et al. (2008).
Here we extend this line of inquiry by bringing governments into
3 See, for example, Svaleryd and Vlachos (2002) and Baltagi et al. (2009).

2
the nexus of finance and trade, starting with 18th century England and then broadening the
analysis to 84 countries using data from 1960 to the present.
Our starting point is historical. In the early stages of economic and financial
development, countries may find themselves caught in an under-development trap. The
absence of financial markets, both domestic and international, combined with an under-
developed tax base and inefficiencies in tax administration can lead to governments that are
cash constrained. Without sufficient funds, governments are unable to undertake much
needed public investments in hard and soft infrastructure, education and health. Inadequate
transportation networks, rudimentary law and order systems, and ill and/or illiterate
populations can create insurmountable obstacles for industrial take-off. 4
Trade offers a way to break out of the under-development trap. However, history has
shown that this requires a high degree of co-ordination between private and public sectors.
Trade can be highly profitable if it is secure yet the profits can easily be competed away. As
Andrianova et al. (2008) and others have argued, the emergence of London as a financial
market in the latter part of the 17th century owes a lot to the monopoly rights granted by
government to all the leading joint stock companies. These rights guaranteed high returns to
investors and helped to mobilise saving (the share issues of the East India Company, for
In such
circumstances, opportunities for profitable private investment are rare. Where present, they
can be very risky. And without insurance markets, the risks are likely to be unacceptably
high for entrepreneurs. As a result the demand for private finance may be negligible or non-
existent. In such a bad equilibrium, financial and economic under-development are two sides
of the same coin.
4 The critical role of infrastructure in promoting industrial take-off is documented by Easterly and Rebelo (1993). There is also a large literature on the positive effects of infrastructure on private investment, trade and economic growth. See for example, Bougheas et al. (1999) or Bougheas et al. (2000).

3
example, were typically over-subscribed). The rise of the great trading companies in turn
promoted development of a modern commercial sector. The monopoly rights were granted at
a price: the joint stock companies made very significant long-term loans to the government.
These loans were so large that they transformed the state of the public finances. As Rousseau
(2003) shows, the rise in real incomes that followed the expansion of trade set in motion a
virtuous finance-trade-growth cycle which helped to propel England from a weak state in the
early part of the 17th century to Europe’s foremost military power by the beginning of the
18th century and the world’s clear financial leader by its end.5
Given the central role of governments in promoting financial and commercial
development in history, might we expect to see similar patterns today in developing
countries? We think that the answer is yes, although the picture can be more complex
because developing countries today have greater (yet still varying degrees of) access to world
capital markets and foreign aid. For the poorest developing countries, foreign aid is an
important mechanism for financing trade-promoting infrastructure and public investment in
health and education. As a result, the link between government spending and domestic
financial development may be weaker than it is likely to have been, for example, in 18th
century England, where governments tapped much if not all of their finance domestically.
For the same reason, we would expect a stronger link between government and domestic
financial development in middle income countries.
First, however, it is appropriate to consider 18th century England, often touted as the
classic case of the centrality of the State in modern economic emergence.
5 Similar events were realised a century earlier in Amsterdam. The Dutch East India Company, which had very close links to the Dutch state, was formed in 1602 by royal charter following demands by its predecessors who saw their profits eroded by competition. The emergence of the stock market in Amsterdam is firmly linked to the establishment of the Company (see Neal, 1990).

4
2. 18th century England
2.1. Background
Modern studies of the role of the state in 18th century British growth tend to focus on
the extent to which wartime expenditures led to a crowding out of private sector investments,
thereby slowing overall economic growth (e.g., Williamson, 1984; Crafts, 1987; Mokyr,
1987). But if disbursements by the exchequer are a weak proxy for the output of the
government, as Jackson (1990) has argued, the multiplier of actual government expenditure
may have been larger, in which case crowding out would have been less severe.
Fig. 1 shows total government expenditure from 1720 along with total trade (i.e., the
sum of imports, exports, and re-exports), all in per capita 1740 sterling. 6 The four large
spikes in the expenditure series corresponding with the War of Austrian Succession (1740-
48), the Seven Years War (1754-63), the American Revolutionary War (1775-83), and the
Wars of the First and Second Coalitions (1793-1802).7
6 Government expenditures are the sum of civil and military spending from Mitchell (1988, Table 11.2, pp. 578-80). The trade data are from Mitchell (1988, Table 10.1.A, pp. 448-9 for England and Wales for 1720-91, and Table 10.1.B, p. 450 for Great Britain 1792-99). To form a single series for trade openness we join the broader aggregate for Great Britain to the narrower series for England and Wales. We deflate all of our data to reflect 1740 prices using the Schumpeter-Gilboy price index for consumer goods (Mitchell, 1988, Table 14.1.B, pp. 719-20) and convert them into per capita terms using population data for England (excluding Monmouthshire) from Mitchell (1988, Table 1.1.A, pp. 7-8).
It would seem that large lumpy
expenditures such as these could not have been conducive to an industrial take-off. Yet total
trade, a rough proxy for activity in the commercial (i.e., modern) sector of the economy, with
the exception of the American Revolutionary period, does not fluctuate sharply and
negatively with government expenditure. Rather, the two series have a positive correlation
7 Our sample period was immediately preceded by the War of Spanish Succession (1700-14) and then by the Nine Years War (1688-97), the latter commencing with the Glorious Revolution of 1688.

5
1720 1730 1740 1750 1760 1770 1780 1790 18002
2.5
3
3.5
4
4.5
0.5
1
1.5
2
2.5
3gov’t expenditure
total trade (right scale)
(left scale)
Fig. 1. Real per capita British government expenditures (including military) and total trade (imports, exports, and re-exports), 1720-1799.
coefficient of 0.49, with international trade rising by 88 percent between 1720 and 1799
despite the American War.
At the same time that trade was rising dramatically, England was in the midst of a
commercial and industrial revolution. And when the time series for trade in Fig. 1 is
considered in light of earlier data for the East India Company that indicate a more than six-
fold increase in Asian exports between 1660 and 1710, the rapid commercialisation of the
British economy comes into clear focus. It is interesting to note that Hoffman’s index of
industrial production (Mitchell, 1988, Table 8.21.A, pp. 431-432, including building),
progresses less rapidly than the trade series at first, but accelerates after 1780, and thus seems
to share the rhythm of the later part of the trade boom.

6
The positive relation between government expenditure and trade requires explanation.
Was the crowding out suggested by earlier studies a short-run phenomenon while state
interventions promoted growth in a long-term sense through a less direct “big push”
mechanism? We argue here that such a push started with public sector investments that
raised income, production, trade, and bank deposits, with the latter providing significant
feedback effects to the commercial sector as the Bank of England shifted its asset portfolio
towards private loans. This allowed government expenditure, finance, and commerce, as
measured by the extent of trading activity, to interact in a complementary manner.
The main public expenditure early on, of course, involved gearing up for war, and a
positive interaction between the government and banking began as Parliament strove to raise
finance for the Nine-Years War against France in 1688. A key problem for the government at
the time was the illiquidity of its own bonds, so it formed the Bank of England in 1694 to
buy and hold this debt while the underlying capitalisation of the Bank itself could trade with
greater liquidity on the newly-formed London stock market.8
Shortly after its founding, the Bank re-coined the nation’s metallic currency and
engaged in various note-issuing experiments, both of which promoted monetisation and
brought some degree of order to the fledgling financial system. The dashed line in Fig. 2
shows how the real per capita liabilities of the Bank (i.e., the sum of its circulation and
deposits) increased rapidly through the early 1730s before declining slightly and then
Over the next fifty years, the
Bank would become, to quote R. D. Richards (1934, p. 272), “a credit institution, an organ of
State Finance, a discount and issuing house, a bullion warehouse, and a safe repository.”
8 The stock exchange facilitated transactions in public debt securities and shares of the large trading companies, including the British East and West India Companies, the South Sea Company, and the Royal African Company.

7
1720 1730 1740 1750 1760 1770 1780 1790 18000
0.25
0.5
0.75
1
1.25
1.5
1.75
BE private loans
BE liabilities
Fig. 2. Real per capita liabilities and private loans of the Bank of England, 1720-1799.
levelling off for the remainder of the century. 9
9 We obtain the Bank’s deposit and circulation liabilities from Mitchell (1988, Table 12.2.A, pp. 655-58). It is probably fair to say that coin and Bank of England notes accounted for most of the circulating medium it in London and elsewhere before 1750 given that London’s private bankers had stopped issuing notes, which were always a small part of their business, long before 1775 due to competition from the Bank of England (Cameron, 1967, p. 22). But an increase in the number of country banks after 1775 and a lack of reliable information about net specie imports make us unable to build a continuous series for an M2-like aggregate.
The ability of the Bank to bring about
intensive growth in ordinary deposits early on proved essential to supporting the government
expenditures that would become necessary in the 1740s and 1750s. Even the extensive
growth in deposits after 1750, though not impressive, was considerable given the 50 percent

8
increase in England’s population between 1750 and 1799. 10
But while the Bank’s relationship with the State has received the most attention among
scholars, the Bank also offered considerable support to London’s merchant and trading
communities through its clearing and discounting facilities (see Clapham, 1941). The solid
line in Fig. 2 shows the extent of the Bank of England’s private loan business, which grew
rapidly from the 1750s, even approaching the size of its deposit and circulation liabilities
during the 1760s and again by 1800.
11 Much of this activity was accomplished through the
Bank’s “drawing accounts,” though not all those with accounts were entitled to advances.12
10 Since the Bank’s deposit and circulation liabilities were presumably zero before its founding in 1694, their growth prior to the start of our data in 1720 must have been very rapid indeed. This apparent rise in liabilities, for which we see only the very tail end in Fig. 2, also coincided with another spike in government expenditures at the time of the War of Spanish Succession (1700-14).
Evidence from the Bank archives show that loans and discounts were spread across a wide
range of commercial activities, and that discounts below the statutory limit of £50 were not
unusual. And as liabilities struggled to keep up with population by the late 1730s, the Bank’s
capital and deposits were increasingly deployed toward the provision of private loans, some
of which were used to facilitate trade. With the large trading companies making loans to the
government through the Bank of England, and these (often military) expenditures making
their way back into the deposit liabilities of the Bank, we believe that the rise and
11 We build this series as the income from discounting bills and notes and making private loans (Clapham, 1945, Vol. 1, Appendix E, pp. 301-2 and Vol. II, Appendix C, p. 433) divided by the Bank rate over the previous year (Clapham, 1945, Vol. I, Appendix D, p. 299, and Vol. II, Appendix B, pp. 429). This assumes that the Bank of England’s loans were primarily short term, which is consistent with Clapham’s reading of the loan records. 12 The Bank also made over ninety loans to the East India Company between 1709 and 1744, but these loans, though exceeding other bill and note discounts in the Bank’s early days, did not become an important component of the asset portfolio until the 1750s.

9
accompanying fluctuations in the amount and availability of private loans could have
strongly influenced commerce just as the industrial economy hit its stride after 1760.
The Bank’s private loans may also be representative of commercial lending in
England more generally because, before 1750, the Bank of England co-existed in the
provision of banking services only with a group of private bankers in London who dealt
primarily in deposits and bills of exchange. This gave rise to an active money market to
finance trade and working capital for the emerging manufacturing sector, and the Bank had a
central role in its operation. Moreover, England was slow to develop private banks
compared to the pace at which they would grow in the United States only 50 years later.13
2.2. Empirical analysis Is the available evidence for 18th century England consistent with virtuous cycles of
government expenditure, trade and financial development? Though our historical focus
limits the richness of the data items that can be brought to bear on our hypothesis, the data
depicted in Fig. 1 and Fig. 2 are sufficient for conducting at least a basic time series
investigation. We limit the time coverage to 1728 to 1799 because this represents the period
for which reliable data on private loans of the Bank of England are continuously available on
an annual basis. We have argued above that this variable might capture the intensity of
financial intermediation well.
Table 1 provides time-series evidence of the relationship between government
expenditure, trade openness and financial development, with all three variables measured on
a real, per capita basis. The upper panel reports results from a vector autoregressive (VAR)
13 Relatively little is known about the extent of country banking in 18th century England. These banks were generally small, but grew in number. Cameron (1967, pp. 23-24) estimates that “about a dozen” existed in 1750, about 100 in the early 1780s, and about 300 by 1800.

10
model estimated in log levels.14
The Johansen (1991) tests for cointegration reported in center panel of Table 1 show a
single long-term relationship among the three variables, with both the trace and maximum
eigenvalue statistics rejecting the null of no cointegration and failing to reject the null of a
single cointegrating vector.
Both trade and government expenditure Granger-cause
private loans at the five percent level or less with the regression coefficients for each variable
summing to a positive value. This suggests that both of these variables drive financial
development, which is consistent with our view of the mechanism at work.
The lower panel of Table 1 reports estimates from the corresponding vector error
correction model (VECM).15
14 Before estimating the VAR, we tested each series for non-stationarity using Augmented Dickey-Fuller (ADF) tests. We were unable to reject the null hypothesis of a unit root for any of these series using three to five additional lag differences in the test regressions. All three series rejected the null in first differences. Since our Johansen (1991) tests indicate that the series share a single cointegrating relationship, a VAR model in levels is appropriate (see Sims et al., 1990). We determine the lag order of the VAR using a series of nested likelihood ratio tests. The Granger-causality inferences are qualitatively the same when we apply the modified Wald tests developed by Toda and Yamamoto (1995).
The results confirm the exogeneity of trade suggested by the
levels VAR. They also confirm that financial development is not weakly exogenous to the
system with an estimated coefficient of -0.1134. The negative and significant sum of the
regression coefficients on first differences of both government expenditure and trade in the
private loans equation suggest that both crowded out Bank of England private loans in the
short-run. More interestingly, however, the negative sign on the error correction term (ECT)
in the private loans equation, when viewed with the negative loadings on government
expenditure and trade in the normalised cointegrating vector, are consistent with a positive
15 We form the VECM by inserting the stationary linear combination of the data (i.e., the ECT) at a single lag into an otherwise standard VAR in first differences with four lags, and normalise the cointegrating vector on the Bank of England’s private loans.

11
TABLE 1. GOVERNMENT, TRADE AND PRIVATE LOANS MADE BY THE BANK OF ENGLAND, 1728-1799.
Levels VAR results and block exogeneity tests
Dependent variable Regressors
R2/DW
Bank of England private loans
Trade Government expenditure
Bank of England private loans
0.8377
(0.000) [0.000]
1.4701 (0.019) [0.039]
0.6522
(0.000) [0.001]
0.921 (1.97)
Trade 0.0040 (0.817) [0.928]
0.7476 (0.000) [0.000]
0.0226 (0.905) [0.799]
0.558 (2.01)
Government expenditure
0.0110 (0.820) [0.931]
0.1285 (0.485) [0.599]
0.6977 (0.000) [0.000]
0.867 (2.11)
Vector error correction analysis
r = 0
Cointegration tests r ≤ 1
r ≤ 2
Trace statistic 5% critical value 10% critical value
45.65 29.68 26.79
10.59 15.41 13.33
1.17 3.76 2.69
Max. eigenvalue statistic 5% critical value 10% critical value
35.05 20.97 18.60
9.42 14.07 12.07
1.17 3.76 2.69
Cointegrating vector (ECM) BE private loans Trade Government expenditure Beta 1.000 -7.875 -5.726 Total short run effects Long-run effect
VECM models for
BE private loans Trade Government expenditure
Disequilibrium Adjustment
(ECT) BE private loans
-0.9442 (0.006)
-1.4590 (0.183)
-1.1950 (0.008)
-0.1134 (0.000)
Trade 0.0562 (0.805)
-0.7261 (0.216)
-0.0608 (0.765)
-0.0048 (0.527)
Government expenditure -0.0583 (0.816)
0.3460 (0.249)
0.9691 (0.001)
0.0534 (0.002)
Note: The VAR includes five lags of all variables in log real per capita terms. The table reports the sum of the lag coefficients for each variable block in the VAR and VECM models, with p-values for block Granger causality in parentheses. Figures in square brackets are p-values for the modified Wald tests developed by Toda and Yamamoto (1995). Critical values for the Johansen (1991) cointegration tests are from Table 1 in Osterwald-Lenum (1992).

12
Year 1 3 5 7 9 11
-0.1
0
0.1
0.2
0.3
Fig. 3. Effect of government expenditure on private loans made by the Bank of England, 1728-99.
Note: The impulse responses correspond to the levels VAR system reported in Table 1. The plot traces the percent change in private loans made by the Bank of England over a 12-year horizon from a 1% change in the orthogonalised innovation to government expenditure. The variable ordering places expenditure first, trade second and private loans at the Bank of England last. Using Monte Carlo integration, the thick solid line plots the mean impulse response that results from 10,000 random draws from the posterior distribution of the estimated VAR coefficients. The dashed lines are two standard error bands.
long-run relationship from both government expenditure and trade openness to financial
development, just as the levels VAR in the upper panel indicated. Turning to the VECM
equation for government expenditure, we find that the latter is not weakly exogenous, once
again providing confirmation of the block tests obtained in the levels VAR, and suggesting
that financial development even had positive long run effects on the resources available to
the government.
The cumulative impulse responses depicted in Fig. 3 and Fig. 4 confirm the positive

13
Fig. 4. Effect of international trade on private loans issued by the Bank of England, 1728-99 (see note to Fig. 3).
long run effects of government expenditure and trade openness on private loans, and the
magnitudes of these effects are economically substantial. A one percent change in
government expenditure, for example, is associated with an increase of 0.2 percent in private
loans within six years of the shock, while a one percent change in trade is associated with a
0.17 percent change in private loans within eight years.
3. Evidence from a panel of countries: 1960-2004
In light of our historical findings for England, we now ask whether our hypothesis,
namely that governments and trade can contribute to a “big push” by promoting development
of the financial sector, has some support in more modern data. To this end, we obtained cross
sectional and panel data on financial and macroeconomic indicators for 84 countries over the
period from 1960 to 2004 from the 2009 edition of the World Bank’s World Development

14
Indicators.16
As before, we measure trade openness as the ratio of imports plus exports. Government
is measured as final expenditures, excluding the military.
The selection of countries is based on data availability from this source.
17
Consistent with our hypothesis, the starting point is a set of cross-country regressions
For comparability with other
studies, we use three familiar measures of financial development, namely liquid liabilities
(M3), liquid liabilities less narrow money (M3 less M1), and credit allocated to the private
sector. To facilitate cross-country analysis, we express all variables as percentages of gross
domestic product (GDP). Liquid liabilities as a percentage of GDP have become a standard
measure of financial depth and an indicator of the overall size of financial intermediary
activity in cross-country studies. M3 less M1 removes the pure transactions asset to focus
more on the intensity of intermediation, and the credit measure isolates intermediation to the
private sector from credit allocated to government or state enterprises. We average the data
over five-year periods to build a maximum of nine time series observations for each country
starting with 1960-64 and ending with 2000-2004.
16 The 84 countries are Algeria, Argentina, Australia, Austria, Bangladesh, Barbados, Belgium, Bolivia, Brazil, Cameroon, Canada, Central African Republic, Chile, Colombia, Costa Rica, Cote d’Ivoire, Denmark, Dominican Republic, Ecuador, Egypt, El Salvador, Fiji, Finland, France, Gambia, Ghana, Greece, Guatemala, Guyana, Haiti, Honduras, Iceland, India, Indonesia, Iran, Ireland, Israel, Italy, Jamaica, Japan, Jordan, Kenya, Republic of Korea, Lesotho, Luxembourg, Malawi, Malaysia, Malta, Mauritius, Mexico, Morocco, Nepal, Netherlands, New Zealand, Nicaragua, Niger, Nigeria, Norway, Pakistan, Panama, Papua New Guinea, Paraguay, Peru, Philippines, Portugal, Rwanda, Senegal, Sierra Leone, South Africa, Spain, Sri Lanka, Sudan, Sweden, Switzerland, Syrian Arab Republic, Thailand, Trinidad and Tobago, Togo, Turkey, United Kingdom, United States, Uruguay, Venezuela, and Zimbabwe.
17 It is reasonable to exclude military expenditures from our measure of government for the post-1960 period given that wars have not been a mechanism through which financial sectors have emerged and their inclusion would distort identification of the agglomeration effects that we hypothesise. In this respect the role of wars in financial development today differs considerably from that in the earlier days of British economic emergence.

15
of the form
FDit = α0 + αGOVit + βTRD it + ∂X it + uit, (1)
where FDit is a measure of financial development, GOVit is government expenditure, TRDit
is trade openness, and Xit is a set of baseline explanatory variables that have been shown
empirically to be robust determinants of growth. We then estimate a second set of regressions
that reverse the positions of trade openness and financial development
TRDit = α0 + αGOVit + βFD it + ∂X it + vit.. (2)
The conditioning set (i.e., the Xit) for the financial development regressions includes
per capita income and CPI inflation, in accordance with the empirical literature on the
determinants of financial development (e.g., Rousseau and Wachtel, 2002; Baltagi et al.,
2009). The trade openness regressions additionally condition on the initial value of aggregate
GDP in each five-year period to capture the effects of country size on trade. We anticipate
that country size matters in a negative way when it comes to trade openness in that, all other
things equal, larger countries need to trade less than smaller countries, as consumers and
firms are able to source a greater range of products domestically at lower cost. Estimation is
by instrumental variables to ameliorate potential problems of simultaneity. Specifically, we
attempt to extract the predetermined component of the financial variable by using its initial
value (in each five-year period) along with the initial values of government expenditure and
trade as percentages of GDP as instruments in each regression equation.
Table 2 presents estimates of the regressions specified in (1) and (2) using the full set
of five-year observations in our 84-country sample. All estimates include time period fixed
effects. The coefficient on trade openness is highly statistically significant in all three

16
TABLE 2 FINANCIAL DEVELOPMENT AND TRADE OPENNESS IN A PANEL OF COUNTRIES 1960-2004
Instrumental Variable Regressions with 5-Year Panel Data
Dependent variable
Regressors M3 % of GDP
M3-M1 % of GDP
Private credit % of GDP
Trade openness % of GDP
Trade openness % of GDP
Trade openness % of GDP
Government expenditure (% of GDP)
0.168
(0.228)
-0.128
(0.144)
0.154
(0.222)
1.193***
(0.204)
1.326***
(0.205)
1.180***
(0.226) Trade openness (% of GDP) Liquid liabilities (M3) (% of GDP)
0.237***
(0.034)
---
0.186***
(0.021)
---
0.065***
(0.030)
---
---
0.386***
(0.037)
---
---
---
---
M3-M1 (% of GDP)
---
---
---
---
0.619***
(0.058)
---
Private credit (% of GDP)
---
---
---
---
---
0.289***
(0.044) Initial real GDP per capita (in 2000 US$)
10.476***
(0.716)
7.627***
(0.452)
14.797***
(0.695)
7.701***
(0.992)
6.748***
(1.051)
10.965***
(1.130) Initial aggregate GDP (in 2000 US$) CPI Inflation
---
-0.005 (0.005)
---
-0.004 (0.003)
---
-0.007 (0.005)
-12.352***
(0.633)
-0.012**
(0.005)
-11.739***
(0.640)
-0.011** (0.005)
-14.440***
(0.706)
-0.013***
(0.005) R2
0.40
0.47
0.53
0.55
0.55
0.51
Number of observations 630 626 653 630 626 653
Notes: Instruments include initial values of all regressors other than CPI inflation. Figures in parentheses are standard errors. All regressions include a full set of dummy variables for five-year time periods. The symbols ***, **, and * denote statistical significance at the 1%, 5% and 10% levels, respectively.
17
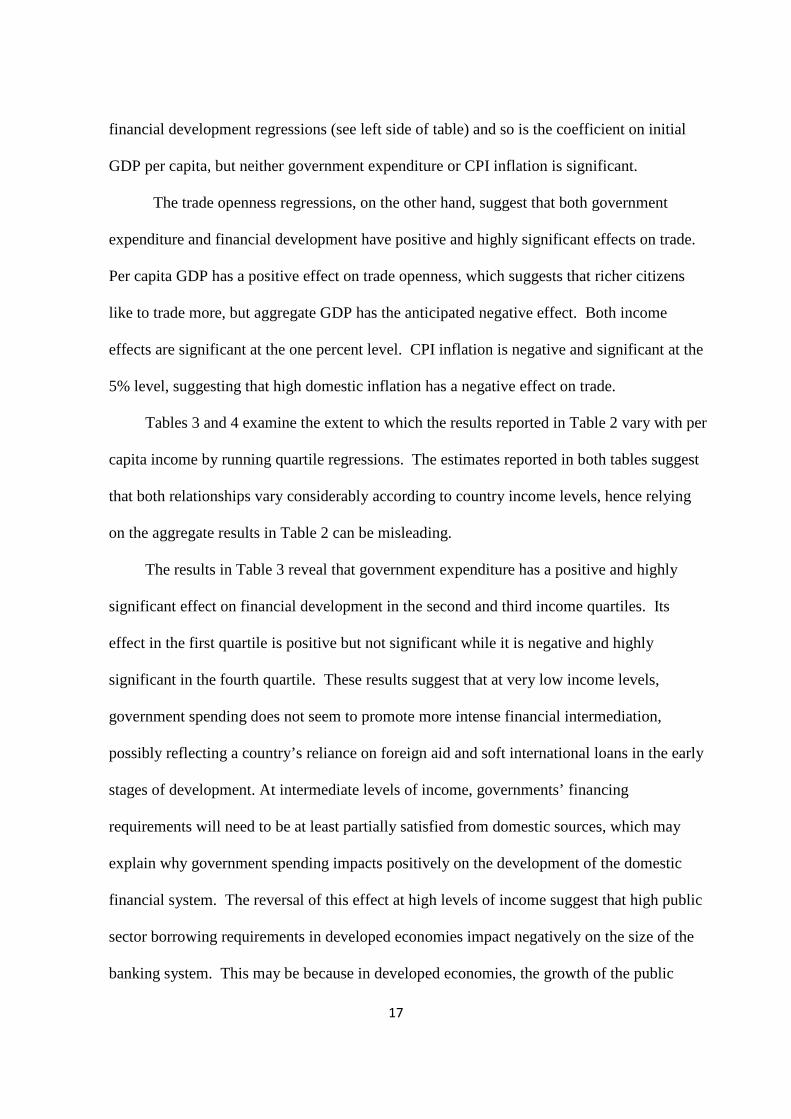
financial development regressions (see left side of table) and so is the coefficient on initial
GDP per capita, but neither government expenditure or CPI inflation is significant.
The trade openness regressions, on the other hand, suggest that both government
expenditure and financial development have positive and highly significant effects on trade.
Per capita GDP has a positive effect on trade openness, which suggests that richer citizens
like to trade more, but aggregate GDP has the anticipated negative effect. Both income
effects are significant at the one percent level. CPI inflation is negative and significant at the
5% level, suggesting that high domestic inflation has a negative effect on trade.
Tables 3 and 4 examine the extent to which the results reported in Table 2 vary with per
capita income by running quartile regressions. The estimates reported in both tables suggest
that both relationships vary considerably according to country income levels, hence relying
on the aggregate results in Table 2 can be misleading.
The results in Table 3 reveal that government expenditure has a positive and highly
significant effect on financial development in the second and third income quartiles. Its
effect in the first quartile is positive but not significant while it is negative and highly
significant in the fourth quartile. These results suggest that at very low income levels,
government spending does not seem to promote more intense financial intermediation,
possibly reflecting a country’s reliance on foreign aid and soft international loans in the early
stages of development. At intermediate levels of income, governments’ financing
requirements will need to be at least partially satisfied from domestic sources, which may
explain why government spending impacts positively on the development of the domestic
financial system. The reversal of this effect at high levels of income suggest that high public
sector borrowing requirements in developed economies impact negatively on the size of the
banking system. This may be because in developed economies, the growth of the public

18
TABLE 3 FINANCIAL DEVELOPMENT IN A PANEL OF COUNTRIES 1960-2004
Instrumental Variable Quartile Regressions with 5-Year Panel Data
Dependent variable: Liquid Liabilities (M3 as % of GDP)
Regressors 1st Quartile
2nd Quartile
3rd Quartile 4th Quartile
Government expenditure (% of GDP)
-0.076
(0.249)
2.031***
(0.307)
2.423***
(0.703)
-2.246***
(0.551) Trade Openness (% of GDP)
0.057
(0.036)
0.283***
(0.076)
0.459***
(0.050)
-0.196**
(0.091) Initial real GDP per capita (in 2000 US$)
14.22***
(2.612)
5.953** (2.800)
12.279***
(3.498)
23.243***
(7.134)
CPI Inflation -0.075 (0.073)
-0.011***
(0.004)
0.316**
(0.162) -0.039**
(0.016)
R2 0.40 0.55 0.56 0.33 Number of observations 136 172 163 159
Notes:
1. Quartiles are defined in accordance to US$ income levels in 1990. The 1st quartile includes countries with GDP per capita of up to $660, while the upper cut-offs for the second, third and fourth quartiles are $1,659, $8,947 and $33,297 respectively.
2. Instruments include initial values of government expenditure and trade openness. 3. Figures in parentheses are standard errors. 4. All regressions include a full set of time dummies. 5. The symbols *** ** and * denote statistical significance at the 1%, 5% and 10% levels, respectively.
sector may crowd out rather than crowd in the private sector. If the private sector relies more
on the banking system than the public sector, crowding out of the former by the latter is
likely to result in a smaller banking system.
Trade openness also has a positive and highly significant effect on financial
development in the second and third quartiles, a negative one in the fourth and an
insignificant one in the first. The positive effect of trade openness on financial development
is consistent with existing empirical literature (e.g., Baltagi et al., 2009) as well as with the
19
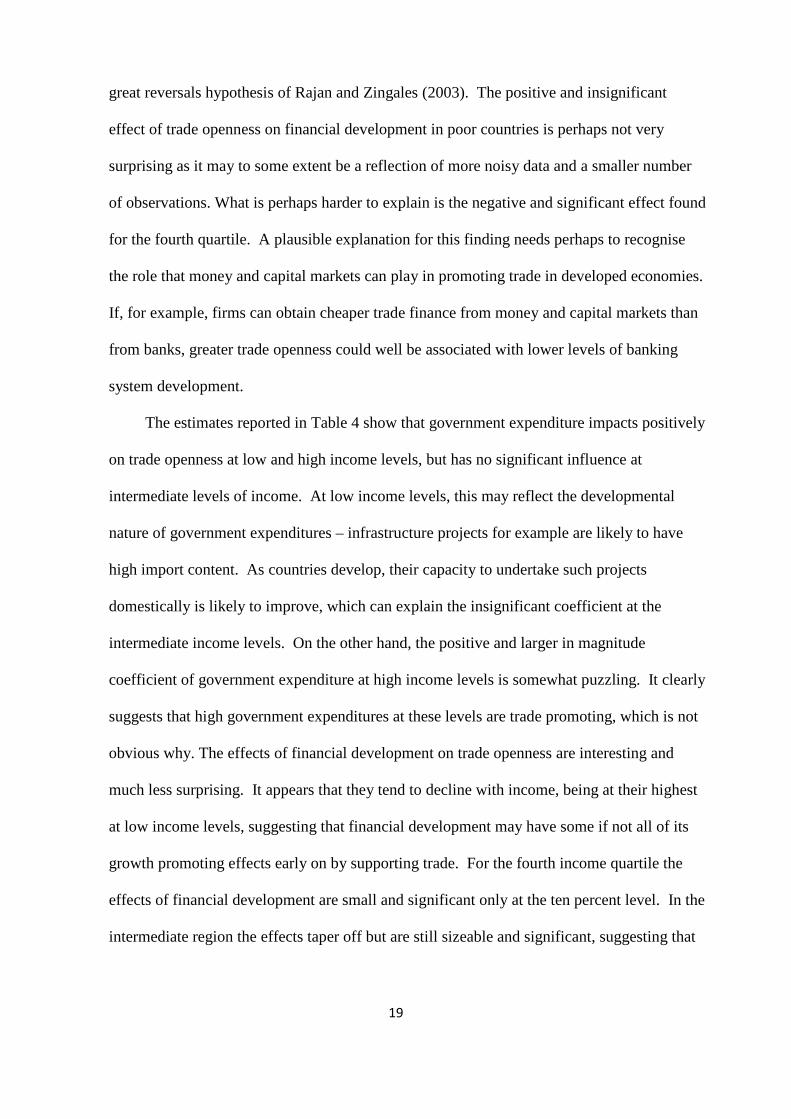
great reversals hypothesis of Rajan and Zingales (2003). The positive and insignificant
effect of trade openness on financial development in poor countries is perhaps not very
surprising as it may to some extent be a reflection of more noisy data and a smaller number
of observations. What is perhaps harder to explain is the negative and significant effect found
for the fourth quartile. A plausible explanation for this finding needs perhaps to recognise
the role that money and capital markets can play in promoting trade in developed economies.
If, for example, firms can obtain cheaper trade finance from money and capital markets than
from banks, greater trade openness could well be associated with lower levels of banking
system development.
The estimates reported in Table 4 show that government expenditure impacts positively
on trade openness at low and high income levels, but has no significant influence at
intermediate levels of income. At low income levels, this may reflect the developmental
nature of government expenditures – infrastructure projects for example are likely to have
high import content. As countries develop, their capacity to undertake such projects
domestically is likely to improve, which can explain the insignificant coefficient at the
intermediate income levels. On the other hand, the positive and larger in magnitude
coefficient of government expenditure at high income levels is somewhat puzzling. It clearly
suggests that high government expenditures at these levels are trade promoting, which is not
obvious why. The effects of financial development on trade openness are interesting and
much less surprising. It appears that they tend to decline with income, being at their highest
at low income levels, suggesting that financial development may have some if not all of its
growth promoting effects early on by supporting trade. For the fourth income quartile the
effects of financial development are small and significant only at the ten percent level. In the
intermediate region the effects taper off but are still sizeable and significant, suggesting that

20
TABLE 4 TRADE OPENNESS IN A PANEL OF COUNTRIES 1960-2004
Instrumental Variable Quartile Regressions with 5-Year Panel Data
Dependent variable: Trade Openness
Regressors 1st Quartile
2nd Quartile
3rd Quartile 4th Quartile
Government expenditure (% of GDP)
1.343***
(0.436)
0.273
(0.361)
-0.596
(0.799)
2.026***
(0.429) Liquid liabilities (M3) (% of GDP)
0.819***
(0.213)
0.505***
(0.083)
0.613***
(0.072)
0.121*
(0.072) Initial real GDP per capita (in 2000 US$)
26.576***
(5.352)
5.521** (2.750)
-0.979
(3.904)
4.402
(5.554)
Initial aggregate GDP (in 2000 US$)
-12.273***
(1.315) -6.814***
(1.252) -13.771***
(1.450) -10.447***
(1.274)
CPI Inflation 0.013 (0.132)
-0.005 (0.004)
-0.015
(0.013) -0.227*
(0.127)
R2 0.65 0.52 0.73 0.47 Number of observations 133 172 163 159
Notes:
1. Quartiles are defined in accordance to US$ income levels in 1990. The 1st quartile includes countries with GDP per capita of up to $660, while the upper cut-offs for the second, third and fourth quartiles are $1,659, $8,947 and $33,297 respectively.
2. Instruments include initial values of government expenditure and liquid liabilities. 3. Figures in parentheses are standard errors. 4. All regressions include a full set of five-year time dummies. 5. The symbols *** ** and * denote statistical significance at the 1%, 5% and 10% levels, respectively.
financial development continues to be important in promoting economic openness in such
countries. Interestingly, the effects of per capita income on trade are significant only in the
first and second quartiles while the negative-size effect is highly significant in all quartiles.
The results in Tables 3 and 4 confirm that the aggregate results mask important
variation that exists among different groups of countries. Different policy recommendations
may therefore be appropriate for different stages of development. At low income levels,

21
economic development is the only variable that appears to drive financial development, since
both trade openness and government spending have positive and insignificant coefficients at
conventional levels. At intermediate income levels, both government expenditure and trade
openness are significant drivers of banking system development. At high levels of income
both these effects are reversed, reflecting perhaps the increased role played by money and
capital markets and crowding out of the private sector by the government.
At the very initial stages of development, government spending relies on foreign aid
and soft international loans which do not promote domestic financial development but does
seem to support trade. It is only later, when the commercial sector is more developed, that
government expenditure would be directed toward trade-promoting infrastructure such as
ports, railroads, and roads, which ultimately create income that feeds back into the financial
sector. As economic development progresses, government expenditure begins to facilitate the
emergence of domestic finance, because governments begin to borrow from domestic banks,
which are able to mobilise more savings.
4. Concluding Remarks
We make a first attempt to examine empirically the interactions between government
expenditure, trade openness and financial development utilising data from 18th century
England and a panel of 84 countries from 1960-2004. For England, we find that the
government and international trade did have a positive long-run effect on financial
development when measured as the value of private loans issued at the Bank of England. For
the wider panel of countries and more recent data, we find that government expenditures
have positive effects on financial development for countries that are in the mid-ranges of
economic development as measured by per capita income, but have little effect for poor
countries and a strongly negative effect for the wealthiest ones.

22
The historical and more modern analyses are both consistent with a mutually
supportive government-trade-finance nexus that reaches its peak of effectiveness once an
economy begins to modernise. England, for example, had shown signs of modernising prior
to the Glorious Revolution of 1688, but military conflicts and the rise of a stronger
Parliamentary state allowed the Bank of England to form and evolve along with a host of
other financial institutions, setting the nexus into motion. Indeed, with a per capita income of
more than $1,000 (1990 US) by 1770, England would have been firmly in the second quartile
of our broad cross-section of economies measured in 1990.
Our study identifies an important caveat to the view that government expenditures in
general crowd out private investment, and suggests that the government itself is essential to
the development of sound financial arrangements. The effects of such a nexus, with the
emergence of a modern sector reflected in the extent of international trade, are most emphatic
as economies begin to experience robust growth. This has strong implications for the staging
of development policies today.
References
Andrianova, S., Demetriades, P. and Xu, C. (2008). “Political economy origins of financial markets in Europe and Asia”, University of Leicester Discussion Paper in Economics, 08/1.
Baltagi, B. H., Demetriades, P. O. and Law, S. H. (2009). “Financial development and openness: evidence from panel data”, Journal of Development Economics, 89, 285-296.
Ben-David, D. (1993). “Equalising exchange: trade liberalisation and income convergence” Quarterly Journal of Economics, 108, 653-79.
Bougheas, S., Demetriades, P. O. and Mamuneas T. P. (2000). “Infrastructure, specialisation and economic growth”, Canadian Journal of Economics, 33(2), 506-22.
Bougheas, S., Demetriades, P. O. and Morgenroth, E. L. W. (1999). “Infrastructure, transport costs and trade”, Journal of International Economics, 47, 169-89.
Brewer, J. (1989). The Sinews of Power: War, Money and the English State, 1688-1783, Cambridge, MA: Harvard University Press.

23
Cameron, R. (1967). “England, 1750-1844”, in (R. Cameron, O. Crisp, H. T. Patrick, and R. Tilly, eds.) Banking in the Early Stages of Industrialisation: A Study in Comparative Economic History, pp. 15-59. New York: Oxford University Press.
Clapham, J. H. (1941). “The private business of the Bank of England, 1744-1800”, Economic History Review, 11, 77-89.
Clapham, J. H. (1945). The Bank of England: A History, New York: Macmillan.
Crafts, N. F. R. (1987). “British economic growth, 1700-1850: some difficulties of interpretation”, Explorations in Economic History, 24:245-68.
de Vries, J. (1976). The Economy of Europe in an Age of Crisis,1600-1750, Cambridge: Cambridge University Press.
de Vries, J. and van der Woude, A. (1997). The First Modern Economy: Success, Failure, and Perseverence of the Dutch Economy,1500-1815, Cambridge: Cambridge University Press.
Dickson, P. G. M. (1967). The Financial Revolution in England: A Study in the Development of Public Credit, 1688-1756, London: Macmillan.
Dollar, D. (1992). “Outward-oriented developing countries really do grow more rapidly: evidence from 95 LDCs”, Economic Development and Cultural Change, 40, 523-44.
Edwards, S. (1998). “Openness, productivity and growth: what do we really know?”, Economic Journal 108, 383-98.
Easterly, W. and Rebelo, S. (1993). “Fiscal policy and economic growth: an empirical investigation”, Journal of Economic Growth 32, 417-58.
Jackson, R. V. (1990). “Government expenditure and British economic growth in the eighteenth century: some problems of measurement”, Economic History Review, 43, 217-35.
Johansen, S. (1991). “Estimation and hypothesis testing of cointegration vectors in Gaussian vector autoregressive models”, Econometrica, 59, 1551-80.
Levine, R. (2005). “Finance and growth: theory and evidence”, in (P. Aghion and S. N. Durlauf, eds.) Handbook of Economic Growth, Vol. 1A, pp. 865-934. Amsterdam: Elsevier North Holland.
Levine, R. (1997). “Financial development and economic growth: views and agenda”, Journal of Economic Literature, 35, 688-726.
Mitchell, B. R. (1988). British Historical Statistics, Cambridge: Cambridge University Press.
Mokyr, J. (1987). “Has the industrial revolution been crowded out? Some reflections on Crafts and Williamson”, Explorations in Economic History, 24, 293-319.
Neal, L. (1990). The Rise of Financial Capitalism: International Capital Markets in the Age of Reason, New York: Cambridge University Press.

24
North, D. and Weingast, B. (1989). “Constitutions and commitment”, Journal of Economic History, 49, 803-32.
Osterwald-Lenum, M. (1992). “A note with fractiles of the asymptotic distribution of the maximum likelihood cointegration rank test statistics: four cases”, Oxford Bulletin of Economics and Statistics, 54, 461-78.
Rajan, R. G. and Zingales, L. (2003) “The great reversals: the politics of financial development in the twentieth century”, Journal of Financial Economics, 69, 5–50.
Richards, R. D. (1934). “The first fifty years of the Bank of England”, in (J. G. Van Dillen, ed.) History of the Public Banks: Accompanied by Extensive Bibliographies of the Histories of Banking and Credit in Eleven European Countries, pp. 201-72. The Hague: M. Nijhoff.
Rousseau, P. L. (2003). “Historical perspectives on financial development and economic growth”, Federal Reserve Bank of St. Louis Review, 84:4, 81-105.
Rousseau, P. L., and Wachtel, P. (2002). “Inflation thresholds in the finance-growth nexus”, Journal of International Money and Finance, 21, 777-93.
Rousseau, P. L. and Sylla, R. (2003). “Financial systems, economic growth, and globalisation”, in (M. D. Bordo, A. M. Taylor, and J. G. Williamson, eds.) Globalisation in Historical Perspective, pp. 373-413. Chicago: University of Chicago Press for National Bureau of Economic Research.
Sachs, J. and Warner, A. (1995). “Economic reform and the process of global integration”, Brookings Papers on Economic Activity, 1, 1-118.
Sims, C. A., Stock, J. H., and Watson, M. W. (1990). “Inference in time series models with some unit roots”, Econometrica, 58, 113-44.
Svaleryd, H. and Vlachos, J. (2002). “Markets for risk and openness to trade: how are they related”, Journal of International Economics, 57, 369–95.
Sylla, R. (1999). “Shaping the U.S. financial system, 1690-1913”, in (R. Sylla, R. Tilly and G. Tortella, eds.) The State, the Financial System, and Economic Modernisation, pp. 249-70. Cambridge: Cambridge University Press.
Toda, H. and Yamamoto, T. (1995). “Statistical inference in vector autoregressions with possibly near integrated processes”, Journal of Econometrics, 66, 225-50.
Williamson, J. G. (1984). “Why was British growth so slow during the industrial revolution”, Explorations in Economic History, 44, 687-712.


![Openness Agreements: Part Two The Reality of Openness · Presented by © Adoptive Families Association of BC [2016] Openness Agreements: Part Two The Reality of Openness](https://static.fdocuments.us/doc/165x107/5e81797d22c1fb32191241b3/openness-agreements-part-two-the-reality-of-openness-presented-by-adoptive-families.jpg)