GOVERNMENT OF INDIA - Ministry of Statistics and...
69
REPORT OF THE GROUP FOR EXAMINING DISCREPANCY IN PFCE ESTIMATES FROM NSSO CONSUMER EXPENDITURE DATA AND ESTIMATES COMPILED BY NATIONAL ACCOUNTS DIVISION CENTRAL STATISTICAL ORGANISATION MINISTRY OF STATISTICS & PROGRAMME IMPLEMENTATION GOVERNMENT OF INDIA January 2008
Transcript of GOVERNMENT OF INDIA - Ministry of Statistics and...

REPORT OF
THE GROUP FOR EXAMINING
DISCREPANCY IN PFCE ESTIMATES
FROM NSSO CONSUMER EXPENDITURE
DATA AND ESTIMATES COMPILED BY
NATIONAL ACCOUNTS DIVISION
CENTRAL STATISTICAL
ORGANISATION MINISTRY OF STATISTICS & PROGRAMME
IMPLEMENTATION
GOVERNMENT OF INDIA
January 2008
Central Statistical Organisation National Accounts Division
1
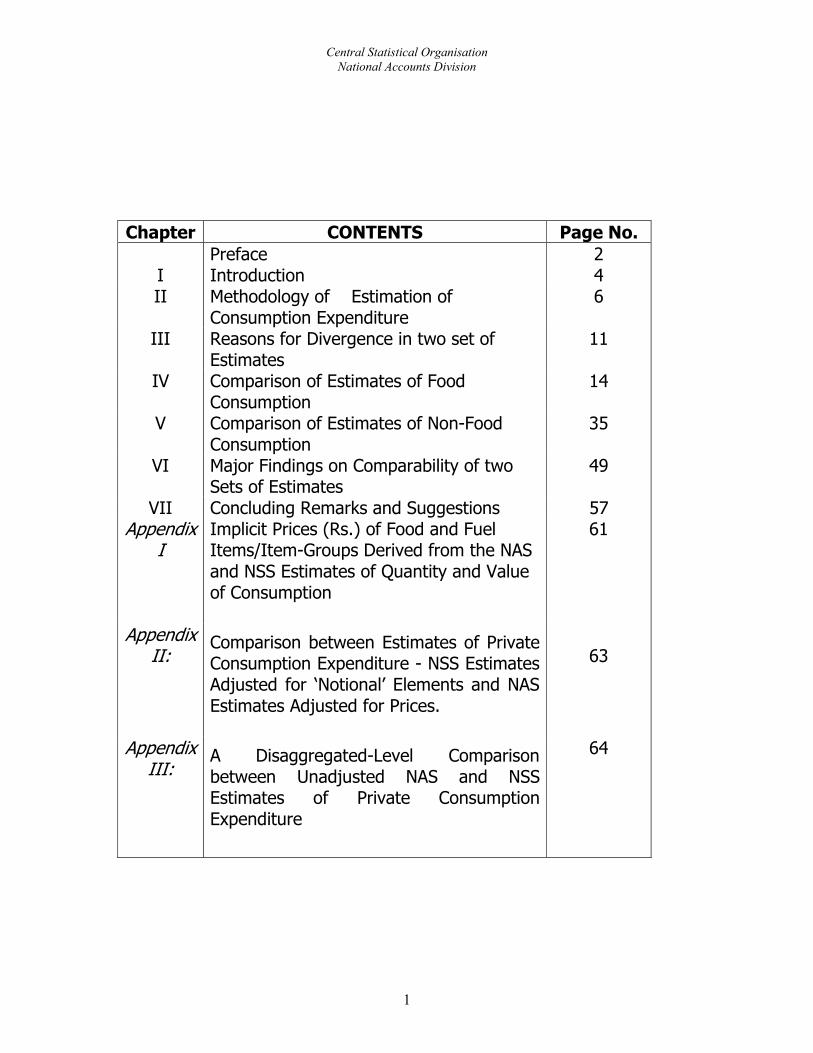
Chapter CONTENTS Page No. Preface 2 I Introduction 4 II Methodology of Estimation of
Consumption Expenditure 6
III Reasons for Divergence in two set of Estimates
11
IV Comparison of Estimates of Food Consumption
14
V Comparison of Estimates of Non-Food Consumption
35
VI Major Findings on Comparability of two Sets of Estimates
49
VII Concluding Remarks and Suggestions 57 Appendix
I Implicit Prices (Rs.) of Food and Fuel Items/Item-Groups Derived from the NAS and NSS Estimates of Quantity and Value of Consumption
61
Appendix II:
Comparison between Estimates of Private Consumption Expenditure - NSS Estimates Adjusted for ‘Notional’ Elements and NAS Estimates Adjusted for Prices.
63
Appendix III:
A Disaggregated-Level Comparison between Unadjusted NAS and NSS Estimates of Private Consumption Expenditure
64
Central Statistical Organisation National Accounts Division
2
PREFACE A meeting with the officers of PCL, CSO and Economic Advisor’s Office, was held with Prof. S.D. Tendulkar, Chairman and Dr. Surjit S. Bhalla, Member NSC to discuss different issues relating to Price Statistics. While discussing the proposal to introduce CPI (Urban), CPI (Rural) and combined CPI, it was decided to use Consumer Expenditure Survey data to prepare weighting diagram. Some members raised doubts about the discrepancy in Private Final Consumption Expenditure estimates from the NSSO and National Accounts. In view of this, it was decided to constitute a Group to examine the issue of divergence in the two sets of estimates under the Chairpersonship of Dr. Savita Sharma, DDG, National Accounts Division, CSO. The composition of the Group was as follows:
1. Dr. Savita Sharma, DDG (NAD) Chairperson
2. Shri Sanjay Kumar, Director, (PCL) Member 3. Sh. Prabir Choudhury, Director, SDRD, Kolkata Member 4. Sh. Janardan Yadav, Director NAD Member -Secretary
2. The terms of reference of the group were the following:
(i). To examine the extent of discrepancy in PFCE estimate from NSSO
Consumer Expenditure data and estimates compiled by National Accounts Division using commodity flow approach.
(ii). To ascertain reasons of discrepancy in the two sets of PFCE estimates. 3. The group held two meetings at the initial stages to chalk out the action plan. It was decided to use NSS consumer expenditure data of 55th (1999-00) and 61rst (2004-05) round and compare it with the NAS estimates. The detailed data from the reports mentioned below has been used for making concordance between the NSS and NAS items to facilitate comparison at the disaggregated level:
1. Consumption of Some Important Commodities in India, 1999-2000 (NSS 55th
Round, Report No. 461). 2. Household Consumption of Various Goods and Services in India, 2004-05
(NSS 61st Round, Report No. 509).
4. It was also decided to use earlier study done by CSO on this subject. The earlier report analysed the data up to the year 1993-94. The committee has considered for examination the data now available for NSS quinquennial rounds conducted during 1999-2000 and 2004-05. Many of the causes of the difference in two sets of estimates are inherent in the methodology adopted for estimation by the two agencies which have
Central Statistical Organisation National Accounts Division
3
been discussed extensively in the earlier studies. The detailed item-wise comparison of the estimates on food and non-food consumption was taken up to identify the components mainly responsible for the divergence.
Central Statistical Organisation National Accounts Division
4
CHAPTER I INTRODUCTION
1.1 In India, the private final consumption expenditure (PFCE) is generated from two sources. First, as a part of the National Accounts Statistics (NAS), the Central Statistical Organisation (CSO) compiles annually the estimates of private consumption. Secondly, the Household Consumer Expenditure Surveys (HCES) of the National Sample Survey Organisation (NSSO) yields the estimates of private consumption. The former is available as a macro estimate and a scalar for the nation as a whole while the latter estimates are available separately for different states in rural and urban areas, which can be aggregated to a national estimate. The estimates of private consumption from these two sources are different, primarily as these are derived from different approaches. The difference in two sets of estimates is obvious but the concern is the increase in the difference over the years. The data from two sources for the years from 1972-73 to 2004-05 shows that the difference has increased from 5 percent to 50 percent. Moreover, the growth in per capita consumption expenditure of NAS is higher than that of growth in per capita expenditure of NSS. 1.2 The issue of divergence between the estimates of private consumption expenditure gained momentum when Planning Commission dropped the adjustment of NSS distribution of consumption expenditure to the level of NAS in late 1990’s. On the basis of Task Force Methodology, Planning Commission was estimating incidence of poverty from consumption expenditure distribution of NSS after scaling it up to the level of consumption expenditure of NAS. Planning Commission uses macro economic aggregates of NAS in its planning exercises and PFCE of NAS is one of the indicators used in these exercises. Poverty ratio has also been used as a parameter in planning exercises. To have consistency in the data used, Task Force suggested estimating poverty after adjusting NSS distribution to the level of NAS. As long as the NAS estimate was 5 percent to 10 percent higher than NSS, it did not bother the academicians. But, over the years this discrepancy rose to more than 30 percent. Computing poverty from the expenditure distribution of NSS after scaling it by such a high proportion led to the criticism of the Task Force methodology of estimation of poverty. 1.3 In September 1989, Planning Commission, constituted an Expert Group under the chairmanship of Prof. D.T. Lakdawala to go into the question of re-defining the poverty line. The Expert Group recommended use of consumption distribution of NSS without any adjustment to NAS level of consumption for estimation of poverty. This was
Central Statistical Organisation National Accounts Division
5
a major departure from Task Force method, which did this adjustment on a pro-rata basis. The recommendations of the Expert Group regarding the exclusive reliance on NSS data for consumption expenditures were accepted by the Government in 1997. 1.4 The unadjusted distribution yields the poverty ratio as 54.88 percent in 1973-74 and 26.10 in 1999-2000, a decline of 29 percentage points. Whereas, the NSS consumption distribution adjusted to the CSO consumption expenditure yields a poverty ratio of 28.32 percent in 1973-74 and 4.34 percent in 1999-2000, marking a decline of 24 percentage points during this period. However, it is the level of poverty that causes concern. It is virtually non-existent in case the CSO consumption is the “correct” estimate of consumption expenditure and follows the same pattern of distribution as that of NSS distribution. There is a group of academicians who feel that consumption expenditure of NSS is grossly under-estimated and does not give the true picture of growing economy.
1.5 Drastically different picture emerging from these two estimates of private consumption expenditure has led to the debate on the correctness and reliability of either or both these estimates. Detailed analysis of each and every component forming part of these two estimates can only help to bring them closer but are unlikely to entirely close the gap. A number of studies have been conducted, centering on the coverage and measurement procedure of these estimates.
1.6 In order to examine the extent of discrepancy in PFCE estimates from NSSO Consumer Expenditure data and estimates compiled by National Accounts Division a committee has been set up by CSO. The committee would also ascertain the reasons of discrepancy in the two sets of PFCE estimates.
Central Statistical Organisation National Accounts Division
6
CHAPTER II METHODOLOGY OF ESTIMATION OF CONSUMPTION EXPENDITURE
2.1 The NSSO estimate consumption expenditure by conducting a survey of households. The consumption expenditure is collected from the selected households directly by canvassing a well-designed schedule of enquiry covering almost every item of household consumption. But the surveys conducted for this purpose, called Household Consumption Expenditure Surveys (HCES), cover only the households and not the consumption expenditure of private non profit institutes serving households (NPISHs).
2.2 The household consumer expenditure surveys by NSSO provide the estimates of monthly per capita consumer expenditure for broad items of expenditure. These are available separately for the rural and urban population for all-India and separately for the states and Union Territories (UT). The monthly per capita consumption estimates are multiplied by the appropriate factor to derive the annual per capita expenditure. This is then multiplied by the projected population of relevant year for rural and urban areas to get the total annual consumption expenditure in rural and urban areas respectively. Rural and urban consumer expenditure is added to get NSS based estimates of aggregate annual household consumer expenditure. 2.3 The estimate of Private Final Consumption Expenditure (PFCE) in National Accounts Statistics is derived following the “commodity flow” approach. It implies working of commodity balances relating to various items of consumption, taking into account (i) production; (ii) intermediate consumption in agriculture, manufacturing and other industries; (iii) net imports; (iv) change in stock; (v) consumption on government account and household and non-household final consumption. An amount is also discounted for the wastage of agricultural produce. For obtaining PFCE the expenditure incurred by industries as intermediate consumption and all final consumption (including imports and exports) other than those by households and non-profit institutions are deducted from the total availability. 2.4 The quantity of final consumption obtained from commodity balances is generally evaluated at market prices. For services, the estimates of final consumption expenditure is derived from the total output (as measured by the gross earnings) of the agencies providing these services to the consumers after netting out the expenditure by the private enterprises and public sector on these services during the year. The gross
Central Statistical Organisation National Accounts Division
7
earnings of any particular service during a given period is the sum total of the payments received from the consumers of these services in lieu of the services rendered to them. 2.5 For food items, PFCE is estimated at two stages. Firstly, the quantity retained by the producers for their own consumption is evaluated at producer's prices which is the same as used for the domestic product and secondly, marketed part is evaluated at retail prices which are the average prices of rural and urban prices collected from National Sample Survey Organisation (NSSO) and Directorate of Economic & Statistics, Ministry of Agriculture respectively. For manufacturing items, the value of output is adjusted for excise duty and trade and transport margin (TTM). The TTM'S are separately estimated for various commodities/commodity groups on the basis of price data at various levels; i.e., producers', wholesale, retail etc. Import duty is also added to the value of imports. The sum of all the commodity-wise estimates of value gives the aggregate estimate of PFCE, which in fact represents the value of goods and services consumed by the households and NPISHs.
2.6 The two data sets of private final consumption expenditure of NAS and NSS are not strictly comparable. Besides, the differences in the coverage and reference time-frames, there is difference in the concepts and methods of estimation followed by the two agencies. As mentioned earlier, this issue is not new. A number of studies have been conducted in the past by various academicians and researchers. Recently, the ‘Study Group on Non-sampling Errors’ comprising officers from NAD, CSO and SDRD, NSSO prepared a report on “Cross Validation Study of Estimates of Private Final Consumption Expenditure available from Household Survey and National Accounts”. This report contains a comprehensive disaggregated level comparison of the two sets of estimates. The present attempt to explore the extent and reasons for the discrepancy are an extension of the above mentioned report which contains analyses of the data up to the year 1993-94. The committee has considered for examination the data now available for NSS quinquennial rounds conducted during 1999-2000 and 2004-05. 2.7 It is important to mention that the data for 1999-2000 is not exactly comparable with other rounds. The reference period for different commodity groups in the household consumption expenditure surveys conducted during 1999-2000 is different from HCES of earlier years as well as from the survey conducted during 2004-05. In all HCESs, except 1999-00, the data has been collected for 30-days reference period for all commodities. The data for 365-days reference period is also being collected for five non-food item-groups namely, clothing (bedding), footwear, education, medical care (institutional) and durable goods. But, the NSS estimates used for comparison with NAS estimates are based on the data collected in the HCES with 30-days reference period. For 1999-00, the data on consumption of clothing, footwear, education, medical care (institutional) and durable goods has been collected for 365-days reference period only.

Central Statistical Organisation National Accounts Division
8
Hence the data for the above mentioned items for 365 days reference period has been used in 1999-00.
2.8 The NSS estimates mentioned in Table 1 below are arrived as the product of the estimates of annual per capita consumption expenditure obtained from the HCES and the population projections based on the Population Census-2001. The NAS estimates for different years given in this table are the current-price estimates based on the base year of the corresponding series. Table1: Divergence between the NSS and NAS Estimates of Consumption Expenditure for Selected Years
(Rs. crore) Year Source Food Non-food Total
1972-73 NSS 23420 9790 33210(1970-71 base) NAS 23379 11752 35131 % difference 0.18 -16.70 -5.471977-78 NSS 36500 20030 56530(1970-71 base) NAS 39801 23282 63083 % difference -8.29 -13.97 -10.391983-84 NSS 69735 39996 109731(1980-81 base) NAS 85613 60471 146084 % difference -18.55 -33.86 -24.881987-88 NSS 106205 67560 173765(1980-81 base) NAS 122805 101256 224061 % difference -13.52 -33.28 -22.451993-94 NSS 224066 131704 355770(1993-94 base) NAS 315243 259529 574772 % difference -28.92 -49.25 -38.101999-00 NSS 393126 323265 716391(1993-94 base) NAS 652627 618929 1271556 % difference -39.76 -47.77 -43.661999-00 NSS 410918 305473 716391(1999-00 base) NAS 647011 610530 1257541 % difference -36.49 -49.97 -43.032004-05 (URP) NSS 481189 450226 931415(1999-00 base) NAS 742609 1131120 1873729 % difference -35.20 -60.20 -50.292004-05 (MRP) NSS 481189 485204 966393(1999-00 base) NAS 742609 1131120 1873729 % difference -35.20 -57.10 -48.42
Notes: 1. % difference stands for (NSS – NAS) / NAS expressed in percentage. 2. The estimates for 1972-73 and 1977-78 are taken from the National Accounts Statistics of 1981 (page 34) and 1986 (page 36) respectively.
3. Figures for NAS estimates for 1983-84, 1987-88 are on 1980-81 base, 1993-94 and 1999-00 are at 1993-94 base and 2004-05 are at 1999-00 base and taken from the National Accounts Statistics of 1990, 1992,2000 and NAS 2007 respectively.
Central Statistical Organisation National Accounts Division
9
PERCENTAGE DIFFERENCE IN PFCE ESTIMATES OF NSS & NAS
-10.000.00
10.0020.0030.0040.0050.0060.0070.00
1972-73 1977-78 1983-84 1987-88 1993-94 1999-00 2004-05YEAR
PERCEN
TAG
E(%
)
Food Non- Food Total
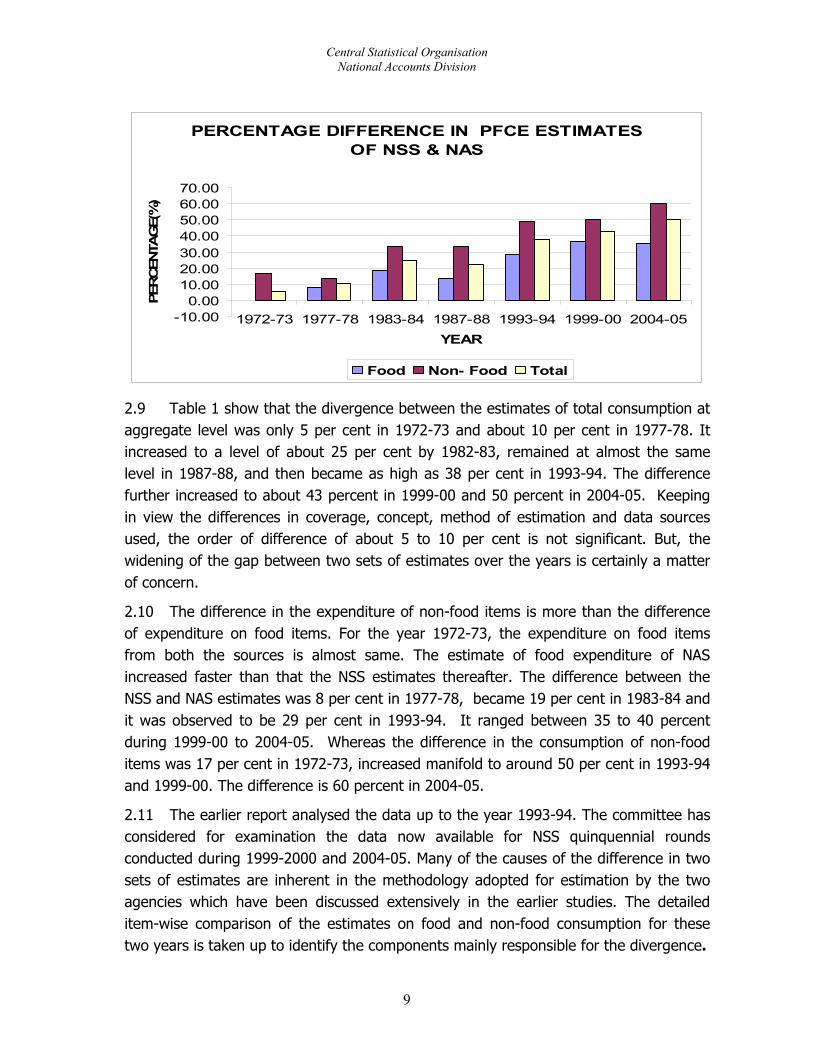
2.9 Table 1 show that the divergence between the estimates of total consumption at aggregate level was only 5 per cent in 1972-73 and about 10 per cent in 1977-78. It increased to a level of about 25 per cent by 1982-83, remained at almost the same level in 1987-88, and then became as high as 38 per cent in 1993-94. The difference further increased to about 43 percent in 1999-00 and 50 percent in 2004-05. Keeping in view the differences in coverage, concept, method of estimation and data sources used, the order of difference of about 5 to 10 per cent is not significant. But, the widening of the gap between two sets of estimates over the years is certainly a matter of concern.
2.10 The difference in the expenditure of non-food items is more than the difference of expenditure on food items. For the year 1972-73, the expenditure on food items from both the sources is almost same. The estimate of food expenditure of NAS increased faster than that the NSS estimates thereafter. The difference between the NSS and NAS estimates was 8 per cent in 1977-78, became 19 per cent in 1983-84 and it was observed to be 29 per cent in 1993-94. It ranged between 35 to 40 percent during 1999-00 to 2004-05. Whereas the difference in the consumption of non-food items was 17 per cent in 1972-73, increased manifold to around 50 per cent in 1993-94 and 1999-00. The difference is 60 percent in 2004-05.
2.11 The earlier report analysed the data up to the year 1993-94. The committee has considered for examination the data now available for NSS quinquennial rounds conducted during 1999-2000 and 2004-05. Many of the causes of the difference in two sets of estimates are inherent in the methodology adopted for estimation by the two agencies which have been discussed extensively in the earlier studies. The detailed item-wise comparison of the estimates on food and non-food consumption for these two years is taken up to identify the components mainly responsible for the divergence.
Central Statistical Organisation National Accounts Division
10
CHAPTER III
REASONS FOR DIVERGENCE IN TWO SET OF ESTIMATES
3.1 The comparison of the two sets of estimates is constrained by certain differences inherent in the approaches adopted by the two agencies. The following is a brief discussion on the identified possible reasons for differences that are inherent in the methods of estimation used by the two agencies.
3.2 Coverage: As observed in the earlier studies, the Household Consumer Expenditure Surveys (HCES) of the NSSO excludes the houseless and the institutional population like the inhabitants of orphanages, prisons and hospitals, while the consumption of these persons are included in NAS estimate. Also included in the NAS estimate is the consumption expenditure of NPISHs, which are not explicitly covered by the HCES. Nevertheless, the NSS estimates of average per capita consumption expenditure, in conjunction with the estimated total population of the country, provides a valid aggregate estimate of the consumption expenditure of the households, despite being subject to the limitation of non-coverage of the houseless and the institutional population in the HCES. So far as the comparability between the two sets of estimates is concerned, this limitation is virtually of no consequence, as the proportion of the houseless and the institutional population in the total population is negligibly small. As for the consumption expenditure of NPISHs, it is not possible to derive any reasonable estimate of its share in the NAS estimate of PFCE. Since the activities of NPISHs have increased significantly in the recent years, it could be one of the factors for widening of the gap.
3.3 Reference Time-frame: Since the production and consumption of goods, particularly of agricultural produce, are events usually separated in time by considerable gaps, whatever is produced during the agricultural year is not necessarily consumed during the same period, nor is the current year’s consumption drawn entirely from the current year’s production. For reasons such as these, the NAS estimates are strictly not comparable with the NSS estimates as the NSS survey period is generally an agricultural year, and the NSS estimates represent the actual consumption during the agricultural year. The comparability, however, should not be seriously affected if the difference in the output of food crops in two successive years is not significant. It may be seen from Table 2 below that the difference in food grains production in the years 1998-99 and 1999-2000 is not much but for major oilseeds and sugarcane, the output is significantly different in the two years. The difference is quite large in case of food-grain production in the years 2003-04 and 2004-05.

Central Statistical Organisation National Accounts Division
11
Table 2: Production of Food Grains, Oilseeds and Sugarcane during Agricultural Years 1998-99, 1999-00, 2003-04 & 2004-05 (Million tones )
Crop 1998-99 1999-00 2003-04 2004-05
Rice 86.08 89.68 88.53 83.13
Wheat 71.29 76.37 72.16 68.64
Coarse cereals 31.34 30.33 37.60 33.47
Pulses 14.91 13.42 14.91 13.13
Food Grains 203.62 209.8 213.2 198.37Nine major oilseeds 24.75 20.72 25.19 24.35
Sugarcane 288.72 299.32 233.86 237.08
Source: Agricultural Statistics at a Glance, 2006, Directorate of Economics and Statistics, Ministry of Agriculture.
3.4 Unmatched Classification Schemes: The classification schemes for grouping commodities and services adopted by the two agencies both at the data collection and compilation stages as well as those used for presentation of results differ considerably in many respects. This makes item-wise comparison difficult. Prior to the 1980-81 series of the NAS, the classification schemes differed in respect of expenditure on ‘hotels & restaurants’, which was classified under non-food consumer services in the NAS, while it was included in the food group in the NSS estimate. From1980-81 series onwards, the consumption expenditure on ‘hotels & restaurants’ is classified in the ‘food’ group in the NAS as well. Yet, the classification schemes used by the two agencies at present differ in a number of other respects. For example:
In the NAS, the ‘rice’ retained by the farmers for their self-consumption is put entirely under ‘rice’ consumption, whether or not a part of it is converted into rice products. In contrast, rice products like murmure, cheera / poha and khoi are not included in the NSS estimate of ‘rice’, when they are made out of ‘home-grown stock’.
Expenditure on purchase and repairs of transport equipment is classified under ‘durables’ in the NSS estimates, while it is included in the transport-group in the NAS estimates of PFCE.
The expenditure on cooked food given to the domestic servants (whether full-time or part-time) is included in the ‘food’ group in the NSS. In the NAS, on the other hand, all payments (whether in cash or kind) made to the domestic help are, in principle, taken as expenses incurred for consumption of ‘personal services’.
3.5 Treatment of Cooked Meals: The value of the “cooked meals” served to a domestic help by an employer household forms a part of ‘food’ consumption of the employer household in NSS. On the other hand, in NAS estimate it forms consumption of ‘services’ for the employer households. But, in order to avoid double counting of the

Central Statistical Organisation National Accounts Division
12
expenditure on ‘food’, the value of ‘cooked meals’ is recorded as consumption expenditure of only the employer household in the HCES. As a result, in the aggregate, the HCES fails to include the part of the value of services provided by domestic helps that is remunerated for by “cooked meals”. Thus, the NSS method of collection of data on “cooked meals” served to domestic helps as part of their remuneration leads to underestimation of the total value of services consumed by the households, and thus the total consumption expenditure incurred by them.
3.6 Notional Components in NAS Estimate of PFCE: In NAS estimates of rent on dwellings, all imputed rentals of owner-occupied dwellings while in NSS the rent actually paid is taken. This accounts for a substantial part of the divergence observed between the two estimates. The Financial Intermediation Services Indirectly Measured (FISIM) is another such notional component in the NAS estimate. This is being included in PFCE since the 1980-81 series of national accounts. Inclusion of imputed rentals of owner-occupied dwellings and FISIM in the NAS estimate of private consumption is as per the internationally accepted system of national accounts. Table 3 illustrates the affect of these notional components in the NAS estimates of PFCE. After adjusting NSS estimates for these components, the discrepancy between two sets of estimates has come down by 7 to 9 percentage points.
Table 3: Comparison between the NSS estimates and NAS estimates adjusted for rent on dwellings and FISIM (Rs. crore)
Year Un-adj. NSS
NAS % diff. Cols. (2) & (3)
Imputed rentals
FISIM Adjusted NSS
% diff. Cols. (7) &
(3) (1) (2) (3) (4) (5) (6) (7) (8)
1983-84 109731 146084 -24.88 10478 758 120967 -17.19
1987-88 173765 224061 -22.45 15416 1513 190694 -14.89
1993-94 355771 574772 -38.10 37297 11,801 404869 -29.59
1999-00 716391 1257541 -43.03 68437 24672* 809500 -35.63
2004-05 931415 1873729 -50.29 101690 65395* 1098500 -41.37Note: 1. % Difference stands for (NSS – NAS) / NAS expressed in percentage.
2. * Figures include expenditure of life insurance and general insurance also.
Central Statistical Organisation National Accounts Division
13
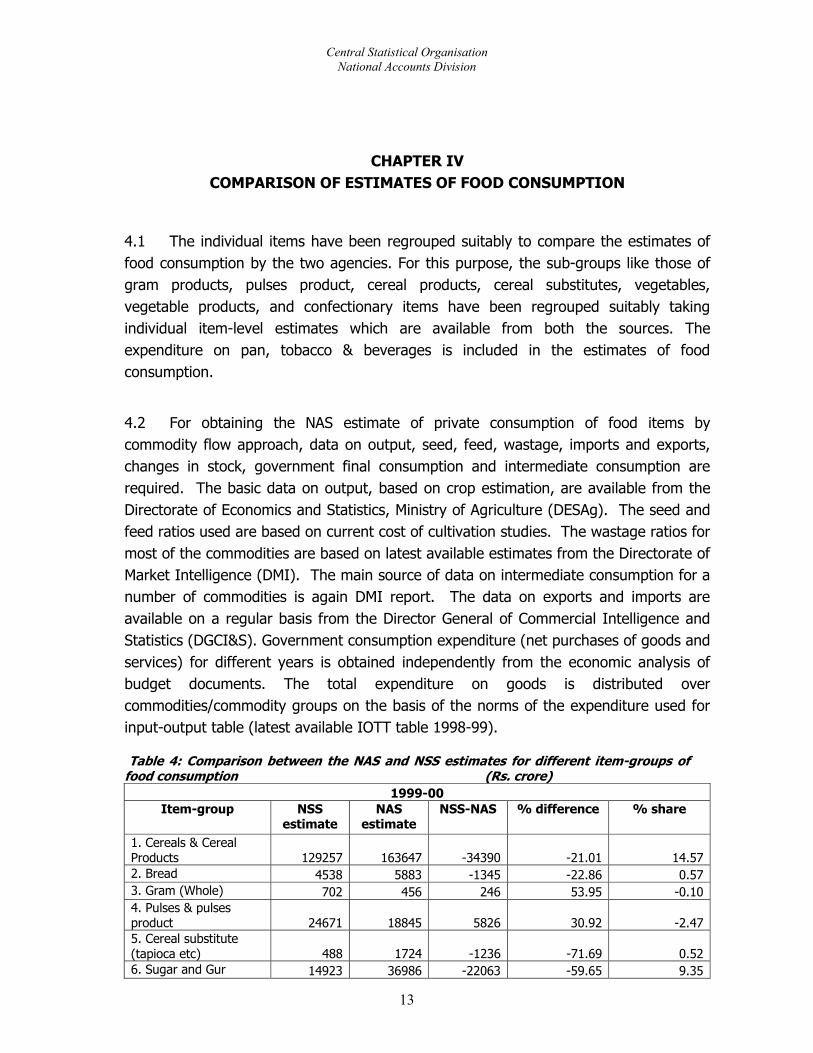
CHAPTER IV COMPARISON OF ESTIMATES OF FOOD CONSUMPTION
4.1 The individual items have been regrouped suitably to compare the estimates of food consumption by the two agencies. For this purpose, the sub-groups like those of gram products, pulses product, cereal products, cereal substitutes, vegetables, vegetable products, and confectionary items have been regrouped suitably taking individual item-level estimates which are available from both the sources. The expenditure on pan, tobacco & beverages is included in the estimates of food consumption.
4.2 For obtaining the NAS estimate of private consumption of food items by commodity flow approach, data on output, seed, feed, wastage, imports and exports, changes in stock, government final consumption and intermediate consumption are required. The basic data on output, based on crop estimation, are available from the Directorate of Economics and Statistics, Ministry of Agriculture (DESAg). The seed and feed ratios used are based on current cost of cultivation studies. The wastage ratios for most of the commodities are based on latest available estimates from the Directorate of Market Intelligence (DMI). The main source of data on intermediate consumption for a number of commodities is again DMI report. The data on exports and imports are available on a regular basis from the Director General of Commercial Intelligence and Statistics (DGCI&S). Government consumption expenditure (net purchases of goods and services) for different years is obtained independently from the economic analysis of budget documents. The total expenditure on goods is distributed over commodities/commodity groups on the basis of the norms of the expenditure used for input-output table (latest available IOTT table 1998-99). Table 4: Comparison between the NAS and NSS estimates for different item-groups of food consumption (Rs. crore)
1999-00 Item-group NSS
estimate NAS
estimate NSS-NAS % difference % share
1. Cereals & Cereal Products 129257 163647 -34390 -21.01 14.572. Bread 4538 5883 -1345 -22.86 0.573. Gram (Whole) 702 456 246 53.95 -0.104. Pulses & pulses product 24671 18845 5826 30.92 -2.475. Cereal substitute (tapioca etc) 488 1724 -1236 -71.69 0.526. Sugar and Gur 14923 36986 -22063 -59.65 9.35
Central Statistical Organisation National Accounts Division
14
1999-00 Item-group NSS
estimate NAS
estimate NSS-NAS % difference % share
7. Milk & milk products 62510 103681 -41171 -39.71 17.448. Edible oils & oilseeds 25872 30518 -4646 -15.22 1.979. Meat, egg & fish 23247 50649 -27402 -54.10 11.6110. Fruits, vegetables & their products 56649 122347 -65698 -53.70 27.8311. Salt 1426 1426 0 0.00 0.0012. Spices 16884 17715 -831 -4.69 0.3513. Non-alcoholic Beverages 10738 15310 -4572 -29.86 1.9414. Processed / Other food 4639 6914 -2275 -32.90 0.9615. Pan 2420 3333 -913 -27.39 0.3916. Tobacco 9441 34395 -24954 -72.55 10.5717. Alcoholic beverages and other intoxicants
5931 10247 -4316 -42.12 1.83
18. Hotel & restaurant / cooked meals
16582 22935 -6353 -27.70 2.69
Food: Total 410918 647011 -236093 -36.49 100.002004-05
Item-group NSS
estimate NAS
estimate NSS-NAS % difference % share
1. Cereals & Cereal Products 133550 114479 19071 16.66 -7.302. Bread 6100 5657 443 7.83 -0.173. Gram (Whole) 854 434 420 96.77 -0.164. Pulses & pulses product 25049 19399 5650 29.13 -2.165. Cereal substitute (tapioca etc) 566 1756 -1190 -67.77 0.466. Sugar and Gur 18549 33547 -14998 -44.71 5.747. Milk & milk products 76334 127114 -50780 -39.95 19.428. Edible oils & oilseeds 38753 54367 -15614 -28.72 5.979. Meat, egg & fish 28395 68999 -40604 -58.85 15.5310. Fruits, vegetables & their products 73126 165486 -92360 -55.81 35.3311. Salt 1605 1382 223 16.14 -0.0912. Spices 14378 20080 -5702 -28.40 2.1813. Non-alcoholic Beverages 11409 28633 -17224 -60.15 6.5914. Processed / Other food 7779 14672 -6893 -46.98 2.6415. Pan 2576 5907 -3331 -56.39 1.2716. Tobacco 10971 19946 -8975 -45.00 3.4317. Alcoholic beverages and other intoxicants
7142 19987 -12845 -64.27 4.91
18. Hotel & restaurant / cooked meals
24053 40764 -16711 -40.99 6.39
Food: Total 481189 742609 -261420 -35.20 100.00

Central Statistical Organisation National Accounts Division
15
PERCENTAGE SHARE OF DIFFERENT ITEMS IN TOTAL DIVERGENCE OF FOOD GROUP- 1999-00
1. Cereals & CerealProducts2. Sugar and Gur
3. Milk & milk products
4. Meat, egg & fish
5. Fruits, vegetables &their products6. Tobacco
7. Others
PERCENTAGE SHARE OF DIERENT ITEMS IN TOTAL DIVERGENCE OF FOOD GROUP- 2004-05
1. Cereals & CerealProducts2. Sugar and Gur
3. Milk & milk products
4. Meat, egg & fish
5. Fruits, vegetables & theirproducts6. Tobacco
7. Others
Central Statistical Organisation National Accounts Division
16
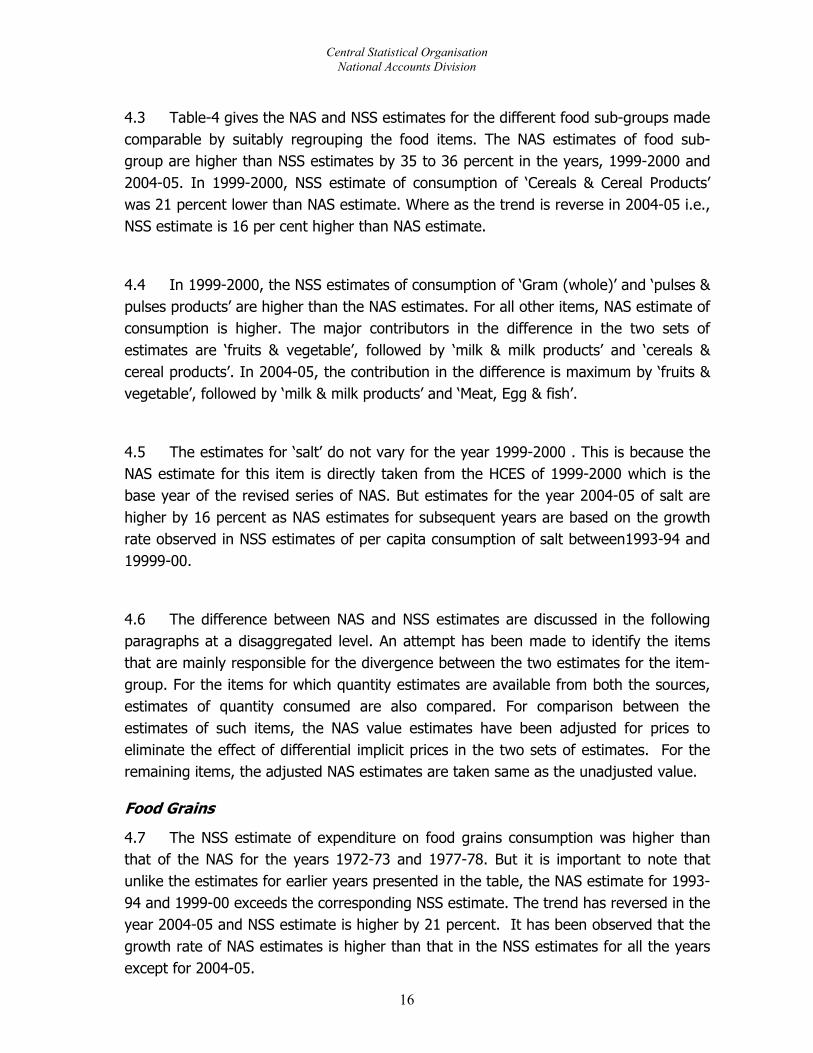
4.3 Table-4 gives the NAS and NSS estimates for the different food sub-groups made comparable by suitably regrouping the food items. The NAS estimates of food sub-group are higher than NSS estimates by 35 to 36 percent in the years, 1999-2000 and 2004-05. In 1999-2000, NSS estimate of consumption of ‘Cereals & Cereal Products’ was 21 percent lower than NAS estimate. Where as the trend is reverse in 2004-05 i.e., NSS estimate is 16 per cent higher than NAS estimate.
4.4 In 1999-2000, the NSS estimates of consumption of ‘Gram (whole)’ and ‘pulses & pulses products’ are higher than the NAS estimates. For all other items, NAS estimate of consumption is higher. The major contributors in the difference in the two sets of estimates are ‘fruits & vegetable’, followed by ‘milk & milk products’ and ‘cereals & cereal products’. In 2004-05, the contribution in the difference is maximum by ‘fruits & vegetable’, followed by ‘milk & milk products’ and ‘Meat, Egg & fish’.
4.5 The estimates for ‘salt’ do not vary for the year 1999-2000 . This is because the NAS estimate for this item is directly taken from the HCES of 1999-2000 which is the base year of the revised series of NAS. But estimates for the year 2004-05 of salt are higher by 16 percent as NAS estimates for subsequent years are based on the growth rate observed in NSS estimates of per capita consumption of salt between1993-94 and 19999-00.
4.6 The difference between NAS and NSS estimates are discussed in the following paragraphs at a disaggregated level. An attempt has been made to identify the items that are mainly responsible for the divergence between the two estimates for the item-group. For the items for which quantity estimates are available from both the sources, estimates of quantity consumed are also compared. For comparison between the estimates of such items, the NAS value estimates have been adjusted for prices to eliminate the effect of differential implicit prices in the two sets of estimates. For the remaining items, the adjusted NAS estimates are taken same as the unadjusted value.
Food Grains
4.7 The NSS estimate of expenditure on food grains consumption was higher than that of the NAS for the years 1972-73 and 1977-78. But it is important to note that unlike the estimates for earlier years presented in the table, the NAS estimate for 1993-94 and 1999-00 exceeds the corresponding NSS estimate. The trend has reversed in the year 2004-05 and NSS estimate is higher by 21 percent. It has been observed that the growth rate of NAS estimates is higher than that in the NSS estimates for all the years except for 2004-05.

Central Statistical Organisation National Accounts Division
17
Table 5: Difference between the NSS and NAS Estimates of Consumption of Food grains in different Years (Rs. Crore)
Year NSS NAS Difference for the group
% Difference Difference for "all food"
1972-73 13418 10362 3056 29.49 5.43
1977-78 19302 17560 1742 9.92 -4.34
1993-94 85943 90467 -4524 -5.00 -28.92
1999-00 157644 184337 -26693 -14.48 -36.49
2004-05 163648 135647 28001 20.64 -35.20
Note: Food grain is estimated as cereals +pulses-biscuits(estimated from the ratio of biscuits in 1993-94 in bread and biscuit )
4.8 Since the sub-groups ‘cereals & cereal products’ and ‘pulses & pulses products’ have major shares in total consumption expenditure on food, it is necessary to undertake a disaggregated-level comparison of NAS and NSS estimates of cereals and pulses consumption. The following paragraphs contain a detailed comparison of the quantity and value estimates of consumption of individual constituents of food grains in 1999-00 and 2004-05. Besides the cereals and pulses, food grains comprise cereals and pulses products and whole grams. Breads produced in bakeries, being principally a wheat product, are also included in this group of food items.
Cereals and Cereal Products
4.9 Table 6 gives a comparison of the NSS and NAS estimates of consumption of cereals and its products for 1999-00 and 2004-05. It also provides comparable estimates for the item ‘gram (whole grain)’ and ‘bread’. Both the NAS and NSS value estimates for the items in the rice and wheat groups represent the expenditure actually incurred on the items. The quantity available from the Public Distribution System (PDS) is evaluated at the administered price in the NAS, while the cost actually paid by the households for the quantity obtained from the PDS are recorded in the HCES. Thus, the implicit prices that can be worked out from the NAS and NSS estimates of value and quantity given in the table represent the (weighted) average of the open-market and administered prices. For the year 2004-05, the implicit prices derived from the NAS estimates for all the cereal-group, except wheat and its products, small millets and gram (whole) are higher than the respective implicit prices derived from the NSS estimates. (A comparison of implicit prices derived from the NAS and NSS estimates is given in Appendix I for different items). The NAS value estimates adjusted by NSS implicit prices are given in the table along with the unadjusted values. The following observations emerge from the estimates presented in Table- 6:
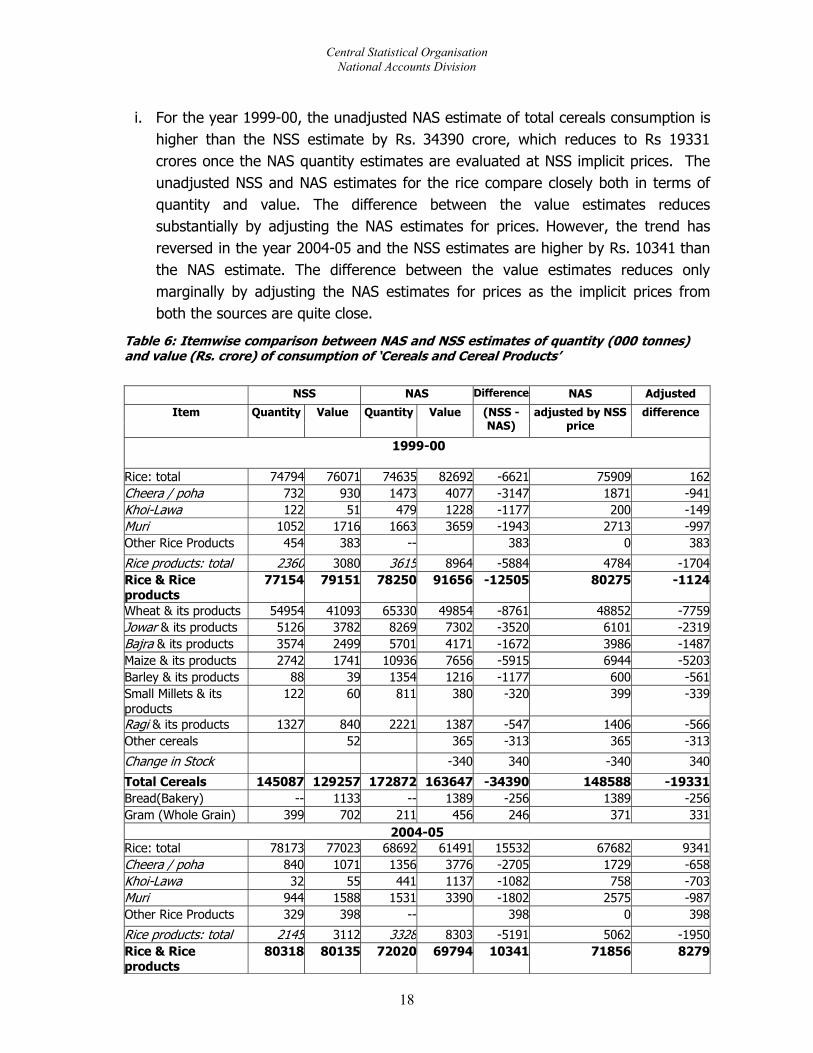
Central Statistical Organisation National Accounts Division
18
i. For the year 1999-00, the unadjusted NAS estimate of total cereals consumption is higher than the NSS estimate by Rs. 34390 crore, which reduces to Rs 19331 crores once the NAS quantity estimates are evaluated at NSS implicit prices. The unadjusted NSS and NAS estimates for the rice compare closely both in terms of quantity and value. The difference between the value estimates reduces substantially by adjusting the NAS estimates for prices. However, the trend has reversed in the year 2004-05 and the NSS estimates are higher by Rs. 10341 than the NAS estimate. The difference between the value estimates reduces only marginally by adjusting the NAS estimates for prices as the implicit prices from both the sources are quite close.
Table 6: Itemwise comparison between NAS and NSS estimates of quantity (000 tonnes) and value (Rs. crore) of consumption of ‘Cereals and Cereal Products’
NSS NAS Difference NAS Adjusted
Item Quantity Value Quantity Value (NSS - NAS)
adjusted by NSS price
difference
1999-00
Rice: total 74794 76071 74635 82692 -6621 75909 162Cheera / poha 732 930 1473 4077 -3147 1871 -941Khoi-Lawa 122 51 479 1228 -1177 200 -149Muri 1052 1716 1663 3659 -1943 2713 -997Other Rice Products 454 383 -- 383 0 383
Rice products: total 2360 3080 3615 8964 -5884 4784 -1704Rice & Rice products
77154 79151 78250 91656 -12505 80275 -1124
Wheat & its products 54954 41093 65330 49854 -8761 48852 -7759Jowar & its products 5126 3782 8269 7302 -3520 6101 -2319Bajra & its products 3574 2499 5701 4171 -1672 3986 -1487Maize & its products 2742 1741 10936 7656 -5915 6944 -5203Barley & its products 88 39 1354 1216 -1177 600 -561Small Millets & its products
122 60 811 380 -320 399 -339
Ragi & its products 1327 840 2221 1387 -547 1406 -566Other cereals 52 365 -313 365 -313
Change in Stock -340 340 -340 340
Total Cereals 145087 129257 172872 163647 -34390 148588 -19331Bread(Bakery) -- 1133 -- 1389 -256 1389 -256Gram (Whole Grain) 399 702 211 456 246 371 331
2004-05 Rice: total 78173 77023 68692 61491 15532 67682 9341Cheera / poha 840 1071 1356 3776 -2705 1729 -658Khoi-Lawa 32 55 441 1137 -1082 758 -703Muri 944 1588 1531 3390 -1802 2575 -987Other Rice Products 329 398 -- 398 0 398
Rice products: total 2145 3112 3328 8303 -5191 5062 -1950Rice & Rice products
80318 80135 72020 69794 10341 71856 8279
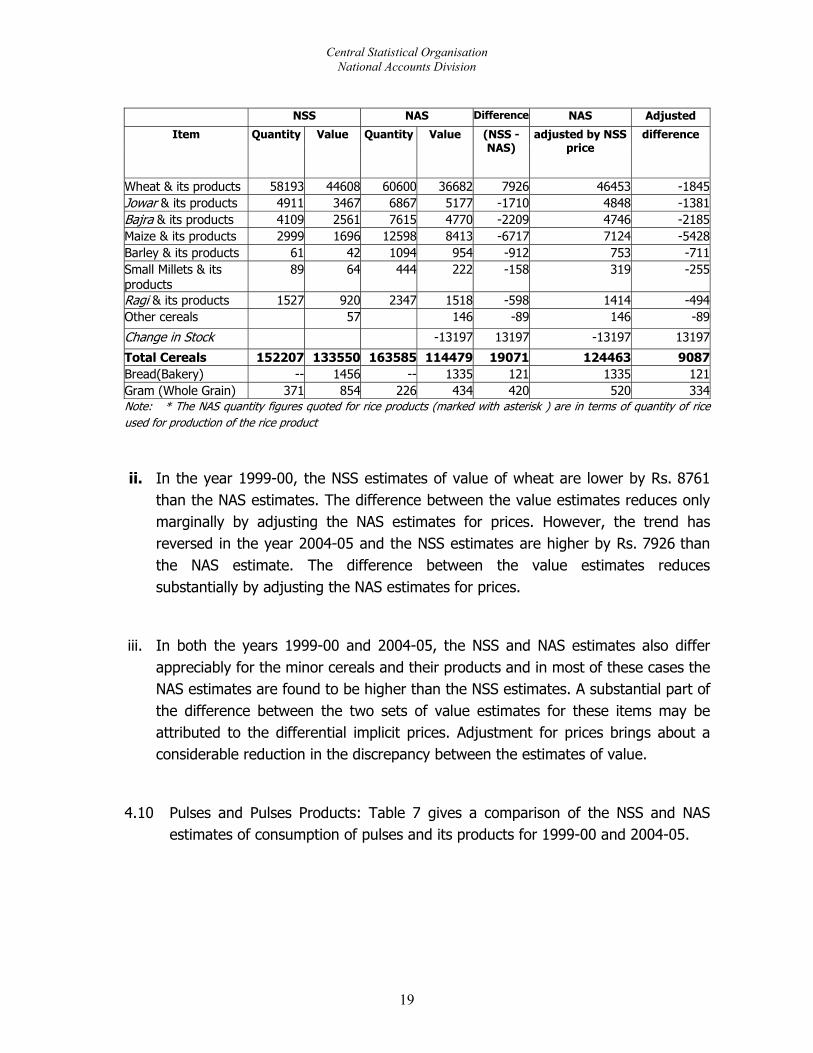
Central Statistical Organisation National Accounts Division
19
NSS NAS Difference NAS Adjusted
Item Quantity Value Quantity Value (NSS - NAS)
adjusted by NSS price
difference
Wheat & its products 58193 44608 60600 36682 7926 46453 -1845Jowar & its products 4911 3467 6867 5177 -1710 4848 -1381Bajra & its products 4109 2561 7615 4770 -2209 4746 -2185Maize & its products 2999 1696 12598 8413 -6717 7124 -5428Barley & its products 61 42 1094 954 -912 753 -711Small Millets & its products
89 64 444 222 -158 319 -255
Ragi & its products 1527 920 2347 1518 -598 1414 -494Other cereals 57 146 -89 146 -89
Change in Stock -13197 13197 -13197 13197
Total Cereals 152207 133550 163585 114479 19071 124463 9087Bread(Bakery) -- 1456 -- 1335 121 1335 121Gram (Whole Grain) 371 854 226 434 420 520 334Note: * The NAS quantity figures quoted for rice products (marked with asterisk ) are in terms of quantity of rice used for production of the rice product
ii. In the year 1999-00, the NSS estimates of value of wheat are lower by Rs. 8761 than the NAS estimates. The difference between the value estimates reduces only marginally by adjusting the NAS estimates for prices. However, the trend has reversed in the year 2004-05 and the NSS estimates are higher by Rs. 7926 than the NAS estimate. The difference between the value estimates reduces substantially by adjusting the NAS estimates for prices.
iii. In both the years 1999-00 and 2004-05, the NSS and NAS estimates also differ appreciably for the minor cereals and their products and in most of these cases the NAS estimates are found to be higher than the NSS estimates. A substantial part of the difference between the two sets of value estimates for these items may be attributed to the differential implicit prices. Adjustment for prices brings about a considerable reduction in the discrepancy between the estimates of value.
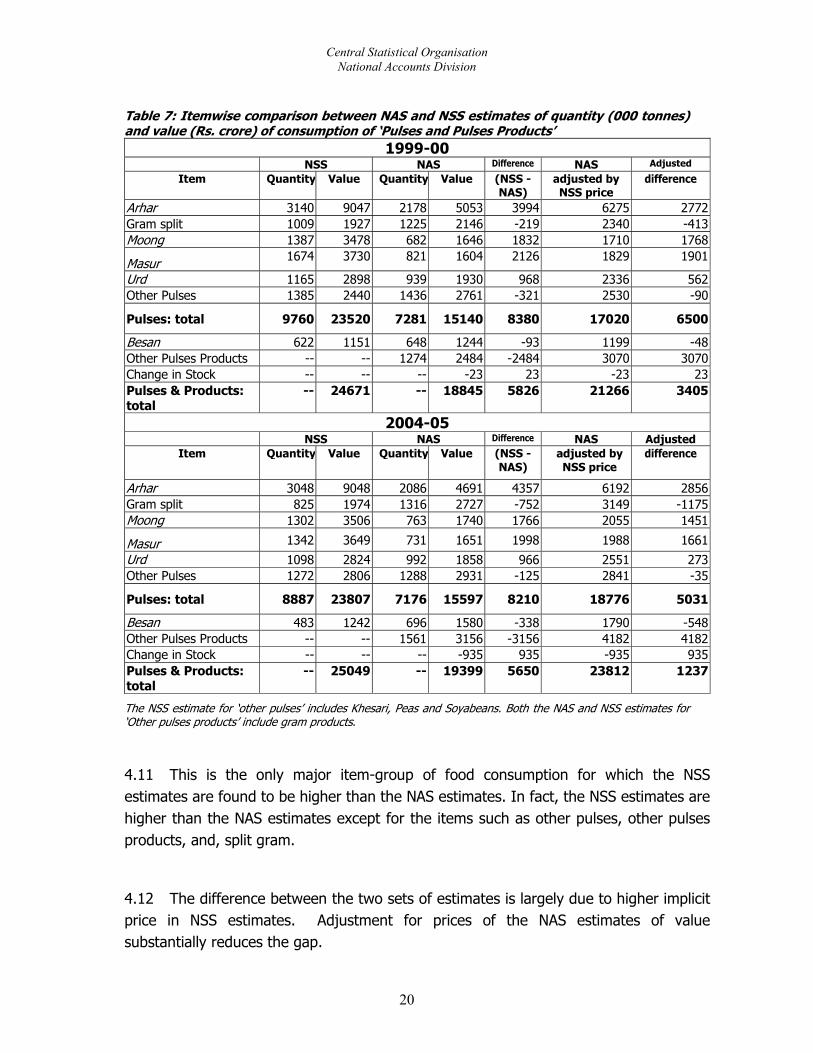
4.10 Pulses and Pulses Products: Table 7 gives a comparison of the NSS and NAS estimates of consumption of pulses and its products for 1999-00 and 2004-05.
Central Statistical Organisation National Accounts Division
20
Table 7: Itemwise comparison between NAS and NSS estimates of quantity (000 tonnes) and value (Rs. crore) of consumption of ‘Pulses and Pulses Products’
1999-00 NSS NAS Difference NAS Adjusted
Item Quantity Value Quantity Value (NSS - NAS)
adjusted by NSS price
difference
Arhar 3140 9047 2178 5053 3994 6275 2772Gram split 1009 1927 1225 2146 -219 2340 -413Moong 1387 3478 682 1646 1832 1710 1768
Masur 1674 3730 821 1604 2126 1829 1901
Urd 1165 2898 939 1930 968 2336 562Other Pulses 1385 2440 1436 2761 -321 2530 -90
Pulses: total 9760 23520 7281 15140 8380 17020 6500
Besan 622 1151 648 1244 -93 1199 -48Other Pulses Products -- -- 1274 2484 -2484 3070 3070Change in Stock -- -- -- -23 23 -23 23Pulses & Products: total
-- 24671 -- 18845 5826 21266 3405
2004-05 NSS NAS Difference NAS Adjusted
Item Quantity Value Quantity Value (NSS - NAS)
adjusted by NSS price
difference
Arhar 3048 9048 2086 4691 4357 6192 2856Gram split 825 1974 1316 2727 -752 3149 -1175Moong 1302 3506 763 1740 1766 2055 1451
Masur 1342 3649 731 1651 1998 1988 1661Urd 1098 2824 992 1858 966 2551 273Other Pulses 1272 2806 1288 2931 -125 2841 -35
Pulses: total 8887 23807 7176 15597 8210 18776 5031
Besan 483 1242 696 1580 -338 1790 -548Other Pulses Products -- -- 1561 3156 -3156 4182 4182Change in Stock -- -- -- -935 935 -935 935Pulses & Products: total
-- 25049 -- 19399 5650 23812 1237
The NSS estimate for ‘other pulses’ includes Khesari, Peas and Soyabeans. Both the NAS and NSS estimates for ‘Other pulses products’ include gram products.
4.11 This is the only major item-group of food consumption for which the NSS estimates are found to be higher than the NAS estimates. In fact, the NSS estimates are higher than the NAS estimates except for the items such as other pulses, other pulses products, and, split gram.
4.12 The difference between the two sets of estimates is largely due to higher implicit price in NSS estimates. Adjustment for prices of the NAS estimates of value substantially reduces the gap.
Central Statistical Organisation National Accounts Division
21
4.13 There is another reason for which the NAS value estimates for pulses are affected by a downward bias. The mark-ups applied on ex-farm prices of grains retained by the producers, particularly for arhar, moong, urad and masur, to arrive at the value of dal appear to be low. On the other hand, both the NAS quantity and value estimates without doubt suffer from an upward bias, as the present method makes no provision for intermediate consumption of the dals in hotels and restaurants or in other industries. Sugar and Gur
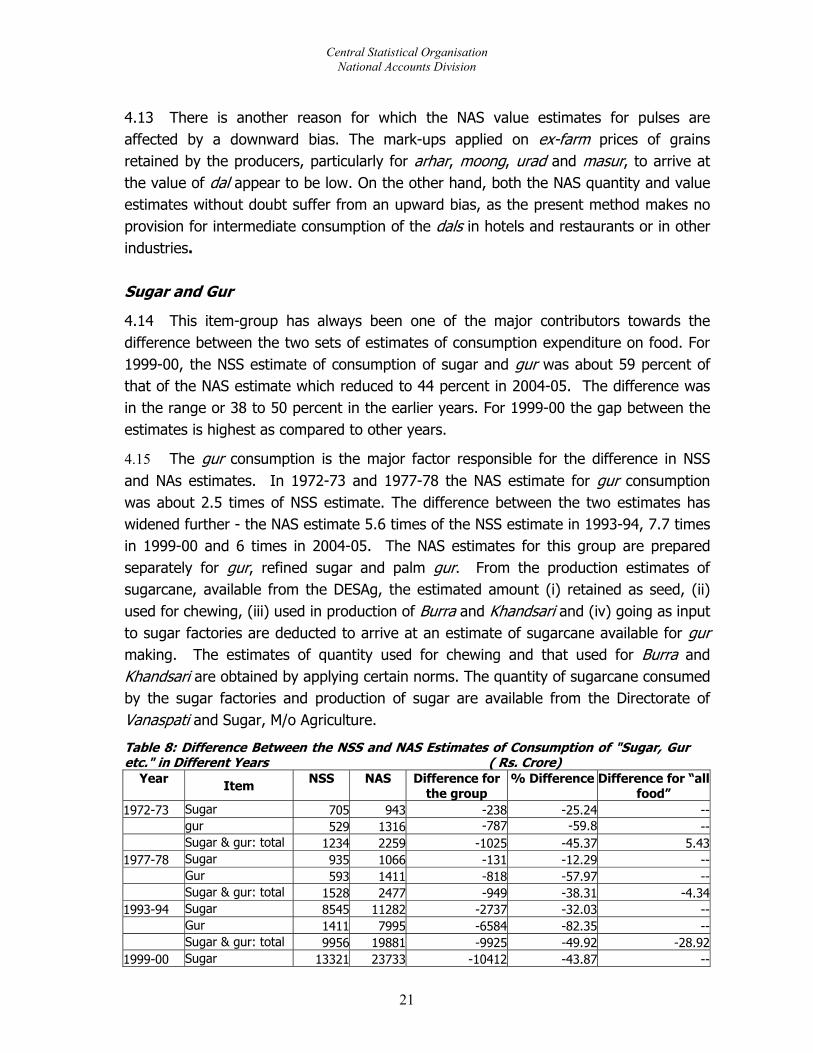
4.14 This item-group has always been one of the major contributors towards the difference between the two sets of estimates of consumption expenditure on food. For 1999-00, the NSS estimate of consumption of sugar and gur was about 59 percent of that of the NAS estimate which reduced to 44 percent in 2004-05. The difference was in the range or 38 to 50 percent in the earlier years. For 1999-00 the gap between the estimates is highest as compared to other years.
4.15 The gur consumption is the major factor responsible for the difference in NSS and NAs estimates. In 1972-73 and 1977-78 the NAS estimate for gur consumption was about 2.5 times of NSS estimate. The difference between the two estimates has widened further - the NAS estimate 5.6 times of the NSS estimate in 1993-94, 7.7 times in 1999-00 and 6 times in 2004-05. The NAS estimates for this group are prepared separately for gur, refined sugar and palm gur. From the production estimates of sugarcane, available from the DESAg, the estimated amount (i) retained as seed, (ii) used for chewing, (iii) used in production of Burra and Khandsari and (iv) going as input to sugar factories are deducted to arrive at an estimate of sugarcane available for gur making. The estimates of quantity used for chewing and that used for Burra and Khandsari are obtained by applying certain norms. The quantity of sugarcane consumed by the sugar factories and production of sugar are available from the Directorate of Vanaspati and Sugar, M/o Agriculture.
Table 8: Difference Between the NSS and NAS Estimates of Consumption of "Sugar, Gur etc." in Different Years ( Rs. Crore)
Year Item NSS NAS Difference for the group
% Difference Difference for “all food”
1972-73 Sugar 705 943 -238 -25.24 -- gur 529 1316 -787 -59.8 -- Sugar & gur: total 1234 2259 -1025 -45.37 5.431977-78 Sugar 935 1066 -131 -12.29 -- Gur 593 1411 -818 -57.97 -- Sugar & gur: total 1528 2477 -949 -38.31 -4.341993-94 Sugar 8545 11282 -2737 -32.03 -- Gur 1411 7995 -6584 -82.35 -- Sugar & gur: total 9956 19881 -9925 -49.92 -28.921999-00 Sugar 13321 23733 -10412 -43.87 --
Central Statistical Organisation National Accounts Division
22
Year Item NSS NAS Difference for the group
% Difference Difference for “all food”
Gur 1602 12335 -10733 -87.01 -- Sugar & gur: total 14923 36556 -21633 -59.18 -36.492004-05 Sugar 16779 26813 -10034 -37.42 -- Gur 1770 10780 -9010 -83.58 -- Sugar & gur: total 18549 33125 -14576 -44.00 -35.20Source: Same as those for Table 5.
Note: Total of sugar & gur does not tally with table 4 and Annexure-III as the NAS estimates excludes sugarcane.
4.16 The reasons for high difference between NAS and NSS estimates of sugar and gur consumption are (i) low ratio of intermediate consumption of gur and sugar used for deriving the NAS estimates, (ii) under-reporting of consumption of sugar and gur in the HCES and (iii) overestimation of sugarcane production. The last two reasons appear to be less likely. It is hard to find a definite reason for under-reporting of sugar or gur consumption in the HCES. Likewise, the regular crop reporting system, which covers sugarcane as a principal crop, is not expected to produce overestimates of sugarcane production consistently over the years. Thus, it appears that taking 5 per cent of gur and sugar production as intermediate consumption is unrealistic. Milk and Milk Products
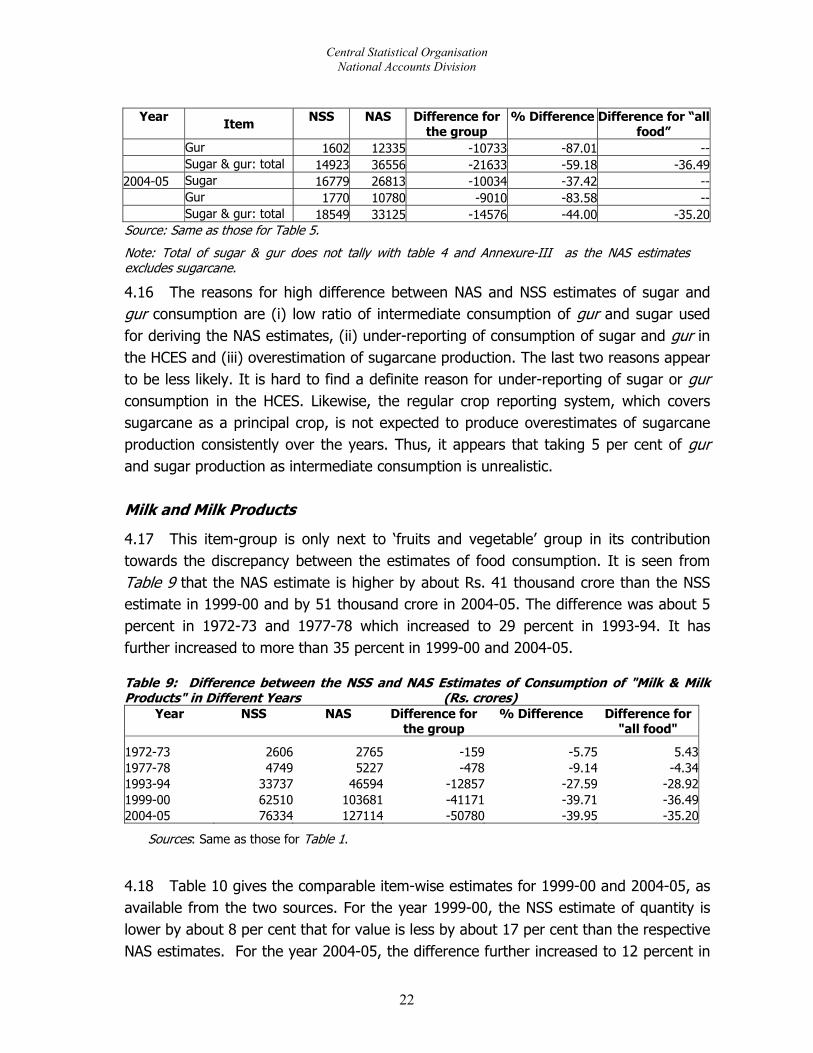
4.17 This item-group is only next to ‘fruits and vegetable’ group in its contribution towards the discrepancy between the estimates of food consumption. It is seen from Table 9 that the NAS estimate is higher by about Rs. 41 thousand crore than the NSS estimate in 1999-00 and by 51 thousand crore in 2004-05. The difference was about 5 percent in 1972-73 and 1977-78 which increased to 29 percent in 1993-94. It has further increased to more than 35 percent in 1999-00 and 2004-05.
Table 9: Difference between the NSS and NAS Estimates of Consumption of "Milk & Milk Products" in Different Years (Rs. crores)
Year NSS NAS Difference for the group
% Difference Difference for "all food"
1972-73 2606 2765 -159 -5.75 5.431977-78 4749 5227 -478 -9.14 -4.341993-94 33737 46594 -12857 -27.59 -28.921999-00 62510 103681 -41171 -39.71 -36.492004-05 76334 127114 -50780 -39.95 -35.20
Sources: Same as those for Table 1.
4.18 Table 10 gives the comparable item-wise estimates for 1999-00 and 2004-05, as available from the two sources. For the year 1999-00, the NSS estimate of quantity is lower by about 8 per cent that for value is less by about 17 per cent than the respective NAS estimates. For the year 2004-05, the difference further increased to 12 percent in
Central Statistical Organisation National Accounts Division
23
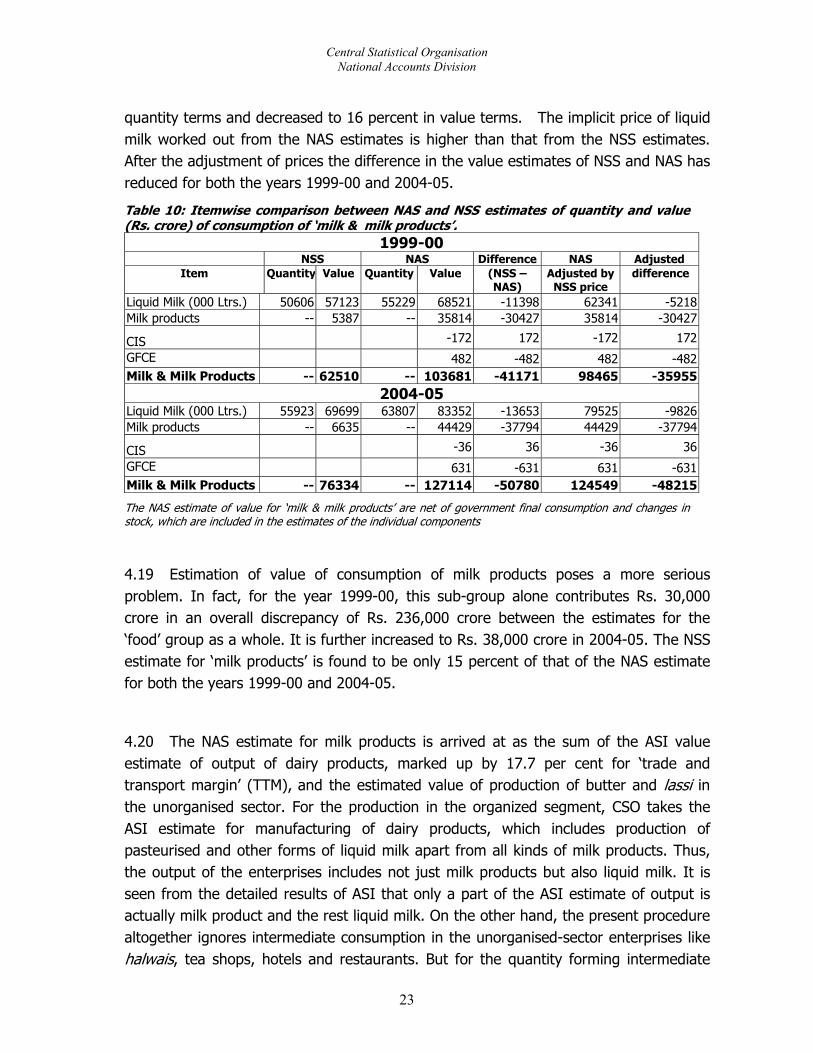
quantity terms and decreased to 16 percent in value terms. The implicit price of liquid milk worked out from the NAS estimates is higher than that from the NSS estimates. After the adjustment of prices the difference in the value estimates of NSS and NAS has reduced for both the years 1999-00 and 2004-05.
Table 10: Itemwise comparison between NAS and NSS estimates of quantity and value (Rs. crore) of consumption of ‘milk & milk products’.
1999-00 NSS NAS Difference NAS Adjusted
Item Quantity Value
Quantity Value
(NSS – NAS)
Adjusted by NSS price
difference
Liquid Milk (000 Ltrs.) 50606 57123 55229 68521 -11398 62341 -5218Milk products -- 5387 -- 35814 -30427 35814 -30427
CIS -172 172 -172 172
GFCE 482 -482 482 -482Milk & Milk Products -- 62510 -- 103681 -41171 98465 -35955
2004-05 Liquid Milk (000 Ltrs.) 55923 69699 63807 83352 -13653 79525 -9826Milk products -- 6635 -- 44429 -37794 44429 -37794
CIS -36 36 -36 36
GFCE 631 -631 631 -631Milk & Milk Products -- 76334 -- 127114 -50780 124549 -48215
The NAS estimate of value for ‘milk & milk products’ are net of government final consumption and changes in stock, which are included in the estimates of the individual components
4.19 Estimation of value of consumption of milk products poses a more serious problem. In fact, for the year 1999-00, this sub-group alone contributes Rs. 30,000 crore in an overall discrepancy of Rs. 236,000 crore between the estimates for the ‘food’ group as a whole. It is further increased to Rs. 38,000 crore in 2004-05. The NSS estimate for ‘milk products’ is found to be only 15 percent of that of the NAS estimate for both the years 1999-00 and 2004-05.
4.20 The NAS estimate for milk products is arrived at as the sum of the ASI value estimate of output of dairy products, marked up by 17.7 per cent for ‘trade and transport margin’ (TTM), and the estimated value of production of butter and lassi in the unorganised sector. For the production in the organized segment, CSO takes the ASI estimate for manufacturing of dairy products, which includes production of pasteurised and other forms of liquid milk apart from all kinds of milk products. Thus, the output of the enterprises includes not just milk products but also liquid milk. It is seen from the detailed results of ASI that only a part of the ASI estimate of output is actually milk product and the rest liquid milk. On the other hand, the present procedure altogether ignores intermediate consumption in the unorganised-sector enterprises like halwais, tea shops, hotels and restaurants. But for the quantity forming intermediate

Central Statistical Organisation National Accounts Division
24
consumption in the organised manufacturing and that consumed as liquid milk by the households, the entire volume of milk coming to the market is assumed to be converted only into butter and lassi. Thus, the NAS estimate of consumption of liquid milk does not include pasteurised milk output of the factories at the one hand, and includes that which goes in as intermediate consumption in the unorganised sector enterprises on the other. The NAS estimate of liquid milk consumption is, therefore, subject to both upward and downward bias.
4.21 What appears likely from the above discussion is that the consumption of milk products is overestimated by the CSO. A part of the volume of milk assumed to be used for butter and lassi production may in fact be used as intermediate consumption in enterprises producing other commodities like sweetmeat, tea and coffee, hotel and restaurant services, consumption of which are estimated separately in the NAS. In addition, the entire output of ASI (NIC-201) is not milk product – a large part of it is in fact pasteurised milk or other forms of processed milk.
Edible oil and Oilseeds
4.22 The NSS estimate of consumption expenditure of ‘edible oils and oilseeds’ are lower than the NAS estimates by 15 per cent for 1999-00 and 29 percent for 2004-05. The difference was maximum (32 percent) in 1993-94. As seen from Table 11 the gap between the two estimates was lower in the earlier years.
Table 11: Difference between the NSS and NAS Estimates of Consumption of Edible Oil and oilseeds in different years (Rs. crore)
Year NSS NAS Difference for the group
% Difference Difference for "all food"
1972-73 1286 1465 -179 -12.22 5.431977-78 2243 3077 -834 -27.1 -4.341993-94 15674 23204 -7530 -32.45 -28.921999-00 25872 30518 -4646 -15.22 -36.492004-05 38753 54367 -15614 -28.72 -35.20
4.23 The estimates of edible oils for 1999-00 and 2004-05 have been re-grouped to make the estimates comparable. The oils less commonly used have been clubbed together in the ‘others’ category for the NSS estimates. These estimates thus arrived at from the two sources and the estimates of oilseeds are given in the Table 12.
4.24 For both the years 1999-00 and 2004-05, the estimates from the two sources are fairly close to each other for mustard oil. The major part of the big difference between
Central Statistical Organisation National Accounts Division
25
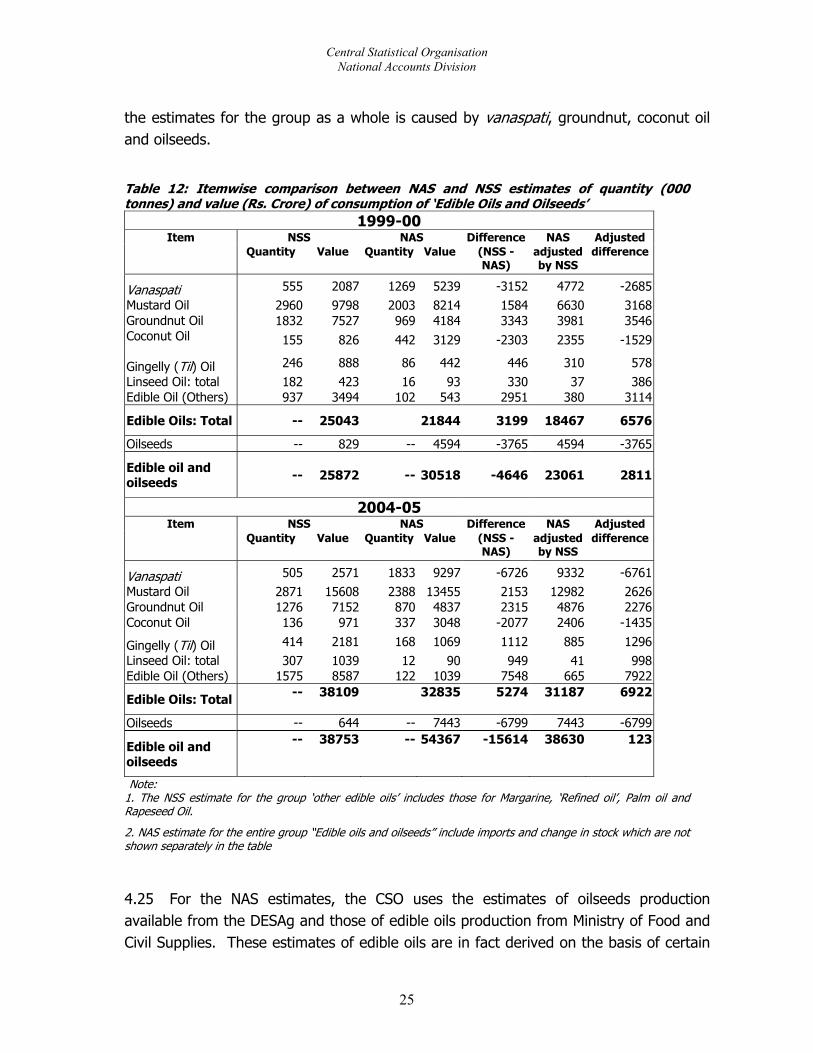
the estimates for the group as a whole is caused by vanaspati, groundnut, coconut oil and oilseeds.
Table 12: Itemwise comparison between NAS and NSS estimates of quantity (000 tonnes) and value (Rs. Crore) of consumption of ‘Edible Oils and Oilseeds’
1999-00 NSS NAS Difference NAS Adjusted Item
Quantity Value
Quantity Value
(NSS - NAS)
adjusted by NSS
difference
Vanaspati 555 2087 1269 5239 -3152 4772 -2685 Mustard Oil 2960 9798 2003 8214 1584 6630 3168 Groundnut Oil 1832 7527 969 4184 3343 3981 3546 Coconut Oil 155 826 442 3129 -2303 2355 -1529
Gingelly (Til) Oil 246 888 86 442 446 310 578 Linseed Oil: total 182 423 16 93 330 37 386 Edible Oil (Others) 937 3494 102 543 2951 380 3114
Edible Oils: Total -- 25043 21844 3199 18467 6576
Oilseeds -- 829 -- 4594 -3765 4594 -3765
Edible oil and oilseeds -- 25872 -- 30518 -4646 23061 2811
2004-05 NSS NAS Difference NAS Adjusted Item
Quantity Value
Quantity Value
(NSS - NAS)
adjusted by NSS
difference
Vanaspati 505 2571 1833 9297 -6726 9332 -6761 Mustard Oil 2871 15608 2388 13455 2153 12982 2626 Groundnut Oil 1276 7152 870 4837 2315 4876 2276 Coconut Oil 136 971 337 3048 -2077 2406 -1435
Gingelly (Til) Oil 414 2181 168 1069 1112 885 1296 Linseed Oil: total 307 1039 12 90 949 41 998 Edible Oil (Others) 1575 8587 122 1039 7548 665 7922
Edible Oils: Total -- 38109 32835 5274 31187 6922
Oilseeds -- 644 -- 7443 -6799 7443 -6799
Edible oil and oilseeds
-- 38753 -- 54367 -15614 38630 123
Note: 1. The NSS estimate for the group ‘other edible oils’ includes those for Margarine, ‘Refined oil’, Palm oil and Rapeseed Oil.
2. NAS estimate for the entire group “Edible oils and oilseeds” include imports and change in stock which are not shown separately in the table
4.25 For the NAS estimates, the CSO uses the estimates of oilseeds production available from the DESAg and those of edible oils production from Ministry of Food and Civil Supplies. These estimates of edible oils are in fact derived on the basis of certain

Central Statistical Organisation National Accounts Division
26
assumptions on utilisation of oilseeds for different purposes like seed, feed, waste etc. and oil extraction rates.
4.26 For deriving the NAS estimates, varying ratios of intermediate consumption are used for the edible oils, but for vanaspati no adjustment is made for its use in other industries. This appears to be an important reason for the difference between the estimates of vanaspati consumption, since it is used extensively in commercial establishments like halwais, hotels and restaurants. The estimates for individual oils are found to differ substantially in some cases. The difference is most pronounced for coconut oil, coconut oil and oilseeds. The estimates of both quantity and value differ widely. On adjusting the NAS estimates for price differential the gap in the difference narrows down significantly.
4.27 The difference in the estimates of consumption is most pronounced for the oilseeds. It may be noted that groundnuts used as such are not included here. Notwithstanding the possibility of underreporting in the NSS, the NAS estimate for oilseeds appears to be on the higher side, particularly because the latter is based on the assumption that the entire amount of oilseeds retained by the producers is consumed as oilseeds.
Meat, Fish and Egg
4.28 This is another item-group of food items for which the estimates from the two sources vary widely. The estimates were comparable for the year1972-73 and 1977-78. But it increased to 45 percent in 1993-93, 54 percent in 1999-00 and 59 percent in 2004-05. Table 13: Difference between the NSS and NAS Estimates of Consumption of "Meat, Fish and Egg" in Different Years (Rs. crore)
Year NSS NAS Difference for the group
% Difference Difference for "all food"
1972-73 891 915 -24 -2.62 5.431977-78 1677 1690 -13 -0.77 -4.341993-94 11923 21737 -9814 -45.15 -28.921999-00 23247 50649 -27402 -54.10 -36.492004-05 28395 68999 -40604 -58.85 -35.20
4.29 Table 14 gives the comparable NSS and NAS estimates of consumption of individual items for 1999-00 and 2004-05. The estimates from the two sources are fairly close to each other for the meat sub-group. The NAS estimate exceeds the NSS estimates by about Rs.1548 crore in 1999-00. The NSS estimate is higher than the NAS estimate only for ‘goat meat’ for 1999-00. The gap between the two value estimates of ‘goat meat’ widens when the NAS value estimate is adjusted for prices. For all other items NAS estimates are higher than the NSS estimates.

Central Statistical Organisation National Accounts Division
27
Table 14: Itemwise comparison between NAS and NSS estimates of quantity (000 tonnes) and value (Rs. crore) of consumption of ‘Meat, Egg And Fish’ item-group
1999-00
NSS NAS Difference NAS Adjusted Item Quantity Value
Quantity Value
(NSS -
NAS) adjusted by NSS price
difference
Goat Meat 789 5457 520 5322 135 3597 1860Mutton 165 1458 195 1837 -379 1723 -265Goat meat plus mutton 954 6915 715 7159 -244 5183 1732
Beef 268 1064 308 1141 -77 1223 -159
Pork 87 400 237 1385 -985 1090 -690Buffalo Meat 268 639 356 989 -350 849 -210Other Meat -- 108 -- 108 108
Meat: total -- 9126 -- 10674 -1548 8344 782
Other Meat (byproduct) -- -- 738 -738 738 -738
Chicken -- 3130 -- 8369 -5239 8369 -5239Other Birds(No) -- 73 -- 992 -919 992 -919
Eggs & egg products
-- 2710 5710 -3000 5710 -3000
Fish -- 8208 -- 24204 -15996 24204 -15996Change in Stock -- -- -38 38 -38 38
Meat Egg Fish : total
-- 23247 50649 -27402 48319 -25072
2004-05 NSS NAS Difference NAS Adjusted
Item Quantity Value
Quantity Value
(NSS - NAS)
adjusted by NSS price
Quantity
Goat Meat 587 5564 481 5565 -1 4559 1005Mutton 123 1487 271 3061 -1574 3276 -1789Goat meat plus mutton 710 7051 752 8626 -1575 7468 -417
Beef 251 1248 368 1528 -280 1830 -582Pork 76 488 315 1679 -1191 2023 -1535Buffalo Meat 251 749 419 1414 -665 1250 -501Other Meat -- 127 -- 127 127
Meat: total -- 9663 -- 13247 -3584 12571 -2908
Other Meat (byproduct) -- -- 966 -966 966 -966
Chicken -- 5050 -- 9337 -4287 9337 -4287Other Birds(No) -- 127 -- 1112 -985 1112 -985
Eggs & egg products
-- 2866 7137 -4271 7137 -4271
Fish -- 10689 -- 36851 -26162 36851 -26162Change in Stock -- -- 349 -349 349 -349
Meat Egg Fish : total
-- 28395 68999 -40604 68323 -39928

Central Statistical Organisation National Accounts Division
28
4.30 Fish is the main contributor in the divergence followed by the items such as chicken, egg & egg products. In the year 1999-00, difference in the estimates of fish was Rs. 15996 crore, chicken was Rs. 5239 crore, egg and egg products was Rs. 3000 crore in the overall divergence of Rs. 27402 crore for this group. The overall difference for this item group further increased to Rs. 40604 crore in 2004-05.
4.31 The sub-group ‘other meat products’ comprises glands, other poultry killed and other meat product in the NAS. In the NSS survey no data is collected separately for these items. The expenditure on these items is embodied in the expenditure on meat. In the NAS, this sub-group is also factor for the discrepancy between the two sets of estimates.
4.32 The other reason for the discrepancy may be that the intermediate consumption for most of the items of this group is taken as nil in the NAS. This appears to be the main reason for the wide divergence between the two sets of estimates, particularly for eggs and chicken since a large volume of these is actually used as input in the food processing industries, hotels and restaurants. Fruits and Vegetables
4.33 The "fruits and vegetables and their products” contributes maximum in the difference between the NAS and NSS estimates of consumption expenditure in the item-groups of food consumption. This contributed 28 percent in 1999-00 which further increased to 35 percent in 2004-05 in the overall divergence in the food consumption. It can be seen from Table 15 that the difference between the estimates for this group was about 41 percent in 19972-72 and 1977-78, which increased to 54 percent in 1999-00 and 56 percent in 2004-05.
Table 15: Difference between the NSS and NAS Value Estimates of Consumption of ‘fruits & vegetables’ in different years (Rs. crore)
Year NSS
NAS
Difference (fruits &
vegetable)
% Difference (NSS-NAS)
/NAS
Difference (all food)
1972-73 1835 3097 -1262 -40.75 5.43
1977-78 3228 5517 -2289 -41.49 -4.34
1993-94 28851 68036 -39185 -57.59 -28.92
1999-00 56649 122347 -65698 -53.70 -36.492004-05 73126 165486 -92360 -55.81 -35.20
4.34 The item-wise estimates for 1999-00 and 2004-05 available from NSS and NAS have been suitably re-grouped to make them comparable. The items of fruits and vegetables for which separate estimates are available from the two agencies have been
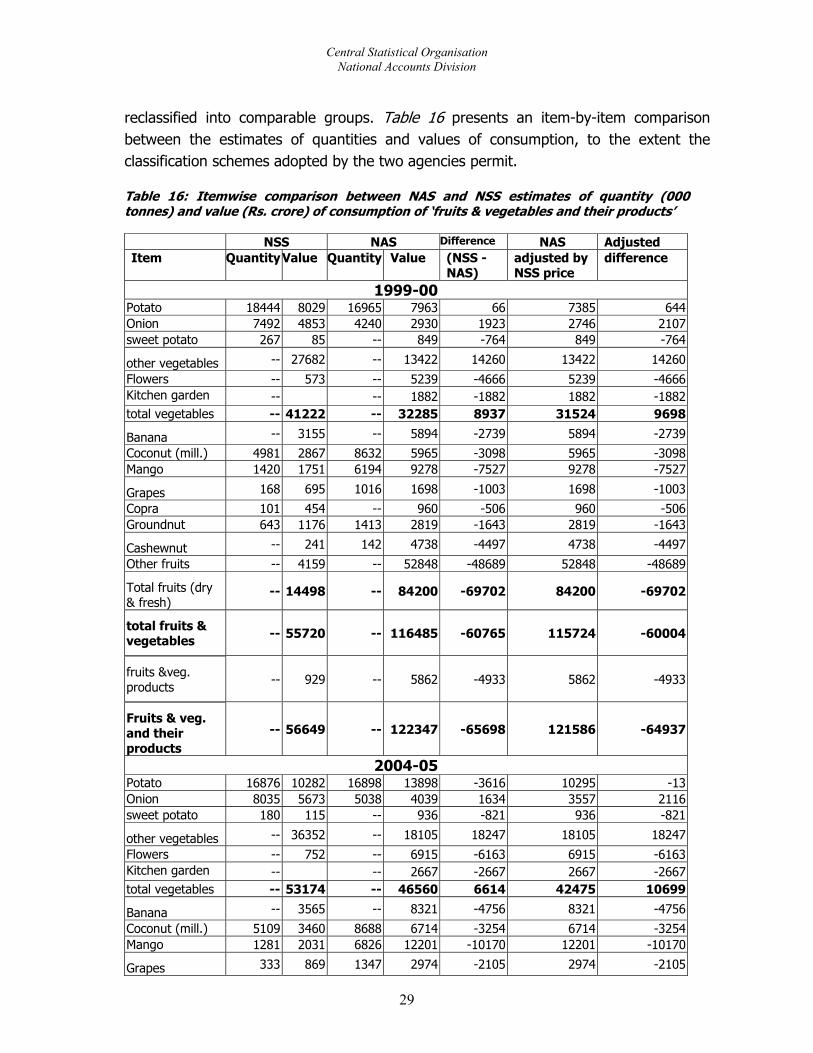
Central Statistical Organisation National Accounts Division
29
reclassified into comparable groups. Table 16 presents an item-by-item comparison between the estimates of quantities and values of consumption, to the extent the classification schemes adopted by the two agencies permit. Table 16: Itemwise comparison between NAS and NSS estimates of quantity (000 tonnes) and value (Rs. crore) of consumption of ‘fruits & vegetables and their products’ NSS NAS Difference NAS Adjusted Item Quantity Value
Quantity Value
(NSS - NAS)
adjusted by NSS price
difference
1999-00 Potato 18444 8029 16965 7963 66 7385 644Onion 7492 4853 4240 2930 1923 2746 2107sweet potato 267 85 -- 849 -764 849 -764
other vegetables -- 27682 -- 13422 14260 13422 14260
Flowers -- 573 -- 5239 -4666 5239 -4666Kitchen garden -- -- 1882 -1882 1882 -1882total vegetables -- 41222 -- 32285 8937 31524 9698
Banana -- 3155 -- 5894 -2739 5894 -2739Coconut (mill.) 4981 2867 8632 5965 -3098 5965 -3098Mango 1420 1751 6194 9278 -7527 9278 -7527
Grapes 168 695 1016 1698 -1003 1698 -1003
Copra 101 454 -- 960 -506 960 -506Groundnut 643 1176 1413 2819 -1643 2819 -1643
Cashewnut -- 241 142 4738 -4497 4738 -4497
Other fruits -- 4159 -- 52848 -48689 52848 -48689
Total fruits (dry & fresh)
-- 14498 -- 84200 -69702 84200 -69702
total fruits & vegetables -- 55720 -- 116485 -60765 115724 -60004
fruits &veg. products -- 929 -- 5862 -4933 5862 -4933
Fruits & veg. and their products
-- 56649 -- 122347 -65698 121586 -64937
2004-05 Potato 16876 10282 16898 13898 -3616 10295 -13Onion 8035 5673 5038 4039 1634 3557 2116sweet potato 180 115 -- 936 -821 936 -821
other vegetables -- 36352 -- 18105 18247 18105 18247
Flowers -- 752 -- 6915 -6163 6915 -6163Kitchen garden -- -- 2667 -2667 2667 -2667total vegetables -- 53174 -- 46560 6614 42475 10699
Banana -- 3565 -- 8321 -4756 8321 -4756
Coconut (mill.) 5109 3460 8688 6714 -3254 6714 -3254Mango 1281 2031 6826 12201 -10170 12201 -10170
Grapes 333 869 1347 2974 -2105 2974 -2105
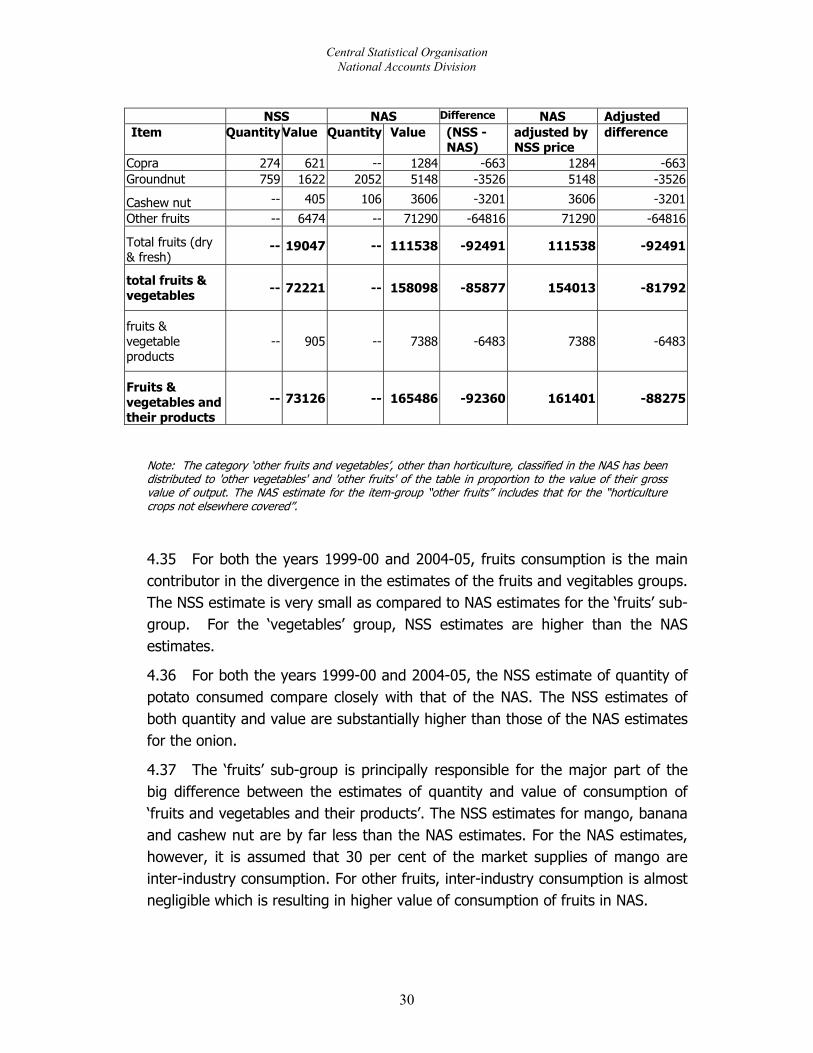
Central Statistical Organisation National Accounts Division
30
NSS NAS Difference NAS Adjusted Item Quantity Value
Quantity Value
(NSS - NAS)
adjusted by NSS price
difference
Copra 274 621 -- 1284 -663 1284 -663Groundnut 759 1622 2052 5148 -3526 5148 -3526
Cashew nut -- 405 106 3606 -3201 3606 -3201
Other fruits -- 6474 -- 71290 -64816 71290 -64816
Total fruits (dry & fresh)
-- 19047 -- 111538 -92491 111538 -92491
total fruits & vegetables -- 72221 -- 158098 -85877 154013 -81792
fruits & vegetable products
-- 905 -- 7388 -6483 7388 -6483
Fruits & vegetables and their products
-- 73126 -- 165486 -92360 161401 -88275
Note: The category ‘other fruits and vegetables’, other than horticulture, classified in the NAS has been distributed to 'other vegetables' and 'other fruits' of the table in proportion to the value of their gross value of output. The NAS estimate for the item-group “other fruits” includes that for the “horticulture crops not elsewhere covered”.
4.35 For both the years 1999-00 and 2004-05, fruits consumption is the main contributor in the divergence in the estimates of the fruits and vegitables groups. The NSS estimate is very small as compared to NAS estimates for the ‘fruits’ sub-group. For the ‘vegetables’ group, NSS estimates are higher than the NAS estimates.
4.36 For both the years 1999-00 and 2004-05, the NSS estimate of quantity of potato consumed compare closely with that of the NAS. The NSS estimates of both quantity and value are substantially higher than those of the NAS estimates for the onion.
4.37 The ‘fruits’ sub-group is principally responsible for the major part of the big difference between the estimates of quantity and value of consumption of ‘fruits and vegetables and their products’. The NSS estimates for mango, banana and cashew nut are by far less than the NAS estimates. For the NAS estimates, however, it is assumed that 30 per cent of the market supplies of mango are inter-industry consumption. For other fruits, inter-industry consumption is almost negligible which is resulting in higher value of consumption of fruits in NAS.
Central Statistical Organisation National Accounts Division
31
4.38 Divergence in the estimates of ‘fruits’ consumption are high as compared to consumption estimates of cereals and pulses and those of vegetables and ‘meat, fish and eggs’ group. The reporting of fruits probably suffers severely from recall lapse in the HCES. Fruits consumed outside home are most likely not captured in the HCES. Thus, on the one hand the NAS estimate of fruits consumption appears to be on the higher side, while on the other the NSS estimate seems to suffer from under-estimation.
Tobacco
4.39 It is observed from Table 17 that NAS consumption estimates for item-groups have always been substantially higher than the NSS estimates. In fact, for 1972-73, 1993-94 and 2004-05 the NSS estimate is only about a half of the NAS estimate for this item-group. In 1999-00, the NSS estimate was 73% lower than NAS estimate.
Table 17: Difference between the NSS and NAS Estimates of Consumption of Tobacco in different year (Rs. Crores)
Year NSS NAS Difference % Difference for the group
% Difference for "all food"
1972-73 612 1117 -505 -45.21 5.43
1977-78 1000 1533 -533 -34.77 -4.34
1993-94 5877 12309 -6432 -52.25 -28.921999-00 9441 34395 -24954 -72.55 -36.492004-05 10971 19946 -8975 -45.00 -35.20
4.40 Item-wise estimates of tobacco consumption from the two sources for the year 1999-00 and 2004-05 are given in the table below.
Table 18: Item wise comparison between NAS and NSS estimates of value of Tobacco consumption (Rs. crores) 1999-00 2004-05
Item NSS NAS Diff. % diff. NSS NAS Diff. % diff
Bidi 5388 14895 -9507 -63.83 5799 12489 -6690 -53.57
Cigarettes 2011 11155 -9144 -81.97 2192 10227 -8035 -78.57
Leaf Tobacco 1027 4177 -3150 -75.41 1166 3834 -2668 -69.59
Snuff 45 1369 -1324 -96.71 59 1150 -1091 -94.87
Cheroot 75 291 -216 -74.23 91 267 -176 -65.92
Other Tobacco Products (incld. that for hookah and zarda)
895 1482 -587 -39.61 1664 1360 304 22.35
Change in stocks 1026 -1026 -100.00 -9381 9381 -100.00
Tobacco : total 9441 34395 -24954 -72.55 10971 19946 -8975 -45.00
4.41 It is observed that ‘bidi’ and ‘cigarettes’ have major shares in the difference between the estimates for this item-group. The NSS estimates are
Central Statistical Organisation National Accounts Division
32
likely to be on the lower side, as the data collected through interviews are expected to be adversely affected by under-reporting resulting from the inhibitions against consumption of tobacco. Moreover, in the HCES, information is usually collected from a member of the household, who is often unaware of tobacco consumption habits of the other members of the household.
Hotel and Restaurant
4.42 The Hotel and Restaurant -group was classified in the category of services till the 1970-71 series of the NAS. As the receipts from sale of food constitute a major share of the total receipts by the hotel and restaurant industry this is taken as a part of the food consumption since the 1980-81 series.
4.43 The NAS estimate for this group is obtained from the estimate of gross value added (GVA). First, an estimate of output of hotel and restaurants is derived from the estimate of GVA. Private consumption is assumed to be 33 per cent of the output. This NAS estimate of private consumption includes the accommodation charges in addition to the value of food. It is important to note that hotels and restaurants also serve other food items like tea, snacks and beverages. The NSSO, on the other hand, does not provide any estimate of consumption for this item-group as such. Instead it provides estimates of value of “cooked meals”, snacks, beverages and “other processed food” purchased by the households. Thus the comparison here is restricted to the NAS estimate for ‘hotels and restaurants’ and the NSS estimate of purchased ‘cooked meals’, other processed food, tea(cups) and coffee(cups). The comparability of these two estimates is severely constrained by the difference in coverage. These estimates for different years are placed in Table 19 to illustrate how the two estimates differ from each other.
4.44 It is seen that NSS estimate for this group was higher than the NAS estimate in both 1972-73 and 1977-78. But, for 1993-94 onwards the trend is reversed. The NAS estimate is expected to be higher due to the larger coverage than NSS. But the high magnitude of difference may not be only because of the receipts from accommodation charges. However, the food served includes snacks and beverages that are not counted as “cooked meals” in the HCES. The difference in two estimates can mainly be attributed to the non-comparable coverage.
Central Statistical Organisation National Accounts Division
33
Table 19: Difference between the NSS and NAS estimates for Hotel and Restaurant in different Years (Rs. Crores)
Year NSS NASDifference for
the group % DifferenceDifference for
"all food"1972-73 839 444 395 88.96 5.431977-78 1125 757 368 48.61 -4.341993-94 3765 6142 -2377 -38.70 -28.921999-00 16582 22935 -6353 -27.70 -36.492004-05 24053 40764 -16711 -40.99 -35.20
Central Statistical Organisation National Accounts Division
34
CHAPTER V
COMPARISON OF ESTIMATES OF NON-FOOD CONSUMPTION
5.1 Private final consumption expenditure on fuel, clothing and footwear, other manufactured goods and services constitute ‘non-food consumption’. Individual items have been appropriately regrouped into comparable item-groups using the detailed and disaggregated NAS and NSS estimates for 1999-00 and 2004-05. The NSS estimates used for this purpose are based on the data collected in the HCES with 30 days reference period. The item-group level difference in the NSS and the NAS estimates are presented in the table below (Table 20). Table 20: Comparison of NAS and NSS estimates of consumption expenditure on different non-food item-groups (Rs. Crores)
Item-group NSS NAS NSS - NAS
% difference
% share
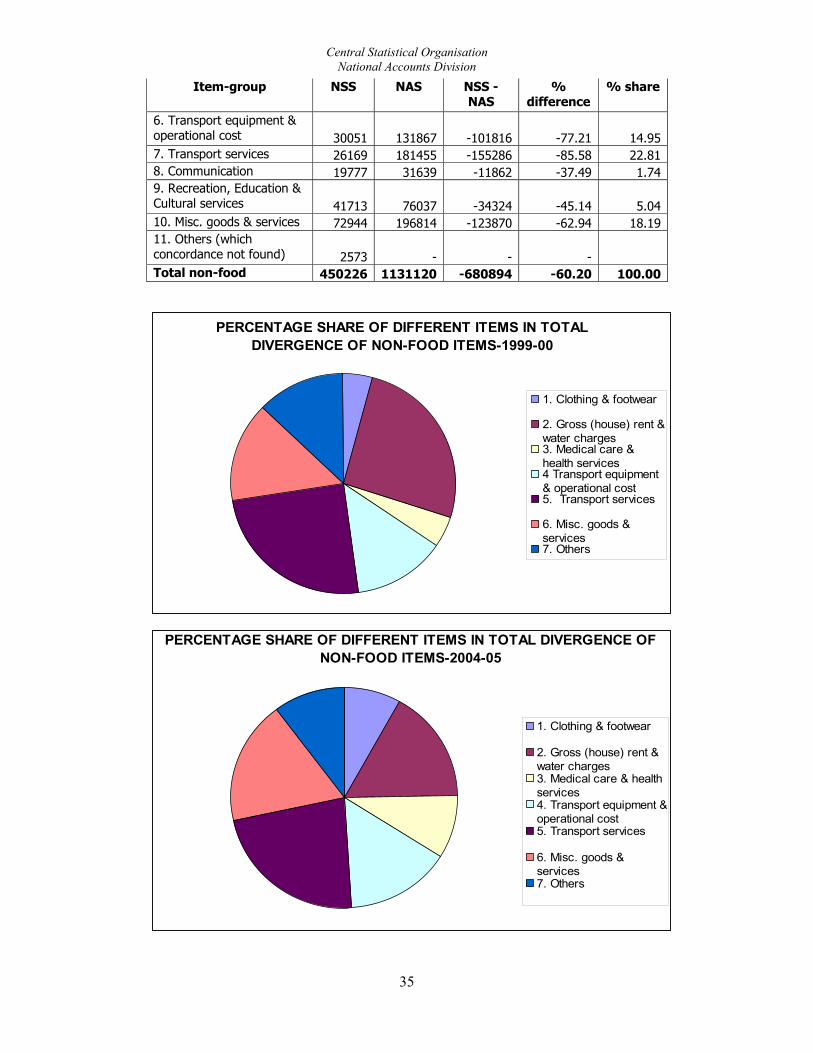
1999-001. Clothing & footwear 53652 66292 -12640 -19.07 4.142. Gross (house) rent & water charges 20815 99270 -78455 -79.03 25.723. Fuel & power 53139 44288 8851 19.99 -2.904. Furniture, furnishings, appliances & services 17516 42411 -24895 -58.70 8.165. Medical care & health services 40672 54825 -14153 -25.81 4.646. Transport equipment & operational cost 16144 56259 -40115 -71.30 13.157. Transport services 18127 93727 -75600 -80.66 24.788. Communication 5077 14538 -9461 -65.08 3.109. Recreation, Education & Cultural services 26725 42570 -15845 -37.22 5.1910. Misc. goods & services 51638 96350 -44712 -46.41 14.6611. Others (which concordance not found) 1968 - - - Total non-food 305473 610530 -305057 -49.97 100.00
2004-051. Clothing & footwear 45657 100164 -54507 -54.42 8.012. Gross (house) rent & water charges 38059 152612 -114553 -75.06 16.823. Fuel & power 91762 76204 15558 20.42 -2.284. Furniture, furnishings, appliances & services 25839 66890 -41051 -61.37 6.035. Medical care & health services 55682 117438 -61756 -52.59 9.07
Central Statistical Organisation National Accounts Division
35
Item-group NSS NAS NSS - NAS
% difference
% share
6. Transport equipment & operational cost 30051 131867 -101816 -77.21 14.957. Transport services 26169 181455 -155286 -85.58 22.818. Communication 19777 31639 -11862 -37.49 1.749. Recreation, Education & Cultural services 41713 76037 -34324 -45.14 5.0410. Misc. goods & services 72944 196814 -123870 -62.94 18.1911. Others (which concordance not found) 2573 - - - Total non-food 450226 1131120 -680894 -60.20 100.00
PERCENTAGE SHARE OF DIFFERENT ITEMS IN TOTAL DIVERGENCE OF NON-FOOD ITEMS-1999-00
1. Clothing & footwear
2. Gross (house) rent &water charges3. Medical care &health services4 Transport equipment& operational cost5. Transport services
6. Misc. goods &services7. Others
1. Clothing & footwear
2. Gross (house) rent &water charges3. Medical care & healthservices4. Transport equipment &operational cost5. Transport services
6. Misc. goods &services7. Others
PERCENTAGE SHARE OF DIFFERENT ITEMS IN TOTAL DIVERGENCE OF NON-FOOD ITEMS-2004-05

Central Statistical Organisation National Accounts Division
36
5.2 It is observed that NSS estimate for non-food consumption is 50 percent lower than NAS estimate of non-food consumption for the year 1999-00 which became 60 percent in 2004-05. As discussed earlier, the NAS estimate includes three components of consumption that cannot be obtained directly from the reported consumption of the households. The NAS estimate of ‘gross rent’ includes the notional element of imputed rent of owner-occupied dwellings and ‘furniture, furnishings, appliances and services’ includes the notional element of general insurance services. The ‘miscellaneous goods and services’ includes the notional element of FISIM embodied in the banking and insurance services. For comparing the two sets of estimates, adjustment of the NSS estimate for the notional elements is required. After the adjustment the NSS estimates for the items house rent, banking services and insurance services the comparative figures are presented in the table below (Table 21).
Table 21: Comparison of NAS and NSS estimates of consumption expenditure on different non-food consumption adjusted for the notional elements (Rs. crore)
1999-00 2004-05 Item-group Adjusted
NSS NAS %
differenceAdjusted
NSS NAS %
difference
1. Clothing & footwear 53652 66292 -19.07 45657 100164 -54.42 2. Gross (house) rent & water charges
89252 99270 -10.09 139749 152612 -8.43
3. Fuel & power 53139 44288 19.99 91762 76204 20.42 4. Furniture, furnishings, appliances & services
17596 42411 -58.51 26017 66890 -61.10
5. Medical care & health services
40672 54825 -25.81 55682 117438 -52.59
6. Transport equipment & operational cost
16144 56259 -71.30 30051 131867 -77.21
7. Transport services 18127 93727 -80.66 26169 181455 -85.58 8. Communication 5077 14538 -65.08 19777 31639 -37.49 9. Recreation, Education & Cultural services
26725 42570 -37.22 41713 76037 -45.14
10. Misc. goods & services 76230 96350 -20.88 138161 196814 -29.80 11. Others (which concordance not found)
1968 - - 2573 - -
Total non-food(adjusted)
398582 610530 -34.72 617311 1131120 -45.42
Total food 410918 647011 -36.49 481189 742609 -35.20 Total consumption expenditure(adjusted)
809500 1257541 -35.63 1098500 1873729 -41.37
5.3 It is observed that the difference in the NSS and NAS estimates have reduced from 50 percent to 35 percent for 1999-00. Similarly, for 2004-05, the difference has reduced to 45 percent from 60 percent. Difference for rent &

Central Statistical Organisation National Accounts Division
37
water charges and miscellaneous goods & services has also reduced considerably after the adjustment. 5.4 Comparison of individual item-groups reveals that for all item-groups, except ‘fuel and light’, the NAS estimate is much higher than the NSS estimate. Three items namely, gross (house) rent & water charges, transport services and miscellaneous goods & services are main contributors of the difference.
5.5 Different approaches are adopted for different item-groups for NAS estimates on non-food consumption. The estimates for the manufactured goods are obtained by the commodity flow approach, while those for fuel and services are derived by various other approaches. The commodity-wise value of consumption of manufactured goods is derived from the estimate of value of production, by applying various ratios and norms representing (i) percentage share of consumables, (ii) gross distributive margins, (iii) percentage shares used for fixed capital formation and inter-industry consumption and (iv) Government consumption. For the registered manufacturing, the commodity-wise shares of consumable items in the total output (of product and by-product) have been obtained for the base year, 1999-2000, from the detailed results of ASI for the year 1999-00. For the unregistered manufacturing, product and by-product ratio to value added have been worked out from the Enterprise Survey on Unorganised Manufacturing. The percentage shares of capital formation are based on the norms worked out on the basis of the results of All India Debt and Investment Survey. The ratios obtained for the base year are used for subsequent years i.e., 2004-05. The data on government consumption are available every year from the budget documents.
Clothing and Footwear
5.6 The NSS estimate of clothing and footwear has always been less than the NAS estimate (Table 22). It is 19 per cent less in 1999-2000. In 2004-05, the difference in NSS and NAS estimate has widened to 54 per cent.
Table 22: Difference between the NSS and NAS Estimates of Consumption of Cothing and Footwear in different Years (Rs. crores)
Year item NSS NAS Difference for the group
% Difference
Difference for "all
non-food"1972-73 Clothing 2319 2563 -244 -9.52 Footwear 163 192 -29 -15.1 Clothing & Footwear 2482 2755 -273 -9.91 -24.381977-78 Clothing 5068 5888 -820 -13.93 Footwear 407 353 54 15.3 Clothing & Footwear 5475 6241 -766 -12.27 -19.63

Central Statistical Organisation National Accounts Division
38
Year item NSS NAS Difference for the group
% Difference
Difference for "all
non-food"1993-94 Clothing 18203 30937 -12734 -41.16 Footwear 3179 4062 -883 -21.74 Clothing & Footwear 21382 34999 -13617 -38.91 -49.251999-00 Clothing 45532 57936 -12404 -21.41 Footwear 8120 8356 -236 -2.82 Clothing & Footwear 53652 66292 -12640 -19.07 -49.972004-05 Clothing 38929 90052 -51123 -56.77 Footwear 6728 10112 -3384 -33.47 Clothing & Footwear 45657 100164 -54507 -54.42 -60.20
Note: Sources are same as that for Table 1.
5.7 In national accounting, the estimates for clothing are prepared separately for cotton, silk and woolen fabrics and miscellaneous textiles. In the 1980-81 series of NAS estimates, the data from the Office of the Textile Commissioner was used for estimation of private consumption. From1993-94 series onwards, the estimates of private consumption of textile products, consistent with the GDP estimates, are based both on the results of ASI and on the results of the All-India Census of SSI units.
5.8 While the NAS estimate of ‘clothing & footwear’ has increased by 51% between 1999-2000 and 2004-05, the NSS estimate shows a decline of 15% in 2004-05 over 1999-00. The NSS estimates for 1999-2000 were based on 365 days’ data, which in recent years have been yielding higher estimates than 30 days’ data for clothing, footwear, education and durables. This explains the apparently haphazard behaviour (a rise and then a fall) of the NSS estimates between 1993-94 and 2004-05. Using 365 days’ data for 2004-05 wipes out the observed decline in the NSS estimate of clothing and footwear between 1999-2000 and 2004-05 and shows the NSS estimate to have increased since 1999-2000, but at a slow pace. Nevertheless, the gap between NSS and NAS estimates has undeniably widened. The NSS estimate of this sector for 2004-05 seems to suffer from under-reporting. However, the NSS estimate for 2004-05 would increase by 50% of its present value if data obtained by the last 365 days recall period method were used instead of the last 30 days recall period.
Fuel and Light
5.9 For this item-group, the NSS estimate is higher than NAS estimate by Rs. 8851 crore in 1999-2000 and Rs. 15558 crore in 2004-05. The NSS estimate of consumption expenditure on fuel and light has always been higher than that of the NAS. The gap between the two estimates, it is seen from Table 23, has progressively closed from 49 per cent in 1972-73 to 15 per cent in 1993-94, rising again to 20 per cent in 1999-2000 and 2004-05. In 1972-73, the NSS
Central Statistical Organisation National Accounts Division
39
estimate was higher than the NAS estimate by about 49 per cent and in 1977-78 by about 62 per cent.
Table 23: Difference between the NSS and NAS Estimates of Consumption of Fuel and Light in different Years
(Rs. crore) Year item NSS NAS Difference
for the group
Percentage Difference
Difference for "all non-
food" 1972-73 Electricity 102 82 20 24.39 L.P.G 26 17 9 52.94 Kerosene 308 401 -93 -23.19 Other fuel 1370 715 655 91.61 Total fuel & light 1806 1215 591 48.64 -24.38
1977-78 Electricity 233 272 -39 -14.34 L.P.G 64 67 -3 -4.48 Kerosene 655 538 117 21.75 Other fuel 2471 1238 1233 99.6 Total fuel & light 3423 2115 1308 61.84 -19.63
1993-94 Electricity 4797 3926 871 22.19 L.P.G 1961 1521 440 28.93 Kerosene 3648 2906 742 25.53 Other fuel 14121 13032 1089 8.36 Total fuel & light 24527 21385 3142 14.69 -49.251999-00 Electricity 15855 9859 5996 60.82 L.P.G 6931 5971 960 16.08 Kerosene 6785 4036 2749 68.11 Other fuel 23568 24422 -854 -3.50 Total fuel & light 53139 44288 8851 19.99 -49.972004-05 Electricity 29337 18666 10671 57.17 L.P.G 17017 16288 729 4.48 Kerosene 10113 8738 1375 15.74 Other fuel 35295 32512 2783 8.56 Total fuel & light 91762 76204 15558 20.42 -60.20
5.10 Separate estimates of consumption of different items of fuel and light available from both the sources are given in Table 23. The item ‘other fuel’ consists of coal, firewood, vegetable waste, dung cake, lignite, gas coke, bagasse, charcoal and gobar gas. Electricity has major share in the difference in the ‘fuel and light’ group. A detailed comparison of the estimates for the constituents of domestic fuel consumption for 1999-2000 and 2004-05 is given below in Table 24.
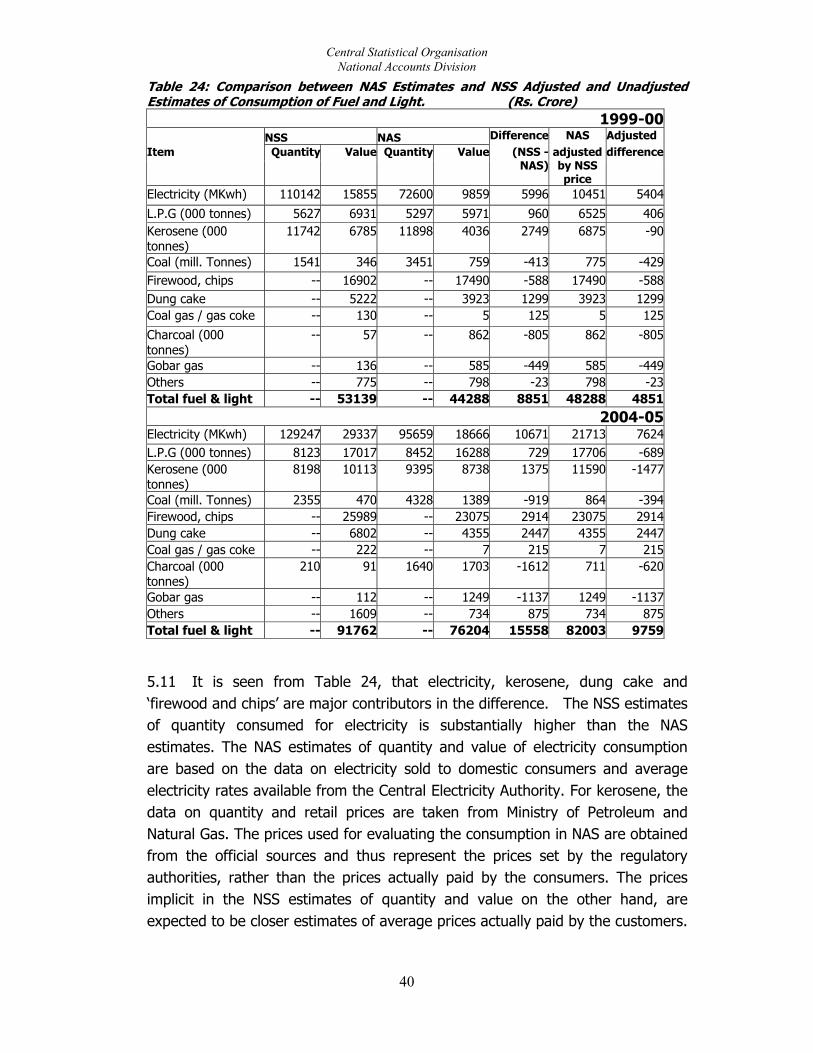
Central Statistical Organisation National Accounts Division
40
Table 24: Comparison between NAS Estimates and NSS Adjusted and Unadjusted Estimates of Consumption of Fuel and Light. (Rs. Crore)
1999-00 NSS NAS Difference NAS Adjusted Item Quantity Value Quantity Value (NSS -
NAS)adjusted by NSS price
difference
Electricity (MKwh) 110142 15855 72600 9859 5996 10451 5404
L.P.G (000 tonnes) 5627 6931 5297 5971 960 6525 406Kerosene (000 tonnes)
11742 6785 11898 4036 2749 6875 -90
Coal (mill. Tonnes) 1541 346 3451 759 -413 775 -429Firewood, chips -- 16902 -- 17490 -588 17490 -588Dung cake -- 5222 -- 3923 1299 3923 1299Coal gas / gas coke -- 130 -- 5 125 5 125Charcoal (000 tonnes)
-- 57 -- 862 -805 862 -805
Gobar gas -- 136 -- 585 -449 585 -449Others -- 775 -- 798 -23 798 -23Total fuel & light -- 53139 -- 44288 8851 48288 4851
2004-05Electricity (MKwh) 129247 29337 95659 18666 10671 21713 7624L.P.G (000 tonnes) 8123 17017 8452 16288 729 17706 -689Kerosene (000 tonnes)
8198 10113 9395 8738 1375 11590 -1477
Coal (mill. Tonnes) 2355 470 4328 1389 -919 864 -394Firewood, chips -- 25989 -- 23075 2914 23075 2914Dung cake -- 6802 -- 4355 2447 4355 2447Coal gas / gas coke -- 222 -- 7 215 7 215Charcoal (000 tonnes)
210 91 1640 1703 -1612 711 -620
Gobar gas -- 112 -- 1249 -1137 1249 -1137Others -- 1609 -- 734 875 734 875Total fuel & light -- 91762 -- 76204 15558 82003 9759
5.11 It is seen from Table 24, that electricity, kerosene, dung cake and ‘firewood and chips’ are major contributors in the difference. The NSS estimates of quantity consumed for electricity is substantially higher than the NAS estimates. The NAS estimates of quantity and value of electricity consumption are based on the data on electricity sold to domestic consumers and average electricity rates available from the Central Electricity Authority. For kerosene, the data on quantity and retail prices are taken from Ministry of Petroleum and Natural Gas. The prices used for evaluating the consumption in NAS are obtained from the official sources and thus represent the prices set by the regulatory authorities, rather than the prices actually paid by the consumers. The prices implicit in the NSS estimates of quantity and value on the other hand, are expected to be closer estimates of average prices actually paid by the customers.
Central Statistical Organisation National Accounts Division
41
The implicit prices of NSS estimates are higher than the implicit prices of NAS estimates. This has resulted in higher value of NAS estimates of kerosene when evaluated at NSS prices and hence changing the trend in the difference in two estimates.
5.12 The NAS consumption estimates of firewood are based on the consumption data available from the HCES of the NSSO. The minor difference in the estimates from the two sources for the base year i.e., 1999-2000 is on account of adjustments made for agricultural waste and bagasse and value of firewood used in the funerals. The difference between the estimates of firewood consumption owes itself to the adjustments made for the NAS estimate under the assumption that vegetable wastes, bagasse are included, while fire wood used in funerals are not included in the NSS estimate for ‘firewood & chips’. The difference in two estimates has increased in 2004-05. This is because for 2004-05, the NAS estimates have been computed applying the growth rate observed during last two quinquennial surveys on the value of base year estimates.
Medical care & Health Services 5.13 The difference in the two estimates was around 6% in 1993-94. The NSS estimate was lower than NAS estimate. The difference increased to 26% in 1999-00 and 53% in 2004-05. The NAS estimates based on 1999-2000 series are not comparable with the estimates of earlier series. The estimates of expenditure of the households on medical care and health services were prepared on the basis of the NSSO Consumer Expenditure Survey (CES, 50th round) 1993-94 for the old series. For subsequent years the estimates were built on the basis of inter-survey growth observed in the 43rd (1987-88) and 50th (1993-94) round survey results. For the present series i.e., 1999-2000, the PFCE estimates are based on the 52nd round NSS Health Care Survey. PFCE for subsequent years is projected using the growth rate in the per capita consumption expenditure between 52nd and 57th round HCES of NSS. The receipt by Central government on account of Central Government Health Scheme compiled from the Central government budget is also taken as an item of household consumption.
5.14 Since the Health Care Survey of the 52nd round of NSS was focused on medical care, it is presumed to have collected the data more accurately compared to the household consumer expenditure surveys. This has resulted in wide gap between the two sets of estimates for the year 1999-2000. The gap
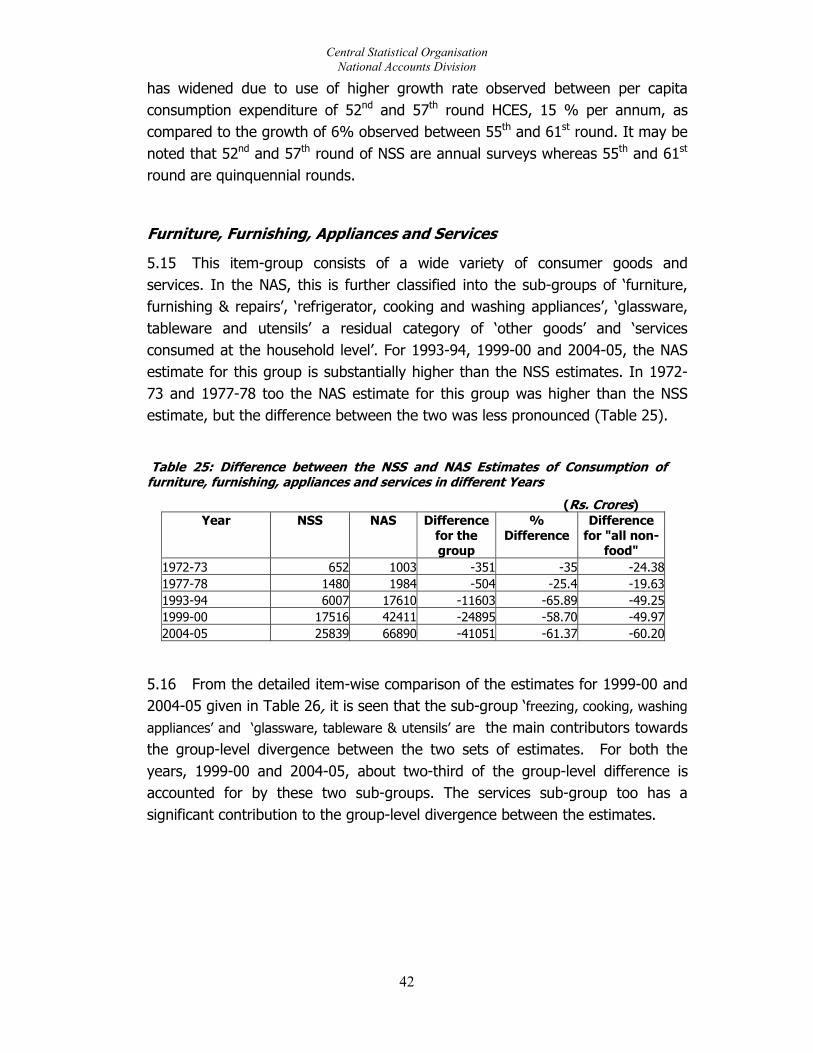
Central Statistical Organisation National Accounts Division
42
has widened due to use of higher growth rate observed between per capita consumption expenditure of 52nd and 57th round HCES, 15 % per annum, as compared to the growth of 6% observed between 55th and 61st round. It may be noted that 52nd and 57th round of NSS are annual surveys whereas 55th and 61st round are quinquennial rounds.
Furniture, Furnishing, Appliances and Services
5.15 This item-group consists of a wide variety of consumer goods and services. In the NAS, this is further classified into the sub-groups of ‘furniture, furnishing & repairs’, ‘refrigerator, cooking and washing appliances’, ‘glassware, tableware and utensils’ a residual category of ‘other goods’ and ‘services consumed at the household level’. For 1993-94, 1999-00 and 2004-05, the NAS estimate for this group is substantially higher than the NSS estimates. In 1972-73 and 1977-78 too the NAS estimate for this group was higher than the NSS estimate, but the difference between the two was less pronounced (Table 25).
Table 25: Difference between the NSS and NAS Estimates of Consumption of furniture, furnishing, appliances and services in different Years
(Rs. Crores) Year NSS NAS Difference
for the group
% Difference
Difference for "all non-
food" 1972-73 652 1003 -351 -35 -24.381977-78 1480 1984 -504 -25.4 -19.631993-94 6007 17610 -11603 -65.89 -49.251999-00 17516 42411 -24895 -58.70 -49.972004-05 25839 66890 -41051 -61.37 -60.20
5.16 From the detailed item-wise comparison of the estimates for 1999-00 and 2004-05 given in Table 26, it is seen that the sub-group ‘freezing, cooking, washing
appliances’ and ‘glassware, tableware & utensils’ are the main contributors towards the group-level divergence between the two sets of estimates. For both the years, 1999-00 and 2004-05, about two-third of the group-level difference is accounted for by these two sub-groups. The services sub-group too has a significant contribution to the group-level divergence between the estimates.

Central Statistical Organisation National Accounts Division
43
Table 26: Comparison between NAS and NSS Estimates of Consumption of Furniture, furnishings, appliances and services
(Rs. Crores) 1999-00 2004-05 Items
NSS NAS % difference
NSS NAS % difference
Carpet 19 430 -95.58 38 731 -94.80Coir product 195 244 -20.08 238 371 -35.85Wooden & steel furniture 868 974 -10.88 1850 513 260.62Furniture, furnishing & repairs 1082 1648 -34.34 2126 1615 31.64Non-electrical mach. 186 877 -78.79 199 1410 -85.89Electrical mach. 1324 2441 -45.76 1654 4700 -64.81Refg'tr & AC 651 2939 -77.85 864 4477 -80.70Freezing, cooking, washing appliances 2161 6257 -65.46 2717 10587 -74.34Glass, earthenware & chinaware 544 12182 -95.53 893 16595 -94.62Metal utensils 1180 2089 -43.51 1447 3422 -57.71other metal / household utensils 157 1013 -84.50 212 1059 -79.98Glassware, tableware& utensils 1881 15284 -87.69 2552 21076 -87.89Matches 1391 2489 -44.11 1667 3669 -54.57Misc. personal goods 6644 5829 13.98 9708 10210 -4.92Plastic products 453 1176 -61.48 727 2937 -75.25Rubber products 22 213 -89.67 55 585 -90.60Batteries 402 1275 -68.47 566 2583 -78.09Other goods 8912 10982 -18.85 12723 19984 -36.33Domestic services 2195 3845 -42.91 3782 6465 -41.50Laundries, dry cleaners 1285 4315 -70.22 1939 6985 -72.24Insurance x 80 -- x 178 --Services 3480 8240 -57.77 5721 13628 -58.02Furniture, furnishings, appliances & services 17516 42411 -58.70 25839 66890 -61.37
Transport
5.17 This head includes purchase and repairs of transport equipment and consumption of transport services. This group accounts for about 38 percent of the difference between the NAS and NSS estimates of non-food consumption for both the years 1999-00 and 2004-05 (Table 20). Divergence between the estimates for this head has been high even in the past. Table 27 shows that the divergence, which was of the order of over 60 per cent in the early 1970’s increased to 77 percent in 1999-00 and 82 percent in 2004-05.

Central Statistical Organisation National Accounts Division
44
Table 27: Difference between the NSS and NAS Estimates of Consumption of transport in different Years (Rs. Crore)
Year Item NSS NAS Difference for the group
% Difference
Difference for "all non-food"
1972-73 transport equipment 117 381 -264 -69.29 transport services 489 1257 -768 -61.1 Transport: total 606 1638 -1032 -63 -24.38
1977-78 transport equipment 211 853 -642 -75.26 transport services 900 2971 -2071 -69.71 Transport: total 1111 3824 -2713 -70.95 -19.63
1993-94 transport equipment 7178 24592 -17414 -70.81 transport services 8450 36143 -27693 -76.62 Transport: total 15628 60735 -45107 -74.27 -49.251999-00 transport equipment 16144 56259 -40115 -71.30 transport services 18127 93727 -75600 -80.66 Transport: total 34271 149986 -115715 -77.15 -49.972004-05 transport equipment 30051 131867 -101816 -77.21 transport services 26169 181455 -155286 -85.58 Transport: total 56220 313322 -257102 -82.06 -60.20 5.18 The share of ‘transport services’ in the estimates of non-food consumption as a whole being higher, its contribution to the divergence too is of greater significance. The item-group ‘transport services’ alone is responsible for about 25 percent of the divergence observed between the NAS and NSS estimates of total non-food consumption for 1999-00 and 23 percent in 2004-05.
Transport Services
5.19 Table 28 gives a detailed comparison between the NAS and NSS estimates of consumption of different types of transport services for 1999-00 and 2004-05. It is seen that the NSS estimate for this group are less by about 81 percent in 1999-00 and 86 percent in 2004-05 of the corresponding NAS estimates.
Table 28: Comparison between NAS and NSS Estimates of Consumption of Transport Services (Rs. Crore)
1999-00 2004-05 Items NSS NAS %
differenceNSS NAS %
difference
Air fare 253 1492 -83.04 784 2370 -66.92Rail fare 1656 7665 -78.40 2656 11250 -76.39Bus (including tram) fare 13155 40577 -67.58 16955 88480 -80.84Taxi, auto-rickshaw fare etc. 1995 36599 -94.55 4307 68731 -93.73
Others with incidental services 1068 7394 -85.56 1467 10624 -86.19Transport services: Total 18127 93727 -80.66 26169 181455 -85.58

Central Statistical Organisation National Accounts Division
45
5.20 In national accounting, estimates of total passenger earnings are worked out separately for each mode and a proportion of each is attributed to private consumption. For rail, air and organised water transport the data are directly available from the annual reports. Of the gross passenger earnings, 80 per cent for rail, 25 per cent for air are taken as private consumption. For the other modes of mechanised road transport, the gross passenger earnings are estimated as the product of an estimated average ‘earnings per vehicle’ and total number of vehicles. Of the gross passenger earnings, 50 per cent for taxi, 90 per cent each for auto-rickshaws and buses are taken as private consumption.
5.21 The NSS estimate includes expenditure incurred on account of journeys undertaken and transportation of goods made by air, rail, bus, steamer, car, taxi, and other mechanised and non-mechanised means of conveyance. It includes all expenses on account of conveyance for the households’ domestic purposes and excludes that incurred for official and business purposes. As far as coverage is concerned, the NSS estimates are by and large comparable with the NAS estimates.
5.22 The NSS estimates are by far lower than the corresponding NAS estimates. Clearly, the NSS estimates for air and rail appear to be on the lower side, as the NAS estimates are based on reliable accounting data of gross receipts. On the other side, the ratios used for arriving at the NAS estimates of private consumption from the gross earnings were revised in the recent base revision (1999-2000) to make them more realistic. In view of this, the following issues need to be investigated further to validate the NAS estimates:
The estimates of number of vehicles available from the Ministry of Surface Transport (MoST) are based on registration of vehicles. It may not represent the actual number in operation.
Validity of the estimates of per vehicle earnings used at present for the NAS estimates.
Validity of the assumed ratios of private consumption of these services used for deriving the NAS estimates.
Transport Equipment and Operational Cost
5.23 Table 29 gives the comparable item-wise estimates of ‘transport equipment and operational costs’, as available from the two sources for 1999-00
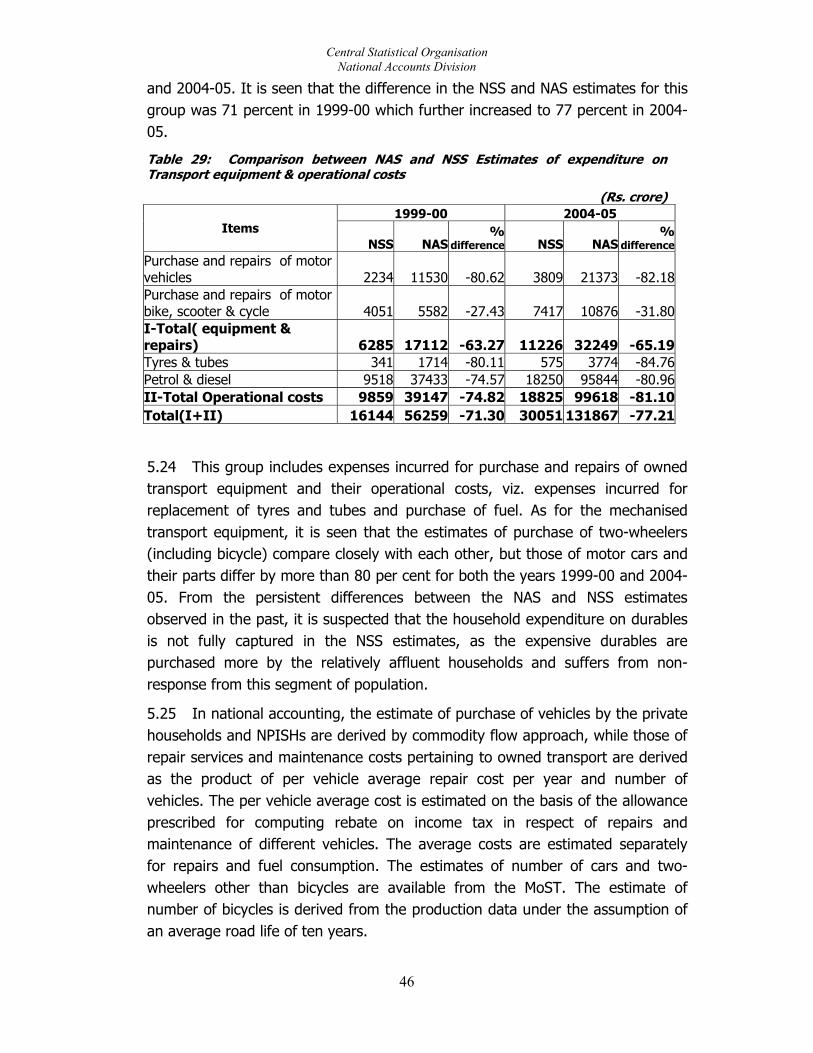
Central Statistical Organisation National Accounts Division
46
and 2004-05. It is seen that the difference in the NSS and NAS estimates for this group was 71 percent in 1999-00 which further increased to 77 percent in 2004-05.
Table 29: Comparison between NAS and NSS Estimates of expenditure on Transport equipment & operational costs
(Rs. crore) 1999-00 2004-05
Items NSS NAS
% difference NSS NAS
% difference
Purchase and repairs of motor vehicles 2234 11530 -80.62 3809 21373 -82.18Purchase and repairs of motor bike, scooter & cycle 4051 5582 -27.43 7417 10876 -31.80I-Total( equipment & repairs) 6285 17112 -63.27 11226 32249 -65.19Tyres & tubes 341 1714 -80.11 575 3774 -84.76Petrol & diesel 9518 37433 -74.57 18250 95844 -80.96II-Total Operational costs 9859 39147 -74.82 18825 99618 -81.10Total(I+II) 16144 56259 -71.30 30051 131867 -77.21
5.24 This group includes expenses incurred for purchase and repairs of owned transport equipment and their operational costs, viz. expenses incurred for replacement of tyres and tubes and purchase of fuel. As for the mechanised transport equipment, it is seen that the estimates of purchase of two-wheelers (including bicycle) compare closely with each other, but those of motor cars and their parts differ by more than 80 per cent for both the years 1999-00 and 2004-05. From the persistent differences between the NAS and NSS estimates observed in the past, it is suspected that the household expenditure on durables is not fully captured in the NSS estimates, as the expensive durables are purchased more by the relatively affluent households and suffers from non-response from this segment of population.
5.25 In national accounting, the estimate of purchase of vehicles by the private households and NPISHs are derived by commodity flow approach, while those of repair services and maintenance costs pertaining to owned transport are derived as the product of per vehicle average repair cost per year and number of vehicles. The per vehicle average cost is estimated on the basis of the allowance prescribed for computing rebate on income tax in respect of repairs and maintenance of different vehicles. The average costs are estimated separately for repairs and fuel consumption. The estimates of number of cars and two-wheelers other than bicycles are available from the MoST. The estimate of number of bicycles is derived from the production data under the assumption of an average road life of ten years.
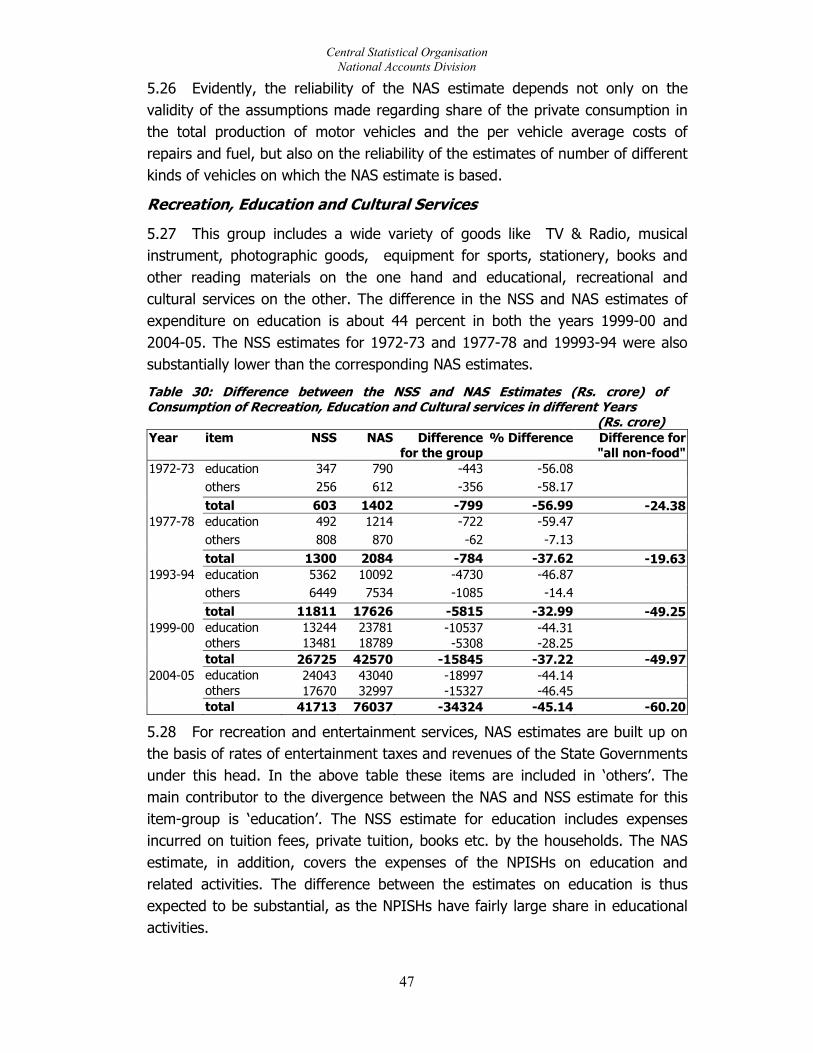
Central Statistical Organisation National Accounts Division
47
5.26 Evidently, the reliability of the NAS estimate depends not only on the validity of the assumptions made regarding share of the private consumption in the total production of motor vehicles and the per vehicle average costs of repairs and fuel, but also on the reliability of the estimates of number of different kinds of vehicles on which the NAS estimate is based.
Recreation, Education and Cultural Services
5.27 This group includes a wide variety of goods like TV & Radio, musical instrument, photographic goods, equipment for sports, stationery, books and other reading materials on the one hand and educational, recreational and cultural services on the other. The difference in the NSS and NAS estimates of expenditure on education is about 44 percent in both the years 1999-00 and 2004-05. The NSS estimates for 1972-73 and 1977-78 and 19993-94 were also substantially lower than the corresponding NAS estimates.
Table 30: Difference between the NSS and NAS Estimates (Rs. crore) of Consumption of Recreation, Education and Cultural services in different Years (Rs. crore) Year item NSS NAS Difference
for the group% Difference Difference for
"all non-food"1972-73 education 347 790 -443 -56.08
others 256 612 -356 -58.17 total 603 1402 -799 -56.99 -24.38
1977-78 education 492 1214 -722 -59.47 others 808 870 -62 -7.13 total 1300 2084 -784 -37.62 -19.63
1993-94 education 5362 10092 -4730 -46.87 others 6449 7534 -1085 -14.4 total 11811 17626 -5815 -32.99 -49.25
1999-00 education 13244 23781 -10537 -44.31 others 13481 18789 -5308 -28.25 total 26725 42570 -15845 -37.22 -49.972004-05 education 24043 43040 -18997 -44.14 others 17670 32997 -15327 -46.45 total 41713 76037 -34324 -45.14 -60.20
5.28 For recreation and entertainment services, NAS estimates are built up on the basis of rates of entertainment taxes and revenues of the State Governments under this head. In the above table these items are included in ‘others’. The main contributor to the divergence between the NAS and NSS estimate for this item-group is ‘education’. The NSS estimate for education includes expenses incurred on tuition fees, private tuition, books etc. by the households. The NAS estimate, in addition, covers the expenses of the NPISHs on education and related activities. The difference between the estimates on education is thus expected to be substantial, as the NPISHs have fairly large share in educational activities.

Central Statistical Organisation National Accounts Division
48
CHAPTER-VI
MAJOR FINDINGS ON COMPARABILITY OF TWO SETS OF ESTIMATES
6.1 The estimates of private final consumption expenditure available from two sources, one from household consumer expenditure surveys of NSSO and other from National Accounts Statistics of CSO, are different due to the procedures followed to compile them. NSS estimate is compiled from the data collected through household surveys. The monthly per capita consumer expenditure available separately for rural and urban areas from the surveys is multiplied by the respective population to arrive at total PFCE estimate. Whereas the CSO estimate is prepared as one of the macro-aggregates of National Accounts Statistics following “commodity flow” approach. This approach consists of netting out intermediate consumption, change in stocks and exports net of imports from the total value of output to get the net availability of the commodities in the domestic economy. An amount is also discounted for the wastage of agricultural produce. From the net availability, the part used for capital formation and that used by the general government administration for current consumption are deducted to arrive at the commodity-wise estimates of private final consumption expenditure (PFCE) at current market prices. This represents the value of goods and services consumed by the households and NPISHs.
6.2 The NSS estimate of total household consumption was lower than the NAS estimate of private final consumption expenditure by only 5 per cent in 1972-73 and about 10 per cent in 1977-78. The divergence increased to a level of about 25 per cent by 1983-84, remained at almost the same level in 1987-88, and then became as high as 38 per cent in 1993-94.The difference further increased to about 43 percent in 1999-00 and 50 percent in 2004-05.
6.3 The difference in the expenditure of non-food items is more than the difference of expenditure on food items. For the year 1972-73, the expenditure on food items from both the sources is almost same. The estimate of PFCE of NAS increased faster than that the NSS estimates thereafter. The difference between the NSS and NAS estimates was 8 per cent in 1977-78, became 19 per cent in 1983-84 and 29 per cent in 1993-94. It ranged between 35 to 40 percent during 1999-00 to 2004-05. Whereas the difference in the consumption of non-food items was 17 per cent in 1972-73, increased manifold to around 50 per cent in 1993-94 and 1999-00. The difference is 60 percent in 2004-05.

Central Statistical Organisation National Accounts Division
49
6.4 The comparison of the two sets of estimates is constrained by certain differences inherent in the approaches adopted by the two agencies. The following is a brief discussion on the identified possible reasons for differences that are inherent in the methods of estimation used by the two agencies.
i). The Household Consumer Expenditure Surveys (HCES) of the NSSO excludes the houseless and the institutional population and consumption expenditure on account of NPISHs while the consumption of these persons is included in NAS estimate. As for the consumption expenditure of NPISHs, it is not possible to derive any reasonable estimate of its share in the NAS estimate of PFCE. Since the activities of NPISHs have increased significantly in the recent years, it could be one of the factors for widening of the gap.
ii). The agricultural items produced during an agricultural year are not necessarily consumed during the same period, nor is the current year’s consumption drawn entirely from the current year’s production. As the NSS survey period is generally an agricultural year and the NSS estimates represent the actual consumption during the agricultural year where as the NAS estimates refer to the financial year. Therefore, the NAS estimates are strictly not comparable with the NSS estimates. The comparability, however, should not be seriously affected if the difference in the output of food crops in two successive years is not significant.
iii). The classification schemes adopted by NSS and NAS differ considerably in many respects. Previous to 1980-81 series, expenditure on ‘hotels & restaurants’ was used to be classified under non-food consumer services in the NAS while it was included in the food group in the NSS estimate. Expenditure on purchase and repairs of transport equipment is classified under ‘durables’ in the NSS estimates, while it is included in the transport-group in the NAS estimates of PFCE.
iv). The value of the “cooked meals” served to a domestic help by an employer household forms a part of ‘food’ consumption of the employer household in NSS. On the other hand, in NAS estimate it forms consumption of ‘services’ for the employer households.
v). Estimates of rent on dwellings include all imputed rentals of owner-occupied dwellings in NAS while in NSS the rent actually paid is taken. NSS has recently started collecting the imputed rentals for the owner occupied dwellings for urban areas only. However, for comparison purposes this information is not taken into account. The adjustment in NSS estimates is made as per the procedure followed in the earlier years i.e., adding NAS estimates of imputed rentals for owner occupied dwellings both in rural and urban areas. The Financial

Central Statistical Organisation National Accounts Division
50
Intermediation Services Indirectly Measured (FISIM) is another such notional component in the NAS estimate. The NSS estimates adjusted for the ‘notional’ elements and the NAS estimates adjusted for prices are given in Appendix II. It is seen that the adjustments, on the whole, closes the gap by about 9 percentage points in both the years 1999-2000 and 2004-05. The difference due to notional elements i.e., imputed rentals and FISIM and due to price differential is given below:
Overall difference in NAS and NSS estimates (%age points)
1999-2000 2004-05 S.No. Food Non
Food Total Food Non
Food Total
1. Without Adjustment 36.49 49.97 43.03 35.20 60.20 50.29
2. Adjustment for FISIM and Imputed Rental
36.49 34.73 35.63 35.20 45.44 41.38
3. Adjusted for Price and notional elements
32.93 35.15 34.04 34.84 45.72 41.44
4. Adjustment due to price alone
-3.56 0.42 -1.59 -0.36 0.28 0.06
vi). The difference due to the ‘notional’ elements like imputed rent and FISIM in the NAS estimate is 7.4% in 1999-2000 and 8.9% in 2004-05. On removing these components, the overall difference between two sets of estimates comes down from 43.03% to 35.63% in 1999-2000 and from 50.29% to 41.38% in 2004-05. As these components are from non-food category, the difference in non-food expenditure after adjusting for imputed rent and FISIM comes down from 49.97% to 34.73% in 1999-00 and from 60.20% to 45.44% in 2004-05.
vii). After adjusting NAS estimates of expenditure by the implicit prices of NSS, the difference in food expenditure came down by 3.56 percentage points and non-food expenditure increased by 0.42 percentage points. The total expenditure after adjusting for prices came down by 1.59 percentage points in 1999-2000. In 2004-05, there is not much impact of price differential on food and non-food expenditure. 6.5 The item-wise comparison of NSS and NAS estimates of food and non-food consumption is summarized below:

Central Statistical Organisation National Accounts Division
51
6.6 The NSS estimates of food sub-group are lower than NAS estimates by 35 to 36 percent in the years, 1999-2000 and 2004-05. In 1999-2000, NSS estimate of consumption of ‘Cereals & Cereal Products’ was 21 percent lower than NAS estimate. Where as the trend is reverse in 2004-05. The NSS estimate is 16 per cent higher than NAS estimate. The major contributors in the difference in this group are ‘fruits & vegetable’, followed by ‘milk & milk products’ and ‘cereals & cereal products’. These three commodity groups contribute about 60% in difference in the estimates of food consumption from two sources in both the years
6.7 The NSS estimate of expenditure on food grains consumption was higher than that of the NAS for the years 1972-73 and 1977-78. But it is important to note that unlike the estimates for earlier years, the NAS estimate for 1993-94 and 1999-00 exceeds the corresponding NSS estimate. The trend has reversed in the year 2004-05. 6.8 For the year 1999-00, the unadjusted NAS estimate of total cereals consumption is higher than the NSS estimate by Rs. 34390 crore, which reduces to Rs 19331 crore once the NAS quantity estimates are evaluated at NSS implicit prices. In 2004-05, the NSS estimates which are higher by Rs. 19071 crore than the NAS estimate reduces to Rs 9087 crore on adjusting NAS estimates for NSS prices. 6.9 Pulses and Pulses Products is the only major item-group of food consumption for which the NSS estimates are found to be higher than the NAS estimates. The difference between the two sets of estimates is largely due to higher implicit price in NSS estimates. Adjustment for prices of the NAS estimates of value substantially reduces the gap.
6.10 Milk and Milk products item-group is only next to ‘fruits and vegetable’ group in its contribution towards the discrepancy between the estimates of food consumption. The consumption of milk products is overestimated by the CSO. A part of the volume of milk assumed to be used for butter and lassi production may in fact be used as intermediate consumption in enterprises producing other commodities like sweetmeat, tea and coffee, hotel and restaurant services, consumption of which are estimated separately in the NAS.
6.11 The NSS estimate of consumption expenditure of ‘edible oils and oilseeds’ are lower than the NAS estimates. For vanaspati no adjustment is made for its

Central Statistical Organisation National Accounts Division
52
use in other industries in NAS estimates. This appears to be an important reason for the difference between the estimates of vanaspati consumption, since it is used extensively in commercial establishments like halwais, hotels and restaurants.
6.12 The difference in the estimates of consumption is most pronounced for the oilseeds. It may be noted that groundnuts used as such are not included here. Notwithstanding the possibility of underreporting in the NSS, the NAS estimate for oilseeds appears to be on the higher side, particularly because the latter is based on the assumption that the entire amount of oilseeds retained by the producers is consumed as oilseeds.
6.13 Meat, Fish and Egg is another item-group of food items for which the estimates from the two sources vary widely. The estimates were comparable for the year 1972-73 and 1977-78. But the difference increased to 45 percent in 1993-93, 54 percent in 1999-00 and 59 percent in 2004-05. The items such as chicken, egg and egg products and the fish are the main contributors in the divergence. The important reason for the discrepancy may be that the intermediate consumption for most of the items of this group is taken as nil in the NAS.
6.14 The "fruits and vegetables and their products” contributes maximum in the difference between the NAS and NSS estimates of consumption expenditure in the the item-groups of food consumption. The reporting of fruits probably suffers severely from recall lapse in the HCES. Fruits consumed outside home are most likely not captured in the HCES.
6.15 NAS consumption estimates for Tobacco item-group always been substantially higher than the NSS estimates. The NSS estimates are likely to be on the lower side, as the data collected through interviews are expected to be adversely affected by under-reporting resulting from the inhibitions against consumption of tobacco. Moreover, in the HCES, information is usually collected from a member of the household, who is often unaware of tobacco consumption habits of the other members of the household.

Central Statistical Organisation National Accounts Division
53
6.16 The Hotel and Restaurant -group was classified in the category of services till the 1970-71 series of the NAS which is taken as a part of the food consumption since the 1980-81 series. NSS estimate for this group was higher than the NAS estimate in both 1972-73 and 1977-78. But, for 1993-94 onwards the trend is reversed. The NAS estimate is expected to be higher due to the larger coverage than NSS. The receipts from accommodation charges may be one of the major causes of divergence in the estimates for this item. 6.17 In non-food group, except ‘fuel and light’, the NSS estimate for all items is much lower than the NAS estimate. Three items namely, gross (house) rent & water charges, transport services and miscellaneous goods & services are main contributors to the difference.
6.18 In the ‘Clothing and footwear’, gap in the two estimates has increased from 19% in 1999-00 to 54% in 2004-05. A significant decline of 15% in the NSS estimates of ‘clothing & footwear’ from 1999-2000 to 2004-05 and an increase of 51% in NAS estimates has resulted in the widening of the gap. The reason for decline in the estimate of ‘clothing & footwear’ in 2004-05 is that the NSS estimates for 1999-2000 were based on 365 days’ data, which in recent years have been yielding higher estimates than 30 days’ data for clothing, footwear, education and durables. The 365 days’ data for 2004-05 wipes out the observed decline in the NSS estimate of clothing and footwear between 1999-2000 and 2004-05 and shows the NSS estimate to have increased since 1999-2000, but at a slow pace than NAS estimates. Nevertheless, the gap between NSS and NAS estimates has widened in 2004-05. The NSS estimate of this sector for 2004-05 seems to suffer from under-reporting.
6.19 The item sub-groups ‘firewood & chips’ are mainly responsible for the difference between the two estimates of ‘fuel and light’. The implicit prices of NSS estimates of ‘electricity’, ‘kerosene’ and ‘L.P.G’ are higher than the implicit prices of NAS estimates. This has resulted in higher value of NAS estimates of kerosene when evaluated at NSS prices and hence changing the trend in the difference in two estimates. 6.20 In ‘medical care & health services’, difference between the NSS and NAS estimates has increased from 26% in 1999-00 to 53% in 2004-05. The NAS estimates for 1999-00 are based on the 52nd round NSS Health Care Survey and

Central Statistical Organisation National Accounts Division
54
for subsequent years it is projected using the growth rate in the per capita consumption expenditure between 52nd and 57th round HCES of NSS. Since the Health Care Survey of the 52nd round of NSS was focused on medical care, it is presumed to have collected the data more accurately compared to the household consumer expenditure surveys. This has resulted in wide gap between the two sets of estimates for the year 1999-2000. The gap has widened due to use of higher growth rate observed between per capita consumption expenditure of 52nd and 57th round HCES which is 15 % per annum, as compared to the growth of 6% observed between 55th (1999-00) and 61st(2004-05) round. As a result the difference which was Rs. 14000 crore in 1999-00 became Rs. 62,000 crore in 2004-05. 6.21 Transport includes purchase and repairs of transport equipment and consumption of transport services. In non-food items, item-group Transport is the major contributor. ‘Transport equipments & operation cost’ and ‘Transport services’ contribute about 38% of the total difference in both the years i.e., 1999-2000 and 2004-05. The NAS does not include transportation of goods made by the private consumption units, which undeniably forms an insignificant part of the whole. Besides under-reporting in the HCES, the estimates of number of vehicles, per vehicle earnings and ratios of private consumption are perhaps important reasons for divergence.
6.22 The difference in the NSS and NAS estimates for ‘transport equipment and operational cost’ was 71 percent in 1999-00 which further increased to 77 percent in 2004-05. It is suspected that the household expenditure on durables is not fully captured in the NSS estimates, as the expensive durables are purchased more by the relatively affluent households, which do not respond properly or adequately to the NSS surveys.
6.23 The difference in the NSS and NAS estimates of expenditure on ‘education’ is about 44 percent in both the years 1999-00 and 2004-05. The NSS estimates for 1972-73 and 1977-78 and 19993-94 were also substantially lower than the corresponding NAS estimates. The NAS estimate, in addition, covers the expenses of the NPISHs on education and related activities. The difference between the estimates on education is thus expected to be substantial, as the NPISHs have fairly large share in educational activities.

Central Statistical Organisation National Accounts Division
55
6.24 In the above paragraphs the reasons for the divergence between NAS and NSS estimates of private consumption expenditure have been discussed in detail. Besides the difference in the two estimates, the more concerning issue is the widening of this gap over the years. It has been observed that the difference is more in non-food items as compared to food items and the share of non-food items is increasing over the years. The share of different commodity groups from 1972-73 is given below to highlight the changing share of these commodities over the years. Expenditure as % of total Consumer Expenditure (Rural & Urban Combined) S. No Item 27th 32nd 38th 43rd 50th 55th 61st Group round round round round round round round (1972-73) (1977-78) (1983-84) (1987-88) (1993-94) (1999-00) (2004-05)
1 Cereals 37.1 30.1 29.2 23.5 21.5 19.5 15.72 Food (total) 71.2 63.3 64.0 62.1 61.0 56.3 51.43 Fuel & Light 5.6 6.1 7.0 7.3 7.2 7.6 10.14 Misc goods &
services 10.8 11.3 14.4 16.7 20.0 22.8 27.3
5 Durables 2.2 7.4 2.3 3.3 2.9 2.9 3.6 6 Non-food
(total) 28.8 36.7 36.0 37.9 39.0 43.7 48.6
6.25 Misc. goods and services include education, medical care and rent & taxes. The share of food items has come down from 71% in 1972-73 to 61% in 1993-94 and to 51% in 2004-05. The non-food items which have larger contribution in the difference have increased from 29% in 1972-93 to almost 49% in 2004-05. Increasing share of those items whose contribution in total expenditure is more is one of the reasons for widening of the gap.
Central Statistical Organisation National Accounts Division
56
CHAPTER-VII
CONCLUDING REMARKS AND SUGGESTIONS
7.1 The difference in the two sets of estimates is inherent in the methodologies adopted for preparing the estimates. It is difficult to say which one is more accurate. The NSS estimates suffer from difference in coverage, under-reporting, recall lapse in case of non-food items or for the items which are less frequently consumed and increase in non-response particularly from affluent section of population. It is suspected that the household expenditure on durables is not fully captured in the NSS estimates, as the expensive durables are purchased more by the relatively affluent households, which do not respond accurately to the NSS surveys. 7.2 Moreover, the NSS schedule is not modified to capture the new items entering into the economy like electronic and communication equipments. They are covered in the category of ‘others’. Expenditure on these items may not be getting reflected adequately.
7.3 The NAS estimate also covers the expenses of the NPISHs on education and related activities which are not captured adequately in NSS estimates. It is not possible to segregate the share of these components in the total difference between PFCE of NAS and NSS as no data is available for NPISH sector.
7.4 After adjusting for the notional components like FISIM and imputed rentals, 35-40% of the difference still remains to be reconciled. For this, there is a need to conduct fresh studies to update rates and ratios used for improving NAS estimates of PFCE. At the same time measures have to be taken to improve the under reporting of NSS estimates.
7.5 The following are some suggestions for improvement in the methods of deriving NAS estimates and data collection in the HCES:
(i) The NAS and NSS estimates for the important sub-groups of food items like major cereals, more commonly used pulses and edible oils, liquid milk and
Central Statistical Organisation National Accounts Division
57
vegetables do not differ much. The recall lapse in NSS estimates could be the main reason for the under reporting of these items. The gap can be narrowed down by using a shorter reference period of 7-days for these items. The experiment with different reference periods carried out during 51st to 54th rounds of HCES shows that 7-day reference period captures more accurately the consumption expenditure on food items. It has been observed that the 7-day reference period yields higher estimates of food items as compared to 30-day reference period.
(ii) The NAS estimates of food items are prepared using average prices which are based on the data collected in the regular price collection schemes. The qualities of these commodities vary over a wide range. But, for each commodity, prices of only fixed set specified qualities are collected in the price collection schemes, notwithstanding the changes in the market shares of different qualities that take place over time. The NSS implicit prices, on the other hand, represent the average price of the commodities appropriately weighted by the actual shares of different qualities in the current consumption basket. Thus, the prices used for NAS estimates may often not be appropriate for evaluating the value of consumption. For this purpose, the NSS implicit prices can be generated from the data collected in the HCES, separately for consumption out of home-grown stock and that out of quantity purchased. The feasibility of deriving NAS value estimates using NSS implicit prices requires a comprehensive study. (iii) The accuracy of the NAS estimates, being derived by commodity flow approach, depends heavily on the accuracy of rates, ratios and norms applied on the production estimates for netting out the amounts used for further production in the form of seeds, feeds and inter-industry consumption. The NAS estimates also depend on the estimated ratio of marketable surplus. These rates and ratios are not revised at regular intervals and hence not capturing the current pattern of their use. For example, the NAS estimates of pulses suffer from an upward bias, as the present method makes no provision for intermediate consumption of the dals in hotels and restaurants or in other industries. Similarly, for vanaspati no adjustment is made for its use in other industries. This appears to be an important reason for the difference between the estimates of vanaspati consumption, since it is used extensively in commercial establishments like halwais, hotels and restaurants. Therefore, the rates –ratios used in NAS estimates needs to be revised by carrying out fresh studies.
Central Statistical Organisation National Accounts Division
58
(iv) A comprehensive study needs to be undertaken to assess the amount of pulses, fruits and vegetables, vanaspati and meat, egg and fish etc. used as inputs in Hotels and Restaurants industry. The ratios of these commodities used as intermediate consumption in the existing methodology of NAS estimates do not capture correctly their use in Hotels and Restaurants sector, which has grown fast in recent years. This may help in correcting the NAS estimates of these items.
(v) The entire amount of output of manufacturing of dairy products is at present, assumed to be milk products, whereas a large part of it is in fact liquid milk of different kinds. Though this does not affect the aggregate estimate for the item-group ‘milk & milk products’, it understates the consumption of liquid milk. The estimates of milk products like butter and lassi are based on norms worked out in the past for the practices prevalent at that time. These too require revision, as the methods of disposal of milk produce have undergone vast changes in the recent past.
(vi) The underestimation of fruit consumption in the HCES may be due to non-cooperation of the affluent section of population. The reporting of fruits probably suffers severely from recall lapse also. Fruits consumed outside home are most likely not captured in the HCES. A comprehensive study needs to be undertaken to investigate possible reasons for underestimation in the HCES.
(vii) The data on change in stock used at present are not appropriate. There is hardly any reliable data on change in stock for the household sector. So far the enterprise surveys have failed to provide useable estimates of change in stock. Thus, special studies need to be undertaken to explore alternative ways of estimating the change in stock in the household sector.
(viii) The under estimation of consumption of durables has been suggested by a number of scholars in the past. The non-cooperation from the affluent households could be the main reason for the downward bias. Further investigation needs to be done for estimating the extent of under estimation in NSS estimates. A separate survey with more detailed schedule for some of these items may provide better estimates in HCES.

Central Statistical Organisation National Accounts Division
59
(ix) The NSS estimates of traveling expenses incurred by the households are grossly underestimated. A study is required to be undertaken to explore alternative means of collecting data particularly on rail and bus fares paid by the households.
(x) The NAS estimate on ‘medical and health care’ based entirely on the NSS estimate, excludes the consumption of the NPISHs. The consumption expenditure of the NPISHs is not expected to be distributed over all the food and non-food item-groups as the household consumption expenditure. In fact, NPISHs, being more active in the fields of health and education, are expected to have proportionately larger shares in these two item-groups. To estimate the magnitude and distribution of consumption expenditure of the NPISHs, it is necessary to take up a special study to examine the consumption pattern of NPISHs. The recent study on Satellite Accounts of NPIs being conducted by the CSO may give some information on the pattern of their expenditure on education and health.
(xi) The value of the “cooked meals” served to a domestic help by an employer household forms a part of ‘food’ consumption of the employer household in NSS. On the other hand, in NAS estimate it forms consumption of ‘services’ for the employer households. A study/survey may be undertaken for collecting the data on cooked meals received, as part of wages, by workers engaged in providing services to the employer household. This may help in making necessary correction for the omission in the NSS estimate of domestic services.
(xii) For some of the item-groups belonging to the service sector, the NAS estimates of gross value added (GVA) and private consumption are based on independent sources of data. The NAS estimate for consumption of road transport services by bus, taxi and auto-rickshaw as well as that of repair services of owned conveyance is derived using the data on number of vehicles available from the MoST. For the item-group ‘medical and health services’, ‘salt’, ‘spices’ and ‘pan’, the NAS estimates are derived from the NSS estimates. Thus, for these item-groups, the estimates of output, which are required for PFCE estimates may not be consistent with the estimates of GVA. Use of common data sets for both GVA and PFCE estimates for these item-groups may be attempted.
Central Statistical Organisation National Accounts Division
60
REFERENCES:
1. CSO & NSSO (2001):report on “Cross-Validation Study of Estimates of
Private Consumption Expenditure Available from Household Survey and National Accounts” by Sh. Aloke Kar, Sh.D.P.Mondal, Sh. P.D.Gupta and Dr. A.C. Kulshreshtha.
2. CSO (1980), National Accounts Statistics - Sources and Methods, April 1980 3. CSO (1989), National Accounts Statistics - Sources and Methods, October
1989 4. CSO (2007), National Accounts Statistics - Sources and Methods, March 2007 5. CSO (1981), National Accounts Statistics, 1981 6. CSO (1982), National Accounts Statistics, 1982 7. CSO (1986), National Accounts Statistics, 1986 8. CSO (1990), National Accounts Statistics, 1990 9. CSO (1992), National Accounts Statistics, 1992 10. CSO (2000), National Accounts Statistics, 2007 11. (1999) Ministry of Agriculture Department of Economics and Statistics:
Agricultural Statistics at a Glance, 1999. 12. (2006) Ministry of Agriculture Department of Economics and Statistics:
Agricultural Statistics at a Glance, 2006. 13. (2001) NSSO, Consumption of Some important Commodities in India, Report
No. 461, NSS 55th Round (July 1999 – June 2000), July 2001. 14. (2007) NSSO, Household Consumption of Various Goods and Services in India,
Report No. 509, NSS 61st Round (July 2004 – June 2005), April2007.
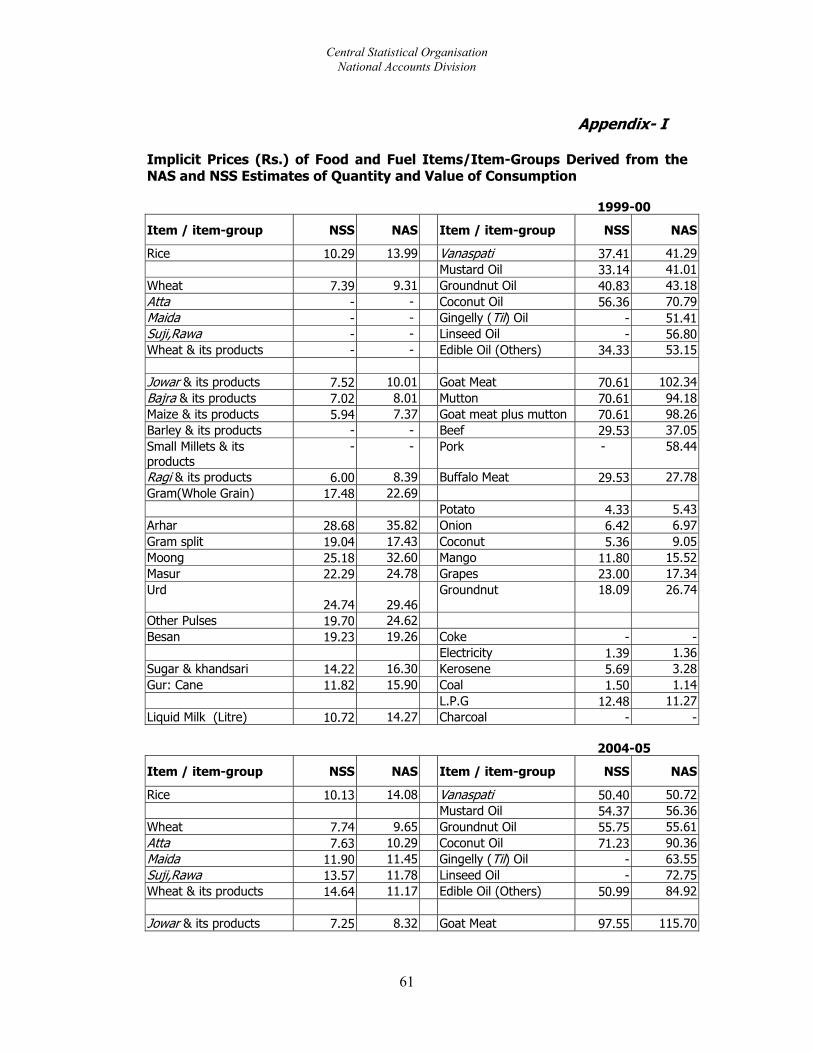
Central Statistical Organisation National Accounts Division
61
Appendix- I Implicit Prices (Rs.) of Food and Fuel Items/Item-Groups Derived from the NAS and NSS Estimates of Quantity and Value of Consumption 1999-00
Item / item-group NSS NAS Item / item-group NSS NAS
Rice 10.29 13.99 Vanaspati 37.41 41.29 Mustard Oil 33.14 41.01
Wheat 7.39 9.31 Groundnut Oil 40.83 43.18Atta - - Coconut Oil 56.36 70.79Maida - - Gingelly (Til) Oil - 51.41Suji,Rawa - - Linseed Oil - 56.80Wheat & its products - - Edible Oil (Others) 34.33 53.15
Jowar & its products 7.52 10.01 Goat Meat 70.61 102.34Bajra & its products 7.02 8.01 Mutton 70.61 94.18Maize & its products 5.94 7.37 Goat meat plus mutton 70.61 98.26Barley & its products - - Beef 29.53 37.05Small Millets & its products
- - Pork - 58.44
Ragi & its products 6.00 8.39 Buffalo Meat 29.53 27.78Gram(Whole Grain) 17.48 22.69
Potato 4.33 5.43Arhar 28.68 35.82 Onion 6.42 6.97Gram split 19.04 17.43 Coconut 5.36 9.05Moong 25.18 32.60 Mango 11.80 15.52Masur 22.29 24.78 Grapes 23.00 17.34Urd
24.74 29.46 Groundnut 18.09 26.74
Other Pulses 19.70 24.62 Besan 19.23 19.26 Coke - -
Electricity 1.39 1.36Sugar & khandsari 14.22 16.30 Kerosene 5.69 3.28Gur: Cane 11.82 15.90 Coal 1.50 1.14
L.P.G 12.48 11.27Liquid Milk (Litre) 10.72 14.27 Charcoal - - 2004-05 Item / item-group NSS NAS Item / item-group NSS NAS
Rice 10.13 14.08 Vanaspati 50.40 50.72 Mustard Oil 54.37 56.36
Wheat 7.74 9.65 Groundnut Oil 55.75 55.61Atta 7.63 10.29 Coconut Oil 71.23 90.36Maida 11.90 11.45 Gingelly (Til) Oil - 63.55Suji,Rawa 13.57 11.78 Linseed Oil - 72.75Wheat & its products 14.64 11.17 Edible Oil (Others) 50.99 84.92
Jowar & its products 7.25 8.32 Goat Meat 97.55 115.70
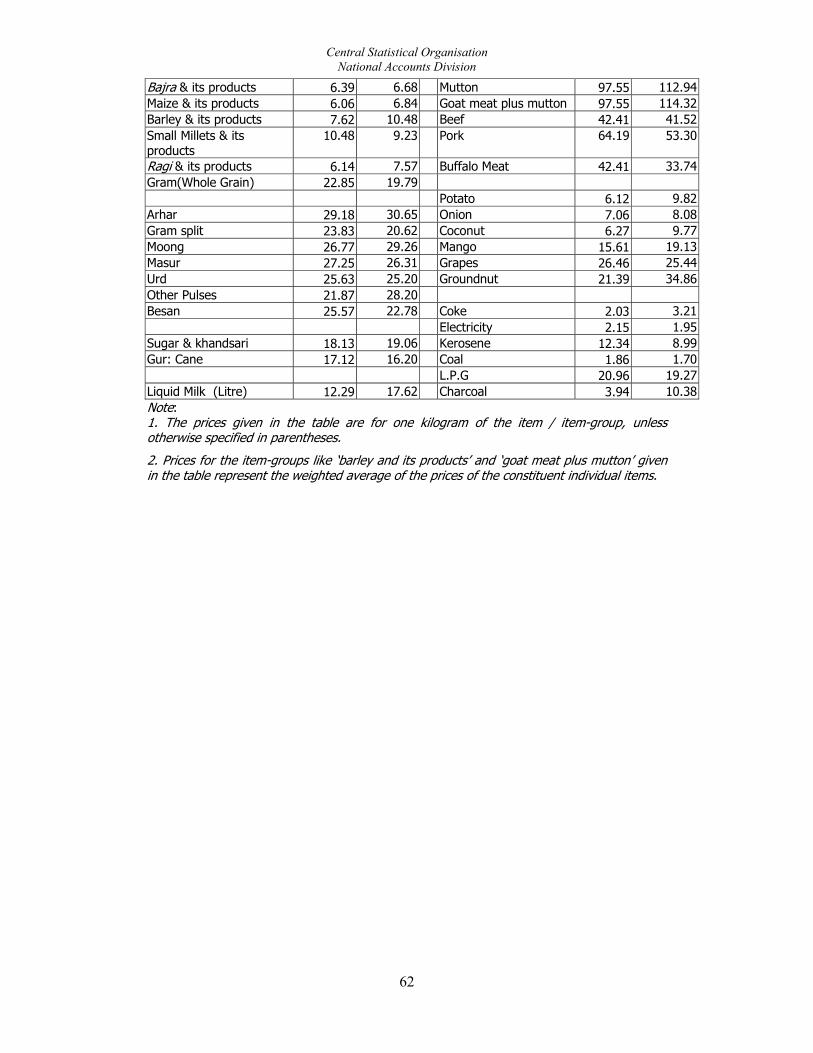
Central Statistical Organisation National Accounts Division
62
Bajra & its products 6.39 6.68 Mutton 97.55 112.94Maize & its products 6.06 6.84 Goat meat plus mutton 97.55 114.32Barley & its products 7.62 10.48 Beef 42.41 41.52Small Millets & its products
10.48 9.23 Pork 64.19 53.30
Ragi & its products 6.14 7.57 Buffalo Meat 42.41 33.74Gram(Whole Grain) 22.85 19.79
Potato 6.12 9.82Arhar 29.18 30.65 Onion 7.06 8.08Gram split 23.83 20.62 Coconut 6.27 9.77Moong 26.77 29.26 Mango 15.61 19.13Masur 27.25 26.31 Grapes 26.46 25.44Urd 25.63 25.20 Groundnut 21.39 34.86Other Pulses 21.87 28.20 Besan 25.57 22.78 Coke 2.03 3.21
Electricity 2.15 1.95Sugar & khandsari 18.13 19.06 Kerosene 12.34 8.99Gur: Cane 17.12 16.20 Coal 1.86 1.70
L.P.G 20.96 19.27Liquid Milk (Litre) 12.29 17.62 Charcoal 3.94 10.38Note: 1. The prices given in the table are for one kilogram of the item / item-group, unless otherwise specified in parentheses.
2. Prices for the item-groups like ‘barley and its products’ and ‘goat meat plus mutton’ given in the table represent the weighted average of the prices of the constituent individual items.
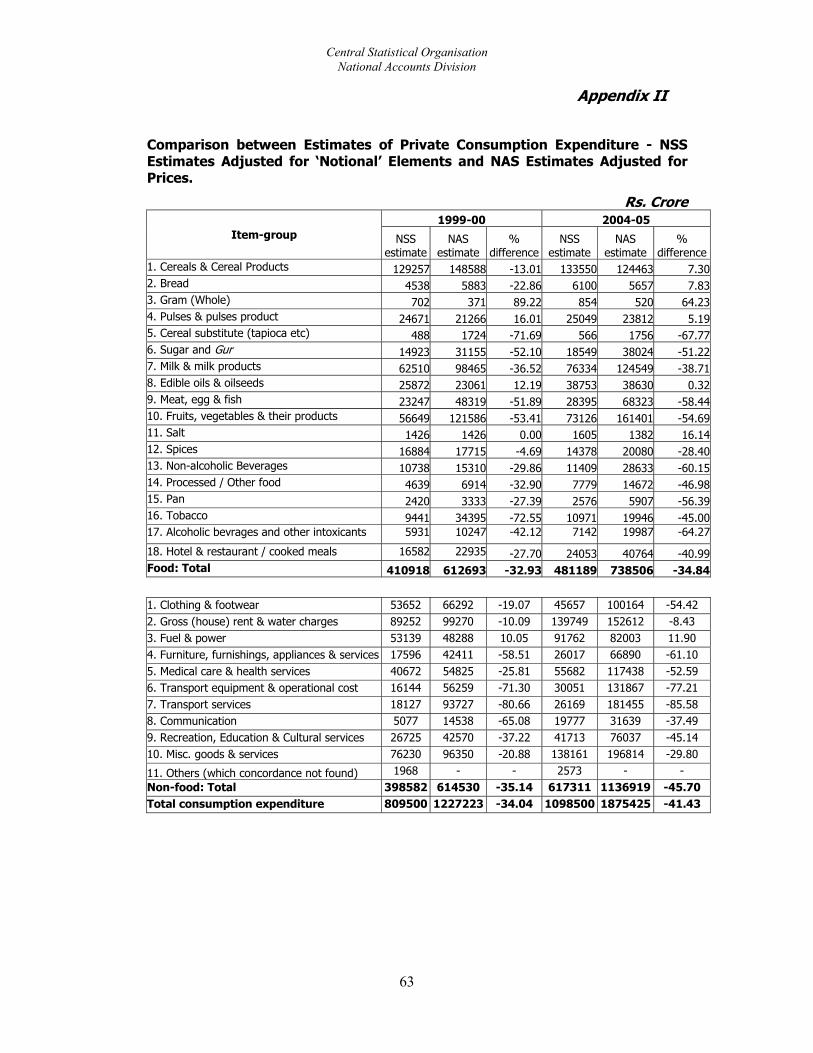
Central Statistical Organisation National Accounts Division
63
Appendix II
Comparison between Estimates of Private Consumption Expenditure - NSS Estimates Adjusted for ‘Notional’ Elements and NAS Estimates Adjusted for Prices.
Rs. Crore 1999-00 2004-05
Item-group NSS estimate
NAS estimate
% difference
NSS estimate
NAS estimate
% difference
1. Cereals & Cereal Products 129257 148588 -13.01 133550 124463 7.302. Bread 4538 5883 -22.86 6100 5657 7.833. Gram (Whole) 702 371 89.22 854 520 64.234. Pulses & pulses product 24671 21266 16.01 25049 23812 5.195. Cereal substitute (tapioca etc) 488 1724 -71.69 566 1756 -67.776. Sugar and Gur 14923 31155 -52.10 18549 38024 -51.227. Milk & milk products 62510 98465 -36.52 76334 124549 -38.718. Edible oils & oilseeds 25872 23061 12.19 38753 38630 0.329. Meat, egg & fish 23247 48319 -51.89 28395 68323 -58.4410. Fruits, vegetables & their products 56649 121586 -53.41 73126 161401 -54.6911. Salt 1426 1426 0.00 1605 1382 16.1412. Spices 16884 17715 -4.69 14378 20080 -28.4013. Non-alcoholic Beverages 10738 15310 -29.86 11409 28633 -60.1514. Processed / Other food 4639 6914 -32.90 7779 14672 -46.9815. Pan 2420 3333 -27.39 2576 5907 -56.3916. Tobacco 9441 34395 -72.55 10971 19946 -45.0017. Alcoholic bevrages and other intoxicants 5931 10247 -42.12 7142 19987 -64.27
18. Hotel & restaurant / cooked meals 16582 22935 -27.70 24053 40764 -40.99Food: Total 410918 612693 -32.93 481189 738506 -34.84
1. Clothing & footwear 53652 66292 -19.07 45657 100164 -54.42 2. Gross (house) rent & water charges 89252 99270 -10.09 139749 152612 -8.43 3. Fuel & power 53139 48288 10.05 91762 82003 11.90 4. Furniture, furnishings, appliances & services 17596 42411 -58.51 26017 66890 -61.10 5. Medical care & health services 40672 54825 -25.81 55682 117438 -52.59 6. Transport equipment & operational cost 16144 56259 -71.30 30051 131867 -77.21 7. Transport services 18127 93727 -80.66 26169 181455 -85.58 8. Communication 5077 14538 -65.08 19777 31639 -37.49 9. Recreation, Education & Cultural services 26725 42570 -37.22 41713 76037 -45.14 10. Misc. goods & services 76230 96350 -20.88 138161 196814 -29.80
11. Others (which concordance not found) 1968 - - 2573 - - Non-food: Total 398582 614530 -35.14 617311 1136919 -45.70 Total consumption expenditure 809500 1227223 -34.04 1098500 1875425 -41.43
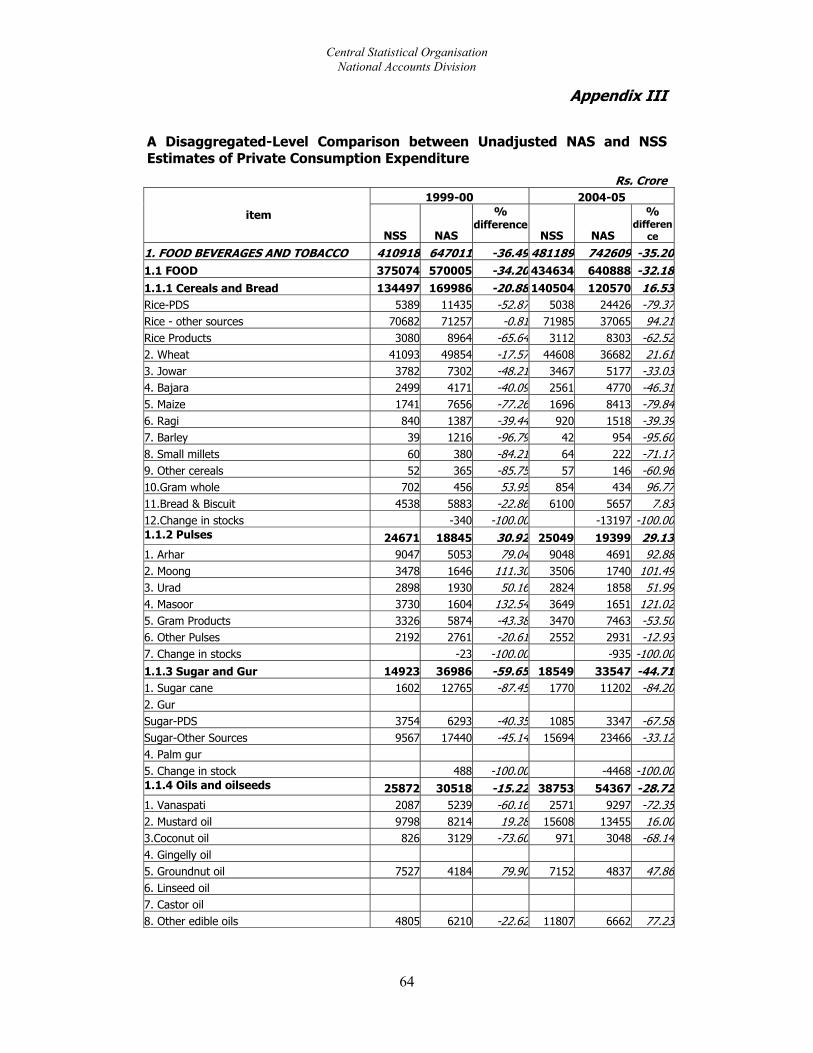
Central Statistical Organisation National Accounts Division
64
Appendix III
A Disaggregated-Level Comparison between Unadjusted NAS and NSS Estimates of Private Consumption Expenditure
Rs. Crore 1999-00 2004-05
item
NSS NAS
% difference
NSS NAS
% differen
ce 1. FOOD BEVERAGES AND TOBACCO 410918 647011 -36.49 481189 742609 -35.201.1 FOOD 375074 570005 -34.20 434634 640888 -32.181.1.1 Cereals and Bread 134497 169986 -20.88 140504 120570 16.53Rice-PDS 5389 11435 -52.87 5038 24426 -79.37Rice - other sources 70682 71257 -0.81 71985 37065 94.21Rice Products 3080 8964 -65.64 3112 8303 -62.522. Wheat 41093 49854 -17.57 44608 36682 21.613. Jowar 3782 7302 -48.21 3467 5177 -33.034. Bajara 2499 4171 -40.09 2561 4770 -46.315. Maize 1741 7656 -77.26 1696 8413 -79.846. Ragi 840 1387 -39.44 920 1518 -39.397. Barley 39 1216 -96.79 42 954 -95.608. Small millets 60 380 -84.21 64 222 -71.179. Other cereals 52 365 -85.75 57 146 -60.9610.Gram whole 702 456 53.95 854 434 96.7711.Bread & Biscuit 4538 5883 -22.86 6100 5657 7.8312.Change in stocks -340 -100.00 -13197 -100.001.1.2 Pulses 24671 18845 30.92 25049 19399 29.131. Arhar 9047 5053 79.04 9048 4691 92.882. Moong 3478 1646 111.30 3506 1740 101.493. Urad 2898 1930 50.16 2824 1858 51.994. Masoor 3730 1604 132.54 3649 1651 121.025. Gram Products 3326 5874 -43.38 3470 7463 -53.506. Other Pulses 2192 2761 -20.61 2552 2931 -12.937. Change in stocks -23 -100.00 -935 -100.001.1.3 Sugar and Gur 14923 36986 -59.65 18549 33547 -44.711. Sugar cane 1602 12765 -87.45 1770 11202 -84.202. Gur Sugar-PDS 3754 6293 -40.35 1085 3347 -67.58Sugar-Other Sources 9567 17440 -45.14 15694 23466 -33.124. Palm gur 5. Change in stock 488 -100.00 -4468 -100.001.1.4 Oils and oilseeds 25872 30518 -15.22 38753 54367 -28.721. Vanaspati 2087 5239 -60.16 2571 9297 -72.352. Mustard oil 9798 8214 19.28 15608 13455 16.003.Coconut oil 826 3129 -73.60 971 3048 -68.144. Gingelly oil 5. Groundnut oil 7527 4184 79.90 7152 4837 47.866. Linseed oil 7. Castor oil 8. Other edible oils 4805 6210 -22.62 11807 6662 77.23
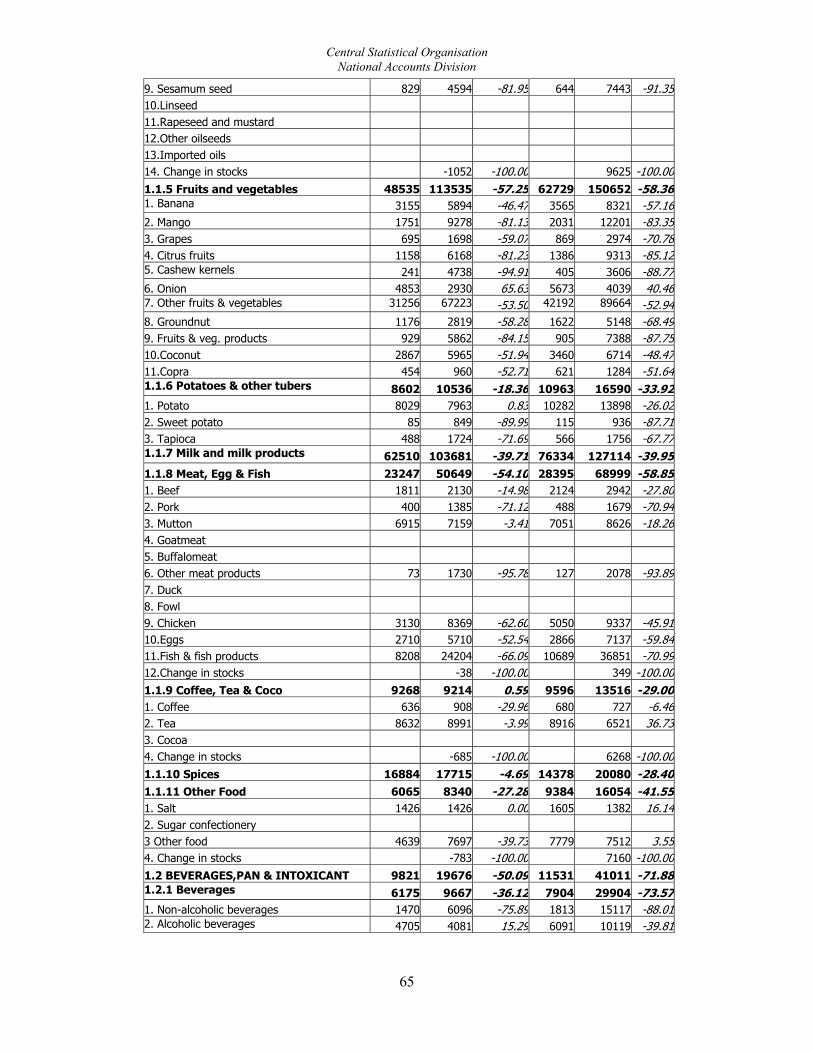
Central Statistical Organisation National Accounts Division
65
9. Sesamum seed 829 4594 -81.95 644 7443 -91.3510.Linseed 11.Rapeseed and mustard 12.Other oilseeds 13.Imported oils 14. Change in stocks -1052 -100.00 9625 -100.001.1.5 Fruits and vegetables 48535 113535 -57.25 62729 150652 -58.361. Banana 3155 5894 -46.47 3565 8321 -57.162. Mango 1751 9278 -81.13 2031 12201 -83.353. Grapes 695 1698 -59.07 869 2974 -70.784. Citrus fruits 1158 6168 -81.23 1386 9313 -85.125. Cashew kernels 241 4738 -94.91 405 3606 -88.776. Onion 4853 2930 65.63 5673 4039 40.467. Other fruits & vegetables 31256 67223 -53.50 42192 89664 -52.948. Groundnut 1176 2819 -58.28 1622 5148 -68.499. Fruits & veg. products 929 5862 -84.15 905 7388 -87.7510.Coconut 2867 5965 -51.94 3460 6714 -48.4711.Copra 454 960 -52.71 621 1284 -51.641.1.6 Potatoes & other tubers 8602 10536 -18.36 10963 16590 -33.921. Potato 8029 7963 0.83 10282 13898 -26.022. Sweet potato 85 849 -89.99 115 936 -87.713. Tapioca 488 1724 -71.69 566 1756 -67.771.1.7 Milk and milk products 62510 103681 -39.71 76334 127114 -39.951.1.8 Meat, Egg & Fish 23247 50649 -54.10 28395 68999 -58.851. Beef 1811 2130 -14.98 2124 2942 -27.802. Pork 400 1385 -71.12 488 1679 -70.943. Mutton 6915 7159 -3.41 7051 8626 -18.264. Goatmeat 5. Buffalomeat 6. Other meat products 73 1730 -95.78 127 2078 -93.897. Duck 8. Fowl 9. Chicken 3130 8369 -62.60 5050 9337 -45.9110.Eggs 2710 5710 -52.54 2866 7137 -59.8411.Fish & fish products 8208 24204 -66.09 10689 36851 -70.9912.Change in stocks -38 -100.00 349 -100.001.1.9 Coffee, Tea & Coco 9268 9214 0.59 9596 13516 -29.001. Coffee 636 908 -29.96 680 727 -6.462. Tea 8632 8991 -3.99 8916 6521 36.733. Cocoa 4. Change in stocks -685 -100.00 6268 -100.001.1.10 Spices 16884 17715 -4.69 14378 20080 -28.401.1.11 Other Food 6065 8340 -27.28 9384 16054 -41.551. Salt 1426 1426 0.00 1605 1382 16.142. Sugar confectionery 3 Other food 4639 7697 -39.73 7779 7512 3.554. Change in stocks -783 -100.00 7160 -100.001.2 BEVERAGES,PAN & INTOXICANT 9821 19676 -50.09 11531 41011 -71.881.2.1 Beverages 6175 9667 -36.12 7904 29904 -73.571. Non-alcoholic beverages 1470 6096 -75.89 1813 15117 -88.012. Alcoholic beverages 4705 4081 15.29 6091 10119 -39.81
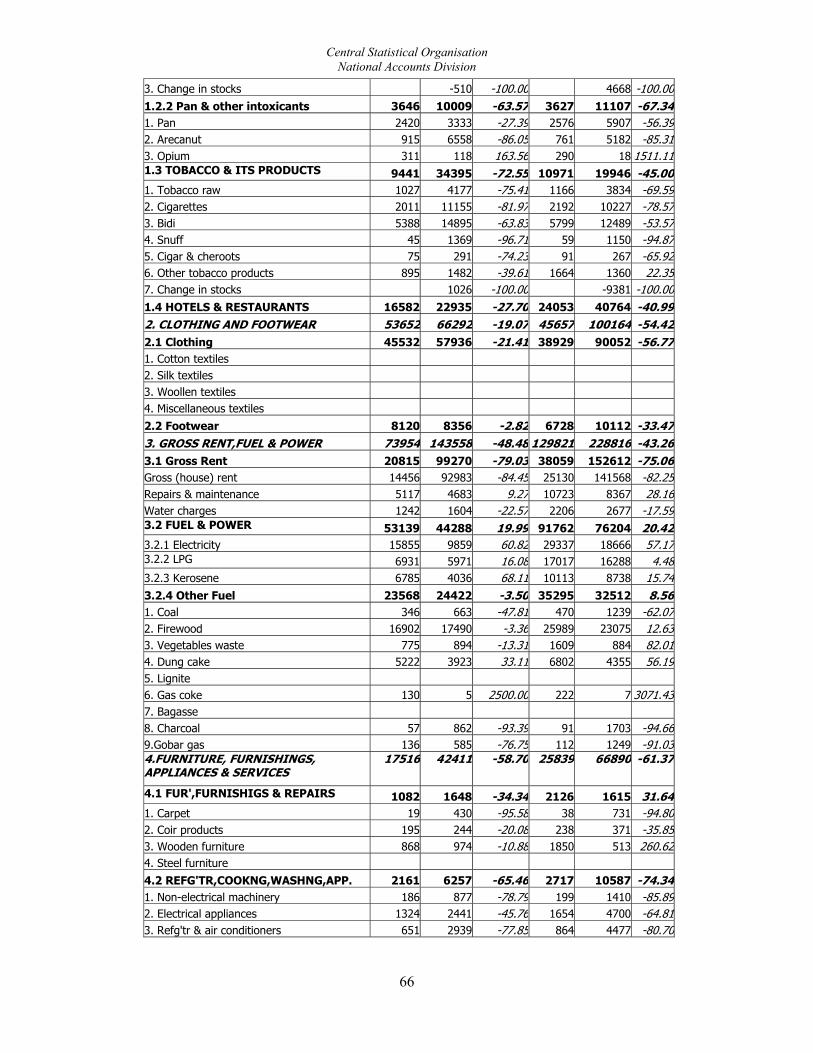
Central Statistical Organisation National Accounts Division
66
3. Change in stocks -510 -100.00 4668 -100.001.2.2 Pan & other intoxicants 3646 10009 -63.57 3627 11107 -67.341. Pan 2420 3333 -27.39 2576 5907 -56.392. Arecanut 915 6558 -86.05 761 5182 -85.313. Opium 311 118 163.56 290 18 1511.111.3 TOBACCO & ITS PRODUCTS 9441 34395 -72.55 10971 19946 -45.001. Tobacco raw 1027 4177 -75.41 1166 3834 -69.592. Cigarettes 2011 11155 -81.97 2192 10227 -78.573. Bidi 5388 14895 -63.83 5799 12489 -53.574. Snuff 45 1369 -96.71 59 1150 -94.875. Cigar & cheroots 75 291 -74.23 91 267 -65.926. Other tobacco products 895 1482 -39.61 1664 1360 22.357. Change in stocks 1026 -100.00 -9381 -100.001.4 HOTELS & RESTAURANTS 16582 22935 -27.70 24053 40764 -40.992. CLOTHING AND FOOTWEAR 53652 66292 -19.07 45657 100164 -54.422.1 Clothing 45532 57936 -21.41 38929 90052 -56.771. Cotton textiles 2. Silk textiles 3. Woollen textiles 4. Miscellaneous textiles 2.2 Footwear 8120 8356 -2.82 6728 10112 -33.473. GROSS RENT,FUEL & POWER 73954 143558 -48.48 129821 228816 -43.263.1 Gross Rent 20815 99270 -79.03 38059 152612 -75.06Gross (house) rent 14456 92983 -84.45 25130 141568 -82.25Repairs & maintenance 5117 4683 9.27 10723 8367 28.16Water charges 1242 1604 -22.57 2206 2677 -17.593.2 FUEL & POWER 53139 44288 19.99 91762 76204 20.423.2.1 Electricity 15855 9859 60.82 29337 18666 57.173.2.2 LPG 6931 5971 16.08 17017 16288 4.483.2.3 Kerosene 6785 4036 68.11 10113 8738 15.743.2.4 Other Fuel 23568 24422 -3.50 35295 32512 8.561. Coal 346 663 -47.81 470 1239 -62.072. Firewood 16902 17490 -3.36 25989 23075 12.633. Vegetables waste 775 894 -13.31 1609 884 82.014. Dung cake 5222 3923 33.11 6802 4355 56.195. Lignite 6. Gas coke 130 5 2500.00 222 7 3071.437. Bagasse 8. Charcoal 57 862 -93.39 91 1703 -94.669.Gobar gas 136 585 -76.75 112 1249 -91.034.FURNITURE, FURNISHINGS, APPLIANCES & SERVICES
17516 42411 -58.70 25839 66890 -61.37
4.1 FUR',FURNISHIGS & REPAIRS 1082 1648 -34.34 2126 1615 31.641. Carpet 19 430 -95.58 38 731 -94.802. Coir products 195 244 -20.08 238 371 -35.853. Wooden furniture 868 974 -10.88 1850 513 260.624. Steel furniture 4.2 REFG'TR,COOKNG,WASHNG,APP. 2161 6257 -65.46 2717 10587 -74.341. Non-electrical machinery 186 877 -78.79 199 1410 -85.892. Electrical appliances 1324 2441 -45.76 1654 4700 -64.813. Refg'tr & air conditioners 651 2939 -77.85 864 4477 -80.70

Central Statistical Organisation National Accounts Division
67
4.3 GLASSWARE,TABLEWARE &UTENs 1881 15284 -87.69 2552 21076 -87.891. Glass & glass products 544 12182 -95.53 893 16595 -94.622. Earthenware & China pottery 3. Metal utensils 1180 2089 -43.51 1447 3422 -57.714. Other metal products 157 1013 -84.50 212 1059 -79.984.4 OTHER GOODS 8912 10982 -18.85 12723 19984 -36.331. Matches 1391 2489 -44.11 1667 3669 -54.572. Misc. personal goods 6644 5829 13.98 9708 10210 -4.923. Plastic products 453 1176 -61.48 727 2937 -75.254. Rubber Products 22 213 -89.67 55 585 -90.605. Dry & wet batteries 402 1275 -68.47 566 2583 -78.094.5 SERVICES 3480 8240 -57.77 5721 13628 -58.021. Domestic services 2195 3845 -42.91 3782 6465 -41.502. Laundries, dry cleaning 1285 4315 -70.22 1939 6985 -72.243. General Insurance 80 -100.00 178 -100.005. MEDICAL CARE & HEALTH SERV. 40672 54825 -25.81 55682 117438 -52.596. TRANSPORT & COMMUNICATION 39348 164524 -76.08 75997 344961 -77.976.1 Personal tpt. equipment 6285 17112 -63.27 11226 32249 -65.19 1. Motor vehicles & parts 2234 11530 -80.62 3809 21373 -82.182. Mo'bikes, scooters & cycles 4051 5582 -27.43 7417 10876 -31.816.2 Operation p'nal tpt eqpt 9859 39147 -74.82 18825 99618 -81.101. Tyres & tubes 341 1714 -80.11 575 3774 -84.762. Petrol & diesel 9518 37433 -74.57 18250 95844 -80.963. Repair charges 6.3 Purchase of tpt. services 18127 93727 -80.66 26169 181455 -85.581. Rail 1656 7665 -78.40 2656 11250 -76.392. Air 253 1492 -83.04 784 2370 -66.923. Bus incl. tramways 13155 40577 -67.58 16955 88480 -80.844. Taxi 1995 36599 -94.55 4307 68731 -93.735. Autorickshaws 6. Non-mechanised road tpt. 1038 6517 -84.07 1422 9131 -84.437. Organised water tpt. 30 877 -96.58 45 1493 -96.998. Un-org. water tpt. 9. Services incidental to tpt. 6.4 Communication 5077 14538 -65.08 19777 31639 -37.497. RECREATION,EDUCATION & CULTURAL SERVICES
26725 42570 -37.22 41713 76037 -45.14
7.1 Eqpt. Paper & Stationery 10709 13931 -23.13 14806 25874 -42.781. TV & Radio 2079 7436 -72.04 2649 15332 -82.722. Musical instruments 3. Photographic goods 34 641 -94.70 19 1084 -98.254. Office Machinery 5. Sports & athletics goods 344 829 -58.50 636 1722 -63.076. Newspaper,books & magazines 5895 4861 21.27 6722 7418 -9.387. Stationery articles 2357 164 1337.20 4780 318 1403.148. Fireworks 7.2 Recreation & cultural serv 2772 4858 -42.94 2864 7123 -59.797.3 Education 13244 23781 -44.31 24043 43040 -44.148. MISC. GOODS & SERVICES 51638 96350 -46.41 72944 196814 -62.948.1 Personal care and effects 19370 37588 -48.47 29369 54463 -46.08
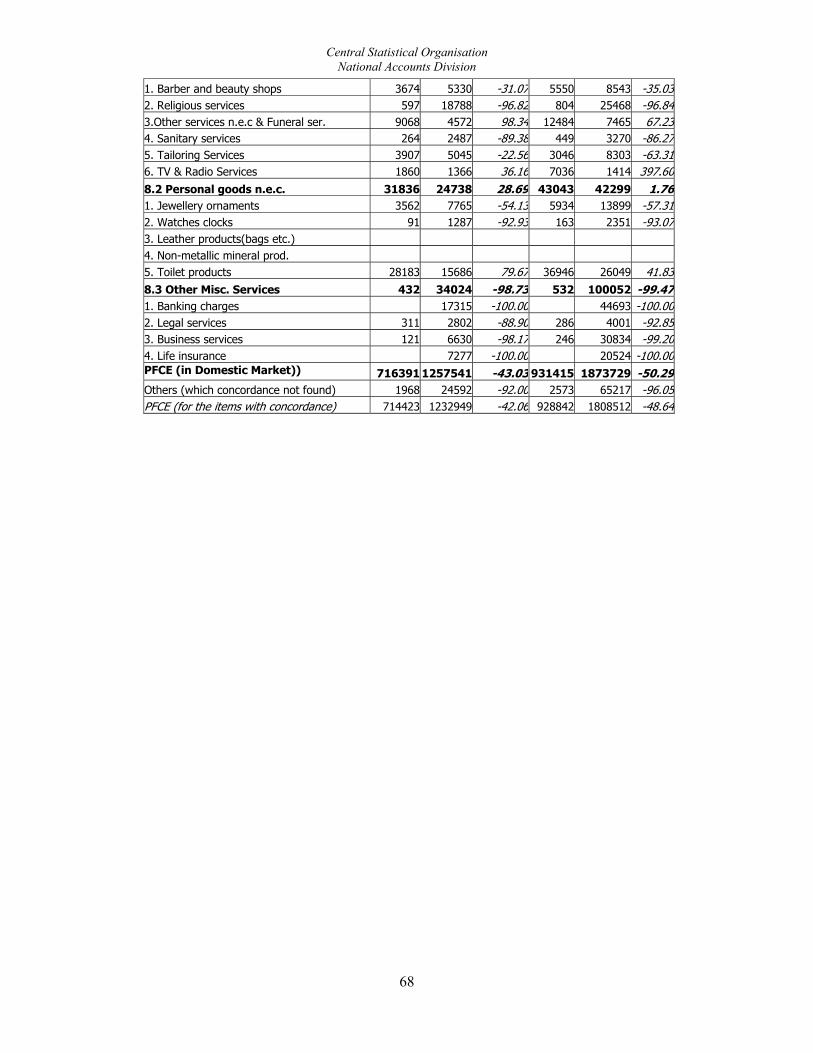
Central Statistical Organisation National Accounts Division
68
1. Barber and beauty shops 3674 5330 -31.07 5550 8543 -35.032. Religious services 597 18788 -96.82 804 25468 -96.843.Other services n.e.c & Funeral ser. 9068 4572 98.34 12484 7465 67.234. Sanitary services 264 2487 -89.38 449 3270 -86.275. Tailoring Services 3907 5045 -22.56 3046 8303 -63.316. TV & Radio Services 1860 1366 36.16 7036 1414 397.608.2 Personal goods n.e.c. 31836 24738 28.69 43043 42299 1.761. Jewellery ornaments 3562 7765 -54.13 5934 13899 -57.312. Watches clocks 91 1287 -92.93 163 2351 -93.073. Leather products(bags etc.) 4. Non-metallic mineral prod. 5. Toilet products 28183 15686 79.67 36946 26049 41.838.3 Other Misc. Services 432 34024 -98.73 532 100052 -99.471. Banking charges 17315 -100.00 44693 -100.002. Legal services 311 2802 -88.90 286 4001 -92.853. Business services 121 6630 -98.17 246 30834 -99.204. Life insurance 7277 -100.00 20524 -100.00PFCE (in Domestic Market)) 716391 1257541 -43.03 931415 1873729 -50.29Others (which concordance not found) 1968 24592 -92.00 2573 65217 -96.05PFCE (for the items with concordance) 714423 1232949 -42.06 928842 1808512 -48.64