Government of India Ministry of Earth Sciences India … › imdetp › lecture_notes › course10...
30
Lecture notes on Synoptic Meteorology for FT Course prepared by Dr. Prakash Khare Sci “E”, MTI, Pune Page 1 Government of India Ministry of Earth Sciences India Meteorological Department Meteorological Training Institute Lecture notes on Synoptic Meteorology (E- Module) of Forecasters Training Course (FTC) Prepared by Dr. Prakash Khare, Sci “E”, M.T.I., Pune
Transcript of Government of India Ministry of Earth Sciences India … › imdetp › lecture_notes › course10...

Lecture notes on Synoptic Meteorology for FT Course prepared by Dr. Prakash Khare Sci “E”, MTI, Pune
Page 1
Government of India Ministry of Earth Sciences
India Meteorological Department Meteorological Training Institute
Lecture notes on
Synoptic Meteorology
(E- Module) of
Forecasters Training Course (FTC)
Prepared by
Dr. Prakash Khare, Sci “E”, M.T.I., Pune

Lecture notes on Synoptic Meteorology for FT Course prepared by Dr. Prakash Khare Sci “E”, MTI, Pune
Page 2
Syllabus for Synoptic Meteorology
(E-learning phase of Forecasters Training Course)
Duration = 2 Months
Double equatorial troughs – depiction of Synoptic features in the equatorial regions in
different seasons for the year.
The Jet –streams. Various jet streams over the globe. Characteristics features of the various
Jet Streams.
Winter season – Western disturbances and associated weather (cold waves & fog).
Hot weather season – Norwesters; Dust storms and dust raising winds, thunderstorms,
(hail storms, heat wave).
Air masses and fronts: production and transformation of air masses; conservational
properties, the exchange properties and formation of air masses; air mass sources in winter
and summer; classification of air masses; types of transformation. – Surfaces of
discontinuity; Typical structure of fronts; slope of frontal surfaces; classification of
fronts; kinematics and dynamic boundary conditions; Frontogenesis and Frontolysis;
Frontogenetical fields; Principal frontal zones.
Lecture notes on Synoptic Meteorology for FT Course prepared by Dr. Prakash Khare Sci “E”, MTI, Pune
Page 3
PREFACE
These lecture notes have been prepared to meet the requirements of IMD
departmental trainees who will undergo the e-learning module of newly introduced
forecaster’s course from April 2015. I, as a faculty in the Meteorological Training
Institute (MTI), Pune, have been involved in the teaching of subject “Synoptic
Meteorology” and also in delivering the special lectures of Aviation and Satellite
meteorology in different courses for the last many years. It is, probably so, I have been
assigned the job of preparing the e-learning module of the Forecaster’s course for the
aforesaid subjects.
While preparing the Synoptic Meteorology lecture notes, a due care has been
taken to cover the syllabus of e-module. Brevity of the topics has been kept in mind
without sacrificing the core content.
I humbly extend my sincere thanks to D.G. IMD, New Delhi, ADGM (R) and DDGM
(Trg), Pune for entrusting responsibility on me for writing these lecture notes. I expect
that the trainees may find lecture notes useful in their e-module of Forecaster’s course
and even derive benefits after the training programme. Updating the lecture notes is a
continuous process and accordingly they may be modified as per the expectations of
the trainees in their future versions. The notes have prepared, edited and compiled in
a short span of time and thus some inadvertent errors may be possible. I will
appreciate the valuable criticism / suggestions of my seniors and trainees / colleagues
offered for enhancing the quality of these lecture notes.
(Dr.) Prakash Khare Sci “E”, MTI, Pune
Pune, March 2015 [email protected]

Lecture notes on Synoptic Meteorology for FT Course prepared by Dr. Prakash Khare Sci “E”, MTI, Pune
Page 4
Double equatorial troughs – depiction of synoptic features in the equatorial regions in different
seasons for the year.
____________________________________________________________________________
INTRODUCTION:
Tropical region is an area in between Tropic of cancer (231/20 N) and Tropic of Capricorn
(231/20 S). Tropics are bounded by two sub-tropical highs one in the northern Hemisphere and one in
the southern Hemisphere these are called as sub tropical highs.
Idealised Average M.S.L. Circulation Distribution of pressure or wind over globe :
In the general circulation we have got the pressure belts and wind belts.
Actually these pressure and wind belts are shifting north and southwards as per the revolution
of earth around the sun. The two extreme positions occur in January and July.
Sub -Tropical Highs: Sub tropical anticyclones are the sub-tropical high pressure belts, which are
located between 250 to 350 in both Northern and Southern hemisphere. Following points mat be noted:
1) They move more pole ward in summer hemisphere and more equator ward in winter hemisphere.
2) The position and intensity also changes due to the differential heating between land and sea.
3) They are more intense in winter months than in the summer months.
4) In the winter months they are located over continental regions and in summer month they are over
oceans. (Main reason for all these things are the location of sun and the land areas cool and become
warm more rapidly than the sea areas.
Lecture notes on Synoptic Meteorology for FT Course prepared by Dr. Prakash Khare Sci “E”, MTI, Pune
Page 5
Equatorial Trough:
The low pressure near the equator is called as the equatorial trough. The mean position of the
equatorial trough for year as a whole is 50 N and it is called as the Meteorological equator or the heat
equator. This position is not coinciding with the real equator - geographic equator. The two sub-
tropical highs and equator shift north and south during the year. During the month of January
(December 22) when the sun is in the southern most position the mean pressure trough lies near 50 S
where as when the sun is in extreme northern most position in July (June 22) the position of pressure
trough is near 12 - 150 N. Thus the shift to the north is more than the shift to the south.
The convergence region for lower-level northeast and southeast trade winds is called
the intertropical convergence zone (ITCZ). The ITCZ known by sailors as The Doldrums, is the area
encircling the earth near the equator where winds originating in the northern and southern
hemispheres come together. When it lies near the equator, it is called the near-equatorial trough. . In
the seamen's speech the zone is referred as the doldrums because of its erratic weather patterns with
stagnant calms and violent thunderstorms.
The ITCZ corresponds to the equatorial trough and is the mechanism that helps generate the deep
cumulonimbus clouds through convection. Cumulonimbus clouds are the main conduit transporting
tropical heating into the upper troposphere. This equatorial trough is also the inter-tropical
convergence zone (ITCZ). Here the trade winds from both the hemispheres meet in a narrow zone.
This ITCZ produces extremely bad weather conditions over a wide area. The region of greatest solar
heating at the surface in the humid tropics corresponds to areas of deep cumulonimbus convection.
Cumulonimbus clouds routinely form in the tropics where rising parcels of air are warmer than the
surrounding ambient atmosphere. They transport water vapour, sensible heat, and Earth’s rotational
momentum to the upper portion of the troposphere.
The circulation pattern described above—ascent in the equatorial trough, pole ward movement in the
upper troposphere, descent in the subtropical ridges, and equator ward movement in the trade winds—
is in effect a direct heat engine, which meteorologists call the Hadley cell. This persistent circulation
mechanism transports heat from the latitudes of greatest solar insolation to the latitudes of the
subtropical ridges. The geographic location of the Hadley circulation moves north and south with the
seasons.
Before the onset of the summer monsoon over India, a low pressure zone forms on the either side of
the equator, roughly along 5deg N and south. Meteorologist refers to this as a double equatorial
trough. This trough is generally observed in the satellite observations of clouds. Prior to the onset of
Lecture notes on Synoptic Meteorology for FT Course prepared by Dr. Prakash Khare Sci “E”, MTI, Pune
Page 6
monsoon the near equatorial trough N of 5deg weakens, but the trough near 5 deg S remains fairly
active.
The ITCZ appears as a band of clouds, usually thunderstorms that circle the globe near the equator. In
the Northern Hemisphere, the trade winds move in a southwestern direction from the northeast, while
in the Southern Hemisphere, they move north-westward from the southeast.
When the ITCZ is positioned north or south of the equator, these directions change according to the
Coriolis effect imparted by the rotation of the earth. For instance, when the ITCZ is situated north of
the equator, the southeast trade wind changes to a southwest wind as it crosses the equator. The ITCZ
is formed by vertical motion largely appearing as convective activities of thunderstorms driven by
solar heating, which effectively draw air in; these are the trade winds. The ITCZ is effectively a tracer
of the ascending branch of the Hadley cell, and is wet. The dry descending branch is the horse
latitudes.
The location of the ITCZ varies over time. Over land, it moves back and forth across the equator
following the sun's zenith point. Over the oceans, where the convergence zone is better defined, the
seasonal cycle is more subtle, as the convection is constrained by the distribution of ocean
temperatures. Sometimes, a double ITCZ forms, with one located north and another south of the
equator. When this occurs, a narrow ridge of high pressure forms between the two convergence zones,
one of which is usually stronger than the other.
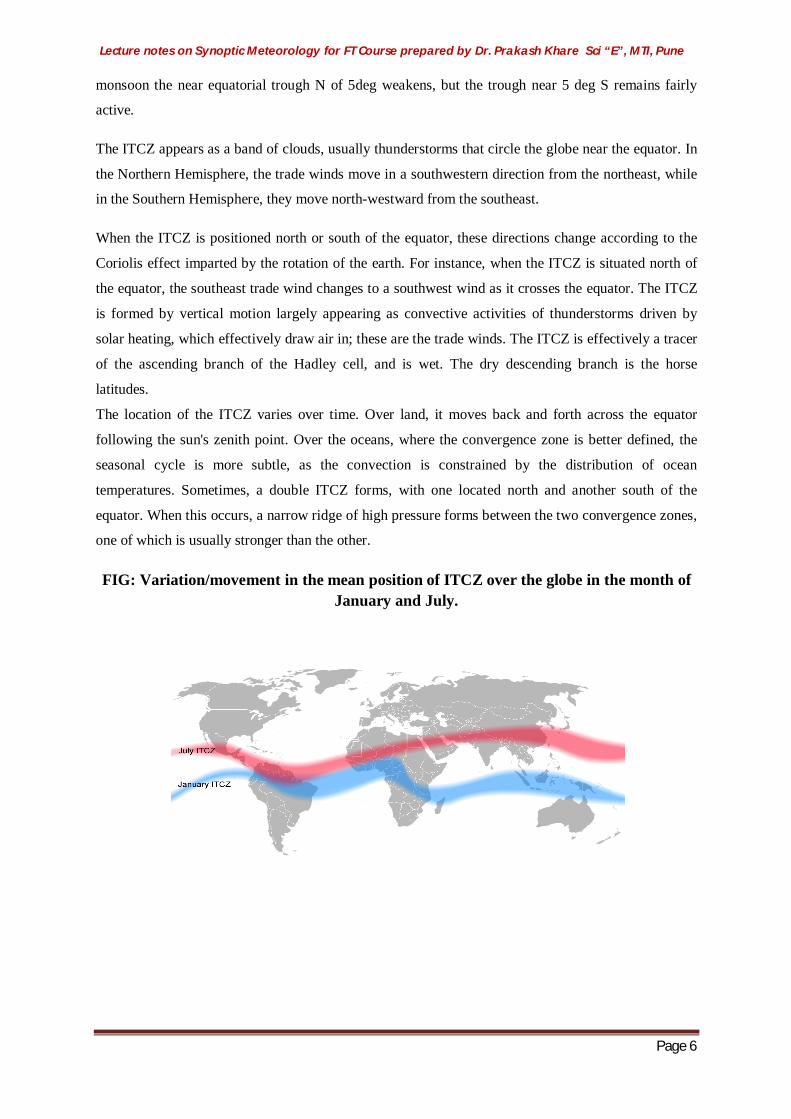
FIG: Variation/movement in the mean position of ITCZ over the globe in the month of January and July.

Lecture notes on Synoptic Meteorology for FT Course prepared by Dr. Prakash Khare Sci “E”, MTI, Pune
Page 7
_________________________________________________________________________
The Jet –streams. Various jet streams over the globe. Characteristics features of the various Jet
Streams.
________________________________________________________________________________
JET STREAMS
Introduction
Early observations of the drift of high cirrus clouds indicated the existence of strong
predominantly zonal winds in the upper troposphere, and observations of noctilucent clouds
revealed the existence of strong winds at great heights in the stratosphere. After 1940, when
upper air observations from fairly dense and extensive networks became available, it was then
found that strong currents of remarkable concentration were almost always present in the upper
troposphere. The following features may be noted from the observed analysis.
(1) There is a shallow layer of light easterly wind over the polar region (Polar easterlies)
in both seasons.
(2) There is also an equatorial belt of easterly winds (Trade winds) at low levels. In the
summer season the easterlies extend to great heights and spread pole ward above 18
Km.
(3) There is a strong circulation of westerly winds in the Tropopause of the middle
latitudes with a pronounced maximum of wind speed at about 12 km. The core of this
strong zonal current is called the Jet stream.
Jet Stream defined
Atmospheric Jet Streams are a strong narrow current of air concentrated along a quasi
horizontal axis, usually in the upper troposphere characterized by strong vertical and
horizontal shears and featuring one or more velocity maxima exceeding 30 m/sec. The
vertical shear is of the order of 10-20 knots per kilometer and the lateral shear is about 18
knots per hundred nautical miles. The differences in air temperature at the surface can
produce winds aloft. Where these temperature differences are most pronounced, the winds
aloft are strongest giving rise to Jet Stream.
Theory of Formation of Jet stream
The General Circulation of the atmosphere shows that the differential heating of the earth’s
surface drives the Hadley Circulation. It also establishes a dominant pattern of winds aloft flowing
from west to east (“westerly”) that is present at middle latitudes in both the Northern and Southern
Hemisphere. Since lower latitudes receive more solar radiation, air temperatures in the tropical
regions are warmer than air temperatures at higher latitudes. Differences in air temperature near
Lecture notes on Synoptic Meteorology for FT Course prepared by Dr. Prakash Khare Sci “E”, MTI, Pune
Page 8
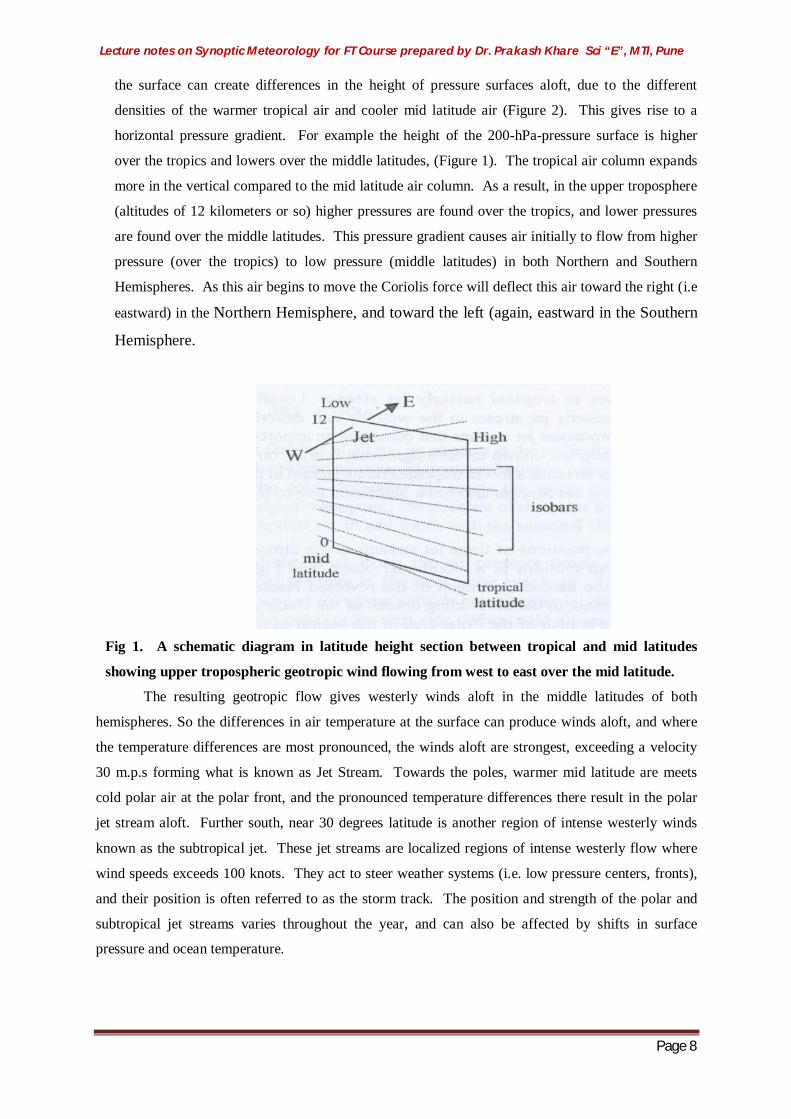
the surface can create differences in the height of pressure surfaces aloft, due to the different
densities of the warmer tropical air and cooler mid latitude air (Figure 2). This gives rise to a
horizontal pressure gradient. For example the height of the 200-hPa-pressure surface is higher
over the tropics and lowers over the middle latitudes, (Figure 1). The tropical air column expands
more in the vertical compared to the mid latitude air column. As a result, in the upper troposphere
(altitudes of 12 kilometers or so) higher pressures are found over the tropics, and lower pressures
are found over the middle latitudes. This pressure gradient causes air initially to flow from higher
pressure (over the tropics) to low pressure (middle latitudes) in both Northern and Southern
Hemispheres. As this air begins to move the Coriolis force will deflect this air toward the right (i.e
eastward) in the Northern Hemisphere, and toward the left (again, eastward in the Southern
Hemisphere.
Fig 1. A schematic diagram in latitude height section between tropical and mid latitudes
showing upper tropospheric geotropic wind flowing from west to east over the mid latitude.
The resulting geotropic flow gives westerly winds aloft in the middle latitudes of both
hemispheres. So the differences in air temperature at the surface can produce winds aloft, and where
the temperature differences are most pronounced, the winds aloft are strongest, exceeding a velocity
30 m.p.s forming what is known as Jet Stream. Towards the poles, warmer mid latitude are meets
cold polar air at the polar front, and the pronounced temperature differences there result in the polar
jet stream aloft. Further south, near 30 degrees latitude is another region of intense westerly winds
known as the subtropical jet. These jet streams are localized regions of intense westerly flow where
wind speeds exceeds 100 knots. They act to steer weather systems (i.e. low pressure centers, fronts),
and their position is often referred to as the storm track. The position and strength of the polar and
subtropical jet streams varies throughout the year, and can also be affected by shifts in surface
pressure and ocean temperature.

Lecture notes on Synoptic Meteorology for FT Course prepared by Dr. Prakash Khare Sci “E”, MTI, Pune
Page 9
Types of Jet Stream
There are several jet streams. With one exception, they all blow from west to east in both the
hemispheres. These are;
Polar front jet stream
Polar night jet stream
Subtropical westerly jet stream
Tropical easterly jet stream, and
Cross Equatorial Low level Jet Stream
Figure 2 shows the positions of these jet streams in the atmosphere. Arrows in the figure
indicate directions of mean motions in a meridional plane. The figure shows that the tropical easterly
jet is located in the ascending branch of the reversed Hadley Cell or monsoon cell and subtropical
westerly jet stream in the descending branch of the Hadley Cell.
Polar front jet stream is located in the ascending branch of the Polar Cell in the region of polar front
and polar right jet stream is located in the upper stratosphere between 40 to 50 kilometre. It is also
evident that the upper tropospheric westerly jet streams are located near the tropopause. It is of
interest to note that the tropopause is fracture (i.e break in the tropopause) in the region of the jet, with
a double tropopause tropical to the south and fairly uniform tropopause to the north. This fracture
which is typical of strong jets permits exchange of air between the troposphere and the stratosphere.
The subtropical westerly jet stream is located at about 300 N throughout the year. In summer
there is also an Easterly Jet at about 150 N extending across Indian Peninsula to north-eastern Africa.
This is the jet stream that blows from east to west and is known as Tropical Easterly Jet (TEJ) stream.
Usually the subtropical westerly jet stream and the tropical easterly jet stream in the westerly and
easterly wind regime in the upper troposphere are the two prominent jet streams that constitute an
important part of the tropical general circulation.
These jet streams are known to have significant bearing on Indian climate. In addition to
these upper tropospheric jet streams, a lower tropospheric jet stream in the monsoon regime known as
Cross Equatorial Low level Jet Stream also has a significant role to play on the southwest monsoon
activity over India.

Lecture notes on Synoptic Meteorology for FT Course prepared by Dr. Prakash Khare Sci “E”, MTI, Pune
Page 10
Figure 2- Positions of these jet streams in the atmosphere
SUB TROPICAL WESTERLY JET STREAM
The subtropical westerly jet stream is located in the upper troposphere with its core near about
200 hPa level over the subtropical latitudes. It is the most powerful wind system of the globe, in which
wind speeds up to 260 knots have been observed over southern Japan. The subtropical jet stream is
also characterized by great steadiness, both in wind direction and in geographical location. Ramage
(1952) attributed the great steadiness of the subtropical jet stream between 250 N and 300 N to the
influence of the Tibetan plateau as a cold region.
The mean winter location of the subtropical jet stream is shown in Figure 3. The figure
indicates that the subtropical jet stream is circumpolar in nature with mean latitude of the jet core
being 27.50 N. There is only slight deviation from this mean seasonal position, on a day-to-day basis.
These deviations were more prominent over the American Atlantic sector, Afro Asian sector and
Asia Pacific sector. The basic character is a quasi permanent three wave pattern (Fig.3). Temporary
dislocation occur particularly when strong middle latitude troughs extend southward into subtropical
latitudes but there is marked tendency for the subtropical features to be quickly re-established in the
mean position as shown.

Lecture notes on Synoptic Meteorology for FT Course prepared by Dr. Prakash Khare Sci “E”, MTI, Pune
Page 11
Fig 3- Mean subtropical jet stream for winter 1955-1956 Isotachs (at 50 knot intervals) at
200 hPa surface. The mean latitude of the jet axis is 27.50 N (after Krishnamurti, 1961)
Mechanisms for the formation STWJ
Large scale meridional contrasts in surface heat and momentum budget, temperature and pressure
and the Central Asian topography are believed to play important roles in the origin of the jet. The sub
tropical westerly jet stream splits owing to the presence of Himalayan massif in its path. The jet flows
as a single stream is seen up to Afghanistan where it splits into two branches, one to the south and
another to the north of the Himalayas, recombining into a strong single stream over China. In the
southern hemisphere too, the sub-tropical westerly jet is best developed in winter, with the strongest
westerlies over the Australian region. In the planetary perspective, the sub-tropical westerly jet is
located above the descending branch of Hadley cell, and the jet is best developed in the season of the
most intense mean meridional circulation.
This is illustrated in Figure 4 which is a schematic diagram showing the branching of subtropical
jets stream at 200 hPa level across Tibetan plateau in winter (top panel) and at 150 hPa level in
summer (bottom panel) where the jet is shown to flow to the north of Tibetan plateau. It also shows
the location of summer time tropical easterly jet at 150-hPa level.
Fig 4. A schematic illustration showing the branching of subtropical westerly jet stream at 200 hPa level across Tibetan plateau in winter (top panel) and at 150 hPa level in summer (bottom panel) where the jet flows to the far north of Tibetan plateau. The location of summer time tropical easterly jet at 150-hPa level is shown in the bottom panel.

Lecture notes on Synoptic Meteorology for FT Course prepared by Dr. Prakash Khare Sci “E”, MTI, Pune
Page 12
Polar Front Jet (PFJ) stream.
The polar front jet stream is located between above 300 N and 600 N in the upper
troposphere near the tropopause and the polar night jet is located over the polar region near
600 N in the upper stratosphere near about 50 Kilometre. The polar front jet stream fluctuated
over a wide range of latitudes from 400 N and 700 N.
Importance of Polar Front Jet (PFJ) stream.
The polar front jet is important for several reasons.
1. It is a region of maximum upper tropospheric flow. It is also one of concentrated upper air
divergence and convergence. Divergence is favoured in the downstream, pole ward sector of
the jet core as well as in its upstream, equator ward sector. It means that such regions are
favoured, though not exclusive, regions for extra tropical cyclone development and inclement
weather.
2. The polar front jets, which move west to east but meander with the general upper air
waves, often “steer” the movement of major low level air masses. This steering is simply a
reflection of the very strong mass transport associated with jet streams. Identification of
changes in jet stream flow can often assist in predicting major changes in air mass and hence
in temperature and weather over a region.
3. This jet stream is an important factor in high altitude flight. Military and civilian jet aircraft
depend heavily on reliable information about upper air winds, which is used for planning the
duration of flights and corresponding fuel consumption.
POLAR NIGHT JET STREAM
The polar night jet stream meanders through the upper stratosphere over the poles. It
occurs only during the long winter night over the pole night is 6 months long during winter.
The polar stratosphere undergoes appreciable cooling due to the lack of solar radiation. The
horizontal temperature gradient is strongly established between the equator and the pole, and
the pressure gradient creates this westerly jet. The temperature gradient breaks down
intermittently during middle and late winter in the Northern Hemisphere, therefore, the jet is
intermittent at these times. In the Southern Hemisphere the temperature gradient and jet
disappear rather abruptly near the time of the spring equinox.
__________________________________________________________________________________
_________________________________________________________________________
Lecture notes on Synoptic Meteorology for FT Course prepared by Dr. Prakash Khare Sci “E”, MTI, Pune
Page 13
Winter season – Western disturbances and associated weather .
________________________________________________________________________
Western disturbances are the synoptic scale weather systems which occur in middle latitude westerlies during the winter season. These systems originate over the Mediterranean Sea, Caspian Sea and Black Sea and approach north-west India, especially northern part of India north of 300 N, by moving across Iraq, Iran, Afghanistan and Pakistan.
W.D. can be noticed as the cyclonic circulation or trough in the middle or lower tropospheric levels or as a low pressure area on surface. Sometimes under the influence of the western disturbance, a low or cyclonic circulation develops to the south of the system. Then this is called as the 'Induced low' or the 'induced cyclonic circulation'. Whenever two or more closed isobars can be drawn on the surface chart, then the system can be referred as a Western Depression.
Along with the winter season the W.D. are also present in pre and post monsoon seasons. During monsoon season also, they are present but are very rare and mostly in the break monsoon situations. Sometimes the W.D’s are associated with the troughs in the westerlies of mid and upper tropospheric levels. Movement of W.D. is mainly in ENE ly direction.
Movement and Rainfall associated with W.D’s
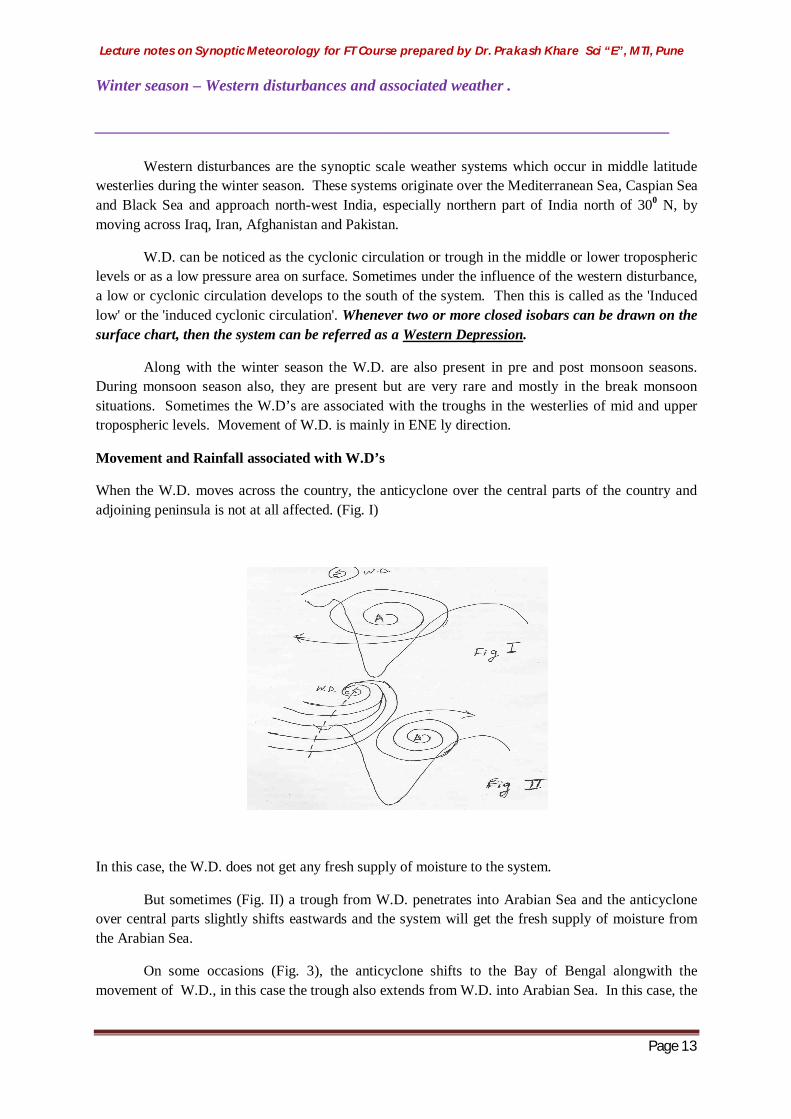
When the W.D. moves across the country, the anticyclone over the central parts of the country and adjoining peninsula is not at all affected. (Fig. I)
In this case, the W.D. does not get any fresh supply of moisture to the system.
But sometimes (Fig. II) a trough from W.D. penetrates into Arabian Sea and the anticyclone over central parts slightly shifts eastwards and the system will get the fresh supply of moisture from the Arabian Sea.
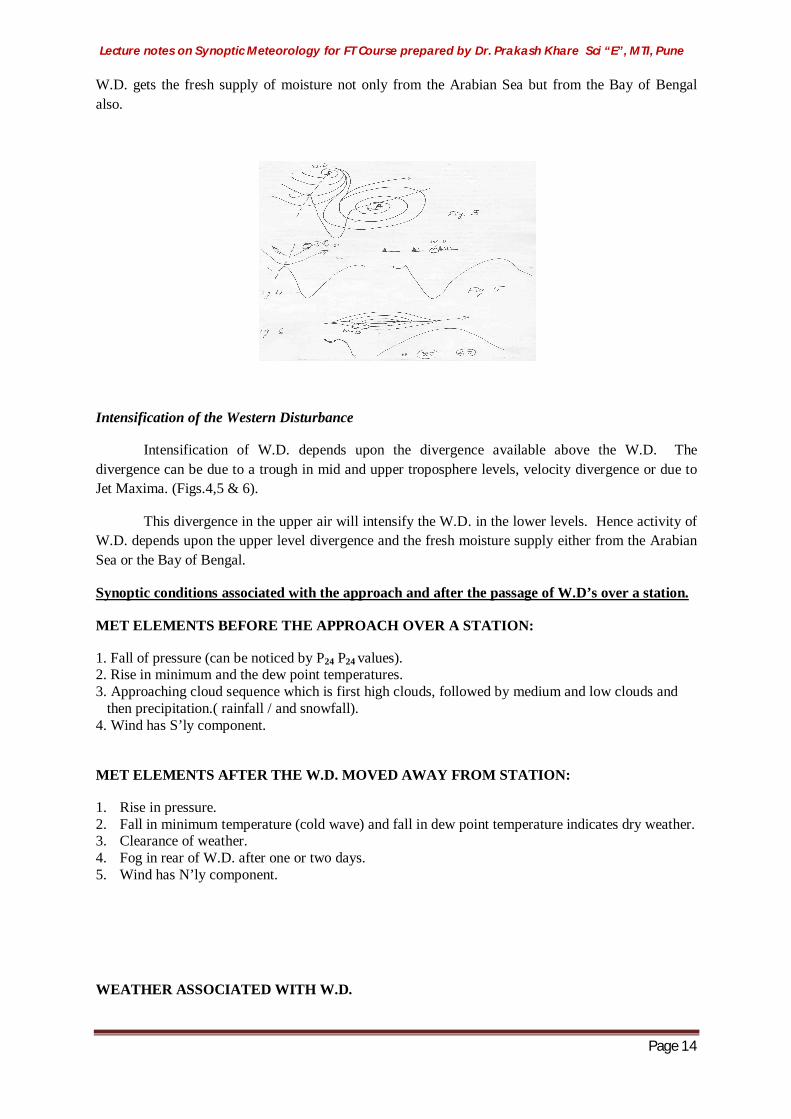
On some occasions (Fig. 3), the anticyclone shifts to the Bay of Bengal alongwith the movement of W.D., in this case the trough also extends from W.D. into Arabian Sea. In this case, the
Lecture notes on Synoptic Meteorology for FT Course prepared by Dr. Prakash Khare Sci “E”, MTI, Pune
Page 14
W.D. gets the fresh supply of moisture not only from the Arabian Sea but from the Bay of Bengal also.
Intensification of the Western Disturbance
Intensification of W.D. depends upon the divergence available above the W.D. The divergence can be due to a trough in mid and upper troposphere levels, velocity divergence or due to Jet Maxima. (Figs.4,5 & 6).
This divergence in the upper air will intensify the W.D. in the lower levels. Hence activity of W.D. depends upon the upper level divergence and the fresh moisture supply either from the Arabian Sea or the Bay of Bengal.
Synoptic conditions associated with the approach and after the passage of W.D’s over a station.
MET ELEMENTS BEFORE THE APPROACH OVER A STATION:
1. Fall of pressure (can be noticed by P24 P24 values). 2. Rise in minimum and the dew point temperatures. 3. Approaching cloud sequence which is first high clouds, followed by medium and low clouds and then precipitation.( rainfall / and snowfall). 4. Wind has S’ly component.
MET ELEMENTS AFTER THE W.D. MOVED AWAY FROM STATION:
1. Rise in pressure. 2. Fall in minimum temperature (cold wave) and fall in dew point temperature indicates dry weather. 3. Clearance of weather. 4. Fog in rear of W.D. after one or two days. 5. Wind has N’ly component.
WEATHER ASSOCIATED WITH W.D.

Lecture notes on Synoptic Meteorology for FT Course prepared by Dr. Prakash Khare Sci “E”, MTI, Pune
Page 15
1. Precipitation
2. Cold Wave
3. Fog
PRECIPITATION: Rainfall / snowfall are the main precipitations associated with W.D’s. It occurs over the forward sector of the W.D. Snow fall generally occur in high mountainous and hilly regions whereas the rainfall moves eastward along with induced system. Rainfall belt extends eastward right up to West Bengal or Assam depending upon the intensity and the movement of the systems.
COLD WAVE: Cold wave occurs in the rear of the Western Disturbance. It is a relative term with respect to the normal minimum temperature. After the passage of W.D. has moved away or if there is no other system following from the west, the cold air from the north of the country sweeps southwards and the temperatures drops leading to cold wave conditions over the country.
FOG: This is a weather hazard which is associated with the W.D’s. It generally occurs in rear of W.D.’s leading poor visibility conditions, especially over the Northern parts of the country during winter season.
Types of Fog:
Fog is understood as condensed water vapour, and a cloud at sea level. As it reduces visibility so greatly, it is also a navigation hazard. Following types of fog are usually experienced:
Advection fog: This is probably the most common type of fog, which forms when warm, moist air flows over colder water. This fog can persist for many days. Wind does not blow this kind of fog away—it creates more. The fog will not clear until there is a change of wind direction and its moisture content, or a general heating of the ambient atmosphere.
Radiation fog: This kind of fog forms in near calms on clear nights when the ground radiates its heat into space and cools down. Moisture in warmer air passing over the cool land may condense as fog and drift out over water. Radiation fog normally disappears in the morning when the sun heats the air. It is observed in the rear of a W.D.
Steam fog: It is also known as sea smoke, steam fog forms when cold air flows across warmer water. It’s usually short-lived and patchy.
Precipitation fog: This kind of fog forms when warm rain falls through a lower layer of cold air. It is usually short-lived.
Lecture notes on Synoptic Meteorology for FT Course prepared by Dr. Prakash Khare Sci “E”, MTI, Pune
Page 16
_________________________________________________________________________________
Hot weather season – Norwesters; Dust storms and dust raising winds, thunderstorms, Hailstorms
_________________________________________________________________________
CONVECTIVE ACTIVITY OVER INDIA
Weather phenomena such as thunderstorms are studied in Meso (middle) scale meteorology. Thunderstorm is defined as a visible or audible manifestation of atmospheric electricity and therefore it is an electrometeor. Month of March to May is considered as the hot weather season/ summer / Pre Monsoon Season over the country. Intense convective activity (like thunderstorms) over India generally occurs during this season. March to May and even in June also the convective activities continue in some areas. The synoptic situations which are responsible for the development of convective activity in general are clear skies, intense heating of ground and the large instability. The synoptic features associated with is convective activity can be studied for different parts of India.
1) Convective activity over NE India.
2) Convective activity over NW India.
3) Convective activity over central India.
4) Convective activity over peninsular India.
1) Convective activity over NE India:
This convective activity over NE India is, generally, known as Norwesters, and more locally
as Kalabaisakhi. This activity starts in month of March and reaches to its maximum in May. This
area is one of the high frequency of occurrence of thunderstorms in the country. Violent
thunderstorms, squalls, heavy precipitation and hails are quite common over NE India. The synoptic
situations associated with these thunderstorms are as follows.
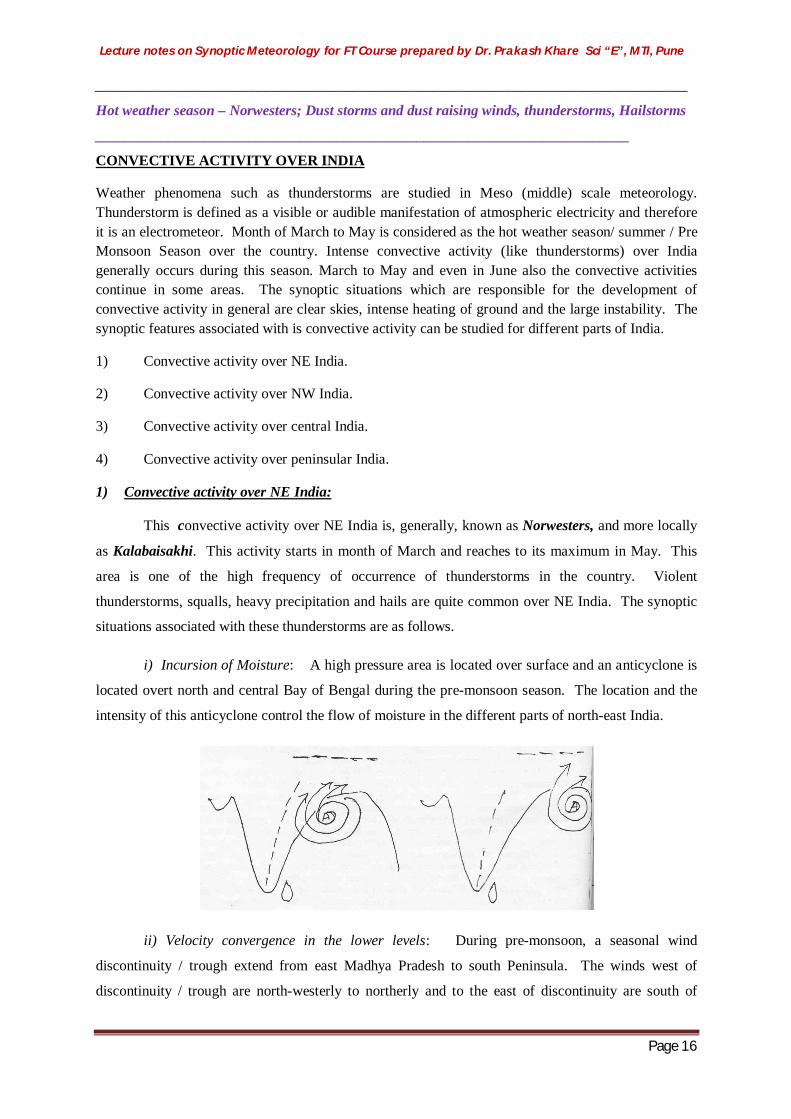
i) Incursion of Moisture: A high pressure area is located over surface and an anticyclone is
located overt north and central Bay of Bengal during the pre-monsoon season. The location and the
intensity of this anticyclone control the flow of moisture in the different parts of north-east India.
ii) Velocity convergence in the lower levels: During pre-monsoon, a seasonal wind
discontinuity / trough extend from east Madhya Pradesh to south Peninsula. The winds west of
discontinuity / trough are north-westerly to northerly and to the east of discontinuity are south of

Lecture notes on Synoptic Meteorology for FT Course prepared by Dr. Prakash Khare Sci “E”, MTI, Pune
Page 17
south-westerlies or southerlies. In these winds on some occasions, there are some pockets when the
wind stream decreases downstream due to which the velocity convergence is there and which will
enhance the intense convective activity.
iii) Thermal structure of the Troposphere: During this season over north-east India, there is a warm
air advection in the lower tropospheric levels as there is a south of south-westerly flow in lower
troposphere. And in middle tropospheric levels, there is a cold air advection as the winds are from
the north-westerly direction. Thus increased warm air advection is in the lower levels and increased
cold air advection in the middle levels. This type of advection will increase the lapse rate which will
result in increased instability over the area.
iv) Upper air divergence :
Normally the convective activity increases over the areas where there is an upper air divergence in the
upper tropospheric levels. This divergence in the higher levels will increase lower level convergence
and increased convective activity. The upper level divergence can be provided due to :
1) Trough in mid and upper tropospheric westerlies where the divergence is present ahead of the
trough i.e. from trough to ridge.
2) Velocity divergence in the westerly flow over northern parts of the country, the wind speeds are
increasing downstream.
3) Divergence associated with jet maxima. There is a divergence in right entrance and left exit region
of jet maxima area.
Lecture notes on Synoptic Meteorology for FT Course prepared by Dr. Prakash Khare Sci “E”, MTI, Pune
Page 18
4) Along all these things, there is a east-west wind discontinuity / trough is present in lower levels
mostly from Uttar Pradesh to Assam or from Bihar to Assam which helps in the enhancing convective
activity over north-east India.
2. Convective Activity of NW India:
Convective Activity over NW India is called as “ANDHIS ". The activity starts in the month
of April and it continues in June also. This activity occurs due to intense surface heating and
instability. Then again due to synoptic scale systems viz. cyclonic circulations, western disturbance
and troughs in middle and upper troposhperic westerlies. These systems will give rise to the
convergence which helps in the convective activity. If sufficient moisture supply is available, then
there will be thunderstorm activity. But mostly due to absence of moisture, there is a downdraft from
Cb cloud which gives rise to the sand storms or duststorms over the area. In these storms, the
horizontal visibility reduces to less than 1 km due to the raised dust or sand in the atmosphere. There
are two types of dust storms or sand storms which are occurring over north-west India.
1) The Convective type 2) The Pressure Gradient type
1) Convective Type: In this type due to intense heating and instability the Cb cloud
develops but there is no moisture supply available, in such a case a downdraft from Cb cloud raised
the dust or sand upto the height of about 2-3 kms and reducing the horizontal visibility less than 1 km.
The duration of convective type of duststorms / sandstorms is from few minutes to the fraction of an
hour.
2) Pressure Gradient Type: During pre-monsoon season intense low forms over NW India
especially during late April and entire month of May. On some occasions, a strong pressure gradient
develops to the south of this low and this will generate the strong winds both at surface and the lower
tropospheric levels. The dust or sand raised due to these strong winds will reduce the visibility less
than 1 km. This is pressure gradient type duststorm. Duration of this storm is for greater number of
hours or may be upto few days. The upper air divergence associated with the westerly trough,
velocity divergence or divergence associated with jet stream enhances the convective activity over
NW India.
3) Convective Activity over Central India:
The convective activity over central India is generally associated with the low pressure
systems or cyclonic circulations which are due to the
1) Systems in westerly’s as induced cycirs (cyclonic circulations).
2) Sometimes systems in easterlies.

Lecture notes on Synoptic Meteorology for FT Course prepared by Dr. Prakash Khare Sci “E”, MTI, Pune
Page 19
3) Locally developed systems.
4) Orography of area.
In addition to these, there is wind discontinuity / trough from eastern parts of Vidarbha to
south-east Madhya Pradesh in the SW - NE orientation. Again here also the divergence provided with
trough in middle and upper tropospheric westerlies, velocity divergence and the divergence associated
with jet stream will enhance the lower systems and the thunderstorm activity.
4) Thunderstorm Activity over Peninsula:
During the pre-monsoon season, a trough line or wind discontinuity is noticed from east
Madhya Pradesh up to extreme south Tamil Nadu up to Kanyakumari. The winds to the west are
northerly or north-westerly and the winds to the east are southerly of south-westerly. But this trough
line fluctuates to east and west widely. Sometimes it is noticed along west coast or sometimes also
east coast. The thunderstorm activity is mainly seen to the east of the tough line. During later part of
May the ITCZ comes close to south peninsula and at this time the thunderstorms are mainly over the
southernmost parts of peninsula.
Hail storm and What causes hail?
Hail is precipitation (hydrometeor) in the form of small balls or pieces of ice with a diameter
ranging from 5 to 50 mm, or sometimes even more. Cumulonimbus clouds are favourable for the
formation of hail. These clouds are characterised by strong updrafts, large liquid water contents, large
cloud drop sizes and vertical height. Any thunderstorm which produces hail that reaches the ground is
known as a hailstorm. Hailstorms form within a unusually unstable air mass, that is, an air mass in
which the temperature fall off with height is much greater than normal. The unstable air is necessary
to produce large updraft speeds -- fast enough to keep a developing hailstone from falling to the
ground. Some of these updrafts can reach 60 mph or more. Hail is large, layered ice particles, often
spherical in shape, which are produced by thunderstorms having strong, tilted updrafts. In a hailstorm,
small ice particles that form above the freezing level (which occurs in all thunderstorms) collect either
rain water or cloud water on them, forming a water shell that freezes. The tilted updraft and downdraft
structure of the storm is important in order for hailstones to grow because they can be 'recycled'
several times, until they either become too large for the updraft to carry them, or they get caught in a
downdraft, and they finally reach the ground. Hailstones can be very large or very small, which
depends upon the strength of updrafts.

Lecture notes on Synoptic Meteorology for FT Course prepared by Dr. Prakash Khare Sci “E”, MTI, Pune
Page 20
______________________________________________________________________ Air masses and fronts: classification of air masses, production and transformation of air masses; conservational properties, the exchange properties and formation of air masses; air mass sources in winter and summer; types of transformation. – Surfaces of discontinuity; Typical structure of fronts; slope of frontal surfaces; classification of fronts; Principal frontal zones; kinematics and dynamic boundary conditions; Frontogenesis and Frontolysis; Frontogenetical fields; ______________________________________________________________________________
Definition of Air Mass
When air possesses uniform characteristics over a large area it is called an “Air mass”. It is an
extensive portion of the atmosphere which is homogeneous in its horizontal distribution of
temperature, humidity and lapse-rate. These properties are acquired by air remaining over a large
portion of earth’s surface having similar temperature conditions until equilibrium is reached by
convection and radiation processes between surface and upper layers of the atmosphere.
Source regions of Air masses
Air masses get their uniform characteristics from the under lying surface or surface below.
Thus, for acquiring such a condition air has to remain more or less stagnant over an area for a
considerable period of time. At this juncture we must understand that, such conditions can be desired
from an anticyclone where pressure gradient is low and movement of air will be almost negligible.
Thus, polar highs and sub polar highs are considered as the main source region of air masses. Regions
where air masses originate are called source regions.
The properties are acquired by air remaining over a large portion of earth’s surface having
similar temperature conditions until equilibrium is reached by convection and radiation processes
between surface and upper layers of the atmosphere. It should be understood, in terms of their
structure, as the huge body of air extends up to thousands of Kms. in length, hundreds of Kms. in
width and few Kms/mtrs. in depth. We can also define it as the Air possessing same characteristics
over a large area whose physical properties are more or less uniform in horizontal in terms of
temperature and moisture contents.
Air mass sources in winter may be classified as given below:
Arctic air mass - Highly stable
Polar continental air mass - Highly stable
Tropical Maritime air mass – Area dominated by subtropical anticyclones
Tropical Continental source – Most of North Africa
Equatorial air mass – Equatorial side of Sub-tropical Highs
Monsoon air mass – Winter monsoon out of India & southeast Asia
Regions of transition – Southward penetration of Arctic & Polar Continental types – region
of frequent storms.

Lecture notes on Synoptic Meteorology for FT Course prepared by Dr. Prakash Khare Sci “E”, MTI, Pune
Page 21
Airmass sources in winter1- Arctic2-Polar continental3- Polar maritime4-5, - transitional 6- Tropical continental7-Tropical maritime8- Equatorial 9- Monsoonal
Air mass sources in summer may be classified as given below:
Temperature contrasts between oceans & continents are much weaker in summer than in Winter
and so contrasts between different air masses are smaller in summer than in winter}
• Arctic Air mass
• Polar source regions – Arctic region is separated from Tropical ones by relatively narrow belt.
Polar Continental air masses form when high pressure areas are present. Air from these
sources spread southward forming polar maritime air mass
• Tropical Maritime air mass- Region of sub-tropical highs, more extensive and located further
to the north than in winter
• Tropical Continental air mass
• Equatorial / Monsoon air mass – displaced far to the north
Airmass sources in summer1- Arctic2-Polar continental3- Polar maritime4- Tropical continental5-Tropical maritime6- Equatorial 7- Monsoonal
Classification of air masses
Most effective and widely accepted type of air mass classification is based on Norwegian
System / Geographical source regions, i.e. based primarily on the latitude of the source region. In
order of increasing latitude they use the following terms:.
Equatorial air (E)
Lecture notes on Synoptic Meteorology for FT Course prepared by Dr. Prakash Khare Sci “E”, MTI, Pune
Page 22
Tropical air (T)
Polar air (P)
Arctic ( or Antarctic ) air (A)
Further they can be classified on the basis of Moisture content as given below - (whether
Oceanic or continental);
Air which has its origin over the ocean has high moisture content and is called a maritime air
mass (M). By contrast, an air mass formed over a land surface is relatively dry. It is known as
continental air mass (C). For airmasses can therefore be distinguished, and the following symbols are
sometimes iused to distinguish them:
Tropical maritime (Tm)
Tropical continental (Tc)
Polar maritime- (Pm)
Polar Continental ( Pc )
They can be further classified on the basis of Temperature & Thermodynamic feature (stability
/ instability conditions in lower layers (after Bergeron).
Cold (K) - colder than the underlying surface
Warm (W) – warmer than the underlying surface
These symbols may be combined with source region symbols in the following way:
KTm; KTc; KPm; KPc and WTm; WTc; WPm; WPc
(Can you tell now the meaning of KTm ---- etc.?)
MODIFICATION OF AIR MASSES:
Basically, it is a slow process and can be understood considering two cases.
Case I- When colder air mass moves over the warm surface.
In this particular example two cases are possible,
(a) When colder air mass moves over ocean or land. At the time when it is moving over ocean will be
heated from below. A thermal instability will be developed in the lower layer and spread upwards.
Due to the convection process the absorbed moisture will be transferred to upper levels where
condensation will take place and clouds like Cu, Cb may appear resulting thunderstorm or
thundershower activity.
(b)-When the colder air mass moves over land area (comparatively warmer), the less moisture will be
absorbed and development of clouds etc. may be delayed.
Case II- When warmer air mass moves over the cold surface.
Lecture notes on Synoptic Meteorology for FT Course prepared by Dr. Prakash Khare Sci “E”, MTI, Pune
Page 23
In this situation warm air will lose its heat into lower layer and air mass will become more and
more stable. Therefore, there will not be any convection. However, inversion layer may develop
resulting into poor visibility conditions and drizzle may also occur.
When air leaves its source region, its properties are subjected to modifications as it moves
over surfaces having different temperature/ moisture conditions.
Air masses may be modified by Radiation (gain or loss, evaporation or condensation,
Convergent or divergent flows)
Factors influencing modification are:
Topography, Temperature and Moisture
Structure of an Air Mass is also changed with large scale patterns of air flow
(Horizontal & Vertical)
Process responsible for Modification of air masses:
Thermodynamic
Heating or cooling from below (radiative transfer of heat)
Addition of moisture (Evaporation)
Mechanical
Sinking or upward motion
Convective rising of warm air
Orographic lifting, etc.
FORMATON OF FRONTS
Between middle latitude around 30-70o N (and so in southern hemisphere) due to warm
tropical air and cold polar air the fronts are formed and this boundary is called polar front. It is
impossible to detect a sharp boundary between two air masses. Rather, there is a zone of transition
in which the properties of an air mass gradually changes to those of others. It is more correct to use
the term frontal zone, but the word front is generally used in synoptic meteorology.
DEFINITION OF FRONT:
The front is a line of separation between two air masses of different histories. A front is also a
zone of rapid transition in temperature, pressure & wind. It is an intersection of vertically sloping
frontal surface with any level surface. It is composed of two air masses having different
properties. When Air masses of different densities are placed side by side a sloping surface of
separation is formed and called frontal surface. The line of intersection of frontal surface with
ground is called front.

Lecture notes on Synoptic Meteorology for FT Course prepared by Dr. Prakash Khare Sci “E”, MTI, Pune
Page 24
FRONTAL SURFACE:
If we consider the any variable along XY plane say S, then in case of frontal surface Pressure
is having first order discontinuity. Thus frontal surface is defined as boundary surface between
two different types of air masses and surface of discontinuity of order one w.r.t. pressure. Fronts
are typically classified according to the direction of their movement.
CLASSIFICATION OF FRONTS:
It is possible to classify the fronts in four ways. Namely they can be classified as;
i) cold front
ii) warm front
iii) stationary front
iv) occluded front
The above-classified fronts are a good example of mid-lattitude weather systems affecting the
tropical weather systems. The meteorologists especially in the formation of western disturbances,
during the recent past, have paid them a large attention.
Cold Front
It is a transition zone from warm air to cold air. A cold front is defined as the transition zone
where a cold air mass is replacing a warmer air mass. Cold fronts generally move from northwest to
southeast. The air behind a cold front is noticeably colder and drier than the air ahead of it.

Lecture notes on Synoptic Meteorology for FT Course prepared by Dr. Prakash Khare Sci “E”, MTI, Pune
Page 25
Symbolically, a cold front is represented by a solid line with triangles along the front pointing towards
the warmer air and in the direction of movement. On coloured weather maps, a cold front is drawn
with a solid blue line.
Cold Front
Warmer air mass
Colder air mass
N
E
Cold front moves south as colder air pushes out warmer air.
Weather elements associated with the Cold Front
Pressure : Well defined pressure troughs Winds: Strong and gusty winds accompanied by line squalls near the frontal zone.
Wind speed decrease rapidly after the passage of Type I front. Strong winds with frequent gusts & turbulence observed for long periods in the rear of Type II fronts
Precipitation : Showers or Thundershowers Clouds : Cumulus or Cumulonimbus, Nimbostratus close to the front Temperature : Pronounced drop in temperature.
Common characteristics associated with cold fronts have been listed in the table below.
Before Passing While Passing After Passing
Winds south-southwest gusty; shifting west-northwest
Temperature warm sudden drop steadily dropping
Pressure falling steadily minimum, then sharp rise rising steadily
Clouds increasing: Ci, Cs and Cb
Cb Cu
Precipitation short period of showers heavy rains, sometimes with
hail, thunder and lightning showers then clearing
Visibility fair to poor in haze
poor, followed by improving good, except in showers
Dew Point high; remains steady sharp drop lowering

Lecture notes on Synoptic Meteorology for FT Course prepared by Dr. Prakash Khare Sci “E”, MTI, Pune
Page 26
Warm Front
It is a transition zone from cold air to warm air. A warm front is defined as the transition zone where a warm air mass is replacing a cold air mass. Warm fronts generally move from southwest to northeast and the air behind a warm front is warmer and more moist than the air ahead of it. When a warm front passes through, the air becomes noticeably warmer and more humid than it was before.
Symbolically, a warm front is represented by a solid line with semicircles pointing towards the colder air and in the direction of movement. On colored weather maps, a warm front is drawn with a solid red line.
Warm FrontN
EColder air mass
Warmer air mass
Warm front moves north as warmer air pushes out colder air.
Weather elements associated with the Warm Front
1. Pressure : Active warm fronts are generally associated with pressure troughs 2. Wind: Wind speed increases in advance of the warm front due to increase in pressure
gradient. After the passage of the front winds veer with reduction in speed. 3. Clouds: Transition from Cirrus, Cirrostratus to Altostratus, Nimbostratus as a rule.
Cumulus clouds form if the air is unstable 4. Precipitation : Extends about 300 km ahead of the front 5. Temperature: Temperature rises slowly with the first indication of the warm front.
When Altostratus shield approaches rapid increase in surface temperature occurs.
Common characteristics associated with warm fronts have been listed in the table below.
Before Passing While Passing
After Passing
Lecture notes on Synoptic Meteorology for FT Course prepared by Dr. Prakash Khare Sci “E”, MTI, Pune
Page 27
Winds south-southeast variable south-southwest
Temperature cool-cold, slow warming steady rise warmer, then steady
Pressure usually falling leveling off slight rise, followed by fall
Clouds in this order: Ci, Cs, As, Ns, St, and fog; occasionally Cb in summer
stratus-type clearing with scattered Sc; occasionally Cb in summer
Precipitation light-to-moderate rain, snow, sleet, or drizzle drizzle or
none usually none, sometimes light rain or showers
Visibility poor poor, but improving fair in haze
Dew Point steady rise steady rise, then steady
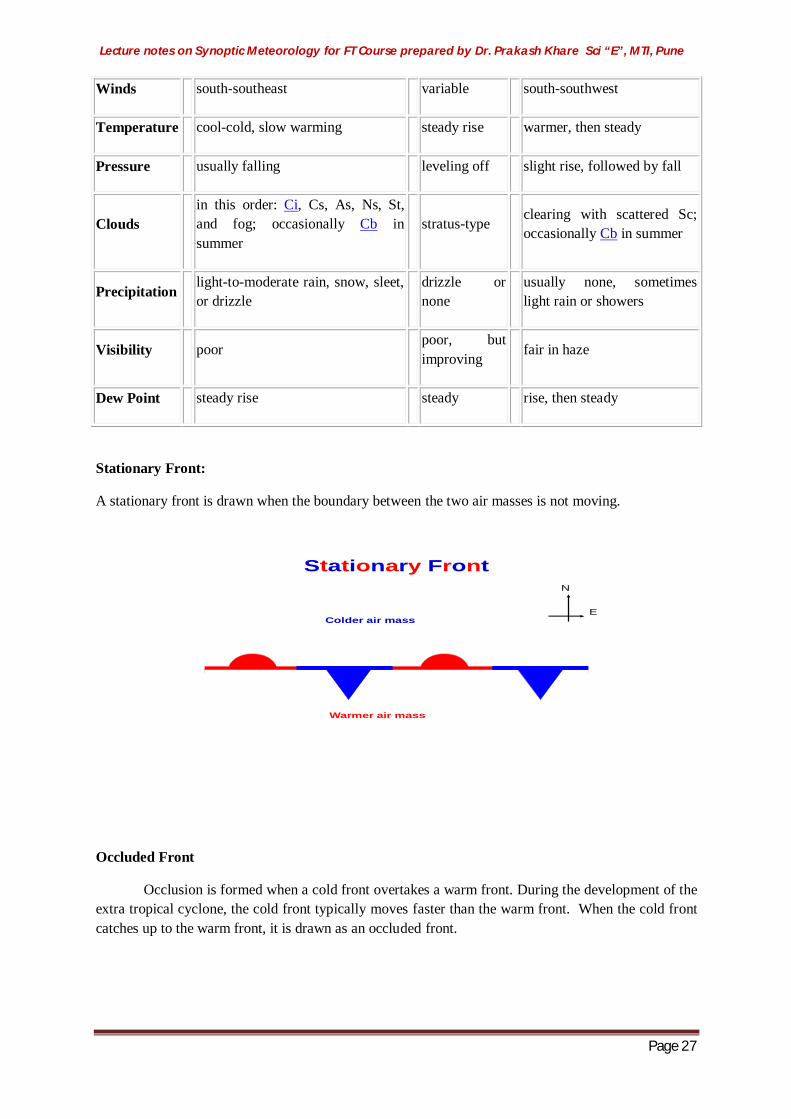
Stationary Front:
A stationary front is drawn when the boundary between the two air masses is not moving.
Stationary Front
Warmer air mass
Colder air mass
N
E
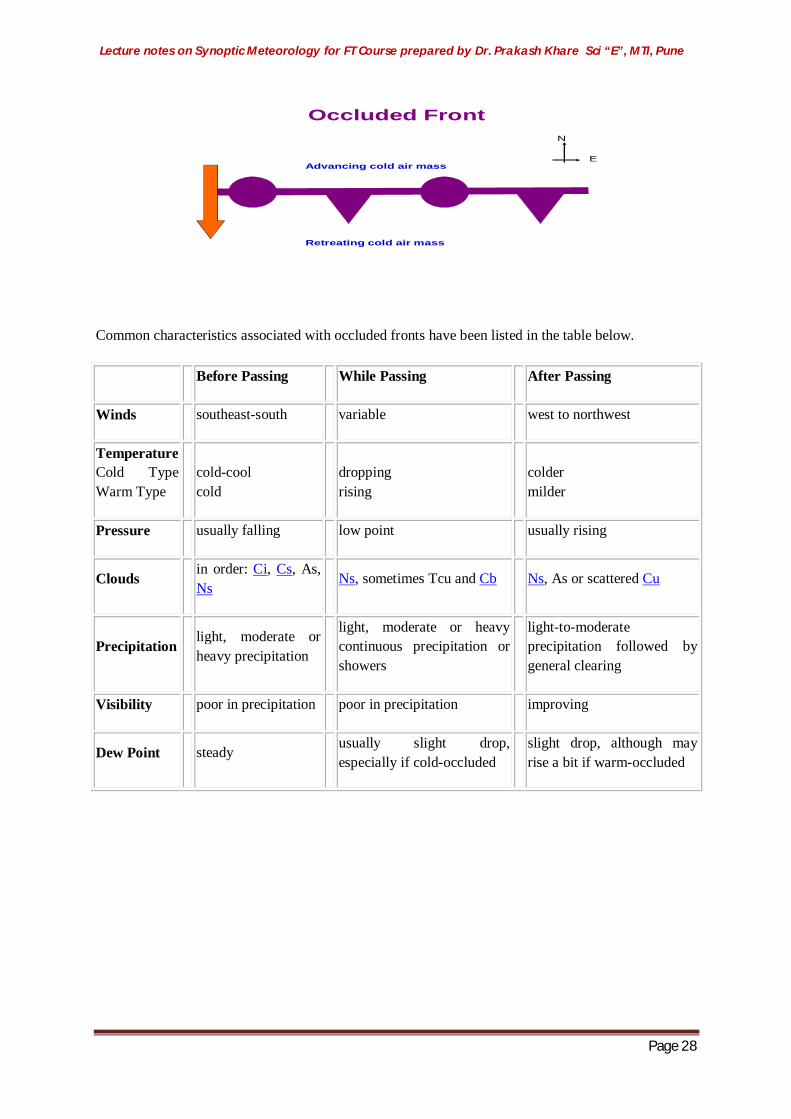
Occluded Front
Occlusion is formed when a cold front overtakes a warm front. During the development of the extra tropical cyclone, the cold front typically moves faster than the warm front. When the cold front catches up to the warm front, it is drawn as an occluded front.
Lecture notes on Synoptic Meteorology for FT Course prepared by Dr. Prakash Khare Sci “E”, MTI, Pune
Page 28
Occluded Front
Advancing cold air mass
Retreating cold air mass
N
E
Common characteristics associated with occluded fronts have been listed in the table below.
Before Passing While Passing After Passing
Winds southeast-south variable west to northwest
Temperature Cold Type Warm Type
cold-cool cold
dropping rising
colder milder
Pressure usually falling low point usually rising
Clouds in order: Ci, Cs, As, Ns
Ns, sometimes Tcu and Cb Ns, As or scattered Cu
Precipitation light, moderate or heavy precipitation
light, moderate or heavy continuous precipitation or showers
light-to-moderate precipitation followed by general clearing
Visibility poor in precipitation poor in precipitation improving
Dew Point steady usually slight drop, especially if cold-occluded
slight drop, although may rise a bit if warm-occluded

Lecture notes on Synoptic Meteorology for FT Course prepared by Dr. Prakash Khare Sci “E”, MTI, Pune
Page 29
With the above understanding are you able to identify the type of fronts given below?
___________________________________________________________________________
FRONTOGENESIS
It is a process of strengthening of an existing front and also in which a new front is formed. It
can occur under the condition when
Cyclonic wind shift takes place between two air masses.
Cyclonic wind shear is available between two air masses.
FRONTOLYSIS
The weakening and disintegration of a front is called Frontolysis. The conditions required for
Frontolysis are,
Two air masses of different densities must lie side by side.
Favorable wind to keep the different air masses constant in touch with one another.
Characteristics of Fronts :
Average slope of the cold front is steep and between 1/50 and 1/150 ( Avg. slope1:75)
In a cold front, the wedge of cold air is moving actively forward and the effect of surface
friction is to hold back the part near the ground so that the front becomes steep.
In a warm front, the cold-air wedge is receding and the effect of surface friction is to hold
back the front near the ground so that it trails with a small slope.
Average slope of the warm front is gentle and between 1/100 and 1/300 ( Avg. slope1:250)
Bergeron further classified cold fronts into two types on the basis of vertical velocities
Cold Front type I – when warm air is being lifted to high levels along the cold front surface
due to the intrusion of cold air in lower levels – typical slope 1/100

Lecture notes on Synoptic Meteorology for FT Course prepared by Dr. Prakash Khare Sci “E”, MTI, Pune
Page 30
Cold Front Type II – when warm air is lifted only along the leading edge of the intruding
wedge of cold air – slope varies from 1/40 to 1/80.
FRONTOGENETIC FUNCTION:
The frontogenetic or frontolytic tendency in a flow can be measured by the quantity d/dt |vh|,
which is called the frontogenetic function. This is the rate of change of horizontal potential-
temperature.
An expression for the frontogenesis function is obtained by differentiation of the thermodynamic
equation d/dt gradient | ν h | > 0 the frontogenesis
< 0 then Frontolysis
Frontolysis of a stationary front Frontogenesis of a stationary front
_________________________________________________________________________
References and extended learning:
1) H. Riehl, McGraw-Hill Book Company : Tropical Meteorology 2) H. Robert Byres, McGraw-Hill Book Company :General Meteorology 3) G.G. Tarakanov, Mir Publishers : Tropical Meteorology 4) WMO compendium of lecture notes on meteorology (Vol. II)