GOVERNMENT IN HAWAII - University of Hawaii that is compiled is ... and scope of government in...
66
GOVERNMENT IN HAWAII A HANDBOOK OF FINANCIAL STATISTICS 1967 Percent Nov. HJ 5 T389.TAX FOUNDATION OF HAWAII 1967 ' HONOLULU, HAWAIt
Transcript of GOVERNMENT IN HAWAII - University of Hawaii that is compiled is ... and scope of government in...

GOVERNMENT IN HAWAII
A HANDBOOK OF FINANCIAL STATISTICS
1967Percent
Nov.
HJ 5T389.TAX FOUNDATION OF HAWAII1967 ' HONOLULU, H A W A It
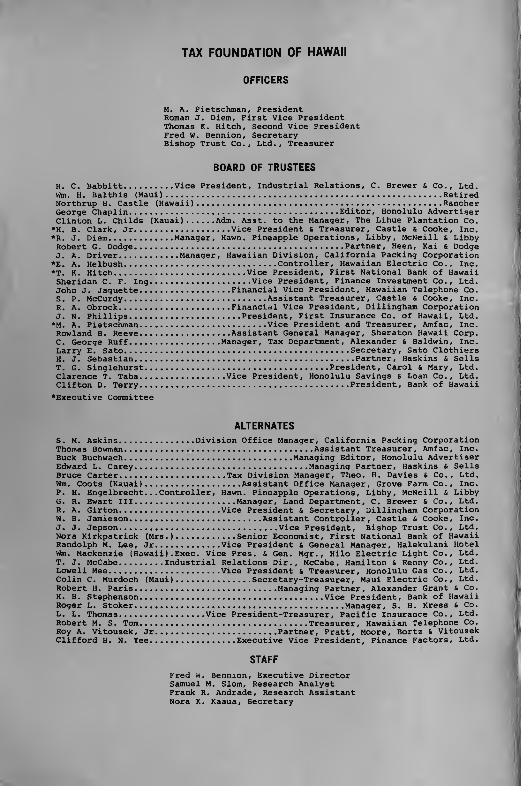
TAX FOUNDATION OF HAWAII
OFFICERS
M. A. Pietschman, President Roman J. Diem, First Vice President Thomas K. Hitch, Second Vice President Fred W. Bennion, Secretary Bishop Trust Co., Ltd., Treasurer
BOARD OF TRUSTEES
H. C. Babbitt......... Vice President, Industrial Relations, C. Brewer & Co., Ltd.Wm. H. Balthis (Maui)............................. RetiredNorthrup H. Castle (Hawaii)................................................... RancherGeorge Chaplin Editor, Honolulu AdvertiserClinton L. Childs (Kauai)..... Adm. Asst, to the Manager, The Lihue Plantation Co.*H. B. Clark, Jr....................Vice President & Treasurer, Castle & Cooke, Inc.*R. J. Diem.............Manager, Hawn. Pineapple Operations, Libby, McNeill & LibbyRobert G. Dodge............................................Partner, Heen, Kai & DodgeJ. A. Driver............ Manager, Hawaiian Division, California Packing Corporation*E. A. Helbush............................... Controller, Hawaiian Electric Co., Inc.*T. K. Hitch...........................Vice President, First National Bank of HawaiiSheridan C. F. Ing.................... Vice President, Finance Investment Co., Ltd.John J. Jaquette............ Financial Vice President, Hawaiian Telephone Co.S, P. McCurdy.............................Assistant Treasurer, Castle & Cooke, Inc.R. A. Obrock....................... Financial Vice President, Dillingham CorporationJ. N. Phillips.......................President, First Insurance Co. of Hawaii, Ltd.*M. A. Pietschman..........................Vice President and Treasurer, Amfac, Inc.Rowland B. Reeve...................Assistant General Manager, Sheraton Hawaii Corp.C. George Ruff...................Manager, Tax Department, Alexander & Baldwin, Inc.Larry E. Sato...............................................Secretary, Sato ClothiersH. J. Sebastian Partner, Haskins & SellsT. G. Singlehurst...................................... President, Carol 6 Mary, Ltd.Clarence T. Taba Vice President, Honolulu Savings & Loan Co., Ltd.Clifton D. Terry........................................... President, Bank of Hawaii♦Executive Committee
ALTERNATES
S. M. Askins............... Division Office Manager, California Packing CorporationThomas Bowman....................................... Assistant Treasurer, Amfac, Inc.Buck Buchwach................................... Managing Editor, Honolulu AdvertiserEdward L. Carey.................................... Managing Partner, Haskins & SellsBruce Carter...................... Tax Division Manager, Theo. H. Davies & Co., Ltd.Wm. Coots (Kauai)................... Assistant Office Manager, Grove Farm Co., Inc.P. H. Engelbrecht...Controller, Hawn. Pineapple Operations, Libby, McNeill & LibbyG. R. Ewart III.................... Manager, Land Department, C. Brewer & Co., Ltd.R. A. Girton..................... Vice President & Secretary, Dillingham CorporationW. B. Jamieson........................... Assistant Controller, Castle & Cooke, Inc.J. J. Jepson................................ Vice President, Bishop Trust Co., Ltd.Nora Kirkpatrick (Mrs.)........... Senior Economist, First National Bank of HawaiiRandolph M. Lee, Jr............. Vice President & General Manager, Halekulani HotelWm. Mackenzie (Hawaii).Exec. Vice Pres. & Gen. Mgr., Hilo Electric Light Co., Ltd.T. J. McCabe Industrial Relations Dir., McCabe, Hamilton & Renny Co., Ltd.Lowell Mee....................... Vice President & Treasurer, Honolulu Gas Co., Ltd.Colin C. Murdoch (Maui)............... Secretary-Treasurer, Maui Electric Co., Ltd.Robert H. Paris............................. Managing Partner, Alexander Grant & Co.H. H. Stephenson...................................... Vice President, Bank of HawaiiRoger L. Stoker........................................... Manager, S. H. Kress & Co.L, L. Thomas................. Vice President-Treasurer, Pacific Insurance Co., Ltd.Robert M. S. Tom...................................Treasurer, Hawaiian Telephone Co.Roy A. Vitousek, Jr........................Partner, Pratt, Moore, Bortz & VitousekClifford H. N. Yee.................Executive Vice President, Finance Factors, Ltd.
STAFF
Fred W. Bennion, Executive Director Samuel M. Slom, Research Analyst Frank R. Andrade, Research Assistant Nora K. Kaaua, Secretary

TAX FOUNDATION OF HAWAII
Incorporated in 1953, the Tax Foundation of Hawaii is an independent, non-profit, non-partisan educational citizens' organization. The Foundation is governed by a 24-member Board of Trustees representing the entire State of Hawaii. The Foundation is financed by voluntary contributions from underwriting members, business organizations, and from corporate and individual associate members.
The purpose of the Tax Foundation is to encourage efficiency and economy in government, and to improve the economic status and standard of living of the citizens of the State of Hawaii. This is accomplished in part by cooperating with public officials and other organized groups or individuals working toward the adoption of improved methods, systems and procedures of public administration.
Data relative to government and taxation are collected and analyzed, with the Tax Foundation serving as a clearing house. Information that is compiled is made available to the public through the publication of reports, pamphlets, newspaper articles and by radio and television broadcasts.
In addition to GOVERNMENT IN HAWAII, other releases by the Tax Foundation of Hawaii include: FINANCE INBRIEF, a wallet size resume' of Hawaii's fiscal facts; a weekly column in the editorial pages of the Sunday Honolulu Star-Bulletin & Advertiser; a radio series twice weekly on KTRG (Honolulu), KMVI (Maui), KPUA (Hawaii) KTOH (Kauai), and weekly on KIKI (Honolulu). During the State of Hawaii Legislative Sessions, the Foundation prepares a LEGISLATIVE TAX BILL SERVICE which digests and comments on tax legislation; TAX TOPICS offers capsule comments on highlighted legislative issues; and YOUR TAX DOLLAR, published at the conclusion of each session, presents detailed reports of all major action as well as an examination of the changes in the State's finances.
Good Government Depends on an Inform ed P ublic

FOREWORD
As evidenced in this Fourteenth Edition of Government in Hawaii, it is clear that government is Hawaii’s biggest business... and, it is getting bigger. As citizen-taxpayers, we are part of this business and share in the profits and losses. The taxes we pay are our investment in government and as shareholders we should be aware of how our money is spent. We have a right to expect good government and a reasonable return on our investment but we have an obligation too. Remember, GOOD GOVERNMENT DEPENDS ON AN INFORMED PUBLIC.
This handbook of financial statistics points up the size and scope of government in Hawaii and, in turn, the impact on Hawaii's citizens. For example, tax collections at both the State and County levels of government are rapidly rising in the 50th State. In 1965 state and county collections totalled $222 million; in 1966 they rose to $273 million. Moving from $298 per capita in fiscal 1965 to $365 per capita in 1966, Hawaii's tax burden on a per capita basis is now the third highest in the nation. Total tax collections are up 200% in the past 10 years, while personal income increased 107%.
Ten years ago, Hawaii's state operating expenditures amounted to $95 million. In fiscal 1966, the State of Hawaii expended $3 0 T ~million. Direct general expenditures for all functions of state and local government in 1966 were $494 per person in Hawaii compared to the U. S. average of $387. Hawaii is the 5th highest state in the nation in state and local government per capita expenditures. State and local long term debt is also high in Hawaii...$674 per capita, ranking us 6th from the top in the nation.
In addition to providing the fiscal data on the sources of the tax dollars and where they are spent, the 1967 Government in Hawaii contains statistics on the trends in the factors contributing to the State's economic growth. One section presents a digest of Hawaii's tax laws and filing requirements.
The Tax Foundation of Hawaii gratefully acknowledges the valuable assistance and cooperation of the many public officials at the federal, state, and local levels of government who contributed to this publication. Private firms, too, helped make this booklet possible, and we gratefully thank them for their valuable assistance. Special thanks is due the directors and staffs of the State of Hawaii Departments of Accounting and General Services, Budget and Finance, Education, Labor and Industrial Relations, Taxation, and Transportation; the City and County of Honolulu Budget Office and Finance Department; Auditors and Treasurers of Maui, Hawaii, and Kauai counties; and the Bank of Hawaii and the First National Bank of Hawaii.
M. A. Pietschman, President Tax Foundation of Hawaii
TABLE OF CONTENTS — GOVERNMENT IN HAW AII 1967
Foreword.............................................................. 2
PART ONE: 50TH STATE STATISTICS................................. 4
Growth in the Hawaiian Economy............................. 5Selected Trends - Debt, Taxes, Income..................... 6Population Trends............................................. 7Miscellaneous County D ata................................... 8Personal Income - Sources and Amounts..................... 9Employment...................................................... 12
PART TWO: WHERE GOVERNMENT GETS ITS MONEY..................... 14
Hawaii Tax Collections....................................... 15Allocation of State and County Taxes...................... 19General Excise Tax D ata...................................... 20County Operating Revenues................................... 21General Sales Tax Rates...................................... 24Fuel, Tobacco and Liquor Rates.............................. 25Real Property Taxation in Hawaii........................... 27Personal Net Income Tax Rates............................... 30Corporate Income Tax Rates.................................. 31Taxes Levied in Hawaii....................................... 32State and Local Tax Burden.................................. 34Federal Grants and Collections in Hawaii................. 35
PART THREE: HOW GOVERNMENT SPENDS ITS M O NEY .................. 36
State Government Expenditures............................... 37State General Fund Finances................................. 4 0County Operating Expenditures............................... 41Per Capita Direct General Expenditures.................... 44Education....................................................... 4 5Salary Information............................................ 48Hawaii's State Retirement System.......................... 51Transportation: Highways Division........................ 52
Airports Division........................ 53Harbors Division.......................... 54
The Federal Budget............................................ 55
PART FOUR: THE LONG TERM PUBLIC BONDED DEBT.................. 56
State and Local Long Term Debt............................ 57Hawaii's Debt - State and Counties........................ 58State Constitutional Debt Limit........................... 60Trends in Long Term Bonded D e b t............................ 62
Index.................................................................. 6 3
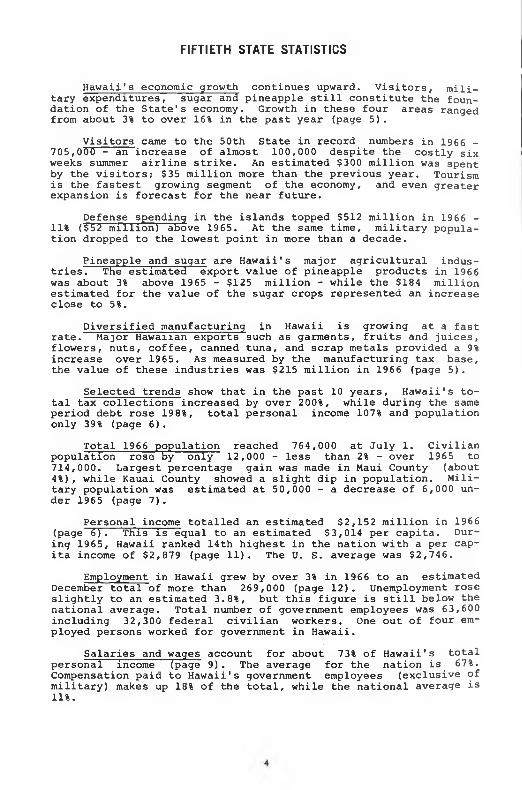
FIFTIETH STATE STATISTICS
Hawaii's economic growth continues upward. Visitors, military expenditures, sugar and pineapple still constitute the foundation of the State's economy. Growth in these four areas ranged from about 3% to over 16% in the past year {page 5).
Visitors came to the 50th State in record numbers in 1966 - 705,000 - an increase of almost 100,000 despite the costly six weeks summer airline strike. An estimated $300 million was spent by the visitors; $35 million more than the previous year. Tourism is the fastest growing segment of the economy, and even greater expansion is forecast for the near future.
Defense spending in the islands topped $512 million in 1966 - 11% ($52 million) above 1965. At the same time, military population dropped to the lowest point in more than a decade.
Pineapple and sugar are Hawaii's major agricultural indus- triesT The estimated export value of pineapple products in 1966 was about 3% above 1965 - $125 million - while the $184 million estimated for the value of the sugar crops represented an increase close to 5%.
Diversified manufacturing in Hawaii is growing at a fast rate. Major Hawaiian exports such as garments, fruits and juices, flowers, nuts, coffee, canned tuna, and scrap metals provided a 9% increase over 1965. As measured by the manufacturing tax base, the value of these industries was $215 million in 1966 (page 5).
Selected trends show that in the past 10 years, Hawaii's total tax collections increased by over 200%, while during the same period debt rose 198%, total personal income 107% and population only 39% (page 6).
Total 1966 population reached 764,000 at July 1. Civilian population rose by only 12,000 - less than 2% - over 1965 to 714,000. Largest percentage gain was made in Maui County (about 4%), while Kauai County showed a slight dip in population. Military population was estimated at 50,000 - a decrease of 6,000 under 1965 (page 7).
Personal income totalled an estimated $2,152 million in 1966 (page 6). This is equal to an estimated $3,014 per capita. During 1965, Hawaii ranked 14th highest in the nation with a per capita income of $2,879 (page 11). The U. S. average was $2,746.
Employment in Hawaii grew by over 3% in 1966 to an estimated December total of more than 269,000 (page 12). Unemployment rose slightly to an estimated 3.8%, but this figure is still below the national average. Total number of government employees was 63,600 including 32,300 federal civilian workers. One out of four employed persons worked for government in Hawaii.
Salaries and wages account for about 73% of Hawaii's totalpersonal income (page 9). The average for the nation is 67%.Compensation paid to Hawaii's government employees (exclusive of military) makes up 18% of the total, while the national average is 11%.

TABLE 1
GROWTH IN THE HAWAIIAN ECONOMYCalendar Years 1956, 1961, 1964-1966
Economic IndicatorsAmounts Percent Change 1966 from
1956 1961 1964 1965 1966 1956 1961 1964 1965Total Population^ 570,000 669,021 734,791 758,143 763,,646 33.97 14.14 3.93 0.73Civilian Labor Forced 204,082 242,850 257,630 266,540 277,,132 35.79 14.12 7.57 3.97Percent Unemployed^ 4.4% 4.1% 3.9% 3.5% 3..3% - 25.00 - 19.51 -15.38 - 5.71Civilian Employmentb 195,075 232,910 247.560 257,200 268,,000 37.38 15.07 8.26 4.20Cost of LivingC 81.5% 94.1% 101.2% 103.9% 105,.6% 29.57 12.22 4.35 1.64Motor Vehicle Registration^ 190,721 249,416 296,323 319,862 340,,876 78.73 36.67 15.04 6.57Number of Visitors© 133,815 319,807 508,870 606,010 705,,000 426.85 120.45 38.54 16.33
DOLLAR AMOUNTS IN MILLIONS EXCEPT PER CAPITAVisitor Expenditures^ $ 65 $ 137 $ 225 $ 265 $ 300 361.54 118.98 33.33 13.21Military Expenditures^ 285 402 416 460 512 79.65 27.36 23.08 11.30Retail Sales Tax Baseg 677 945 1,089 1,197 1,r293 90.99 36.83 18.73 8.02Wholesale Sales Tax Baseg 305 409 496 543 829 171.80 102.69 67.14 52.67Value of Sugar Cropsd 148 145 167 176 184 24.32 26.90 10.18 4.55Value of Pineapple Exports^ 117 112 120 122 125 6. 84 11.61 4.17 2.46Diversified Manufacturingg 110 171 184 197 215 95.45 25.73 16.85 9.14Value of Constructiong 112 263 308 339 381 240.18 44.87 23.70 12.39Bank Deposits*^ 426 806 908 1,006 1,,092 156.34 35.48 20.26 8.55Total Personal Income^ 1,041 1,598 1,912 2,030 2 ,152 106.72 34.67 12.55 6.01Per Capita Personal Income^ 1,900 2,485 2,775 2,879 3 ,014 58.63 21.29 8.61 4.69Per Capita Taxesi 177 260 272 298 365 106.21 40.38 34.19 22.48a.b.c.d.e.f.g*
h.i.
Monthly average; 1966 based on 11 months preliminary data.Honolulu Consumer Price Index at December (revised), based on December, 1963 = 100%; 1966 figure at September. Estimated for 1966.Overnight or longer visitors; 1966 data preliminary.Mainland dollar income from Armed Forces; 1966 estimated.General Excise Tax Base for February-January collections as follows: Retailing, use (consumption prior to 1966),and exempt federal retail sales; wholesaling, use (compensating prior to 1966), and exempt federal wholesale sales; manufacturing, canning other than pineapple, and exempt federal manufacturing sales; contracting. 1966 data estimated from 10 months actual bases.Pineapple products exclusive of local sales.Fiscal year state and calendar year counties' collections (except 1964-1966 city-county fiscal years).
SOURCE; State Departments of Budget and Finance, Health, Planning and Economic Development, Regulatory Agencies,Labor and Industrial Relations, and Taxation; City and County Budget and Finance Director; County Auditors and Treasurers; Honolulu Automobile Club; Office of Business Economics and Bureau of the Census, U, S. Department of Commerce; Bank of Hawaii; First National Ban)c of Hawaii,

TABLE 2 TRENDS IN HAWAII
S t a t e a n d Co u n t i e s : 1956-1966
YearFundedDebta
Total • Taxesb
PersonalIncome
CivilianPopulationc
1 9 6 6 $ 3 5 8 , 3 7 8 , 8 0 0 $ 2 7 3 , 0 3 1 , 8 2 4 $ 2 , 1 5 2 , 0 0 0 , 0 0 0 6 7 1 3 , 9 0 91 9 6 5 3 9 9 , 6 6 4 , 4 0 0 < a 2 2 1 , 9 0 2 , 6 1 7 2 , 0 3 0 , 0 0 0 , 0 0 0 7 0 2 , 0 3 01 9 6 4 3 7 3 , 1 3 4 , 0 0 0 d 1 9 9 , 8 5 7 , 7 2 0 1 , 9 1 2 , 0 0 0 , 0 0 0 6 7 4 , 9 5 11 9 6 3 3 3 4 , 2 2 6 , 0 0 0 d 1 8 3 , 4 8 8 , 4 5 5 1 , 7 7 6 , 0 0 0 , 0 0 0 6 5 5 , 5 4 61 9 6 2 2 7 7 , 5 1 6 , 5 0 0 1 8 0 , 7 5 6 , 6 4 0 1 , 6 8 0 , 0 0 0 , 0 0 0 6 3 5 , 8 8 81 9 6 1 2 7 0 , 5 6 8 , 0 0 0 1 7 2 , 1 5 9 , 2 2 0 1 , 5 9 8 , 0 0 0 , 0 0 0 6 1 2 , 6 7 31 9 6 0 2 5 1 , 4 2 3 , 5 0 0 1 5 5 , 0 7 3 , 1 9 4 1 , 4 7 8 , 0 0 0 , 0 0 0 5 9 5 , 0 2 41 9 5 9 2 4 7 , 2 2 3 , 0 0 0 1 3 9 , 1 0 1 , 1 2 3 1 , 3 2 5 , 0 0 0 , 0 0 0 5 8 0 , 5 0 51 9 5 8 1 8 9 , 9 3 7 , 5 0 0 1 2 0 , 8 7 0 , 1 5 2 1 , 1 8 2 , 0 0 0 , 0 0 0 5 6 0 , 4 4 81 9 5 7 1 6 0 , 8 3 8 , 0 0 0 9 9 , 6 4 0 , 3 8 5 1 , 1 1 4 , 0 0 0 , 0 0 0 5 3 8 , 2 9 61 9 5 6 1 2 0 , 0 9 4 , 5 0 0 9 0 , 9 0 7 , 3 1 7 1 , 0 4 1 , 0 0 0 , 0 0 0 5 1 2 , 2 0 0
outstanding at December 31.b. Fiscal years for State; previous calendar years for counties except Honolulu
fiscal years 1962-1966; unemployment compensation collections included.c. Mid-year de facto civilian population.d. Includes highway refunding bonds of $39,600,000.e. Estimated by Tax Foundation of Hawaii.SOURCE; State Departments of Budget and Finance, Accounting and General Services,
Taxation; City & County Finance Director; County Auditors; U. S. Department of Commerce, "Survey of Current Business," Table 3.
CHART 1
DEBT, TAXES, INCOME, POPULATION State of H awa ii and Counties: 1956*1366
1956 1957 1958 1959 1960 1961 1962 1963 1964 1965 1966
a. O utstand ing funded debt exclus ive of state re fund in g bonds. SOURCE: Tab le 2.

TRENDS IN CIVILIAN POPULATION State of Hawaii and Counties Mid-Year Estimates 1356-1366
CHART 2
Percent
SOURCE: Tab les .
TABLE 3
POPULATION TRENDS IN HAWAIIMid-Year Estimates of C ivilian Population^
Year
Civilian PopulationMilitaryb
Pop.StateTotal
City-CountyHonolulu
MauiCounty
HawaiiCounty
KauaiCounty Total
AnnualChange
1956 373,491 45,436 63,955 29,318 512,200 4.1 58,000 570,0001957 400,500 44,289 63,998 29,509 538,296 5.1 60,000 598,0001958 425,521 43,801 62,411 28,715 560,448 4.1 55,000 615,0001959 445,972 43,798 61,903 28,832 580,505 3,6 56,000 637,0001960 461,454 44,030 61,059 28,481 595,024 2.5 59,000 654,0001961 480,173 43,759 60,332 28,409 612,673 3.0 56,348 669,0211962 501,356 45,625 60,246 28,661 635,888 3.8 59,702 695,5901963 520,999 45,916 60,649 27,982 655,546 3.1 57,093 712,6391964 540,872 46,850 60,000 27,229 674,951 3.0 59,840 734,7911965 566,532 47,892 60,029 27,577 702,030 4.0 56,113 758,1431966 575,757 49,667 61,027 27,458 713,909* 1.7 49,737 763,646
De facto estimates at July 1. 1966 total includes 31,838 visitors presentand military dependents domiciled in the state, and excludes 12,070 Hawaii residents temporarily absent.Includes crews of ships in Hawaii. 1956-1960 as estimated by U. S. Bureau of the Census; 1961-1966 by Planning Department, State of Hawaii.
SOURCE: Departments of Health, and Planning and Economic Development, State of Hawaii.

MISCELLANEOUS COUNTY DATABy Counties — 1965 and 1966
TABLE 4
1965Honolulu
1966Maui
1965 1966Hawaii
1965 1966 1965Kauai
1966PER CAPITA
Personal Income^ Government Cpsts^Tax Revenues" Retailing^Services^Contracting^Rentals<=Wholesaling‘SManufacturing^s Pineapple Canning^s Bank Demand Deposits" Property Valuations® Sugar Income^
S 2,,869.00 $ 2,962.00 5 2,214.00 $ 2 ,347.00 $ 2,398.00 $ 2,529.00 $ 2,623.00 S 2,791.00122.21 124.55 203.17 205.95 236.37 256.15 186.42 185.22106.32 109.11 140.55 107.46 140.77 106.25 151.56 112.83
1,,791.52 1,927.55 1,112.10 1,,171.80 1,576.23 1,482.95 1,236.76 1,256.46403.09 432.99 178.33 197.31 258.48 227.77 185.40 193.02539.58 606.68 210.68 241.61 288.30 226.13 199.61 214.87430.96 463.56 236.92 275.84 211.27 231.05 147.26 156.60882.75 1,341.89 242.40 354.36 412.02 471.92 235.20 378.76319.83 349.11 95.26 86.58 147.99 129.45 72.93 69.20175.50 146.07 393.91 410.74 — — 136.46 123.83699.80 705.54 328.15 291.93 458.50 390.79 334.10 338.78
4,,136.33 4,518.44 3,165.14 3 ,528.57 2,910.22 3,386.92 2,883.34 3,117.3353.68 61.54 841.78 907.76 1,099,54 1,022.94 1,431.22 1,476.93
PER 100 POPULATIONMotor Vehicle Regis.9 44.8 46..6 47,2 50.7 47.9 52.3 53.3 55.8Number of Telephones^ 41.7 43..7 32.8 33.8 36.2 38.0 37.1 40.3Civilian Labor Forcei 38.1 39,.0 36.6 36.6 42.1 41.5 42.3 42.6Number Employedi 36.9 37,.6 34.8 34.9 40.3 40.1 40.6 41.0
Unemployment Ratei 3.2% 3,.7% 4.8% 4.9% 4.3% 3.6% 3.8% 3.9%Civilian Populationj 566,532 575,757 47,892 49,667 60,029 61,027 27,577 27,458a. Data shown are for 1964 and 1965 calendar years (see Chart 3# page 10).b. County government data for calendar 1964 and 1965 (population July 1), except Honolulu fiscal years (population January 1).c. General excise tax bases for February-January period, as reported by the State Tax Office; does not necessarily reflect all
business activity within each county since tax reporting practice varies by firms. Retailing also includes use (consumption prior to 1966), and federal sales base; wholesaling also includes use (compensating prior to 1966) and federal sales base; manufacturing includes federal sales base. Data for 1966 estimated from 10 months actual base.
d. As at December 31.e. Net assessed valuations at January 1.f. Income attributable to sugar production; 1966 estimated.g. 1966 data as at December 1.h. Telephones in service at December 31; 1966 data preliminary.i. As at December 12; unemployment rate as a per cent of labor force. 1966 data preliminary November 12.j. As at July 1; except for personal income and as noted, all other data based on these figures.SOURCE; State Departments of Health, Labor and Industrial Relations, and Taxation; City and County Budget and Finance Direc
tors; Counties' Auditors and Treasurers; Honolulu Automobile Club; Bank of Hawaii; First National Bank of Hawaii;Hawaiian Telephone Company; and Tables 3, 14-17, 22, 34-37 and Chart 3.
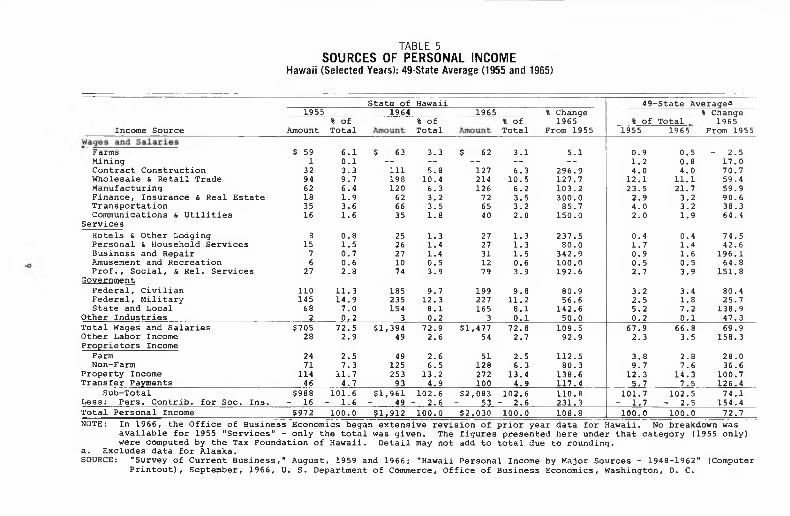
TABLE 5
SOURCES OF PERSONAL INCOMEHawaii (Selected Years): 49-State Average (1955 and 1965)
1955State of Hawaii
Income Source% of
Amount Total
1964% of Total
1965% of Total
% Change 1965
From 1955
49-State Average^
% of Total . 1955 1965
% Change 1965
From 1955
Farms $ 59 6.1 $ 63 3.3 $ 62 3.1 5.1 0.9 0.5 - 2.5Mining 1 0.1 — — — — - - 1.2 0.8 17.0Contract Construction 32 3.3 Ill 5.8 127 6.3 296.9 4.0 4.0 70.7Wholesale & Retail Trade 94 9.7 198 10.4 214 10.5 127.7 12.1 11.1 59.4Manufacturing 62 6.4 120 6.3 126 6.2 103.2 23.5 21.7 59.9Finance, Insurance & Real Estate 18 1.9 62 3.2 72 3.5 300.0 2.9 3.2 90.6Transportation 35 3.6 66 3.5 65 3.2 85.7 4.0 3.2 38.3Communications & Utilities 16 1.6 35 1.8 40 2.0 150.0 2.0 1.9 64.4
ServicesHotels & other Lodging 8 0.8 25 1.3 27 1.3 237.5 0.4 0.4 74.5Personal & Household Services 15 1.5 26 1.4 27 1.3 80.0 1.7 1.4 42.6Business and Repair 7 0.7 27 1.4 31 1.5 342 .9 0.9 1.6 196.1Amusement and Recreation 6 0.6 10 0.5 12 0.6 100.0 0.5 0.5 64.8Prof., Social, & Rel. Services 27 2.8 74 3.9 79 3.9 192.6 2.7 3.9 151.8
GovernmentFederal, Civilian 110 11.3 185 9.7 199 9.8 80.9 3.2 3.4 80.4Federal, Military 145 14.9 235 12. 3 227 11.2 56.6 2.5 1.8 25.7State and Local 68 7.0 154 8.1 165 8.1 142.6 5.2 7.2 138.9
Other Industries 2 0.2 3 0.2 3 0.1 50.0 0.2 0.1 47.3Total Wages and Salaries $705 72.5 $1,394 72.9 $1,477 72.8 109.5 67.9 66.8 69.9Other Labor Income 28 2.9 49 2.6 54 2.7 92.9 2.3 3.5 158.3Proprietors Income
Farm 24 2.5 49 2.6 51 2.5 112.5 3.8 2.8 28.0Non-Farm 71 7.3 125 6.5 128 6.3 80.3 9.7 7.6 36.6
Property Income 114 11.7 253 13.2 272 13.4 138.6 12.3 14.3 100.7Transfer Payments 46 4.7 93 4.9 100 4.9 117.4 5.7 7.5 126.4
Sub-Total $988 101.6 $1,961 102.6 $2,083 102.6 110.8 101.7 102.5 74.1Less: Pers. Contrib. for Soc. Ins. - 16 - 1.6 - 49 - 2.6 - 53 - 2.6 231.3 - 1.7 - 2.5 154.4Total Personal Income $972 100.0 $1,912 100.0 $2,030 100.0 108.8 100.0 100.0 72.7NOTE: In 1966, the Office of Business Economics began extensive revision of prior year data for Hawaii. No breakdown was
available for 1955 "Services" - only the total was given. The figures presented here under that category (1955 only) were computed by the Tax Foundation of Hawaii. Detail may not add to total due to rounding,
a. Excludes data for Alaska.SOURCE: "Survey of Current Business," August, 1959 and 1966; "Hawaii Personal Income by Major Sources - 1948-1962" (Computer
Printout), September, 1966, U. S. Department of Commerce, Office of Business Economics, Washington, D. C.
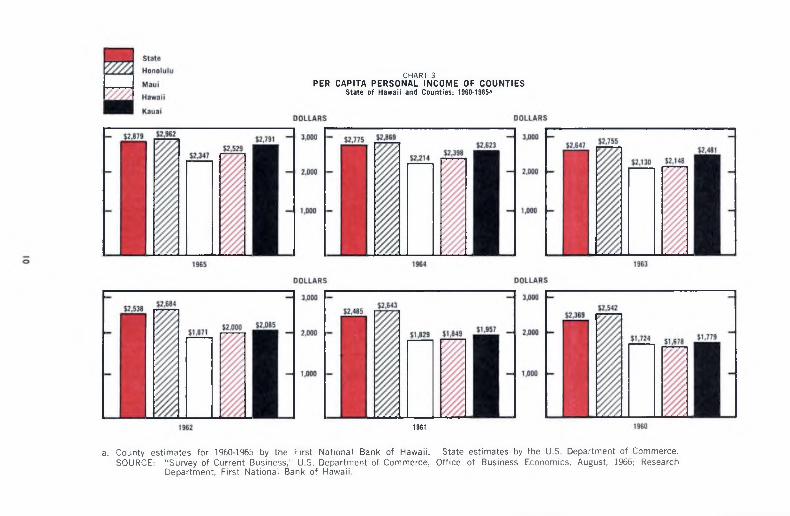
CHART 3PER CAPITA PERSONAL INCOME OF COUNTIES
State of Hawaii and Counties: 1960-1965^
1961
a. County estimates for 1960*1965 by the First National Bank of Hawaii. State estimates by the U.S. Department of Commerce. SOURCE: “Survey of Current Business," U.S. Department of Commerce, Office of Business Economics, August, 1966; Research
Department, First National Bank of Hawaii.
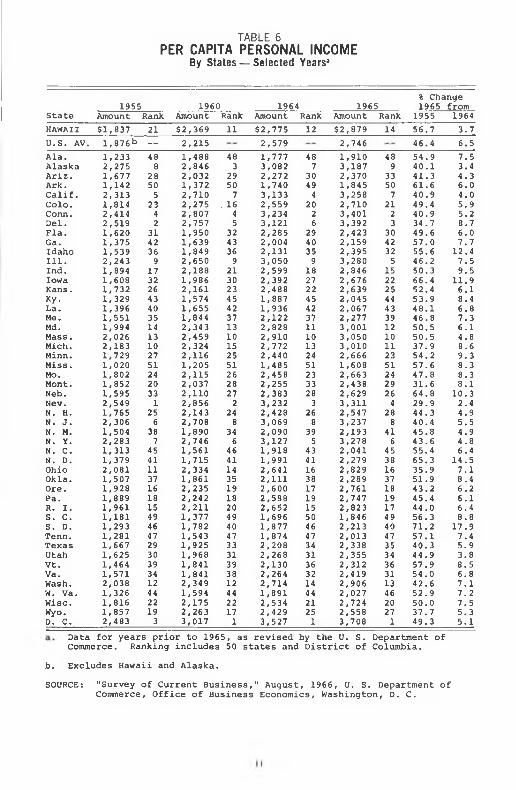
PER CAPITA PERSONAL INCOMEBy States — Selected Years"
TABLE 6
1955State
1960 1964 1965Amount Rank Amount Rank Amount Rank Amount Rank
% Change 1965 from
1955 1964HAWAII $1,837 21 $2,369 11 $2,775 12 $2,879 14 56.7 3.7U.S. AV. 1,876^) — 2,215 2,579 2,746 46.4 6.5Ala.AlaskaAriz.Ark.Calif.Colo.Conn.Del.Fla.Ga.IdahoI l l .Ind.IowaKans.Ky.La.Me.Md.Mass.Mich.Minn.Miss.Mo.Mont.Neb.Nev.N. H. N. J. N. M. N. Y. N. C. N. D. Ohio Okla. Ore. Pa.R. I.S. C.S. D.Tenn.TexasUtahVt.Va. Wash. W. Va. Wise. Wyo.D. C.
1,2332,2751,6771,1422.313 1,814 2,414 2,519 1,620 1,375 1,539 2,243 1,894 1,608 1,732 1,329 1,396 1,551 1,994 2,026 2,183 1,729 1,020 1,802 1,852 1,595 2,549 1,765 2,306 1,504 2,2831.313 1,379 2,081 1,507 1,928 1,889 1,961 1,181 1,293 1,281 1,667 1,625 1,464 1,571 2,038 1,326 1,816 1,857 2,483
48 8
28505
23 4 2
314236 9
1732 264340 3514 13 10 275124 2033 1
256
38 7
4541 1137 16181549464729303934 1244 22 193
1,4882,8462,0321,3722,7102,2752,8072,7571,9501,6391,8492,6502,1881,9862,1611,5741,6551,8442,3432,4592,3242,1161,2052,1152,0372,1102,8562,1432,7081,8902,7461,5611,7152,3341,8612,2352,2422,2111,3771,7821,5431,9251,9681.8411.841 2,349 1,594 2,175 2,263 3,017
483
29507
1645
324336 921302345 423713 10 15255126 28 272
248
346
46 41143519 182049 40473331 3938 1244 22 17
1
1,7773,0822,2721,7403,1332,5593,2343.121 2,285 2,004 2,131 3,0502.599 2,392 2,488 1,887 1,9362.122 2,828 2,910 2,772 2,440 1,485 2,458 2,255 2,383 3,2322.428 3,069 2,090 3,127 1,918 1,991 2,641 2,1112.600 2,588 2,652 1,696 1,877 1,874 2,208 2,268 2,130 2,264 2,714 1,891 2,5342.429 3,527
487
30494
2026
294035 9
1827 22454237 11 101324 51 233328 3
268
395
4341 1638 17 19 15504647343136321444 2125 1
1,9103,1872,3701.845 3,258 2,710 3,401 3,392 2,423 2,159 2,395 3,2802.846 2,676 2,639 2,045 2,0672.277 3,001 3,050 3,010 2,666 1,608 2,663 2,438 2,6293.311 2,547 3,237 2,1933.278 2,0412.279 2,829 2,289 2,761 2,747 2,8231.846 2,213 2,013 2,338 2,3552.312 2,419 2,906 2,027 2,724 2,558 3,708
48 9
33507 2123
3042 325
15 2225444339 12 10 11235124 29264
288
416
45 3816 37 1819 174940 4735343631 134620 271
54.940.141.3 61.640.949.440.934.749.657.055.646.250.366.452.453.948.146.850.550.537.954.257.647.831.664.829.944.340.445.843.655.465.335.951.943.245.444.056.371.257.140.344.957.954.042.652.950.037.749.3
7.53.44.36 . 04.05.95.28.76 . 07.7
12.47.59.5
11.9 6.18.46.87.3 6.14.88.69.38.38.3 8.1
10.32.44.95.54.94.86.4
14.57.18.46.2 6.16.48 . 8
17.97.4 5.93.88.56.87.17.27.55.3 5.1
Data for years prior to 1965, as revised by the U. S. Department of Commerce. Ranking includes 50 states and District of Columbia.
b. Excludes Hawaii and Alaska.
SOURCE: "Survey of Current Business," August, 1966, U. S. Department of Commerce, Office of Business Economics, Washington, D. C.
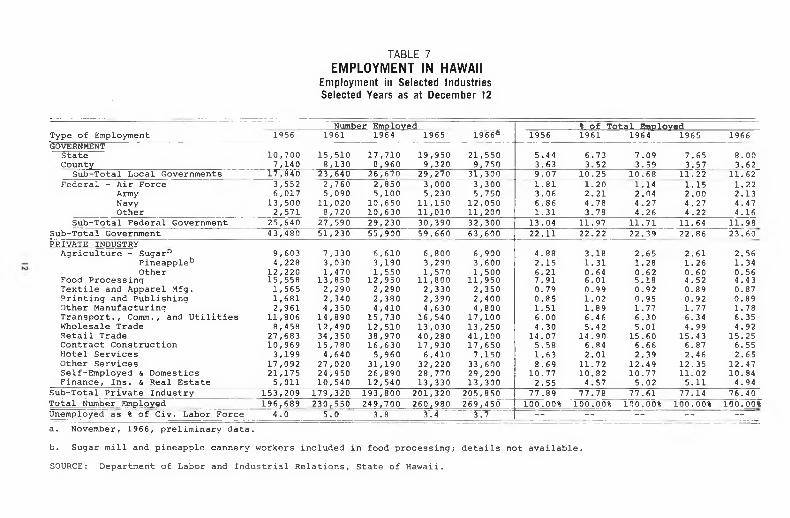
TABLE 7
EMPLOYMENT IN HAWAIIEmployment in Selected Industries
Selected Years as at December 12
Number Emploved % of Total EmolovedType of Employment 1956 1961 1964 1965 1966* 1956 1961 1964 1965 1966GOVERNMENT
State 10,700 15,510 17,710 19,950 21,550 5.44 6.73 7.09 7.65 8.00County 7,140 8,130 8,960 9,320 9,750 3.63 3.52 3.59 3.57 3.62
Sub-Total Local Governments 17,840 23,640 26,670 29,270 31,300 9.07 10.25 10.68 11.22 11.62*Federal - Air Force 3,552 2,760 2,850 3,000 3,300 1.81 1.20 1.14 1.15 1,22
Army 6,017 5,090 5,100 5,230 5,750 3.06 2.21 2.04 2.00 2.13Navy 13,500 11,020 10,650 11,150 12,050 6.86 4.78 4.27 4.27 4.47Other 2,571 8,720 10,630 11,010 11,200 1.31 3.78 4.26 4.22 4.16
Sub-Total Federal Government 25,640 27,590 29,230 30,390 32,300 13.04 11.97 11.71 11.64 11.98Sub-Total Government 43,480 51,230 55,900 59,660 63,600 22.11 22.22 22.39 22.86 23.60PRIVATE INDUSTRY
Agriculture - Sugar^ 9,603 7,330 6,610 6,800 6,900 4.88 3.18 2.65 2.61 2.56Pineapple^ 4,228 3,030 3,190 3,290 3,600 2.15 1.31 1.28 1.26 1.34Other 12,220 1,470 1,550 1,570 1,500 6.21 0.64 0.62 0.60 0.56
Food Processing 15,558 13,850 12,950 11,800 11,950 7.91 6.01 5.18 4.52 4.43Textile and Apparel Mfg. 1,565 2,290 2,290 2,330 2,350 0.79 0.99 0.92 0.89 0, 87Printing and Publishing 1,681 2,340 2,380 2,390 2,400 0.85 1.02 0.95 0.92 0.89Other Manufacturing 2,961 4,350 4,410 4,630 4,800 1.51 1.89 1.77 1.77 1.78Transport., Comm., and Utilities 11,806 14,890 15,730 16,540 17,100 6.00 6.46 6.30 6.34 6.35Wholesale Trade 8,458 12,490 12,510 13,030 13,250 4 .30 5.42 5.01 4.99 4.92Retail Trade 27,683 34,350 38,970 40,280 41,100 14.07 14.90 15.60 15.43 15.25Contract Construction 10,969 15,780 16,630 17,930 17,650 5.58 6.84 6.66 6.87 6.55Hotel Services 3,199 4,640 5,960 6,410 7,150 1.63 2.01 2.39 2,46 2.65Other Services 17,092 27,020 31,190 32,220 33,600 8.69 11.72 12.49 12.35 12.47Self-Employed & Domestics 21,175 24,950 26,890 28,770 29,200 10.77 10.82 10.77 11.02 10.84Finance, Ins. & Real Estate 5,011 10,540 12,540 13,330 13,300 2.55 4.57 5.02 5.11 4.94
Sub-Total Private Industry 153,209 179,320 193,800 201,320 205,850 77.89 77.78 77.61 77.14 76.40Total Number Employed 196,689 230,.550 249,700 260,980 269,450 100.00% 100.00% 100.00% 100.00% 100.00%Unemployed as % of Civ. Labor Force 4.0 5.0 3.8 3.4 3.7 1 — — — — —a. November, 1966, preliminary data.
b. Sugar mill and pineapple cannery workers included in food processing; details not available.
SOURCE: Department of Labor and Industrial Relations, State of Hawaii.

TABLE 8
PUBLIC EMPLOYMENTstate and Local Government Full-Time Equivalent Employees
Per 10,000 Population, By Function: October 1965 State Ranking by Employees — All Functions
State TotalPublic
Schools*HigherEduc.
Highways
HealthHospt.
PoliceFire
Parks General AllRecr.b Water Controic Others<^
Wyo.AlaskaKans.Colo.Ore.Nev.Mont.Wash.N. Y.D. C.Neb.N. M.Calif.Fla.Del.UtahN. D.IdahoIowaS. D.La.
496.3 454. 3436.1435.5426.0423.8410.8 406. 3406.2401.0399.3399.1397.2395.7391.8 391. 8390.6389.6386.1383.1 380. 3
194.2172.3197.3192.2 180.0159.9 172.1168.5135.3127.9159.3162.9148.3147.0150.6178.0164.6161.7 178.6173.1 153.0
46.530.944.950.553.625.138.340.217.9 1.9
33.950.935.429.546.951.750.535.038.033.6 31. 9
58.9 76.144.933.640.043.953.032.9 23.517.0 36.436.921.728.137.334.945.044.134.352.8 35.7
64.5 26.042.546.327.248.928.530.560.451.737.531.639.560.936.925.823.535.6 36.4 19.042.3
24.217.622.722.724.342.3 2 2 . 023.738.458.9 20.1 20.230.629.423.9 20.214.624.019.116.224.8
25.3 20.211.4 16.016.719.5 22.016.912.8 4.8
17.113.418.9 20. 39.6
14.518.428.512.9 16.4 18.3
6.92 . 67.07.87.63.46.46.14.36 . 84.75.0 7.25.64.06.8 2 . 8 2.95.44.67.6
27.436.323.326.526.732.729.321.524.516.524.725.823.321.427.7 20.1 26.2 22.119.7 28.116.4
48.472.342.039.850.048.039.566.089.4
115.665.852.672.353.555.039.745.035.641.939.3 50.5
HAWAII 375.9 130.5 36.7 26.1 37.9 29.0 24,9 10.7 25.0 55.0Ariz. 372.3 160.5 38.8 37.5 22. 9 25.6 12.5 5.6 23.0 45.9Minn. 369.8 159.9 31.6 33.4 43.3 20.3 13.2 4.8 19.1 44.3Okla. 367.4 144.7 37.4 35.6 45.8 21.0 14.9 8.5 19.1 40.3Mich. 364.9 159.6 40.7 22.1 45.9 25.8 9.5 4.5 16.6 40.2Vt. 361.9 130.5 46.3 61.2 24.5 17.9 16.4 3.1 22.4 39.7Ind. 361.2 168.4 36.5 24.5 39.1 23.6 9.9 3.8 18,7 36.7Wise. 360.1 146.9 36.3 28.5 36.9 27.4 13.4 4.0 20.0 46.8Tenn. 360.1 136.6 23.6 36.7 47,4 21.0 15.6 6.7 15.0 54.5Mass. 360. 0 132.4 8.9 27.4 53.8 43.2 6.9 6.2 21.0 60.1Md. 357.9 152.3 29. 6 22.8 42.9 32.1 10. 3 5.1 17.5 45.2U.S. AV. 357.9 146.3 26.6 28.3 40.7 26.7 12.3 5.5 19.6 51.7W. Va. 348.1 144,3 32.5 47.0 37.6 14.7 9.5 4.0 19.3 39.1Texas 345.8 156.8 25.0 29.6 34.0 23.0 11.5 10.3 16.8 39.0Ga. 344.8 144.9 22.8 29.4 57.2 20.2 11.8 6.2 15.5 37.0Miss, 338.6 127.7 33.5 42.2 56.2 16.8 12.8 4.2 15,5 29.7N. H. 336.6 115.1 27.0 46.4 36.9 36.1 10.9 5.9 15.3 43.0Me. 336. 3 143.4 19.9 51.8 23.7 24,8 13.1 7.8 16,7 35.1Ill. 330.5 136.7 22.5 21.1 36.7 28.9 10.2 5.1 16.5 52.7Va. 323.9 145.4 23.3 34.4 31.3 19.8 10.4 3.5 1.6.1 39.7Ohio 322.7 141.9 24.0 22.8 32.6 24.4 6.3 5.2 18.6 46.7Mo. 321.8 141.9 20.0 25.3 40.6 26,5 11.2 5.0 17.6 33.6Conn. 321. 3 140.4 14.8 28.7 31.5 30. 8 6.9 3.0 17.1 48.1R. I. 318.5 108.1 21.8 23.5 38.0 36.6 7.3 5.8 21.9 55.5Ala. 315.6 127.8 23.2 43.7 35.0 19.7 9.8 5.1 12.1 39.3N. J. 315.5 137.1 11.0 21.4 35.8 33.7 8.6 3.7 20.3 43.9N. C. 303.6 138.9 22.5 24.8 31.2 17.4 10.8 4.0 14.5 39.4Pa. 302 .5 132.1 10.8 27.8 28. 3 24.1 7.2 4.5 20.9 46.8Ky. 300.5 132.7 19.7 29.8 34.3 18.5 13.3 6.3 13.9 32.0S. C, 299.9 132.8 20.1 25.2 42.2 16.5 11.7 4.2 14.2 33.0Ark. 296. 4 131.6 24.2 30. 0 35,4 14.8 11.0 5.2 14.8 29,6NOTE: Because of rounding, detail may not add to total. •a. Includes local libraries.b. Includes natural resources.c. Includes finance administration, and other general government control.d. Includes employees in special schools, welfare, sewerage and other sanita
tion, correction, public service enterprises other than water, employment security administration, state liquor stores, and all other general government functions.
SOURCE: "Public Employment in 1965," U. S. Department of Commerce, Bureau ofthe Census, Series GE-No. 2, February, 1966.

WHERE GOVERNMENT GETS ITS MONEY
HAWAII STATE AND COUNTIESHawaii's tax structure is highly centralized. Almost all taxes
are imposed, administered and collected by the State government. There are certain exceptions.
Real property and (county) fuel tax rates are set by the counties, while the State assesses, collects and administers the laws; the public utility franchise tax is administered and collected by the counties, but the rates are set by the State; the 1966 legislature authorized the counties to set the motor vehicle weight tax rates - formerly imposed by the State - giving the counties complete responsibility for this tax. In addition, certain local permits and licenses are levied and administered by the four counties.
Eamarked taxes are limited in Hawaii. Less than 10% of the total $262.1 million state and local taxes (excluding $10.9 million unemployment compensation collections) collected in fiscal 1966 were earmar)ced. Utility franchise and vehicle weight taxes are used for county highways; liquid fuel taxes for airports and state and county highways; and a portion of the real property levy may be earmarked for urban redevelopment (page 18).
Sales and income taxes provide the bulk of Hawaii's tax dollars. Of the total state and county collections, 74.1% came from these sources (pages 32-33).
Total tax collections during fiscal 1966 topped $596.6 million (pages 18 and 35). Federal collections amounted to $323.6 million (page 35), or 54.2%, while state and county tax receipts totalled $273.0 million (page 18).
The per capita tax burden in Hawaii continues to climb. In fiscal 1966, Hawaii's tax collections equalled $365 per capita - a figure higher than was estimated for all but two other states (page 34). The U. S. average was $296 per capita. In relation to per capita personal income, taxes take an average 10.8% of income, while the figure in Hawaii stands at 12.7%. This ranks Hawaii 12th highest in the country.STATE OF HAWAII
Total state receipts increased by 34.6% in fiscal 1966 over the prior year total. A record $327.0 million in revenues was taken in by the state - 77% of which was for general purposes, and 23% for special functions (page 16).
Major sources of state receipts included: taxes $199.3 million(61.0%); federal grants $76.9 million (23.5%); departmental earnings of $22.3 million (6.8%); and miscellaneous other sources $28.5 million (8.7%) - see page 17.THE COUNTIES
County operating revenues amounted to $106.7 million for the latest fiscal year (pages 22-23). City and County of Honolulu revenues reached $77.7 million in fiscal 1966. Calendar 1965 revenues for neighbor island counties were: Maui $9.9 million; Hawaii $13.8million; and Kauai $5.3 million.
Major source of revenue for Honolulu continues to be the real property tax - 64.8% of the total (page 21). State aid is the major source of revenues for Maui (29.1%), Hawaii (30.0%), and Kauai (36.7%).
14
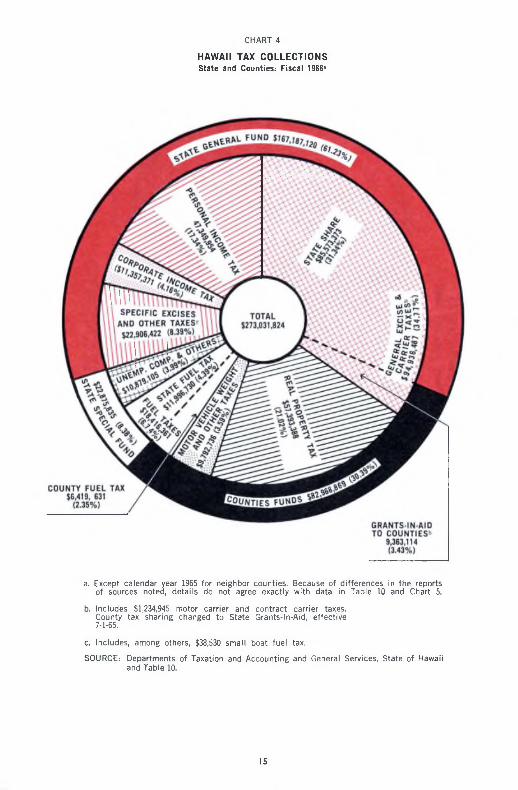
HAWAII TAX COLLECTIONSState and C ounties : F isca l 1966*
CHART 4
a . Except c a ie n da r year 1965 for n e ighbo r counties . Because of d iffe rences in the reports of sources noted , d e ta ils do not agree exactiy w ith data in T ab le 10 and Chart 5.
b . In c ludes $1,234,945 m otor carrie r and contract carrie r taxes.County tax sh a r in g changed to State Grants-ln-Aid, e ffective 7-1-65.
c. In c ludes , am ong others, $38,530 sm a ll boat fu e l tax.
SOURCE : D epartm ents of Taxation and A ccounting and G enera l Serv ices, State o f H aw a ii and Tab le 10.
15

TABLE 9
STATE REVENUE RECEIPTSH aw a ii — Fiscal Years 1965 and 1966
Fiscal 1965 Fiscal 1966
Source of RevenuesGeneralFunds
SpecialFunds Total
GeneralFunds
SpecialFunds Total
Tax RevenuesGeneral Excise 5 54,032,597 $ — 5 54,032,597 5 93,647,887 5 — 5 93,647,887Specific Excises^ 17,283,617 10,955,911 28,239,528 22,243,882 11,996,730 34,240,612Individual Income 38,550,998 — 38,550,998 47,349,954 — 47,349,954Corporate Income 7,567,053 — 7,567,053 9,950,547 — 9,950,547Unemployment Compensation — 10,610,525 10,610,525 — 10,864,415 10,864,415Other Taxes, Licenses & Permits*^ 2,456,154 4,820 2,460,974 3,276,799 6,285 3,283,084
Sub-Total Taxes 5119,890,419 521,571,256 5141,461,675 5176,469,069 522,867,430 5199,336,499Fines, Forfeits and Escheats 5 193,102 5 6 5 193,108 5 1,545,421 7,917 5 1,553,338Federal Grants-in-Aid 43,371,161 15,191,554 58,562,715 56,086,894 20,787,186 76,874,080Revenues from Other Agencies 132,451 85,064 217,515 195,912 99,456 295,368Rents, Royalties & Land Income 2,140,006 1,061,971 3,201,977 1,903,442 1,164,371 3,067,813Sales of Real Property — 1,605,599 1,605,599 — 2,108,571 2,108,571Earnings - General Departments 6,577,328 3,975,460 10,552,788 9,552,110 4,891,103 14,443,213Earnings - Public Serv. Enterp. 181,262 6,467,248 6,648,510 230,952 7,621,733 7,852,685Sale of Investments — — — — 5,100 5,100Repayment Advances to Other
Civil Divisions .. 3,161,896 3,161,896 .. 3,136,891 3,136,891Repayment Debt Cost: Counties 3,759,160 — 3,759,160 3,781,510 — 3,781,510Interest Earned l,957,797d 1,838,515 3,796,312 2,567,n o d 2,151,628 4,718,738Miscellaneous 559,190 9,237,9836 9,797,173 740,011 9,085,4426 9,825,453TOTALS'^ 5178,761,876 564,196,552 5242,958,428 5253,072,431 573,926,828 5326,999,259
a. Includes Public Utilities, Tobacco, Liquor, Insurance and Fuel taxes.b. Includes Franchise tax. Inheritance and Estate taxes, business and non-business licenses and permits.c. Excludes transfers and repayments except as shown.d. Excludes repayments of interest on state bonds from special fund agencies to avoid duplication.e. Includes public school cafeteria sales of 56,317,878 in 1965 and $6,527,184 in 1966.
SOURCE: Department of Accounting and General Services, State of Hawaii.

SOURCES OF STATE GOVERNMENT OPERATING REVENUES Hawaii — Fiscal 1966
STATE GENERAL FUND ONLY
CHART 5
HAWAII NATIONAL GUARD $12,438,746
(4 .91%)
STATE GENERAL AND SPECIAL FUNDS
HAWAII NATIONAL GUARD ' $12,438,746
(3.80%)
REPAYMENT OF ADVANCES
in t e r e s t «
SOURCE: Table 9
17

STATE AND COUNTY TAX COLLECTIONS IN HAWAII Selected Years — 1956-1966
TABLE 10
Unit of Government and Sources 1956 1961 1964 1965 1966State of Hawaii (Fiscal Years)
Gross Income® $35,287,579 $ 68,146,837 $ 71,098,881^ S 77,251,8133 $ 93,721,542*^Fuel 10,928,641 16,430,474 16,057,644 17,057,526 18,454,891Liquor 2,101,494 3,518,661 3,816,109 4,182,734 5,404,933Tobacco 1,264,361 2,248,372 2,356,105 2,608,868 3,719,259Insurance 1,095,266 2,213,238 2,754,787 2,794,785 3,812,355Public Service Companiesb 2,625,455 4,644,783 7,261,817 7,613,281 8,984,927Banks and Other Financial Corporationsc 175,000 794,073 752,013 900,294 1,406,823Corporate Income^ 3,487,326 5,833,733 7,053,094 7,567,053j 9,950,548Personal Income©
Compensation and Dividends 12,337,804 98,251 14,654 9,338 7,456Net Income 1,876,153 32,051,616 34,664,948i 38,541,659j 47,342,497k
Inheritance and Estate 238,994 1,059,904 1,164,973 1,077,416 1,445,585Real Property^ 11,245,040b 21,886,297h 34 ,271,968i 41,756,8723 57,399,238kLicenses, Permits and Others 321,764 556,117 593,835 732,891 716,214Unemployment Compensation 2,401,330 5,333,817 9,373,885 10,617,678 10,872,820
Sub-Total $85,386,207 $164,816,173 $191,234,713 $212,712,208 $263,239,088Counties (Previous Calendar Year)?
Liquor License Fees $ 368,531 $ 456,529 S 509,566 $ 541,205 $ 574,331Utility Franchise 595,585 940,991 1,292,555 1,368,960 1,440,084Motor Vehicle Weight 3,733,098 4,693,523 5,453,843 5,743,127 6,034,168Licenses, Permits and Others 823,896 1,252,004 1,367,043 1,537,117 1,744,153
Sub-Total $ 5,521,110 $ 7,343,047 $ 8,623,007 $ 9,190,409 $ 9,792,736Grand Total S90.907.317 $172,159,220 $199,857,720 $221,902,617 $273,031,824
b.
d..
Includes Use, Consumption and Compensating Taxes.Formerly Public Utility. New law effective January 1, 1964, includes public utilities and airlines and motor carriersformerly under General Excise Tax.Flat amount bank tax until January 1, 1958.Includes payments on estimated taxes from January 1, 1958.Compensation and Dividends Tax repealed effective January 1, 1958. Net income tax includes withheld and estimated taxamounts from January 1, 1958, less refunds.Includes Personal Property Tax for prior years; repealed January 2, 1948.Except fiscal year data for City and County of Honolulu from 1962.Adjusted by $4,476,000 collected in 1956 for 1955 and $2,841,000 in 1961 for 1960.Reduced by Natural Disaster refunds and credits as follows: General Excise $1,228,905; Personal Income $84,053; and RealProperty $152,483.Reductions for Natural Disaster refunds and credits as follows: General Excise $1,182,376; corporate income $20,000;Personal Income $197,152; Real Property $298,110.Reduced by Natural Disaster refunds and credits - General Excise $777,475; Net Income $197,425; Real Property $738,247; and Hurricane "Dot" $195.
SOURCE: Departments of Taxation and Accounting and General Services, State of Hawaii; City and County of Honolulu FinanceDepartment, and County Auditors.
k.
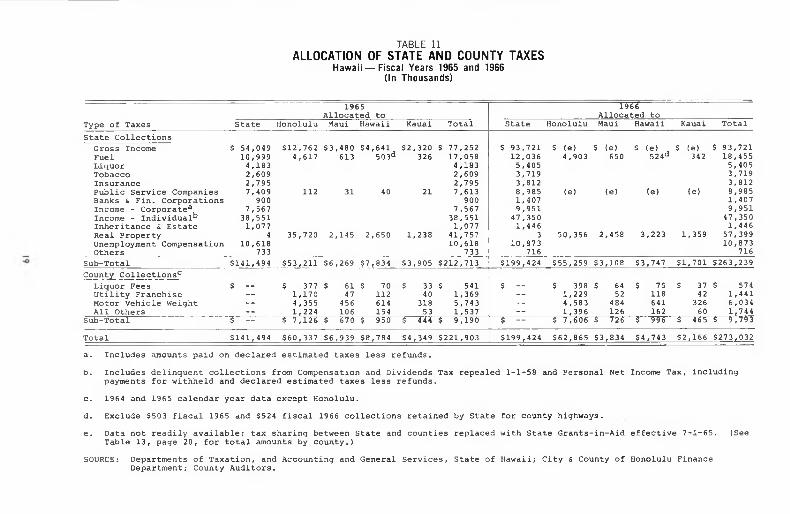
ALLOCATION OF STATE ANO COUNTY TAXESH aw a ii — F iscal Years 1965 and 1366
(In Thousands)
TABLE 11
1966 Allocated to
1 9 6 5Allocated to
Type of Taxes State Honolulu Maui Hawaii Kauai Total State Honolulu Maui Hawaii Kauai TotalState Collections
Gross Income $ 54,049 $12,762 $3,480 $4,641 $2,320 $ 77,252 $ 93,721 $ (e) $ (e) $ (e) ^ $ (e) $ 93,721Fuel 10,999 4,617 613 503*^ 326 17,058 12,036 4,903 650 524*^ 342 18,455Liquor 4,183 4,183 5,405 5,405Tobacco 2,609 2,609 3,719 3,719Insurance 2,795 2,795 3,812 3,812Public Service Companies 7,409 112 31 40 21 7,613 8,985 (e) (e) (e) (e) 8,985Banks & Fin. Corporations 900 900 1,407 1,407Income - Corporate® 7,567 7,567 9,951 9,951Income - Individual^ 38,551 38,551 47,350 47,350Inheritance & Estate 1,077 1,077 1,446 1,446Real Property 4 35,720 2,145 2,650 1,238 41,757 3 50,356 2,458 3,223 1,359 57,399Unemployment Compensation 10,618 10,618 10,873 10,873Others 733 733 716 716
Sub-Total $141,494 $53,211 $6,269 $7,834 $3,905 $212,713 $199,424 $55,259 $3,108 $3,747 $1,701 $263,239County Collections*^
Liquor Fees $ — $ 377 $ 61 $ 70 S 33 $ 541 $ — $ 398 S 64 $ 75 S 37 $ 574Utility Franchise — 1,170 47 112 40 1,369 — 1,229 52 118 42 1,441Motor Vehicle Weight — 4 ,355 456 614 318 5,743 — 4 ,583 484 641 326 6,034All Others — 1_,_224 106 154 53 1,537 — 1,396 126 162 60 1,744
Sub-Total $ — $ 7,126 $ 670 $ 950 $ 444 $ 9,190 $ — S 7,606 S 726 $ 996 $ 465 $ 9,793
Total $141,494 $60,337 $6,939 $8,784 $4,349 $221,903 $199,424 $62,865 $3,834 54,743 $2,166 $273,032
a. Includes amounts paid on declared estimated taxes less refunds.
b. Includes delinquent collections from Compensation and Dividends Tax repealed 1-1-58 and Personal Net Income Tax, including payments for withheld and declared estimated taxes less refunds.
c. 1964 and 1965 calendar year data except Honolulu.
d. Exclude $503 fiscal 1965 and $524 fiscal 1966 collections retained by State for county highways.
e. Data not readily available; tax sharing between State and counties replaced with State Grants-in-Aid Table 13, page 20, for total amounts by county.)
SOURCE: Departments of Taxation, and Accounting and General Services, State of Hawaii; City & County ofDepartment; County Auditors.
effective 7-1-65. (See
Honolulu Finance

TABLE 12
GENERAL EXCISE TAX COLLECTIONS State of Hawaii - Fiscal Years 1961,1965 and 1966’
Activities 1966Change 1966 from 1965
Amount PercentRetailing $30,618,958 $36,898,014 $44,656,034
10,204,153d ;$ 7,758,020 21.03
Services 7,059,818 0 ,962,071d 1,242,082 13.86Contracting Theater, Radio,
9,994,606 11,195,909 13,902,754 1 2,706,845 24.18Amusement 780,258 954,868 1,056,119 1 101,251 10.60Interest 654,469 995,551 1,118,994 , 123,443 12.40Commissions 1,503,320 1,831,342 2,216,757 ' 385,415 21.05Rentals 5,741,319 9,092,898 11,148,530 2,055,632 22.61AirlinesConsumption
482,056 (d) (d) — —(+ 4% Use)b 1,880,147 1,234,667 1,622,070 387,403 31.38
All Others 819,511 1,062,355 1,370,780 308,425 29.03Sub-Total $59,534,462 $72,227,675 $87,296,191 $15,068,516 20.86Sugar Process. $ 1,857,696 $ 824,668 $ 745,240 -$ 79,428 - 9.63Pine Canning 2,012,954 617,538 576,236 41,302 - 6.69
$ 3,870,650 $ 414,590
1,300,061
$ 1,442,206 $ 1,321,476 -$ 120,730 - 8.37Producing ManufacturingC
283,476932,963
283,469981,313
748,350
Sub-Total $ 1,714,651 $ 1,216,439 $ 1,264,782 48,343 3.97Wholesaling $ 2,392,114 $ 2,302,728 $ 2,600,884 298,156 12.95Intermediary Services
Compensating (+ S% Use)6
Blind Vendors
90,467
199,5344,336
87,366
165,4511,867
88,988
603.8463,155
1,622
438,3951,288
1.86
264.9768.99
Sub-Total $ 2,686,451 $ 2,,557,412 $ 3 ,296,873 $ 739,461 28.91InsuranceSolicitors $ 59,105 $ 154,325 $ 186,354 $ 32,029 20.75
Penalties and Interest
Licenses, Fees, and Others
Disaster Claims Refunds
150,706
130.812
268,905
160,185®
775,334
210,315
246,882® i
101,331
“ 58,590
86,697
674,003
- 21.79
54.12
86.93GRAND TOTAL $68,146,837 $77,,251,813 $93,,721,542 $16,,469,729 21.32
were changed effective January 1, 1961 and July 1, 1965.b. Consumption and Compensating Taxes repealed effective 12/31/65; replaced with
Use Tax (at same rates) effective 1/1/66.c. Includes canning other than pineapple.d. Excludes collections from motor and contract carriers and public utility air
lines subject to Public Service Companies Tax effective January 1, 1964.e. Includes estimated tax (net) payments of $16,376 in 1965 and $97,960 in 1966.
SOURCE: Department of Taxation, State of Hawaii.
TABLE 13
DISTRIBUTION OF GENERAL EXCISE AND CARRIER TAXESHawaii — State and Counties*
Fiscal Years 1961, 1965 and 1966
1961 1965 1966Change 1966 Amount
from 1965 Percent
Honolulu $10,219,140 $12,873,985 $ 1,489,465 -$11,384,520 -88.43Hawaii 3,716,051 4,681,449 3,396,360 - 1,285,089 -27.45Maui 2,787,038 3,511,087 2,433,413 - 1,077,674 -30.69Kauai 1,858,025 2,340,724 2,043,876 - 296,848 -12.68Counties Share $18,580,254 $23,407,245 $ 9,363,114 -$14,044,131 -60.00State Share $49,566,583 $54,480,495 $85,593,373 $31,112,878 57.11
Total $68,146,837 $77,887,740 $94,956,487 $17,068,747 21.91
Method o£ distribution to counties changed from tax sharing to grants-in-aid effective 7-1-65. Includes General Excise, Consumption and Compensating taxes (both repealed 12-31-65), Use Tax (effective 1-1-66), and taxes on Motor and Contract Carriers subject to Public Service Company taxes after 1-1-64. (See Table 27, page 32 for distribution formula.)
URCE: Department of Taxation, State of Hawaii.
20

SOURCES OF COUNTY GOVERNMENT REVENUES Percentage D istr ibu t ion — By Counties
H ono lu lu F isca l 1966: Other C ounties C a lendar 1965
CHART 6
1 0 % 2 0 % 3 0 % 4 0 % 5 0 % 6 0 % 7 0 %
REAL PROPERTY TAX
15 .33%
GENERAL EXCISE TAX
L IQ U ID FUEL TAX
MOTOR VEH IC LE
W E IG H T TAX
6 .3 1 %
B .44%
3 .7 4 % I
^ 6 . 2 7 %
5 .9 0 %
4 .9 1 %
4 .6 4 % I
^ 9 . 1 2 %
OTHER TAXES
STATE A ID GRANTS
DEPARTMENTAL
EARN INGS
OTHER REVENUES
I3 .8 9 %
! .4 5 %
| \ \ | 2 .5 7 %
$ 3 2 .6 1 %
16.90%
29 .06%
17 .84%
$ ^ ^ ^ ^ W \ \ ' j l 6 . 7 0 %
^ 0 .9 4 %
64 .77%
City and County of H ono lu lu
County of M au i
k W \ \ l County of H aw a ii
County of K aua i
1 0 % 2 0 % 3 0 % 4 0 % 5 0 % 6 0 % 7 0 %
SOURCE: Tab les 14-17 in c lu s ive .
21

OPERATING REVENUES-CITY AND COUNTY OF HONOLULUSelected Years — All Funds*
TABLE 14
...... ■ Calendar Years Fiscal YearsSources of Revenues 1955 1960 1964 1965 1966
Real Property^ S 8,888,918 $17,815,405 $28,908,046 $35,719,553 $50,355,931General Excise 6,558,647 9,782,342 11,456,161 11,893,973 — dLiquid Fuel 2,311,083 3,846,945 4,373,362 4,616,919 4.903,437Utility Franchise 486,316 784,109 1,097,165 1,169,761 1,228,915Motor Vehicle Weight 2,609,420 3,453,375 4,112,390 4,355,252 4,583,179
Sub-Total Taxes $20,854,384 $35,682,176 $49,947,124 $57,755,458 $61,071,462Liquor Licenses & Fees $ 239,464 $ 322,725 $ 351,853 $ 377,582 $ 398,190Parking Meter Fees 188,292 520,119 723,499 731,986 765,577Other Licenses & Permits 626,812 1,009,725 1,071,721 1,224,295 1,395,915Fines, Forfeits & Penalties 640,933 884,691 1,320,429 1,231,222 71,232Departmental Earnings^ 915,895 1,611,845 4,293,415 4,771,816 3,588.536State Grants
Indigent 768,214 911,513 — -- —TB Hospitals — — — — —Pensioners 139,405 271,410 336,915 330,392 331,070Salary Adjustment 61,666 1,590,543 -- — 1,688,550Act 155d -- — — — 1,489,465Others 119,630 189,632 288,423 329,927 1,848,946
Sub-Total State Grants $ 1,088,915 $ 2,963,098 $ 625,338 $ 660,319 $ 5,358,031Other Grants
Federal $ 112,500 $ 4,468,348 $ 2,690,217 $ 3,764,139 $ 3,802,806Hawaii Housing Authority 86,818 75,722 112,622 141,024 105,494
Land Sales — 174,682 2,056,267 423,679 485,882Miscellaneous 354,862 243,106 528,766 668,365 699,843Totals $25.108,875 $47,956,237 $63.721.251 $71,749,885 $77,742,969
Excludes Bond, Improvement District, Trust (except Liquor Commission Funds and Motor Vehicle Dealers Licensing Board Funds), Revolving Fund and Water Supply Revenues.
b. Includes Urban Redevelopment levy.c. Includes rental and interest incomes, garbage collection fees and others.d. General excise tax sharing method changed by Act 155, SLH 1965 (effective July 1, 1965). State
aid comes from general excise tax and is granted in an amount based on each county's "relativefiscal capacity and relative fiscal need" as defined by the legislature.
SOURCE: Finance Director's Annual Financial Reports (Controller to 1960), City and County ofHonolulu, State of Hawaii.
TABLE 15
OPERATING REVENUES-COUNTY OF MAUISelected Calendar Years — All Funds’
Sources of Revenues 1955 1960 1963 1964 1965Taxes
Real Property 51 ,008,062 $1 ,410,000 $1,611,982 $1,987,289 52,276,569General Excise 1,788,722 2 ,704,327 3,001,760 3,331,557 l,509,84icLiquid Fuel 356,383 538,266 578,083 596,200 634,674Utility Franchise 26,818 38,751 47,069 47,089 51,527Motor Vehicle Weight 367,220 395,398 438,891 456,539 484,197
Sub-Total Taxes $3 ,547,205 $5,,086,742 $5,677,785 $6,418,674 $4,956,808Liquor Licenses & Fees $ 40,790 $ 49,443 $ 57,118 $ 60,644 $ 63,947Parking Meter Fees — — -- — —Other Licenses & Permits 65,086 87,136 104,385 105,448 125.711Pines, Forfeits & Penalties 18,486 21,239 24,475 25,446 13,179Departmental Earnings^ 434,753 933,241 1,414,647 1,585,183 1,757,191State Grants
Indigent 71,987 83,390 -- — —TB Hospitals 467,656 660,906 683,534 695,826 697,893Pensioners 70,610 175,414 179,666 177,276 178,751Salary Adjustment 67,564 267,499 95,527 — 32,056Redevelopment — — 3,000 — —Act 155C — — — -- 1,216,709Others 24,751 67,844 203,073 196,017 737,677
Sub-Total State Grants $ 702,568 $1 ,255,053 $1,164,800 $1,069,119 $2,863,086Other Grants
Federal $ -- $ -- $ 1,472 $ 58,256 $ 1,525Hawaii Housing Authority -- — — — --
Land Sales — 8,534 — — —Miscellaneous 2,034 33,002 20,308 56,339 69,937Totals $4 ,810,922 $7,474,390 $8,464,990 $9,379,109 $9,851,384
b.Excludes Bond Revolving and certain Trust Funds and Water Supply Revenues. Data for 1964 revised.Includes rentals, interest, garbage collection charges and other earnings.General excise tax sharing method changed by Act 155, SLH 1965, (effective July 1, 1965). State aid cones from the general excise tax and is granted in an amount based on each county's "relative fiscal capacity and relative fiscal need" as defined by the legislature.
SOURCE; Annual Reports of the Auditor, County of Maui, State of Hawaii.
22

OPERATING REVENUES-COUNTY OF HAWAIISelected Calendar Years — All Funds*
TABLE 16
Sources of RevenuesTaxes
Real Property General Excise Liquid Fuelb Utility Franchise Motor Vehicle Weight
Sub-Total Taxes
1963 1965
$1,210,5992,384,963
137,05661,919
485,949_$4,280,486
$ 1,838,194 3,645,910
429,123 88,686
___ 552,407
Liquor Licenses & Fees $ 60,590Parking Meter Fees 33,450Other Licenses & Permits 97,249Fines, Forfeits & Penalties 33,388Departmental Earnings^ 1,318,925
2,056,7413,988,162
461,131109,947593,304
2,567,8454,439,673
488,699112,331613,662
2,895,3821,970,055d
516,845118,090640,730
6,554,320 $ 7,209,285 $ 8,222,210 $ 6,141,10257,01633,974
110,74538,983
1,365,892
67,85839,662
141,39039,181
2,094,981
70,07041,944153,86058,803
2,323,121
74,70943,353162,16931,632
939,594
IndigentTB HospitalsPensionersSalary AdjustmentRedevelopmentCapital ImprovementsAct 155dOthers
122,149510,81286,48564,431
112,984
141,336593,028176,095464,149
1,017,050
710,906191,818140,534
2,0771,483,977
224,966
728,243168,248
1,159,504190,664
169,45043,103
,042,000,698,181188,280
Sub-Total State Grants $ 896,861 $ 2,391,658 $ 2,754,278 $ 2,246,659 $ 4,141,014other Grants
FederalHawaiian Home Lands Hawaii Housing Authority
Land Sales Miscellaneous
$ —5,947
114,067
$ —2,574
32,670
$ 1,607,154
6,511 57,942
$ 35,546 9,397
123,335
$ 1,227,4769,863
977,25460,474
Totals $6,840,963 $10,587,832 $14,018,242 $13,284,945 $13,808,640
b. Excludes amounts withheld by state for highways.c. Includes rentals, interest, garbage collection charges and other earnings.d. General excise tax sharing method changed by Act 155, SLH 1965 (effective July 1, 1965).
State aid comes from the general excise tax and is granted in an amount based on each county's "relative fiscal capacity and relative fiscal need" as defined by the legislature.
SOURCE: County Auditor's Annual Reports, County of Hawaii, State of Hawaii.
TABLE 17
OPERATING REVENUES-COUNTY OF KAUAISelected Calendar Years — All Funds’
Sources of Revenues 1955 1960 1963 1964 1965Taxes
Real Property $ 603,,792 $ 954 ,061 $1.,022,,444 $1,.142,,061 $1.,304,,360General Excise 1,.183,,467 1,756 ,350 2,,001,,840 2,,220,,37ld 1.,007,,227cLiquid Fuel 206,,374 284 ,600 312,.777 320,.639 334,,502Utility Franchise 20,,532 29 ,445 38,,375 39,.780 41,,552Motor Vehicle Weight 270.,509 292 ,343 309,,258 317,,673 326,.062
Sub-Total Taxes $2,284,,674 $3 ,316 ,799 $3..684,,694 $4,.040,.544 $3.,013,,703Liquor Licenses and Pees $ 27,,243 S 27 ,345 $ 32 .737 $ 32,,910 $ 37.,485Parking Meter Fees — — — — —Other Licenses & Permits 35,,202 44 ,398 49,.546 53,,404 60..358Fines, Forfeits & Penalties 5..516 6 ,046 7 .154 8,,159 4,,458Departmental Earningsb 26,,886 53 ,301 112 .198 146,,977 213,,497State Grants
Indigent 34,,900 67 ,260 _ «_ _TB Hospitals 391,.172 491 ,358 574 ,182 60S,.872 616,.897Pensioners 45,,790 96 .92.8 90 ,726 87,.932 78,,853Salary Adjustment 43,,696 192 ,532 66,,169 — 16,,029Act 155C — — -- — 1,,021,,941Others 59,.695 97 ,432 331 ,783 206,,700 223..891
Sub-Total State Grants $ 575,.253 $ 945 ,510 $1,.062 ,860 $ 900,,504 $1,,957,,611Other Grants
Federal ,Hawaii Housing Authority
Land Sales Miscellaneous
$ 16,
19,
,136
,103
$ 14
28
,226
,402
$ 48
11
,653
,743
$ 18,
108,
,583
.6696
$ 15,
30,
,590
,272Totals $2 ,990,,013 $4,436 ,027 $5,,009 ,585 $5,.309,,750 $5,,332,,974a. Excludes Loan, Bond, Revolving and certain Trust Funds, and Water Supply Revenues.b. Includes rentals, interest, garbage collection charges, and other earnings.c. General excise tax sharing method changed by Act 155, SLH 1965. State aid comes from
the general excise tax and is granted in an amount based on each county's "relative fiscal capacity and relative fiscal need," as defined by the legislature.
d. Includes amount retained by state for repayment of county loan ($100,000) in 1964.e. Includes $100,000 warrant cancelled - amount retained by state as repayment of loan.SOURCE: County Auditor's Annual Reports, County of Kauai, State of Hawaii.
23

STATE GENERAL SALES TAX DATATax Rates at January 1, 1967
TABLE 18
StateRetail
StateRate^
LocalOtherRatesb
FoodTaxable®
DrugsTaxable'^
HAWAII 4.0 — 0.5 Yes YesAlabama 4.0 2.0 — Yes YesAlaska — 3.0 — Yes YesArizona 3.0 1.0 — Yes YesArkansas 3.0 -- Yes YesCalifornia 3.0 1.0 No NoColorado 3.0 2.0 _ - YesC YesConnecticut 3.5 — - - No NoFlorida 3.0 -- No NoGeorgia 3.0 -- -- Yes YesIdaho 3.0 — -- Yes YesIllinois 3.5 0. 5 -- Yes YesIndiana 2.0 — 0.5 YesC YesCIowa 2.0 -- — Yes YesKansas 3.0 — Yes YesKentucky 3.0 -- — Yes YesLouisiana 2.0 2.0 — Yes YesMaine 4.0 — — No NoMaryland 3.0 (g) — No NoMassachusetts 3.0 No NoMichigan 4.0 — — Yes YesMississippi 3.5 1.0 0.125 Yes YesMissouri 3.0 — — Yes YesNevada 2.0 — — Yes YesNew Jersey 3.0 — — No NoNew Mexico 3.0 1.0 0.5 Yes YesNew York 2.0 3.0 -- No NoNorth Carolina 3.0 — — Yes NoNorth Dakota 2.25* -- Yes NoOhio 3.0 - - No NoOklahoma 2.0 1.0 — Yes YesPennsylvania 5.0 — — No NoRhode Island 4.0 — -- No NoSouth Carolina 3.0 — — Yes YesSouth Dakota 3.0 -- — Yes YesTennessee 3.0 1.0 — Yes YesTexas 2.0 — — No NoUtah 3.0 0. 5 — Yes YesVirginia 2.0 1.0 - - Yes NoWashington 4.64^ 0.1 0.44 Yes YesWest Virginia 3.5f 0.5 0.4 Yes YesWisconsin 3.0 - - — No NoWyoming 2.5 0.5 — Yes YesDist, of Columbia — 3.0 — Yes No
Generally on tangible personal property only, although imposed on selected services by a few states.
b. Hawaii levies the tax on wholesaling, producing and manufacturing; Indiana on wholesaling, processing and producing; Mississippi on wholesaling only; New Mexico on wholesaling of alcoholic beverages; Washington on wholesaling and manufacturing; West Virginia on wholesaling (0.25%) and manufacturing (0.4%).
G. Taxability of food for home consumption; meals are taxable in all states. In Colorado, food is exempt from local taxation, and a tax credit is allowed on personal income tax returns to offset the state tax on food; a credit is allowed in Indiana to offset the tax on food and drugs. (See notes on Personal Income Tax, Table 25.)
d. Generally limited to medicine and drugs on prescription, although some states allow broader exemption from tax including such items as patent medicines, baby supplies, eyeglasses and various other medical supplies. Additionally, the states of Massachusetts, New Jersey and Pennsylvania do not apply the sales tax on clothing.
e. Sales tax expired July 1, 1965, but the use tax is applicable to most sales covered by the former tax.
f. Rate includes retail sales tax plus business occupation tax rate as follows: Washington 4.2% + .44%; West Virginia 3.0% + 0.5%.
g. Three local units authorized to levy a tax; rate may be changed from year toyear according to calculated formula based on 1/3 of total estimated revenuesfrom gross retail rate collected within the three areas.
NOTE; Transient rentals (as defined in statutes, generally less than 30 or 90 consecutive days) taxable in all states EXCEPT: California, Iowa, Nevada andRhode Island.
SOURCE: State Tax Guide, All States Unit, Commerce Clearing House, Inc.; Tax Administrators News, Federation of Tax Administrators; State of Hawaii, Department of Taxation.
24
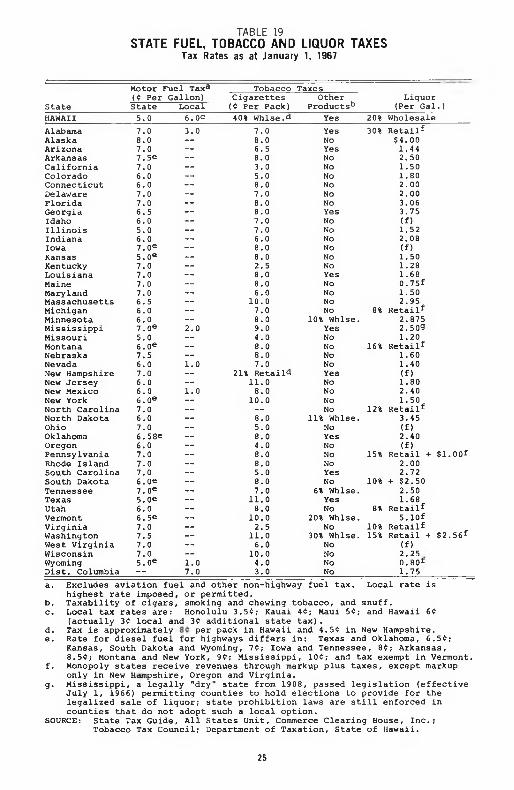
STATE FUEL, TOBACCO AND LIQUOR TAXESTax Rates as at January 1, 1967
TABLE 19
Motor :Fuel Tax® Tobacco Taxes($ Per Gallon) Cigarettes Other
Products^Liquor
State State Local ($ Per Pack) (Per Gal.)HAWAII 5.0 6.0C 40% Whlse.d Yes 20% WholesaleAlabama 7.0 3.0 7.0 Yes 30% Retail^Alaska 8.0 — 8.0 No $4.00Arizona 7.0 — 6.5 Yes 1.44Arkansas 7.5© — 8.0 No 2.50California 7.0 — 3.0 No 1.50Colorado 6.0 — 5.0 No 1.80Connecticut 6.0 — 8.0 No 2.00Delaware 7.0 — 7.0 No 2,00Florida 7.0 — 8.0 No 3.06Georgia 6.5 — 8.0 Yes 3.75Idaho 6.0 — 7.0 No (f)Illinois 5.0 — 7.0 No 1.52Indiana 6.0 — 6.0 No 2.08Iowa 7.0e — 8.0 No (f)Kansas 5.0® — 8.0 No 1.50Kentucky 7.0 — 2.5 No 1.28Louisiana 7.0 — 8.0 Yes 1.68Maine 7.0 — 8.0 No 0.75fMaryland 7.0 — 6.0 No 1.50Massachusetts 6.5 — 10.0 No 2.95Michigan 6.0 — 7.0 No 8% Retail^Minnesota 6.0 — 8.0 10% Whlse. 2.875Mississippi 7.0® 2.0 9.0 Yes 2.509Missouri 5.0 — 4.0 No 1.20Montana 6.0® — 8.0 No 16% Retail^Nebraska 7.5 — 8.0 No 1.60Nevada 6.0 1.0 7.0 No 1.40New Hampshire 7.0 — 21% Retail^ Yes (f)New Jersey 6.0 — 11.0 No 1.80New Mexico 6.0 1.0 8.0 No 2.40New York 6.0® — 10.0 No 1.50North Carolina 7.0 — — No 12% Retail^North Dakota 6.0 — 8.0 11% Whlse. 3.45Ohio 7.0 — 5.0 No (f)Oklahoma 6.58© — 8.0 Yes 2.40Oregon 6.0 — 4.0 No (f)Pennsylvania 7.0 — 8.0 No 15% Retail + $1.00fRhode Island 7.0 — 8.0 No 2.00South Carolina 7.0 — 5.0 Yes 2.72South Dakota 6.0© — 8.0 No 10% + $2.50Tennessee 7.0® — 7.0 6% Whlse. 2.50Texas 5.0© — 11.0 Yes 1.68Utah 6.0 — 8.0 No 8% Retail^Vermont 6.5© — 10.0 20% Whlse. S.l0fVirginia 7.0 — 2.5 No 10% Retail^Washington 7.5 — 11.0 30% Whlse. 15% Retail + $2.56^West Virginia 7.0 - - 6.0 No (f)Wisconsin 7.0 — 10.0 No 2.25Wyoming 5.0® 1.0 4.0 No 0.80^Dist. Columbia — 7.0 3.0 No 1.75a. Excludes aviation fuel and other non-highway fuel tax. Local rate is
highest rate imposed, or permitted.b. Taxability of cigars, smoking and chewing tobacco, and snuff.c. Local tax rates are: Honolulu 3.5<:; Kauai 4^; Maui 5C; and Hawaii 6^
(actually 3^ local and 3^ additional state tax).d. Tax is approximately per pack in Hawaii and 4.5C in New Hampshire.e. Rate for diesel fuel for highways differs in: Texas and Oklahoma, 6.5$;
Kansas, South Dakota and Wyoming, 7C; Iowa and Tennessee, 8$; Arkansas,8.5$; Montana and New York, 9$; Mississippi, 10$; and tax exempt in Vermont.
f. Monopoly states receive revenues through markup plus taxes, except markuponly in New Hampshire, Oregon and Virginia.
g. Mississippi, a legally "dry" state from 1908, passed legislation (effectiveJuly 1, 1966) permitting counties to hold elections to provide for the legalized sale of liquor; state prohibition laws are still enforced in counties that do not adopt such a local option.
SOURCE: State Tax Guide, All States Unit, Commerce Clearing House, Inc.;Tobacco Tax Council; Department of Taxation, State of Hawaii.
25
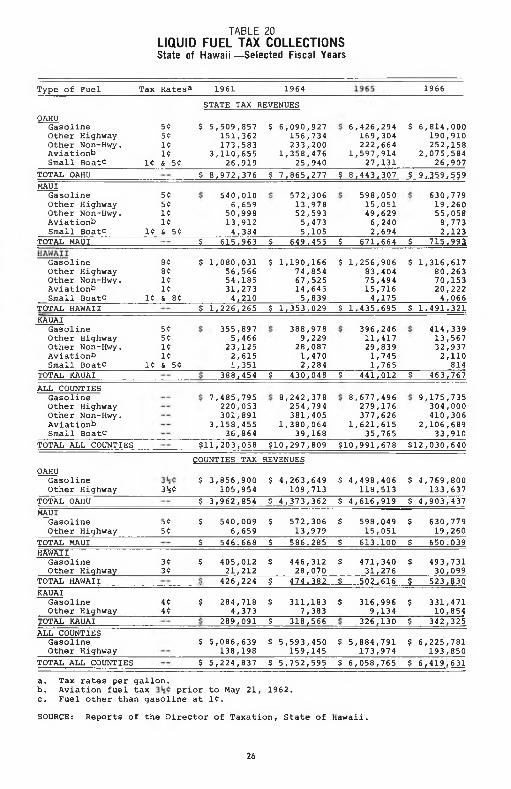
LIQUID FUEL TAX COLLECTIONSState of H aw a ii— Selected Fiscal Years
TABLE 20
Type of Fuel Tax Rates© 1961 1964 1966
OAHUGasoline Other Highway Other Non-Hwy. Aviationb Small Boatc
STATE TAX REVENUES
5<J 5C 1C 1C
1C & 5C
$ 5,509,857 151,362 173,583
3,110,655 26,919
$ 6,090,927 156,734 233,200
1,358,476 25,940
6,426,294169,304222,664
1,597,91427,131
$ 6,814,000 190,910 252,158
2,075,584 26,907
TOTAL OAHUMAUI
Gasoline Other Highway Other Non-Hwy. Aviationb Small Boatc
$ 8,972,376 $ 7,865.277 $ 8.443.307 $ 9.359,559
5C 5C 1C 1C
1C & 5C
540,010 6,659
50,998 13,912 4 ,384
572,30613,97852,5935,4735,105
598,05015,05149,6296,2402,694
630,77919,26055,0588,7732,123
TOTAL MAUI S 615.963 $ 649.455 $ 671,664 $ 715,951
Gasoline Other Highway Other Non-Hwy. Aviationb Small Boatc 1C
8C8C1C1C& 8C
$ 1,080,031 56,566 54,185 31,273 4,210
$ 1,190,166 74,854 67,525 14,645 5,839
$ 1,256,906 83,404 75,494 15,716 4,175
$ 1,316,617 80,263 70,153 20,222
_______ 4,066TOTAL HAWAIIKAUAI
Gasoline Other Highway Other Non-Hwy. Aviationb Small Boatc
$ 1,226,265 $ 1,353.029 $ 1.435.695 $ 1.491.321
1C
5C5C1C1C& 5C
355,8975,466
23,1252,6151,351
388,9789,229
28,0871,4702,284
396,24611,41729,8391,7451,765
414,33913,56732,9372,110
814TOTAL KAUAIALL COUNTIES
Gasoline Other Highway Other Non-Hwy. Aviationb Small Boatc
388,454 $ 430,048 $ 441,012 $ 463,767
7,485,795220,053301,891
3,158,45536,864
8,242,378254,794381,405
1,380,06439,168
8,677,496279,176377,626
1,621,61535,765
9,175,735304,000410,306
2,106,68933,910
TOTAL ALL COUNTIES $11,203,058 $10,297,809 $10,991,678 $12,030,640COUNTIES TAX REVENUES
OAHUGasoline Other Highway 3isC
$ 3,856,900 105,954
$ 4,263,649 109,713
$ 4,498,406 118,513
$ 4,769,800 133,637
TOTAL OAHU $ 3,962,854 $ 4,373,362 $ 4,616,919 $ 4,903,437MAUI
Gasoline Other Highway
5C5C
$ 540,0096,659
$ 572,30613,979
$ 598,04915,051
$ 630,77919,260
TOTAL MAUIHAWAII----------
Gasoline Other Highway
S 546.668 $ 586.285 S 613.100 S 650.039
3C3C
$ 405,012 21,212
$ 446,31228,070
$ 471,340______31,276
$ 493,731______ 30,099
TOTAL HAWAII 426,224 $___ 474,382 $___ 502.616 $ 523.830KAUAI
Gasoline Other Highway
4C4C
$ 284,718_______ 4,373
$ 311,183_______ 7,383
$ 316,9969,134
$ 331,47110,854
TOTAL KAUAI 289,091 $ 318,566 326,130 $ 342,325ALL COUNTIES
Gasoline Other Highway
$ 5,086,639 138,198
$ 5,593,450 159,145
$ 5,884,791 173,974
$ 6,225,781 193,850
TOTAL ALL COUNTIES $ 5,224,837 $ 5,752,595 $ 6,058,765 $ 6,419,631
a. Tax rates per gallon.b. Aviation fuel tax prior to May 21, 1962.c. Fuel other than gasoline at 1C.
SOURCE: Reports of the Director of Taxation, State of Hawaii.
26
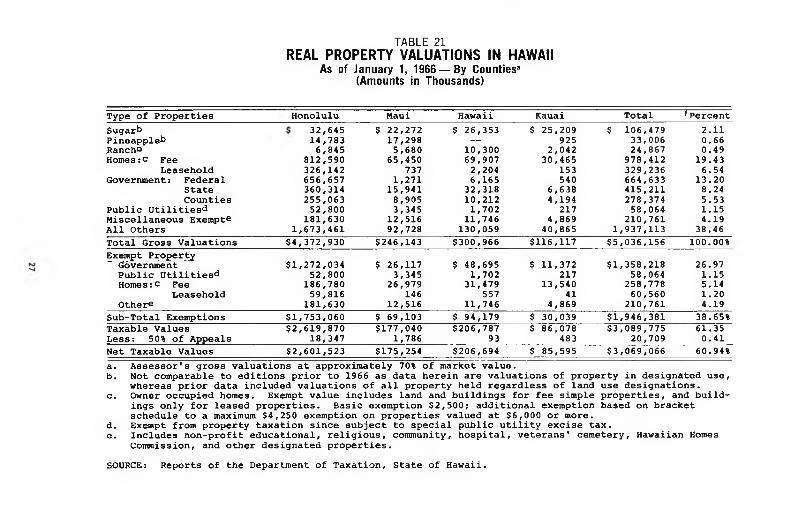
REAL PROPERTY VALUATIONS IN HAWAIIAs of January 1, 1966 — By Counties^
(Amounts in Thousands)
TABLE 21
Type of Properties Honolulu Maui Hawaii Kauai Total <PercentSugarhPineapple^Ranchb Homes:c Fee
Leasehold G overnment: Federa1
State Counties
Public Utilitiesd Miscellaneous Exempts All Others
32,645 $ 22,272 $ 26,353 $ 25,209 $ 106,479 2.1114,783 17,298 — 925 33,006 0.666,845 5,680 10,300 2,042 24,867 0.49
812,590 65,450 69,907 30,465 978,412 19.43326,142 737 2,204 153 329,236 6.54656,657 1,271 6,165 540 664,633 13.20360,314 15,941 32,318 6,638 415,211 8.24255,063 8,905 10,212 4,194 278,374 5.5352,800 3,345 1,702 217 58,064 1.15
181,630 12,516 11,746 4,869 210,761 4.191,673,461 92,728 130,059 40,865 1,937,113 38.46
Total Gross Valuations $4,372,930 $246,143 $300,966 $116,117 $5,036,156 100.00%Exempt Property
Government $1,272,034 $ 26,117 $ 48,695 $ 11,372 $1,358,218 26.97Public Utilities^ 52,800 3,345 1,702 217 58,064 1.15Homes:C Fee 186,780 26,979 31,479 13,540 258,778 5.14
Leasehold 59,816 146 557 41 60,560 1.20Other® 181,630 12,516 11,746 4,869 210,761 4.19
Sub-Total Exemptions $1,753,060 $ 69,103 $ 94,179 $ 30,039 $1,946,381 38.65%Taxable Values $2,619,870 $177,040 $206,787 $ 86,078 $3,089,775 61.35Less: 50% of Appeals 18,347 1,786 93 483 20,709 0.41Net Taxable Values $2,601,523 $175,254 $206,694 $ 85,595 $3,069,066 60.94%a. Assessor's gross valuations at approximately 70% of market value.b. Not comparable to editions prior to 1966 as data herein are valuations of property in designated use,
whereas prior data included valuations of ail property held regardless of land use designations.c. Owner occupied homes. Exempt value includes land and buildings for fee simple properties, and build
ings only for leased properties. Basic exemption $2,500; additional exemption based on bracket schedule to a maximum $4,250 exemption on properties valued at $6,000 or more.
d. Exempt from property taxation since subject to special public utility excise tax.e. Includes non-profit educational, religious, community, hospital, veterans' cemetery, Hawaiian Homes
Commission, and other designated properties.SOURCE: Reports of the Department of Taxation, State of Hawaii.

TABLE 22TRENDS IN REAL PROPERTY TAX BASE
State of Hawaii; By Counties — 1956-1966^
City & County Maui Hawaii Kauai AllCalendar Year of Honolulu County County County Counties1956 $ 773,558,270 $ 72,458,823 $ 86,483,665 $45,809,840 $ 978,310,5981957 822,612,404 72,394,665 88,216,846 46,135,578 1,029,359,4931958 870,751,281 73,217,370 90,855,213 46,441,238 1,081,265,1021959 935,702,435 74,984,399 94,733,725 46,977,251 1,152,397,8101960 1,527,489,601 103,559,421 125,709,421 63,345,310 1,820,103,7531961 1,660,997,414 106,985,329 125,607,541 64,761,698 1,958,351,9821962 1,840,901,885 109,804,944 130,910,138 64,855,277 2,146,472,2441963 1,948,146,471 115,443,575 140,795,860 66,516,942 2,270,902,8481964 2,166,552,480 141,582,814 162,905,282 73,511,600 2,544,552,1761965b 2,345,412,6100 151,584,951 174,832,888C 79,513,873 2,751,344,3221966b (2,603,649,001)0 (175,253,711) (206,836,819)C (85,595,593) (3,071,335,124)Residential - Land 884,489,936 47,768,808 47,956,131 17,935,930 998,150,805
- Bldg. 431,977,175 23,693,885 26,135,729 13,399,363 495,206,152Hotel-Apt. - Land 222,259,691 13,900,926 4,914,991 5,663,004 246,738,612
- Bldg. 203,871,919 7,891,939 9,753,113 5,526,444 227,043,415Conunercial - Land 264,508,141 8,461,531 11,213,025 4,084,283 288,266,980
- Bldg. 197,597,431 7,638,356 11,661,728 6,337,291 223,234,806Industrial - Land 219,225,522 5,708,238 6,387,378 1,063,089 232,384,227
- Bldg. 97,932,575 8,575,871 10,880,236 4,045,697 121,434,379Agricultural - Land 63,007,229 44,616,767 66,525,621 21,765,048 195,914,665
- Bldg. 9,562,165 6,278,545 9,766,800 3,923,341 29,530,851Conservation - Land 8,582,301 595,275 1,387,519 1,406,176 11,971,271
- Bldg. 634,916 123,570 254,548 445,927 1,458,961a. Net assessed valuations for tax rate purposes, except as noted. Valuations approximately 70% of
market value.b. Effective 1965, buildings and real property exclusive of buildings for each specified land use class
separately valued and assessed.c. Includes federal leased property assessable to lessee, but not Includable for tax rate purposes as fol-
lows: Honolulu $2,046,1924 for 1965 and i52,126,135 for 1966; Hawaii $135, 536 for 1965 and $143,508for 1966.
SOURCE: Compiled by the Tax Foundation of Hawaii from reports of the Department of Taxation, Stateof Hawaii.

TRENDS IN REAL PROPERTY TAX RATES State of Hawaii — By Counties — 1956-1966
(Rates per $1,000 Taxable Values)
TABLE 23
CalendarYear
city-CountyHonolulu*
1956 $10.74 $13.80 $13.88 $13.10 $11.351957 15.15 16.57 13.88 16.52 15.201958 15.15 16.57 15.62 17.52 15.391959 15.15 16.57 16.50 17.52 15.481960 11.70 13.61 15.10 15.50 12.181961 13.89 13.61 16.10 15.50 14.071962 13.89 13.61 16.10 15.50 14.061963 14.66 14.00 16.10 15.50 14.631964 14.66 14.00 17.90 15.50 14.741965 Average Rated 17.71 15.00 17.90 16.50 17.531966 Average Rated 19.21 15.00 17.90 16.50 18.80
ResidentialLand 19.86 15.51 18.55 17.24 19.54Improvements 17.87 13.96 16.70 15.51 17.56
Hotel-ApartmentLand 20.18 15.56 19.17 17.34 19.83Improvements 18.16 14.01 17.26 15.64 17.92
CommercialLand 20.07 15.75 18.86 17.56 19.86Improvements 18.06 14.17 16.98 15.82 17.81
IndustrialLand 19.82 15.96 19.10 17.92 19.70Improvements 17.84 14.36 17.20 16.13 17.48
Agricultural 19.21 15.00 17.90 16.50 17.50Conservation 19.21 15.00 17.90 16.50 18.45
a. Includes additionalb. Includes additional
tax rates for tax rates in :
Honolulu Redevelopment Agency, L961, 1964 and 1965 for Hawaii Redevelopment Agency.
Total taxes collected in the state divided by total taxable values.Differential tax rates applicable on buildings and on all other real property on four of six established land use classes. Average tax rate computed on amount of taxes to be raised divided by total taxable values.
SOURCE: Compiled by Tax Foundation of Hawaii from reports of the Department of Taxation,State of Hawaii.
d.
TABLE 24
TRENDS IN REAL PROPERTY TAX COLECTIONS State of Hawaii: By Counties - 1956-1966“
Calendar City-County Maui Hawaii Kauai AllYear Honolulu^ County County County Counties1956 $ 8,488,947 $1,001,001 $1,164,056 $ 602,685 $11,256,6891957 12,472,212 1,201,042 1,211,081 765,851 15,650,1861958 13,133,374 1,224,565 1,436,423 811,066 16,605,4281959 14,201,069 1,249,499 1,564,326 828,540 17,843,4341960 17,663,443 1,399,385 1,838,194 969,683 21,870,705d1961 23,372,074 1,449,369 1,986,124C 1,002,724 27,810,291d1962 25,538,643 1,498,256 1,941,959 1,003,961 29,982,819d1963 28,517,185 1,611,982 2,056,741 1,030,235 33,216,143d1964 31,805,083 1,987,289 2,567,845c 1,153,561 37,513,778d1965 41,772,069 2,276,569 2,895,385 1,307,188 48 ,251,211<31966 50,013,492 2,628,496 3,702,273 1,412,371 57,756,632Residential (25,285,402) (1,071,661) (1,326,053) ( 517,039) (28,200,155)Hotel-Apt.-
Resort ( 8,187,515) ( 326,864) ( 262,559) ( 184,630) ( 8,961,568)Conunercial ( 8,877,288) ( 241,505) ( 409,494) ( 171,976) ( 9,700,263)Industrial ( 6,092,167) ( 214,253) ( 309,139) ( 84,308) ( 6,699,867)Agricultural ( 1,394,057) ( 763,430) (1,365,635) ( 423,858) ( 3,946,980)Conservation ( 177,063) ( 10,783) ( 29,393) ( 30,560) ( 247,799)
a. Actual calendar year tax collections except 1966 preliminary. Includes collections for prior years.
b. Includes amounts for Honolulu Redevelopment Agency,o. Includes amounts for Hawaii Redevelopment Agency.d. Reduced by $7,138 (1960); $25,158 (1961); $133,955 (1962); $169,228 (1963);
$198,722 (1964); and $592,744 (1965) for various natural disaster claims.
SOURCE: Compiled by the Tax Foundation of Hawaii from reports of the Departmentof Taxation, State of Hawaii.
29

TABLE 25STATE PERSONAL INCOME TAX DATA
As at January 1, 1967
StepsTax Rate in Exemptions
state Min. Up to Max. Over Range Single© DependentFEDERAL INCOME TAX DEDUCTIBLE^
Alabama 1.5% $ 1,000 5.0% $ 5,000 4 $1,500 $300Arizona 1.3 1,000 5.9 7,000 8 1,000 600Colorado® 3.0 1,000 8.0 10,000 11 750® 750®Delaware 1.5 1,000 11.0 100,000 11 600 600Idaho® 2.5 1,000 9.0 5,000 6 lof lofIowa 0.75 1,000 4.5 9,000 6 15^ 15^Kansas 2.5 2,000 6.5 7,000 5 600 600Kentucky 2.0 3,000 6.0 8,000 5 20f 20fLouisiana 2.0 10,000 6.0 50,000 3 2,500© 400Massachusetts^ 2.5 Flat Rate 2,000© 400©Minnesotac 1.5 500 12.0 20,000 11 19f 19fMissouri 1.0 1,000 4.0 9,000 7 1,200 400Montana 1.1 1,000 7.9 7,000 6 600 600New Mexico 1.5 10,000 6.0 100,000 4 600 600North Dakota 1.0 3,000 11.0 15,000 7 600© 600Oklahoma 1.0 1,500 6.0 7,500 6 1,000 500Oregon 3.0 500 9.5 8,000 7 600 600South Carolina 2.0 2,000 7.0 10,000 6 800 800Utah 2.0 1,000 6.5 5,000 6 600 600
FEDERAL INCOME TAX NOT DEDUCTIBLEHAWAII 2.25 500 11.0 30,000 11 600© 600©Alaska 16% (of Federal tax payable on Federal rates in effect 12/31/63Arkansas 1.0 3,000 5.0 25,000 5 17.50f 6fCalifornia 1.0 2,500 7.0 15,000 7 1,500 600Georgia 1.0 1,000 6.0 10,000 6 1,500 600?Indiana 2.0 Flat Rate 1,000®'® 500®Maryland 3.0 Flat Rate 800 800Mississippi 2.0 5,000 3.0 5,000 2 5,000© 0New Hampshire 4.25 on1 interest and dividend income in excess of $600New Jersey 2.0 1,000 10.0 15,000 9 600 600New York 2.0 1,000 10.0 15,000 9 600 600North Carolina 3.0 2,000 7.0 10,000 5 1,000 300Tennessee 4 or 6 - applies only on stocks and bonds income in excess of $25Vermont 2.0 1,000 7.5 5,000 4 500 500Virginia 2.0 3,000 5.0 5,000 3 1,000 200West Virginia 1.2 2,000 5.5 200,000 24 600 600Wisconsin 2.7 1,000 10.0 14,000 15 10^ 10^Dist. Columbia 2.5 2,000 5.0 10,000 6 1,000 500
a. Double exemption or credit for joint returns except; $2,000 in Indiana; $7,000 in Mississippi; $1,500 in North Dakota. In Louisiana, exemption applies against first $10,000 of net taxable income before exemptions.
b. Limited to federal tax on income taxed by the state in 13 states. Limited to $300 on single or $600 on joint return in Delaware; to $500 in South Carolina; to amount paid on business income in Massachusetts.
c. In addition to normal tax, Colorado imposes a 2% surtax on certain incomes above $5,000; Idaho levies a $10 excise tax on each return except blind persons on public welfare; Minnesota taxes first $1,000 of gross income at 1% to increase tax to no more than $10 if tax is less than $10.
d. Tax applies to business or employment income. Other rates are 1.5% on annuities and 6% on interest, dividends and gain on sale of intangibles. Additional 23% surtax imposed.
e. Colorado, Hawaii, Indiana and Massachusetts allow additional tax credits to bededucted from net income liabilities as follows: Colorado, $7 per allowablepersonal exemption to offset sales tax on food; Hawaii permits three kinds of graduated credits ranging from $50.00 to $0.45 (see Table 27, page 33); Indiana grants a credit equal to $6 per person to offset food and drug taxation; Massachusetts provides a $4 credit for every qualified income taxpayer whose income together with his spouse does not exceed $5,000; $4 also goes to the spouse and $8 for each qualified dependent.
f. Deducted from computed tax liability.g. Increased personal exemption for college student dependents, physically handi
capped and mentally retarded dependents - $1,200.
SOURCE: State Tax Guide, All States Unit, Commerce Clearing House, Inc.; TaxAdministrators News, Federation of Tax Administrators.
30

STATE CORPORATION NET INCOME TAX Rates and Estimated Burden on Selected Incomes
January 1, 1967
TABLE 26
Net Estimated State Income TaxOperating _______ on Net Taxable Income of*_____
Loss $5,000 $50,000 $500,000 $1,000,000FEDERAL CORPORATION TAX DEDUCTIBLE^
AlabamaArizona®
IowaKansasKentucky
Louisiana Minnesota Missouri New Mexico North Dakota®
OklahomaUtahdWisconsin®
5%1.3% on 1st SI,000 6.6% over $6,000
4%4.5%
5% on 1st $25,000 7% over $25,000
4%f7.5%, Min. $109
2%3%
3% on 1st $3,000 6% over $15,000
4%6%, Min. $10 2% on 1st $1,000 7% over $6,000
$ 188 $ 1,584 $ 12,987 $ 25,658
CF-5, CB-1 CF-5, CB-3
CF-5
CP-li None
CF-5, CB-3 None
CF-5, CB-3
CF-4NoneNone
105151170
18835
27677
114
122151224
1,9011.274 1,429
1,7131,1562,346
643960
1,6391.274 1,891
2,780FEDERAL CORPORATION TAX NOT DEDUCTIBLE
5.85% to $25,000 6.435% over $25,000 CF-1 293 3,071
16,83210.443 11,718
17,51710,32519,2375,2757,872
15,25410.443 15,506
29,450
32,029
33,42320.631 23,151
35,07820,51338,00510,42215,552
30,38220.631 30,634
59,083
64,204AlaskaArkansas®
CaliforniaColoradoConnecticut®DelawareGeorgiaIdaho
Indiana®MarylandMassachusetts'^Mississippi
Montana New Jerseyd New York North Carolina Oregon Pennsylvania Rhode Islandd South Carolina Tennessee VermontVirginia_______
18% of Federal^1% on 1st $3,000 5% over $25,000 5.5%, Min. SlOO
5%5.25%, Min. $30
5%5%
6% Plus$10 Excise Tax
2%5%
6.765%, Min. $100 2% on 1st $5,000 3% over $5,000 5.25%, Min. $10
3.25%5.5%, Min. $25
6%6%, Min. $10
6%6%5%4%
5%, Min. $25 5%
CF-5, CB-3
CP-3 None
CF-5, CB-3 None
CF-5, CB-3 CF-5, CB-1
CF-5, CB-3 CF-5, CB-3
None None
CF-5 None None
CF-5, CB-3 CF-5 CF-5 None None CF-3i None None CF-3
270
70275250263250250
310100250338
100263163275300300300300250200250250
3,690
2,0502.7502.5002.6252.5002.500
3,0101,0002.500 3,383
1,4502.6251.6252.7503.0003.0003.0003.0002.5002.0002.5002.500
45,810
24,55027,50025.00026.25025.00025.000
30,01010.00025.000 33,825
14,95026.25016.250 27 ,50030.00030.00030.00030.00025.00020.00025.00025.000
92,610
49,55055.00050.00052.50050.00050.000
60,01020.00050.000 67,650
29,95052.50032.50055.00060.000 60,000 60,000 60,00050.00040.00050.00050.000
NOTE: In certain states, specific credits are allowed against the computed tax. Because of variations, details are not shown.
a. Where the federal corporate tax (or portion) is allowed as a deduction, federal and state corporate income taxes (without limit except for Wisconsin) have been deducted before application of the state rate; for Alaska, percentage is applicable on net taxable income before deduction of state tax; and for Indiana, the normal federal base is adjusted (minus U. S. Bond interest plus gifts, charitable contributions and state taxes, etc.) and the state rate applied.
b. Limited to federal tax on income taxed by the state, except in Iowa, New Mexico and Utah. Further limited in Wisconsin to 10% of net income before deductions for contributions and federal taxes.
c. Rates graduated.d. An alternate method of computation must be used if it yields a greater tax.e. A credit is allowed for taxes due under the adjusted gross income tax but is
limited to the amount incurred in the same tax year.f. On net income in excess of that portion of $3,000 which the taxable net income
bears to total income.g. Minimum not payable if gross income is less than $5,000 and net income is less
than $500.h. 18% of federal tax payable at rates in effect on December 31, 1963.i. Number of years carry forward and/or carry back of net operating loss. In Kentucky
carry forward permitted only for new business suffering loss in first year; in South Carolina, for new business if loss occurs during first three years.
SOURCE: State Tax Guide, All States Unit, Commerce Clearing House, Inc., New York.
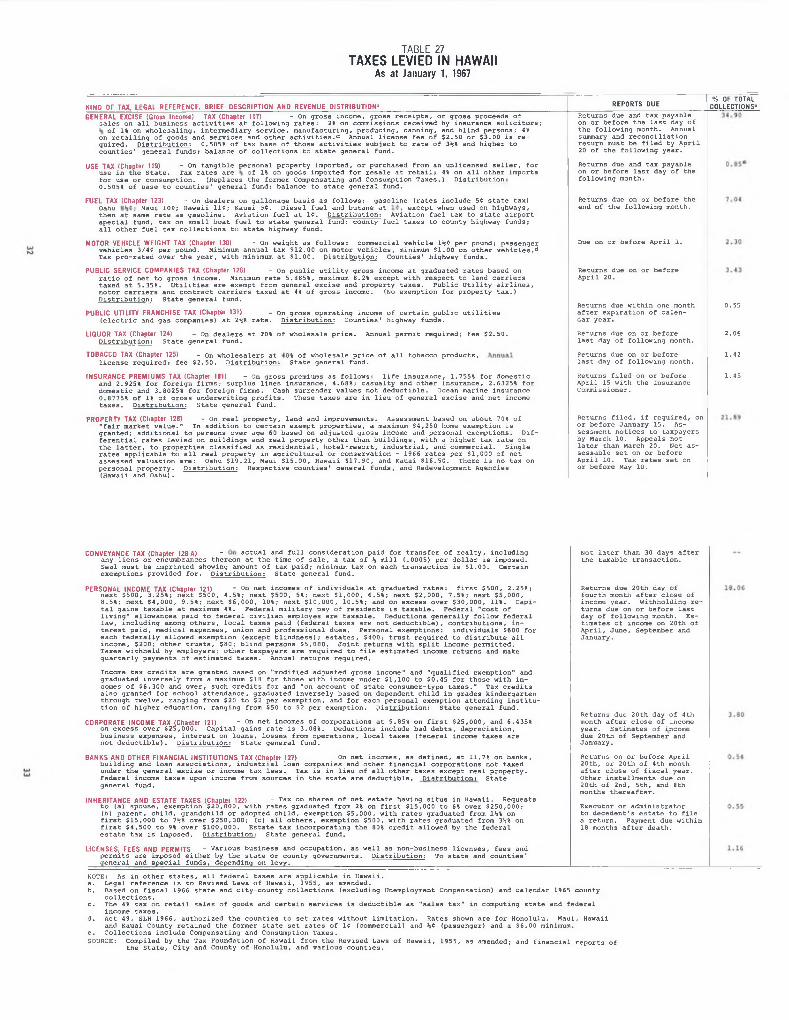
TABLE 27
TAXES LEVIED IN HAWAIIAs at January 1, 1967
K IN D OF TAX, LEGAL REFERENCE . BR IEF DESCRIPTION AND REVENUE D ISTRIBUTION* REPORTS DUE% OF TOTAL
COLLECTIONS!-
GENERAL EXCISE (Gross Income) TAX (Chapter 117) - On gross income, gross receipts, or gross proceeds ofs a l e s o n a l l b u s in e s s a c t i v i t i e s a t f o l l o w i n g r a t e s : 2% o n c o m m is s io n s r e c e iv e d b y i n s u r a n c e s o l i c i t o r s ;
o f 1 % o n w h o l e s a l i n g , i n t e r m e d i a r y s e r v i c e , m a n u f a c t u r i n g , p r o d u c i n g , c a n n i n g , a n d b l i n d p e r s o n s ; 4% o n r e t a i l i n g o f g o o d s a n d s e r v ic e s a n d o t h e r a c t i v i t i e s . c A n n u a l l i c e n s e f e e o f $ 2 .5 0 o r $ 3 .0 0 i s r e q u i r e d . D i s t r i b u t i o n ; 0 .5 0 5 % o f t a x b a s e o f t h o s e a c t i v i t i e s s u b j e c t t o r a t e o f 3*j% a n d h i g h e r t o c o u n t i e s ’ g e n e r a l f u n d s ; b a l a n c e o f c o l l e c t i o n s t o s t a t e g e n e r a l f u n d .
USE TAX (Chapter 119) - On t a n g i b l e p e r s o n a l p r o p e r t y im p o r t e d , o r p u r c h a s e d f r o m a n u n l i c e n s e d s e l l e r , f o ru s e i n t h e S t a t e . T a x r a t e s a r e o f 1% o n g o o d s im p o r t e d f o r r e s a l e a t r e t a i l ; 4% o n a l l o t h e r im p o r t s f o r u s e o r c o n s u m p t io n . (R e p la c e s t h e f o r m e r C o m p e n s a t in g a n d C o n s u m p t io n T a x e s . ) D i s t r i b u t i o n ;0 .5 0 5 % o f b a s e t o c o u n t i e s ' g e n e r a l f u n d ; b a la n c e t o s t a t e g e n e r a l f u n d .
FUEL TAX (Chapter 123) - On d e a l e r s o n g a l l o n a g e b a s i s a s f o l l o w s : g a s o l i n e ( r a t e s i n c l u d e 5« s t a t e t a x )O ahu M a u i 1 0 < :; H a w a i i I K ^ ; K a u a i 9 ( . D i e s e l f u e l a n d b u t a n e a t e x c e p t w h e n u s e d o n h ig h w a y s ,t h e n a t sam e r a t e a s g a s o l i n e . A v i a t i o n f u e l a t 1 C . D i s t r i b u t i o n ; A v i a t i o n f u e l t a x t o s t a t e a i r p o r t s p e c i a l f u n d ; t a x o n s m a l l b o a t f u e l t o s t a t e g e n e r a l f u n d ; c o u n t y f u e l t a x e s t o c o u n t y h ig h w a y f u n d s ; a l l o t h e r f u e l t a x c o l l e c t i o n s t o s t a t e h ig h w a y f u n d .
MOTOR VEH ICLE W E IG H T TAX (Chapter 130) - On w e ig h t a s f o l l o w s : c o m m e r c ia l v e h i c l e IH C p e r p o u n d ; p a s s e n g e rv e h i c l e s 3 / 4 4 p e r p o u n d . M in im u m a n n u a l t a x $ 1 2 .0 0 o n m o t o r v e h i c l e s , m in im u m $ 1 .0 0 o n o t h e r v e h i c l e s . <3 T a x p r o - r a t e d o v e r t h e y e a r , w i t h m in im u m a t $ 1 . 0 0 . D i s t r i b u t i o n ; C o u n t ie s ' h ig h w a y f u n d s .
PUBLIC SERVICE COM PANIES TAX (Chapter 128) - On p u b l i c u t i l i t y g r o s s in c o m e a t g r a d u a t e d r a t e s b a s e d o nr a t i o o f n e t t o g r o s s in c o m e . M in im u m r a t e 5 .8 8 5 % , m ax im um 8 .2 % e x c e p t w i t h r e s p e c t t o l a n d c a r r i e r s t a x e d a t 5 . 3 5 % . U t i l i t i e s a r e e x e m p t f r o m g e n e r a l e x c i s e a n d p r o p e r t y t a x e s . P u b l i c U t i l i t y a i r l i n e s , m o t o r c a r r i e r s a n d c o n t r a c t c a r r i e r s t a x e d a t 4% o f g r o s s in c o m e . (N o e x e m p t io n f o r p r o p e r t y t a x . ) D i s t r i b u t i o n ; S t a t e g e n e r a l f u n d .
PUBLIC UT ILITY FRANCH ISE TAX (Chapter 131) - o n g r o s s o p e r a t i n g in c o m e o f c e r t a i n p u b l i c u t i l i t i e s( e l e c t r i c a n d g a s c o m p a n ie s ) a t 2*$% r a t e . D i s t r i b u t i o n : C o u n t ie s ' h ig h w a y f u n d s .
L IQUOR TAX (Chapter 124) - On d e a l e r s a t 2 0 % o f w h o le s a le p r i c e .D i s t r i b u t i o n ; S t a t e g e n e r a l f u n d .
A n n u a l p e r m i t r e q u i r e d ; f e e $ 2 .5 0 .
TOBACCO TAX (Chapter 125) - o n w h o l e s a l e r s a tl i c e n s e r e q u i r e d ; f e e $ 2 . 5 0 . D i s t r i b u t i o n ;
0% o f w h o le s a le p r i c e o f a l l t o b a c c o p r o d u c t s . S t a t e g e n e r a l f u n d .
IN SU RA NC E P R EM IU M S TAX (Chapter 181) - On g r o s s p r e m iu m s a s f o l l o w s : l i f e i n s u r a n c e , 1 .7 5 5 % f o r d o m e s t ica n d 2 .9 2 5 % f o r f o r e i g n f i r m s ; s u r p l u s l i n e s i n s u r a n c e , 4 . 6 8 % ; c a s u a l t y a n d o t h e r i n s u r a n c e , 2 .6 3 2 5 % f o r d o m e s t ic a n d 3 .8 0 2 5 % f o r f o r e i g n f i r m s . C a sh s u r r e n d e r v a lu e s n o t d e d u c t i b l e . O cean m a r in e in s u r a n c e 0 .8 7 7 5 % o f 1% o f g r o s s u n d e r w r i t i n g p r o f i t s . T h e s e t a x e s a r e i n l i e u o f g e n e r a l e x c i s e a n d n e t in c o m et a x e s . D i s t r i b u t i o n ; S t a t e g e n e r a l f u n d .
PROPERTY TAX (Chapter 128) - On r e a l p r o p e r t y , l a n d a n d im p r o v e m e n t s . A s s e s s m e n t b a s e d o n a b o u t 7 0 % o f" f a i r m a r k e t v a l u e . " I n a d d i t i o n t o c e r t a i n e x e m p t p r o p e r t i e s , a m a x im ium $ 4 ,2 5 0 hom e e x e m p t io n i s g r a n t e d ; a d d i t i o n a l t o p e r s o n s o v e r a g e 6 0 b a s e d o n a d ju s t e d g r o s s in c o m e a n d p e r s o n a l e x e m p t io n s . D i f f e r e n t i a l r a t e s l e v i e d o n b u i l d i n g s a n d r e a l p r o p e r t y o t h e r t h a n b u i l d i n g s , w i t h a h i g h e r t a x r a t e o n t h e l a t t e r , t o p r o p e r t i e s c l a s s i f i e d a s r e s i d e n t i a l , h o t e l - r e s o r t , i n d u s t r i a l , a n d c o m m e r c ia l . S i n g l e r a t e s a p p l i c a b l e t o a l l r e a l p r o p e r t y i n a g r i c u l t u r a l o r c o n s e r v a t i o n - 1 9 6 6 r a t e s p e r $ 1 ,0 0 0 o f n e ta s s e s s e d v a l u a t i o n a r e : O ahu $ 1 9 .2 1 , M a u i $ 1 5 .0 0 , H a w a i i $ 1 7 .9 0 , a n d K a u a i $ 1 6 .5 0 . T h e r e i s n o t a x o np e r s o n a l p r o p e r t y . D i s t r i b u t i o n ; R e s p e c t iv e c o u n t i e s ' g e n e r a l f u n d s , a n d R e d e v e lo p m e n t A g e n c ie s ( H a w a i i a n d O a h u ) .
R e t u r n s d u e a n d t a x p a y a b le o n o r b e f o r e t h e l a s t d a y o f t h e f o l l o w i n g m o n th . A n n u a l sum m a ry a n d r e c o n c i l i a t i o n r e t u r n m u s t b e f i l e d b y A p r i l 20 o f t h e f o l l o w i n g y e a r .
R e t u r n s d u e a n d t a x p a y a b le o n o r b e f o r e l a s t d a y o f t h e f o l l o w i n g m o n th .
R e t u r n s d u e o n o r b e f o r e t h e e n d o f t h e f o l l o w i n g m o n th .
D ue o n o r b e f o r e A p r i l 1 .
R e t u r n s d u e o n o r b e f o r e A p r i l 2 0 .
R e t u r n s d u e w i t h i n o n e m o n th a f t e r e x p i r a t i o n o f c a l e n d a r y e a r .
R e t u r n s d u e o n o r b e f o r e l a s t d a y o f f o l l o w i n g m o n th .
R e t u r n s d u e o n o r b e f o r e l a s t d a y o f f o l l o w i n g m o n th .
R e t u r n s f i l e d o n o r b e f o r e A p r i l 15 w i t h t h e In s u r a n c e C o m m is s io n e r .
R e t u r n s f i l e d , i f r e q u i r e d , o n o r b e f o r e J a n u a r y 1 5 . A ss e s s m e n t n o t i c e s t o t a x p a y e r s b y M a rc h 1 0 . A p p e a ls n o t l a t e r t h a n M a rc h 2 0 . N e t a s s e s s a b le s e t o n o r b e f o r e A p r i l 1 0 . T a x r a t e s s e t on o r b e f o r e M ay 1 0 .
0 .5 5
2 .0 6
1 .4 2
1 .4 5
CONVEYANCE TAX (Chapter 128-A) " a c t u a l a n d f u l l c o n s i d e r a t i o n p a i d f o r t r a n s f e r o f r e a l t y , i n c l u d i n ga n y l i e n s o r e n c u m b r a n c e s t h e r e o n a t t h e t im e o f s a l e , a t a x o f % m i l l ( . 0 0 0 5 ) p e r d o l l a r i s im p o s e d . S e a l m u s t b e im p r i n t e d s h p w in g a m o u n t o f t a x p a i d ; m in im u m t a x o n e a c h t r a n s a c t i o n i s $ 1 . 0 0 . C e r t a i n e x e m p t io n s p r o v id e d f o r . D i s t r i b u t i o n : S t a t e g e n e r a l f u n d .
PERSONAL INCOM E TAX (Chapter 121) " On n e t in c o m e s o f i n d i v i d u a l s a t g r a d u a t e d r a t e s : f i r s t $ 5 0 0 , 2 .2 5 % ;n e x t S 5 0 0 , 3 . 2 5 % ; n e x t $ 5 0 0 , 4 . 5 % ; n e x t $ 5 0 0 , 5 % ; n e x t $ 1 ,0 0 0 , 6 . 5 % ; n e x t $ 2 ,0 0 0 , 7 . 5 % ; n e x t $ 5 ,0 0 0 , 8 . 5 % ; n e x t $ 4 ,0 0 0 , 9 . 5 % ; n e x t $ 6 ,0 0 0 , 1 0 % ; n e x t $ 1 0 ,0 0 0 , 1 0 . 5 % ; a n d o n e x c e s s o v e r $ 3 0 ,0 0 0 , 1 1 % . C a p it a l g a i n s t a x a b l e a t m ax im um 4 % . F e d e r a l m i l i t a r y p a y o f r e s i d e n t s i s t a x a b l e . F e d e r a l " c o s t o f l i v i n g " a l l o w a n c e s p a i d t o f e d e r a l c i v i l i a n e m p lo y e s a r e t a x a b l e . D e d u c t io n s g e n e r a l l y f o l l o w f e d e r a l l a w , i n c l u d i n g am o ng o t h e r s , l o c a l t a x e s p a i d ( f e d e r a l t a x e s a r e n o t d e d u c t i b l e ) , c o n t r i b u t i o n s , i n t e r e s t p a i d , m e d ic a l e x p e n s e s , u n io n a n d p r o f e s s i o n a l d u e s . P e r s o n a l e x e m p t io n s : i n d i v i d u a l s $ 6 0 0 f o re a c h f e d e r a l l y a l l o w e d e x e m p t io n ( e x c e p t b l i n d n e s s ) ; e s t a t e s , $ 4 0 0 ; t r u s t r e q u i r e d t o d i s t r i b u t e a l l in c o m e , $ 2 0 0 ; o t h e r t r u s t s , $ 8 0 ; b l i n d p e r s o n s $ 5 ,0 0 0 . J o i n t r e t u r n s w i t h s p l i t in c o m e p e r m i t t e d .T a x e s w i t h h e l d b y e m p lo y e r s ; o t h e r t a x p a y e r s a r e r e q u i r e d t o f i l e e s t im a t e d in c o m e r e t u r n s a n d m ake q u a r t e r l y p a y m e n t s o f e s t im a t e d t a x e s . A n n u a l r e t u r n s r e q u i r e d .
In c o m e t a x c r e d i t s a r e g r a n t e d b a s e d o n " m o d i f i e d a d ju s t e d g r o s s in c o m e " a n d " q u a l i f i e d e x e m p t io n " a n d g r a d u a t e d i n v e r s e l y f r o m a m ax im um $ 1 8 f o r t h o s e w i t h in c o m e u n d e r $ 1 ,1 0 0 t o $ 0 .4 5 f o r t h o s e w i t h i n com es o f $ 6 ,3 0 0 a n d o v e r , s u c h c r e d i t s f o r a n d " o n a c c o u n t o f s t a t e c o n s u m e r - t y p e t a x e s ." T a x c r e d i t s a l s o g r a n t e d f o r s c h o o l a t t e n d a n c e , g r a d u a t e d i n v e r s e l y b a s e d o n d e p e n d e n t c h i l d i n g r a d e s k i n d e r g a r t e n t h r o u g h t w e l v e , r a n g i n g f r o m $ 2 0 t o $2 p e r e x e m p t io n , a n d f o r e a c h p e r s o n a l e x e m p t io n a t t e n d i n g i n s t i t u t i o n o f h i g h e r e d u c a t i o n , r a n g i n g f r o m $ 5 0 t o S2 p e r e x e m p t io n . D i s t r i b u t i o n ; S t a t e g e n e r a l f u n d .
CORPORATE INCOM E TAX (Chanter 121) " On n e t in c o m e s o f c o r p o r a t i o n s a t 5 .8 5 % o n f i r s t $ 2 5 ,0 0 0 , a n d 6 .4 3 5 %o n e x c e s s o v e r $ 2 5 ,0 0 0 . C a p i t a l g a i n s r a t e i s 3 .0 8 % . D e d u c t io n s i n c l u d e b a d d e b t s , d e p r e c i a t i o n , b u s in e s s e x p e n s e s , i n t e r e s t o n l o a n s , lo s s e s f r o m o p e r a t i o n s , l o c a l t a x e s ( f e d e r a l in c o m e t a x e s a r e n o t d e d u c t i b l e ) . D i s t r i b u t i o n ; S t a t e g e n e r a l f u n d .
BANKS AND OTHER F INANC IAL IN ST ITUT IO NS TAX (Chapter 127) - On n e t in c o m e s , a s d e f i n e d , a t 1 1 .7 % o n b a n k s ,b u i l d i n g a n d l o a n a s s o c i a t i o n s , i n d u s t r i a l l o a n c o m p a n ie s a n d o t h e r f i n a n c i a l c o r p o r a t i o n s n o t t a x e d u n d e r t h e g e n e r a l e x c i s e o r in c o m e t a x l a w s . T a x i s i n l i e u o f a l l o t h e r t a x e s e x c e p t r e a l p r o p e r t y . F e d e r a l in c o m e t a x e s u p o n in c o m e f r o m s o u r c e s i n t h e s t a t e a r e d e d u c t i b l e . D i s t r i b u t i o n ; S t a t e g e n e r a l f u n d .
IN HER ITA N CE AND ESTATE TAXES (Chapter 122) " T a x o n s h a r e s o f n e t e s t a t e h a v in g s i t u s i n H a w a i i . R e q u e s t st o ( a ) s p o u s e , e x e m p t io n $ 2 0 ,0 0 0 , w i t h r a t e s g r a d u a t e d f r o m 2% o n f i r s t $ 1 5 ,0 0 0 t o 6% o v e r $ 2 5 0 ,0 0 0 ;( b ) p a r e n t , c h i l d , g r a n d c h i l d o r a d o p t e d c h i l d , e x e m p t io n $ 5 ,0 0 0 , w i t h r a t e s g r a d u a t e d f r o m l i j % o n f i r s t $ 1 5 ,0 0 0 t o 7 ij% o v e r $ 2 5 0 ,0 0 0 ; ( c ) a l l o t h e r s , e x e m p t io n $ 5 0 0 , w i t h r a t e s g r a d u a t e d f r o m 3%% o n f i r s t $ 4 ,5 0 0 t o 9% o v e r $ 1 0 0 ,0 0 0 . E s t a t e t a x i n c o r p o r a t i n g t h e 8 0% c r e d i t a l l o w e d b y t h e f e d e r a l e s t a t e t a x i s im p o s e d . D i s t r i b u t i o n ; S t a t e g e n e r a l f u n d .
L ICENSES , FEES AND PERM ITS “ V a r io u s b u s in e s s a n d o c c u p a t io n , a s w e l l a s n o n - b u s in e s s l i c e n s e s , f e e s a n d p e r m i t s a r e im p o s e d e i t h e r b y t h e s t a t e o r c o u n t y g o v e r n m e n t s . D i s t r i b u t i o n ; T o s t a t e a n d c o u n t i e s ’ g e n e r a l a n d s p e c i a l f u n d s , d e p e n d in g o n l e v y . ____________________________________________________________________________________________________________________________________________
N o t l a t e r t h a n 30 d a y s a f t e r t h e t a x a b l e t r a n s a c t i o n .
R e t u r n s d u e 2 0 t h d a y o f f o u r t h m o n th a f t e r c lo s e o f in c o m e y e a r . W i t h h o l d i n g r e t u r n s d u e o n o r b e f o r e l a s t d a y o f f o l l o w i n g m o n th . E s t im a t e s o f in c o m e o n 2 0 t h o f A p r i l , J u n e , S e p te m b e r a n d J a n u a r y .
R e t u r n s d u e 2 0 t h d a y o f 4 t h m o n th a f t e r c lo s e o f in c o m e y e a r . E s t im a t e s o f in c o m e d u e 2 0 t h o f S e p te m b e r a n d J a n u a r y .
R e t u r n s o n o r b e f o r e A p r i l 2 0 t h , o r 2 0 t h o f 4 t h m o n th a f t e r c lo s e o f f i s c a l y e a r . O t h e r i n s t a l lm e n t s d u e o n 2 0 t h o f 2 n d , 5 t h , a n d 8 t h m o n th s t h e r e a f t e r .
E x e c u t o r o r a d m in i s t r a t o r t o d e c e d e n t 's e s t a t e t o f i l e a r e t u r n . P a y m e n t d u e w i t h i n 18 m o n th s a f t e r d e a t h .
NOTE : A s i n o t h e r s t a t e s , a l l f e d e r a l t a x e s a r e a p p l i c a b l e i n H a w a i i .a . L e g a l r e f e r e n c e i s t o R e v is e d L aw s o f H a w a i i , 1 9 5 5 , a s gunended .b . B a s e d o n f i s c a l 1 9 6 6 s t a t e a n d c i t y - c o u n t y c o l l e c t i o n s ( e x c l u d i n g U n e m p lo y m e n t C o m p e n s a t io n ) a n d c a le n d a r 1 9 6 5 c o u n t y
c o l l e c t i o n s .c . T h e 4% t a x o n r e t a i l s a le s o f g o o d s a n d c e r t a i n s e r v i c e s i s d e d u c t i b l e a s " s a le s t a x " i n c o m p u t in g s t a t e a n d f e d e r a l
in c o m e t a x e s .d . A c t 4 9 , SLH 1 9 6 6 , a u t h o r i z e d t h e c o u n t i e s t o s e t r a t e s w i t h o u t l i m i t a t i o n . R a t e s sh o w n a r e f o r H o n o l u l u . M a u i , H a w a i i
a n d K a u a i C o u n t y r e t a i n e d t h e f o r m e r s t a t e s e t r a t e s o f 14 ( c o m m e r c ia l ) a n d %4 ( p a s s e n g e r ) a n d a $ 6 .0 0 m in im u m .e . C o l l e c t i o n s i n c l u d e C o m p e n s a t in g a n d C o n s u m p t io n T a x e s .
SOURCE; C o m p i le d b y t h e T a x F o u n d a t io n o f H a w a i i f r o m t h e R e v is e d L aw s o f H a w a i i , 1 9 5 5 , a s a m e n d e d ; a n d f i n a n c i a l r e p o r t s o f t h e S t a t e , C i t y a n d C o u n t y o f H o n o l u l u , a n d v a r i o u s c o u n t i e s .

STATE AND LOCAL TAX BURDENTax Collections Related to Population and Personal Income
All States — Fiscal Years 1965 and 1966
TABLE 28
Per Capita Tax Collections^Fiscal 1965 Fiscal 1966bAmount Rank Amount Rank
% Change from 1965
Per Capita Tax as a % of Per Capita Income^
1965Rank Rank
$297.91 8 $365.12 22.56 10.74 22 12.68 12U.S. AV. 266.11 296.41 11.39 10.32 10.79Ala.AlaskaAriz.Ark.Calif.Colo.Conn.Del.Fla.Ga .Idaho111.Ind.IowaKans.Ky.La.Me.Md.Mass.Mich.Minn.Miss.Mo.Mont.Neb.Nev.N. H. N. J. N. M. N. Y. N. C. N. D. Ohio Okla. Ore. Pa.R. I.S. C.S. D.Tenn.TexasUtahVt.Va. Wash. W. Va. Wise. Wyo.D. C.
167.55249.80266.45159.47379.29291.93291.04302.05 233.01190.74 245.27266.30 257.19275.94 273.34174.89222.04233.18261.06 302.03289.66299.25169.89222.67 264.87219.75321.82220.95 268.65 243.15 372.10188.30 248.32225.26 215.93 280.72245.05 262.74160.82 240.71 178.24207.05 254.61 277.84188.18294.06 191.97 309.53277.76 288.39
4927 20 511
10115
344329 212517184737 33 246
127
48 36 22393
38 1931 2
442835401430 235032 4641261545 9
424
16 13
181.34278.90305.90194.35 409.27 352.85322.84 319.20244.47 207.87321.78 296.11287.34349.82355.34193.91 246.67 256.30283.47344.47 312.10352.42 182.98 249.25304.96246.36337.35247.33285.65262.37440.96208.84254.79242.65237.09 293.40262.42 288.24182.82 300.19 196.29 217.03285.23310.10 205.90 341.71212.24346.34 334.46 306.93
51291947 25
1315384414 22257 4
483632 289
166
49342037 113526 311
4333394023302450 21 4641 271745 10428
1218
8.2311.6514.8121.877.90
20.8710.93 5.684.92 8.98
31.1911.19 11.7226.77 30.0010.88 11.099.92 8.58
14.057.75
17.777.70
11.94 15.14 12.114.83
11.94 6,337.90
18.51 10.912.617.729.804.527.099.71
13.68 24.71 10.134.82
12.0311.619.42
16.20 10.56 11.89 20.416.43
9.438.11
11.739.16
12.1111.419.009.68
10.209.52
11.518.739.90
11.5410.99 9.27
11.4710.99 9.23
10.3810.4512.2611.44 9.06
11.759.229.969.108,75
11.6311.909.82
12.478.53
10.23 10. 809.479.919.48
12.829.519.38
11.23 13.048.31
10.8310.1512.2211.44 8.18
37 519
42 6
164532 2633 124730 11193913 184024 234
14 448
41 284346 107
31 3
4825 21 36 29 352
3438 171
4920 275
1550
9.498.75
12.91 10,5312.56 13.029.49 9.41
10.09 9.63
13.44 9.03
10.1013.0713.46 9.48
11.9311.269.45
11.2910.3713.2211.389.36
12.519.37
10.199.718.82
11.9613.4510.23 11.188.58
10.3610.639.55
10.219.90
13.569.759.28
12.11 13.418.51
11.7610.47 12.7113.088.28
3848 102413 9
394232364
46 3182
4017 2141 20 266
19441443 30 3547 163
282249 27 2337 2933 1
3445155
501825 117
S I .Population excluding armed forces overseas for July 1, 1965 and 1966 as estimated by the U. S. Department of Commerce.Computed from preliminary State Tax Collections according to percentages estimated by the U. S. Department of Commerce for fiscal 1965.Fiscal year taxes as a percent of prior calendar year personal income.
a.
b.
SOURCE: State Tax Collections in 1966, Governmental Finances in 1963-64,and 1964-65, Survey of Current Business, August, 1966, U. s. Department of Commerce; Department of Budget & Finance, State of Hawaii.
34

TABLE 29
FEDERAL GRANTS TO HAWAIIAs Reported by State Comptroller
Selected Fiscal Years
Purpose 1956 1961 1964 1965 1966Highways $ 2,582,756 $ 4,207,323 $ 8,610,277 $11,050,712 $18,013,841Airports 166,528 532,307 309,278 2,075,178 388,688National Guard Health & Hospital
5,279,515 18,378,405 17,039,695 10,571,828 12,438,746Hospital Construction -- 1,169,281 613,641 373,885 722,914Public Health 489,020 665,916 984,949 1,347,276 1,651,950Hansen's Disease
Education1,056,807 1,150,842 1,562,614 1,194,460 845,953
Elem,-Secondary Act — — — — 2,801,500Other Education 1,993,177 7,631,051 12,134,049 13,844,412 16,737,196School Construction
Public Welfare2,031,670 2,719,433 395,501 201,656 268,233
Dependent Children 2,425,202 2,123,596 3,774,991 3,397,601 4,413,182Aged and Others 1,241,406 1,319,186 2,809,009 2,635,247 3,939,984
Veterans' Assistance 957,232 911,405 -- -- --Natural Resources 596,779 950,072 1,147,467 1,262,780 1,334,965Employment Security 719,889 1,189,439 1,754,425 1,573,452 2,158,601Unemp. Comp. Benefits — -- 1,325,182 1,135,197 1,227,547Disaster Relief — 1,088,551 -- 190,231East-West Center -- 1,400,205 3,860,276 5,103,252 5,255,843Peace Corps -- — 1,111,388 1,129,397 1,566,278Econ. Opportunity Act — -- 323,483 2,449,482Miscellaneous 226,423 1,073,356® 932,955 1,152,668 659,177Total $19,766,404 $46,510,368 $58,365,697 $58,562,715 $76,874,080a. Includes $480,000 for faculty housing at University of Hawaii.
SOURCE: Annual Reports of the Department of Accounting and General Services, State ofHawaii,
TABLE 30
FEDERAL TAX COLLECTIONS IN HAWAIISelected Fiscal Years
Source 1956 1961 1964 1965 1966®
Indiv. Income & Employmenta $100,847,000 $185,655,000 $225,116,000 $218,295,000 $240,711,000
Corp. Income & Excess Profits 30,846,000 42,657,000 52,416,000 53,039,000 63,323,000
Admissions 1,134,000 687,000 963,000 1,128,000 162,155Manufacturer' s
Excise 88,000 365,000 244,000 362,000 302,000Retailer's
Excise 980,000 1,337,000 1,718,000 1,977,000 409,348Alcoholt> 1,307,000 1,632,000 2,045,000 2,860,000 3,548,000Communications 1,231,000 2,237,000 2,798,000 3,104,000 2,748,211Transportation
of Personsc 1,151,000 1,411,000 520,000 599,000 626,760Estate 1,621,000 4,059,000 3,339,000 5,388,000 5,672,000Gift 416,000 474,000 917,000 584,000 2,639,000Tobaccob 25,000 14,000 11,000 13,000 11,000Unemployment
Insurance 612,000 944,000 2,164,000 1,422,000 1,536,000All Others^ 435,000 886,000 1,202,000 1,393,000 1,925,526
Total $140,693,000 $242,358,000 $293,453,000 $290,164,000 $323,614,000
a. Includes withholding, FICA, Individual Income and Railroad Retirement.b. Includes receipts from customs.c. Includes tax on transportation of property prior to 1961.d. Includes stamp taxes, club dues, initiation fees and others.e. Preliminary data from District Director, Internal Revenue Service, Honolulu.
SOURCE: Internal Revenue Service, U. S. Treasury Department.
35

HOW GOVERNMENT SPENDS ITS MONEY
HAWAII STATE AND COUNTIES
Government expenditures of the state and county governments to- talle3 $388.2 million in fiscal 1966 (page 39). Education spent the largest amount - $127.8 million. This money went for public schools, libraries and the University of Hawaii and represented 32.9% of all expenditures. Health, hospital and welfare payments combined too)c the next largest share of governmental dollars - 14.0% or $54.4 million. The cost of public safety (including police, fire and National Guard) amounted to $40.5 million (10.4%). Fiscal 1966 expenditures were $71.5 million above 1965 - an Increase of 22.6%.
Per capita direct general expenditures in Hawaii (state and counties) amounted to $494. In comparison, the U. S. average totaled $387 for the same period (page 44) . Hawaii ran)cs fifth highest in the nation on a per capita basis.
Compensation of public employees on an average monthly basis is above that of most other states. Hawaii's public employees earned an average $536 per month, while the average for the country was $490 per month (page 49). Only five other states and the District of Columbia paid public employees higher average monthly compensation.
STATE OF HAWAII
State operating expenditures totalled $303.6 million in fiscal 1966 (page 38). This $74.6 million - 32.6% increase - is due in part to the transfer on July 1, 1965 of certain county functions. Publiceducation - public schools, libraries and the University of Hawaii accounted for 41.6% of all state government expenditures. Outlays for conservation of health, hospitals and public assistance were 14.1% of the total expended.
There was a surplus of $12.9 million in the general fund on June30, 1966 (page 40). It is anticipated the state will utilize thesurplus through greater reliance on cash for capital improvements.
THE COUNTIES
County governments spent $102.1 million during the last fiscalperiod (pages 42-43) . Public safety costs continued to top all others with a total $22.2 million (21.7%). Expenditures for debt - principal repayments and interest costs - accounted for the next largest object of expenditure; $16.2 million (15.9%) was devoted to this area. The cost of running the county governments, including general governmental control and staff agencies, rose to $11.3 million - 11.1% of total expenses.
City and County of Honolulu costs totalled $71.8 million and amounted to 70.3% of the four county total. Of this amount, $17.1 million was spent for police, fire and other public safety in Honolulu, or 23.8%. Honolulu spent $13.4 million (18.7%) for debt service.
Maui County spent $9.9 million. Hospital and public welfare payments totalled $2.8 million (28.5%) and was the largest object of expense. Public safety cost Maui $1.7 million (17.1%).
Hawaii County expended $15.4 million. Of this amount, 21.2% ($3.3 million) was used to pay for general government costs. Close behind were hospital and welfare outlays totalling $3.0 million (19.8%).
Kauai County spent the same amount - S5.1 million - as it did during the previous fiscal period. Public safety costs still headed the list on Kauai; over one-fourth ($1.3 million) went to this function. Highway expenditures amounted to $0.8 million (16.4%).
36

H O W STATE G O V ER N M E N T DO LLARS A RE SP EN T
O p e ra t in g E x p e n d itu re s — By F u n c t io n s
S tate o f H a w a ii — F is c a l Year 1966
STATE G E N ER A L F U N D ONLY
CHART 7
N A T U R A L R E S O U R C E S $9,528,657— 3 .9 7 %
STATE G E N ER A L A N D S P EC IA L F U N D S
U N E M P L O Y M E N T C O M P E N S A T IO N
$10,702,824— 3 .5 3 %
a. Includes general funds for highways, utilities, recreation, unemployment compensation, and others.
b. Debt costs for highway revenue bonds included in highways, and for harbor, airport and other bonds reimbursable from special funds included in all others.
c. Includes harbors, airports, homesteading, land development, public housing, recreation, and other miscellaneous expenditures.
SOURCE: Department of Accounting and General Services, Stateof Hawaii; see also Table 31.
37

TABLE 31
S T A T E G O V E R N M E N T O P E R A T IN G E X P E N D I T U R E S
State of Hawaii — Selected F isca l Years*
Functions 1956 1961 1964 1965 1966General Government - Control
- StaffPublic Safety - Police & Fire
- Other ProtectionHighwaysNatural Resources Health and Sanitation Hospital and Institutions Public Welfare Education - University
- Public Schools- Public Libraries
RecreationUtilities & Other Enterprises Interest^Bond Redemption^Retirement and Pension Employees’ Health & Hosp. Ins. Salary Increases & Adjustment° Unemployment CompensationMiscellaneouscGrants-in-Aid to Counties
$ 1,288,397 3,609,822
139,062 8,395,245 8,930,433 2,872,151 3,514,273 7,884,676 7,945,287 4,743,765
25,680,786 669,084 168,346
4,690,168 1,149,190 2,964,000 1,859,757
684,8634,547,3482,931,365
3,963,7,779,
160,24,775,11,129,8,620,4,019,
11,347,9,978,
13,097,51,282,1,664,1,102,8,616,3,480,6,072,5,937,
776 / 240 } 1121 4 3 ^ 839 341 6 7 ^ 718) 8?6 366 215)50lJ
LoZ l078100^^807*^
8,556,103 *' 7,306,120’'
3,593,4489,085,236
66,77422,933,42314,770,2969,384,2464,360,137
12,433,40014,803,75526,886,79555,267,4471,947,677
504,8559,378,5274,402,9417,537,000
10,504,6031,904,669
262,41312,886,5434,234,267
4,441,7099.940.220
63,86316,107,11417,685,5468,910,3734,496,612
11,951,94814,930,61828,500,49059,474,6591,882,057
478,4377.977.221 5,617,357 8,648,000
10,529,3792,041,443
10,982,6614,356,202
5,543,4299,858,882
72,54918,578,06523,712,49311,740,0815,483,921
17,177,65220,125,03138,576,32085,515,497*2,153,840
439,1077,621,0536,410,7079,223,600
11,139,0221,940,7052,513,611
10,702,8245,696,282^9,363,114^
Operating Expenditures^ $94.668.018 $188.890.670 $227,148,452 $229,015,909 $303,587,785NOTE: Data do not correspond to those in Table 32 as intergovernmental transfers have not been eliminated.a. Includes present general and special funds with corresponding accounts for previous periods. Interfund transfers
have been eliminated to avoid duplication.b. Debt service charges reimburseable from highway funds included under highways; from airport funds included under
utilities; from Sand Island receipts, Land Revolving fund and Veterans* Loan Fund included under Miscellaneous.c. Data not allocated to functions.d. Includes cash expenditures for capital improvements.e. Includes $133,657 for other educational activities, such as, commissions, compacts and a public education study.f. For further explanation and amounts by county see Table 13, page 20,
SOURCE: Annual Reports of the Comptroller, Department of Accounting & General Services, State of Hawaii.

TABLE 32
G O V E R N M E N T E X P E N D IT U R E S IN H A W A I I
State of Hawaii and City and County of Honolulu: Fiscal 1966Other Counties: Calendar 1965 (All Funds)^
Object of Expenditure StateC & C of Honolulu Maui
County of . Hawaii Kauai Totals
General Government Control S 5,543,429 $ 737,412 $ 190,979 $ 143,964 $ 158,744 $ 6,774,528Staff Agencies 9,858,882 5,743,386 764,649 1,882,973 414,076 18,663,966
Public Safety & Correction Police and Fire 72,549 13,819,513 1,511,791 1,955,294 1 ,178,595 18,537,742Other Protection 18,578,065 3,061,590 153,765 113,760 96,404 22,003,584
Highways 23,667,493 6,343,983 1,152,445 1,471,684 801,547 33,457,152Devel. & Cons. Natural Resources 11,740,081 — — — — 11,740,081Health and Sanitation 5,483,921 6,479,370 294,998 157,212 113,747 12,529,248Hospitals and Institutions 17,132,652 — ' 2,497,872 2,038,458 13,545 21,682,527Public Welfare 20,125,031 20,138 20,889 4,738 1,836 20,172,632Education: University 38,528,816 — — — — 38,528,816
Public Schools 85,515,497 162,265 414,768 874,353 193,225 87,160,108Public Libraries 2,153,840 — — — 2,153,840
Recreation 439,107 4,698,227 494,598 621,916 318,428 6,572,276Utilities & Other Enterprises 7,621,053 — — — — 7,621,053Interest Expense® Bond Redemption^
5,383,189*3 4,893,993 265,255 582,245® 128,701 11,253,3836,473,103<i 8,543,209 511,404 1,025,511® 213,373 16,766,600
Retirement and Pension!* 11,139,022 3,762,137 644,533 996,777 473,540 17,016,009Unemployment Compensation 10,702,824 — — — — 10,702,824Miscellaneous 10,140,561 867,383 115,783 164,461 65,835 11,354,023Cash for Capital Improvements^ — 11,094,647 — — — 11,094,647Act 155 - Grants-in-Aid 9,363,114 — — — — 9,363,114Sub-Total $299,682,229 $70,227,253 $9,033,729 $12,033,346 $4 ,171,596 $395,148,153Less: Act 155 — 1,489,465 1,216,709 1,698,181 1 ,021,941 5,426,296
State Salary Grants^ -- 1,412,929 32,056 43,103 16,029 1,504,117Total $299,682,229 $67,324,859 $7,784,964 $10,292,062 $3,,133,626 $388,217,740a. Data do not correspond to those in Tables 31 and 34-37, since intergovernmental transfers have been eliminated (by subtract
ing applicable receipts from other governmental units or agencies) to avoid duplication. Excludes expenditures from bond, improvement district, trust (except liquor and motor vehicle dealers' ccxnmissions) and water supply funds.
b. Amounts not allocated to functions.c. Details by object of expenditure not available. Other grants have been deducted from specific expenditures to avoid dupli
cation.d. Includes interest and redemption costs on veterans' bonds, Sand Island and other land development bonds which are reimburse-
able from loan and interest revenues of the Veterans' Farm and Home Loan Fund, and sale and/or lease of Sand Island and other public lands.
e. Includes interest and redemption payments on general obligation bonds for water purposes not directly paid from water supply revenues.
SOURCE: State Department of Accounting and General Services, City & County Department of Finance; and County Auditors.

M illio n s of Dollars
GENERAL FUND FINANCIAL POSITION State of H awa ii— Cash and Unappropriated Surp luses and Deficits
As at June 30— Selected Years (M illio n s of Dollars)
CHART 8
M illio n s of Dollars
SOURCE: Table 33
TABLE 33
HAWAII STATE GENERAL FUND FINANCESFiscal Years Ending June 30
(In Thousands)®
FiscalYear
Excess or Receipts Expenditures Deficiency
CashBalance
UnexpendedAppropriations
UnappropriatedBalance
1956 $ 62,130 $ 60,190 $ 1,940 -$ 6,093 $12,822 -S18,9151957 67,851 65,681 2,170 - 3,923 10,682 - 14,6051958 82,757 75,627 7,130 3,207 4,923 - 1,7161959 99,087 83,664 15,423 18,630 7,276 11,3541960 121,418 110,954 10,464 29,094 31,731 - 2,6371961 154,012 149,737 4,275 33,369 20,864 12,5051962 163,501 167,220 - 3,719 29,650 21,516 8,1341963 168,519 182,713 - 14,194 15,456 16,001 - 5451964 176,198 175,779 419 15,875 9,617 6,2581965 182,296 177,439 4,857 20,732 11,314 9,4181966 258,327 243,926 14,401 35,133 22,283 12,850
a. Includes federal funds earmarked for specific purposes. 1961 and subsequent data include certain revenues and expenditures formerly under special funds, such as federal funds for Hawaii National Guard, or in funds not covered in the treasury.
SOURCE: Department of Accounting and General Services, State of Hawaii.
40

PUBLIC SAFETY
HIGHWAYS
CHART 9
OBJECTS OF COUNTY GO VERNM ENT EXPEND ITURES
Percentage D istr ibu t io n — By Counties
H o n o lu lu F isca l 1966; Other Counties C a lendar 1965
1 0 % 2 0 % 3 0 %
_ | 2 3 .84%
! 17 .05%
13 .76%
25 .75%
I
I 9 .2 9 %
111.68%1 9 .5 7 %
^ ^ ^ ^ ^ ^ 1 6 . 3 9 %
HEALTH AND SANITATION
HOSPITAL AND W ELFARE
GENERAL GOVERNMENT
SCHOOLS
DEBT PR INC IPAL AND INTEREST PAYMENTS
RECREATION
M ISCELLANEO US OTHERS
9 .0 3 %
J 2 .9 9 %
11.12%I 2 .3 3 %
0 .0 3 %
\ \ \ \ \ \ \ \ \ \ \ \ 1 il38%----^
I 2 8 .49%
C ity and County of H ono lu lu
County of M au i
10% 20%
SOURCE: Tab les 34-37 in c lu s ive
3 0 % 4 0 %
41
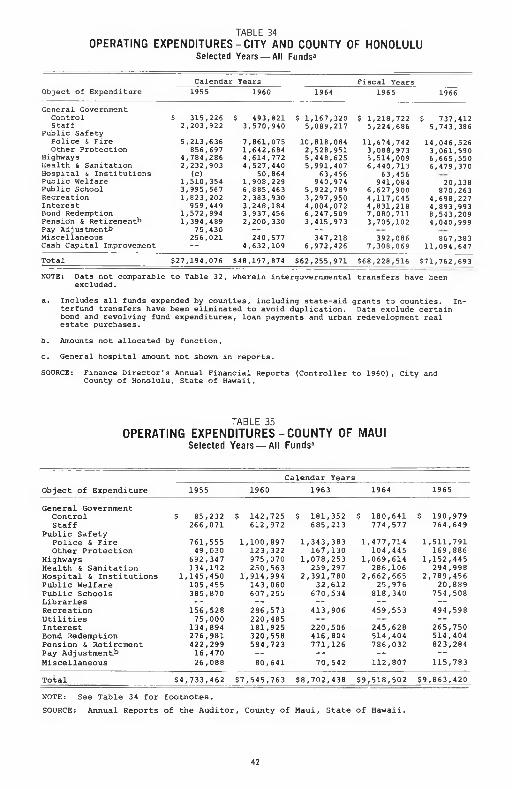
TABLE 34
OPERATING EXPENDITURES-CITY AND COUNTY OF HONOLULUSelected Years — All Fundsa
Calendar Years Fiscal YearsObject of Expenditure 1955 1960 1964 1965 1966
General Government Control $ 315,226 $ 493,821 S 1,167,320 $ 1,218,722 $ 737,412Staff 2,203,922 3,570,940 5,089,217 5,224,686 5,743,386
Public Safety Police & Fire 5,213,636 7,861,075 10,818,084 11,674,742 14,046,526Other Protection 856,697 1,642,684 2,528,951 3,088,973 3,061,590
Highways 4,784,286 4,614,772 5,448,625 5,514,009 6,665,550Health & Sanitation 2,232,903 4,527,440 5,991,407 6,440,713 6,479,370Hospital & Institutions (c) 50,864 63,456 63,456Public Welfare 1,510,354 1,908,229 940,974 941,084 20,138Public School 3,995,567 6,885,463 5,922,789 6,627,900 870,263Recreation 1,823,202 2,383,930 3,297,950 4,117,045 4,698,227Interest 959,449 3,248,184 4,004,072 4,831,218 4,893,993Bond Redemption 1,572,894 3,937,456 6,247,509 7,080,711 8,543,209Pension & Retirementh 1,394,489 2,200,330 3,415,973 3,705,102 4,040,999Pay Adjustmentb 75,430 _ _ _ _
Miscellaneous 256,021 240,577 347,218 392,086 867,383Cash Capital Improvement -- 4,632,109 6,972,426 7,308,069 11,094,647Total $27,194,076 $48,197,874 $62,255,971 $68,228,516 $71,762,693NOTE: Data not comparable to Table 32, wherein intergovernmental transfers have been
excluded.
a. Includes all funds expended by counties, including state-aid grants to counties. Interfund transfers have been eliminated to avoid duplication. Data exclude certain bond and revolving fund expenditures, loan payments and urban redevelopment real estate purchases.
b. Amounts not allocated by function.
c. General hospital amount not shown in reports.
SOURCE: Finance Director's Annual Financial Reports (Controller to 1960), City andCounty of Honolulu, State of Hawaii.
TABLE 35
OPERATING EXPENDITURES-COUNTY OF MAUISelected Years — All Funds’
Calendar YearsObject of Expenditure 1955 1960 1963 1964 1965
General GovernmentControl $ 85,232 $ 142,725 $ 181,352 $ 180,641 $ 190,979Staff 266,071 612,972 685,213 774,577 764,649
Public SafetyPolice & Fire 761,555 1 ,100,897 1,343,383 1,,477,714 1,,511,791Other Protection 49,030 123,322 167,130 104,445 169,886
Highways 692,347 975,070 1,078,253 1,,069,614 1,,152,445Health & Sanitation 134,192 250,563 259,297 286,106 294,998Hospital & Institutions 1,145,450 1 ,914,994 2,391,780 2,,662,665 2 ,789,456Public Welfare 105,455 143,060 32,612 25,976 20,889Public Schools 385,870 607,255 670,534 818,340 754,508Libraries — -- — — —Recreation 156,528 286,573 413,906 459,553 494,598Utilities 75,000 220,485 — -- —Interest 134,894 181,925 220,506 245,628 265,750Bond Redemption 276,981 320,558 416,804 514,404 514,404Pension & Retirement 422,299 584,723 771,126 786,032 823,284Pay Adjustmentb 16,470 — — — —Miscellaneous 26,088 80,641 70,542 112,807 115,783
Total $4,733,462 $7 ,545,763 $8,702,438 $9,,518,502 $9 ,863,420
NOTE: See Table 34 for footnotes.SOURCE: Annual Reports of the Auditor, County of Maui, State of Hawaii.
42
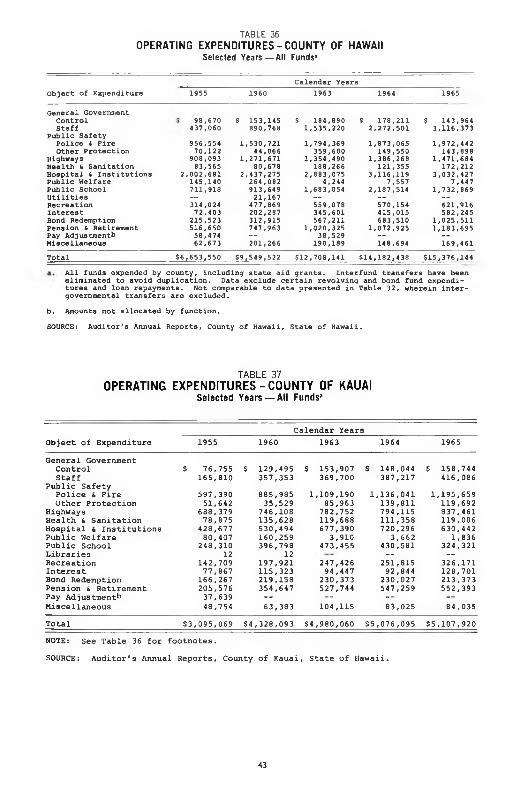
OPERATING EXPENDITURES-COUNTY OF HAWAIIS e lected Years — A ll Funds"
TABLE 36
Calendar YearsObject of Expenditure 1955 1960 1963 1964 1965
> 98,670 S 153,145 $ 184,890 $ 178,211 $ 143,964437,060 890,768 1,535,220 2,272,501 3,116,373956,554 1,,530,721 1,794,369 1,873,065 1,972,44270,122 44,066 359,600 149,550 143,898
908,093 1,,271,671 1,354,490 1,386,268 1,471,68483,565 80,678 168,266 121,355 172,212
2,002,681 2,,437,275 2,883,075 3,116,119 3,032,427145,140 264,082 4,244 7,557 7,447711,918 913,649 1,683,054 2,187,514 1,732,869— 21,167 -- -- —314,024 477,869 559,078 570,154 621,91672,403 202,287 345,601 415,015 582,245
215,523 312,915 567,211 683,510 1,025,511516,650 747,963 1,020,325 1,072,925 1,183,69558,474 — 38,529 — --62,673 201,266 190,189 148 ,694 169,461
General Government Control Staff
Public Safety Police & Fire Other Protection
HighwaysHealth & SanitationHospital & InstitutionsPublic WelfarePublic SchoolUtilitiesRecreationInterestBond RedemptionPension & RetirementPay AdjustmentbMiscellaneousTotal $6,653,550 $9,549,522 $12,708,141 $14,182,438 $15,376,144
All funds expended by county, including state aid grants. Interfund transfers have been eliminated to avoid duplication. Data exclude certain revolving and bond fund expenditures and loan repayments. Not comparable to data presented in Table 32, wherein intergovernmental transfers are excluded.
b. Amounts not allocated by function.
SOURCE: Auditor's Annual Reports, County of Hawaii, State of Hawaii.
TABLE 37
OPERATING EXPENDITURES-COUNTY OF KAUAISelected Years — All Funds*
Calendar YearsObject of Expenditure 1955 1960 1963 1964 1965
General GovernmentControl $ 76,755 S 129,495 $ 153,907 $ 148,044 $ 158,744Staff 165,810 357,353 369,700 387,217 416,086
Public SafetyPolice & Fire 597,390 885,985 1 ,109,190 1,136,041 1,195,659Other Protection 51,642 35,529 85,963 139,811 119,692
Highways 688,379 746,108 782,752 794,115 837,461Health & Sanitation 78,875 135,628 119,688 111,358 119,006Hospital & Institutions 428,677 530,494 677,390 720,296 630,442Public Welfare 80,407 160,259 3,910 3,662 1,836Public School 240,310 396,798 473,455 430,581 324,321Libraries 12 12 — —Recreation 142,709 197,921 247,426 251,815 326,171Interest 77,867 115,323 94,447 92,844 128,701Bond Redemption 166,267 219,158 230,373 230,027 213,373Pension & Retirement 205,576 354,647 527,744 547,259 552,393Pay Adjustmentb 37,639 — — — —Miscellaneous 48,754 63,383 104,115 83,025 84,035
Total $3,,095,069 $4 ,328,093 S4 ,980,060 55,076,095 $5,107,920NOTE: See Table 36 for footnotes.
SOURCE: Auditor's Annual Reports, County of Kauai, State of Hawaii.
43
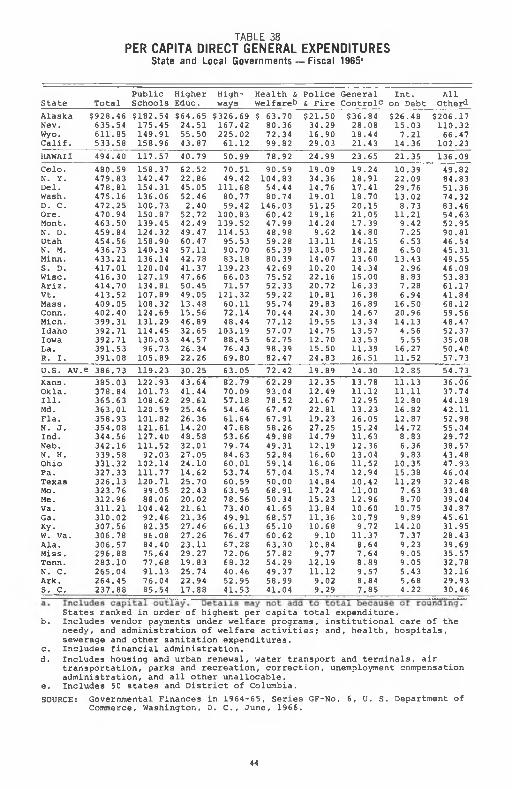
TABLE 38PER CAPITA DIRECT GENERAL EXPENDITURES
State and Local Governments — Fiscal 1965*
Public Higher High Health & Police General Int. AllState Total Schools Educ. ways Welfare^ & Fire Controlc on Debt OtherdAlaska $928.46 $182.54 $64.65 $326.69 $ 63.70 $21.50 $36.84 $26.48 $206.17Nev. 635.54 175.45 24.51 167.42 80.36 34.29 28.08 15.03 110.32Wyo. 611.85 149.91 55.50 225.02 72.34 16.90 18.44 7.21 66.47Calif. 533.58 158.96 43.87 61.12 99.82 29.03 21.43 14.36 102.23HAWAII 494.40 117.57 40.79 50.99 78.92 24.99 23.65 21.35 136.09Colo. 480.59 158.37 62.52 70.51 90.59 19.09 19.24 10.39 49.82N. Y. 479.83 142.47 22.86 49.42 104.83 34.36 18.91 22.09 84.83Del. 478.81 154.31 45.05 111.68 54.44 14.76 17.41 29.76 51.36Wash. 475.16 136.06 52.46 80.77 80.74 19.01 18.70 13.02 74.32D. C. 472.25 100.73 2.40 59.42 146.03 51.25 20.15 8.73 83.46Ore. 470.94 150.87 52.72 100.83 60.42 19.16 21.05 11.21 54.63Mont. 463.50 139.45 42.49 139.52 47.99 14.24 17.39 9.42 52.95N. D. 459.84 124.32 49.47 114.53 48.98 9.62 14.80 7.25 90.81Utah 454.56 158.90 60.47 95.53 59.28 13.11 14.15 6.53 46.54N. M. 436.73 140.34 57.11 90.70 65.39 13.05 18.28 6.50 45.31Minn. 433.21 136.14 42.78 83.18 80.39 14.07 13.60 13.43 49.55S. D. 417.01 120.04 41.37 139.23 42.69 10.20 14.34 2.96 46.09Wise. 416.30 127.19 47.66 66.03 75.52 22.16 15,00 8.83 53.83Ariz. 414.70 134.81 50.45 71.57 52.33 20.72 16.33 7.28 61.17Vt. 413.52 107.89 49.05 121.32 59.22 10.81 16.38 6.94 41.84Mass. 409.05 108.32 13.48 60.11 95.74 29.83 16,89 16.50 68.12Conn. 402.40 124.69 15.56 72.14 70.44 24.30 14.67 20.96 59.56Mich. 399.31 131.29 46.89 48.44 77.12 19.55 13.34 14.13 48.47Idaho 392.71 114.45 32.65 103.19 57.07 14.75 13.57 4.56 52.37Iowa 392.71 130.03 44.57 88.45 62.75 12.70 13.53 5.55 35.08La. 391.53 96.73 26.34 76.43 98.39 15.50 11.39 16.27 50.40R. I. 391.08 105.89 22.26 69.80 82.47 24.83 16.51 11.52 57.73U.S. AV.,e 386.73 119.23 30.25 63.05 72.42 19.89 14.30 12.85 54.73Kans. 385.03 122.93 43.64 82.79 62.29 12.35 13.78 11.13 36.06Okla. 378.84 101.73 41.44 70.09 93.04 12.49 11.12 11.11 37.74I11. 365.63 108.62 29.61 57.18 78.52 21.67 12.95 12.80 44.19Md. 363.01 120.59 25.46 54.46 67.47 22.81 13.23 16.82 42.11Fla. 358.93 101.82 26.36 61.64 67.91 19.23 16.05 12.87 52.98N. J. 354.08 121.61 14.20 47.68 58.26 27.25 15.24 14.72 55.04Ind. 344.56 127.40 48.58 53.66 49.88 14.79 11.63 8.83 29.72Neb. 342.16 111.52 32.01 79.74 49.31 12.19 12.36 6.36 38.57N. H. 339.58 92.03 27.05 84.63 52.84 16.60 13.04 9.83 43.48Ohio 331.32 102.14 24.10 60.01 59.14 16.06 11.52 10.35 47.93Pa. 327.33 111.77 14.62 53.74 57.04 15.74 12.94 15.38 46.04Texas 326.13 120.71 25.70 60.59 50.00 14.84 10.42 11.29 32.48Mo. 323,76 99.05 22.43 63.95 68.91 17.24 11.00 7.63 33.48Me. 312.96 88.06 20.02 78.56 50.34 15.23 12.96 8.70 39.04Va. 311.21 104.42 21.61 73.40 41.65 13.84 10.60 10.75 34.87Ga. 310.02 92.46 21.36 49.91 68.57 11.36 10.79 9.89 45.61Ky. 307.56 82.35 27.46 66.13 65.10 10.68 9.72 14.10 31.95W. Va. 306.78 86.08 27.26 76.47 60.62 9.10 11.37 7.37 28.43Ala. 306.57 84.40 23.11 67.28 63.30 10.84 8.64 9.23 39.69Miss. 296.88 75.64 29.27 72.06 57.82 9.77 7.64 9.05 35.57Tenn. 283.10 77,68 19.83 68.32 54.29 12.19 8.89 9.05 32.78N. C. 265.04 91.13 25.74 40.46 49.37 11.12 9.57 5.43 32.16Ark. 264.45 76.04 22.94 52.95 58.99 9.02 8.84 5.68 29.93S. C. 237.88 85.54 17.88 41.53 41.04 9.29 7.85 4.22 30.46
States ranked in order of highest per capita total expenditure.b. Includes vendor payments under welfare programs, institutional care of the
needy, and administration of welfare activities; and, health, hospitals, sewerage and other sanitation expenditures.
c. Includes financial administration.d. Includes housing and urban renewal, water transport and terminals, air
transportation, parks and recreation, correction, unemployment compensation administration, and all other unallocable.
e. Includes 50 states and District of Columbia.SOURCE: Governmental Finances in 1964-65, Series GF-No. 6, U. S. Department of
Commerce, Washington, D. C., June, 1966.
44

TABLE 39HAWAII PUBLIC SCHOOL COSTS
Selected Fiscal Years: 1956-1966^
Object of Expenditure 1956 1961 1964 1965 1966AdministrationInstructionFood ServicesOther School ServicesSchool Plant OperationSchool Plant MaintenanceRetire., S.S., Med. Ins. Contrib.Workmen's CompensationbDebt Service
S 616,647 20,008,062
(d) 1,169,817 1,449,270 1,516,342 1,508,462 14,425 986,380
S 818,045 35,234,190
(d) 2,053.403 3,271,092 2,357,131 2,630,208
43,325 4,672,430
S 2,094,5719 42,598,630 8,789,066 922,316 3,111,364
2,416,545 4,436,804 558,707 5,092,749
S 3,280,7249 43,961,726 8,827,555 1,655,205 3,223,608 2,776,808 4,365,294 528,846 5,423,781
S 4,977,118957,031,09410,082,0562,255,5343,463,460^5,540,526^5,912,594165,0375,754,378
Sub-Total $27,269,405 851,079,824 $70,020,752 874,543,547 S 95,181,797Capital Outlayc Adult Education Technical Schools Public Libraries Vocational Rehabilitation
S 1,600,826 109,666(e)(f)(f)
$ 5,040,354 234,913(e)(f)(f)
$ 6,277,565 338,278 (e) 1,614,981 709,490
$13,219,292498,7171,365,5341,773.441
781,148
S 17,366,3841,623,019
842,4172,866.8251,027,961
Total $28,979,897 $56,355,091 $78,961,066h S92,181,679h S118,908,403hAverage Enrollment 119,085 144,764 155,051 158,787 160,617Average Daily Attendance 112,575 136,860 146,293 148,702 151,253
Does not include all costs attributable to education department operation. Includes expenditures from federal, state and county funds.Includes $476,530 in 1964, $440,169 in 1965 and $114,412 in 1966 for unemployment compensation Does not include expenditures from bond funds.Breakdown not available.Not available as separate item but included in total.Not included under Department of Education responsibility until subsequent years.Charges by other governmental agencies increased over prior years because of a revised method of recording charges.Not comparable with previous years since total includes other charges.County maintenance functions transferred to the state, effective July 1, 1965.
SOURCE: Annual Reports of the Department of Publiof Education, State of Hawaii.
Instruction, Territory of Hawaii, and Department
(0 0 0 )
CH ART 10TRENDS IN HAWAII SCHOOL ENROLLMENT
State of Hawaii — Public and Private Schools As at December 31 — Selected Years 1956-1966
(000)
200
150
. PUBLIC SCHOOLS Non-Federa|a 199,625
1956 1961 1964 1965
Prior year data adjusted to exclude enro llm ent in technical schools transferred in 1965 to University of Hawaii Community Colleges.Includes enrollm ent for partial as well as fu ll federal impact- area a id .Pre lim inary 1966 enro llm ent data subject to change.SOURCE: Department of Education, Research and Statistics
Division, State of Hawaii.
45
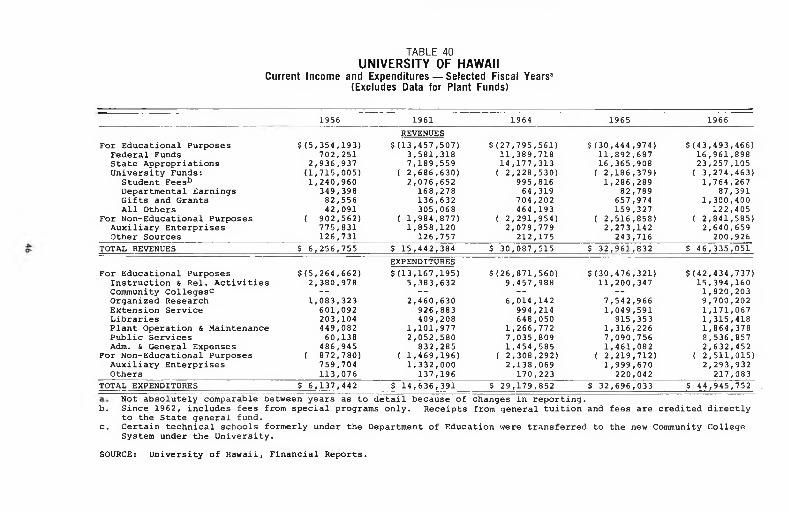
TABLE 40
UNIVERSITY OF HAWAIICurrent Income and Expenditures— Selected Fiscal Years"
(Excludes Data for Plant Funds)
1956 1961 1964 1965REVENUES
1966
For Educational Purposes $(5,354,193) $(13,457,507) $(27,795,561) $(30,444,974) $(43,493,466)Federal Funds 702,251 3,581,318 11,389,718 11,892,687 16,961,898State Appropriations 2,936,937 7,189,559 14,177,313 16,365,908 23,257,105University Funds: (1,715,005) ( 2,686,630) ( 2,228,530) ( 2,186,379) ( 3,274,463)
Student Fees^* 1,240,960 2,076,652 995,816 1,286,289 1,764,267Departmental Earnings 349,398 168,278 64,319 82,789 87,391Gifts and Grants 82,556 136,632 704,202 657,974 1,300,400All Others 42,091 305,068 464,193 159,327 122,405
For Non-Educational Purposes ( 902,562) ( 1,984,877) ( 2,291,954) ( 2,516,858) ( 2,841,585)Auxiliary Enterprises 775,831 1,858,120 2,079,779 2,273,142 2,640,659Other Sources 126,731 126,757 212,175 243,716 200,926
TOTAL REVENUES $ 6,256,755 $ 15,442,384 $ 30,087,515 $ 32,961,832 $ 46,335,051EXPENDITURES
For Educational Purposes $(5,264,662) $ (13,167,195) $(26,871,560) $(30,476,321) $(42,434,737)Instruction & Rel. Activities 2,380,978 5,383,632 9,457,988 11,200,347 15,394,160Community C o l l e g e s ^ — — — — 1,820,203Organized Research 1,083,323 2,460,630 6,014,142 7,542,966 9,700,202Extension Service 601,092 926,883 994,214 1,049,591 1,171,067Libraries 203,104 409,208 648,050 815,353 1,315,418Plant Operation 6 Maintenance 449,082 1,101,977 1,266,772 1,316,226 1,864,378Public Services 60,138 2,052,580 7,035,809 7,090,756 8,536,857Adm. & General Expenses 486,945 832,285 1,454,585 1,461,082 2,632,452
For Non-Educational Purposes ( 872,780) ( 1,469,196) ( 2,308,292) ( 2,219,712) ( 2,511,015)Auxiliary Enterprises 759,704 1,332,000 2,138,069 1,999,670 2,293,932Others 113,076 137,196 170,223 220,042 217,083
TOTAL EXPENDITURES $ 6,137,442 $ 14,636,391 $ 29,179,852 $ 32,696,033 $ 44,945,752Not absolutely comparable between years as to detail because of changes in reporting.
b. Since 1962, includes fees from special programs only. Receipts from general tuition and fees are credited directly to the State general fund.
c. Certain technical schools formerly under the Department of Education were transferred to the new Community College System under the University.
SOURCE: University of Hawaii, Financial Reports.
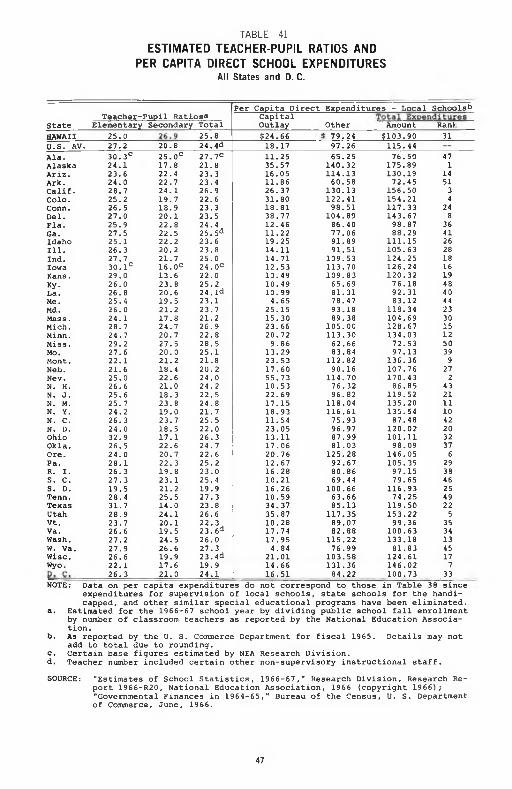
TABLE 41
ESTIMATED TEACHER-PUPIL RATIOS AND
PER CAPITA DIRECT SCHOOL EXPENDITURESAll States and D. C.
stateTeacher-Pupil Ratios*
Elementary Secondary TotalPer Capita Direct Expenditures - Local Schools!*
CapitalOutlay Other Amount Ran)i
: 79.24 $103.90 3197.26 115.44 —65.25 76.50 47
140.32 175.89 1114.13 130.19 1460.58 72.45 51
130.13 156.50 3122.41 154.21 498.51 117.33 24
104.89 143.67 886.40 98.87 3677.06 88.29 4191.89 111.15 2691.51 105.63 28
109.53 124.25 18113.70 126.24 16109.83 120.32 1965.69 76.18 4881.31 92.31 4078.47 83.12 4493.18 118.34 2389.38 104.69 30
105.00 128.67 15113.30 134.03 1262.66 72.53 5083.84 97.13 39
112.82 136.36 990.16 107.76 27
114.70 170.43 276.32 86.85 4396.82 119.52 21
118.04 135.20 11116.61 135.54 1075.93 87.48 4296.97 120.02 2087.99 101.11 3281.03 98.09 37125.28 146.05 692.67 105.35 2980.86 97.15 3869.44 79.65 46
100.66 116.93 2563.66 74.25 4985.13 119.50 22
117.35 153.22 589.07 99.36 3582.88 100.63 34
115.22 133.18 1376.99 81.83 45
103.58 124.61 17131.36 146.02 784.22 100,73 33
HAWAII 25.0 25.8 24.4d
$24.66U.S. AV. 27.2 20.8 18.17Ala.AlaskaAriz.Ark.Calif.Colo.Conn.Del.Fla.Ga.IdahoI l l .Ind.IowaKans.Ky.La.Me.Md.Mass.Mich.Minn.Miss.Mo.Mont.Neb.Nev.N. H. N. J. N. M. N. y. N. C. N. D. Ohio Okla. Ore. Pa.R. I.S. C.S. D.Tenn.TexasUtahVt.Va. Wash. W. Va. Wisc. Wyo.
30.3®24.123.624.028.725.226.527.025.927.525.126.327.7 30.1®29.026.026.825.4 26.024.128.724.729.227.6 22.121.625.0 26.625.625.724.226.324.032.926.524.028.1 26. 327.319.528.431.728.923.726.627.227.9 26.6 22.126.3
25.0®17.822.422.724.119.718.92 0 . 12 2 . 822.5 22.2 2 0 . 221.7 16.0®13.623.82 0 . 619.5 21.217.824.720.727.5 2 0 . 0 21.218.422.6 21.018.323.819.023.718.517.12 2 . 620.722.319.823.121.225.514.024.12 0 .119.524.526.619.9 17.6 21.0
27.7®21.823.323.4 26.9 22.623.323.524.4 25.5*̂23.623.825.0 24.0®22.0 25.2 24.1<i23.123.721.226.922.828.525.1 21.820.224.024.222.524.821.725.522.026.324.72 2 . 625.223.025.419.927.323.8 26.6 22-3, 23.6®26.027.3 23.4d19.9 24.1
11.25 35,5716.05 11.8626.3731.8018.81 38.77 12.46 11.2219.2514.1114.7112.5310.4910.49 10.994.65
25.15 15. 3023.6620.72 9.86
13.2923.53 17.6055.7310.53 22.6917.15 18.9311.5423.0513.1117.06 20.7612.67 16.28 1 0 . 2 116.26 10.5934.37 35.87 10.2817.74 17.954.84
21.0114.6616.51
NOTE: Data on per capita expenditures do not correspond to those in Table 38 sinceexpenditures for supervision of local schools, state schools for the handicapped, and other similar special educational programs have been eliminated.
a. Estimated for the 1966-67 school year by dividing public school fall enrollment by number of classroom teachers as reported by the National Education Association.
b. As reported by the U. S. Commerce Department for fiscal 1965. Details may not add to total due to rounding.
c. Certain base figures estimated by NBA Research Division.d. Teacher number included certain other non-supervisory instructional staff,SOURCE: "Estimates of School Statistics, 1966-67," Research Division, Research Re
port 1966-R20, National Education Association, 1966 (copyright 1966); "Governmental Finances in 1964-65," Bureau of the Census, U. S. Department of Commerce, June, 1966.
47
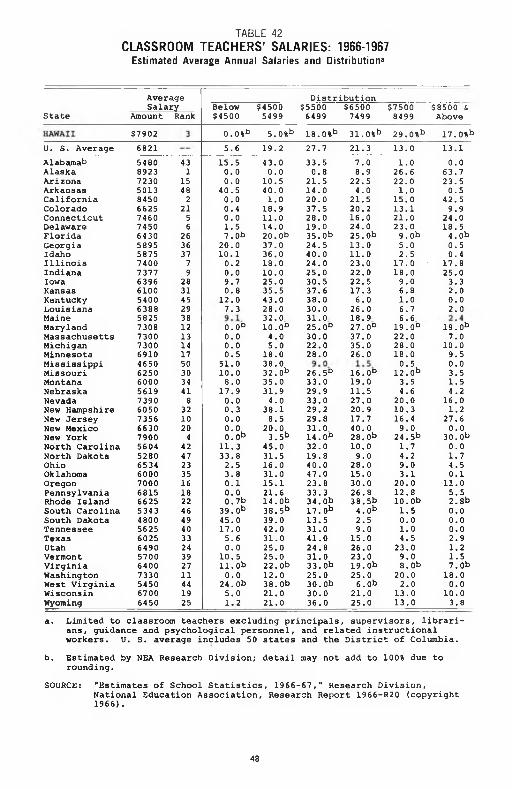
CLASSROOM TEACHERS’ SALARIES: 1966-1967Estimated Average Annual Salaries and Distribution^
TABLE 42
State
Average Salary
Amount RankBelow$4500
$45005499
Distribution $550^6499
$65007499
$75008499
$8500 & Above
$7902 0.0%^ 5.0%-= 18.0%-= 31.0%>= 29.0%-= 17.0%-=U. S. Average 6821 5.6 19.2 27.7 21.3 13.0 13.1Alabeuna^ Alaska Arizona Arkansas California Colorado Connecticut Delaware Florida Georgia Idaho Illinois Indiana Iowa Kansas Kentucky Louisiana Maine Maryland Massachusetts Michigan
548089237230501384506625746074506430589558757400737763966100540063885825730873007300
431
15482
2156
263637 7 9
2831452938 121314
15.5 0 . 0 0.0
40.5 0 . 0 0.4 0 . 0 1.5 7.0b
2 0 . 010.10.20 . 09.70.8
12.07.3
0.0°0 . 00.0
43.00.0
10.540.0 1.0
18.911.014.0 20.0b37.036.018.0 10.025.035.543.028.0 32.0 10.0°4.05.0
33.5 0.8
21.514.02 0 . 037.5 28.019.0 35.0b24.540.024.025.030.537.638.030.031.0 25.0°30.022.0
7.0 8.9
22.54.0
21.5 20.2 16.024.0 25.0b13.011.023.02 2 . 022.5 17.36.0
26.0 18,9 27.0°37.035.0
1.026.62 2 . 01.0
15.013.1 21.023.09.0b5.02.5
17.018.09.0 6.81.0 6.76.6
19.0° 22.0 26.0
0.063.723.5 0.5
42.5 9.9
24.018.5 4.0b 0.5 0.4
17.825.0 3.3 2.0 0.0 2.0
19.0^7.0
10.0Minnesota 6910 17 0.5 18.0 28.0 26.0 18.0 9.5Mississippi 4650 50 51.0 38.0 0.5 0.0Missouri 6250 30 10.0 32.0^ 26.5° 16.0° 12.0^ 3.5Montana 6000 34 8.0 35.0 33.0 19.0 3.5 1.5Nebraska 5619 41 17.9 31.9 29.9 11.5 4.6 4.2Nevada 7390 8 0.0 4.0 33.0 27.0 20.0 16.0New Hampshire 6050 32 0.3 38.1 29.2 20.9 10.3 1.2New Jersey 7356 10 0.0 8.5 29.8 17.7 16.4 27.6New Mexico 6630 20 0.0^ 20.0 31.0^ 40.0 9.0 0.0New York 7900 4 0.0^ 3 .5 b 14.0^ 28.0b 2 4 .5 b 30.ObNorth Carolina 5604 42 11.3 45.0 32.0 10.0 1.7 0.0North Dakota 5280 47 33.8 31.5 19.8 9.0 4.2 1.7Ohio 6534 23 2.5 16.0 40.0 28.0 9.0 4.5Oklahoma 6000 35 3.8 31.0 47.0 15.0 3.1 0.1Oregon 7000 16 0.1 15.1 23.8 30.0 20.0 11.0Pennsylvania 6815 18 0.0 21.6 33.3 26.8 12.8 5.5Rhode Island 6625 22 0.7b 14.0b 34.0b 38.5b 10.0b 2.8bSouth Carolina 5343 46 39.0^ 38.5t> 17.0^ 4.0^^ 1.5 0.0South Dakota 4800 49 45.0 39.0 13.5 2.5 0.0 0.0Tennessee 5625 40 17.0 42.0 31.0 9.0 1.0 0.0Texas 6025 33 5.6 31.0 41.0 15.0 4.5 2.9Utah 6490 24 0.0 25.0 24.8 26.0 23.0 1.2Vermont 5700 39 10.5 25.0 31.0 23.0 9.0 1.5Virginia 6400 27 11.0b 22.0b 33.0b 19.0b 8.0b 7.0bWashington 7330 11 0.0 12.0 25.0 25.0 20.0 18.0West Virginia 5450 44 24.0b 38.0b 30.0b 6.0b 2.0 0.0Wisconsin 6700 19 5.0 21.0 30.0 21.0 13.0 10.0Wyoming 6450 25 1.2 21.0 36.0 25.0 13.0 3.8
a. Limited to classroom teachers excluding principals, supervisors, librarians, guidance and psychological personnel, and related instructionalworkers. U. S. average includes 50 states and the District of Columbia.
b. Estimated by NEA Research Division; detail may not add to 100% due torounding.
SOURCE: "Estimates of School Statistics, 1966-67," Research Division,National Education Association, Research Report 1966-R20 (copyright 1966).
48
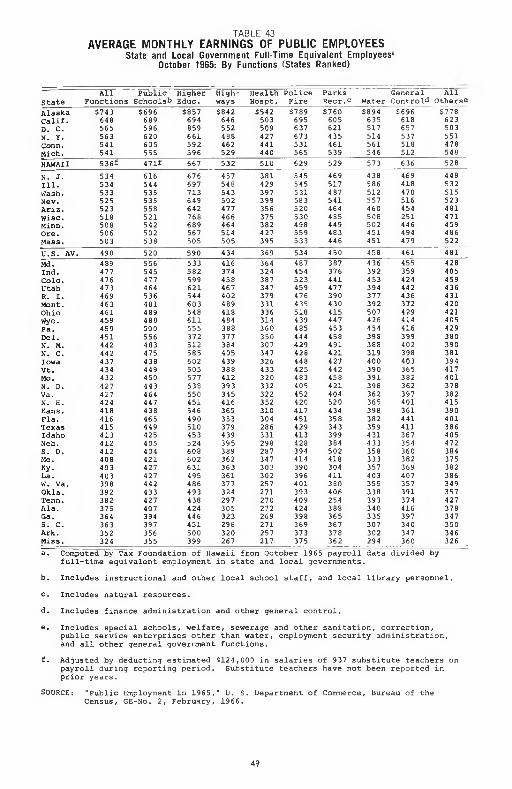
AVERAGE MONTHLY EARNINGS OF PUBLIC EMPLOYEESState and Local Government Full-Time Equivalent Employees’
October 1965: By Functions (States Ranked)
TABLE 43
All Public Higher High Health Police Parks General AllState Functions Schoolsb Educ. ways Hospt. Fire Recr.c Water Control^ Others©Alaska $743 $696 $857 $842 $542 S789 $760 $894 $696 $778Calif. 648 689 694 646 503 695 605 635 618 623D. C. 565 596 859 552 509 637 621 517 657 503N. Y. 563 620 661 468 427 673 435 514 537 551Conn. 541 605 592 462 441 531 461 561 518 478Mich. 541 555 596 529 440 565 539 546 512 548HAWAII 536f 471f 667 532 510 629 529 573 636 528N. J. 534 616 676 457 381 545 469 438 469 448111. 534 544 697 548 429 545 517 586 418 532Wash. 533 535 713 543 397 531 487 512 470 515Nev. 525 535 649 502 399 583 541 557 516 523Ariz. 523 558 642 477 356 520 464 460 454 481Wise. 518 521 768 466 375 530 485 508 251 471Minn. 508 542 689 464 382 498 449 502 446 459Ore. 506 502 567 514 427 559 483 451 494 486Mass. 503 538 505 505 395 533 446 451 479 522U.S. AV. 490 520 590 434 369 534 450 458 461 481Md, 489 556 533 416 364 487 387 436 455 428Ind. 477 545 582 374 324 454 376 392 359 405Colo. 476 477 599 458 387 523 441 453 424 459Utah 473 464 621 467 347 459 477 394 442 436R. I. 469 536 544 402 379 476 390 377 436 431Mont. 463 481 603 489 331 435 430 392 372 420Ohio 461 489 548 418 336 518 415 507 429 421Wyo. 459 488 611 484 314 439 447 426 414 405Pa. 459 500 555 388 360 485 453 454 416 429Del. 451 556 372 377 350 444 458 398 399 380N. M. 442 483 512 384 307 429 491 388 402 390N. C. 442 475 585 405 347 428 421 319 398 381Iowa 437 438 602 439 326 448 427 400 403 394Vt. 434 449 505 388 433 425 442 390 365 417Mo. 432 450 577 412 320 483 458 391 382 401N. D. 427 443 538 393 332 405 421 398 362 378Va. 427 464 550 345 322 452 404 362 397 382N. H. 424 447 451 416 352 420 520 365 401 415Kans. 418 438 546 365 310 417 434 398 361 390Fla. 416 465 490 353 304 451 358 382 441 401Texas 415 449 510 379 286 429 343 359 411 386Idaho 413 425 453 439 331 413 399 431 367 405Neb. 412 405 524 395 298 428 384 433 354 472S. D. 412 404 608 389 287 394 502 358 360 384Me. 408 421 602 362 347 414 418 333 382 375Ky. 403 427 631 363 303 390 304 357 369 382La. 403 427 495 361 302 396 411 403 407 386W. Va. 398 442 486 377 257 401 380 355 357 349Okla. 392 433 493 324 271 393 406 338 391 357Tenn. 382 427 438 297 270 409 254 393 374 427Ala. 375 407 424 305 272 424 388 340 416 378Ga. 364 394 446 323 269 398 365 335 397 347S. C. 363 397 451 298 271 369 367 307 340 350Ark. 352 356 500 320 257 373 378 302 347 346Miss. 324 355 399 267 217 375 362 294 360 326a. Computed by Tax Foundation of Hawaii from October 1965 payroll data divided by
full-time equivalent employment in state and local governments,
b. Includes instructional and other local school staff, and local library personnel.
c. Includes natural resources.
d. Includes finance administration and other general control.
e. Includes special schools, welfare, sewerage and other sanitation, correction,public service enterprises other than water, employment security administration, and all other general government functions.
f. Adjusted by deducting estimated $124,000 in salaries of 937 substitute teachers on payroll during reporting period. Substitute teachers have not been reported in prior years.
SOURCE: "Public Employment in 1965," U. S. Department of Commerce, Bureau of theCensus, GE-No. 2, February, 1966.
49

TABLE 44
COMPENSATION RATES IN SELECTED POSITIONSPrivate Industry and State-County Governments in Hawaii
Private Industrya
Job Classification Min. Max.
State-County Private State-County
Min, Max. Median Mean Median Mean
$394 $504 $ 404 $ 430 $504 $498357 457 320 339 414 409394 504 368 373 504 493340 435 353 366 394 406294 375 290 301 309 325394 504 400 425 457 462394 504 440 456 504 490375 480 368 377 435 439375 480 455 443 435 433555 709 575 601 555 583744 949 1,200 1,057 904 910529 675 658 635 612 623294 375 274 285 394 376555 709 525 594 659 672340 435 385 388 394 387480 612 447 468 612 604357 457 335 345 457 445435 555 415 427 504 516394 504 415 424 529 519375 480 388 410 480 455516 696 510 529 643 635309 394 362 363 366 362340 435 325 330 446 430435 555 489 485 529 519309 394 283 294 309 320
Monthly Salary Rates
Account Clerk $375Bkkp. Mach. Oper. 305Cashier 329Clerk 317Clerk, Junior 283Clerk, Numbers 381Clerk, Senior 398Clerk-Steno. 338Draftsman 430Engr., Civ. (Entry) 603Engr., Civ. (Lie.) 759Engr. Draftsman 523Hospt. Attendant 265Instrumentman 528Key Punch Operator 330Med. Lab. Tech. 436Nurse, Practical 310Nurse, Staff 416Payroll Clerk 371Rodman i Chainman 398Secretary, Private 446Switchboard Oper. 306Switch. Oper.-Reoept. 300 Tab. Mach. Oper. 421Typist, Junior 265
Hourly Wage Rates
$ 505 408 433 429 365 498 551 448 519 839
1,124 641 322 743 422 558390 522 502 482 600391392 541 350
Auto Mechanic $2.72 $3.58 $2.51 $3,23 $2.82 $2.98 $3.36 $3.21Auto Mech. Helper 1.72 2.68 1.96 2.51 2.29 2.37 2.34 2.30Bldg. Maint. Man 2.35 3.04 2.39 3.05 2.60 2.66 3.05 3.04Carpenter 2.45 3.16 2.39 3.05 2.80 2.91 3.05 3.00Carpenter Helper 2.03 2.65 1.96 2.51 2.17 2.22 2.06 2.16Cook 2.05 2.79 1.96 2.51 2.43 2.43 2.58 2.48Electrician 2.48 3.16 2.51 3.20 2,94 3.07 3.20 2.99Groundskeeper 1.65 2.05 1.70 2.16 1.94 1.91 2.06 2.03Janitor 1.55 1.99 1.70 2.16 1.84 1.81 2.06 2.03Kitchen Helper 1.63 1.97 1.62 2,06 1.64 1.67 2.16 2.09Laborer 1.59 2.24 1.70 2.16 2.00 2.00 1.96 1.98Painter 2.28 3.05 2.39 3.05 2.80 2.80 3.20 3.11Plumber 2.49 3.42 2.51 3.20 2.82 3.09 3.20 3.14Stock Select. Clk. 2.10 2.81 1.96 2.51 2.28 2.22 2.64 2.48Truck Driver Ab 2.13 2.53 2.06 2.64 2.26 2.31 2.64 2.58Truck Driver Bb 3.02 3.32 2.27 2.91 2.26 2.40 3.05 2.93Watchman (Night) 1.64 2.15 1.78 2.27 1.93 1.95 2.39 2.27Welder 2.50 3.85 2.51 3.20 2.80 2.99 3.36 3,18
Results of sampling 359 private establishments and 10 government agencies employing 105,928 employees or 44.0% of estimated civilian employee population conducted during June-July, 1966. Caution must be exercised in making comparisons due to variations among individual jobs and differences in fringe benefits provided.
a. Average of salary ranges.b. A = Capacity, l1/2- 4 tons; B Capacity, 5 tons and over.SOURCE: Hawaii Employer's Council, Research Report: "Pay Rates in
Hawaii, Private Employment, Government Employment," Special Publication Number 71, September, 1966. (Survey conducted jointly by the Council and the State and Counties' Personnel Services departments.)
50
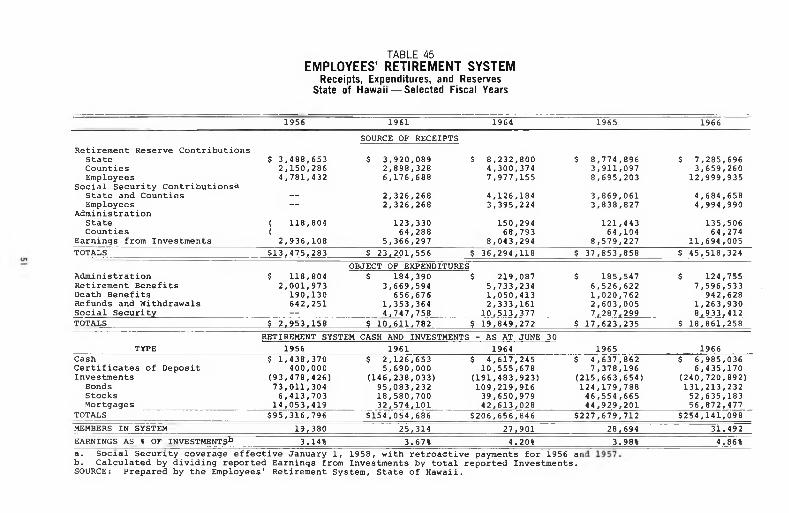
EMPLOYEES’ RETIREMENT SYSTEMReceipts, Expenditures, and Reserves
State of Hawaii — Selected Fiscal Years
TABLE 45
1956 1961 1964 1965 1966SOURCE OF RECEIPTS
Retirement Reserve ContributionsState $ 3,488,653 $ 3,920,089 $ 8,232,800 $ 8,774,896 $ 7,285,696Counties 2,150,286 2,898,328 4,300,374 3,911,097 3,659,260Employees 4,781,432 6,176,688 7,977,155 8,695,203 12,999,935
Social Security Contributions®State and Counties — 2,326,268 4,126,184 3,869,061 4,684,658Employees — 2,326,268 3,395,224 3,838,827 4,994,990
AdministrationState ( 118,804 123,330 150,294 121,443 135,506Counties ( 64,288 68,793 64,104 64,274
Earnings from Investments 2,936,108 5,366,297 8,043,294 8,579,227 11,694,005TOTALS $13,475,283 $ 23,201,556 $ 36,294,118 $ 37,853,858 $ 45,518,324
OBJECT OF EXPENDITURESAdministration $ 118,804 $ 184,390 $ 219,087 $ 185,547 $ 124,755Retirement Benefits 2,001,973 3,669,594 5,733,234 6,526,622 7,596,533Death Benefits 190,130 656,676 1,050,413 1,020,762 942,628Refunds and Withdrawals 642,251 1,353,364 2,333,161 2,603,005 1,263,930Social Security — 4,747,758 10,513,377 7,287.299 8,933,412TOTALS S 2,953,158 $ 10,611.782 $ 19,849,272 $ 17.623,235 $ 18,861,258
RETIREMENT SYSTEM CASH AND INVESTMENTS - AS AT JUNE 30TYPE 1956 1961 1964 1965 1966
CashCertificates of Deposit Investments
Bonds Stocks Mortgages
$ 1,438,370 400,000
(93,478,426) 73,011,304 6,413,703
14,053,419
$ 2,126,653 5,690,000
(146,238,033) 95,083,232 18,580,700 32,574,101
$ 4,617,245 10,555,678
(191,483,923) 109,219,916 39,650,979 42,613,028
$ 4,637,862 7,378,196
(215,663,654) 124,179,788 46,554,665 44,929,201
$ 6,985,036 6,435,170
(240,720,892) 131,213,232 52,635,183 56,872,477
TOTALS $95,316,796 $154,054,686 $206,656,846 $227,679,712 $254,141,098MEMBERS IN SYSTEM 19,380 25,314 27,901 28,694 31,492EARNINGS AS % OF INVESTMENTS^ 3.14% 3.67% 4.20% 3.98% 4.86%a. Social Security coverage effective January 1, 1958, with retroactive payments for 1956 arb. Calculated by dividing reported Earnings from Investments by total reported Investments. SOURCE: Prepared by the Employees' Retirement System, State of Hawaii.

TABLE 46
DIVISION OF HIGHWAYSDepartment of Transportation — State of Hawaii
Revenues and Expenditures — Selected Fiscal Yearsa
1956 1961 1964 1965 1966
Federal-Aid Highways Primary & Secondary $ 2,582,756
REVENUES
$ 4,207,323 $ 6,175,426 $ 4,665,244 $ 4,201,234Interstate & Defense — — 2,434,851 5,371,498 13,920,048Defense Access Roads — — — 1,013,970 - -
County Contributions — — -- — —State Funds
General Fund Cash 175,000 1,031,683 __ __ 424,836Bond Realizations — 5,438 8,109,563 8,563,064 3,024,360Fuel Tax 6,235,924 8,007,739 8,878,577 9,334,297 9,890,042Interest Earned — 652,676 171,076 151,109 163,402Rental of Buildings — 303,733 148,927 114,764 40,399Sale of Condemned Impr. 41,666 12,082 97,637 145,178 51,484Miscellaneous — 21,301 9,297 8,240 15,161
Total $ 9,035,346 $14,241,975 $26,025,354 $29,367,364 $31,730,966
Administration ? 175,557EXPENDITURES
$ 708,524 $ 601,133 $ 530,957 $ 623,4805% Surcharge — 295,195 269,835 293,508 299,890Maintenance 1,389,582 3,386,454 2,764,192 3,088,522 4,073,413Land Acquisition 2,920,112 766,644 1,803,929 4,291,673 2,297,310Design & Construction 6,052,563 11,967,588 11,587,573 15,127,764 18,131,339Interest Paid - - 2,166,236 2,065,944 2,255,312 2,762,620Miscellaneous 167,737 207,440 — — —Total $10,705,551 $19,498,081 $19,092,606 $25,587,736 $28,188,052a. Excludes income from sale of investments and reimbursements and expenditures for investments
purchased. Since bond funds are included, bond principal payments are excluded to eliminate duplication.
SOURCE: Annual Reports of the Department of Public Works, Territory of Hawaii and Department ofTransportation, State of Hawaii. Unpublished data from Fiscal Section, Department ofTransportation, State of Hawaii.

TABLE 47D IV IS IO N OF A IR P O R TS
Department of Transportation — State of HawaiiRevenues and Expenditures — Selected Fiscal Years
1956 1961 1964 1965 1966R EV ENUESa
Fuel Taxb $1,118,893 $ 3,158,455 $1,380,064 $1,621,614 $2,106,689Airport Use F e e s C 61,907 99,952 1,821,460 1,564,754 2,098,890Concession & Other Rentals 357,334 634,063 1,708,633 1,878,539 1,938,230Bond Funds — — 234,560 894,533 —Federal Grants 166,528 532,307 309,278 2,075,178 388,688All Others 246 ,776 1,574 ,599 142,770 238,712 2,027,270TOTAL
Personal Services Other Operating Expenses Capital Outlay Bond Interest Miscellaneous Others
$1,951,438 $ 5,999,376 $5,596,765 $8,273,330 $8,559,767EXPENDITURES'^
579,879430,953860,90923,20037,160
737,221957,935
7,520,468783,15360,273
$1,028,0421,382,8752,138,300
872,628230,542
$1,091,865993,016
2,023,161859,275638,640
$1,258,4871,379,2472,452,301
719,350680,926
TOTAL $1,932,101 $10,059,050 $5,652,387 $5,605,957 $6,490,311a. Excludes advances from Treasurer and investments redeemed; includes general fund
appropriations.b. Rate 31/2= per gallon to 5-21-62, and 1c thereafter,c. Landing fees only through 1962.d. Excludes bond principal payments since expenditures from bond funds are included; also
excludes investments purchased and transfers.SOURCE: Comparative Statements of Receipts and Expenditures (1956), Hawaii Aeronautics
Commission; Consolidated Statement of Receipts and Expenditures, Airports Division, Department of Transportation, State of Hawaii.

TABLE 48
DIVISION OF HARBORSDepartment of Transportation — State of Hawaii
Revenues and Expenditures — Seiected Fiscai Years*
1956 1961 1964 1965 1966REVENUES
Wharfage $ 841,076 $1,188,836 $1,169,019 $1,418,672 $1,673,741Pilotage Fees 112,466 251,654 278,569 251,672 324,885Dockage & Mooring Charges 283,531 413,624 394,679 390,184 480,509Rentals 475,195 862,670 804,564 832,785 906,137Sales of Services & Materials 60,642 165,845 178,401 174,696 237,122Income on Investments 29,541 53,136 205,040 87,536 97,614Miscellaneous^ 6,684 9,230 40,970 42,051 15,060Total Revenues $1,809,135 $2,944,995 $3,071,242 $3,197,596 $3,735,068
EXPENDITURESAdministrationc $ 88,585 $ 250,027 $ 243,397 $ 211,314 S 297,326Harbor Operations 271,766 436,451 641,278 674,673 702,917General Maintenance 140,347 431,127 445,578 461,882 555,729Engineering Services & Overhead 12,523 53,824 50,657 74,306 100,124Retirement Contribution — 53,753 77,474 79,444 93,7055% Surcharge on Gross Receipts 62,317 100,347 90,361 124,257 149,041Interest on Bonded Debt 153,388 268,193 364,837 355,131 345,500Debt Retirement 457,834 258,000 354,875 385,625 369,100Miscellaneousd 81,489 35,023 217,411 277,537 288,323Depreciation 441,921 556,566 575,268 632,748 721,707Total Expenditures $1,710,170 $2,443,311 $3,061,136 $3,276,917 $3,623,472a. Report of the "public undertaking,'* as defined in the resolution authorizing issuance of Harbor Revenue Bonds as all
harbors and waterfront improvements and other properties under the Harbors Division, except those principally used for recreation and landing of fish.
b. Includes permits to operate small power boats, recoveries for damages to property, and sales of utilities, etc.c. Includes contributions to the Department of Transportation for general administrative expenses of the department:
$108,704 in 1966, $136,596 in 1965, and $194,761 in 1964.d. Includes contribution to City and County of Honolulu for operation of fireboat ($30,000 in 1961, $167,423 in 1964,
$208,927 in 1965, and $227,013 in 1966); visitor satisfaction contributions of $49,988 in 1964, $68,610 in 1965, and $47,230 in 1966; and other miscellaneous expenses.
SOURCE: Audit Section, Annual Reports, Board of Harbor Commissioners, Territory and State of Hawaii, July 1, 1956 and 1961;and Accountant's Report, Harbors Division, Department of Transportation, State of Hawaii, Fiscal Years 1964-1966.
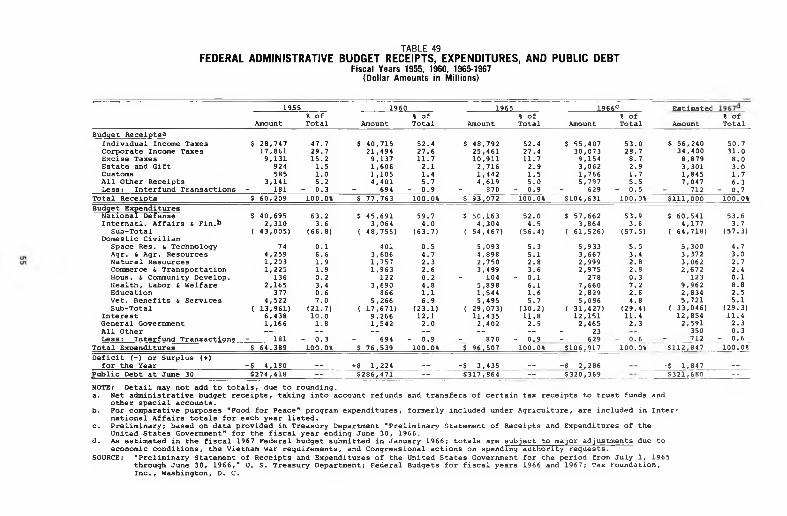
FEDERAL ADMINISTRATIVE BUDGET RECEIPTS, EXPENDITURES, AND PUBLIC DEBTFiscal Years 1955, 1960, 1965-1967
(Dollar Amounts in Millions)
TABLE 49
1955 1960 1965 1966c Estimated% of % of % of % of % of
Amount Total Amount Total Amount Total Amount Total Amount TotalBudqet Receipts^
Individual Income Taxes S 23,747 47.7 S 40,715 52.4 S 48,792 52.4 $ 55,407 53.0 $ 56,240 50.7Corporate Income Taxes 17,861 29.7 21,494 27.6 25,461 27.4 30,073 28.7 34,400 31.0Excise Taxes 9,131 15.2 9,137 11.7 10,911 11.7 9,154 8.7 8,879 8.0Estate and Gift 924 1.5 1,606 2.1 2,716 2.9 3,062 2.9 3,301 3.0Customs 585 1.0 1 ,105 1.4 1,442 1.5 1,766 1.7 1,845 1.7All Other Receipts 3,141 5.2 4,401 5.7 4,619 5.0 5,797 5.5 7,047 6.3Less: Interfund Transactions - 181 -• 0.3 - 694 ■■ 0.9 - 870 •- 0.9 - 629 - 0.5 - 712 - 0.7
Total Receipts s 60,209 100.0« $ 77,763 100.0% S 93,072 100.0% $104,631 100.0% $111,000 100.0%Budqet Expenditures
National Defense $ 40,695 63.2 $ 45,691 59.7 S 50,163 52.0 $ 57,662 53.9 S 60,541 53.6Internatl. Affairs & Fin.b 2,310 3.6 3,064 4.0 4 ,304 4.5 3,864 3.6 4,177 3.7
Sub-Total ( 43,005) (66.8) ( 48,755) (63.7) ( 54,467) (56.4) ( 61,526) (57.5) ( 64,718) (57.3)Domestic Civilian
Space Res. 6 Technology 74 0.1 401 0.5 5,093 5.3 5,933 5.5 5,300 4.7Agr. & Agr. Resources 4,259 6.6 3,606 4.7 4,898 5.1 3,667 3.4 3,372 3.0Natural Resources 1,203 1.9 1,757 2.3 2,750 2.8 2,999 2.8 3,062 2.7Commerce & Transportation 1,225 1.9 1,963 2.6 3,499 3.6 2,975 2.8 2,672 2.4Hous. & Community Develop. 136 0.2 122 0.2 - 104 •- 0.1 278 0.3 123 0.1Health, Labor & Welfare 2,165 3.4 3,690 4.8 5,898 6.1 7,660 7.2 9,962 8.8Education 377 0.6 866 1.1 1,544 1.6 2,829 2.6 2,834 2.5Vet. Benefits & Services 4,522 7.0 5,266 6.9 5,495 5.7 5,086 4.8 5,721 5.1Sub-Total ( 13,961) (21.7) ( 17,671) (23.1) ( 29,073) (30.2) ( 31,427) (29.4) ( 33,046) (29.3)
Interest 6,438 10.0 9,266 12.1 11,435 11.8 12,151 11.4 12,854 11.4General Government 1,166 1.8 1,542 2.0 2,402 2.5 2,465 2.3 2,591 2.3All Other — — — — — — - 23 350 0.3Less: Interfund Transactions - 181 ■- 0.3 - 694 -- 0.9 - 870 •- 0.9 - 629 - 0.6 - 712 - 0.6
Total Expenditures $ 64.389 100.0% $ 76,539 100.0% 5 96.507 100.0% $106,917 100.0% $112,847 100.0%"Deficit (-) or Surplus {+)
for the Year -$ 4,180 — +s 1,224 — -s 3,435 — -S 2,286 -$ 1,847 --Public Debt at June 30 $274,418 " $286,471 -- $317,864 — ___ 5320,369__ , ;_ 8321,680 --NOTE: Detail may not add to totals, due to rounding.a. Net administrative budget receipts, taking into account refunds and transfers of certain tax receipts to trust funds and
other special accounts.b. For comparative purposes "Food for Peace" program expenditures, formerly included under Agriculture, are included in Inter
national Affairs totals for each year listed.c. Preliminary; based on data provided in Treasury Department "Preliminary Statement of Receipts and Expenditures of the
United States Government" for the fiscal year ending June 30, 1966.d. As estimated in the fiscal 1967 Federal budget submitted in January 1966; totals are subject to major adjustments due to
economic conditions, the Vietnam war requirements, and Congressional actions on spending authority requests.SOURCE: "Preliminary Statement of Receipts and Expenditures of the United States Government for the period from July 1, 1965
through June 30, 1966," U. S. Treasury Department; Federal Budgets for fiscal years 1966 and 1967; Tax Foundation, Inc., Washington, D. C.
THE LONG TERM PUBLIC BONDED DEBT
HAWAII STATE AND COUNTIESTotal public debt in Hawaii amounted to $412.3 million outstand
ing at December 31, 1966 (page 58). Of this total, $344.3 million are general obligation bonds chargeable to the general revenues of the state and/or counties. The other $68.0 million are revenue bonds, financed from special earmar)ced receipts such as, airport realizations, fuel tax and highway and harbor revenues. Water utilities, multi-declc and off-street parking, and University housing receipts were also included, but Hawaii Housing Authority revenue bonds (guaranteed by the federal government) and Honolulu Improvement District bonds payable from special assessments to property owners are excluded.
Hawaii's debt burden, state and local, continues to increase (page 57). At June 30, 1965, Hawaii's per capita outstanding debt totalled $674 - higher than all but five other states. As a percentage of per capita personal income, Hawaii's debt equaled 23% of income. By this measure, Hawaii ranks sixth in the nation. Hawaii's debt amounted to 226% of total state and county tax collections, ran)cing the State loth highest.STATE OF HAWAII
Hawaii's constitutional debt limit is $60 million, but by a two- thirdi majority vote, the legislature is able to incur a funded debt up to a maximum of 15% of the State's net assessed real property valuations. Subject to this limitation are all outstanding and authorized but unissued general obligation debt, and territorial highway and airport revenue bonds issued prior to statehood. In 1966, the 15% limit was $460.4 million (page 60, footnote b).
Funded debt at December 31, 1966 stood at $378.7 million. Thiswas 12.3% of 1966 real property valuations (page 60). There were $217.7 million outstanding general obligations - $94.5 million or 43% are financed from the general revenues of the State. Another $24.7 million will be repaid from county funds, while principal and interest charges on the remaining $98.5 million are repaid from special fund realizations. Authorized but unissued bonds totalled $161.0 million (page 60).
State revenue bonds outstanding totalled $12.4 million. Harbor bonds amounted to $10.4 million. University of Hawaii bonds issued for housing and dormitories $1.4 million, and multi-dec)c par)cing facilities for public employees $0.8 million.THE COUNTIES
A county debt limit equal to 10% of net assessed property valuations withxn the county is set by the State Constitution. Additionally, the counties may not exceed 2% of net valuations in contracted debt during a single fiscal year.
General obligation debt of the four counties at December 31, 1966 amounted to $165.4 million in outstanding issues (page 61). Included were $140.7 million in county bonds and $24.7 million in bonds issued by the state for the counties. The latter are chargeable to the counties. An additional $28.8 million in bonds have been authorized but not issued.
County revenue bonds, issued and outstanding, included $40.6 million in water bonds, and $0.7 million in Honolulu off-street parlcing bonds (page 61).
56

STATE AND LOCAL LONG-TERM DEBTRelated to Population, Personal Income, and Tax Collections
Debt Outstanding at June 30, 1965— By States
TABLE 50
state
Per Cap. Debt as a % of Per Cap. Per Capita Debt Personal Income Tax CollectionsAmount Rank Percent Rank Percent Rank
HAWAII $ 673.59 23.40 226,11 10U. S. Average® 486.04 17.70 182.65AlabamaAlaskaArizonaArkansasCaliforniaColoradoConnecticutDelawareFloridaGeorgiaIdahoIllinoisIndianaIowaKansasKentuckyLouisianaMaineMarylandMassachusettsMichiganMinnesotaMississippiMissouriMontanaNebraskaNevadaNew HampshireNew JerseyNew MexicoNew YorkNorth CarolinaNorth DakotaOhioOklahomaOregonPennsylvaniaRhode IslandSouth CarolinaSouth DakotaTennesseeTexasUtahVermontVirginiaWashingtonWest VirginiaWisconsinWyomingDist, of Columbia
359.66 758.10412.08263.47586.82 478.97 674.36
1,075.02477.43362.81218.66 430.14281.92197.78407.05449.92 544.64 270.21 630.51 583.74 455.13 441.56 313.68303.05 339.28491.66 542.76315.09477.09 358.80 825.72 221.84 266.62 369.38 444.89480.47515.66 447.46211.79 128.00 453.86471.83 366.31 300.03 340.33
1,151.77293.63345.30412.80 257.35
324
2745 8
155 2
16 314825425028 21 1043 7 9
19 2438393613 11371733 3
474429 2314 12 22495120183040 351
41342646
18.8323.79 17.39 14.28 18.0117.6719.8331.6919.7016.80 9,13
13.11 9,91 7,39
15.422 2 . 0 026.3511.87 21.0119.1415.12 16.56 19.5111.38 13.9218.7016.39 12,37 14.7416.36 25.1910.8711.7013.06 19.4417.40 18.77 15.85 11.475.78
22.55 20.1815.55 12.9814.07 39.63 14,4912.6816.14 6.94
165
22341920 112
122348 37 4749 30
42 9
1531241345 36 1825 413226 4
46433814 21 17 2844 517
102939 35
13340 27 50
214.66 303.48154.66 165.22 154,72 164.07 231.71355.91204.90 190.2189.15
161.52109.62 71.68
148.92257.26 245.29115.88241.52193.27 157.13147.56184.64 136.10 128.09 223.74168.65142.61 177.59147.56221.91 117.81 107.37163.98 206.03 171.16 210.43 170.31 131.6953.18
254.63227.88 143.87107.99 180.85 391.68 152.96111.56148.62 89.24
133
3125 3026 8 2
161849 284550334 6
43 7
172935193941 11 24 38 2136 124247 27 15 2214 2340515 9
374620 1
32443448
a. U. S. average includes 50 states and District of Columbia.SOURCE: Governmental Finances in 1964-65 (June, 1966); and Survey of
Current Business, August, 1966, U. S. Department of Commerce.
57
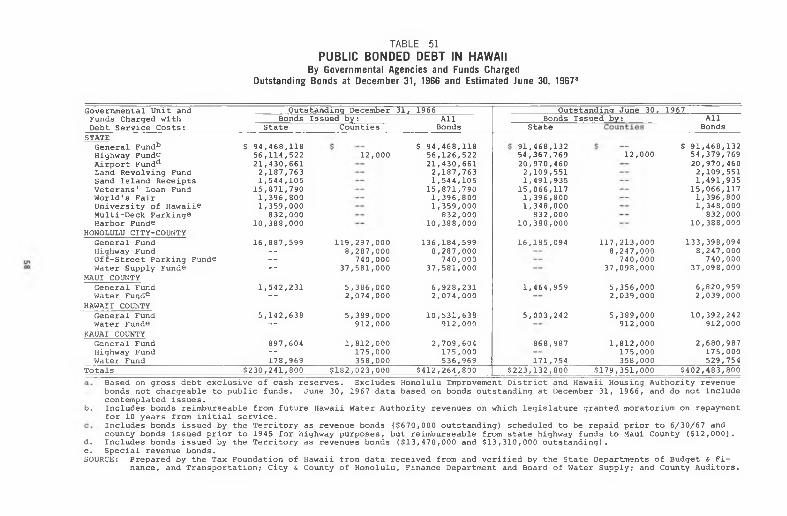
TABLE 51
PUBLIC BONDED DEBT IN HAWAIIBy Governmental Agencies and Funds Charged
Outstanding Bonds at December 31, 1966 and Estimated June 30, 1967^
Outstanding June 30, 1967Governmental Unit and Funds Charged with Debt Service Costs:
Outstanding December 31, 1966Bonds Issued by;
State CountiesAllBonds
Bonds Issued by;State
AllBonds
STATEGeneral Fund^ $ 94,468,118Highway Fundc 56,114,522Airport Fund^ 21,430,661Land Revolving Fund 2,187,763Sand Island Receipts 1,544,105Veterans' Loan Fund 15,871,790World's Fair 1,396,800University of Hawaii© 1,359,000Multi-Deck Parking© 832,000Harbor Fund© 10,388,000
HONOLULU CITY-COUNTYGeneral Fund 16,887,599Highway Fund —Off-Street Parking Fund© —Water Supply Fund© -
MAUI COUNTYGeneral Fund 1,542,231Water Fund® -
HAWAII COUNTYGeneral Fund 5,142,638Water Fund© —
KAUAI COUNTYGeneral Fund 897,604Highway Fund —Water Fund_________________________ 178,969
12,000
119,297,0008.287.000
740.000 37,581,000
5.386.0002.074.000
5.389.000912.000
1.812.000175.000358.000
$ 94,468,118 56,126,522 21,430,661 2,187,763 1,544,105
15,871,790 1,396,8001.359.000
832.00010.388.000
136,184,5998.287.000
740.00037.581.000
6,928,2312.074.000
10,531,638912.000
2,709,604175.000 536,969
91,468,13254,367,76920,970,4602,109,5511,491,935
15,066,1171,396,8001,348,000
832,00010,388,000
16,185,094
1,464,959
5,003,242
868,987
171,754
12,000
117,213,0008.247.000
740.000 37,098,000
5.356.0002.039.000
5.389.000912.000
1.812.000175.000358.000
Totals $230,241,800 $182,023,000 $412,264,800 $223,132,800 $179,351,000
S 91,468,132 54,379,769 20,970,460 2,109,551 1,491,935
15,066,117 1,396,8001.348.000
832.00010.388.000
133,398,0948.247.000
740.00037.098.000
6,820,9592.039.000
10,392,242912.000
2,680,987175.000 529,754
$402,483,800Based on gross debt exclusive of cash reserves. Excludes Honolulu Improvement District and Hawaii Housing Authority revenue bonds not chargeable to public funds. June 30, 1967 data based on bonds outstanding at December 31, 1966, and do not include contemplated issues.Includes bonds reimburseable from future Hawaii Water Authority revenues on which legislature granted moratorium on repayment for 10 years from initial service.Includes bonds issued by the Territory as revenue bonds {$670,000 outstanding) scheduled to be repaid prior to 6/30/67 and county bonds issued prior to 1945 for highway purposes, but reimburseable from state highway funds to Maui County ($12,000). Includes bonds issued by the Territory as revenues bonds ($13,470,000 and $13,310,000 outstanding),
e. Special revenue bonds.SOURCE: Prepared by the Tax Foundation of Hawaii from data received from and verified by the State Departments of Budget & Fi
nance, and Transportation; City & County of Honolulu, Finance Department and Board of Water Supply; and County Auditors.
b.
d.
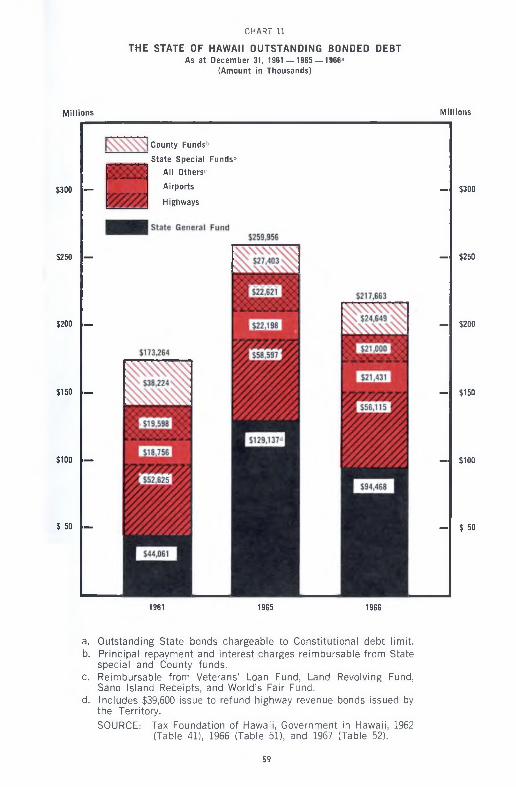
THE STATE OF HAWAII OUTSTANDING BONDED DEBTAs at D ecem ber 31, 1961 — 1965 — 1966“
(A m oun t in T housands )
CHART 11
M illio n s M ill io n s
$300 —
$250 —
$ 2 0 0 —
$150 —
$ 1 0 0 —
$ 50 —
County Funds"
_ S tate S p ec ia l Funds"
A ll Others"
A irports
H ighw ays
— $300
— $250
— $200
— $150
— $100
- $ 50
1961 1965 1966
a. Outstanding State bonds chargeable to Constitutional debt lim it.
b. Principal repayment and interest charges reimbursable from State special and County funds.
c. Reimbursable from Veterans’ Loan Fund, Land Revolving Fund, Sand Island Receipts, and World’s Fair Fund.
d. Includes $39,600 issue to refund highway revenue bonds issued by the Territory.
SOURCE: Tax Foundation of Hawaii, Government in Hawaii, 1962 (Table 41), 1966 (Table 51), and 1967 (Table 52).
59
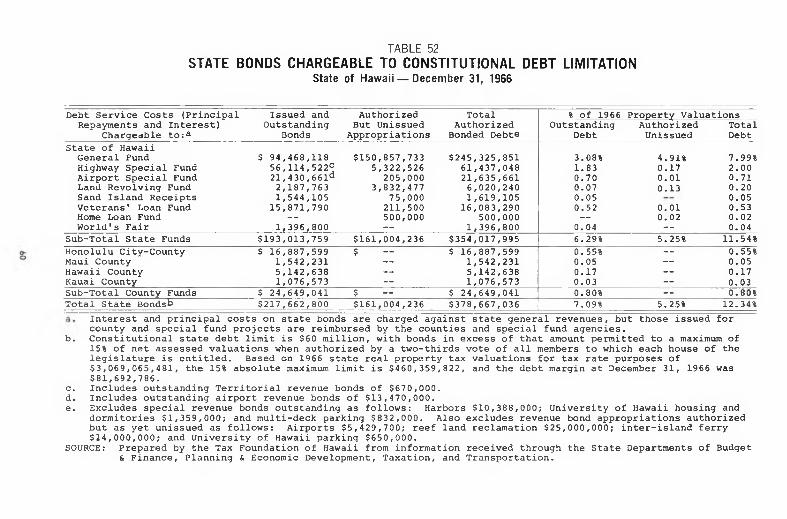
STATE BONDS CH ARG EABLE TO CONSTITUTIONAL DEBT LIMITATIONState of H aw a ii — Decem ber 31, 1966
TABLE 52
Debt Service Costs (Principal Issued and Repayments and Interest) Outstanding
Chargeable to:a Bonds
Authorized But Unissued
Appropriations
Total Authorized
Bonded Debte
% of 1966 Property Valuations Outstanding Authorized Total
Debt Unissued DebtState of Hawaii
General Fund $ 94,468,118 $150,857,733 $245,325,851 3.08% 4.91% 7.99%Highway Special Fund 56,114,522c 5,322,526 61,437,048 1.83 0.17 2.00Airport Special Fund 21,430,661d 205,000 21,635,661 0.70 0.01 0.71Land Revolving Fund 2,187,763 3,832,477 6,020,240 0.07 0.13 0.20Sand Island Receipts 1,544,105 75,000 1,619,105 0.05 0.05Veterans' Loan Fund 15,871,790 211,500 16,083,290 0.52 0.01 0.53Home Loan Fund — 500,000 500,000 — 0.02 0.02World's Fair 1,396,800 — 1,396,800 0. 04 — 0.04
Sub-Total State Funds $193,013,759 $161,004,236 $354,017,995 6.29% 5.25% 11.54%Honolulu City-County $ 16,887,599 $ — $ 16,887,599 0.55% -- 0.55%Maui County 1,542,231 — 1,542,231 0.05 — 0.05Hawaii County 5,142,638 — 5,142,638 0.17 — 0.17Kauai County 1,076,573 — 1,076,573 0.03 — 0.03Sub-Total County Funds $ 24,649,041 $ — $ 24,649,041 0.80% — 0.80%Total State Bondsb $217,662,800 $161,004,236 $378,667,036 7.09% 5.25% 12.34%
Interest and principal costs on state bonds are charged against state general revenues, but those issued for county and special fund projects are reimbursed by the counties and special fund agencies.Constitutional state debt limit is $60 million, with bonds in excess of that amount permitted to a maximum of 15% of net assessed valuations when authorized by a two-thirds vote of all members to which each house of thelegislature is entitled. Based on 1966 state real property tax valuations for tax rate purposes of$3,069,065,481, the 15% absolute maximum limit is $460,359,822, and the debt margin at December 31, 1966 was $81,692,786.
o. Includes outstanding Territorial revenue bonds of $670,000.d. Includes outstanding airport revenue bonds of $13,470,000.e. Excludes special revenue bonds outstanding as follows: Harbors $10,388,000; University of Hawaii housing and
dormitories $1,359,000; and multi-deck parking $832,000. Also excludes revenue bond appropriations authorized but as yet unissued as follows: Airports $5,429,700; reef land reclamation $25,000,000; inter-island ferry$14,000,000; and University of Hawaii parking $650,000.
SOURCE: Prepared by the Tax Foundation of Hawaii from information received through the State Departments of Budget& Finance, Planning s Economic Development, Taxation, and Transportation.
b.

TABLE 53COUNTY GENERAL OBLIGATION BONOS
state of Hawaii — By Counties: December 31, 1966
Amount of General Obligation DebtDebt as a % of
Net Assessed ValuesDescription Honolulu Maui Hawaii Kauai All Counties Honolulu Maui Hawaii Kauai
Issued and Outstanding State Bonds© $ 16,887,599 $ 1,542,231 $ 5,142,638 S 1,076,573 $ 24,649,041 0.65 0.88 2.49 1.26
County Bonds 127,584,000 5,398,000^ 5,389,000 2,345,000 140,716,000 4.90 3.08 2.61 2.74
TOTAL COUNTY BONDED DEBTb $ 144,471,599 S 6,940,231 $ 10,531,638 $ 3,421,573 $ 165,365,041 5.55 3.96 5.10 4.00
AUTHORIZED-UNISSUED DEBT $ 28,425,800 S — $ 291,000 $ 50,000 $ 28,766,800 1.10 — 0.14 0.06
Total Authorized Debt
State Issues $ 16,887,599 $ 1,542,231 $ 5,142,638 $ 1,076,573 $ 24,649,041 0.65 0.88 2.49 1.26
County Issues 156,009,800 5,398,000 5,680,000 2,395,000 169,482,800 6.00 3.08 2.75 2.80
TOTAL AUTHORIZED DEBT $ 172,897,399 $ 6 ,940,231 $ 10,822,638 $ 3,471,573 $ 194,131,841 6.65 3.96 5.24 4.06
Debt Limits and Margins
1966 Property Values $2 ,601,522,866 $175,253,711 $206,693,311 $85,595,593 $3,,069,065,481 — — —
Const. Debt Limit® 260,152,287 17,525,371 20,669,331 8,559,559 306,906,548 — — — —
Debt Charged to Limit 127,584,000 5,398,000 5,389,000 2,345,000 140,716,000 4.90 3.08 2.61 2.74
DEBT MARGIN $ 132,568,287 $ 12,127,371 S 15,280,331 $ 6,214,559 $ 166,190,548 5.10 6.92 7.39 7.26
a. State bonds issued for county purposes are reimburseable to the state general fund by each respective county.b. Based on gross debt exclusive of cash reserves. Additional bonds outstanding include: Honolulu Water Supply revenue bonds
$37,581,000 and off-street parking revenue bonds $740,000; and water revenue bonds of Maui County $2,074,000 and Hawaii County $912,000.
c. State Constitution limits debt to 10% of net assessed property valuations in each county.d. Includes $12,000 for highway purposes issued prior to 1945 but reimburseable from state funds.
SOURCE: Prepared by the Tax Foundation of Hawaii from details received from and verified by the City and County Finance Department and Board of Water Supply, and County Auditors.

Percent
TRENDS IN LONG TERM BONDED DEBTState of Hawaii and Counties^
O utstanding as at December 31, 1956- 1966
CHART 12
Percent
356
300
200
150
1956 1957 1958 1963 1964 1966
a. Inc ludes genera l ob ligations and territoria l h ighway and airport revenue bonds. M au i and Kauai County bonds issued prior to 1945 for highways inc luded in State data.
b. State funded debt exclusive of $39,600,000 re fund ing issue for territoria l h ighway revenue bonds.
SOURCE: Department of Budget and F inance, State of H aw aii;City and County of Hono lu lu F inance Department; County Auditors.
62

INDEX TO TABLES AND CHARTS — GOVERNMENT IN HAWAII 1967
Airline Tax (See Public Service Co.)Airport Finances......................Alcoholic Beverage Tax (See Liquor)
Banlc Deposits in Hawaii............... 5,Bonds (See Debt)
Comparative Data, by StatesCorporate Income Tax Rates............ 31Debt, Long-Term Bonded................ 57Employees, Public...................... 13Expenditures, Per Capita.............. 44Income, Per Capita Personal........... 11Liquid Fuel Tax........................ 25Liquor Tax........ 25Personal Net Income Tax............... 30Salaries, Classroom Teachers.......... 48Salaries, Public Employees............ 49State and Local Sales Tax............. 24Tax Burden............................. 34Teacher-Pupil Ratios................... 47Tobacco Tax............................ 25
Contracting......................... 5, 8,20Conveyance Tax 3 3Corporate Income Tax........... 14-19,31,32Cost of Living - Hawaii................. 5County Information
Allocation of Taxes................ 19-20Bank Deposits (Demand)................ 8Bonded Debt......................... 56-62Employment............................. 8Expenditures.................. 8,36,41-43Fuel Tax Collections.................. 26Liquor License Revenues....... 18-19,22-23Motor Vehicle Registrations........... 8Motor Vehicle Weight Tax.. 14,18,21-23,32Personal Income, Per Capita..... 8,10,11Population............................ 7, 8Real Property Data......... 8,21-23,27-29Revenues.................. 14,15,18,20-23State Grants-in-Aid.......... 20,22-23,32Sugar Income........................... 8Unemployment Rate...................... 8
D
DebtBurden.............................. 56,57County..................... 56,58,59,61,62Federal................................. 55General Information.................... 56Limitations...................... 56,60,61State and Local Per Capita............ 57Trends................................ 6,62
E
Earmarked Taxes in Hawaii............... 14Economy of Hawaii
County Statistics...................... 8General Information.................... 4State Growth........................... 5
EducationClassroom Teachers’ Salaries.......... 48Enrollment in Hawaii.................. 45Expenditures................. 37-39,44,47Pupil-Teacher Ratios.................. 47University of Hawaii.................. 46
EmploymentBy Industry............................ 12Civilian Labor Force.......... 4, 5, 8,12Government.......................... 12,13Trends.............................. CoverUnemployed..................... 4, 5, 8,12
Estate Taxes....................... 18,19,33Excise Taxes..................... 16-20,25,26
Direct General, Per Capita.... 44Federal Government............ 55
53 General Information........... 36Hawaii, County of............., .. 39 ,43Honolulu, City and County---- ... 39 ,42Kauai, County of............. 39 ,43Maui, County of............... , . . 39 ,42
8 State of Hawaii.............. ., , , 36 ,39Tourist........................ 5
Expenditures
Federal GovernmentAdministrative Budget................. 55Debt.................................... 55Employment in Hawaii............ 12,CoverGrants to Hawaii............. 16,17,35,52Military Expenditures 4, 5Tax Collections in Hawaii............. 35
Financial InstitutionsBank Deposits 5, 8Tax............................... 18,19,33
Food, States Taxing...................... 24Franchise Tax (See Public Utility)Fuel Tax (See Liquid Fuel Tax)
General Excise Tax............. 20,21,23,32General Fund Finances................ 40Government Costs by County..... 8,39,41-43
H
Harbor Finance........................... 54Hawaii, County of
Bonded Debt...................... 58,61,62Expenditures..................... 39,41,43General Excise Tax..................... 20Liquid Fuel Tax........................ 26Per Capita Personal Income.......... 8,10Population Trends...................... 9Real Property Tax.................... 27-29Revenues............................ 21,23Taxes, Total........................... 19
Health ExpendituresCounty........................... 39,41-43Per Capita, by State................... 44State of Hawaii..................... 37-39
Highways....................... 37-39,44 ,52Home Exemption (See Real Property)Honolulu, City and Countv of
Bonded Debt...................... 58,61,62Expenditures..................... 39,41,42General Excise Tax..................... 20Liquid Fuel Tax........................ 26Per Capita Personal Income.......... 8,10Population Trends...................... 7Real Property Tax.................... 27-29Revenues.............................. 21,22Taxes, Total........................... 19
Income, PersonalPer Capita, by State.................... 11Per Capita, by County................. 8,10Sources of............................. 9Trends.................................. 6
Income TaxCorporate................. 15-19,31,33,35Credits................................. 33Personal............ 15,16,18,19,30,33,35Rates............................ 30,31,33
Inheritance Tax.................... 18,19,33Insurance Tax...................... 18,19,32
Kauai, County of Bonded Debt.... 58,61,62
63
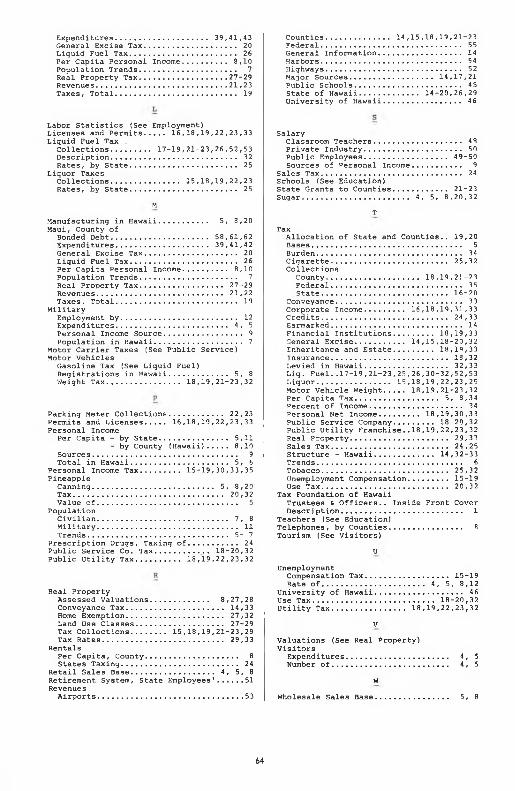
Expenditures..................... 39,41,43General Excise Tax..................... 20Liquid Fuel Tax........................ 26Per Capita Personal Income.......... 9,10Population Trends...................... 7Real Property Tax.................... 27-29Revenues.............................. 21,23Taxes, Total........................... 19
Labor Statistics (See Employment)Licenses and Permits.... 16,18Liquid Fuel Tax
Collections......... 17-19,21Description..................Rates, by State..............
Liquor TaxesCollections............... 15Rates, by State..............
19,22,23,33
23,26,52,53........ 32........ 25
18,19,22,23 ........ 25
MManufacturing in Hawaii............ 5, 8,20Maui, County of
Bonded Debt...................... 58,61,62Expenditures..................... 39,41,42General Excise Tax..................... 20Liquid Fuel Tax........................ 26Per Capita Personal Income.......... 8,10Population Trends...................... 7Real Property Tax.................. 27-29Revenues............................ 21,22Taxes, Total........................... 19
MilitaryEmployment by.......................... 12Expenditures 4, 5Personal Income Source................. 9Population in Hawaii.................... 7
Motor Carrier Taxes (See Public Service) Motor Vehicles
Gasoline Tax (See Liquid Fuel)Registrations in Hawaii 5, 8Weight Tax................ 18,19,21-23,32
Parking Meter Collections............ 22,23Permits and Licenses 16,18,19,22,23,33Personal Income
Per Capita - by State............... 5,11- by County (Hawaii) 8,10
Sources................................. 9Total in Hawaii 5, 6
Personal Income Tax......... 15-19, 30,33,35Pineapple
Canning........................... 5, 8,20Tax.................................. 20,32Value of................................ 5
PopulationCivilian 7, 8Military................................ 11Trends 5- 7
Prescription Drugs, Taxing of......... 24Public Service Co. Tax............ 18-20,32Public Utility Tax.... 18,19,22,23,32
Real PropertyAssessed Valuations............. 8,27,28Conveyance Tax...................... 14,33Home Exemption...................... 27,32Land Use Classes.................... 27-29Tax Collections........ 15,18,19,21-23,29Tax Rates........................... 29,33
RentalsPer Capita, County..................... 8States Taxing.......................... 24
Retail Sales Base.................. 4, 5, 8Retirement System, State Employees' 51Revenues
Airports................................. 53
Counties.............. 14,15,18,19,21-23Federal................................ 55General Information.................. 14Harbors................................ 54Highways.............................. 52Major Sources................... 14,17,21Public Schools........................ 45State of Hawaii............. 14-20,26,29University of Hawaii................. 46
SalaryClassroom Teachers.................... 48Private Industry...................... 50Public Employees................... 49-50Sources of Personal Income........... 9
Sales Tax............................... 24Schools (See Education)State Grants to Counties............ 21-23Sugar........................ 4, 5, 8,20,32
T
TaxAllocation of State and Counties.. 19,20Bases....................... 5Burden................................. 34Cigarette.......................... 25,32Collections
County..................... 18,19,21-23Federal.............................. 3 5State............................ 16-20
Conveyance............................ 3 3Corporate Income......... 16,18,19,31,33Credits............................ 24,33Earmarked........................ 14Financial Institutions......... 18,19,33General Excise........... 14,15,18-20,32Inheritance and Estate......... 18,19,33Insurance.......................... 18,32Levied in Hawaii.................. 32,33Liq. Fuel..17-19,21-23,25,26,30-32,52,53Liquor................ 15,18,19,22,23,25Motor Vehicle Weight 18,19,21-23,32Per Capita Tax.................. 5, 8,34Percent of Income..................... 34Personal Net Income......... 18,19,30,33Public Service Company......... 18-20,32Public Utility Franchise..18,19,22,23,32Real Property...................... 29,33Sales Tax.......................... 24,25Structure - Hawaii............. 14,32-33Trends................................. 6Tobacco............................ 25,32Unemployment Compensation......... 15-19Use Tax............................ 20,32
Tax Foundation of HawaiiTrustees & Officers.. Inside Front CoverDescription........................... 1
Teachers (See Education)Telephones, by Counties................ 8Tourism (See Visitors)
UUnemployment
Compensation Tax................... 15-19Rate of....................... 4, 5, 8,12
University of Hawaii.................... 46Use Tax........................... 18-20,32Utility Tax................ 18,19,22,23,32
V
Valuations (See Real Property)Visitors
Expenditures........................ 4, 5Number of...... .................... 4 , 5
W
Wholesale Sales Base............. 5, 8
64
T A X FOUNDATION OF H A W A II 551 A lexander Young Building
Honolulu, Hawaii 9 6 8 1 3
Non-Profit Organization
U. S. POSTAGE
P A I DHonolulu, Hawaii
PERMIT NO . 609
RALPH IKEDADEPT OF PLANNING & RESEARCH426 S QUEEN STHONOLULU HAWAII 96813