Government Financial Reporting
31
CHAPTER 3 Government Financial Reporting I n Chapter 2 we discussed the reasons why governments use fund accounting and we described the purposes of the funds that they maintain. In Chapters 4 through 10 we shall examine the principal transactions of the various types of funds. Our goal in this chapter is to provide a broad understanding of the purpose, form, and general content of the basic financial statements that are required by generally accepted ac- counting principles (GAAP). The basic financial statements are the end product of the accounting system. Armed with an overview of the end product, students should find it easier to appreci- ate the discussions in the next few chapters. Those chapters should fill in the blanks concerning how information is selected and recorded in the various funds and how recorded information is summarized for external reporting. In Chapter 11 we shall address additional reporting issues, including the scope of the reporting entity (e.g., which affiliated organizations should be included in a gov- ernment’s report) and supplementary information included in a government’s com- prehensive annual financial report (CAFR). In Chapter 14 we shall discuss the elements of financial statement analysis. The illustrative financial statements in this and subsequent chapters are from the CAFR of the City of Orlando, Florida, for the fiscal year ended September 30, 2001. 1 HOW CAN FUNDS BE COMBINED AND CONSOLIDATED? As discussed in Chapter 2, fund accounting provides accountability for, and control of, public moneys. Each fund is a separate fiscal and accounting entity with its own self- balancing set of accounts. Thus, financial statements, such as a balance sheet and a statement of revenues and expenditures or expenses, can be prepared for each individ- ual fund. However, governments may maintain hundreds of funds. A way is needed to summarize fund information for financial reporting so that the reports are of a man- ageable size but still provide useful information, including the restrictions on re- sources that funds represent. One possibility is simply to combine or aggregate the funds—add them together without adjusting for interfund activities and balances. An- other is to consolidate the funds—add them together, but eliminate interfund activities 39 1 Students can learn more about Orlando and its financial reporting by accessing the city’s Web site at www.cityoforlando.net/admin/accounting/reports.htm and clicking on “CAFR 2001.” The management’s dis- cussion and analysis in Orlando’s 2001 CAFR provides an introduction to and overview of the financial statements discussed in this and subsequent chapters.
Transcript of Government Financial Reporting

C H A P T E R 3
Government FinancialReporting
In Chapter 2 we discussed the reasons why governments use fund accounting andwe described the purposes of the funds that they maintain. In Chapters 4 through
10 we shall examine the principal transactions of the various types of funds. Our goalin this chapter is to provide a broad understanding of the purpose, form, and generalcontent of the basic financial statements that are required by generally accepted ac-counting principles (GAAP).
The basic financial statements are the end product of the accounting system.Armed with an overview of the end product, students should find it easier to appreci-ate the discussions in the next few chapters. Those chapters should fill in the blanksconcerning how information is selected and recorded in the various funds and howrecorded information is summarized for external reporting.
In Chapter 11 we shall address additional reporting issues, including the scope ofthe reporting entity (e.g., which affiliated organizations should be included in a gov-ernment’s report) and supplementary information included in a government’s com-prehensive annual financial report (CAFR). In Chapter 14 we shall discuss theelements of financial statement analysis.
The illustrative financial statements in this and subsequent chapters are from theCAFR of the City of Orlando, Florida, for the fiscal year ended September 30, 2001.1
HOW CAN FUNDS BE COMBINED AND CONSOLIDATED?
As discussed in Chapter 2, fund accounting provides accountability for, and control of,public moneys. Each fund is a separate fiscal and accounting entity with its own self-balancing set of accounts. Thus, financial statements, such as a balance sheet and astatement of revenues and expenditures or expenses, can be prepared for each individ-ual fund. However, governments may maintain hundreds of funds. A way is needed tosummarize fund information for financial reporting so that the reports are of a man-ageable size but still provide useful information, including the restrictions on re-sources that funds represent. One possibility is simply to combine or aggregate thefunds—add them together without adjusting for interfund activities and balances. An-other is to consolidate the funds—add them together, but eliminate interfund activities
39
1Students can learn more about Orlando and its financial reporting by accessing the city’s Web site atwww.cityoforlando.net/admin/accounting/reports.htm and clicking on “CAFR 2001.” The management’s dis-cussion and analysis in Orlando’s 2001 CAFR provides an introduction to and overview of the financialstatements discussed in this and subsequent chapters.

40 CHAPTER 3 / GOVERNMENT FINANCIAL REPORTING
and balances—and prepare financial statements for the government as a single eco-nomic entity. Traditionally, government financial reporting standards required thefirst solution. However, as we shall see, the current standards incorporate both solu-tions to some extent.
PRE-1999 REPORTING MODEL For many decades, governments prepared fi-nancial statements with multiple columns—one for each fund type. For example, acombined statement for governmental funds generally included a column for thegeneral fund, a second column for all special revenue funds combined, and othercolumns for, respectively, all capital projects funds and all debt service funds com-bined. A combined balance sheet for all fund types included columns for each gov-ernmental, proprietary, and fiduciary fund type. It also included additionalcolumns to provide information about general fixed assets and long-term debt,which, as previously discussed, are not recorded in any governmental fund.
Unlike a consolidated statement, a combined financial statement does noteliminate activity and balances between funds and fund types, such as interfund re-ceivables, payables, and transfers. Thus, although a “totals” column was providedon most statements, some totals were overstated from the perspective of the gov-ernment as a single economic entity. As a result, users could not readily obtain apicture of the government’s financial position and results of operations and wereimpeded from comparing one government with another. Moreover, because thestatements presented combined information for multiple funds of a similar type,information for the more significant funds could be offset or obscured by informa-tion for the less significant funds. Thus, comparative analysis was made still moredifficult.
WHAT IS GASB STATEMENT NO. 34?
CURRENT REPORTING MODEL Upon its establishment in 1984, the GASB under-took to develop a new reporting model that would address some of the problems offund-based reporting that had evolved over many decades. After years of considerableand often controversial debate, a final pronouncement (Statement No. 34, Basic Finan-cial Statements—and Management’s Discussion and Analysis—for State and Local Govern-ments) was issued in June 1999. The statement required governments to implementthe new standards for fiscal years beginning after June 15, 2001, 2002, or 2003, de-pending on the government’s size. Thus, by the time this text is in use, most govern-ments should have implemented the new model. Orlando’s financial statements, usedas illustrations in this text, incorporate most of the requirements of Statement No.34.
Much of the debate over the new model centered on whether governmentsshould continue to prepare fund-based financial statements or, instead, should pre-sent consolidated financial statements for the government as a whole. An importantpart of this debate was whether the statements should focus on current financial re-sources (as did the previous model), total financial resources, or all economic re-sources (including capital assets).
The GASB concluded that the objectives of financial reporting established inConcepts Statement No. 1 could not all be achieved with either fund-based reportingor consolidated financial statements alone; nor could they all be achieved with a sin-gle measurement focus and basis of accounting. For example, recall the discussion inChapter 1 as to the conflict between the objectives of reporting on budgetary and fis-
cal compliance as opposed to reporting on interperiod equity. Realization of thecompliance objective requires financial statements prepared on a budget or near-budget basis (i.e., a cash basis or a modified accrual basis). By contrast, fulfillment ofthe interperiod equity objective requires financial statements on a full accrual basiswith a focus on economic resources.
FISCAL VERSUS OPERATIONAL ACCOUNTABILITY According to ConceptsStatement No. 1, the overriding objective of all financial reporting is accountability.The GASB concluded that accountability has different forms that reflect variationsin users’ information needs. Traditionally, governmental funds have focused on fis-cal accountability, whereas the focus of the proprietary (business-type) funds hasbeen on operational accountability. The GASB defines the two types of accountabilityas follows:
• Fiscal accountability is the responsibility of governments to justify that their ac-tions in the current period have complied with public decisions (e.g., the legallyadopted budget) concerning the raising and spending of public moneys in theshort term (usually one budgetary cycle or one year).
• Operational accountability is governments’ responsibility to report the extent towhich they have met their operating objectives efficiently and effectively, usingall resources available for that purpose, and whether they can continue to meettheir objectives for the foreseeable future.2
The GASB concluded that, to meet users’ needs for short-term financial infor-mation and budgetary comparisons, the governmental funds should continue to focuson fiscal accountability and that the modified accrual basis of accounting, with a mea-surement focus on current financial resources, is appropriate for that purpose. Pro-prietary funds should continue to focus on operational accountability (all economicresources), using the full accrual basis. However, governments should also prepareconsolidated financial statements to provide information on the financial position andoperating results of the government as a single economic entity. That is, the consoli-dated financial statements should provide operational accountability information forboth governmental and proprietary activities and, therefore, should focus on eco-nomic resources, using the full accrual basis of accounting. The GASB also con-cluded that fiduciary activities (such as pension trust funds) should be excluded fromthe consolidated statements (but should be reported in fund statements) because trustand agency resources belong to the beneficiaries of the trust or agency relationship.Therefore, they should not be included in assessments of the government’s financialposition.
WHAT ARE THE REQUIRED BASIC FINANCIAL STATEMENTS?
Statement No. 34 mandates that governments’ basic financial statements (those re-quired for compliance with generally accepted accounting principles, or GAAP) in-clude two separate but related sets of financial statements. The first set, thegovernment-wide statements, concentrates on the government as a whole. It consolidates
WHAT ARE THE REQUIRED BASIC FINANCIAL STATEMENTS? 41
2GASB Statement No. 34, Basic Financial Statements—and Management’s Discussion and Analysis—for Stateand Local Governments (1999), para. 203.

all of a government’s own operations (i.e., excluding its fiduciary activities) and in-cludes within its measurement focus all of the government’s economic resources, in-cluding capital assets. The statements are presented on a full accrual basis.
The second set, the fund statements, views the government as a collection of sepa-rate funds. Governmental, proprietary, and fiduciary funds are reported on separatestatements. The fund statements have multiple columns. However, unlike in thestatements of the previous model, the columns do not include combined informationby type of fund (e.g., all special revenue funds combined). Instead, the GASB con-cluded that users’ needs would be better served if the statements focused on themajor funds, regardless of fund type, within, respectively, the governmental fundsand proprietary (enterprise) funds categories. Therefore, instead of one column foreach fund type there is one column for each major fund (and one column that com-bines all the nonmajor funds within the relevant funds category). Thus, for example,the statement that reports governmental funds includes one column for the generalfund and one for each of the other major funds—regardless of whether they are spe-cial revenue funds, capital projects funds, or debt service funds. Although the fund fi-nancial statements contain “totals” columns, they combine, rather than consolidate,the funds. Hence, as was true of the pre–Statement No. 34 model, interfund activitiesand balances are not eliminated.
To prepare their government-wide statements, governments must adjust thegovernmental fund statements from the modified accrual to the full accrual basis.Statement No. 34 requires that a summary of the principal adjustments be pre-sented with the financial statements, so that users can more readily understand therelationship between the fund financial statements and the government-wide finan-cial statements.
As illustrated in Figure 3–1, the basic financial statements must include notes andmust be followed by required supplementary information, which includes, for exam-ple, budget-to-actual comparisons and data relating to pension plans and certaintypes of risks. Statement No. 34 also requires that governments present with thebasic financial statements a management’s discussion and analysis (MD&A). Similarin nature to the MD&A that accompanies business financial statements, this narrativepresents a brief, nontechnical overview of the government’s financial performanceduring the year and its financial position at year-end.
42 CHAPTER 3 / GOVERNMENT FINANCIAL REPORTING
Management’s discussionand analysis
Government-widefinancial statements
Notes to the financial statements
Fund financialstatements
Required supplementaryinformation
(other than MD&A)
FIGURE 3–1 Minimum Requirements forGovernment Financial ReportingSource: GASB Statement No. 34, Basic FinancialStatements—and Management’s Discussion and Analysis—for State and Local Governments
WHAT ARE THE GOVERNMENT-WIDE FINANCIAL STATEMENTS? 43
WHAT ARE THE GOVERNMENT-WIDE FINANCIAL STATEMENTS?
There are just two government-wide statements: a statement of net assets (or a bal-ance sheet) and a statement of activities.
GOVERNMENT-WIDE STATEMENT OF NET ASSETS The statement of net assets(illustrated in Table 3–1) is similar to the balance sheet of a business. However,unlike that of a business, it has separate columns for governmental activities, busi-ness-type activities, total primary (reporting) government, and component units—entities such as building or housing authorities that are economically inter-twined with the government, albeit legally separate (and which are discussed inChapter 11).
The governmental activities column includes consolidated information (i.e.,after eliminating interfund activities and balances) from the governmental funds(and generally also from internal service funds, as discussed later in this chapter andin Chapter 9). The business-type activities column includes consolidated informa-tion from the enterprise funds. The column for the total primary government con-solidates the information reported in the governmental and business-type activitiescolumns.
The illustrated statement is in the format “assets less liabilities equals net as-sets.” The more traditional format, “assets equals liabilities plus net assets,” is alsoacceptable.
Consistent with the focus on economic resources and the full accrual basis of ac-counting, the assets section of the statement of net assets includes both capital and fi-nancial assets. The capital assets, including infrastructure, such as highways andbridges, as well as land, buildings, and equipment, are generally reported net of accu-mulated depreciation. (An exception will be discussed in Chapter 7.) Similarly, the li-abilities section includes long-term obligations. To highlight the proportion ofgovernment resources invested in capital assets, the net assets section of the state-ment distinguishes between the net capital assets (capital assets less the obligationsincurred to construct or purchase them) and the net noncapital assets.
IMPORTANCE OF RESTRICTIONS ON NET ASSETS Governments differ frombusinesses in that a substantial portion of their resources are restricted for specificpurposes, by law or by external parties, such as grantors or donors. It is obviously es-sential that these resources be distinguished from those that are unrestricted andthereby available to meet all the government’s needs. Thus, the GASB requires thatnet assets be displayed in three separate categories:
1. Amounts invested in capital assets (net of related debt, such as mortgages orbonded debt), which obviously cannot be spent unless the assets are sold
2. Amounts restricted for specific purposes, such as capital projects or debt service,which, therefore, cannot be used for other purposes
3. Unrestricted amounts, which can be used for any purpose.
As shown in Table 3–1, 56 percent of Orlando’s reported net assets for governmentalactivities and 80 percent of its business-type net assets are either tied up in capital as-sets or are otherwise restricted (not usable to meet general financing needs). Note

44 CHAPTER 3 / GOVERNMENT FINANCIAL REPORTING
T A B L E 3 – 1Statement of Net Assets
City of Orlando, FloridaStatement of Net Assets as of September 30, 2001
Primary Government
Governmental Business-type ComponentActivities Activities Total Units
AssetsCash and Cash Equivalents $239,439,761 $140,375,663 $ 379,815,424 $ 1,522,028Securities Lending 105,830,638 — 105,830,638 —Receivables (net) 32,109,079 5,329,340 37,438,419 997,760Due from Other Governments 10,473,363 1,370,686 11,844,049 1,487,880Internal Balances (316,530) 316,530 — —Inventories 1,650,031 397,056 2,047,087 32,607Prepaids 142,032 5,774 147,806 —Other Assets 955,596 968,753 1,924,349 —Restricted Assets:
Cash and Cash Equivalents 4,720,609 18,916,942 23,637,551 844,005Investments 21,937,931 31,819,341 53,757,272 1,218,035
Capital Assets:Non-depreciable 100,030,075 82,491,956 182,522,031 —Depreciable (Net) 198,024,288 429,799,892 627,824,180 41,506,775
Total Assets 714,996,873 711,791,933 1,426,788,806 47,609,090
LiabilitiesAccounts Payable 21,801,989 6,800,499 28,602,488 233,604Accrued Liabilities 4,229,127 516,050 4,745,177 23,953Accrued Interest Payable 3,649,353 3,681,912 7,331,265 93,967Advance Payments 3,699,502 13,899,722 17,599,224 —Deferred Revenue 10,342,360 — 10,342,360 13,612Securities Lending 105,830,638 — 105,830,638 —Non-Current Liabilities
Due Within One Year:Compensated Absences 1,338,649 238,283 1,576,932 11,132Loans and Leases Payable 1,165,097 1,488,591 2,653,688 189,691Bonds Payable 5,325,000 9,275,000 14,600,000 345,000
Due In More Than One Year:Compensated Absences 15,394,460 2,740,248 18,134,708 128,014Loans and Leases Payable 34,507,987 17,375,551 51,883,538 2,813,331Bonds Payable 166,599,019 171,433,221 338,032,240 2,566,447
Claims Liabilities 29,423,160 — 29,423,160 —Advances from Orange County — — — 5,959,000Advances from City of Orlando — — — 14,303,643
Total Liabilities 403,306,341 227,449,077 630,755,418 26,681,394
Net AssetsInvested in Capital Assets
(net of related debt) 138,957,233 333,491,749 472,448,982 36,150,385Restricted for:
Capital Projects 31,613,959 41,570,562 73,184,521 —Debt Service 4,171,129 12,000,000 16,171,129 —Renewal and Replacement — 3,088,649 3,088,649 207,994
Unrestricted (Deficit) 136,948,211 94,191,896 231,140,107 (15,430,683)Total Net Assets $311,690,532 $484,342,856 $ 796,033,388 $20,927,696

that the restrictions for capital projects and debt service do not necessarily coincidewith amounts held in governmental funds with those titles. In the Orlando state-ments, 57 percent of the total amount restricted for capital projects and 74 percent ofthe amount restricted for debt service are attributable to business-type activities.These assets are not maintained in separate capital projects or debt service funds,even though they are restricted for those purposes.
GOVERNMENT-WIDE STATEMENT OF ACTIVITIES In contrast to the govern-ment-wide statement of net assets, which is similar to a business balance sheet, thegovernment-wide statement of activities (illustrated in Table 3–2) bears little re-semblance to the income statement of a business. At first glance, it seems quitedaunting, but the logic behind it is quite easy to follow. The statement should beparticularly useful to users, such as taxpayers and other resource providers, whoare interested in how much the government’s programs and other services cost.
Unlike a business income statement, the aim of the activities statement is to showthe net cost of each of the government’s main functions and programs. The net costis the amount of functional or program expenses that must be covered by taxes andother general revenues, in contrast to fees and charges of the function or program it-self. Accordingly, the first column of the statement of activities reports total expensesfor each program or function, subdivided, as in the statement of net assets, betweengovernmental and business-type activities of the primary government (and followedby expenses of component units).
The next three columns report revenues that directly help defray the expenses,such as those from charges for services and program-specific grants. Then, twocolumns (one for governmental activities and one for business-type activities) showthe difference between the total expenses for each function or program and the di-rectly attributable revenues (called program revenues). The amounts in those twocolumns indicate the net cost to taxpayers (amounts that must be subsidized fromgeneral revenues) of the functions or programs.
CALCULATING THE NET COST TO TAXPAYERS For example, in Table 3–2, Or-lando’s Community and Youth Service program reports expenses of $14.5 million(column 1), which is partially financed by specific charges for program services ($2.3million, column 2) and operating grants and contributions to the program ($0.4 mil-lion, column 3). This leaves an amount of $11.8 million (column 5) that must be fi-nanced from general revenues. Thus, the net cost of the program to the taxpayers is$11.8 million.
The lower portion of the statement summarizes the taxes and other generalrevenues of the government at large—revenues that cannot be associated directlywith specific functions and programs and that can be used to cover the net cost ofall of the government’s programs. In Table 3–2, the net cost of all programs orfunctions of the primary government (the City of Orlando) is $213.9 million (totalnet expense or revenue for the primary government, column 7). This amount wasfinanced from $255.3 million in general revenues (taxes, grants and contributionsnot restricted to specific programs, and other items reported in column 7 below thenet expense figure). After deducting that amount, the net change in the govern-ment’s net assets is $41.5 million. That amount, when added to the beginning-of-the-year net assets amount of $754.5 million, equals total end-of-the-year net assetsof $796 million, as reported for the total primary government in the statement ofnet assets (Table 3–1).
WHAT ARE THE GOVERNMENT-WIDE FINANCIAL STATEMENTS? 45
46 CHAPTER 3 / GOVERNMENT FINANCIAL REPORTING
T A B L E 3 – 2Statement of Activities
City of Orlando, FloridaStatement of Activities for the Year Ended September 30, 2001
Program Revenues
Operating CapitalCharges for Grants and Grants and
Expenses Services Contributions ContributionsFunction/Program Activities—Primary Government:
Governmental Activities:General Government $ 12,233,953 $ 7,178,401 $ 153,750 $ —Administrative Services 19,310,247 99,422 — —Planning and Development 13,291,294 1,850,894 7,378,587 3,000,000Public Works 29,026,898 5,276,589 1,007,057 1,257,109Community and Youth Services 14,501,179 2,298,728 372,637 —Police 73,354,220 10,163,432 4,776,640 —Fire 36,513,281 339,863 — —Community Redevelopment Agency 11,900,678 2,066,558 — —Securities Lending 4,341,897 4,580,683 — —Lynx/Transit Subsidy 3,419,458 — — —Street Lighting 3,303,344 — — —Payments to Component Units 740,575 — — —Other 15,777,111 — — —Interest on Long-Term Debt 8,870,330 — — —Unallocated Depreciation 1,761,141 — — —
Total governmental activities 248,345,606 33,854,570 13,688,671 4,257,109Business-type Activities:
Wastewater 60,673,007 47,263,098 — —Centroplex 19,984,939 15,866,263 — —Parking 11,236,807 9,872,284 — —Stormwater Utility 8,389,754 10,304,175 — —Solid Waste 15,566,657 15,236,797 — —
Total business-type activities 115,851,164 98,542,617 — —Total primary government $364,196,770 $132,397,187 $13,688,671 $4,257,109
Component units:Downtown Development Board $ 1,778,975 $ — $ — $ —Civic Facilities Authority 6,247,075 3,691,271 — —
Total component units $ 8,026,050 $ 3,691,271 $ -0- $ —0—
General Revenues:Taxes:
Property taxes, levied for general purposesSales TaxGas TaxOccupational Licenses and Franchise FeesPublic Service TaxesTax Increment Fees
Grants and contributions not restricted to specific programs:Orlando Utilities CommissionOther
Impact FeesInvestment EarningsPayment from Primary GovernmentMiscellaneousCapital Contributions
Transfers:Subsidiary TransfersOther Transfers
Total General Revenues and TransfersChange in Net Assets
Net Assets—Beginning (Restated)Net assets—Ending

WHAT ARE THE GOVERNMENT-WIDE FINANCIAL STATEMENTS? 47
Net (Expense) Revenue and Changes in Net Assets
Primary Government
Governmental Business-type ComponentActivities Activities Total Units
$ (4,901,802) $ — $ (4,901,802) $ —(19,210,825) — (19,210,825) —
(1,061,813) — (1,061,813) —(21,486,143) — (21,486,143) —(11,829,814) — (11,829,814) —(58,414,148) — (58,414,148) —(36,173,418) — (36,173,418) —
(9,834,120) — (9,834,120) —238,786 — 238,786 —
(3,419,458) — (3,419,458) —(3,303,344) — (3,303,344) —
(740,575) — (740,575) —(15,777,111) — (15,777,111) —
(8,870,330) — (8,870,330) —(1,761,141) — (1,761,141) —
(196,545,256) — (196,545,256) —
— (13,409,909) (13,409,909) —— (4,118,676) (4,118,676) —— (1,364,523) (1,364,523) —— 1,914,421 1,914,421 —— (329,860) (329,860) —— (17,308,547) (17,308,547) —
(196,545,256) (17,308,547) (213,853,803)
— — — (1,778,975)— — — (2,555,804)— — — (4,334,779)
68,984,150 — 68,984,150 1,048,73525,117,291 — 25,117,291 —
7,698,638 — 7,698,638 —25,834,029 — 25,834,029 —31,827,207 — 31,827,207 —
7,417,664 — 7,417,664 —
32,091,000 — 32,091,000 —9,586,845 — 9,586,845 —7,225,526 — 7,225,526 —
14,503,521 15,606,739 30,110,260 382,557— — — 325,000
4,385,131 — 4,385,131 310,0843,111,512 1,958,392 5,069,904 —
(2,290,772) 2,290,772 — —4,113,977 (4,113,977) — —
239,605,719 15,741,926 255,347,645 2,066,37643,060,463 (1,566,621) 41,493,842 (2,268,403)
268,630,069 485,909,477 754,539,546 23,196,099$311,690,532 $484,342,856 $796,033,388 $20,927,696

The government-wide statements are on a full accrual basis. Therefore, asalready noted, the statement of net assets includes both capital assets and long-term debt. Correspondingly, the expenses reported in the statement of activities in-clude charges for depreciation of capital assets, even though they are not broken outseparately.
WHAT ARE THE FUND FINANCIAL STATEMENTS?
The three categories of funds necessitate three sets of statements, each containing aslightly different blend of statements. The following are the basic statements re-quired for each fund category (illustrated in the indicated tables):
• Governmental funds:• Balance sheet (Table 3–3)• Statement of revenues, expenditures, and changes in fund balances (Table 3–5)
• Proprietary funds:• Statement of net assets (or a balance sheet) (Table 3–7)• Statement of revenues, expenses, and changes in fund net assets (Table 3–8)• Statement of cash flows (discussed and illustrated in Chapter 9)
• Fiduciary funds:• Statement of fiduciary net assets• Statement of changes in fiduciary net assets
Both statements are discussed and illustrated in Chapter 10.
GOVERNMENTAL FUNDS As illustrated in Tables 3–3 and 3–5, the general fund andeach of the government’s other major funds are reported in separate columns. Majorfunds are defined as the general fund and other funds in which total assets, revenues,or expenditures/expenses of the fund are at least 10 percent of the correspondingtotal for the relevant fund category (governmental or enterprise) and also at least 5percent of the corresponding total for all governmental and enterprise funds com-bined. The remaining, nonmajor, governmental funds are combined into the columncaptioned other governmental funds.
The governmental funds balance sheet is followed by a reconciliation (Table3–4) of total governmental fund balances ($197.2 million) with the net assets of gov-ernmental activities ($311.7 million) per the government-wide statement of net as-sets. A similar reconciliation (Table 3–6) ties the changes in fund balances per thegovernmental funds statement of revenues and expenditures ($2.1 million) with thechanges in the net assets of governmental activities per the government-wide state-ment of activities ($43.1 million).
Governmental Funds Balance Sheet In contrast to the government-widestatement of net assets, the governmental funds balance sheet (Table 3–3) uses themore traditional format that presents assets as being equal to liabilities plus fundbalances. Recall that, as indicated by the list of long-term items in the reconcilia-tion (Table 3–4), governmental funds focus on current financial resources. (Inven-tories and prepaid items (such as insurance)—discussed in Chapter 5—are
48 CHAPTER 3 / GOVERNMENT FINANCIAL REPORTING
considered current financial resources for reporting purposes.) Therefore, thebalance sheet does not include capital or other noncurrent assets. Similarly, all re-ported liabilities, including compensated absences (e.g., employees’ earned vaca-tion pay, discussed in Chapter 5) and deferred revenues (Chapter 4) include onlyamounts payable or recognizable as revenue within one budgetary cycle or oneyear.
Reservations of Fund Balances As illustrated in Table 3–3, fund balances aresubdivided into amounts that are reserved and unreserved, rather than restricted andunrestricted, as is the practice in the government-wide statement of net assets. A re-served fund balance is similar in concept to resources that are restricted for a spe-cific purpose. However, the term reserve is used in governmental fund statements inpart because of its long history in governmental fund accounting and reporting and inpart because each fund (except the general fund) itself represents a restriction on theuse of the resources for which it accounts. A reservation of fund balance is, in essence,an additional restriction on fund resources.
Reserve for Encumbrances A reserve for encumbrances indicates the amount offund balance that is already committed at year-end related to unfilled purchase or-ders and other signed contracts and, thus, cannot be used for other purposes. A gov-ernment establishes, or adds to, a reserve for encumbrances as it orders or contractsfor goods or services. It reduces that reserve as it receives the goods or services andeither pays for them or records an appropriate liability. At year-end, therefore, thebalance in the reserve indicates the amount of goods or services on order, whichpresumably will be received in the following year. By reporting the reserve for en-cumbrances, the government informs users that part of the fund balance is alreadycommitted and, therefore, cannot be appropriated (included by the legislative bodyin new expenditure authority) or spent for other fund purposes. As shown in Table3–3, for example, $10.4 million of Orlando’s gas tax revenue fund balance is reservedfor goods and services that are on order and is not, therefore, available for otherpurposes.
Reserve for Inventory and Prepaid Items Fund balance is equal to fund assetsless fund liabilities. Like owners’ equity in business accounting, fund balance cannotbe associated with any particular asset or liability. Thus, it is not the equivalent ofcash and is not necessarily indicative of the cash available for distribution or appro-priation by the legislative body. Nevertheless, some users of government statementsmay interpret fund balance as the amount that is available for appropriation. Toavoid that misinterpretation, governments have traditionally established reserves forinventory and other prepaid items. These reserves are always equal to the amount re-ported for inventory and prepaid items in the assets section of the balance sheet.They do nothing more than highlight that the corresponding portion of the fund bal-ance is not available for appropriation.
Governmental Funds Statement of Revenues, Expenditures, and Changes inFund Balances Similar to the balance sheet, the governmental funds statement ofrevenues, expenditures, and changes in fund balances is also presented in a more tra-ditional format than the government-wide statement of activities. Statement No. 34requires revenues (discussed in Chapter 4) to be reported by major source, such as property taxes and licenses and permits. Expenditures (discussed in Chapter 5)
WHAT ARE THE FUND FINANCIAL STATEMENTS? 49

50 CHAPTER 3 / GOVERNMENT FINANCIAL REPORTING
T A B L E 3 – 3Governmental Funds Balance Sheet
City of Orlando, FloridaBalance Sheet
Governmental FundsSeptember 30, 2001
Utilities Trans-Services Gas Tax portation
General Tax Revenue Impact Fees
AssetsCurrent Cash and Cash Equivalents $ 66,841,521 $14,290,900 $20,483,988 $31,623,015Restricted Cash and Cash Equivalents — — — —Restricted Investments — — — —Securities Lending Collateral 105,830,638 — — —Receivables (Net)
Accounts 22,851,387 2,922,653 305,805 —Taxes 497,362 — — —Special Assessments 1,174,200 — 6,629 —
Due from Other Funds 284,737 — — —Due from Other Governments 8,428,121 — 1,325,801 —Prepaid items 108,286 — — —Inventories 1,033,243 — — —
Total Assets $207,049,495 $17,213,553 $22,122,223 $31,623,015
Liabilities and Fund BalancesLiabilities:
Accounts Payable $ 4,102,792 $ 2,712,650 $ 424,481 $ —Accrued Liabilities 4,029,850 — — —Advance Payments 2,982,821 — 400 —Due to Other Funds — — — —Short-term Loans from Other Funds 12,851,033 — — —Deferred Revenue 8,065,422 — 1,759,440 9,056Obligations Under Securities Lending 105,830,638 — — —Accrued Interest Payable — — — —
Total Liabilities 137,862,556 2,712,650 2,184,321 9,056Fund Balances:
Reserved for:Debt Service — — — —Prepaid Items 108,286 — — —Inventories 1,033,243 — — —Encumbrances 818,546 — 10,358,056 —
Unreserved, reported in:General Fund 67,226,864 — — —Special Revenue Funds — 14,500,903 9,579,846 31,613,959Capital Project Funds — — — —
Total Fund Balances 69,186,939 14,500,903 19,937,902 31,613,959Total Liabilities and Fund Balances $207,049,495 $17,213,553 $22,122,223 $31,623,015

WHAT ARE THE FUND FINANCIAL STATEMENTS? 51
Community Other TotalRedevelopment Capital Governmental Governmental
Agency Improvement Funds Funds
$ 8,132,937 $36,168,896 $14,087,575 $191,628,8324,720,609 — 4,720,609
14,438,953 — 14,438,953— — 105,830,638
10,225 291,375 350,292 26,731,737— — — 497,362— — 1,180,829— — — 284,737— — 719,441 10,473,363
33,746 — — 142,032— — 50,145 1,083,388
$27,336,470 $36,460,271 $15,207,453 $357,012,480
$ 2,765,125 $ 8,067,955 $ 614,667 $ 18,687,67013,934 — 50,192 4,093,976
6,734 696,998 12,549 3,699,502378 — 284,359 284,737
— — — 12,851,033696,615 — 2,261,827 12,792,360
— — — 105,830,6381,618,267 — — 1,618,2675,101,053 8,764,953 3,223,594 159,858,183
17,206,486 — — 17,206,48633,746 — — 142,032
— — 50,145 1,083,388930 2,240,129 5,673,463 19,091,124
— — — 67,226,8643,209,170 — 5,035,652 63,939,5301,785,085 25,455,189 1,224,599 28,464,873
22,235,417 27,695,318 11,983,859 197,154,297$27,336,470 $36,460,271 $15,207,453 $357,012,480

52 CHAPTER 3 / GOVERNMENT FINANCIAL REPORTING
T A B L E 3 – 4Reconciliation of the Governmental Funds
Balance Sheet to the Government-Wide Statement of Net Assets
City of Orlando, FloridaReconciliation of the Balance Sheet
to the Statement of Net AssetsGovernmental Funds
As of September 30, 2001
Fund balances—total governmental funds $197,154,297
Amounts reported for governmental activities in the statement ofnet assets are different because:
Capital assets used in governmental activities are not financialresources and therefore are not reported in the governmental funds.
Governmental capital assets $381,685,797Less accumulated depreciation (109,908,332) 271,777,465
Other assets used in governmental activities are not financial resourcesand therefore are not reported in the governmental funds.
Bond costs 579,842Less current year amortization (37,421) 542,421
Long-term receivables applicable to governmental activities are not due and collectible in the current period and therefore are not reported in fund balance in the governmental funds.
Accounts Receivable 3,606,000
Long-term liabilities, including bonds payable are not due and payablein the current period and therefore are not reported in the governmental funds.
Governmental bonds payable (100,690,000)Discount 347,882Current year amortization (22,339)Compensated Absences (16,139,660)Governmental leases payable (1,704,789)Governmental banking fund debt (81,486,332) (199,695,238)
Deferred revenue in governmental funds is susceptible to full accrual on the entity-wide statements.
Deferred Revenue 2,450,000
Internal service funds are used by management to charge the costs of certain activities to individual funds. The assets and liabilities of internal service funds are not included in governmental activities in the statement of net assets. 35,855,587
Net assets of governmental activities $311,690,532
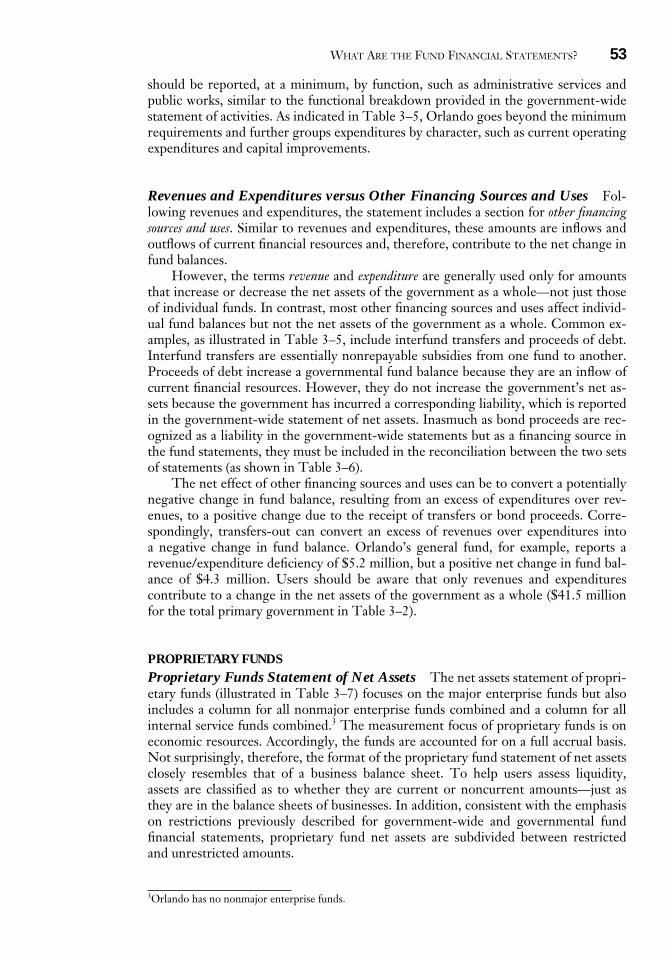
should be reported, at a minimum, by function, such as administrative services andpublic works, similar to the functional breakdown provided in the government-widestatement of activities. As indicated in Table 3–5, Orlando goes beyond the minimumrequirements and further groups expenditures by character, such as current operatingexpenditures and capital improvements.
Revenues and Expenditures versus Other Financing Sources and Uses Fol-lowing revenues and expenditures, the statement includes a section for other financingsources and uses. Similar to revenues and expenditures, these amounts are inflows andoutflows of current financial resources and, therefore, contribute to the net change infund balances.
However, the terms revenue and expenditure are generally used only for amountsthat increase or decrease the net assets of the government as a whole—not just thoseof individual funds. In contrast, most other financing sources and uses affect individ-ual fund balances but not the net assets of the government as a whole. Common ex-amples, as illustrated in Table 3–5, include interfund transfers and proceeds of debt.Interfund transfers are essentially nonrepayable subsidies from one fund to another.Proceeds of debt increase a governmental fund balance because they are an inflow ofcurrent financial resources. However, they do not increase the government’s net as-sets because the government has incurred a corresponding liability, which is reportedin the government-wide statement of net assets. Inasmuch as bond proceeds are rec-ognized as a liability in the government-wide statements but as a financing source inthe fund statements, they must be included in the reconciliation between the two setsof statements (as shown in Table 3–6).
The net effect of other financing sources and uses can be to convert a potentiallynegative change in fund balance, resulting from an excess of expenditures over rev-enues, to a positive change due to the receipt of transfers or bond proceeds. Corre-spondingly, transfers-out can convert an excess of revenues over expenditures into a negative change in fund balance. Orlando’s general fund, for example, reports arevenue/expenditure deficiency of $5.2 million, but a positive net change in fund bal-ance of $4.3 million. Users should be aware that only revenues and expenditurescontribute to a change in the net assets of the government as a whole ($41.5 millionfor the total primary government in Table 3–2).
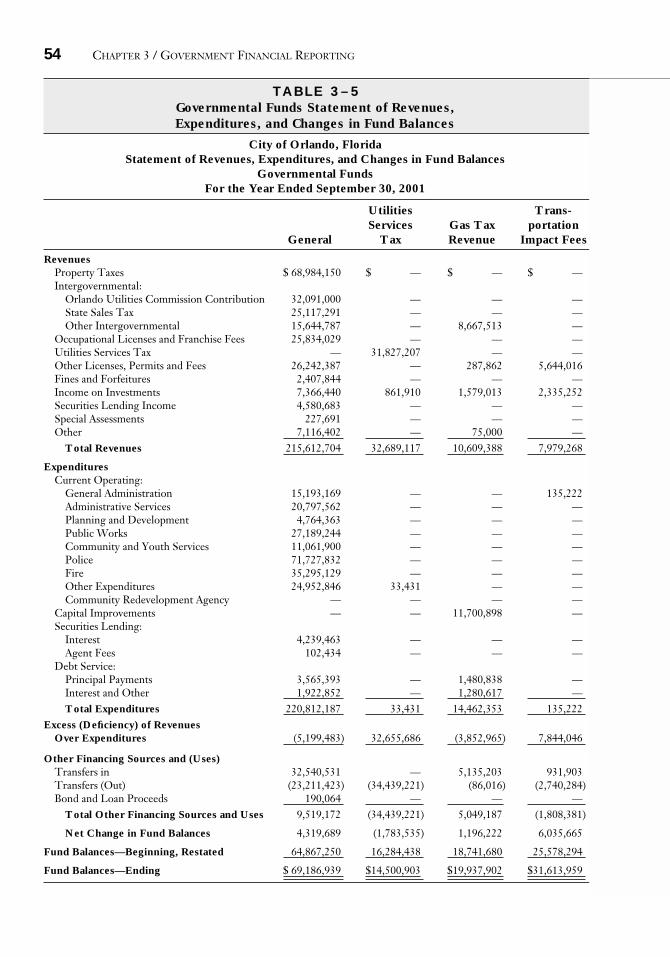
PROPRIETARY FUNDSProprietary Funds Statement of Net Assets The net assets statement of propri-etary funds (illustrated in Table 3–7) focuses on the major enterprise funds but alsoincludes a column for all nonmajor enterprise funds combined and a column for allinternal service funds combined.3 The measurement focus of proprietary funds is oneconomic resources. Accordingly, the funds are accounted for on a full accrual basis.Not surprisingly, therefore, the format of the proprietary fund statement of net assetsclosely resembles that of a business balance sheet. To help users assess liquidity,assets are classified as to whether they are current or noncurrent amounts—just asthey are in the balance sheets of businesses. In addition, consistent with the emphasison restrictions previously described for government-wide and governmental fundfinancial statements, proprietary fund net assets are subdivided between restrictedand unrestricted amounts.
WHAT ARE THE FUND FINANCIAL STATEMENTS? 53
3Orlando has no nonmajor enterprise funds.
54 CHAPTER 3 / GOVERNMENT FINANCIAL REPORTING
T A B L E 3 – 5Governmental Funds Statement of Revenues, Expenditures, and Changes in Fund Balances
City of Orlando, FloridaStatement of Revenues, Expenditures, and Changes in Fund Balances
Governmental FundsFor the Year Ended September 30, 2001
Utilities Trans-Services Gas Tax portation
General Tax Revenue Impact Fees
RevenuesProperty Taxes $ 68,984,150 $ — $ — $ —Intergovernmental:
Orlando Utilities Commission Contribution 32,091,000 — — —State Sales Tax 25,117,291 — — —Other Intergovernmental 15,644,787 — 8,667,513 —
Occupational Licenses and Franchise Fees 25,834,029 — — —Utilities Services Tax — 31,827,207 — —Other Licenses, Permits and Fees 26,242,387 — 287,862 5,644,016Fines and Forfeitures 2,407,844 — — —Income on Investments 7,366,440 861,910 1,579,013 2,335,252Securities Lending Income 4,580,683 — — —Special Assessments 227,691 — — —Other 7,116,402 — 75,000 —
Total Revenues 215,612,704 32,689,117 10,609,388 7,979,268
ExpendituresCurrent Operating:
General Administration 15,193,169 — — 135,222Administrative Services 20,797,562 — — —Planning and Development 4,764,363 — — —Public Works 27,189,244 — — —Community and Youth Services 11,061,900 — — —Police 71,727,832 — — —Fire 35,295,129 — — —Other Expenditures 24,952,846 33,431 — —Community Redevelopment Agency — — — —
Capital Improvements — — 11,700,898 —Securities Lending:
Interest 4,239,463 — — —Agent Fees 102,434 — — —
Debt Service:Principal Payments 3,565,393 — 1,480,838 —Interest and Other 1,922,852 — 1,280,617 —Total Expenditures 220,812,187 33,431 14,462,353 135,222
Excess (Deficiency) of RevenuesOver Expenditures (5,199,483) 32,655,686 (3,852,965) 7,844,046
Other Financing Sources and (Uses)Transfers in 32,540,531 — 5,135,203 931,903Transfers (Out) (23,211,423) (34,439,221) (86,016) (2,740,284)Bond and Loan Proceeds 190,064 — — —
Total Other Financing Sources and Uses 9,519,172 (34,439,221) 5,049,187 (1,808,381)
Net Change in Fund Balances 4,319,689 (1,783,535) 1,196,222 6,035,665
Fund Balances—Beginning, Restated 64,867,250 16,284,438 18,741,680 25,578,294
Fund Balances—Ending $ 69,186,939 $14,500,903 $19,937,902 $31,613,959

WHAT ARE THE FUND FINANCIAL STATEMENTS? 55
Community Other TotalRedevelopment Capital Governmental Governmental
Agency Improvement Funds Funds
$ — $ — $ — $68,984,150
— — — 32,091,000— — — 25,117,291
15,417,468 578,234 9,034,274 49,342,276— — — 25,834,029— — — 31,827,207
1,567,896 — 848,500 34,590,661— — — 2,407,844
2,069,840 2,591,856 1,413,998 18,218,309— — — 4,580,683— — — 227,691
1,180,731 3,467,361 605,411 12,444,90520,235,935 6,637,451 11,902,183 305,666,046
— — — 15,328,391— — — 20,797,562— — 7,470,767 12,235,130— — 7,774,237 34,963,481— — 2,264,094 13,325,994— — 991,103 72,718,935— — — 35,295,129— — 161 24,986,438
10,723,714 — — 10,723,7148,397,290 26,567,596 — 46,665,784
— — — 4,239,463— — — 102,434
4,412,156 — — 9,458,3875,580,211 — — 8,783,680
29,113,371 26,567,596 18,500,362 309,624,522
(8,877,436) (19,930,145) (6,598,179) (3,958,476)
601,212 23,432,065 1,726,536 64,367,450(1,494,804) (2,439,819) (364,339) (64,775,906)5,250,000 — 1,000,000 6,440,0644,356,408 20,992,246 2,362,197 6,031,608
(4,521,028) 1,062,101 (4,235,982) 2,073,132
26,756,445 26,633,217 16,219,841 195,081,165
$22,235,417 $27,695,318 $11,983,859 $197,154,297

56 CHAPTER 3 / GOVERNMENT FINANCIAL REPORTING
T A B L E 3 – 6Reconciliation of the Governmental Funds Statement of Revenues, Expenditures, and Changes in Fund Balances to the Government-Wide Statement of Activities
City of Orlando, FloridaReconciliation of the Statement of Revenues, Expenditures,
and Changes in Fund Balances of Governmental Fundsto the Statement of Activities
Governmental FundsFor the Year Ended September 30, 2001
Net change in fund balances—total governmental funds $ 2,073,132
Amounts reported for governmental activities in the statement ofactivities are different because:
Governmental funds report capital outlays as expenditures.However, in the statement of activities, the cost of those assetsis depreciated over their estimated useful lives.
Expenditures for capital assets 48,034,546Less current year depreciation (14,870,003) 33,164,543
Bond proceeds provide current financial resources to governmental funds, but issuing debt increases long-term liabilities in the statement of net assets. Repayment of bond principal is an expenditure in the governmental funds, but the repayment reduces long-term liabilities in the statement of net assets. This is the amount by which proceeds exceeded repayments.
Bond and loan proceeds (6,440,064)Bond costs 1,855Principal payments 9,458,387 3,020,178
Some revenues reported in the statement of activities do notprovide current financial resources and therefore arenot reported as revenues in governmental funds.
Change in accrual of state payments from casualty andproperty insurance premiums for police and fire pensioncontributions. (362,500)Change in interest receivable on long term capital lease (59,441) (421,941)
Some expenses reported in the statement of activities do notrequire the use of current financial resources and therefore arenot reported as expenditures in governmental funds.
Amortization of current year bond discount (22,339)Amortization of current year bond costs (37,421)Change in long-term compensated absences 57,430 (2,330)
Internal service funds are used by management to charge thecosts of certain activities to individual funds.The net revenue (expense) of the internal service funds isreported with governmental activities. 5,226,881
Change in net assets of governmental activities $43,060,463
Inasmuch as proprietary funds are accounted for on a full accrual basis in boththe government-wide and the fund statements, the net assets section for total enter-prise funds (Table 3–7) is identical in content and amounts to the net assets section ofthe business-type activities column of the government-wide statement of net assets(Table 3–1). Thus, no reconciliation is necessary between the fund financial state-ments and the government-wide statements, as is required for the governmentalfunds.
Internal service funds, like enterprise funds, are proprietary and are maintainedon a full accrual basis. In the fund statements they are reported as proprietary funds,along with the enterprise funds. However, internal service fund activities typicallyserve the functional departments (e.g., police, fire, and administration), the opera-tions of which are considered governmental. As a consequence, per Statement No.34, internal service fund balances generally are included in the governmental activitiescolumn of the government-wide statement of net assets, rather than in the business-type activities column. To highlight this change in category in the government-widestatements, the internal service funds column in the proprietary funds statement ofnet assets is reported to the right of the totals column for the enterprise funds and iscaptioned governmental activities.
Proprietary Fund Statement of Revenues, Expenses, and Changes inFund Net Assets The format of the operating statement for proprietary funds(illustrated in Table 3–8) is similar to that of a business income statement. It dif-fers, therefore, from the format of the corresponding statement (i.e., the business-type activities column) in the government-wide statement of activities (Table 3–2).The fund statement separates operating revenues and expenses, such as chargesand fees for services, from nonoperating revenues and expenses, such as invest-ment income and interest expense on borrowings. Thus, users are provided the in-formation necessary to distinguish between operating income or loss and totalincome or loss.
Contributed Capital and Transfers The statement also distinguishes capitalcontributions (e.g., initial infusions of resources to establish the fund) and transfersto and from other funds from operating and non-operating revenues and expenses.As discussed previously with respect to governmental funds, transfers are separatelyreported because they do not enhance the government’s net assets, although they in-crease fund net assets. Also, the separate reporting informs users of the extent towhich enterprise funds, which users may expect to be self-supporting, are, in fact,subsidized by other funds.
FIDUCIARY FUNDS Fiduciary activities are excluded from the government-widestatements because the assets of fiduciary funds (per the definition of this fundtype) benefit organizations or individuals other than the government itself.Therefore, per Statement No. 34, they should not be included in the financial po-sition or operating results of the government. The government cannot use thesefunds for its own programs. Nevertheless, the government is accountable for thefiduciary activities that it carries out on behalf of others and for the resources inthese funds. Hence, governments are required to include the fiduciary funds inthe fund statements, following those of the governmental and proprietary funds.Transactions and reporting requirements for fiduciary funds will be addressed inChapter 10.
WHAT ARE THE FUND FINANCIAL STATEMENTS? 57

58 CHAPTER 3 / GOVERNMENT FINANCIAL REPORTING
T A B L E 3 – 7Proprietary Funds Statement of Net Assets
City of Orlando, Florida, Statement of Net AssetsProprietary Funds, September 30, 2001
Business-type Activities—Enterprise Funds
Wastewater Orlando ParkingSystem Centroplex System
AssetsCurrent Assets:
Cash and Cash Equivalents $109,816,332 $ 1,590,869 $11,036,503Accounts Receivable (Net) 3,629,929 262,012 133,738Due From Other Governments 1,309,588 — 60,698Inventories 330,727 66,329 —Prepaid Items — 4,774 —
Total Current Assets 115,086,576 1,923,984 11,230,939Non-Current Assets:
Restricted:Cash and Cash Equivalents 14,947,591 — 3,969,351Investments 29,524,326 — 2,295,015Loans to Other Funds — — —
Capital AssetsLand 27,523,515 9,214,762 13,004,855Buildings 156,585,188 77,444,910 59,413,069Improvements Other Than Buildings 94,388,395 30,098,216 3,497,489Equipment 104,215,619 5,461,245 1,839,280Vehicles — — —Wastewater and Stormwater Lines and
Pump Stations 202,756,142 — —Less Accumulated Depreciation (273,080,495) (48,118,602) (29,544,088)Construction in Process 30,297,030 — —
Unamortized Bond Costs 752,680 — 216,073Total Non-Current Assets 387,909,991 74,100,531 54,691,044
Total Assets 502,996,567 76,024,515 65,921,983LiabilitiesCurrent Liabilities:
Accounts Payable 5,196,419 413,487 470,116Accrued Liabilities 243,902 102,536 65,546Accrued Interest Payable 3,207,670 — 474,242Compensated Absences 123,344 35,792 23,489Advance Payments 13,186,090 625,514 88,118Current Portion of Loans Payable — 1,157,343 331,248Current Portion of Bonds Payable 7,985,000 — 1,290,000
Total Current Liabilities 29,942,425 2,334,672 2,742,759Non-Current Liabilities:
Compensated Absences 1,418,453 411,610 270,122Arbitrage Rebate Payable — — —Loans from Other Funds — 10,716,777 6,658,774Loans Due After One Year — — —Bonds Payable After One Year 152,800,240 — 18,632,981Claims Liabilities — — —
Total Non-Current Liabilities 154,218,693 11,128,387 25,561,877Total Liabilities 184,161,118 13,463,059 28,304,636
Net AssetsInvested in Capital Assets, net of related debt 200,161,330 62,226,411 23,808,690Restricted:
Debt Service 12,000,000 — —Capital Projects 41,570,562 — —Renewal and Replacement 883,541 — 2,205,108
Unrestricted 64,220,016 335,045 11,603,549Total Net Assets $318,835,449 $62,561,456 $37,617,347
Adjustment to reflect the consolidation of internal service fund activities related to enterprise funds.Net assets of business-type activities

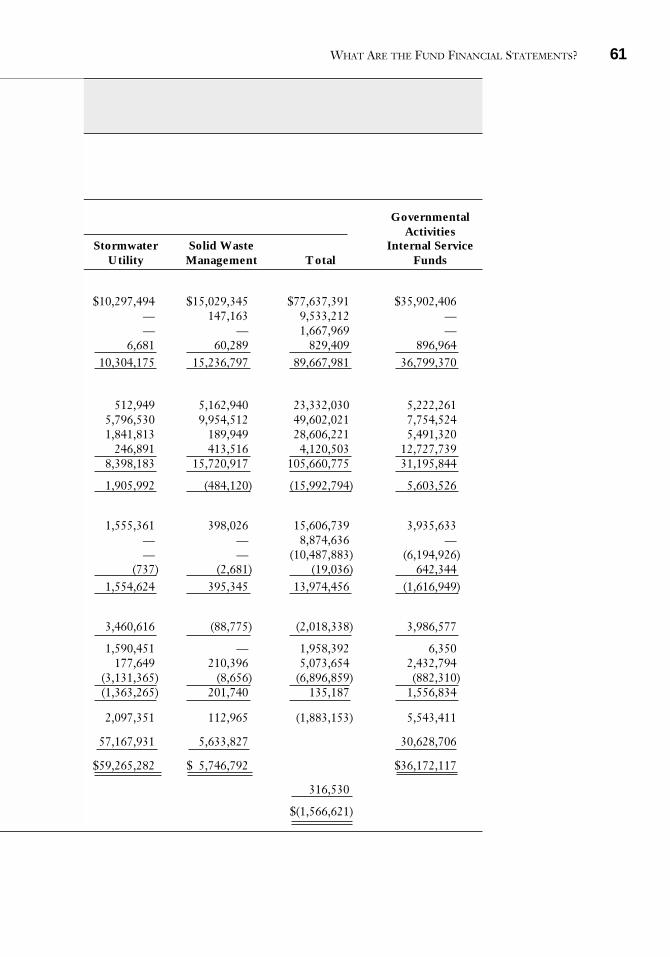
WHAT ARE THE FUND FINANCIAL STATEMENTS? 59
GovernmentalStormwater Solid Waste Activities
Utility Management Total Internal Service Funds
$13,435,543 $4,496,416 $140,375,663 $ 47,799,75644,959 1,258,702 5,329,340 93,151
— 400 1,370,686 —— — 397,056 566,643— 1,000 5,774 —
13,480,502 5,756,518 147,478,519 48,459,550
— — 18,916,942 —— — 31,819,341 7,498,978— — — 117,571,502
654,404 71,165 50,468,701 555,767— 1,402,289 294,845,456 7,760,098— 426,850 128,410,950 245,762
222,611 1,155,618 112,894,373 800,467— — — 55,404,202
71,739,296 — 274,495,438 —(28,107,713) (1,995,427) (380,846,325) (38,478,225)
1,726,225 — 32,023,255 —— — 968,753 413,175
46,234,823 1,060,495 563,996,884 151,771,72659,715,325 6,817,013 711,475,403 200,231,276
354,354 366,123 6,800,499 3,032,15315,831 88,235 516,050 135,151
— — 3,681,912 2,031,0866,389 49,269 238,283 47,476
— — 13,899,722 —— — 1,488,591 660,373— — 9,275,000 3,950,000
376,574 503,627 35,900,057 9,856,239
73,469 566,594 2,740,248 545,973— — 82,166— — 17,375,551 706,599— — — 37,735,459— — 171,433,221 85,709,563— — — 29,423,160
73,469 566,594 191,549,020 154,202,920450,043 1,070,221 227,449,077 164,059,159
46,234,823 1,060,495 333,491,749 24,921,099
— — 12,000,000 —— — 41,570,562 —— — 3,088,649 —
13,030,459 4,686,297 93,875,366 11,251,018$59,265,282 $5,746,792 $484,026,326 $ 36,172,117
316,530
$484,342,856

60 CHAPTER 3 / GOVERNMENT FINANCIAL REPORTING
T A B L E 3 – 8Proprietary Funds Statement of Revenues, Expenses, and Changes in Fund Net Assets
City of Orlando, FloridaStatement of Revenues, Expenses, and Changes in Fund Net Assets
Proprietary Funds For the Year Ended September 30, 2001
Business-type Activities Enterprise Funds
Wastewater Orlando ParkingSystem Centroplex System
Operating Revenues
User Charges $ 37,829,255 $11,724,586 $ 2,756,711Fees 338,929 3,721,004 5,326,116Parking Fines — — 1,667,969Other 220,278 420,673 121,488
Total Operating Revenues 38,388,462 15,866,263 9,872,284
Operating ExpensesSalaries, Wages and Employee Benefits 10,476,288 4,429,511 2,750,342Contractual Services, Materials and Supplies 19,199,716 10,774,796 3,876,467Depreciation Expense 20,232,764 3,687,016 2,654,679Insurance and Other Expenses 2,253,994 557,153 648,949
Total Operating Expenses 52,162,762 19,448,476 9,930,437
Operating Income (Loss) (13,774,300) (3,582,213) (58,153)
Non-Operating Revenues (Expenses)Income on Investments 12,112,573 216,081 1,324,698Impact Fees 8,874,636 — —Interest Expense (8,626,511) (546,217) (1,315,155)Gain (Loss) on Sale of Fixed Assets (6,761) (1,347) (7,510)
Total Non-Operating Revenues (Expenses) 12,353,937 (331,483) 2,033
Income (Loss) Before Contributionsand Transfers (1,420,363) (3,913,696) (56,120)
Capital Contributions 367,941 — —Transfers In 894,837 1,627,847 2,162,925Transfers (Out) (2,232,745) (15,000) (1,509,093)
(969,967) 1,612,847 653,832
Changes in Net Assets (2,390,330) (2,300,849) 597,712
Net Assets—Beginning 321,225,779 64,862,305 37,019,635
Net Assets—Ending $318,835,449 $62,561,456 $37,617,347
Adjustment to reflect the consolidation of internal service fund activities related to enterprise funds.
Change in net assets of business-type activities
WHAT ARE THE FUND FINANCIAL STATEMENTS? 61
GovernmentalActivities
Stormwater Solid Waste Internal ServiceUtility Management Total Funds
$10,297,494 $15,029,345 $77,637,391 $35,902,406— 147,163 9,533,212 —— — 1,667,969 —
6,681 60,289 829,409 896,96410,304,175 15,236,797 89,667,981 36,799,370
512,949 5,162,940 23,332,030 5,222,2615,796,530 9,954,512 49,602,021 7,754,5241,841,813 189,949 28,606,221 5,491,320
246,891 413,516 4,120,503 12,727,7398,398,183 15,720,917 105,660,775 31,195,844
1,905,992 (484,120) (15,992,794) 5,603,526
1,555,361 398,026 15,606,739 3,935,633— — 8,874,636 —— — (10,487,883) (6,194,926)
(737) (2,681) (19,036) 642,3441,554,624 395,345 13,974,456 (1,616,949)
3,460,616 (88,775) (2,018,338) 3,986,577
1,590,451 — 1,958,392 6,350177,649 210,396 5,073,654 2,432,794
(3,131,365) (8,656) (6,896,859) (882,310)(1,363,265) 201,740 135,187 1,556,834
2,097,351 112,965 (1,883,153) 5,543,411
57,167,931 5,633,827 30,628,706
$59,265,282 $ 5,746,792 $36,172,117
316,530
$(1,566,621)

WHAT ARE NOTES AND REQUIRED SUPPLEMENTARY INFORMATION?
As with business financial statements, notes are considered an integral part of thebasic financial statements of governments. Voluminous though they may be, notesare too important to be ignored. Per Statement No. 34 and consistent with exist-ing standards, notes should include explanations of the accounting principles usedin preparing the financial statements, schedules of changes in capital assets andlong-term liabilities, schedules of future debt service requirements, disclosuresabout contingent liabilities, and other information that might affect users’ inter-pretation of the amounts reported in the statements themselves.
Required supplementary information (RSI) is information that the GASBrequires to be presented with, but not as part of, the basic financial statements. Itincludes the management’s discussion and analysis (MD&A), which is pre-sented before the basic financial statements, as well as information such as bud-getary comparisons and pension schedules, which is presented after the notes. RSIhas much in common with notes. Both include GASB-mandated schedules anddata. However, whereas notes are considered part of the basic financial statements,RSI is not. Therefore, RSI may be subject to a lower level of auditor scrutiny thannotes.
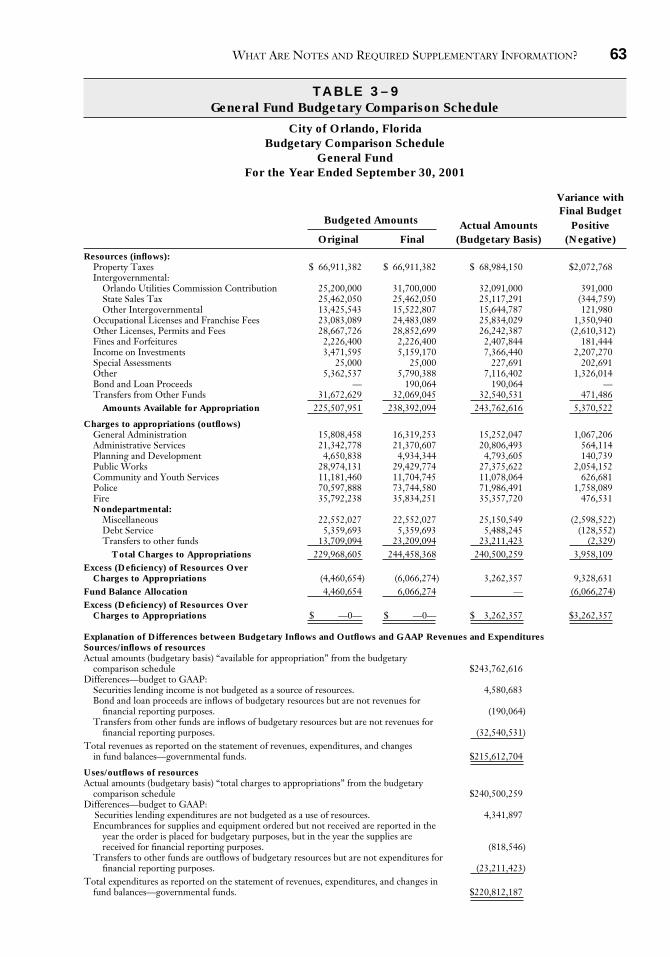
As discussed in Chapter 1, demonstrating compliance with the legally adoptedbudget is a primary objective of government financial reporting. Accordingly, State-ment No. 34 requires that governments include in their annual reports, as RSI, acomparison of actual results with the budget for the general fund and for each specialrevenue fund for which an annual budget has been adopted.
The GASB specifies the accounting principles (GAAP) to which governmentsmust adhere in their external financial reports. It does not have the authority toestablish budgetary principles, which often differ from GAAP. A comparison be-tween the budget and actual results would not be meaningful unless the two sets ofinformation were calculated using the same principles. Therefore, per StatementNo. 34, the GASB requires that governments present their budget versus actualcomparisons on a budgetary basis and include a schedule that reconciles the actualamounts per the budgetary comparison with the GAAP amounts per the financialstatements.
Budget-to-actual comparisons may demonstrate either legal compliance ormanagerial effectiveness in adhering to budget estimates. One of the major im-provements introduced by Statement No. 34 is that it requires governments topresent both their original and their final appropriated budgets, so that readerscan compare the actual results with both budgets. Prior to Statement No. 34,governments could report only their final (amended) budgets. For some govern-ments, their final budgets incorporate changes they authorized only after theywere aware of the actual revenues and expenditures of the year. Thus, govern-ments typically reported no significant variance between budgeted and actualamounts.
Table 3–9 shows Orlando’s budget-to-actual comparison for its general fund.The column reporting the variances between actual results and the final budget is en-couraged but is not required by GASB standards. Governments may also present acolumn with variances from the original budget.
62 CHAPTER 3 / GOVERNMENT FINANCIAL REPORTING
WHAT ARE NOTES AND REQUIRED SUPPLEMENTARY INFORMATION? 63
T A B L E 3 – 9General Fund Budgetary Comparison Schedule
City of Orlando, FloridaBudgetary Comparison Schedule
General FundFor the Year Ended September 30, 2001
Variance withFinal Budget
Budgeted Amounts Actual Amounts PositiveOriginal Final (Budgetary Basis) (Negative)
Resources (inflows):Property Taxes $ 66,911,382 $ 66,911,382 $ 68,984,150 $2,072,768Intergovernmental:
Orlando Utilities Commission Contribution 25,200,000 31,700,000 32,091,000 391,000State Sales Tax 25,462,050 25,462,050 25,117,291 (344,759)Other Intergovernmental 13,425,543 15,522,807 15,644,787 121,980
Occupational Licenses and Franchise Fees 23,083,089 24,483,089 25,834,029 1,350,940Other Licenses, Permits and Fees 28,667,726 28,852,699 26,242,387 (2,610,312)Fines and Forfeitures 2,226,400 2,226,400 2,407,844 181,444Income on Investments 3,471,595 5,159,170 7,366,440 2,207,270Special Assessments 25,000 25,000 227,691 202,691Other 5,362,537 5,790,388 7,116,402 1,326,014Bond and Loan Proceeds — 190,064 190,064 —Transfers from Other Funds 31,672,629 32,069,045 32,540,531 471,486
Amounts Available for Appropriation 225,507,951 238,392,094 243,762,616 5,370,522
Charges to appropriations (outflows)General Administration 15,808,458 16,319,253 15,252,047 1,067,206Administrative Services 21,342,778 21,370,607 20,806,493 564,114Planning and Development 4,650,838 4,934,344 4,793,605 140,739Public Works 28,974,131 29,429,774 27,375,622 2,054,152Community and Youth Services 11,181,460 11,704,745 11,078,064 626,681Police 70,597,888 73,744,580 71,986,491 1,758,089Fire 35,792,238 35,834,251 35,357,720 476,531Nondepartmental:
Miscellaneous 22,552,027 22,552,027 25,150,549 (2,598,522)Debt Service 5,359,693 5,359,693 5,488,245 (128,552)Transfers to other funds 13,709,094 23,209,094 23,211,423 (2,329)
Total Charges to Appropriations 229,968,605 244,458,368 240,500,259 3,958,109Excess (Deficiency) of Resources Over
Charges to Appropriations (4,460,654) (6,066,274) 3,262,357 9,328,631Fund Balance Allocation 4,460,654 6,066,274 — (6,066,274)Excess (Deficiency) of Resources Over
Charges to Appropriations $ —0— $ —0— $ 3,262,357 $3,262,357
Explanation of Differences between Budgetary Inflows and Outflows and GAAP Revenues and ExpendituresSources/inflows of resourcesActual amounts (budgetary basis) “available for appropriation” from the budgetary
comparison schedule $243,762,616Differences—budget to GAAP:
Securities lending income is not budgeted as a source of resources. 4,580,683Bond and loan proceeds are inflows of budgetary resources but are not revenues for
financial reporting purposes. (190,064)Transfers from other funds are inflows of budgetary resources but are not revenues for
financial reporting purposes. (32,540,531)Total revenues as reported on the statement of revenues, expenditures, and changes
in fund balances—governmental funds. $215,612,704
Uses/outflows of resourcesActual amounts (budgetary basis) “total charges to appropriations” from the budgetary
comparison schedule $240,500,259Differences—budget to GAAP:
Securities lending expenditures are not budgeted as a use of resources. 4,341,897Encumbrances for supplies and equipment ordered but not received are reported in the
year the order is placed for budgetary purposes, but in the year the supplies arereceived for financial reporting purposes. (818,546)
Transfers to other funds are outflows of budgetary resources but are not expenditures forfinancial reporting purposes. (23,211,423)
Total expenditures as reported on the statement of revenues, expenditures, and changes infund balances—governmental funds. $220,812,187

WHAT ADDITIONAL INFORMATION DO GOVERNMENTS TYPICALLYREPORT?
In addition to the basic financial statements and RSI, many governments include intheir CAFRs combining statements for the nonmajor funds—that is, financial state-ments that present each of the nonmajor funds in a separate column. Governments alsoprovide statistical information relating to trends in revenues and expenditures, popula-tion, employment, and property values. This expanded approach to reporting helpsusers better assess the government’s financial position and its economic condition—itsongoing ability to provide services and meet its obligations—by providing informationthat will have a direct bearing on both the demand for the government’s services andthe government’s ability to finance them. The statistical information that governmentstypically include in their financial reports is discussed in Chapters 11 and 14.
QUESTIONS FOR REVIEW AND DISCUSSION
64 CHAPTER 3 / GOVERNMENT FINANCIAL REPORTING
1. Distinguish between a financial statement thatcombines funds with one that consolidates them.
2. What is the rationale of the GASB for requir-ing two sets of financial statements, each with adifferent measurement focus and basis of ac-counting for governmental activities?
3. How many government-wide statements arerequired? What are they?
4. In what key ways does the format of the gov-ernment-wide statement of activities differfrom that of a traditional income statement?
5. What are the three categories of fund statements?6. What is the purpose of a reserve for encum-
brances? When do governments add to the re-serve? When do they subtract from it?
7. What are internal service funds? Why are theyclassified differently in government-wide thanin fund statements?
8. What are major funds? In what key ways aremajor funds reported differently than nonmajorfunds?
9. What are fiduciary funds? Why are they not re-ported in the government-wide statements?
10. How does required supplementary informationdiffer from notes to the financial statements?
11. What is the advantage of basing budgetarycomparisons on the original budget, as opposedto the amended budget? What is the advantageof basing budgetary comparisons on theamended budget?
EXERCISES AND PROBLEMS
3–1
Select the best answer.1. Which of the following best describes govern-
ment-wide statements?
a. combined on a full accrual basis
b. combined on a modified accrual basis
c. consolidated on a full accrual basis
d. consolidated on a modified accrual basis
2. How many government-wide statements is a major city, such as New York, required toprepare?a. twob. threec. fourd. six
3. The net assets section of a government-widestatement of net assets would typically not

have a separate category to show amounts in-vested ina. capital assetsb. unrestricted assetsc. restricted assetsd. current assets
4. Which of the following funds would not be incorporated into the government-wide state-ments?a. enterprise fundsb. permanent fundsc. internal service fundsd. fiduciary funds
5. Which of the following funds is least likely tobe separately reported in the governmentalfunds balance sheet?a. a general fundb. a nonmajor special revenue fundc. a major capital projects fundd. a major permanent fund
6. Which of the following items is least likely tobe reported on Midlake County’s governmen-tal funds balance sheet?a. the county courthouseb. amounts due to the internal service fundc. a reserve for encumbrancesd. amounts invested in federal securities
7. A reserve for encumbrances is generally de-creased when goods area. orderedb. receivedc. paid ford. used
8. The year-end balance of a reserve for inven-tory is generally equal to thea. market value of inventory on handb. cost of inventory on handc. amount of inventory on orderd. amount of inventory purchased but not yet
paid for
9. Which of the following would not be shown asa revenue of the function “public safety” onMillburg Township’s government-wide state-ment of activities?a. a grant from the federal government to ac-
quire radar equipment
EXERCISES AND PROBLEMS 65
b. amounts charged to local funeral homes toprovide police escorts
c. an appropriation from the town council topay police officers
d. fees charged to the surrounding county toprovide services outside of township limits
10. Which of the following would be most likely tobe reported among restricted net assets on acity’s government-wide statement of net assets?a. the balance in the city’s debt service fundb. the amount owed to city employees for ser-
vices rendered since they received their lastpaychecks
c. the actuarial liability of the city’s pensionfund
d. the cost, less accumulated depreciation, ofthe city’s highway system
3–2
Select the best answer.1. Internal service funds are reported as
a. business-type activities in government-widestatements and governmental funds in fundstatements
b. proprietary funds in fund statements andgovernmental activities in government-widestatements
c. business-type activities in government-widestatements and proprietary funds in fundstatements
d. governmental funds in fund statements andgovernmental activities in government-widestatements
2. In which of the following statements would de-preciation not be reported?a. internal service fund statement of revenues,
expenses, and changes in fund net assetsb. government-wide statement of activitiesc. capital projects fund statement of revenues,
expenditures, and changes in fund balanced. enterprise fund statement of revenues, ex-
penses, and changes in fund net assets
3. Which of the following is “required supple-mentary information”?a. explanation of accounting principles used in
preparing the financial statementsb. schedule of changes in capital assetsc. budgetary comparisond. ten-year trend of assessed property values

4. Which of the following is not required to beincorporated into the budgetary comparison?a. expenditures per the originally adopted
budgetb. expenditures per the amended budgetc. actual expendituresd. variance between the actual expenditures
and those per the amended budget5. The management’s discussion and analysis
(MD&A) is most likely to include informationona. service efforts and accomplishmentsb. market values of government-owned capital
assetsc. the condition of infrastructure assetsd. financial performance during the period
covered by the financial statements6. Which of the following is not one of the three
main categories of funds?a. governmental fundsb. permanent fundsc. proprietary fundsd. fiduciary funds
7. “Major” funds includea. all governmental funds plus proprietary
funds that have fund balances greater than10 percent of those of all proprietary fundscombined
b. the general fund, special revenue funds, cap-ital projects funds, and debt service funds
c. the general fund plus all funds that have as-sets greater that 50 percent of those of thegeneral fund
d. the general fund plus other funds in whichtotal assets, revenues, or expenditures/expenses of the fund are at least 10 percentof the corresponding total for the relevantfund category (governmental or enterprise)and also at least 5 percent of the corre-sponding total for all governmental and en-terprise funds combined
8. The assets and liabilities of nonmajor govern-mental funds would bea. aggregated and reported in the governmen-
tal funds balance sheet in a single columnb. excluded from the government-wide state-
ment of net assetsc. shown only in notes to the financial state-
mentsd. reported as required supplementary infor-
mation
66 CHAPTER 3 / GOVERNMENT FINANCIAL REPORTING
9. Which of the following would not be reportedon a government-wide statement of activities?a. a transfer of cash from the general fund to a
debt service fundb. costs incurred by the recreation department
for electricity purchased from the city-owned electric utility
c. depreciation on traffic lightsd. interest on bonds issued by the electric util-
ity department10. Which of the following is not required to be in-
cluded in a government’s basic financial state-ments or required supplementary information?a. a reconciliation between proprietary fund
financial statements and the business-typeactivities column of the government-widefinancial statements
b. a reconciliation between governmental fundfinancial statements and the governmentalactivities column of the government-widefinancial statements
c. a reconciliation between revenues reportedon the basis of GAAP and those reported ona budgetary basis
d. a comparison between actual expendituresand expenditures per the amended budget
3–3
Even at this early stage of the course it is possible to re-construct journal entries from a balance sheet.
The Sherill Utility District was recently estab-lished. Here is its balance sheet, after one year.
Sherill Utility DistrictBalance Sheet as of End of Year 1
(in millions)Capital
Gen- Proj- Debteral ects Service
Fund Fund Fund Totals
Assets:Cash $30 $ 30Investments $90 $20 110Total Assets $30 $90 $20 $140
Liabilities andFund Balances:
Fund Balances $30 $90 $20 $140
Note the following additional information:a. The general fund received all of its revenue,
$150 million, from taxes (all collected). It had

operating expenditures, excluding transfers toother funds, of $100 million (all paid for).
b. The general fund transferred $20 million tothe debt service fund. Of this, $15 millionwas to repay the principal on bonds out-standing; $5 million was for interest.
c. The district issued $130 million in bonds tofinance construction of plant and equipment.Of this, it expended $40 million.
1. Prepare journal entries to summarize these ac-tivities in the appropriate funds. You need notmake closing entries. Do not be concerned as tothe specific titles of accounts to be debited orcredited (e.g., whether a transfer from one fundto another should be called a “transfer,” an “ex-pense” or an “expenditure,” or whether pro-ceeds from bonds should be called “bondproceeds” or “revenues.”)
2. Comment on how the district’s government-wide (full accrual) statement of net assets woulddiffer from the balance sheet presented.
3–4
Funds can be consolidated, but only at the risk of lost ormisleading information.
The balance sheet below was adapted from thefinancial statements of the Williamsburg RegionalSewage Treatment Authority (dates have beenchanged).
Williamsburg Regional SewageTreatment Authority
Balance SheetOctober 31, 2003
CapitalGeneral Projects
Fund Fund
Assets:Cash $ 751 $ 5,021Time Deposits 16,398Due on Insurance Claim 9,499Due from General Fund 9,000Due from Participants 66,475 4,414Total Assets $76,725 $34,833
Liabilities and Fund Balance:Accounts Payable $17,725Due to Capital Projects Fund 9,000
26,725Fund Balance 50,000 34,833Total Liabilities andFund Balance $76,725 $34,833
EXERCISES AND PROBLEMS 67
The transactions of the authority are accounted forin the following governmental fund types:
• General fund—To account for all revenues andexpenditures not required to be accounted for inother funds.
• Capital projects fund—To account for financialresources designated to construct or acquirecapital facilities and improvements. Such re-sources are derived principally from other mu-nicipal utility districts to which theWilliamsburg Regional Sewage Treatment Au-thority provides certain services.
1. Recast the balance sheets of the two funds into asingle consolidated balance sheet. Show sepa-rately, however, the restricted and the unre-stricted portions of the consolidated fundbalance account (not each individual asset andliability). Be sure to eliminate interfundpayables and receivables.
2. Which presentation, the unconsolidated or theconsolidated, provides more complete informa-tion? Explain. Which presentation might beseen as misleading? Why? What, if any, advan-tages do you see to the presentation that is lesscomplete and more misleading?
3–5
Consolidated balances are not substitutes for individualfund balance sheets.The combined governmental fund balance sheet ofthe town of Paris is presented on next page.
Per schedules included in the notes to the fi-nancial statements, the town had $1,450 of capitalassets (net of accumulated depreciation) and $1,315in long-term liabilities associated with the capitalassets.
1. Recast the balance sheets in the form of a singleconsolidated, full accrual balance sheet.
2. Put yourself in the place of an analyst. Thetown mayor presents you with the consoli-dated balance sheet. He asserts that the town’sfinancial position is excellent, as measured by the exceedingly “healthy” fund balance.Based on your having seen the combinedbalance sheet that shows the individual fund types, why might you be skeptical of hisclaim?
3. Comment on why a consolidated balance sheetis no substitute for a combined balance sheetthat reports on major funds.

3–6
Exploring Orlando’s financial reportRefer to the financial statements of the City of
Orlando that are included in this chapter.1. Per the government-wide statement of activi-
ties, how much did the city incur in expense forpolice? Of this amount, how much had to becovered from general tax and other unrestrictedrevenues?
2. Per the governmental funds statement of rev-enues, expenditures, and changes in fund bal-ances, how much did the city incur inexpenditures for police? How do you accountfor the difference between this amount and yourresponse to question 1?
3. Per the government-wide statement of activi-ties, what was the ending balance in net assetsassociated with governmental activities? Is thisconsistent with the government-wide statementof net assets?
4. How much was transferred (net) from business-type to governmental activities during the year?
5. How much in taxes did the city direct to thesupport of business-type activities?
6. As noted in the text, government-wide state-ments are on a full accrual basis and thereforethe statement of activities includes charges fordepreciation. Orlando’s government-wide state-ment of activities reports $1.8 million of unallo-cated depreciation (i.e., not allocated to specificfunctions or programs) for governmental activi-ties. How much depreciation did Orlando allo-cate to specific functions or programs ofgovernmental activities? How can you tell?
68 CHAPTER 3 / GOVERNMENT FINANCIAL REPORTING
7. Orlando’s statements include a schedule (Table3–6) that reconciles its statement of revenues, ex-penditures, and changes in fund balances of gov-ernmental funds to the statement of activities,governmental activities. However, it does not in-clude a corresponding reconciliation of the state-ment of revenues, expenses, and changes in fundnet assets of proprietary funds to the statement ofactivities, business-type activities. Why not?
3–7
Exploring Orlando’s financial reportRefer to the financial statements of the City of
Orlando that are included in this chapter.1. How much of the city’s governmental activities
assets are classified as capital? How much of thecity’s governmental activities liabilities wereused to finance those capital assets?
2. How much of the city’s net assets associatedwith governmental activities are restricted forcapital projects? What is the combined fundbalance of the city’s capital projects funds (perthe governmental funds balance sheet)? How doyou account for the difference between thesetwo amounts?
3. In the city’s governmental funds balance sheet,some funds are reported in separate columns,whereas others are combined into a single col-umn captioned “other governmental funds.”How do you think the city determined whichfunds to report in a separate column and whichto aggregate with other funds?
4. How much did the city report as the total actualamount available for appropriation in the gen-
Town of ParisCombined Balance Sheet
Special Capital Debt PermanentGeneral Revenue Projects Service (Endowment)
Fund Fund Fund Fund Fund Totals
Assets:Cash $ 38 $ 20 $ 35 $340 $ 10 $ 443Investments 105 60 480 136 960 1,741Due from Other Funds — 120 46 39 — 205Total Assets $143 $200 $561 $515 $970 $2,389
Liabilities andFund Balances:Accounts Payable $ 8 – – – – $ 8Due to Other Funds 205 – – – – 205Fund Balances (70) $200 $561 $515 $970 2,176Total Liabilities and
Fund Balances $143 $200 $561 $515 $970 $2,389

eral fund per the budgetary comparison? Howmuch did it report as revenues of the generalfund per the statement of revenues, expendi-tures, and changes in fund balances? What itemis the principal cause of the difference?
5. What are the main types of transactions, and inwhat amounts, that account for the differencesbetween the change in fund balances of govern-mental funds, per the statement of revenues, ex-penditures, and changes in fund balances, and
EXERCISES AND PROBLEMS 69
the change in net assets of governmental activ-ities, per the government-wide statement of activities?
6. Over 60 percent of the total amount of capitalassets reported in the government-wide state-ment of net assets are devoted to business-typeactivities. What is the most likely explanation asto why the proportion of capital assets directedto business-type activities is greater than thatdevoted to governmental activities?