Governance and Management in the Education Sector in Cameroon
97
Report No. 67201-CM Cameroon GOVERNANCE AND MANAGEMENT IN THE EDUCATION SECTOR March 2012 Africa Region
Transcript of Governance and Management in the Education Sector in Cameroon
Report No. 67201-CM
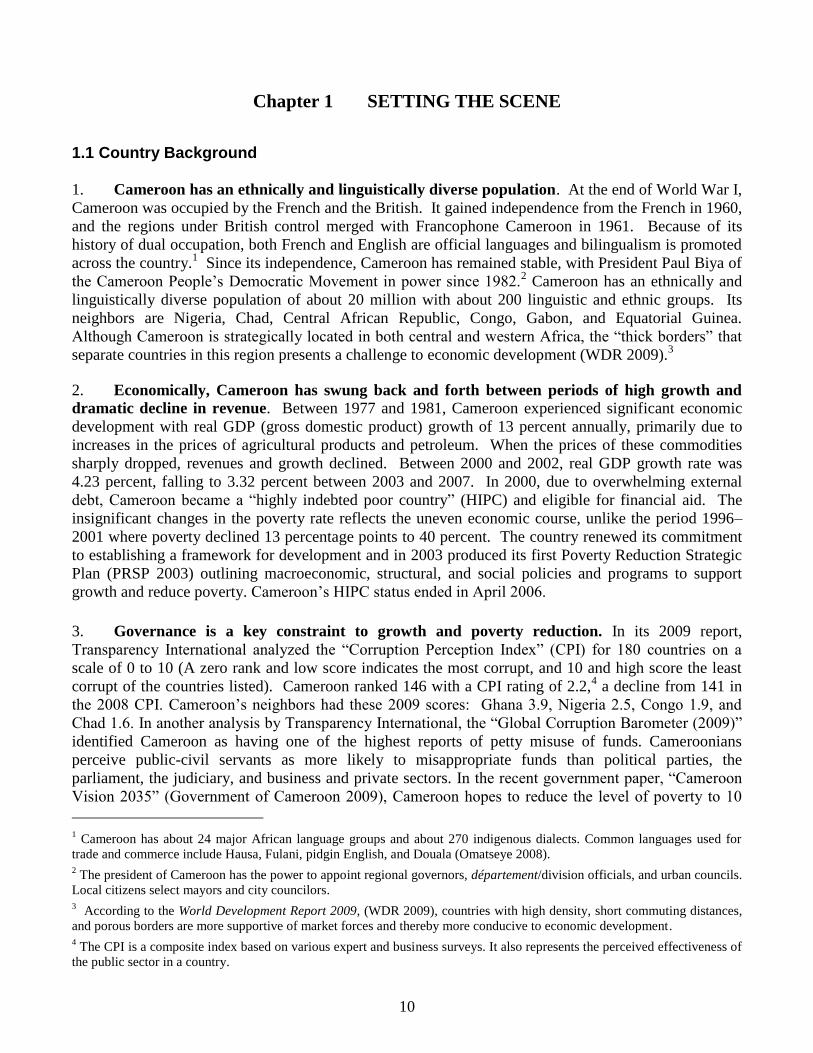
Cameroon
GOVERNANCE AND MANAGEMENT IN THE
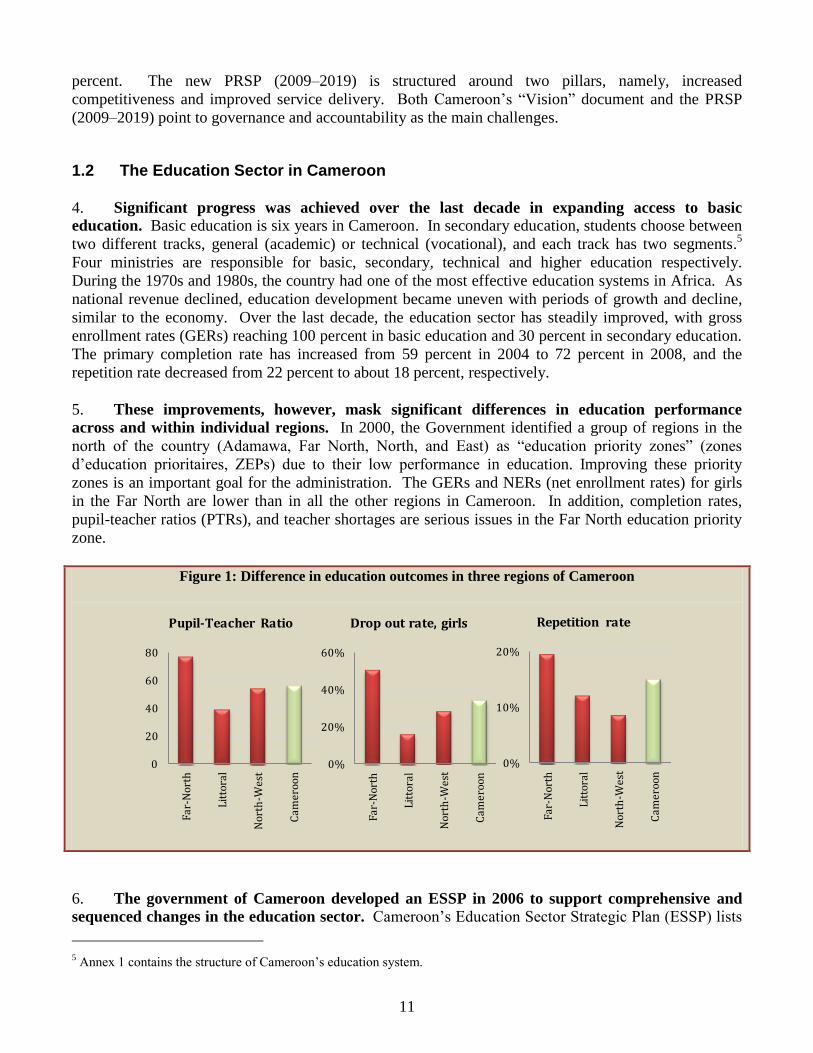
EDUCATION SECTOR
March 2012
Africa Region

ACKNOWLEDGMENTS
This report is the result of a collaborative effort between the Government of Cameroon, the
Cameroon Country Management Unit and the Education Unit, Africa Region (AFTED).
The Ministry of Basic Education and the Ministry of Secondary Education fully supported its
development, during field visits and dissemination workshops. The insights and contribution of
Paul Emog Valentin (Director, Human Resources, Ministry of Basic Education) are particularly
acknowledged.
The World Bank team comprised Michel Welmond (Lead Education Specialist), Daniel Murphy
(Senior Country Officer), Cia Sjetnan (Senior Country Officer), Fadila Caillaud (Education
Economist), Abel Paul Basile Bove (Governance Specialist), Victoire Ngounoue (Consultant), and
Natalie Tchoumba Bitnga (Program Assistant). The study was designed and conducted by Prema
Clarke (Consultant) and Vincent Perrot (Consultant). Norosoa Andrianaivo (Program Assistant)
provided document processing support.
Valuable advice and comments were also provided by the report’s peer reviewers: Fabien Eboussi
Boulaga (Professor, University of Cameroon and Governance Advisor), Verena Fritz (Governance
Specialist), Cornelia Jesse (Operations Officer), Sahr Kpundeh (Senior Public Sector Specialist,
Africa Region Operational Quality and Knowledge Services), Elizabeth Ninan (Human
Development Specialist), Emiliana Vegas (Senior Education Economist) and Tony Verheijen
(Senior Public Sector Management Specialist).
Finally we gratefully acknowledge the Governance Partnership Facility for providing financial
support for the preparation of this report.
TABLE OF CONTENTS
ACKNOWLEDGMENTS .............................................................................................................. ii
TABLE OF CONTENTS .............................................................................................................. iii
ACRONYMS AND ABBREVIATIONS ....................................................................................... v
EXECUTIVE SUMMARY ........................................................................................................... vi
Introduction ................................................................................................................................ vi
Key Findings .............................................................................................................................. vi
Potential Areas for Governance Reform .................................................................................. viii
Chapter 1 SETTING THE SCENE ..................................................................................... 10
1.1 Country Background ........................................................................................................... 10
1.2 The Education Sector in Cameroon ................................................................................. 11
1.3 Objectives and Analytical Framework ................................................................................ 14
1.4 Study Methodology .......................................................................................................... 17
Chapter 2 GOVERNANCE OF PUBLIC EXPENDITURE IN EDUCATION .................. 19
2.1 Introduction ...................................................................................................................... 19
2.2.1 Budget Allocations ................................................................................................. 19
2.2.2 Central Financial Transfers to Regional Levels of Government ..................... 20
2.2.3 Central Financial Transfers for Regional Administration ................................. 22
2.3 Central Financial Support to Schools ............................................................................... 22
2.3.1 Infrastructure Development .................................................................................. 23
2.3.2 Minimum Package .................................................................................................. 24
2.3.3 Financial Support for Primary and Secondary Schools ................................... 25
2.4 Public Procurement and Expenditure in the Education Sector ........................................ 26
2.4.1 Expenditure below CFA 5 Million ......................................................................... 26
2.4.2 Expenditure above CFA 5 Million ........................................................................ 27
2.4.3 Textbook Procurement .......................................................................................... 28
2.5 Central Monitoring of Expenditure .................................................................................. 29
2.6 Conclusions ...................................................................................................................... 31
Chapter 3 GOVERNANCE OF SYSTEM FUNCTIONING IN EDUCATION ................. 32
3.1 Teachers ........................................................................................................................... 32
3.1.1 Teacher Recruitment ............................................................................................. 32
3.1.2 Registration of Recruited Teachers ..................................................................... 33
3.1.3 Teacher Deployment and Transfers .................................................................... 34
3.1.4 Teacher Work Force and Salary Payments ....................................................... 35
3.2 Schools ............................................................................................................................. 38
3.2.1 Teacher Performance ............................................................................................ 39
3.2.2 Sanctions and Incentives ...................................................................................... 40
3.2.3 Administrative Performance ................................................................................. 41
3.2.4 School Performance .............................................................................................. 43
3.2.5 Community Participation ....................................................................................... 44
3.3 Role of Extra-government Entities in Governance .......................................................... 46
3.4 Conclusions ...................................................................................................................... 48
Chapter 4 MAXIMIZING GOVERNANCE IN EDUCATION ........................................... 49
4.1 The impact of governance on education outcomes .......................................................... 49
4.2 Improving education outcomes through better governance: a roadmap .......................... 51
ANNEXES ..................................................................................................................................... 56
Annexe I: organisation du système et statistiques .......................................................................... 56
Annexe II : les trois régions ............................................................................................................ 58
Annexe III: gestion des infrastructures ........................................................................................... 60
Annexe IV: exemple de « carton » du Ministère des Finances ....................................................... 62
Annexe V: gestion des données dans la délégation départementale du Wouri ............................... 63
Annexe VI: Organigramme des services déconcentrés .................................................................. 67
Annexe VII: exemple de rapport confidentiel sur un enseignant ................................................... 69
Annexe VIII : fiche de suivi séquentiel des enseignants (MINEDUB) .......................................... 73
Annexe IX : rapport d’inspection (MINEDUB) ............................................................................. 74
Annexe X : rapport pour les inspecteurs (MINEDUB) .................................................................. 79
Annexe XI : restitution de l’étude ................................................................................................... 90
Annexe XII : proposition de plan d’action faisant suite aux ateliers .............................................. 92
BIBLIOGRAPHY ......................................................................................................................... 94
CURRENCY EQUIVALENTS
(Exchange Rate Effective as of July 31, 2009)
Currency Unit = CFAF
US$1.00 = CFAF 464.13
FISCAL YEAR
January 1 – December 31
ACRONYMS AND ABBREVIATIONS
AFD Agence Française du Développement (French Development Agency)
BAC Baccalauréat (General certificate of secondary studies, second
cycle)
BEPC Brevet d’études de premier cycle (General certificate of secondary
studies, first cycle)
CAP Certificate of Professional Aptitude
CPDM Cameroon People’s Democratic Movement
CEP Certificat d’études primaires (Primary studies certificate)
CL Class level
CPI Corruption Perception Index
ECAM Enquête Camerounaise auprès des ménages (Cameroon Household
Survey)
EMIS Educational Monitoring Information System
ESSP Education Sector Strategic Plan
EFA-FTI Education for All-Fast Track Initiative
FSLC First School Leaving Certificate
GCE O Level General Certificate of Education, Ordinary Level
GCE A Level General Certificate of Education, Advanced Level
GER Gross enrollment rates
MTEF Medium Term Expenditure Framework
MINEDUB Ministry of Basic Education
MINESEC Ministry of Secondary Education
MINFI Ministry of Budget and Finance
MINFOPRA Ministry of Public Service and Administrative Reform
NER Net enrollment rates
PET survey Public Expenditure Tracking survey
PTA Parents and Teachers Association
PTR Pupil-teacher ratios
SBM School-based management
SIGIPES Système Informatique de gestion intégrés des personnels de l’état et
de la solde (Integrated Management System of the Central
Government Employees and the Payroll)
UNICEF United Nation Children’s Education Fund
WDR World Development Report
ZEP Zone d’éducation prioritaire (Education priority zone)
vi
EXECUTIVE SUMMARY
Introduction
1. This report aims to analyze the extent to which current governance and
management practices contribute to explaining differences in education outcomes, focusing
on three regions of Cameroon: the Littoral, Far North, and North West. The three regions
chosen for this study differ considerably in terms of education performance, with the Far North
being the weakest at one end of the spectrum, and the Littoral region being one of the best at the
other end. The report explores the connections between governance and educational outcomes in
these three regions, using a qualitative approach. In-depth interviews with government officials
and school personnel, observations of school operations, and reviews of documents were used to
analyze governance and accountability in both basic and secondary education. Such approach is
inductive, context sensitive, and naturalistic, based on an iterative process of knowledge
generation.
2. The analytical framework for the study consists of two broad areas, public
expenditure and system functioning. Under public expenditure, the study examines governance
and accountability practices relating to upstream financial decision making and execution. This
includes budget allocations and government transfers, financial transfers to schools, procurement
procedures, and financial management. System functioning covers activities that must take place
consistently over the school year and includes: teachers (recruitment, deployment and transfers,
and remuneration), schools (monitoring of teacher performance, administration, and school
performance), and extra-government entities. In addition, the report reviews contribution of the
community (the citizens and students who are the beneficiary) and the extent to which they are
able to demand acceptable standards of service delivery in education is examined. The section
on extra-government entities briefly looks at their roles and contributions in bringing about good
governance.
Key Findings
3. There are vital strengths identified in governance practices across the three regions. First, regional levels understand their role as implementers of the vision and policies defined by
the Central Ministries of Basic Education and Secondary Education (referred to as the Center).
Therefore, the Center has the potential to positively influence education development within the
regions. Second, ―control missions‖ from the Center that monitor financial performance are well
positioned to help regional governments keep their accounts in order. Third, the contract-teacher
initiative in basic education is an innovative program that is significantly improving the
recruitment and deployment of teachers.
4. Governance and management arrangements contribute to explaining some of the
variation in education outcomes across regions. Several factors limit for instance educational
performance in the Far North. First, financial transfers for administration to this region are much
vii
lower than to the Littoral region, resulting in inadequate management, infrastructure, staffing,
and skills to efficiently manage education. Second, infrastructure development in the Far North
is unsatisfactory due to poor site selection and a high level of collusion between contractors and
the public works department. Third, while the contract primary teacher program has had a
positive influence on teacher quality and education in the low-performing Far North region, it
has not been sufficient to bring it up to par with the other regions examined in this study. As a
result, a larger percentage of PTA teachers without the required qualifications are recruited to
address this shortage, especially in secondary education.
5. The effectiveness of the compact between the policy maker, education provider, and
the beneficiaries is dependent on the instruments and procedures of accountability that
exist at the different levels. Taking into account the demands of the policy maker (the Center),
the compact between the policy maker and the education provider (regional delegations) is clear
and effective. The compact between the education provider and the school is fragile in basic
education, due to a lack of clearly defined standards and expectations, vis-à-vis school
functioning and outcomes. The monitoring of school and teacher performance is particularly
weak in basic education. There is more accountability in secondary education as a result of the
high stakes placed on certification and examinations.
6. Vulnerable areas, prone to political interference, and the reported misuse of funds
and rent seeking were identified. These areas include infrastructure development and teacher
recruitment, deployment, and transfers in both basic and secondary education. In secondary
education, specifically, there are reports of irregular financial transfers in the conduct of
examinations.
7. There are complexities and ambiguities in how decentralization is understood and
implemented in Cameroon. Decentralization in Cameroon mainly consists of a nascent form of
administrative deconcentration. Regional delegations are responsible for teacher transfers and
the appointment of school heads (principals). Centralized financial transfers, along with the
perception among regional delegations that they are mainly implementers of MINEDUB and
MINESEC programs, do not support effective deconcentration. Decentralization will be better
implemented when regions and municipalities are made more financially accountable with a
corresponding mandate for reaching critical educational outcomes.
Box 1: Main constraints to the governance and accountability of public expenditure and system
functioning were identified across regions.
Inadequate resources result in uniform under-financing of budgets in all regions. In response to this
inadequate financing, parents and communities have assumed the responsibility for a substantial ―top-
up‖ of the budget, complicating the process of budget planning and fund allocations.
Fund flows do not correspond with the hierarchal structure of government institutions in the regions.
Financial transfers are made from the Center directly to each regional level of education
administration. Thus, accountability is directed to the Center rather than to the appropriate next or
higher level in the regional administration. This process weakens financial accountability in the
regions.
The Center makes financial transfers to schools without a clear system of accounting and reporting.
Responsibility for monitoring accounts and expenditure lies with control missions organized by the

viii
Center. These missions are too infrequent and unsystematic to ensure financial accountability.
Public procurement is based on list prices, which are determined at the national level, and do not take
into account price variations across the regions. This creates the potential for informal misuse of
funds.
Political interference in the site selection for new school construction leads to waste and duplication
of resources, as well as inappropriate or inconvenient sites.
The process of teacher recruitment in secondary education is time consuming and inefficient. Political
interference in teacher recruitment, deployment, and transfer in both basic and secondary education is
consistently reported.
In basic education, accountability for school functioning and performance is weak and the monitoring
of teachers’ instruction in the classroom (time and content achievement) is fractured and ineffective.
In both basic and secondary education, a comprehensive database of teachers’ service records, crucial
for managing the teacher workforce, is unavailable.
Potential Areas for Governance Reform
8. The first area deals with establishing and implementing benchmarks and standards
for performance at the school and regional levels of government. While schools and regional
agencies appear to have some standards, they are not comprehensive enough to support quality
improvement in education. Establishing appropriate standards across institutions is critical.
Implementing these standards will involve defining responsibilities, providing the relevant tools
and templates, improving skill in documentation and analysis, and developing strategies for
communication and feedback. Expanding the role of the PTAs, by orienting them to the
importance of teaching and learning, would further enhance the implementation of standards and
improvements in the quality of education. Upgrading the abilities of the inspectorates/inspection
d’arrondissements (part of the regional delegation) to monitor the implementation of standards at
the school level must be a part of this reform.
9. The second area highlights the importance of improving teacher management and
addressing governance issues. Ring fencing, improving transparency in teacher recruitment,
and protecting teacher deployment from political interference are major challenges. Moreover, a
common, agreed-upon, and easily understandable performance monitoring instrument introduced
for all teachers in basic education is critical to improving teacher management. Adequate
documentation and reporting of teacher performance on a regular basis will enable the system to
track instructional quality. Finally, implementing an effective system of incentives and sanctions
that addresses shortcomings and violations of the standards at the school level will be crucial to
improving teacher management.
10. The third area focuses on the equitable distribution of resources and the effective
monitoring of budgets and expenditure. Considering the substantial contribution of parents,
linking national allocations of funds to citizen-based budgeting will be crucial. Instead of the
minimum package and financial transfers, Central financing for schools could be based on a
budget developed by each school that takes into account PTA funds and in-kind support
available such as instructional aids, furniture etc. Targeting financial allocations to weaker
regions is also important. To ensure more accountability for expenditures and financial
accounting, it will be helpful to augment Center-fielded control missions with regional

ix
involvement in monitoring. Blacklisting problem contractors with publically documented sub-
standard construction of schools, especially in the Far North, will demonstrate commitment to
improving governance.
11. The fourth area is establishing a system of public transparency to promote good
governance. Granting a more structured role to local leaders and expanding the involvement of
the media to help monitor the school system would be helpful. Accountability and good
governance can also be facilitated through regular assessments and independent surveys,
complemented by opportunities for citizens to evaluate and share their perceptions regarding the
quality of service delivery.
10
Chapter 1 SETTING THE SCENE
1.1 Country Background
1. Cameroon has an ethnically and linguistically diverse population. At the end of World War I,
Cameroon was occupied by the French and the British. It gained independence from the French in 1960,
and the regions under British control merged with Francophone Cameroon in 1961. Because of its
history of dual occupation, both French and English are official languages and bilingualism is promoted
across the country.1 Since its independence, Cameroon has remained stable, with President Paul Biya of
the Cameroon People’s Democratic Movement in power since 1982.2 Cameroon has an ethnically and
linguistically diverse population of about 20 million with about 200 linguistic and ethnic groups. Its
neighbors are Nigeria, Chad, Central African Republic, Congo, Gabon, and Equatorial Guinea.
Although Cameroon is strategically located in both central and western Africa, the ―thick borders‖ that
separate countries in this region presents a challenge to economic development (WDR 2009).3
2. Economically, Cameroon has swung back and forth between periods of high growth and
dramatic decline in revenue. Between 1977 and 1981, Cameroon experienced significant economic
development with real GDP (gross domestic product) growth of 13 percent annually, primarily due to
increases in the prices of agricultural products and petroleum. When the prices of these commodities
sharply dropped, revenues and growth declined. Between 2000 and 2002, real GDP growth rate was
4.23 percent, falling to 3.32 percent between 2003 and 2007. In 2000, due to overwhelming external
debt, Cameroon became a ―highly indebted poor country‖ (HIPC) and eligible for financial aid. The
insignificant changes in the poverty rate reflects the uneven economic course, unlike the period 1996–
2001 where poverty declined 13 percentage points to 40 percent. The country renewed its commitment
to establishing a framework for development and in 2003 produced its first Poverty Reduction Strategic
Plan (PRSP 2003) outlining macroeconomic, structural, and social policies and programs to support
growth and reduce poverty. Cameroon’s HIPC status ended in April 2006.
3. Governance is a key constraint to growth and poverty reduction. In its 2009 report,
Transparency International analyzed the ―Corruption Perception Index‖ (CPI) for 180 countries on a
scale of 0 to 10 (A zero rank and low score indicates the most corrupt, and 10 and high score the least
corrupt of the countries listed). Cameroon ranked 146 with a CPI rating of 2.2,4 a decline from 141 in
the 2008 CPI. Cameroon’s neighbors had these 2009 scores: Ghana 3.9, Nigeria 2.5, Congo 1.9, and
Chad 1.6. In another analysis by Transparency International, the ―Global Corruption Barometer (2009)‖
identified Cameroon as having one of the highest reports of petty misuse of funds. Cameroonians
perceive public-civil servants as more likely to misappropriate funds than political parties, the
parliament, the judiciary, and business and private sectors. In the recent government paper, ―Cameroon
Vision 2035‖ (Government of Cameroon 2009), Cameroon hopes to reduce the level of poverty to 10
1 Cameroon has about 24 major African language groups and about 270 indigenous dialects. Common languages used for
trade and commerce include Hausa, Fulani, pidgin English, and Douala (Omatseye 2008). 2 The president of Cameroon has the power to appoint regional governors, département/division officials, and urban councils.
Local citizens select mayors and city councilors. 3 According to the World Development Report 2009, (WDR 2009), countries with high density, short commuting distances,
and porous borders are more supportive of market forces and thereby more conducive to economic development. 4 The CPI is a composite index based on various expert and business surveys. It also represents the perceived effectiveness of
the public sector in a country.
11
percent. The new PRSP (2009–2019) is structured around two pillars, namely, increased
competitiveness and improved service delivery. Both Cameroon’s ―Vision‖ document and the PRSP
(2009–2019) point to governance and accountability as the main challenges.
1.2 The Education Sector in Cameroon
4. Significant progress was achieved over the last decade in expanding access to basic
education. Basic education is six years in Cameroon. In secondary education, students choose between
two different tracks, general (academic) or technical (vocational), and each track has two segments.5
Four ministries are responsible for basic, secondary, technical and higher education respectively.
During the 1970s and 1980s, the country had one of the most effective education systems in Africa. As
national revenue declined, education development became uneven with periods of growth and decline,
similar to the economy. Over the last decade, the education sector has steadily improved, with gross
enrollment rates (GERs) reaching 100 percent in basic education and 30 percent in secondary education.
The primary completion rate has increased from 59 percent in 2004 to 72 percent in 2008, and the
repetition rate decreased from 22 percent to about 18 percent, respectively.
5. These improvements, however, mask significant differences in education performance
across and within individual regions. In 2000, the Government identified a group of regions in the
north of the country (Adamawa, Far North, North, and East) as ―education priority zones‖ (zones
d’education prioritaires, ZEPs) due to their low performance in education. Improving these priority
zones is an important goal for the administration. The GERs and NERs (net enrollment rates) for girls
in the Far North are lower than in all the other regions in Cameroon. In addition, completion rates,
pupil-teacher ratios (PTRs), and teacher shortages are serious issues in the Far North education priority
zone.
Figure 1: Difference in education outcomes in three regions of Cameroon
6. The government of Cameroon developed an ESSP in 2006 to support comprehensive and
sequenced changes in the education sector. Cameroon’s Education Sector Strategic Plan (ESSP) lists
5 Annex 1 contains the structure of Cameroon’s education system.
0
20
40
60
80
Fa
r-N
ort
h
Lit
tora
l
No
rth
-Wes
t
Ca
me
roo
n
Pupil-Teacher Ratio
0%
20%
40%
60%
Far-
Nor
th
Litt
oral
Nor
th-W
est
Cam
ero
on
Drop out rate, girls
0%
10%
20%
Far-
Nor
th
Litt
oral
Nor
th-W
est
Cam
ero
on
Repetition rate
12
key outcomes for the education sector (which are captured in some of the Millennium Development
Goals). The main objectives of the ESSP are: i) Improving universal basic education by 2015 by
reducing grade repetition, increasing the number of teachers in the system, reducing pupil-teacher ratios,
increasing pedagogical resources in the classroom, and improving educational management and
administration; ii) Expanding preschool coverage; iii) Introducing reforms in higher, technical, and
secondary education; iv) Regulating access to post-primary education according to the needs of the job
market.
7. The three regions included in this study represent a range of performance on key
educational indicators. The selection regions comprise two Francophone regions (Littoral and Far
North, also a Priority Education Zone), and an Anglophone region (North West). The Littoral and North
West regions are relatively high performers when compared to the Far North, which is one of the
weakest regions in Cameroon. Table 1 illustrates the differences in educational outcomes that form the
basis of this analysis of governance across the three regions.6 The regions significantly vary in terms of
completion rates and pass rates at the common entrance exam test for high school.7 Only 26 percent of
the students are successful in the Far North, in contrast to 74 percent in the Littoral region and 59
percent in the North West region. As a result, the proportion of students that graduate from basic
education and go on to secondary in the Far North (35 percent) is about half that of the Littoral region
(66 percent). Determinants of education quality vary also considerably across regions, with pupil-
teacher ratio in the public schools of the Littoral region of 47:1. By contrast, the PTR in the North West
region is 77:1, which is not optimal, but is far better than the Far North region’s PTR of 152:1.
Table 1. Education performance in basic education in the three regions
Far North Littoral North West
Population 542,080 335,185 361,451
Students enrolled 545,205 340,713 346,794
Gross enrollment rate (GER)
GER all students 100.58 101.65 95.94
GER girls 81.30 99.95 93.09
Net enrollment rate (NER)
NER all students 82.91 81.14 75.41
NER girls 67.76 80.22 73.60
Completion rate
All students 50.69 88.38 76.28
Girls 35.56 88.10 74.69
Learning levels* (% successful students)
CEP 72.70% 72.42% 64.47%
FSLC 86.45% 77.89% 71.58%
Common entrance exam 26.14% 73.63% 59.20%
6 Annex I contains overall statistics on basic and secondary education across the regions. The Republic of Cameroon’s
―Education Country Status Report‖ (2003) provides a detailed analysis of the sector. Annex II contains a brief description of
the three regions. 7 At the end of primary, students sit for the Certificat d’études primaries (CEP) in the Francophone regions, and the First
School Leaving Certificate (FSLC) in the Anglophone regions. These examinations are organized by MINEDUB. In addition
to these examinations, a common entrance exam, organized by MINESEC, determines the transition of students from basic to
secondary school.

13
Schools and teachers in public schools
No. of schools 1,483 638 920
Total no. of teachers 3,991 6,382 4,706
No. of parent teachers 3,120 839 1,676
No. of teachers needed 8,537 360 2,504
Pupil-teacher ratios* 152:1 47:1 77:1
* Leaflet, ―MINEDUB Basic Education in Figures 2008 Edition‖; MINEDUB and MINESEC, Examination
Board, Government of Cameroon.
Source: MINEDUB Statistical Yearbook 2007/2008.
Table 2. Education performance in secondary education in the three regions8
Far North Littoral North West
Total enrollment in secondary education
Enrollment in general track 76,763 156,204 87,477
Enrollment in vocational track 7,249 44,779 21,491
Enrollment in public secondary education
Enrollment in general track 71,974 83,049 56,304
Enrollment in vocational track 7,131 25,823 18,337
Change in total enrollment 2006/2007 to 2007/2008 in general secondary education
No. of students enrolled in 2006/2007 69,071 132,023 72,663
Increase in enrollment in 2007/2008 7,692 24,181 14,814
Increase/decrease (percent) 11% 18% 20%
Change in total enrollment 2006/2007 to 2007/2008 vocational schools
No. of students enrolled in 2006/2007 14,041 31,273 16,062
Increase/decrease in enrollment in 2007/2008 - 6,792 13,506 5,429
Increase/decrease (percent) -48% 43% 34%
Transition from basic to secondary (public) education
Enrollment in CM2 (last year of primary) 60,218 51,870 47,108
First year enrollment, general and vocational
secondary tracks
20,960 34,138 23,284
Percent of transition 35% 66% 49%
Learning levels* (% successful students)
BEPC 35% 42% 67%
GCE O/L 51% 54% 76%
BAC 38% 59% 67%
GCE A/L 30% 63% 88%
Public schools and teachers
No. of civil servant teachers in secondary schools 788 3,490 3,415
No. of temporary teachers 1,185 2,542 289
No. of secondary public schools 142 105 171
* Learning levels: BEPC = Brevet d’études de premier cycle [General certificate of secondary studies]:
GCE O/L = General Certificate of Education, Ordinary Level; BAC = Baccalauréat; GCE A/L = General
Certificate of Education, Advanced Level.
Source: MINESEC Annual Statistics 2006/2007 and 2007/2008.
8 Raw EMIS data for secondary education is available for 2006/2007 and 2007/2008. No analysis of this data has been
undertaken, so no enrollment (or completion) rates, such as GERs or NERs, are available. In order to maintain the relevance
of this table for public sector officials, only data available and produced by MINEDUB and MINESEC was used in this
report. No other reports were used or calculations made to arrive at rates.
14
1.3 Objectives and Analytical Framework
8. This report seeks to provide the Government and its partners with a detailed analysis of
educational processes at the regional and school level and to highlight how these directly impact
education outcomes. Providing education is a complex task that has to be sustained over time.9
It
involves students in a range of age groups, public institutions at different levels, a variety of processes
that occur at the same time, continuous interaction between different groups (students, parents, teachers,
and administrators), reliable availability and distribution of materials (such as textbooks, paper, and
pencils), and a system that must effectively function for 10 months of the year. Focusing on ―business
as usual‖, this study explores whether existing oversight systems can ensure the even application of
standards, incentives, and sanctions. It also discusses the operational rules that define the relationship
between the central government in Yaoundé and regional government institutions.
9. While the study highlights governance practices across regions, it also identifies areas or
aspects within regions that may need rethinking and reform. By presenting a comparative analysis
of governance at the regional level for basic and secondary education, the report identifies governance
issues and highlights critical areas where the Ministry of Basic Education (MINEDUB) and Ministry of
Secondary Education (MINESEC) can improve governance and sector performance. The report
provides recommendations on key strategies and actions that could improve governance in school
education.
10. The analytical framework for the study consists of two broad areas, public expenditure and
system functioning. Taking into account the outcomes that education expects to achieve, good
governance can be defined as the presence and implementation of standards, rules, regulations, and
processes to ensure effective public expenditure and efficient system functioning.10
Under public
expenditure, the study examines governance and accountability practices relating to upstream financial
decision making and execution. This includes budget allocations and government transfers, financial
transfers to schools, procurement procedures, and financial management. System functioning covers
activities that must take place consistently over the school year and includes: teachers (recruitment,
deployment and transfers, and remuneration), schools (monitoring of teacher performance,
administration, and school performance), and extra-government entities. In addition, the report reviews
contribution of the community (the citizens and students who are the beneficiary) and the extent to
which they are able to demand acceptable standards of service delivery in education is examined.
Figure 2 gives more details on each component of the analytical framework.
9 This is in contrast, for example, to building a road, where the task is completed within a relatively short period and includes
only financing, labor, and construction materials. The education sector has the largest number of employees and beneficiaries
(students). In fact, the highest number of civil servants (78,340) is in Cameroon’s education sector, followed by health
(42,073), and police (15,967). 10
System functioning refers to the management of teachers in their task of instruction and the consistent operation of schools.

15
Figure 2: Analytical framework
Public expenditure for education
• The Ministry of Budget and Finance (MINFI) is responsible for financing the entire education sector and determines the allocations to the regions for both operational and capital/development expenditure. MINFI makes these decisions in collaboration with MINEDUB and MINESEC. This report first examines whether the criteria used for planning and fund allocations for the three regions (Littoral, Far North, and North West) supports accountability. Second, it reviews fund flows among the Center, the regional administration units, and the schools, and the impact of community contributions on the targeted use of public finances. Third, the study focuses on whether regional fund allocations are adequate to support an environment of accountability and the activities necessary to monitor progress and oversee expenditures.
Budget allocations and financial transfers:
•Schools are the primary focus and ensuring that they receive an appropriate amount of funds and materials is basic to good governance (World Bank 2007). The Center supports schools in three ways, namely, through infrastructure development, adequate supply of essential school items, and financing.
Central financing for schools:
•A good public procurement system purchases quality inputs at the lowest cost available. It avoids wastage, prevents the misuse of funds, and makes full use of all available resources. The study reviews the current policies and procedures for the procurement of goods and services above and below CFA 5 million (CFA = Communauté Financiére Africaine franc). Textbook procurement constitutes a significant component of public expenditure (Abadzi 2006; Nannyongo 2007). With no other reading material available, it is critical that each child in the classroom have a textbook. Accordingly, the study also looks at how well the production and distribution of textbooks work.
Public procurement and expenditure:
• A well-established financial management system with appropriate, systematic oversight can facilitate good governance. Cameroon executes regular audits, and the study reviews whether these evaluations are sufficient to ensure financial accountability in the regions.
Financial monitoring:

16
System Functioning
•Teacher recruitment: For the right teachers to join the workforce, the recruitment process must be transparent and based on a clear set of principles and criteria. Avoiding favoritism, nepotism, and purchased positions is critical to this process.
•Teacher deployment and transfers: Newly recruited teachers and teachers in the workforce must be deployed appropriately, keeping in mind the needs and status of educational outcomes across the different regions. If the distribution of teachers is inequitable or disproportionate, the functioning of the system will be adversely affected because some schools will receive too many teachers and other schools too few.
•Teacher workforce and salary payments: Teachers’ salary payments constitute one of the largest items of expenditure in the education sector. Encouraging the commitment and motivation of teachers is related to adequate remuneration and regular salary payments. Favoritism is defined as the recruitment of one’s friends and known individuals without vetting against established criteria or standards. Nepotism is the recruitment of one’s relatives (Hallak and Poisson 2005), again outside the established vetting process.
Teachers
•Teacher performance: School functioning is dependent on the consistent presence of teachers in the classroom and the time spent by teachers on instruction (time on task). In other words, teacher attendance and time on task are basic proxies for evaluating school functioning. Moreover, established procedures for the formal and regular review of teacher performance and sanctions for inadequate performance are important for government officials to understand and address issues at the school level.
•Administrative performance: Effective system functioning is dependent on the quality of administration in regional institutions. Relevant job descriptions and performance expectations for government officials that are consistent across regions are critical to this process. In order to perform their duties, administrative staff requires well-equipped offices and sufficient tools, as well as knowledge and skill for management, data maintenance, and analysis.
•School performance: An operational oversight system at the school level is crucial for quality service delivery. Consistency in collecting and maintaining data on student attendance and achievement reflects the commitment and abilities of the local administration to manage the school. The role of inspections to ensure effective school performance is also pertinent to the topic of accountability.
•Community participation: During the last decade, numerous grassroots activities and campaigns increased the awareness of communities about the policies and performance of government programs (World Bank 2006). This information draws the attention of community members to the importance of education and encourages them to voice their demand for action and proper services (Banerjee et al. 2008). The analysis here explores the extent to which communities are involved with education and are able to share their perceptions of service delivery.
Schools
•This study also examines the roles of the media, traditional authorities, and teacher unions in governance. All three entities can play a constructive role in system functioning. They can be involved in both monitoring and supporting school functioning, as well as calling government institutions to account.
Extra-government Entities

17
1.4 Study Methodology
11. The study is qualitative, based on a purposive sample of three regions, namely the Littoral,
Far North, and North West. Qualitative research is inductive, where situations and contexts are
examined with few preconceived hypotheses or conclusions.11
This type of research is often referred to
as ―naturalistic.‖ General knowledge and perceptions are used to interview individuals and observe
activities in their natural setting to obtain a more in-depth understanding of institutional structures and
decision-making processes. Qualitative analysis is also iterative and, therefore, the knowledge of the
researcher in the beginning of the study is challenged, expanded, or reconceived through interviews and
observations.
12. The study uses qualitative method for two reasons. First, this approach furthers the findings of
quantitative research in the area of governance (Campos and Pradhan 2007).12
For example, quantitative
methods used in Reinikka and Svensson (2004) study highlights the financial leakages in the transfer of
funds to schools. Qualitative research, on the other hand, can uncover aspects of sector management
that allows this to happen, such as inadequate processes, vested decision-making and vulnerable agents.
Second, qualitative research uses in-depth interviewing, which presents more opportunities for probing
and arriving at a contextually relevant expansion of knowledge about the constraints to good
governance.
13. In addition to qualitative data, the report includes an analysis of quantitative information
relevant to governance and accountability, generated from the Educational Monitoring Information
System (EMIS 2007 and 2008), the Household Survey (ECAM 2004), and the Public Expenditure
Tracking Survey (PET Survey 2005). Quantitative information is used to substantiate or expand the
discussion of governance. Available research and studies on governance topics and education in
Cameroon also informs the qualitative analysis used in this study.
14. This study encompasses all three levels of the education system, namely, the local, regional,
and national levels. The national (or macro) level refers to the central government in Yaoundé and the
local (or micro) level to the school. In between the national government and the schools are three
regional levels of government (meso level). In the Anglophone region, basic education includes
regional delegations, division delegations, and sub-division inspectorates; in secondary education, there
are just regional and division delegations. In the Francophone region, while the entities are the same, the
French translations are: délégation régionale, délégation départementale, and inspection
d'arrondissement, respectively.13
Box 2 describes how each level was examined as part of the study.
11
There are numerous publications on qualitative research. See especially M.Q. Patton, 1990, Qualitative Evaluation and
Research Methods, 2nd ed. (Thousand Oaks, CA, USA: Sage Publications); and N.K. Denzin and Y.S. Lincoln, 2005, ―The
Handbook of Qualitative Research,‖ 3rd ed. (Thousand Oaks, CA, USA: Sage Publications). 12
The analysis of governance is often based on perceptions and the ―bluntness‖ of perception-based indicators used in
quantitative analysis is seen to be limited to directing reform efforts. 13
For clarity, the English version of this report includes ―département‖ when using the term division, and ―arrondissement‖
when referring to the inspectorate.
18
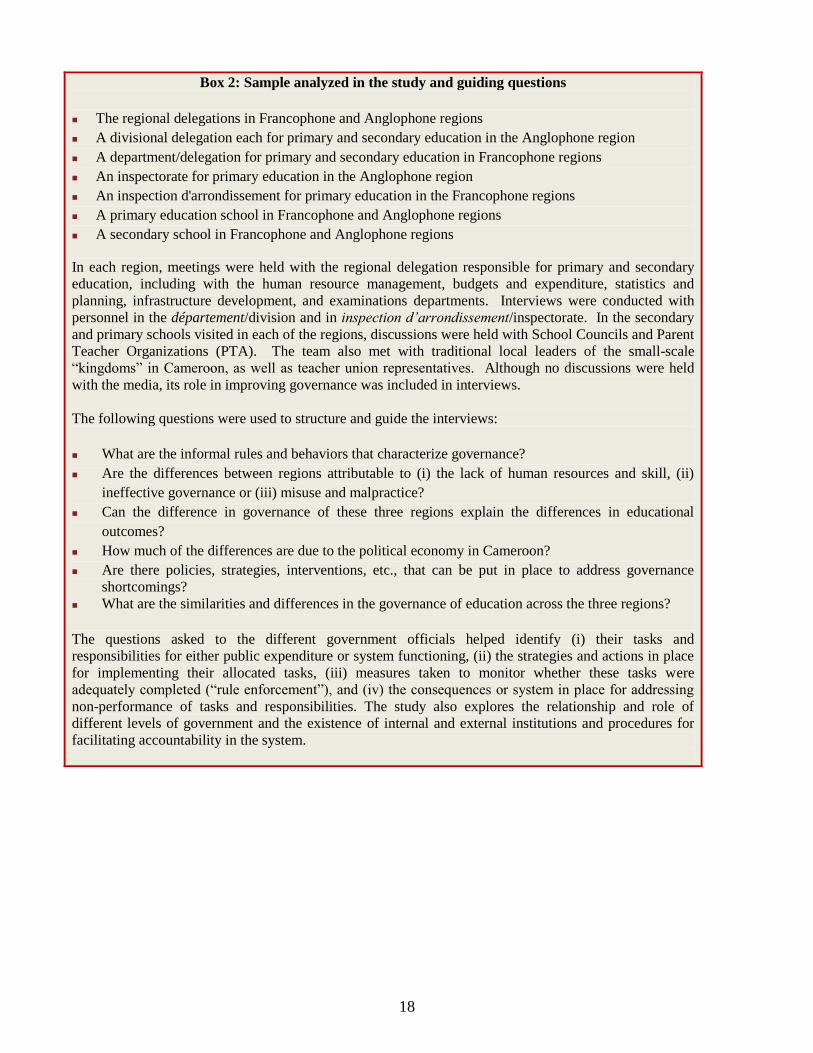
Box 2: Sample analyzed in the study and guiding questions
The regional delegations in Francophone and Anglophone regions
A divisional delegation each for primary and secondary education in the Anglophone region
A department/delegation for primary and secondary education in Francophone regions
An inspectorate for primary education in the Anglophone region
An inspection d'arrondissement for primary education in the Francophone regions
A primary education school in Francophone and Anglophone regions
A secondary school in Francophone and Anglophone regions
In each region, meetings were held with the regional delegation responsible for primary and secondary
education, including with the human resource management, budgets and expenditure, statistics and
planning, infrastructure development, and examinations departments. Interviews were conducted with
personnel in the département/division and in inspection d’arrondissement/inspectorate. In the secondary
and primary schools visited in each of the regions, discussions were held with School Councils and Parent
Teacher Organizations (PTA). The team also met with traditional local leaders of the small-scale
―kingdoms‖ in Cameroon, as well as teacher union representatives. Although no discussions were held
with the media, its role in improving governance was included in interviews.
The following questions were used to structure and guide the interviews:
What are the informal rules and behaviors that characterize governance?
Are the differences between regions attributable to (i) the lack of human resources and skill, (ii)
ineffective governance or (iii) misuse and malpractice?
Can the difference in governance of these three regions explain the differences in educational
outcomes?
How much of the differences are due to the political economy in Cameroon?
Are there policies, strategies, interventions, etc., that can be put in place to address governance
shortcomings?
What are the similarities and differences in the governance of education across the three regions?
The questions asked to the different government officials helped identify (i) their tasks and
responsibilities for either public expenditure or system functioning, (ii) the strategies and actions in place
for implementing their allocated tasks, (iii) measures taken to monitor whether these tasks were
adequately completed (―rule enforcement‖), and (iv) the consequences or system in place for addressing
non-performance of tasks and responsibilities. The study also explores the relationship and role of
different levels of government and the existence of internal and external institutions and procedures for
facilitating accountability in the system.

19
Chapter 2 GOVERNANCE OF PUBLIC EXPENDITURE IN EDUCATION
2.1 Introduction
15. Efficient management and government of public spending on education are key to ensuring
the system performance. Public expenditure on education represents a large share of total public
spending in Cameroon (see Table xx for more details). Optimizing these resources is therefore crucial
to ensuring good education outcomes for all children. Governance of public financing in the education
sector includes the following areas: (i) budget allocations and financial transfers to the regions; (ii)
central financing for schools, which includes infrastructure development, the ―minimum package‖ of
supplies and financial transfers; (iii) public procurement and expenditure in the education sector; and
(iv) procedures for financial monitoring. These areas constitute upstream expenditure in the education
sector and the following discussion focuses on effectiveness, efficiency, and accountability of each of
these dimensions.
Table 3. Central financial allocations for basic and secondary education
in CFA millions
2007 2008 2009
Total budget 2,251,000 2,482,000 2,301,400
Budget allocated for education 329,632 358,279 402,770
% allocation for education 14.6% 14.4% 17.5%
Budget allocated for basic education 121,929 147,396 153,102
% budget allocated for basic education 37.0% 41.1% 38.0%
Budget allocated for secondary education 166,824 168156 204,507
% budget allocated for secondary education 50.6% 46.9% 50.8%
Source: MINEDUB and MINESEC budget documents.
2.2 Budget Allocations and Financial Transfers
16. This discussion examines three aspects of budget allocations and financial transfers: the process
of planning and budget allocations to regions; the procedures for financial transfers to the regions; and
the amounts available for administration.
2.2.1 Budget Allocations
17. Decisions on the allocation of the budget are centralized and hardly take into account the
specific needs of the different regions and delegations. MINFI, in collaboration with the Central
Ministries of Basic Education and Secondary Education (known as the Center), decides on the amounts
to be distributed to regional and sub-regional delegations. Supposedly this process is a bottom-up one,
with regional delegations putting forward their needs during the budget preparation, and specifying the
amount of funding required for each item in the budget. However, in the process of financial
allocations, the Center systematically underfunds regional budgets by a certain percentage. Funds

20
allocated to the regional level do not vary much from year to year, and both the basic and secondary
education levels receive a similar amount. This constant lack of correspondence to what is requested
promotes a visible lack of seriousness and motivation to analyze school performance and (accordingly)
annual financial requirements.14
18. There is a move to change this pattern and to work with budgets prepared by the regional
delegations based on actual need. Budget decisions should be based on the number of students,
classrooms, and teachers in each region. Considering that the financing of education is centrally
determined, it is still unclear how this process will unfold in practice. In order for this change in budget
and expenditure planning to be effective, it is important that the Center develop the capacity for fiscal
analysis at the regional level and to ensure that true financial needs at the school and
département/division levels can be determined. It will involve deliberate inter-level collaboration and
transparency in financial transactions, which is a challenge, considering the existing structure of
financing in the sector.
19. The substantial financial contribution of parents complicates budget planning and execution
and prevents to some extent the achievement of an equitable distribution of resources. Except for
parent contributions to teachers’ salaries (described later in this report), the total amount of parents’
financial support for education is not known. Parent contributions reflect the commitment of
communities to school activities, and may in some cases promote the efficient use of funds. In this
sense, parents are literally investing in the educational performance of their children. However, within
this context of multiple sources of financing, the need for budget planning and execution becomes even
more overwhelming. First, the dependence on funds from parents and the community, and the lack of
clear policies related to this support, constrains the government’s ability to ensure equitable distribution
of resources to regions and schools. Second, although the PTA is expected to declare the size of its
contribution to the school budget, it is not possible to predict in advance how much parents and other
community well-wishers will voluntarily contribute to the school. This level of unpredictability poses a
problem for government decision-making and budget allocation to the regions.15
20. Detailed information on parents’ contribution to the public education system is needed to
make the system more equitable, transparent and efficient. Consistent and systematic data collected
about parents’ incomes and the community’s ability to finance school activities could facilitate equity in
school budgeting. Furthermore, it could prevent the elite capture of government funds (described in
more detail later). In addition to regional levels databases on parent contributions, an analysis of data
from household surveys would allow more informed and equitable allocations.
2.2.2 Central Financial Transfers to Regional Levels of Government
21. Education financing in Cameroon for both basic and secondary education is structurally
“centralized” rather than “vertically” organized. It is centralized in that the Center provides funds
directly to the regional delegations (i.e., the départements/divisions, and to the inspection
14
Uniformity in budget allocations from year to year is normal. However, in developing country contexts, when universal
education is not yet achieved, the financial requirements for teachers, classrooms, and instructional materials will change year
to year, necessitating a corresponding variation in budget allocations. 15
If parents know that their contributions will reduce the amount of money allocated by the government to the school, then
there appears to be a corresponding reduction in their support. This was the case in the Littoral region.
21
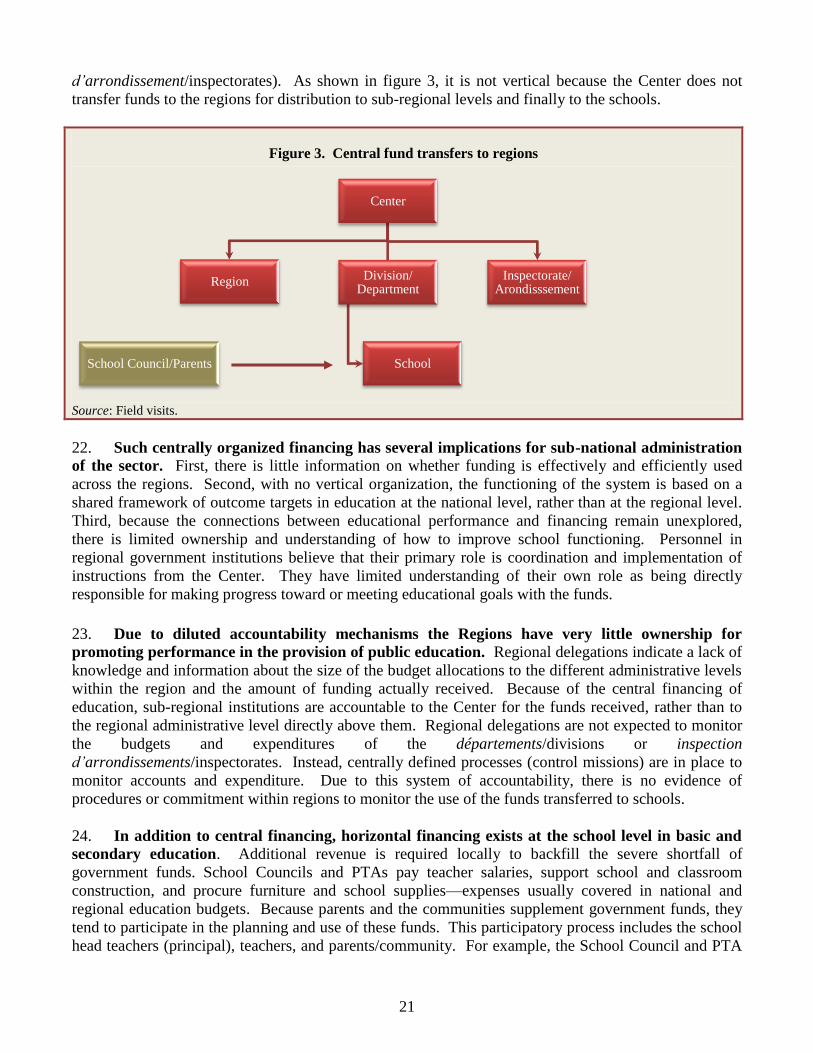
d’arrondissement/inspectorates). As shown in figure 3, it is not vertical because the Center does not
transfer funds to the regions for distribution to sub-regional levels and finally to the schools.
Figure 3. Central fund transfers to regions
Source: Field visits.
22. Such centrally organized financing has several implications for sub-national administration
of the sector. First, there is little information on whether funding is effectively and efficiently used
across the regions. Second, with no vertical organization, the functioning of the system is based on a
shared framework of outcome targets in education at the national level, rather than at the regional level.
Third, because the connections between educational performance and financing remain unexplored,
there is limited ownership and understanding of how to improve school functioning. Personnel in
regional government institutions believe that their primary role is coordination and implementation of
instructions from the Center. They have limited understanding of their own role as being directly
responsible for making progress toward or meeting educational goals with the funds.
23. Due to diluted accountability mechanisms the Regions have very little ownership for
promoting performance in the provision of public education. Regional delegations indicate a lack of
knowledge and information about the size of the budget allocations to the different administrative levels
within the region and the amount of funding actually received. Because of the central financing of
education, sub-regional institutions are accountable to the Center for the funds received, rather than to
the regional administrative level directly above them. Regional delegations are not expected to monitor
the budgets and expenditures of the départements/divisions or inspection
d’arrondissements/inspectorates. Instead, centrally defined processes (control missions) are in place to
monitor accounts and expenditure. Due to this system of accountability, there is no evidence of
procedures or commitment within regions to monitor the use of the funds transferred to schools.
24. In addition to central financing, horizontal financing exists at the school level in basic and
secondary education. Additional revenue is required locally to backfill the severe shortfall of
government funds. School Councils and PTAs pay teacher salaries, support school and classroom
construction, and procure furniture and school supplies—expenses usually covered in national and
regional education budgets. Because parents and the communities supplement government funds, they
tend to participate in the planning and use of these funds. This participatory process includes the school
head teachers (principal), teachers, and parents/community. For example, the School Council and PTA
Center
Region Division/
Department
School
Inspectorate/ Arondisssement
School Council/Parents

22
members interviewed in the field visit described an interactive ―visioning process‖ that takes place at the
school level. Depending on their background and experience, the constituents bring their distinct vision
of what needs to be done for the school. The respective visions are then knit together in a plan that
guides the use of resources.
2.2.3 Central Financial Transfers for Regional Administration
25. There is considerable variation in the availability of administrative staff to the three
regions, which impacts their ability to efficiently manage the system. For example, the Littoral
region has 47 staff members, which is the largest administrative staff; North West has 38 administrative
staff; and Far North has the lowest, with 25 staff. If the ratio between the number of staff and the
number of students in the 6–11 age group is considered (see figure 4), the challenges to educational
administration in the Far North become evident. In the Far North, the ratio of administrative staff in the
regional delegation to students enrolled in basic education is 1:21,808. In contrast, in the Littoral region,
the proportion is 1:7,249, and in the North West it is 1:9,126.16
Key positions, such as the sub-regional
director and the director for pedagogy, were vacant in the Far North, which also had a shortage of staff
in the départements/divisions. This is in contrast to the Littoral region, which is well staffed.17
This
distribution of administrative staff reflects the political capital of the Littoral region, which is able to
capture both funds and personnel.
Figure 4. Number of students per administrative staff member in basic education
Source: Field study and MINEDUB Statistical Yearbook 2007/2008.
2.3 Central Financial Support to Schools
26. The Center provides direct financial support to schools in different ways. First, it transfers funds
for infrastructure development for both basic and secondary education. Second, the Center distributes a
―minimum package‖ only to primary schools, consisting of instructional aids, office supplies, and sports
equipment. Third, it provides a small amount of money earmarked for specific items and activities. The
amount and details of Central financial transfers to the regions for secondary schools was difficult to
16
The ratio of the number of administrative staff to students in secondary education shows a similar unequal distribution.
However, the administrative staff is concentrated at the school level in secondary education, rather than in the delegations.
Since the real management and oversight occurs in the schools, we could not conduct the same analysis of secondary
education that we did for basic education 17
The team attempted to calculate the actual funds received for administration from the Center at the regional and divisional
level, but it proved a challenge and could not be uniformly assessed.
7,249
21,808
9,126
Littoral Far North North West
0
5000
10000
15000
20000
25000
23
ascertain because each school receives a different amount for different items. In addition to
administration and a variety of activities, secondary schools receive funds for laboratories, libraries, and
stationery, etc. Compared to the primary schools, the secondary schools visited had much clearer and
orderly processes for recording expenditures and maintaining accounts.
2.3.1 Infrastructure Development
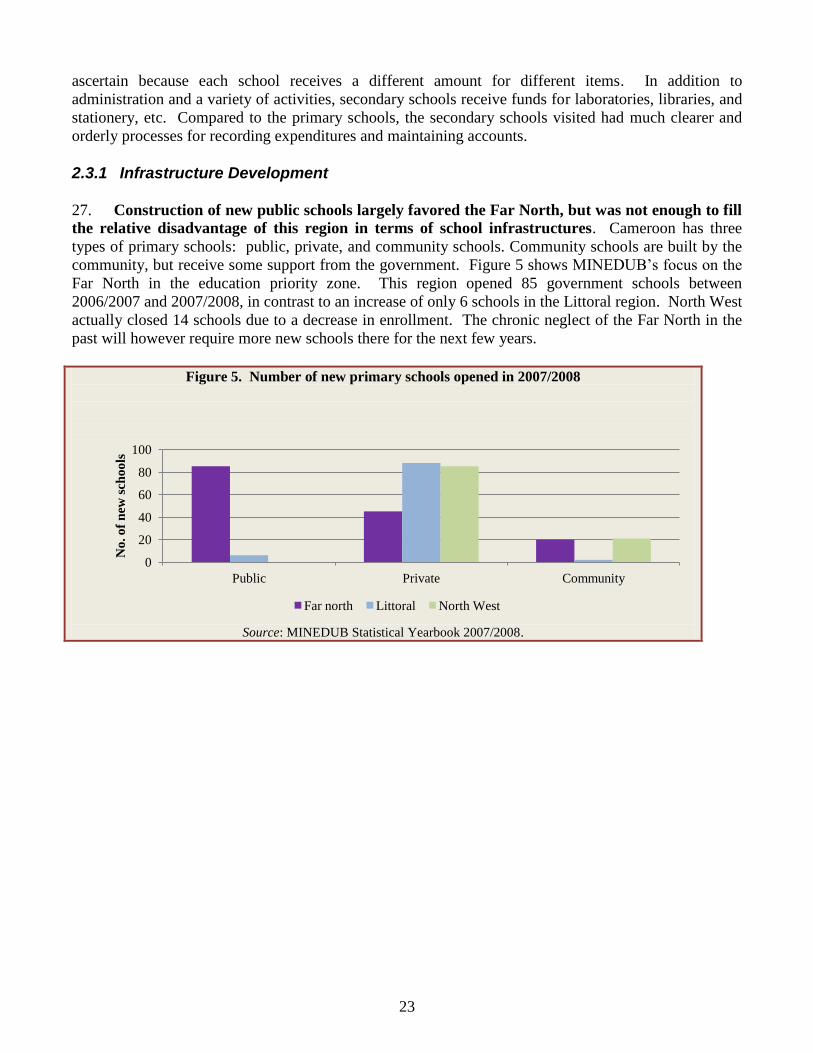
27. Construction of new public schools largely favored the Far North, but was not enough to fill
the relative disadvantage of this region in terms of school infrastructures. Cameroon has three
types of primary schools: public, private, and community schools. Community schools are built by the
community, but receive some support from the government. Figure 5 shows MINEDUB’s focus on the
Far North in the education priority zone. This region opened 85 government schools between
2006/2007 and 2007/2008, in contrast to an increase of only 6 schools in the Littoral region. North West
actually closed 14 schools due to a decrease in enrollment. The chronic neglect of the Far North in the
past will however require more new schools there for the next few years.
Figure 5. Number of new primary schools opened in 2007/2008
Source: MINEDUB Statistical Yearbook 2007/2008.
0
20
40
60
80
100
Public Private Community
No
. o
f n
ew s
cho
ols
Far north Littoral North West

24
28. Site selection for infrastructure development is usually handled at the regional level and
requires clearance from the Center. Identifying sites for new schools is a complex process, based on
the analysis of projected enrollments in the catchment area, a survey of possible construction sites, and a
review of existing facilities to avoid duplication of service delivery. In regional delegations, the ―head
of planning‖ and ―head of construction‖ are responsible for site selection. Communities can also
identify a site and submit a demand for a new school to the inspection d’arrondissement/inspectorate in
basic education and to the département/division for secondary education. For both sub-sectors, the
request must be first cleared by the regional delegation and then by MINEDUB and MINESEC,
respectively. When the Center clears this request and sanctions construction, it is tantamount to
assigning a director and allotting teachers for the school.
29. In all the three regions visited, there were indications to varying degrees that schools
construction did not entirely follow a need basis approach, resulting in schools not being put to
full use. There are several reasons for this situation. First, except in the Littoral region, staff in charge
of planning new schools was unable to access the demographic data which continues to be regarded as
sensitive information and is therefore not widely disseminated. In the Littoral region, because statistical
data was available and analyzed, a more rational plan for where to build schools was evident. Second,
there was considerable political pressure from traditional leaders, community leaders, and politicians to
build new schools in their particular constituencies. Politicians and parliamentarians could bypass
regional delegations and pressure the central ministry directly to build schools. It was estimated that
about 20 percent of the new schools each year were constructed in response to direct political
intervention. In most cases, it resulted in either duplicate facilities or prevented construction of a school
where it is really needed. In addition, school construction supported by politicians may be built in sites
that are inconvenient or inappropriate for students and learning.18
2.3.2 Minimum Package
30. The minimum package was introduced in 2000 to address both the paucity and delay in
fund transfers to schools. Often schools used to receive funds from the Center well into the school
year, causing delays in the procurement of much-needed school supplies. In order to enable the school
to begin instruction as soon as the school year started, the Center started distributing a set of basic
school supplies. The package is distributed with considerable fanfare and the involvement of the
regional delegate, NGOs (non-governmental organizations), the governor, the media, and parents.
31. There exist variations across regions in the number of school and pupils that benefit from
the minimum package. In 2005, according to the PET survey, the minimum package consisted of ―(i)
office supplies for teachers, (ii) didactic material for teachers, (iii) assessment material for teaching and
testing pupils, (iv) sports and recreation materials, and (v) a small pharmacy/first aid box‖ (PET Survey
2005, 47). This content list was consistent with what school officials reported during field visits. The
PET survey showed however some variation across regions in the number of schools that received this
package, from 70 percent of schools in the East region to 100 percent in the Littoral. In both the North
West and Far North, 88 percent of the schools received the package. However, 55 percent of the schools
surveyed across Cameroon felt that this minimum package was not sufficient. In the Far North, the
minimum package received was not commensurate with the size of enrollment in the school. The
scarcity of equipment was particularly severe in one of the primary schools visited in the Far North,
which had class sizes of several hundred children in the early grades.
18
For example, the team visited a school on the banks of a river that was opened under pressure from a minister. The
surroundings were not safe for students and there was no place for sports or future expansion.

25
32. Moreover, there was limited evidence that the different items were available and used in the
schools visited. A small amount of stationery for administration, such as registers and paper, were
visible in the school office. It was notable that respondents were unable to convey the extent to which
these items were integral to the functioning of the school.19
Overall, regional delegations were unable to
confirm whether the packages were efficiently distributed and whether the package was adequate for the
number of students enrolled in each school.
33. Overall, the “minimum package” was felt as not being responsive enough to the specific
needs of each school. Indeed, providing schools with a standardized package produced and procured
externally does not take into account the variation in school contexts across regions. Funds provided
directly to the school based on a comprehensive budget proposal might be more effective. When
preparing the budget, the abilities of the School Councils and the PTAs to supply certain items could be
taken into consideration, and the funds used to procure the remaining items according to the needs and
conditions of the school.
2.3.3 Financial Support for Primary and Secondary Schools
34. Similar to the minimum package, the Center transfers funds at the beginning of the school
year to the département/division for distribution to schools. The PET survey (2005, 27) called this
―transferred expenditure.‖ When this policy was introduced in 2000, the amount allocated was about
CFA 2,500 per student, but it has now been reduced to CFA 750 per student. Schools receive the list of
items covered by this fund. In the PET survey, 11 items were included in the list (table 4). The Center
revised this list, as seen in the visits to the three sample regions, and now includes only school
insurance, library, cultural activities, and maintenance. There are two new items, namely, school health
and performance (or incentive) bonuses.
Table 4. List of school items financed by Central funds
19
In fact, the only clear evidence of useful and important materials received by a school was in the Far North region. These
materials were provided by UNICEF.
Original items Per student expenditure
in 2002 (in CFA)
Per student expenditure in
2009 (in CFA)
1 School insurance 100 100
2 Library 200 50
3 Monthly register 200
4 Identity cards 200
5 Cooperative 100
6 Cultural activities 100 250
7 Sports activities 300
8 Practice activities 100
9 School Council 300
10 Maintenance 400 100
11 School projects 500
New items added
12 Performance bonus - 200
13 School health - 50
Total 2500 750

26
Source: PET Survey 2005 and field visits.
35. The extent to which there is equity in fund transfers is not clear, especially in the Far North,
where there is a significant time lag between allocations and increases in school enrollment. Per
pupil expenditure is much lower in the Far North due to the increases in enrollment in basic education.
During visits to schools, the team discussed the perceptions of school authorities regarding the use of
these funds. Responses revealed limited awareness and hardly any control over the funds received from
the Center.20
Although a distribution of funds across different categories is stipulated, school authorities
gave priority to sports activities or the ―Funesco‖ (national games) organized by the Center (which
suggests that the Center was monitoring expenditure on this item closely). In contrast, officials rarely
mention expenditure on items important for instruction and student learning, such as library books or
instructional materials.
36. It is not clear if the administrative delegations monitor the appropriate distribution and use
of these funds. Regional delegations are not responsible for the efficient distribution of Center funds to
primary or secondary schools: départements/divisions simply transfer the funds. Any systematic effort
to closely monitor the use of these funds would be complicated by the absence of uniform procedures
for the maintenance of accounts with respect to these transfers at the département/division level. This
leads in some instances in errors in the amounts transferred, for example, in one of the primary schools
visited, the amount received by the school was three times what the departments reported. Accounts
maintained were confusing and inadequate in most of the offices visited, except for the Wouri
département in the Littoral region. This département is an example of good practice relevant to other
départements/divisions. The département delegate created a template that specified the items and
amount received by each school (see annex III). The head teacher in each school signs this form after
receiving the money. Similarly, département/division delegations take limited responsibility for
monitoring and ensuring accountability for school income and expenditure.
2.4 Public Procurement and Expenditure in the Education Sector
37. Because policies and procedures differ for public procurement above and below CFA 5 million,
these two areas are discussed separately. In addition, the procurement of textbooks, a significant
component of school education, is included in this section.
2.4.1 Expenditure below CFA 5 Million
38. In order to limit the misuse of funds, stringent procedures are in place that prohibit the use
of cash for procuring goods. The Ministry of Finance is responsible for all financial allocations and
expenditures. The government of Cameroon is committed to limiting possibilities for the misuse of
funds, and one way is by prohibiting cash transfers. The allocations to regional entities are notional,
based on a system of credit, and stringent procedures govern all transactions. Any expense incurred that
is less than CFA 5 million requires filling out a voucher (also called a ―carton”; see annex IV).21
The
voucher is given to the retail store or firm, which then submits the voucher to the public treasury for
20
This was in contrast to the resources collected through the PTA, where there much more clarity in how much was collected
and what was purchased with this money. 21
A new procurement code was introduced in Cameroon in 2004 that significantly improved procurement processes. This
new code includes standard bidding documents, manuals of procedures, and a variety of regulatory instruments. Independent
audits are also conducted at regular intervals.

27
reimbursement. Actual cash is rarely exchanged in transactions within regions. Credit managers or
financial controllers in MINFI authorize expenditures. While public contract boards review contracts
for expenditures above CFA 5 million, such a review is not required for expenditures below 5 million.
39. While actual cash is not exchanged, the system can be subverted by adjustments made to the
costs of supplies. The Ministry of Commerce puts together estimated costs for commodities, known as
―mercurial or pricelist.‖ This list specifies the cost of all the items purchased by the government. Most
of the individuals interviewed indicate that the prices are largely overstated. The unofficial line is that
the quoted price includes a substantial margin for the supplier and the intermediaries involved in
procuring these items. Respondents also stated that if they were given the funds, they could procure the
same item two to five times cheaper than the government’s list prices. It appears that the government list
prices likely allows for misuse to take place within an accepted system of public expenditure.
40. There is often distrust in the relationship between the education sector administration and
the public treasury. Education managers interviewed complained about delays in the release of funds.
One legitimate reason for the Treasury to deny payment is technical, such as if the financial controller
does not authorize the expenditure in the regions. Other reasons include a mismatch between the
purchase and the nomenclature (i.e., the credit line does not match the expenditure), and if the quoted
price and the quality of the product do not correspond. According to MINFI, although these cases are
rare, the public treasury is supposed to report misappropriations or fraud committed by education
officials.
2.4.2 Expenditure above CFA 5 Million
41. Procurement procedures for expenditures above CFA5 million include the involvement of
the regional tender board. Any procurement that is more than CFA 5 million must follow public
contracting rules established by the Agency for the Regulation of Public Procurement [Agence de
régulation des marchés publics]. Tender boards located at the regional and département/division levels
are responsible for the bidding process and awarding contracts. A project manager oversees contract
implementation. Appointment of project managers is discretionary, made by the relevant sub-committee
that reviews the contract. Public works departments attached to the regional governor’s office or at the
département/division level are responsible for all infrastructure construction supported by the
government. The public works department advertises a request for proposals and receives financial and
technical proposals for the work. Tenders must reflect the current list of prices. Proposals are rated on a
scale of A to D, with A being the highest. If the costs are 25 percent above the list prices, the
submission is rejected.
42. Similar to expenditure below CFA 5 million, activities above this amount are based on list
prices that are far above the regular rate. The existence of national fixed prices is not satisfactory for
two reasons. First, common pricing is not a cost-effective use of funds because it generates a system in
which items cost more than they are worth. It does not take into account variations in prices across
regions, especially the geographical factors that affect costing. For example, regions close to Nigeria,
due to competitive pricing, can obtain materials and services for much lower rates. While the cost for
constructing a classroom based on the list price is CFA 8,000,000, parents’ association claimed that they
were able to build a classroom for approximately CFA 3,000,000. Second, because the list prices do not
take into account the high cost of construction in remote areas, it becomes a disincentive to construct
schools and classrooms in these areas. The unit cost will be far higher in remote areas, given a greater
cost for transportation and the unavailability of construction materials.

28
43. The weak collaboration between the public works department and the head of construction
in the regional delegation to can negatively affect the quality of school construction and facilitate
collusive practices. Restrictions on the timing and frequency of building inspection were sometimes
imposed by the public works department to the heads of construction in regional delegations. As a
result, regional delegations were unable to ensure that the classrooms and schools were built according
to requisite norms and guarantee the quality of the construction. In the Far North, the ―Project
Logbook‖ which records all completed works detailed the low quality of buildings and how funds could
be diverted in the construction of schools (annex V).22
In some instances, collusion between
construction companies and the public works department was noted. Considering that the logbook is a
shared document, unsatisfactory construction is either ignored or supported by the leadership. However,
in the Littoral region, the head of construction was more deeply involved with the different activities and
felt empowered to identify unsatisfactory construction which amounted to only about 10 percent of the
projects. The coordination in the Littoral region indicates that it is possible for construction in
Cameroon to be less susceptible to the diversion of funds and for the ministries to guarantee quality
construction.
2.4.3 Textbook Procurement
44. Textbooks, which are a crucial component of education, are scarcely available and hardly
used for educational purposes. MINEDUB does not provide textbooks to students; students have to
procure textbooks on their own. The distribution of textbooks across the three regions is shown below.
The availability of mathematics textbooks is alarmingly low (table 5). The slightly higher percentage of
students who have textbooks in the Far North is due to textbooks supplied by UNICEF. Fields visits
indicated however that these textbooks were not being used by students and were kept carefully in the
head teacher’s cabinet. More students observed in classrooms in the North West appeared to have
textbooks.
22
According to Ware et al. (2007), apart from project identification and design (see the section on infrastructure development
in this report), irregularities in procurement can occur during advertisement, prequalification, preparation of bidding
documents, bid submission, bid evaluation, post-qualification, contract award, and supervision of contract performance.
Since this study did not review this list of the different stages of procurement, it is difficult to capture at what stage or process
faulty construction of schools occurs.

29
Table 5. Distribution of textbooks across regions and students enrolled
Far North Littoral North West
Enrollment in basic education 540168 340713 346794
No. of language textbooks in the school system 78424 11482 35135
% of students with language textbooks 15% 3% 10%
No. of science textbooks in the school system 54797 9491 35139
% of students with science textbooks 10% 3% 10%
No. of mathematics textbooks in the school
system
2027 1436 849
% of students with mathematics textbooks 0.4% 0.4% .2%
Source: MINEDUB Statistical Yearbook 2007/2008.
45. The high cost of textbooks and absence of policy regarding their mandatory use in class
explain in part the dearth of textbooks. First, there are no local publishers of textbooks, which
undoubtedly drive up the cost of textbooks. Books are produced and printed in France for the
Francophone regions and in the United Kingdom for the Anglophone regions. During the 1990s, there
was a move to liberalize textbook production and establish a national printing press in Yaoundé. This
project, however, was abandoned due to domestic politics, pressure from donors and publishers, and the
perception that a national press would produce substandard books. Second, because textbooks are not
mandatory, parents are resistant to buying them for their children. The high cost of textbooks also
makes them unattractive for parents, given the competing demands on their meager resources by PTA
fees, examination fees, and other contributions to the school, among others. About CFA 10,000 is
required for each student in primary education to obtain all the textbooks required. The minimum
package only includes textbooks for teachers and is not meant for students. Some schools have
established a rental system for low-cost books (CFA 300 for the year), but the initial purchase of books,
which is substantial, remains a problem.
2.5 Central Monitoring of Expenditure
46. Accountability for the funds received from the Center by the different regional levels of
government comes under the responsibility of MINFI based in Yaoundé and its counterparts in
the region. ―Control missions‖ fielded by MINFI visit the different levels of government to monitor
whether accounts relating to budget and expenditure are consistently maintained. The missions consist
of three to four individuals that visit two to three times a year. Visits are made to the regional delegation
and a few départements/divisions, inspectorates/inspection d’arrondissements, and schools. During the
field visits to the regions, the study team met with several control missions immersed in their work.
Their primary task is to conduct internal audits and assess whether funds are spent according to the
instructions given by the Center. The missions also assess construction of new schools by taking
photographs, reviewing the project logbook, and talking with staff.
47. The rationale and procedures used by the control missions are not sufficient to ensure
financial accountability and improve education performance. The effectiveness of these control
missions is compromised for three reasons. First, the visits are not based on a well-defined random
sample of schools and départements/divisions, organized over time. Control missions rarely visit
30
schools or départements/divisions that are far from the regional capital city, and often seem to visit the
same delegations and schools. Therefore, the information that is collected is likely to be incomplete and
skewed. Second, control mission report only to the Center. Unless the control mission reports an
irregularity, schools or regional delegations do not receive a copy of the report. If there is a problem, the
Superior State Control is responsible. The Superior State Control informs MINEDUB or MINESEC,
and State Disciplinary Councils take action. A regular feedback loop that includes the school and
regional authorities would facilitate more effective financial monitoring. Third, when the Center takes
disciplinary action, only serious issues are considered. This approach limits the incentive for
incremental improvements and fine-tuning of financial management at the regional level.
31
2.6 Conclusions
•Strategies and processes in place for budget planning and financial allocations are inadequate. Decisions on the budget allocation to regions are made by MINFI and the Center, and regional administrative entities are not really involved in preparing budgets based on the analysis of need. The substantial contribution of parents to the school system also poses a challenge to government budget planning and equitable allocation.
•Accountability for financing remains centralized with limited involvement by regional level government entities. Accountability for the funds received is to the Center rather than to the administrative level immediately above. This situation limits the financial and functional coordination between different levels of government within the region. In both the primary and secondary school levels, due to the considerable local generation of funds, school officials and communities tend to be more involved in managing and monitoring the use of funds.
•Allocations for regional administration across regions are inequitable. Far North delegations are understaffed, in contrast to the Littoral region, where there was no shortage of staff. Inadequate staffing levels limit the extent to which oversight activities can be undertaken.
Budget allocations and financial transfers
•The impact of the minimum package in terms of efficiency and targeting is unclear. Allocation of the minimum package does not take into account the capacities and needs of each school. Financial allocations to schools are earmarked for specific items, leaving little room for school level decisions for its use.
•In school construction, political interference often results in wasting financial resources.
Central financing of schools
•Expenditures must comply with government list prices that may contribute to the informal misuse of funds. Although this system of banning cash transactions limits the possibilities of misuse, more systemic diversion of funds is reported. All purchases must be made according list prices established by the Center. List prices often include wide margins and do not take into account variation in prices across regions, thereby presenting opportunities for the misuse of funds. More specifically, there is indication of collusion between the public works department and building contractors in the Far North.
•The Center does not supply textbooks to schools. Visits to schools indicate a critical shortage of textbooks in classrooms. Foreign publishers dominate the textbook industry, driving up the cost, and resulting in a scarcity of textbooks. There is a need to explore alternative options for the production and printing of textbooks.
Public procurement and expenditure
•Centrally defined procedures are in place to monitor budgets and expenditures. However, the mechanism and modes of such an operation are inadequate. Control missions lack rigor and comprehensiveness, due to the nature of their mandate and inadequate systematization. The impression in the field is that control missions are limited and ineffective in ensuring financial accountability across regions.
Procedures for financial monitoring
32
Chapter 3 GOVERNANCE OF SYSTEM FUNCTIONING IN
EDUCATION
3.1 Teachers
48. Teacher accountability constitutes a critical area of system functioning. This section examines the
effectiveness of the system of teacher recruitment, deployment and transfer, and the size and consistency
in salary payments to teachers.
3.1.1 Teacher Recruitment
49. Restrictions on teachers’ recruitment and a surge in enrolments led to the widespread use of
community teachers. Throughout the 1990s, there was a ban on recruiting teachers in Cameroon and,
at the same time, school fees were abolished. 23
Reduced allocations and redefined priorities in primary
education resulted in increased enrollment and severe teacher shortages all over the country. This
situation led to the ad hoc locally-driven recruitment of teachers in both basic and secondary education.
In basic education, there were three types of teachers: regular civil servant teachers hired by the Center,
contract teachers hired by regional administrations, and teachers hired by the PTAs.
50. The government introduced a contract teacher program in primary education via decree in
the 1990s, with a more detailed description of the program completed in 2000. The program aimed
to incorporate all non-civil servant teachers into a single group of contract teachers. In other words,
locally recruited teachers, such as those hired by the PTA and contract teachers hired by regions were to
eventually join the official contract-teacher cadre. A well-defined policy outlining salary scales,
benefits, and career paths undergirds the contract teacher program.24
A detailed operations manual
developed by MINEDUB, which is continually updated, also guides program implementation. Over the
last few years, the international donor community has supported the implementation of the contract
teacher program, but the number of contract teachers recruited so far (37,2000 by 2011) remains
insufficient to cover the needs, and parents and regional delegations continue to recruit teachers locally.
At the secondary level, two types of teachers are recruited: regular teachers that are part of the civil
servant cadre, and long-term or temporary teachers hired by the regional delegations or PTAs.
Temporary teachers are hired for a course or semester.
51. In both basic and secondary education, favoritism and nepotism, mainly through political
interference in the recruitment of teachers, are identified as common practice. Politicians and
prominent individuals in the community pressure officials to hire their relatives or friends as contract or
secondary school teachers. Because of some of the recent reforms, there are indications that there is less
23
As in many other sub-Saharan countries, structural adjustment programs targeted the salary of teachers during the 1980s
and 1990s. This one-dimensional approach to this issue ignored the broader policy context in which teachers functioned
(Welmond 2002). 24
Several levels of promotion have been created for contract teachers and, after 10 years of service, they have a chance to
join the regular civil servants cadre. The government of Cameroon gives a cash bonus to teachers in lieu of pension.
Contract teachers are also receive similar benefits as regular civil servants. For example, contract teachers are allowed 18
days of leave during the school year and regular teachers 30 days. If they have children, contract teachers can also take
advantage of two additional days of leave per child. If leave is not taken during the school year, contract teachers are allowed
to accumulate the leave. Regular teachers, on the other hand, are not allowed to accumulate leave.
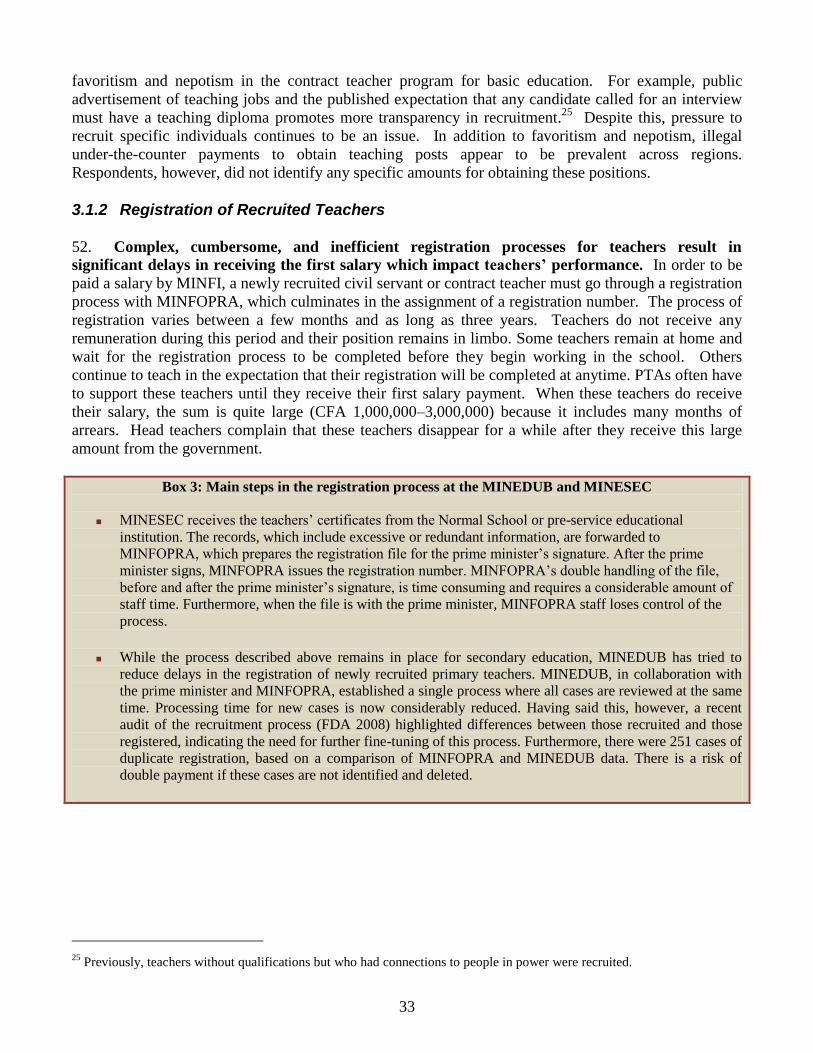
33
favoritism and nepotism in the contract teacher program for basic education. For example, public
advertisement of teaching jobs and the published expectation that any candidate called for an interview
must have a teaching diploma promotes more transparency in recruitment.25
Despite this, pressure to
recruit specific individuals continues to be an issue. In addition to favoritism and nepotism, illegal
under-the-counter payments to obtain teaching posts appear to be prevalent across regions.
Respondents, however, did not identify any specific amounts for obtaining these positions.
3.1.2 Registration of Recruited Teachers
52. Complex, cumbersome, and inefficient registration processes for teachers result in
significant delays in receiving the first salary which impact teachers’ performance. In order to be
paid a salary by MINFI, a newly recruited civil servant or contract teacher must go through a registration
process with MINFOPRA, which culminates in the assignment of a registration number. The process of
registration varies between a few months and as long as three years. Teachers do not receive any
remuneration during this period and their position remains in limbo. Some teachers remain at home and
wait for the registration process to be completed before they begin working in the school. Others
continue to teach in the expectation that their registration will be completed at anytime. PTAs often have
to support these teachers until they receive their first salary payment. When these teachers do receive
their salary, the sum is quite large (CFA 1,000,000–3,000,000) because it includes many months of
arrears. Head teachers complain that these teachers disappear for a while after they receive this large
amount from the government.
Box 3: Main steps in the registration process at the MINEDUB and MINESEC
MINESEC receives the teachers’ certificates from the Normal School or pre-service educational
institution. The records, which include excessive or redundant information, are forwarded to
MINFOPRA, which prepares the registration file for the prime minister’s signature. After the prime
minister signs, MINFOPRA issues the registration number. MINFOPRA’s double handling of the file,
before and after the prime minister’s signature, is time consuming and requires a considerable amount of
staff time. Furthermore, when the file is with the prime minister, MINFOPRA staff loses control of the
process.
While the process described above remains in place for secondary education, MINEDUB has tried to
reduce delays in the registration of newly recruited primary teachers. MINEDUB, in collaboration with
the prime minister and MINFOPRA, established a single process where all cases are reviewed at the same
time. Processing time for new cases is now considerably reduced. Having said this, however, a recent
audit of the recruitment process (FDA 2008) highlighted differences between those recruited and those
registered, indicating the need for further fine-tuning of this process. Furthermore, there were 251 cases of
duplicate registration, based on a comparison of MINFOPRA and MINEDUB data. There is a risk of
double payment if these cases are not identified and deleted.
25
Previously, teachers without qualifications but who had connections to people in power were recruited.

34
3.1.3 Teacher Deployment and Transfers
53. The deployment of additional teachers to the Far North region has not been sufficient to
cover the large increase in enrolments. Effective service delivery in both basic and secondary
education depends on the appropriate deployment of teachers across the regions. The number of
teachers hired by the government in the Far North increased more than threefold, from 784 in 2006/2007
to 2,949 in 2007/2008. In spite of MINEDUB’s remarkable effort to increase the number of teachers
deployed to the Far North (see figure 7), the political capital of the Littoral region drew many new
recruits. Even though there is a decrease in the number students in Littoral and the average pupil-teacher
ratio is 47:1, a significant number of contract teachers in 2007/2008 were sent to this region instead of
the Far North. The North West region also received additional contract teachers in 2007/2008, which is
to some extent valid because the average PTR is still high at 77:1. Information on the number of
teachers recruited between 2006/2007 and 2007/2008 is not available for secondary education because
MINESEC only began to collect secondary education statistics in 2007/2008. Attempts to examine this
information at the regional level were also not successful.
Figure 6. Differences in the number of teachers and students in the three regions over two years
Source: MINEDUB Statistical Yearbook 2007/2008 and 2006/2007
54. Deployment through teacher transfers is also a complex and lengthy process. Deployment of
government-hired (regular and contract) basic and secondary education teachers also occurs through
transfers from school to school within and across regions. The Center is responsible for all deployment
and transfers in both primary and secondary education. Similar to the recruitment of teachers, transfer
procedures are intricate and time consuming. Primary teachers submit their requests for transfer to the
inspection d’arrondissement/ inspectorate and secondary teachers to the département/division. The list
moves up the administrative levels to MINEDUB and MINESEC for basic and secondary education,
respectively. MINEDUB and MINESEC finalize the transfers and submit the list to MINFOPRA, which
informs the regional delegations. Civil servant (regular) teachers in both basic and secondary schools
can request a transfer after three years in a school. Contract teachers, on the other hand, have to remain
in a school for five years. Outside the three and five year terms, teachers can request a transfer for the
following reasons: (i) if he or she is the spouse of a government official who is transferred; (ii) if he or
she is the spouse of a military person who is transferred; or (iii) force majeure, such as teachers finding
-600
-400
-200
0
200
400
600
800
1000
Far North Littoral North West
Teachers Students (hundreds)

35
themselves in danger.26
In addition to these three situations, teachers can request a transfer due to illness
and family reasons, such as marriage.27
55. Similar to recruitment, teacher deployments and transfers are influenced by vested political
interests throughout Cameroon. Teachers frequently request transfers, especially in the North West
and Far North regions. In the North West primary schools, 500 regular and contract teachers requested a
transfer, and 175 transfers approved; in secondary schools, 190 requests, of which 125 were granted. In
the Far North primary schools, 172 teachers requested transfers and 100 transfers approved; in
secondary schools, 300 requests, of which 30 were granted. In the Littoral region primary schools, 20
teachers requested transfers and 30 transfers approved; in secondary schools, 19 requests, of which 25
were granted. Anecdotal evidence shows that politicians and individuals in prominent positions demand
teacher transfers throughout the school year. Across the regions visited, officials stated that if he or she
is the spouse of an important person, a transfer can be requested and should be granted at any time.
Although officials spend considerable effort organizing a rational distribution of teachers across schools,
about 30 percent of the teachers are changed at various stages by influential persons. It is also difficult
to determine whether the transfers requested by teachers are in fact legitimate. For example, in the case
of sickness or marriage, administrators try to do some informal investigation. However, investigations
are neither thorough nor substantial due to a lack of financial resources and limited staff on site.
Understanding the real situation is also difficult because personnel records of teachers are not
consistently maintained or regularly updated in the regions.
56. Overall, for several reasons, deployments and transfers are often arbitrary and not based on
rational requirements and system performance. First, the extent of political interference will not
allow a rational and need-based deployment and transfer of teachers. Second, there is no system of
forecasting future teacher requirements by analyzing teacher retirements and attrition. Third, it is
difficult to predict and analyze the number of PTA-paid teachers that will be employed, due to the
dependence on voluntary financial contributions and the availability of qualified personnel.
3.1.4 Teacher Work Force and Salary Payments
57. The variation in the size of the teacher workforce supported by the government results in
sub-optimal class sizes and does not promote the “teachability” of the class. The distribution of
government paid teachers across the country is not aligned with the differences in student enrollment
across the three regions. Although the Far North has about 496,000 students, the Littoral about 150,000,
and North West regions about 232,000, all three regions have the same number of civil-servant teachers
(about 2,500). Because of this distribution, the level of dependency on the community and parents also
26
Force majeure can mean illness or danger as in this anecdote. A school in the north of Cameroon had five teachers. One
teacher was hired by the community and the remaining four were contract teachers. The teacher hired by the community died.
A member of the community decided that a contract teacher had practiced sorcery on the local teacher to have him killed.
This story began to circulate in the village, creating antagonism and fury against all contract teachers. The village decided
that such sorcery needed to be severely punished. The community set fire to the homes of the four contract teachers.
Fortunately, the teachers rushed out of their homes in time and sought protection from the local Catholic mission. MINEDUB
then arranged for the transfer of all the four contract teachers to another region. 27
Marriage is complicated, given Cameroon’s cultural context of polygamy. An important person may request a transfer for
just not one wife but also for his other wives. The ministry finds itself in an awkward position in this situation and has to
grant the transfer.

36
varies (figure 7).28
In the North West, PTA teachers (1,676) are about twice the number in the Littoral
region (839) and, in the Far North, there are almost four times as many PTA teachers (3,120).29
The size
of the regular/contract teacher cadre and the small number of PTA teachers in the Littoral region, again,
portray the political power of this region and its ability to capture more funds from the Center. It also
illustrates the Center’s susceptibility to political pressure in the past decades at the expense of improving
educational performance in the weaker regions in the country.
Figure 7. Government (regular and contract) and PTA teachers in basic education
Source: MINEDUB Statistical Yearbook 2007/2008.
58. When comparing the ratio of civil servant teachers (regular and contract) to students
enrolled in each region, the inequity is even starker in secondary schools. With about 83,000 and
56,000 students in the Littoral and North West regions, respectively, the majority of teachers in
secondary schools are civil servants (close to 3,400). This is in contrast to the situation in the Far North,
which has nearly 72,000 students and fewer than 800 teachers in the system. This skewed distribution is
also reflected at the school level in figure 8. Parents in the Far North have no other recourse but to
increase the number of secondary school teachers by hiring and paying the salaries of 1,185 PTA
teachers.30
Field visits also confirmed the high number of PTA teachers in the Far North (table 6).
About 15 percent of teachers in schools visited in the Littoral and North West regions are supported by
parents, whereas this number is over 60 percent in the school in the Far North.
28
The regular civil servant teachers in figure 8 include both the ―fonctionaires‖ and the ―contractualisés,‖ or contract,
teachers in the Statistical Yearbook 2007/2008. 29
In spite of the large number of adequately trained government-supported regular/contract teachers in the Littoral region,
about 193,182 students attend private schools. 30
Low enrollment in the North West requires a smaller number of PTA teachers (289). The large number of teachers (2,542)
hired by the PTA in the Littoral region appears to be somewhat inefficient and needs to be further explored.
0 500 1000 1500 2000 2500 3000 3500
Gov tchs
PTA teachers
Far North North West Littoral

37
Figure 8. Government (regular and contract) and PTA teachers in secondary education
Source: MINESEC Annual Statistics 2007/2008
Table 6. PTA recruitment at the school level in secondary education
Region School Total
teachers
Gov’t
teachers
PTA
teachers
% of civil
servants
North West Bambui CCAST 154 130 24 84%
Littoral Lycee Joss Douala 116 99 17 85%
Far North Lycee classic Maroua 61 24 37 39%
Source: Field visits.
59. Different levels of remuneration for teachers that are not commensurate with differences in
qualification and, more importantly, effort and performance in the classroom has a negative
impact on sector performance. There is inequity and arbitrariness in the salaries paid to teachers.
Regular and contract teachers hired by the Center and those hired by the regions and PTA teachers that
work in basic education earn different salaries (table 7). Teachers with different pay scales could work
in the same school. Differentiation in pay scales is not connected to differences either in qualifications
or in the work undertaken in the classroom. Regular (non-contract) civil servant teachers earn the
highest salaries and the PTA teachers the lowest. PTA teachers receive only about 30 percent of the
salary received by regular civil servant teachers. In secondary schools, the teacher payment situation is
similar to primary schools. Teachers hired by parents earn between CFA 35,000 and CFA 60,000 per
month, while teachers hired by the government receive a minimum of about CFA 150,000 per month.
0 500 1000 1500 2000 2500 3000 3500 4000
Gov teachers
PTA teachers
Far North North West Littoral
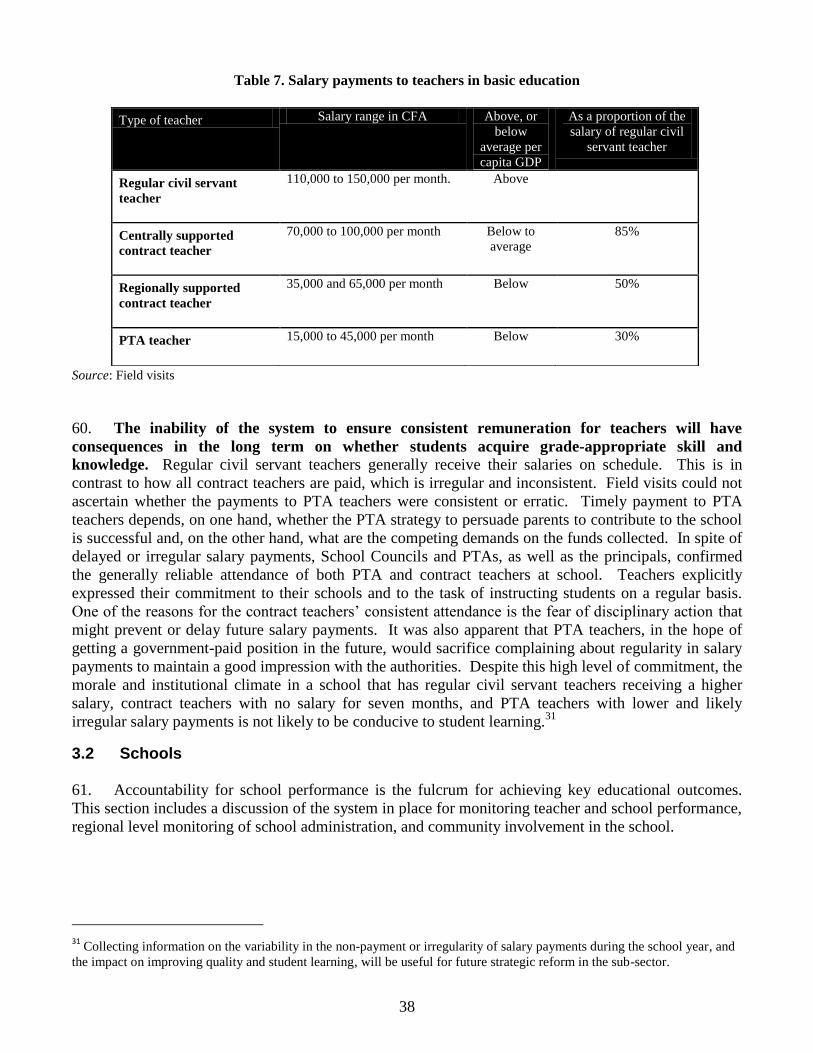
38
Table 7. Salary payments to teachers in basic education
Source: Field visits
60. The inability of the system to ensure consistent remuneration for teachers will have
consequences in the long term on whether students acquire grade-appropriate skill and
knowledge. Regular civil servant teachers generally receive their salaries on schedule. This is in
contrast to how all contract teachers are paid, which is irregular and inconsistent. Field visits could not
ascertain whether the payments to PTA teachers were consistent or erratic. Timely payment to PTA
teachers depends, on one hand, whether the PTA strategy to persuade parents to contribute to the school
is successful and, on the other hand, what are the competing demands on the funds collected. In spite of
delayed or irregular salary payments, School Councils and PTAs, as well as the principals, confirmed
the generally reliable attendance of both PTA and contract teachers at school. Teachers explicitly
expressed their commitment to their schools and to the task of instructing students on a regular basis.
One of the reasons for the contract teachers’ consistent attendance is the fear of disciplinary action that
might prevent or delay future salary payments. It was also apparent that PTA teachers, in the hope of
getting a government-paid position in the future, would sacrifice complaining about regularity in salary
payments to maintain a good impression with the authorities. Despite this high level of commitment, the
morale and institutional climate in a school that has regular civil servant teachers receiving a higher
salary, contract teachers with no salary for seven months, and PTA teachers with lower and likely
irregular salary payments is not likely to be conducive to student learning.31
3.2 Schools
61. Accountability for school performance is the fulcrum for achieving key educational outcomes.
This section includes a discussion of the system in place for monitoring teacher and school performance,
regional level monitoring of school administration, and community involvement in the school.
31
Collecting information on the variability in the non-payment or irregularity of salary payments during the school year, and
the impact on improving quality and student learning, will be useful for future strategic reform in the sub-sector.
Type of teacher Salary range in CFA Above, or
below
average per
capita GDP
As a proportion of the
salary of regular civil
servant teacher
Regular civil servant
teacher
110,000 to 150,000 per month. Above
Centrally supported
contract teacher
70,000 to 100,000 per month Below to
average
85%
Regionally supported
contract teacher
35,000 and 65,000 per month Below 50%
PTA teacher 15,000 to 45,000 per month Below 30%

39
3.2.1 Teacher Performance
62. The performance of all administrative staff and regular civil servant teachers (not contract
teachers) in both basic and secondary education is captured in what is called the “confidential
report”. The confidential report is a common form for all staff in both the delegations and in schools.
Two persons rate the individual on an ascending scale of 1 to 6 as per the following categories (see
annex VII for more details):
Professionalism: punctuality, assiduity, sense of duty, and constant application to assigned tasks
Professional knowledge, intelligence, effectiveness, output, initiative, and organization
Personality, collaboration and relations with other staff, respect for seniority, general service to
the public
63. There are several drawbacks in the confidential reports used for monitoring performance.
First, the report is the same for all staff working in the government, regardless of the sector they belong
to or the work that they do. Therefore, it does not document or evaluate achievement of tasks and
targets set in education, or acknowledge accomplishments by the individual. By ignoring specific
successes or failures of teachers and staff, the confidential report signals to the staff a rather confused
commitment of the education system to meeting sector goals and producing desired outcomes. Second,
the form is sent to MINFOPRA and is not shared or discussed with either the person being evaluated or
their immediate superiors. This process does not allow opportunities for self-reflection of performance.
In this sense, evaluation does not promote the specific objective of improving teachers’ performance or
the general goal of better school functioning. Third, according to officials interviewed, the confidential
report does not include suggestions for career development or recommendations for promotion, transfer,
demotion, or sanction. Instead, confidential verbal and written reports are made directly to the minister,
which influences the decision to promote or demote. This system gives undue power to people in
authority who are far removed from the actual context (the school and region, and especially the
teachers) and can encourage nepotism and favoritism. Mostly, it does not leave a transparent paper trail
that is accessible to all those concerned.
64. Assessment tools for contract teachers are more appropriate but appear cumbersome given
their limited use in practice to improve performance. The Center has set in place a rigorous and
regular review of contract teachers in basic education through ―sequential forms‖ (annex VIII), which
document information on teacher absenteeism, curriculum coverage, and salary payment. They must be
filled out after every cycle for each contract teacher and sent to Yaoundé. While the form provides a
good summary of performance, the frequency of submissions creates additional work for all levels in the
system. Furthermore, as school authorities do not analyze the forms, they provide limited information
about the quality of instruction. Bi-annual or annual reporting with authentic information that fully
captures and certifies performance would be more appropriate and useful. There is no formal process
for monitoring locally recruited contract and PTA teachers.
65. Considering the workload and small numbers of staff, the newly introduced tool to monitor
teachers’ instructions in primary schools is unlikely to achieve its intended effect. In basic
education, the pedagogical unit in Yaoundé, with technical support from donors, recently put in place a
detailed and complex five-page form to monitor teachers’ instruction in classrooms. This ―Teacher’s
Inspection Form‖ (annex IX) monitors how well teachers are using recently introduced pedagogical
techniques (such as the new system of continuous student evaluation). Summary findings of this review
are sent to Yaoundé. The review itself is not connected to any formal performance reviews, promotions,

40
or salary scales. A detailed evaluation form was also introduced for the inspectors in the delegation, the
―Inspection Form of Inspectors of Basic Education‖ (annex X). Examination of some of the completed
forms during the field visit underscored however the challenges presented to the school and delegation
staff in filling them out. Completed forms left many questions unanswered or had vague responses.
Rather than entrust this evaluation to overworked and understaffed delegations, it would be far more
efficient for a local university or dedicated institute to collect this information on a sample basis.
66. Table 8 summarizes the situation in the three regions regarding the performance review of
teachers. There is variation and discrepancy in the instruments used for evaluating the different types of
teachers in the system limiting its effectiveness. In secondary education, teacher performance
monitoring at the regional level is restricted to the confidential reports described above, and there is
more regulation and oversight within the school as described below
Table 8. Performance reviews of teachers in primary education
3.2.2 Sanctions and Incentives
67. The system of sanctions in place in both primary and secondary education covers major
cases of misconduct and is oftentimes slow in taking any disciplinary action. Sanctions are based on
excessive and obvious flouting of work regulations or behavioral rules, such as absence for an extended
period of time or blatant misconduct. Implementing sanctions for long, unexcused absences takes place
through a hierarchical process. The département/division delegation first sanctions the teacher, followed
by the regional delegation. If this does not have any impact, it becomes the responsibility of the central
government. It begins with the regional delegation sending a ―letter of discipline‖ requesting an
Type of teacher Instrument Frequency Documentation
PTA teachers Informal Irregular No documentation
Contract (regional)
teachers
Informal Irregular No documentation
Contract (Central)
teachers
Sequential forms After each cycle Three forms each year
Pedagogical review End of the year Summary documentation
sent to Yaoundé
Civil-servant teachers
Confidential report End of the year One form per year
Pedagogical review End of the year Summary documentation
sent to Yaoundé
Source: Field visits.

41
explanation from the offender. If there is no response, this request is followed by a ―letter of
observation‖ demanding that the teacher or staff report for duty. If there is still no response, a letter of
order is sent with a definite command to return to work. Before disciplinary action is taken by
MINIFORRA and MINEDUB, such as salary cuts and finally the removal of the person from the
employee list, the media is used to ask the teacher to resume work. If the teacher is removed from the
employee list, it takes about two years to rescind this and to restart salary payments.
68. There is a general system of incentives in both basic and secondary education but it seems to
have little impact on performance. Occasionally a teacher will receive a letter of congratulations for
having organized an event or won a competition. The financial support received by primary schools
from the Center (described in chapter 1) includes allocations for a performance bonus for teachers.
Similarly, PTA contributions are sometimes shared between teachers as a bonus. During field visits,
there was however no evidence of this bonus being awarded as an incentive to commend teachers for
their performance in the classroom. The impression was that, due to the scarcity of funds, this money
was being used for other purposes. Overall, any incentives associated with progress toward achieving
key educational outcomes, such as increases in enrollment or improvement in learning levels, were not
evident.
3.2.3 Administrative Performance
69. The main responsibilities of regional delegations as perceived by their personnel are to
implement the Center directions. In basic and secondary education, regional entities of government
are expected to follow the organization or process flow charts (organigrams) developed by MINEDUB
and MINESEC, which list all the positions, titles and corresponding tasks and responsibilities for each
administrative level. For basic education, the organigram has 10 titles, with six of these titles pertaining
to Center-level positions. The seventh title in the organigram (annex VI) describes the responsibilities
of the delegates at the regional département/division and inspection d’arrondissement/inspectorate
levels. The overarching perception across administrative levels is that personnel consider themselves
representatives of MINEDUB or MINESEC and their primary responsibility is to implement policies
and programs defined by the Center.32
The importance of making a good impression with Center
authorities was commonly mentioned and there was no frustration or unease expressed about the often-
imprecise expectations. Officials also pay attention to activities in the organigram that are more closely
monitored by the Center. For example, the maintenance of personnel records is included in the
responsibilities of regional delegations. However, as described below, this was unsatisfactory due to a
lack of oversight from the Center.
70. The degree to which the different levels of administration maintain and use education
indicators varied significantly. Understanding the effectiveness of service delivery is dependent on the
availability of comprehensive statistics for a particular education sub-sector. All the administrative
levels in both basic and secondary education have possessed statistical data for the system since 2007
when the EMIS was put in place. However, there is no uniformity in data maintenance, presentation, or
analysis. Three delegations in basic education in the Littoral and North West regions undertook some
32
The discussions with the regional delegations, départements/divisions, inspectorates/inspection d’arrondissements, and
school personnel centered on perceptions of tasks, procedures for carrying out these tasks, and the current process of
accountability to ensure that they had accomplished what was required.
42
analysis of the data, although in most cases information on pupil-teacher ratios across divisions and
patterns of textbook availability, etc., were not available.33
71. Similarly comprehensive and well organized documentation on staff performance, including
teachers, was rarely available locally. Effective administration is also dependent on consistent
documentation and reporting on staffing levels and performance (personnel records). There is no
standard classification system, format, or procedure for maintaining a database on teachers and staff.
There were detailed files on teachers and staff disciplined in the département/division delegations
visited. However, it was not possible for any of the delegations to present complete, well-organized, and
updated performance records for all teachers, including PTA-paid and regular teachers, either at the
school, inspection d’arrondissement/inspectorate, or département/division levels. Of the 16 offices
visited, only about four offices maintained records of regular civil servant teachers. Even these records
were unsatisfactory due to haphazard reporting, outdated and incomplete information, absence of
performance reviews, and almost no records of career promotions or commendations. The standard
response from officials interviewed was that MINFOPRA kept all the information.
72. Finally, the quality and accuracy of the financial information and account keeping was
uneven across delegations. There was a significant lack of uniformity in account keeping and
presentation of budget and expenditure data. Some of the delegations provided this information in
writing and others had computerized data. Accounts observed in some of the offices were sparse and in
others more detailed. For example, one of the delegations, when requested for financial data, provided
six lines of expenditures, hand-written on a piece of paper. Some of the other delegations, by contrast,
had three to four pages of budget and expenditure details. Similar to the documentation on staff, there
was no standard classification system and no standard formats or procedures for maintaining financial
information. The recently completed audit report (FDA 2008) of the procedures for managing Center
hired contract teachers reiterated this situation. The report found that the system for distributing
payments was a manual system of accounting that did not allow easy reconciliation of amounts received,
distributed, and maintained (preserved).
73. Such variations are largely related to the limited management and IT skills of personel in
some delegations, including the Far North. Most of the regional-level administrators are former
teachers. They have acquired management skills either as apprentices or through brief informal bouts of
training within the administration. Most of the officials would not have had more than two months of
formal training during the course of their entire career in the administration. As a result, officials have
limited computer skills, poor knowledge of accounting procedures, and inconsistent reporting or
documentation skills. In addition, especially in the Far North, there is a lack of basic resources, such as
stationery, files, computers, and even shelves to facilitate data maintenance and analysis. This is in
contrast to the Littoral region, with well-stocked offices and a computer in each one. Furthermore, files
and shelves were available to organize paper and documents.
33
The World Bank-supported PASE project has assisted both basic and secondary education to develop education monitoring
information systems (EMIS). The development of EMIS is far more advanced in basic education than in secondary. Basic
education now produces good documentation and analysis of key outcomes. A process to disseminate the findings across the
country was also introduced. Statistics for secondary education, on the other hand, remain unprocessed and unanalyzed.

43
3.2.4 School Performance
74. Although head teachers in primary schools appear to possess some knowledge and
commitment to oversee activities, school level monitoring is weak. Schools maintain student
enrollment and attendance registers, teachers’ logbooks, financial information, and School Council
logbooks. However, there is a lack of attention to detail and inconsistency in the information generated,
plus a limited use of data in running the school. The system of recording teacher absence in one of the
schools visited illustrates this situation. All contract teachers, PTA teachers, and regular civil servant
teachers record when they arrive and leave the school in a logbook. Information in the logbook is
however inconsistent and, more importantly, never summarized, resulting in a lack of data on teacher
absenteeism at the end of the cycle or school year. A teacher could be absent one day a week or arrive
late each day. Yet, because absence or tardiness is not added up, the implications of teacher absence on
student learning is not monitored or recognized.
75. In general, secondary schools are monitored more systematically and efficiently than
primary schools. Enrollment and student performance on certification exams are recorded and
analyzed. There is considerable attention given to curriculum coverage, student involvement, and in-
class evaluations. The département delegation noted that for the school year in progress, an average
73.4 percent of the curricula were completed. One of the delegates described how this summary score is
sent to each institution, highlighting concerns or recognizing good performance. Teacher absenteeism is
also more systematically monitored in secondary schools. Similar to the practice in primary schools,
there is a logbook in which teachers enter the time they enter and leave the school. Unlike basic
education, the logbook is first checked by ―subject masters,‖ who consistently monitor teacher and
student absenteeism. This information is then presented to the deputy head teacher who checks and
signs off on the logbook before sending it to the département/division delegation. Any teacher’s
absence that is not justified results in disciplinary action. The département/division expects to receive
information on teacher and student absenteeism and the average grades of students in the class every
three to six months.
76. There is little monitoring of and accountability for the amounts generated from registration
fees for examination. In primary and secondary schools, considerable funds are generated from
registration fees for examinations given at school.34
One-third of these funds are sent to MINESEC in
Yaoundé and two-thirds are retained to pay proctors and other staff involved. Regional delegates
described in detail exactly how and where problems occur. At the administrative level, a significant
number of temporary staff is hired to both administer and conduct the examinations. This introduces a
large number of personnel that have no long-term accountability within the system. Staff has access to
examination fees and there is a carefully worked-out protocol for accounting for these funds. Yet, it is
alleged that staff can siphon off some of the money collected by not bringing the total amount to the
official registry. Sanctions are in place for financial misappropriation of exam fees. For example, one
teacher was disciplined for the misuse of exam funds and was demoted to a school that did not hold
exams. Having said this, however, officials are fearful of imposing sanctions because the backlash can
be serious. Some of the officials interviewed had received threats on their lives and property.
77. The low remuneration offered to teachers for proctoring the exams, as well as several years
in arrears of paying teachers for exam duty limits the Center’s ability to implement sanctions. As
34
The exam fees for candidates are CFA 2,500 for the CEP, FSLC, and Common Entrance Exam; CFA 3,500 francs for the
BEBC and the CAP; CFA 7,500 for GCE O/L; CFA 10,500 for the BAC; and CFA 12,500 for the GCE A/L.

44
a result, malpractices are frequent. As the proctors are not fully paid, the officials can only close their
eyes to irregular practices in the conduct of examinations. Officials also acknowledge that the diversion
of fees from examinations has never led to a sanction, either because the accused threatened their
personal safety or because they had the support of powerful individuals in the government. At the
student-level, the following malpractices were reported: i) one student can register, while another
student actually writes the exam; ii) Parents bribe the examiner (the estimated price for raising scores is
CFA 10,000) to improve examination results; iii) Parents pay the secretariat to increase the marks made
by their son or daughter on the examinations (the estimated price is CFA 50,000 to 80,000.). Of course,
at the official level, there is clear understanding that students will be dismissed if they are caught for any
of the above malpractices. Yet the actual capacity to do so appears to be limited.
78. The ability of the inspectorate to monitor school performance is limited. Since accountability
for performance in basic education, especially with regards to improving quality, is imperfect at the
school level, the next level—the inspection d’arrondissement or inspectorate — needs to play a critical
role in monitoring school performance. Divisions or départements are sub-divided and each sub-
division has an inspectorate. Inspectors are expected to visit each school several times during the year
and surprise visits are encouraged. However, a set number of required visits to a school is not
stipulated. In practice, the estimated number of schools assigned to each inspector varies from 15 to 100
schools in the North West and 20 to 300 schools in the Littoral and Far North (see table 9 and figure 8).
Inspectors who were interviewed outlined the severe constraints faced in travelling to schools.
Inspectors often do not have transport and, if they do, the roads are bad. Most important, this
administrative level is seriously understaffed. Inspectors list the worst schools in the inspection
d’arrondissement/inspectorate, yet they confess they have never visited some of these schools. Some
schools under their jurisdiction have not been visited for a whole year.
Table 9. Distribution of schools and départements/divisions in the three regions
Region No. of
départements/
divisions
No. of schools
in divisions
No. of civil-
servant teachers in
divisions
No. of PTA
teachers in
divisions
Far North 6 128 to 303 33 to 127 198 to 727
Littoral 4 73 to 632 29 to 582 121 to 227
North West 7 78 to 220 53 to 51 130 to 216
Source: MINEDUB Statistical Yearbook 2006/2007.
3.2.5 Community Participation
79. The institutional framework for community involvement in education was formalized
through the establishment of School Councils and PTAs. Each School Council has 15 members, as
does the PTA. The School Council and head teacher are responsible for all the decisions and activities
in the school. They maintain a school cashbook, a logbook listing all transactions, and an inventory of
all equipment and furniture. The PTA maintains separate accounts and expenditure records. Minutes
are available for School Council and PTA meetings. Local institutions, such as the Development Union
(known as Abasakum Development in the North West) and local NGOs, are also involved in the

45
decision-making and activities taking place in the school. All the primary and secondary schools visited
had a School Council and a PTA.
80. School Councils and PTA tend to be involved in the financing of the schools, although the
extent of their financial contribution appears to be less in the Littoral region where public
resources are more abundant. The School Councils and PTAs in the North West and Far North
regions are consistently involved with the school, especially for contributing financial support and
overseeing the use of funds. In the North West and Far North regions, the family of each child in
primary school is expected to contribute about CFA 1,500 to the PTA. In secondary school, the
expectation is CFA 5,000–25,000 per student. In contrast, although parents are active in primary
schools, financial support was less robust in the Littoral region. A possible explanation could be that
most parents opt for private schools in this region and only parents with very low incomes send their
children to public school and cannot contribute as much. However, visits to the schools did not indicate
this: parents appeared to be more affluent than those in the Far North. A more plausible reason could
be that parents are aware of the political standing of the Littoral region and the potential to obtain Center
funds.
81. Although school fees are often used to finance legitimate school related expenditure,
including teachers’ salaries and infrastructure; however parents are also sometimes requested to
pay for illegal fees. School construction and teacher salary payments are big-ticket items for the PTA
funds in both primary and secondary education. For example, in one of the divisions visited in the North
West region, parents had built eight of the 17 secondary schools. Parents in the Far North are
responsible for paying the salaries of more than 60 percent of the secondary teachers. For example, at
Maroua Lycée classique (Far North), 100 percent of PTA fees go for salaries. At Douala Joss secondary
school (Littoral), salaries consume 80 percent of the PTA fees. PTA funds also procure furniture,
library book, computers, and lab equipment across the three regions. Oftentimes, it was noted that
school fees were requested from illegitimate reasons. In secondary education, for example, head teachers
enrolled students who had failed the entrance examination in 6th grade in order to obtain additional PTA
funds. Also, parents were asked by the principals to pay an illegal registration fee, in the range of CFA
50,000 to 100,000, for their children to be enrolled in public secondary schools. PTAs can be in
collusion with the head teachers on this issue.
82. In addition, there is significant potential for misuse of funds collected from students’
families at the school level. Limited financial oversight by the delegations and poor accounting skills
at the school level further exacerbate this situation and allow diversion of funds. The per diem
entitlement of PTA members was mentioned as an area where PTA funds could be misappropriated.
Each PTA member can collect a ―sitting fee‖ for attending meetings, so there is a tendency to hold
frequent and unnecessary meetings so that members can collect more fees.
83. Finally, the ability and commitment of School Councils and PTAs to monitor performance
is extremely limited. Information related to school performance is not high on the agenda of the School
Council and PTA. For instance, in one of the schools visited, mud floors in classrooms were very dry
and full of dust. Students were unable to sit on the floor because of the dust. Each morning teachers and
students would walk down to a stream to fetch water to pour on the ground in order to settle the dust.
This exercise took about two hours, which essentially reduced the instruction time each day to about
three hours. Neither the head teacher nor the PTA was concerned about the time lost for instruction and
student learning.

46
3.3 Role of Extra-government Entities in Governance
84. Overall, the media plays a limited role in enhancing system functioning. The media consists
of both independent and the government entities in Cameroon, and education is an important topic for
both. The government-controlled media, which includes the daily Cameroon Tribune and the television
channels, is often used for official communication and plays an important role in the system of sanctions
for teachers. The radio summons teachers back to work or calls them to order before the government
takes more drastic action, such as suspension of salaries. The independent media is somewhat
autonomous and is able to report more objectively on the education system. However, in practice its
impact is limited, and it rarely calls the government to account. One of the most recent achievements
that the media has contributed to is the improvement in the procedures for registering new teachers
through pressure to MINFOPRA.
85. Traditional authorities are still active and valued in all regions of Cameroon, however, their
role in monitoring the performance of the education system is limited. These long-established local
leaders, such as the Lamidos in the Far North or the Fon in the North West, retain a presence, an
authority, and significant influence over their land and their people. Tribal leaders as representatives of
the tribe’s ancestors operate as leaders over several thousand ―subjects.‖ There is considerable respect
for the status and position that they hold. There is an awareness of the need for traditional leadership to
integrate modern education with traditional culture, expectations, and behavior. However, how much
traditional authorities are involved with education varies widely, but mostly, they have a limited role.
They are also not involved with monitoring the government’s provision of educational services. In a
few cases, especially those leaders who have had greater exposure by studying abroad, there was real
interest and motivation in both supporting education and monitoring performance. However, these
leaders do not have clear understanding for what they can do or where they can be effectively involved.
86. There is also variation in how government officials relate to local leaders. While they respect
the traditional leaders, most officials were not sure how to motivate them to become more involved with
the school system or in what ways. In the Far North, the delegate had established a more constructive
relationship with local leaders. For example, in areas where girls’ enrollment and primary completion
rates were low, the regional delegate combined school visits with meetings with the Lamidos and Imam
in order to enlist their support for girls to attend school regularly. In the future, it will useful to explore
more constructive ways in which the influence and authority of local leaders can be used to improve
school education.
87. There are numerous teachers unions in Cameroon but they have little influence in terms of
system accountability and, more specifically, improvement of teacher management. Konings
(2005) identified two phases in the evolution of teachers unions in Cameroon. In the first phase, during
the early 1990s, teachers unions were confrontational, demanding higher standards in examinations and
better conditions for teachers and students to improve the quality of education. In the second phase,
starting in the late 1990s, there was a shift from confrontation to co-option by the government, which
began offering lucrative posts and other forms of remuneration to union members. Unions are in
essence no longer autonomous entities that can play a role in improving system accountability. Most of
the teachers union representatives interviewed did not give any opinions or highlight the woes of the
teaching profession and the quality of education. Instead, they discussed the financial support they
received from the government for their jobs and the additional remunerations received in various ways.35
35
One example of the latter is the official use of the secondary school teachers union as proctors during examinations.

47
The message communicated was that since they were now well cared for, it was no longer necessary to
agitate against the education system’s limitations or press for improvements in its governance.
Box 4: Prominent teacher unions include an association and two federations:
The Teachers’ Association of Cameroon (TAC) in the Anglophone region
Federation Camerounaise des Syndicats de l’Education (FECASE [Cameroon Federation of education
unions]), made up of:
o Cameroon Teachers’ Trade Union
o Syndicat National Autonome de l’Education et de la Formation [National independent education and
training union]
o Organization Nationale des Enseignants du Cameroon [National organization of teachers in Cameroon]
o Organisation Nationale des Enseignants d’Education Physique et Sportive [National organization of
physical education and sports teachers]
o Syndicat National des Enseignants du Primaire et de la Maternelle [National union of primary and
kindergarten/pre-school teachers]
Federation des Syndicats de l’Enseignment et de le Recherche (FESER [Federation of education and research
unions), consisting of :
o Syndicat National des Enseignants du Superieur [National union of teachers in higher education]
o Syndicat National Autonome de l’Enseignement Secondaire [National independent union of secondary
education]
o Syndicat National des Enseignants du Primaire et de la Maternelle [National union of primary and
kindergarten/pre-school teachers]
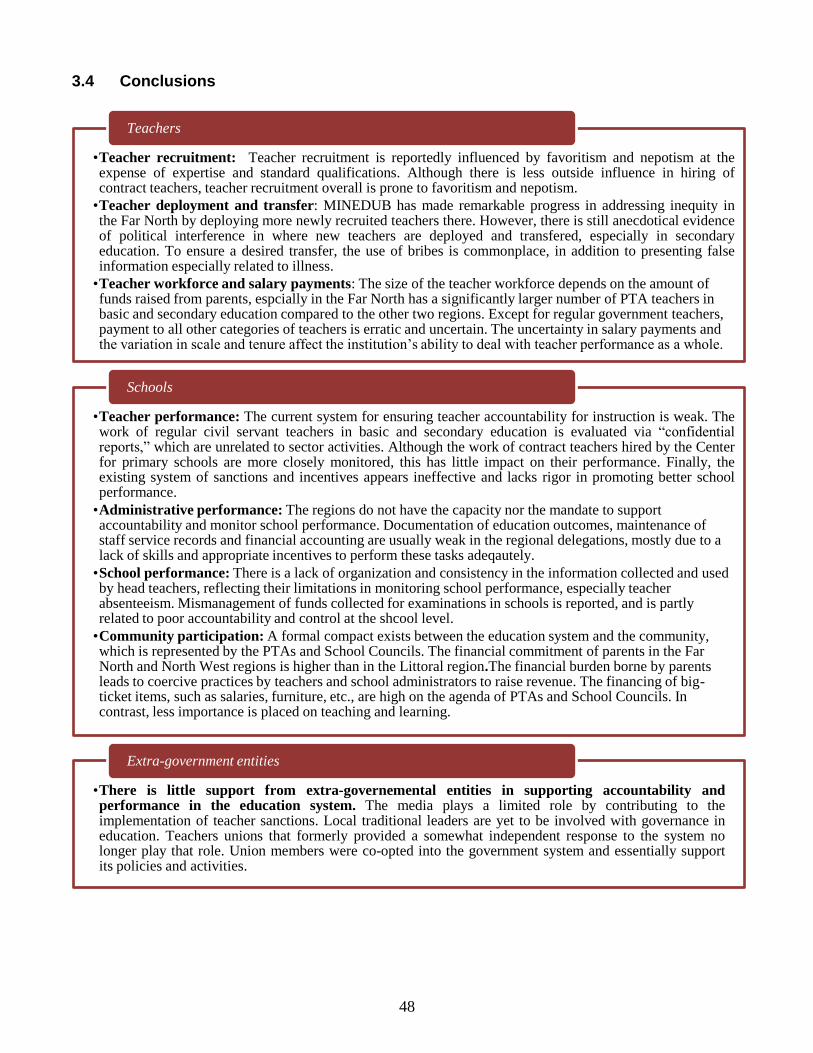
48
3.4 Conclusions
•Teacher recruitment: Teacher recruitment is reportedly influenced by favoritism and nepotism at the expense of expertise and standard qualifications. Although there is less outside influence in hiring of contract teachers, teacher recruitment overall is prone to favoritism and nepotism.
•Teacher deployment and transfer: MINEDUB has made remarkable progress in addressing inequity in the Far North by deploying more newly recruited teachers there. However, there is still anecdotical evidence of political interference in where new teachers are deployed and transfered, especially in secondary education. To ensure a desired transfer, the use of bribes is commonplace, in addition to presenting false information especially related to illness.
•Teacher workforce and salary payments: The size of the teacher workforce depends on the amount of funds raised from parents, espcially in the Far North has a significantly larger number of PTA teachers in basic and secondary education compared to the other two regions. Except for regular government teachers, payment to all other categories of teachers is erratic and uncertain. The uncertainty in salary payments and the variation in scale and tenure affect the institution’s ability to deal with teacher performance as a whole.
Teachers
•Teacher performance: The current system for ensuring teacher accountability for instruction is weak. The work of regular civil servant teachers in basic and secondary education is evaluated via ―confidential reports,‖ which are unrelated to sector activities. Although the work of contract teachers hired by the Center for primary schools are more closely monitored, this has little impact on their performance. Finally, the existing system of sanctions and incentives appears ineffective and lacks rigor in promoting better school performance.
•Administrative performance: The regions do not have the capacity nor the mandate to support accountability and monitor school performance. Documentation of education outcomes, maintenance of staff service records and financial accounting are usually weak in the regional delegations, mostly due to a lack of skills and appropriate incentives to perform these tasks adeqautely.
•School performance: There is a lack of organization and consistency in the information collected and used by head teachers, reflecting their limitations in monitoring school performance, especially teacher absenteeism. Mismanagement of funds collected for examinations in schools is reported, and is partly related to poor accountability and control at the shcool level.
•Community participation: A formal compact exists between the education system and the community, which is represented by the PTAs and School Councils. The financial commitment of parents in the Far North and North West regions is higher than in the Littoral region.The financial burden borne by parents leads to coercive practices by teachers and school administrators to raise revenue. The financing of big-ticket items, such as salaries, furniture, etc., are high on the agenda of PTAs and School Councils. In contrast, less importance is placed on teaching and learning.
Schools
•There is little support from extra-governemental entities in supporting accountability and performance in the education system. The media plays a limited role by contributing to the implementation of teacher sanctions. Local traditional leaders are yet to be involved with governance in education. Teachers unions that formerly provided a somewhat independent response to the system no longer play that role. Union members were co-opted into the government system and essentially support its policies and activities.
Extra-government entities
49
Chapter 4 MAXIMIZING GOVERNANCE IN EDUCATION
4.1 The impact of governance on education outcomes
88. Central ministries play a vital role in good governance, both in terms of planning and
executing activities as well as monitoring performance. This is reflected in the differences between
the statistical information available for basic and secondary education. Statistics on enrollment,
transition, and teachers in basic education are better organized and streamlined, compared to what is
available in secondary education. This is largely due to the positive role of the Center in both
developing a statistical database and assisting regions in the collection and maintenance of information
on significant outcomes in the sector. Similarly, there is a better distribution of teachers in basic
education than in secondary education. The critically low number of regular civil servant teachers in the
Far North in secondary education is a reflection of this unequal distribution of teachers. Again, this
situation is beyond the capacities and mandate of the regional delegations and is largely the role of
MINEDUB and MINESEC. 89. The structure of governance and accountability for education performance is more clearly
defined in secondary than in basic education. Education performance is dependent on consistent
school functioning and regular instruction. In basic education, while there is a concerted attempt to
ensure school and teacher performance, the overall strategy is confusing and ineffective when it comes
to making teachers accountable for quality instruction. The four types of teachers in the system and the
different measures of accountability in place reflect this lack of overall strategy. Most important, the
teaching and learning that is critical to improving the quality of basic education is inconsistently
monitored. In secondary schools, although it may not be fully implemented, there is a clearer process for
monitoring the performance of teachers. In addition, there is an emphasis on the quality of instruction
and the improvement of student learning. It is likely that the smaller size of the secondary education
sector makes better organization and accountability possible. In addition, the number of high-stakes
examinations that certify students forces a higher level of oversight in secondary education.
90. This report highlights a number of shared strengths and weaknesses in the system of
governance and accountability, and show that some of the differences uncovered may explain the
variation in educational outcomes across the three regions. Table 10 shows the positive and negative
aspects of governance. Aspects in red are areas that are directly attributable to the Center. The
remaining aspects, under regional or local control, may be influenced by the Center, as well as by the
situation within the region. The commonalities include both positive dimensions that are conducive to
good governance and negative ones that constrain good governance.

50
Table 10. Commonalities in governance practices across the three regions
Note: Text in bold is attributable to the Center.
* While the new procurement code adopted in September 2004 brings procurement rules and regulations into compliance
with international good practices, the public financial management system requires additional reforms to make budgets and
financial reporting reliable, consistent, and substantive.
Positive
•Regional offices are committed to the instructions/mandates from the Center
•No currency is exchanged. The use of credit vouchers or “cartons” are used for all financial transactions.
•Control missions monitor regional accounts and expenditure on a somewhat regular basis.
•Strategies are in place for monitoring teacher performance in secondary education.
•Financial support from parents is substantial. Communities and parents are consistently involved with the school
•Some accounting and monitoring of expenditure in schools.
Negative
•Complexities of government budget allocations exacerbated by the substantial school level parent support for education.
•Control missions are not sufficient to ensure acceptable levels of financial management and accounting.*
•Mandate for regional delegations is confused especially with regard to the governance of budgets and expenditure within the region.
•The registration process for newly recruited secondary school teachers is unsatisfactory.
•Inflated list prices used for procurement have the potential to support informal misuse of funds.
•Absence of a monitoring strategy for the minimum package and financial transfers to schools affects (i) distribution, (ii) adequacy, and (iii) extent of use.
•Weak monitoring of primary school performance is due to a dysfunctional inspection system and the lack of uniformity and consistency in the collection of school level information.
•Inadequate overall strategy to monitor teacher performance in basic education leads to limited accountability for regular instruction in the classroom.
•Updating and maintenance of teacher and staff service records are unsystematic and inconsistent in both basic and secondary education.
•Potential for misuse of funds is generated in the context of secondary school examinations is high.
•Political interference in teacher transfers seriously affects school functioning.
•Lack of reliability and uneven motivation stems from different types of teachers and corresponding variation in their salaries in both basic and secondary education.

51
91. More specifically, some limitations in accountability and oversight seem to contribute to low
education outcomes in the Far North. The differences between the Littoral and Far North regions are
starker than those between the Far North and the North West. These dissimilarities (see table 11) help
explain the poorer performance by schools in the Far North, compared to the other regions. The Far
North has less administrative staff, which reduces its ability to provide adequate oversight of the system.
In contrast, the additional staff and well-equipped offices of the Littoral region are more advanced and
efficient. Political interference in selecting sites for schools and collusion between contractors and the
public works department seriously hurts infrastructure development in the Far North. Other factors
constraining the development of education in the Far North include the smaller number of regular civil
servants teachers and the disinclination of teachers generally to teach in this region. This is reflected in
the much larger number of transfer requests by teachers there. Although there are efforts to improve the
situation in the education priority zone, it still has a shortage of teachers, especially in secondary
education.
Table 11. Differences in governance between the Littoral and Far North regions
Far North
Littoral
Administrative staff to student ratio is high -
one staff for about 20,000 students.
Administrative staff to student ratio is low - one staff
for about 3000 students.
Minimum package and financial transfers are
not commensurate with enrollment
Accounting in the regional and département
delegations is more organized.
Offices in the Far North are not well
equipped.
Rational allocation of new sites for school
construction.
Arbitrary allocation of new sites for school
construction.
Large number of civil servant regular teachers in both
primary and secondary.
Collusion in infrastructure development
between contractors and government
officials.
Requests for transfers are low.
Large number of requests for teacher
transfers
Large number of PTA teachers in both
secondary and basic education
Positive: Positive discrimination in deployment of new teacher recruits in basic education to the Far North
4.2 Improving education outcomes through better governance: a roadmap
92. This study has shown that weaknesses in the governance and management can result in poor
education outcomes. Improving processes and approaches that are sometimes deeply entrenched in the
daily life of citizens requires time and a multipronged strategy. A range of possible strategies to
improve the governance landscape of public expenditure and system functioning is presented below.
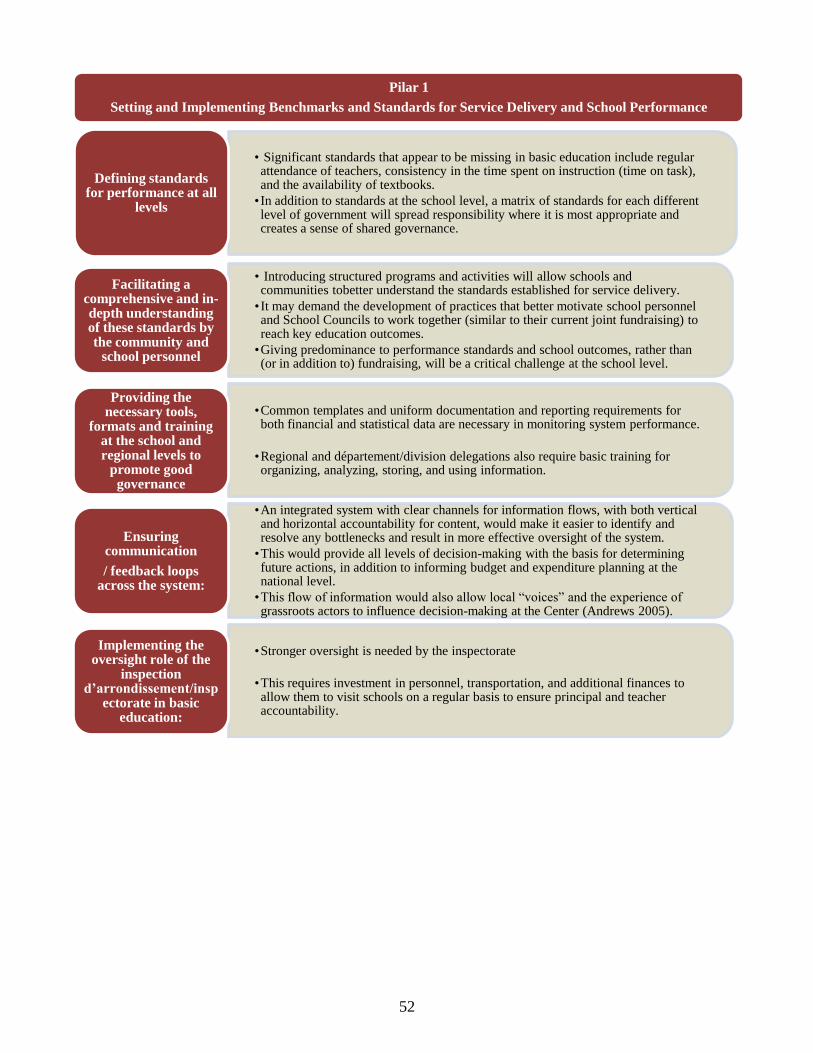
52
Pilar 1
Setting and Implementing Benchmarks and Standards for Service Delivery and School Performance
• Significant standards that appear to be missing in basic education include regular attendance of teachers, consistency in the time spent on instruction (time on task), and the availability of textbooks.
• In addition to standards at the school level, a matrix of standards for each different level of government will spread responsibility where it is most appropriate and creates a sense of shared governance.
Defining standards for performance at all
levels
• Introducing structured programs and activities will allow schools and communities tobetter understand the standards established for service delivery.
• It may demand the development of practices that better motivate school personnel and School Councils to work together (similar to their current joint fundraising) to reach key education outcomes.
•Giving predominance to performance standards and school outcomes, rather than (or in addition to) fundraising, will be a critical challenge at the school level.
Facilitating a comprehensive and in-depth understanding of these standards by the community and
school personnel
•Common templates and uniform documentation and reporting requirements for both financial and statistical data are necessary in monitoring system performance.
•Regional and département/division delegations also require basic training for organizing, analyzing, storing, and using information.
Providing the necessary tools,
formats and training at the school and regional levels to
promote good governance
•An integrated system with clear channels for information flows, with both vertical and horizontal accountability for content, would make it easier to identify and resolve any bottlenecks and result in more effective oversight of the system.
•This would provide all levels of decision-making with the basis for determining future actions, in addition to informing budget and expenditure planning at the national level.
•This flow of information would also allow local ―voices‖ and the experience of grassroots actors to influence decision-making at the Center (Andrews 2005).
Ensuring communication
/ feedback loops across the system:
•Stronger oversight is needed by the inspectorate
•This requires investment in personnel, transportation, and additional finances to allow them to visit schools on a regular basis to ensure principal and teacher accountability.
Implementing the oversight role of the
inspection d’arrondissement/insp
ectorate in basic education:

53
Pilar 2
Teachers: Improving Management and Addressing Governance Issues
• Improving recruitment procedures specifically in secondary education
• Increase transparency in deployment and transfer procedures at both primary and secondary levels.
•Other countries experience (Bogota, Columbia, Mauritania) show that three aspects are key to the success of such reform: i) agreement and strict adherence to a fixed date for all transfers and deployments of existing and new teachers (before the school year begins); ii) public knowledge of the posts available and the criteria for selection; iii) only entity has the mandate for the process (Hallak and Poinsson 2007, CSR 2005)
Ring-fencing and transparency in
teacher recruitment and deployment
•Streamline the formats and procedures for monitoring the performance of all teachers (civil servants and contract and PTA teachers), using common measures and standards.
•One possible option is to retain the simplicity of the form introduced by MINEDUB to monitor its new contract teacher program, while expanding it to include more core aspects of instruction.
•When developing new templates, the technical skills of inspectors and principals should be taken into account, otherwise reviews will be ignored, lost, or subverted with spurious information (Andrews 2005).
Streamlining the monitoring of
teacher performance:
•Comprehensive, organized, and regularly updated service records of all education-sector personnel, from the highest levels of regional delegations to the school level, would help identify both non-performing and well-performing staff over time.
•A personnel database of all administrative staff in the region could be located in regional delegations. The département/division delegations could be responsible for maintaining a complete database of all teachers under their jurisdiction.
•Such data, if analyzed, would also facilitate an understanding of the variations in compliance and their impact on improving education service delivery.
Maintaining and updating of
employee service records:
• Introducing incentives for good performance is necessary, on one hand, to display the system’s commitment to standards and, on the other hand, to motivate all personnel to improve the execution of their tasks.
•Graded incentives for levels of improvement and the distribution of incentives across the system will be more helpful to improve system functioning than existing incentives.
•An incentive strategy that includes salary increases and promotions but it is a complex operation and its success depends on how well and how thoroughly the performance of teachers and administrative staff is monitored and documented.
•The Chilean experience (Mizala et al. 2005) where incentive takes into account teacher salaries and student performance is useful but requires a reliable system of learning assessment.
Instituting incentives for good
performance:
•The existing system of sanctions needs to be expanded to include other categories, such as time-on-task, record keeping, etc., that are specifically tied to standards or benchmarks established for service delivery.
•Good governance will be demonstrated when the system can respond with appropriate sanctions to different levels of non-compliance. For example, teachers coming late to school each day would also continue to fall behind in valuable time-on-task, so sanctions should correspond to both the behavior and its consequences.
Expanding the existing system of
sanctions to include work standards and
administrative performance:

54
Pilar 3:
Equitable Distribution of Resources and Effective Monitoring of Budgets and Expenditure
•Understanding in detail the different types of financial contributions made by parents and tracking the amounts received by category throughout the school year can inform any attempt to make government financing for education more equitable and to draft more rational budgets.
•Streamlining and establishing transparency in the purpose and amounts received by the school, can only improve accountability across the system.
Understanding and streamlining
informal and formal costs to parents:
•Equity and realignment in fund allocations would improve efficiency in the use of funds across regions, as well as improve performance in both high and low performing regions.
•Taking into account MINEDUB’s deployment of newly recruited teachers to the education priority zones as an attempt to redress the neglect of the Far North, the high pupil-teacher ratios indicate the need to continue and expand the strategy of allocating extra resources, especially in secondary education.
Equity and realignment in fund
allocations across regions:
•Rather than a set of miscellaneous items, providing textbooks would help improve learning.
•Alternatively, schools could be given an operating budget that tops up the contribution of parents. Financial support for school operations might be reconceived in one of the types of school-based management (Barrera-Osorio et al. 2009), which nurtures autonomy, participation, and accountability
Rethinking financial support to schools:
•Control missions could be strengthened by introducing a system of random sample-based surprise visits planned for the whole year, which would cover the whole region.
•Regional institutions could also be given specific responsibility for monitoring budgets and expenditures in the region.
•To ensure better use of public finances, it would be useful to revisit the policy of list prices. List prices could be introduced at the regional level, where it is possible to take into account the competitiveness of services and cost of commodities across a region rather than a one-size-fits-all for the country.
Reviewing control missions and list
prices:
• In the Far North, where school construction was unsatisfactory, the region could introduce a system of blacklisting contractors that provided sub-standard construction, since reporting them internally does not seem to deter unscrupulous contractors.
•Public exposure in newspapers, perhaps, might get the attention of contractors with school construction and spur them to work without fraud.
•Taking such action would require the support of the highest levels of administration, as well as traditional local leaders. PTAs can be induced to lobby for clear adherence to pre-determined construction specifications and building codes to keep teachers and students safe.
Blacklisting contractors:
55
Pilar 4:
Establishing a System of Public Transparency to Promote Good Governance
•Both the media and local leaders should be utilized much more fully to push for more transparent and fuller accountability in the education sector in Cameroon.
•The media in Cameroon plays an important dissemination role for the government, but could do more to highlight critical issues for public debate.
•Traditional leaders can be critical advocates for public accountability if they are systematically introduced to the challenges in the education sector.
Expanding the role of the media and local
leaders:
•Regular assessments or surveys conducted by autonomous institutions or external agencies could strengthen transparency.
•Such assessments include: micro-level surveys (including public expenditure tracking, quantitative service delivery, and teacher absenteeism surveys), household community surveys, and learning achievement surveys (Amin et al., 2008)
•Other tools that raise public perceptions of education service delivery, such as school report cards, force transparency and encourages public pressure for change.
Conducting surveys and assessments to
improve transparency:

56
ANNEXES
Annexe I: organisation du système et statistiques
The Basic and Secondary Education System
Francophone System Anglophone System
Public Basic Education
Primary
2nd
cycle
secondary
1st cycle
secondary
Ecole Primaire - 6 ans
SIL, CP/CPS,CE1&2,
CM1&2
Exam : CEP
Primary school – 7
years
CL1 – CL7
Exam : FSLC
Common Entrance
Exam
CET- 4 ans
6ème
-3ème
Exam :
BEPC
CES - 4
ans
6ème
-3ème
Exam :
CAP
CES-5 years
Form 1-5,
Exam : GCE O
Level
CET- 4 ans
Form 1–4
Exam :
CAP
General
Secondary
(3 years); Form
5, Lower &
Upper 6
Exam: GCE A
Level
General Secondary
(2 years); Lower
& Upper 6; Exam:
GCE A Level
Lycée
technique
(3 ans)
2nde
- terminale
Exam: BACC
T
Lycée
général
(3 ans)
2nde
-
terminale
Exam:
BACC

57
Teachers in Basic Education
Regular Contractuel Contractualize PTA Total
Adamaoua 302 124 1053 576 2055
Center 3772 434 2854 2220 9280
East 637 213 1148 923 2921
Far North 986 313 1963 3120 6382
Littoral 1783 395 974 839 3991
North 672 220 1224 1819 3935
North West 1233 669 1128 1676 4706
West 2941 193 1969 2325 7428
South 1152 213 1391 626 3382
South West 1096 892 807 736 3531
Cameroon 14574 3666 14511 14860 47611
Population GER in public schools
Public schools and
teachers
Region Girls Total Girls Total
No. of
schools
No. of
teachers
Adamaoua 72745 144652 56258 134981 550 2055
Center 238106 482460 192054 394907 1575 9280
East 74048 151082 69746 152016 1483 2921
Far North 269715 542080 199231 495717 648 6382
Littoral 167805 335185 72314 147531 638 3991
North 148412 303089 112286 285885 814 3935
North West 179314 361451 111168 232434 920 4706
West 197264 391375 177173 366809 1172 7428
South 52943 109193 51524 108225 721 3382
South West 124163 244805 74280 151441 703 3531
Cameroon 1524515 613074 1116034 2469946 9224 47611

58
Annexe II : les trois régions
L’Extrême-Nord
La capitale de la région francophone de l’Extrême-Nord est Maroua. Cette région a une population de
2,7 millions d’habitants. Elle est frontalière avec le Tchad à l’est et avec le Nigéria à l’ouest. Elle est
divisée en six départements. Exposée à des cycles de sécheresses et d’inondations, la végétation est de
type savane broussailleuse au sud et savane boisée au nord.
L’économie régionale est entièrement tributaire de l’agriculture et de l’élevage. La région souffre d’un
certain isolement, qui est à la fois perçu et réel dans le centre, ce qui explique l’existence d’un parti
politique ayant pour fief le Nord (l’Union nationale pour la démocratie et le progrès). La région se
caractérise également par la présence de nombreux chefs traditionnels et religieux, ainsi qu’une
importante population animiste.
Le Littoral
La capitale de la région francophone du Littoral est Douala. Cette région a une population d’environ 2,2
millions d’habitants. À l’exception de la Baie du Biafra, qui constitue l’une de ses lignes côtières, la
Public Secondary Education
Enrollment: Vocational Enrollment: General No. of
schools
Teachers
Region Girls Total Girls Total Regular Temporary
Adamaoua 1076 4279 7667 22691 57 760 346
Center 9203 26293 62925 129535 228 7891 4032
East 3265 9464 8068 19619 64 917 786
Far North 2235 7131 15918 71974 142 788 1185
Littoral 11132 25389 40738 83049 105 3490 2542
North 3039 10058 10365 39105 62 1264 872
North West 5797 16187 29535 56304 171 3415 289
West 8665 24469 68174 133763 185 4292 4277
South 3373 8726 15250 33505 108 966 715
South West 5665 13520 30700 60079 135 3388 510
Cameroon 53450 145516 289340 649624 1257 27171 15554

59
région du Littoral est bordée par d’autres régions du Cameroun. Elle est divisée en quatre départements.
La végétation se compose de mangroves le long de la côte et de forêts autour de Douala et à l’intérieur
des terres. La population est urbanisée à 85 %.
L’agriculture – traditionnelle et moderne – joue un rôle crucial. Le secteur forestier est important dans la
région, où sont concentrées 70 % des industries camerounaises, notamment sidérurgie, industrie
chimique, exploitation du bois, bâtiment et production alimentaire. En raison de son poids économique
et de sa population, Douala a une grande importance stratégique sur le plan politique. C’est
généralement dans cette ville qu’éclatent les manifestations contre la politique de l’administration
centrale ou l’augmentation du coût de la vie. La région compte de nombreux syndicats qui contribuent à
tempérer la domination du pouvoir central.
Le Nord-Ouest
La capitale de la région anglophone du Nord-Ouest est Bamenda. Cette région a une une population de
1,8 million d’habitants qui la place au troisième rang des régions du Cameroun. Soixante-deux pour cent
de sa population a moins de 20 ans. Le Nord-Ouest fait partie des prairies de l’Ouest. La région est
divisée en sept départements.
L’économie est dominée par l’agriculture, avec un important sous-secteur de l’élevage. L’industrie est
embryonnaire. À l’exception de la fabrication de savon, la transformation des produits agricoles est la
principale activité industrielle. L’artisanat est également très développé (menuiserie, vannerie et
poterie). Le principal parti d’opposition au Cameroun, le Social Democratic Front, a une solide base de
soutien dans la région et conteste souvent la domination francophone du pouvoir central.
60
Annexe III: gestion des infrastructures

61

62
Annexe IV: exemple de « carton » du Ministère des Finances

63
Annexe V: gestion des données dans la délégation départementale du Wouri
64

65

66

67
Annexe VI: Organigramme des services déconcentrés
De la Délégation régional de l’Education de Base
Article 76
(1) Placée sous l’autorité d’un délègue régional las délégation provinciale de l’éducation de base est
chargée :
De la coordination et de l’animation, a l’échelon de la Province des activités pédagogiques des
Enseignements Primaire et Maternel
De l’application des programmes et méthodes d’enseignement définis par le ministère
Du suivi de la programmation et de l’organisation de la formation continue des personnels relevant de
son ressort de compétence en liaison avec la direction des ressources humaines
De la préparation des actes relatifs a l’affectation et a la mutation des personnels de son ressort de
compétence ainsi que de leur évaluation
De la nomination des directeurs d’écoles primaire et maternelles âpres visa du ministre d l’éducation de
base
De la signature et de la délivrance des diplômes du certificat d’études primaires et du first school leaving
certificate.
De la nomination des présidentes de jury des examens relevant de sa compétence
De la constitution des listes des correcteurs des examens relevant de sa compétence
De la sensibilisation de tous les partenaires a l’importance de la communauté éducative
(2) Elle comprend
Le service de l’accueil du courrier de liaison et de la traduction
Le service des normes et de l’évaluation des apprenants
Les inspections pédagogiques provinciales
La sous direction des affaires générales
Le service de la carte scolaire de l’orientation-conseil et des activités post et périscolaires
De la Délégation Départementale de l’Education de Base
Article 89
(1) Placée sous l’autorité d’un délègue départemental la délégation départementale de l’éducation de
base est chargée :
Du suivi de l’application des programmes et des méthodes d’enseignement
De la simulation des actions propres a assuré l’enracinement et le rayonnement de l’école dans son
milieu
Du suivi des actions de maintenance et d’entretien des bâtiments et des équipements scalaires publics
De la centralisation des besoins de formation
De l’élaboration des plans de formation continue du personnel
De la gestion pédagogique administrative et financière des personnels de l’enseignement primaire et
maternel de son ressort due compétence
De la synthèse des propositions de nomination des directeurs d’écoles de son ressort de compétence
De la gestion matérielle des examens et des concours au niveau du département

68
De la délivrance des attestations de réussite au certificat d’études primaires et au first School Leaving
Certificate.
(2) Le Délègue Départemental est assiste de deux Conseillers Pédagogiques
(3) La Délégation Départementale de l’Education de Base comprend
Le Service des Affaires Administratives et Financières
Le Service des Statistiques de l’orientation conseil et des activités post et préscolaire
De l’Inspection D’Arrondissement ou de District de l’Education de Base
Article 92
(1) Placée sous l’autorité D’un inspecteur, l’Inspection D’Arrondissement ou de District est chargée
De l’identification et de la formulation des besoins de l’arrondissement ou du District en écoles et en
personnel
De la tenue de la carte scolaire de l’Arrondissement ou du District et du fichier du personnel enseignant
relevant de son autorité
De l’inspection administrative et pédagogique des écoles ou groupes scolaires relevant de son autorité
De l’organisation matérielle des examens et concours relevant de sa compétence
Du suivi de la sante des élèves et enseignants de sa circonscription
En relation avec les inspections Medico scolaires provinciales et le formations sanitaires locales
De l’organisation et du suivi des activités post et périscolaires de sa circonscription
De l’inspection de l’assistance et du conseil des directeurs d’école et du personnel enseignant de son
ressort
De l’évaluation des personnels relevant de son autorité
De élaboration d’une liste d’aptitude aux fonctions de directeur d’école
De la proposition de nomination aux fonctions de directeur d’école de son ressort de compétence
De l’analyse des besoins de formation de ses personnels et de la transmission des résultats au délègue
départemental.
(2)Elle comprend
Le bureau des affaires pédagogiques et des examens
Le bureau des affaires générales
Le bureau de l’orientation-conseil et de la statistique
Le bureau de la sante e des activités post et périscolaire

69
Annexe VII: exemple de rapport confidentiel sur un enseignant

70
71
72

73
Annexe VIII : fiche de suivi séquentiel des enseignants (MINEDUB)
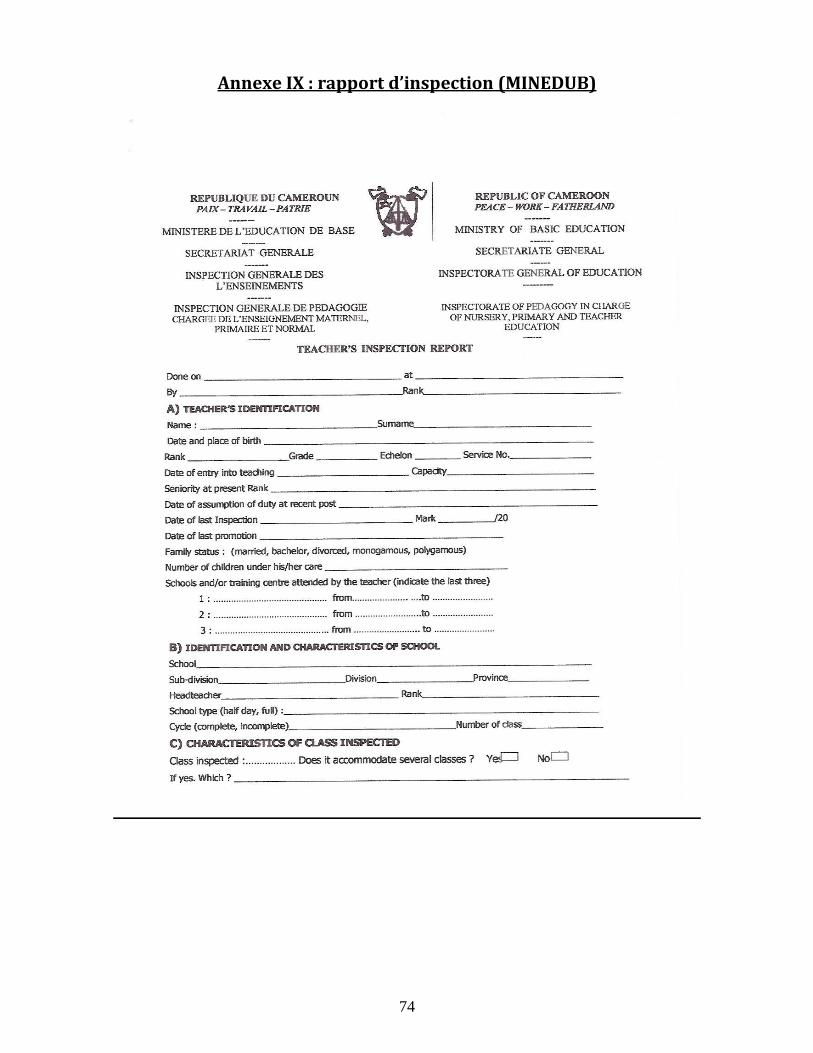
74
Annexe IX : rapport d’inspection (MINEDUB)

75
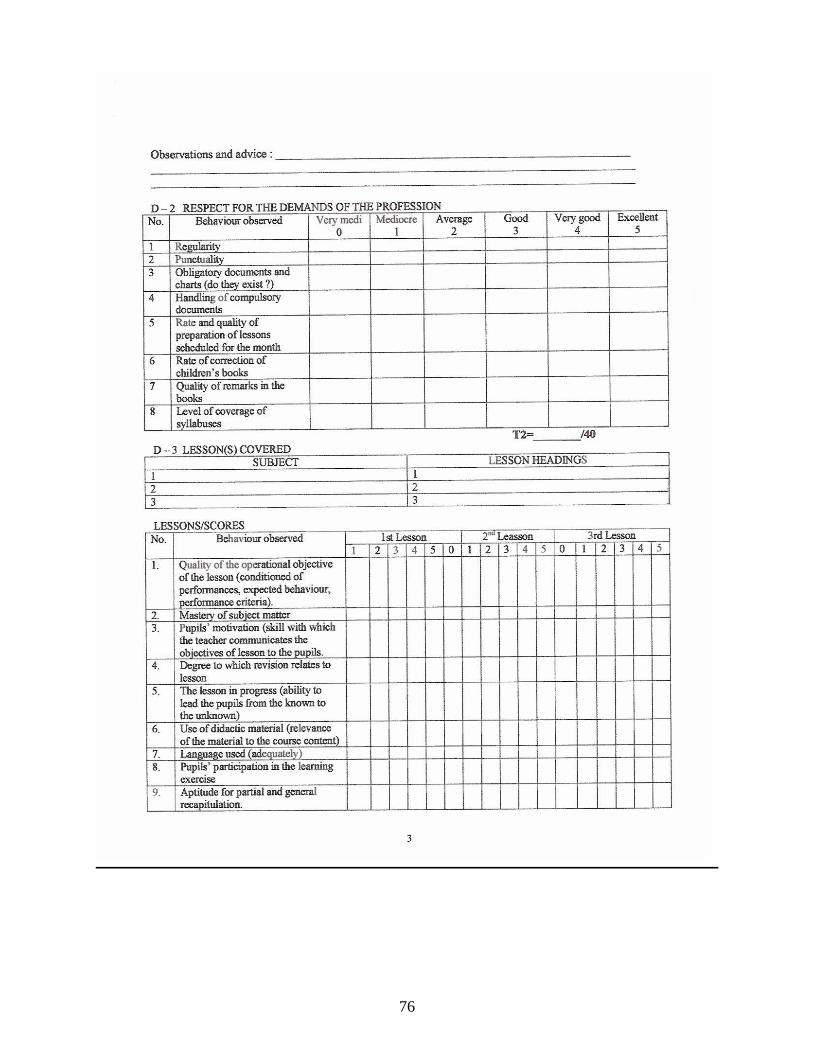
76

77

78
79
Annexe X : rapport pour les inspecteurs (MINEDUB)
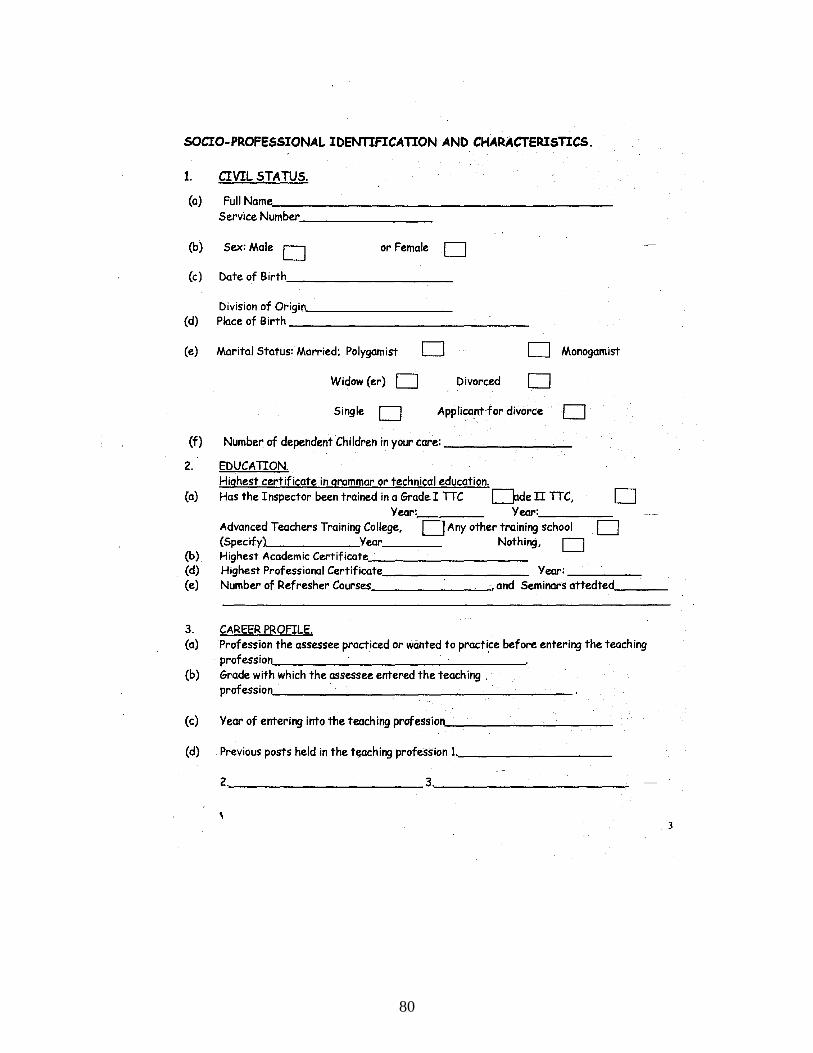
80
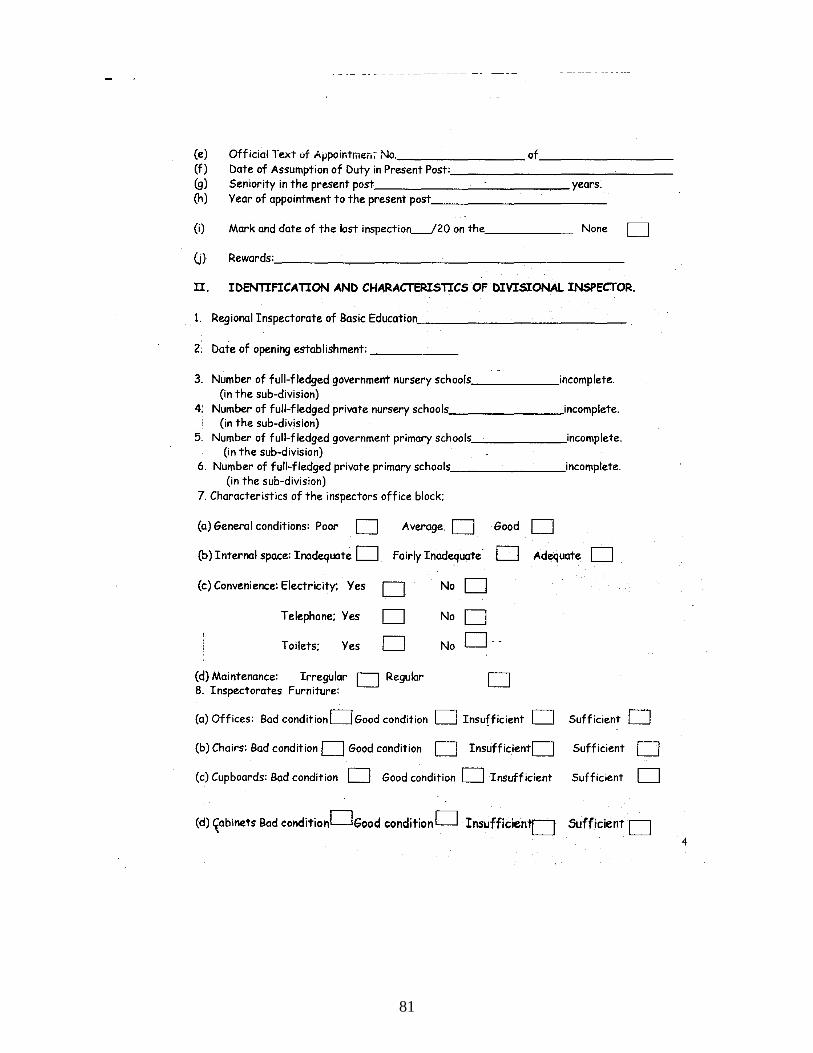
81

82

83

84

85
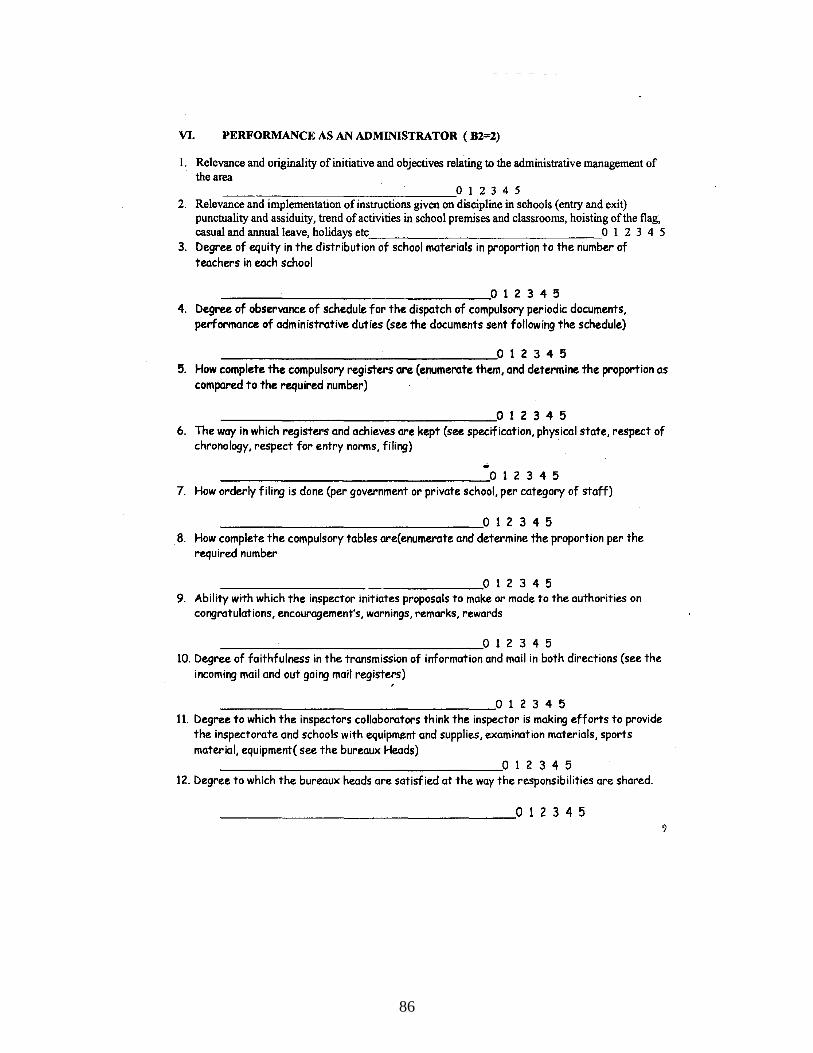
86
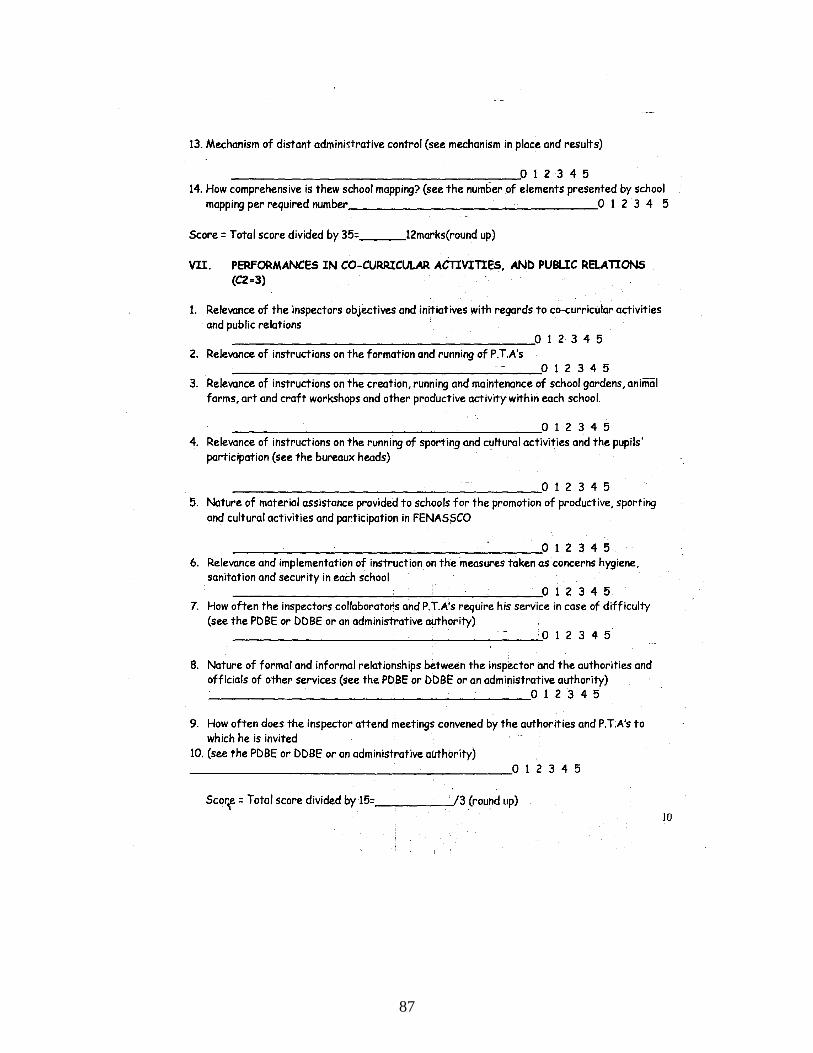
87

88
89

90
Annexe XI : restitution de l’étude
A l’issue de cette étude, a été proposé un dialogue sectoriel entre la Banque mondiale, auteur du
rapport, les ministères en charge de l’éducation et de son administration au Cameroun, ainsi que
des représentants de la société civile. Ce processus a consisté en la mise en place d’ateliers
régionaux dans deux des trois régions visitées par l’étude (Nord-Ouest et Extrême-Nord), et en
l’organisation d’une table ronde nationale à Yaoundé.
L’atelier de Maroura (Extrême-Nord) a réuni 56 personnes le 25 Janvier 2011. L’atelier de Bamenda
(Nord-Ouest) a réuni 68 participants le 28 Janvier 2011. Enfin, la table ronde nationale à Yaoundé a
réuni 86 participants le 1er
Février 2011.
Ce processus de restitution a eu pour objectif, en plus de la publication des analyses et des
recommandations du rapport, la définition d’un plan d’action.
De manière plus précise, les objectifs poursuivis étaient les suivants :
présenter les conclusions de l’étude à une audience large rassemblant les responsables du secteur
éducatif aux niveaux central et déconcentré ainsi que les membres de la communauté éducative et de
la société civile ;
recueillir les réactions des participants sur des propositions de réformes, et identifier un nombre
restreint d’activités concrètes qui pourraient être mises en œuvre au niveau central et local ;
aboutir au niveau local à l’établissement d’un plan d’action qui serait présenté aux autorités centrales
du secteur pour discussion et validation au cours de la table ronde de Yaoundé.
Les ateliers régionaux ont réuni :
- Gouverneurs et préfet séants
- Délégués Régionaux du MINEDUB, MINESEC, MINFI, MINFOPRA, MINEPAT
- Parlementaires locaux
- Représentants de la société civile locale,
- Représentants des Associations de Parents d’Elèves locales,
- Représentants des syndicats d’enseignants locaux,
- Représentants locaux de l’association des maires (CVUC)
- Chefs traditionnels.
La Table Ronde nationale à Yaoundé a réuni :
- MINEDUB, MINESEC, MINFI, MINFOPRA, MINEPAT
- Membres du Parlement impliqués sur le secteur Education
- Représentants à Yaoundé des services déconcentrés du MINEDUB, MINESEC, MINFI,
MINFOPRA, MINEPAT
- Représentants de la société civile au niveau national,
- Représentants des Association de Parents d’Elèves au niveau national,
- Représentants nationaux des syndicats d’enseignants,
- Représentants nationaux de l’association des Maires (CVUC)
91
Bilan des ateliers régionaux:
Le rapport a été accueilli de manière globalement positive. En effet, les problématiques traitées dans le
rapport, issues d’un dialogue qualitatif approfondi avec des acteurs du terrain, font écho aux
préoccupations rencontrées au quotidien par les usagers et les personnels du système éducatif
camerounais. Toutefois, certains représentants des ministères ont fait remarquer le fait qu’une étude de
ce type, si elle permettait de pointer des disfonctionnements ponctuels, ne saurait permettre de
généraliser l’existence de ces dysfonctionnements.
Lors des ateliers régionaux, ont été discutés de manière ouverte les différents points clés mentionnés par
l’étude.
La gestion et l’évaluation du travail des enseignants s’est révélée être une préoccupation
récurrente des participants. Qu’il s’agisse des « maîtres des parents » au statut jugé précaire, des
nouveaux contractualisés ou des fonctionnaires, les participants ont fait remarquer que le suivi de la
carrière et de la qualité du travail des professeurs (absentéisme notamment) souffrent parfois de lacunes
préjudiciables à la qualité du service d’éducation. Cela étant, les participants reconnaissent la difficulté
d’une répartition optimale des enseignants, eu égard aux contextes difficiles, en particulier dans les
zones rurales isolées. La prise en compte d’autres facteurs devient alors nécessaire, tels que les
conditions de vie, le mode de recrutement (question par exemple de la forte féminisation du métier
d’enseignant, en particulier dans le primaire), ou l’environnement social et culturel dans lequel évolue
l’enseignant.
Le rôle des APE (Associations de Parents d’Elèves) a été largement discuté, et a été posée
régulièrement la question de l’effectivité de leur pouvoir. Notamment, la question de l’accès à
l’information a été jugée essentielle sur ce thème, en vue d’un meilleur suivi des dépenses, des activités,
et des performances d’un établissement scolaire.
La question du paquet minimum a également fait l’objet de débats. Si de nombreux intervenants
s’accordent à trouver cette dotation utile, beaucoup d’autres jugent que la manière dont sa distribution
est organisée ne garantit pas son efficacité. Des suggestions ont été faites pour son amélioration. En
revanche, il a été noté que le paquet minimum ne doit son existence qu’à la faiblesse des dotations
financières directes aux écoles. En ce sens, la question de son remplacement par une allocation
budgétaire aux établissements a été posée par des représentants d’établissements se disant sous-financés.
De manière spécifique, à l’issue des ateliers régionaux, 3 thèmes de discussion ont été retenus pour
guider les débats et travaux de la table ronde à Yaoundé :
i) Le management des enseignants
ii) La gestion du paquet minimum
iii) L’implication des communautés dans l’éducation
Bilan de la table ronde nationale:
Les Ministres présents ont promis l’adoption d’actions visant à améliorer la gouvernance dans le
système éducatif Camerounais.

92
les Ministres présents et les représentants de la Banque mondiale ont exprimé le souhait de
mener ces discussions à des actions plus concrètes sur le terrain qui contribueraient à améliorer
de façon significative, la gouvernance dans le système éducatif Camerounais.
Un plan d’action faisant suite aux ateliers a été mis en place (annexe XII)
Annexe XII : proposition de plan d’action faisant suite aux ateliers

93

94
BIBLIOGRAPHY
Andrews, Mathew, and Shah, Anwar. 2005. Toward Citizen-Centered Local-Level Budgets in
Developing Countries. In Public Expenditure Analysis, ed. Anwar Shah. Washington, DC: World
Bank.
Banerjee, A.V., R. Banerji, E. Duflo, R., Glennerster, and S. Khemani. 2008. Pitfalls of Participatory
Programs: Evidence from Three Randomized Experiments in Education in India. Washington,
DC: World Bank.
Barrera-Osorio, Felipe. 2009. Decentralized Decision Making in Schools. Washington DC: World
Bank.
Bipoupout, J.C. 2007. The Contribution of the Competency-Based Approach to Education for all in
Cameroon. Prospects 37(2): 205–221.
Clarke, Prema, and Jha Jyotsna. 2006. Rajasthan’s Experience in Improving Service Delivery in
Education. In Reinventing Public Service Delivery in India: Selected Case Studies, ed. V.K.
Chand. Washington, DC, and Thousand Oaks, CA, USA: World Bank and Sage Publications.
Conde, Kéfing. 2006. Prestation Décentralisée des Services Publics en Guinée : Secteurs de l’éducation
et de l’eau potable [Decentralized delivery of public services in Guinea: Education and drinking
water sectors]. Washington, DC: World Bank.
Campos, J. Edgardo, and Sanjay Pradhan, eds. 2007. The Many Faces of Corruption: Tracking
Vulnerabilities at the Sector Level. Washington, DC: World Bank.
Denzin, Norman, and Yvonna Lincoln. 2007. The Handbook of Qualitative Research. 3rd ed. Thousand
Oaks, CA, USA: Sage Publications.
Dynamique Citoyenne. 2007. Lecon apprises du Project de suivi physico-financier des depenses
publiques du secteur d’education exercise 2004 [Lessons learned from the project for the
physical and financial monitoring of public expenditures in the education sector in 2004].
Yaoundé, Cameroon: Dynamique Citoyenne.
Education Human Development Network. 2007. What Is School Based Management? Washington, DC:
World Bank.
French Development Agency [Agence Française de développement] and Government of Cameroon.
2008. Final Report of Test Audit: Implementation of the Program to Recruit Contract Teachers.
Paris, France: AFD.
Government of Cameroon. 2003. The Education Sector Status Report [Rapport d’Etat du Système
Educatif National Camerounais Eléments de diagnostic pour la politique éducative dans le
contexte de l’EPT et du DSRP.] Yaoundé: Government of Cameroon.
http://siteresources.worldbank.org/INTAFRREGTOPEDUCATION/Resources/444659-
1210786813450/ED_CSR_Cameroun_fr.pdf

95
———. 2009. Cameroon Vision 2035. Working Paper. Yaoundé: Government of Cameroon.
http://www.google.com/#sclient=psy&hl=en&q=Vision+2035+cameroon&aq=1&aqi=g3g-
m2&aql=&oq=&gs_rfai=&pbx=1&fp=55c5c69ad4b2bdf Accessed June 2010.
Grindle, M.S. 2004. Good Enough Governance: Poverty Reduction and Reform in Developing
Countries. Governance 17(4): 525–48.
Hallak, Jacques, and Muriel Poisson. 2005. Ethics and Corruption in Education: An Overview. Journal
of Education for International Development 1(1).
Konings, Piet. 2005. Assessing the Power of Newly Created Teachers’ Organizations during
Cameroon’s Political Liberalization. JEQ/RESA 3(2): 129–52.
Leguéré, Pierre. 2003. Approvisionnement en livres scolaires: vers plus de transparence. Afrique
francophone [Supply of textbooks: Toward greater transparency in francophone Africa. In
Ethics and Corruption in Education. Paris: UNESCO.
Kpundeh, Sahr. 2004. Process Interventions versus structural Reforms: Institutionalizing Anti-
Corruption Reforms in Africa. In Building State Capacity in Africa: New Approaches, Emerging
Lessons, ed. Alan Gelb, John Sahr Kpundeh, Frannie Léautier, and Brian Levy and. Washington,
DC: World Bank Institute.
Lewis, Maureen, and Gunilla Pettersson. 2009. Governance in Education: Raising Performance in the
Sector. Draft paper. World Bank, Washington, DC.
MINEDUB (Minestere de l’Education de Base [Ministry of primary education]). 2006/2007 and
2007/2008. Statistical Yearbook. Yaoundé: Government of Cameroon Minestere de l’Education
de Base.
———. 2008. Mis en oeuvre du programme de centralisation des enseignants au Ministere de
l’education de Base: Manual des Procedures [Implementation of the centralization of education:
Manual of procedures]. Yaoundé: Government of Cameroon.
MINESEC (Minestere de l’Education de Secondaire [Ministry of Secondary Education]). 2006/2007 and
2007/2008. Annual Statistics. Yaoundé: Government of Cameroon.
Mizala, A., and P. Romaguera. 2005. Teacher Salary Structure and Incentives in Chile. In Incentives to
Improve Teaching, ed. E. Vegas. Washington, DC: World Bank.
Mulkeen, A. 2007. Recruiting, Retaining, and Retraining Secondary School Teachers and Principals in
Sub-Saharan Africa. Washington, DC: World Bank.
Nnana, Marie-Claire. 2009. Cameroon Tribune. May 13, 2009. www.Cameroon-tribune.
Ndongko, Theresa, M., and Leke L. Tambo. 2000. Education Development in Cameroon 1961–1999.
Buea, Cameroon: University of Buea, Nkemji Global Tech.
96
Nielsen, H. Dean. 2006. From Schooling Access to Learning Outcomes: An Unfinished Agenda.
Washington, DC: World Bank.
Ochae, Katherine. 2004. Preventing Corruption in the Education System: A Practical Guide. Eschborn,
Germany: GTZ.
Olken, B.A. 2004. Monitoring Corruption: Evidence from a Field Experiment in Indonesia. NBER
Working Paper No. 11753. Cambridge, MA, USA: NBER.
Omatseye, Jim Nesin E. 2008. Schooling in Cameroon. In Going to School in Sub-Saharan Africa.
Westport, CT, USA: Greenwood Press, 15–35.
Osei, G.M. 2007. Decentralization and the Exploration of the Impact of Local Content Curriculum
Reforms in Ghana. International Journal of Educational Development 27(2): 151–65.
PASEC. 2007. Le defi de la Scolarisation universelle de qualite [The challenge of quality universal
education]. Dakar, Senegal: CONFEMEN.
Patrinos, H.A., and R. Kagia. 2007. Maximizing the Performance of Education Systems. In The Many
Faces of Corruption: Tracking Vulnerabilities at the Sector Level, ed. J.E. Campos and S.
Pradhan, 63–87. Washington, DC: World Bank.
Paul, Samuel, Suresh Balakrishnan, K. Gopakumar, Sita Sekhar, and M. Vivekananda. 2004. State of
India’s Public Services: Benchmarks for the States. Economic and Political Weekly 39(9): 930–
33.
Patton, Michael Quinn. 1990. Qualitative Evaluation and Research Methods. 2nd edition.
Thousand Oaks, CA, USA: Sage Publications, Inc.
PET (Public Expenditure Tracking) Survey. 2005. Public Expenditure Tracking Survey and
Beneficiaries Assessment in the Education and Health Sectors. Yaoundé: Government of
Cameroon.
Reinikka, Ritva, and Jakob Svensson. 2004. Local Capture: Evidence from a Central Government
Transfer Program in Uganda. 119(2): 679–705.
Scot, Christopher. 2007. Figuring Out Accountability: Selected Uses of Official Statistics by Civil
Society to Improve Public Sector Performance. Q-Squared Working Paper 37. Toronto, Canada:
Q-Squared.
Transparency International. 2005. Stealing the Future Corruption in the Classroom. Berlin, Germany:
Transparency International.
———. 2009. Global Corruption Barometer.
http://www.transparency.org/policy_research/surveys_indices/gcb/2009 .
———. 2009. ―Corruption Perceptions Index, Country Rankings: Cameroon.
http://www.transparency.org/policy_research/surveys_indices/cpi/2009/cpi_2009_table.
97
Vegas, E., ed. 2005. Incentives to Improve Teaching. Washington, DC: World Bank.
Ware, Glenn, T. Shaun Moss, J. Edgardo Campos, and Gregory P. Noone. 2007. Corruption in Public
Procurement: A Perennial Challenge. In The Many Faces of Corruption. Tracking
Vulnerabilities at the Sector Level, ed. J. Edgardo Campos and Sanjay Pradhan. Washington,
DC: World Bank.
Welmond, Michel. 2002. Globalization viewed from the Periphery: The Dynamics of Teacher Identity in
the Republic of Benin. Comparative Education Review 46(1): 37–65.
World Bank. 1994. Governance: The World Bank’s Experience. Washington, DC: World Bank.
———. 2005. Project Appraisal Document: Education Capacity Building Project. Washington DC:
World Bank.
WDR. 2004. World Development Report 2004: Making Services Work for Poor People. Washington,
DC: World Bank.
———. 2009. World Development Report 2009: Reshaping Economic Geography. Washington, DC:
World Bank.
Zenü Network.2007. Etude sur la gouvernance en milieu scolaire au Cameroon : Quelles implication des
acteurs locaux [Study on the governance of schools in Cameroon: What are the implications for
local actors ?] . Bafoussam, Cameroon: Zenü Network.