Relapse Prevention Program1 Thinking About Relapse Prevention.
Upload
truongdienCategory
view
217download
3
Governance and Conflict Relapse∗
Havard Hegre1,3 and Havard Mokleiv Nygard2,3
1Department of Peace and Conflict Research, Uppsala University2Department of Political Science, University of Oslo
3Peace Research Institute Oslo (PRIO)
September 23, 2013
Abstract
Many conflict studies regard formal democratic institutions as states’ most important vehicle toreduce deprivation-motivated armed conflict against their governments. We argue that the widerconcept of good governance – the extent to which policy-making and implementation benefit thepopulation at large – is better suited to analyze deprivation-based conflict. The paper shows thatthe risk of conflict in countries characterized by good governance drops rapidly after a conflict hasended or after independence. In countries with poor governance, this process takes much longer.Hence, improving governance is important to reduce the incidence of conflict. We also decomposethe effect of good governance into what can be explained by formal democratic institutions andless formal aspects of governance, and into what comes from economic development and what isdue to how well countries are governed. We find informal aspects of good governance to be atleast as important as formal institutions in preventing conflict, and that good governance has aclear effect over and beyond economic development.
∗The article is partly based on a background paper written for the UN ESCWA report The Governance Deficitand Conflict Relapse in the ESCWA Region. Thanks to Bidisha Biswas, Youssef Chaitani, Erik Gartzke, Vito Intini,Idunn Kristiansen, and Maria Ortiz Perez for comments, as well as to participants at the Annual Norwegian PoliticalScience Conference, Trondheim 2012, the International Studies Association Annual Meeting, San Diego 2012 and theEuropean Political Science Association Annual Meeting, Berlin 2012. The research was funded by the Research Councilof Norway, projects 217995/V10 and 204454/V10. An online appendix and replication data are available at JCR’s webpages as well as at www.havardhegre.net.
1

1 Introduction
Are well-governed countries better able to avoid armed conflict? Studies such as Hegre et al. (2001),
Fearon and Laitin (2003), and Cederman, Hug and Krebs (2010) answer this question focusing on the
extent to which the governing institutions are formally democratic since democratically elected leaders
should be best placed to address grievances. The rules regulating how political leaders are recruited
and how citizens participate in this selection, however, are not the only relevant determinants of
‘good governance’. Potentially, the quality of the bureaucratic apparatus,1 the extent of political
corruption, and the appropriateness of the economic policies chosen by political leaders also affect
governments’ ability to prevent domestic violent conflicts. In this paper, we analyze all country-years
from 1960 through 2008 and study how such an expanded conception of governance might increase
our understanding of armed conflict.
The article first looks at the literature treating theoretical links between governance and conflict,
focusing on relative deprivation (Section 2). Section 3 discusses briefly the measures we use to capture
the concept of good governance. In addition to identifying seven disaggregated indicators, we combine
these into a joint governance index and analyze how traditional democracy indicators relate to more
informal concepts of governance such as corruption and bureaucratic quality. Next, we analyze the
effect of governance on conflict (Section 4).
Our statistical models show that the risk of conflict in countries with good governance drops
rapidly after the conflict has ended and after independence. In countries characterized by poor
governance, this process takes much longer. Hence, improving governance plays an important role in
reducing the incidence of conflict.
We find most of our disaggregated governance indicators to be related to a decreased risk of
conflict recurrence. This is partly due to positive correlation between the various indicators, but also
suggests that reform in the different sectors can be partial substitutes to each other. In some cases,
it is a challenge to find an entry point to break this vicious circle of poor governance and conflict. If
reform in any sector helps, changes should be sought where they are most feasible.
We also analyze to what extent good governance can be separated from formal democratic insti-
tutions, on the one hand, and economic development on the other. We show that a model that takes
both dimensions of governance into account fit the data better than a model that only looks at one of
these two dimensions. Both aspects of governance are important for preventing conflict recurrence,
whereas informal governance seems more important for preventing conflict onset. Likewise, we find a
model that separates the two dimensions of governance from average income to improve the fit to the
data. In particular, countries that are relatively democratic for their income levels but score poorly
on informal governance (e.g., Gabon or Lebanon) are at risk of conflict.
1As Raby and Teorell (2010) argues for the case of interstate conflict.
2

2 Theoretical background
Arguments relating to the relationship between aspects of governance and the risk of internal armed
conflict typically build at least implicitly on accounts of how the psychological state of ‘relative
deprivation’ is transformed into intergroup conflict (Davies 1962, Gurr 1968). In the words of Gurr
(1968, 1104), ‘Relative deprivation is defined as actors’ perceptions of discrepancy between their value
expectations (the goods and conditions of life to which they believe they are justifiably entitled) and
their value capabilities (the amounts of those goods and conditions that they think they are able to
get and keep).’ Davies (1962) sees relative deprivation as a dynamic phenomenon – people typically
accept a gap between actual and expected ‘need satisfaction’, but the risk of rebellion increases if this
gap starts to increase toward an intolerable level. We follow Gurr and Davies in thinking of ‘actors’
very broadly as government elites and the non-elite majority population in a country.
We focus here solely on internal armed conflicts that pit governments against domestic opposition
groups. Relative deprivation can explain internal conflicts if populations perceive governments as the
source of the expectations-ability discrepancy and are willing to support armed actions to address
the issue. In other words, such explanations necessarily imply there is a lack of good governance,
defined as the extent to which the process of policy-making and implementation of policies are to the
benefit of the public at large. Gurr (1968)’s formulation of the relative-deprivation explanation indeed
includes aspects of governance such as institutionalization or legitimacy of the regime. Quantitative
studies of deprivation- or grievance-based explanations, however, typically tend to focus on simple
‘grievance factors’ such as poverty, inequality, or absence of democracy. Focusing more precisely on
a ‘lack of good governance’ better reflects the relative-deprivation argument. This is the case for two
reasons.
First, it requires that the government is seen as responsible for the ‘expectations-ability discrep-
ancy’. Economic inequality is one case in point. Collier and Hoeffler (2004, 570) sees inequality as
an ‘objective measure of grievance’, and Fearon and Laitin (2003, 79) state that ‘greater economic
inequality creates broad grievances that favor civil conflict’. Neither of these find ‘grievance’ such
defined to have any association with a heightened risk of armed conflict. However, it is not neces-
sarily so that governments are perceived as responsible for an income gap. Often, inequalities have
much deeper historical roots than the current government. The income differences between Slovenia
and other parts of former Yugoslavia may be traced back to the location of the border between
the Habsburg and Ottoman empires in the 18th century, for instance, and differences between the
various castes of India have even longer historical pedigrees.2 That inequality is unrelated to the risk
of conflict, then, may not be taken as a refutal of relative-deprivation-based explanations, since it is
not an outcome of current government actions.3 Similarly, poverty at the country level is not a good
2Even increasing inequalities may be perceived as acceptable. For instance, the rising economic inland-coastalinequalities in China over the last 20 years (Kanbur and Zhang 2005, 96) is probably perceived to be due to theexports-driven growth at the coast rather than deliberate policies to hold the inland back. Migration, rather thanrebellion, is the natural response to such developments.
3Some studies do find a relationship between inter-group inequality and a high risk of armed conflict (Østby 2008,Cederman, Weidmann and Gleditsch 2011). In such cases, it is more natural that a government is seen as exacerbatingsuch differences through their policies of exclusion and discrimination.
3

proxy for relative deprivation (Collier and Hoeffler 2004). The fact that most citizens in African
countries are much poorer than citizens in Europe is not automatically translated into a sentiment of
relative deprivation strong enough to motivate rebellion against their own governments. The natural
target of such sentiments might rather be the former colonial power or other external actors.
Second, our relative-deprivation formulation relates the source of conflict to whether decision-
making and implementation of decisions are to the benefit of the public in practice, not necessarily
to the de jure institutions that lay out the rules for decision-making. Earlier studies (e.g., Hegre
et al. 2001, Fearon and Laitin 2003, Collier and Hoeffler 2004) implicitly reduce the concept of
good governance to an issue of whether the government is formally democratic or not – whether the
opposition has a ‘voice’ through which they can address grievances (Walter 2004). If selection into
central political positions occur through general elections, governments are presumed to govern in
ways that reduce this expectations-ability discrepancy. This, however, is insufficient. First, non-
elected governments may also choose to promote policies in the interest of the general population.
Moreover, elected governments may fail to govern well despite the best intentions, for instance when
an under-developed public sector is unable to implement policies decided within the representative
institutions. Representative institutions cannot automatically be equated with ‘good governance’.
A more general empirical implication of the relative deprivation-conflict hypothesis, then, is that
good governance broadly defined reduces incentives for conflict due to relative deprivation. Our core
research objective is to investigate whether such a link exists empirically, and to see how it relates
to the formal setup of institutions. In the remainder of this section, we spell out in somewhat more
detail how good governance as defined above should reduce the risk of armed conflict, concentrating
on aspects of governance that are empirically observable. We then discuss the independent effect of
formal democratic institutions.
2.1 How good ‘informal institutions’ reduce conflict
Our conception of good governance involves two distinct aspects: First, that governments intend to
implement policies in the public interest, and that they succeed in implementing them effectively.
We outline six broad categories of ‘informal institutions’ that affect the quality of governance, and
contrast them with ‘formal’ institutions of governance.
Several non-quantitative studies highlight the importance of certain such ‘prerequisites’ for demo-
cratic institutions to be effective. Zakaria (1997), for instance, includes effective ‘rule of law’ as an
important element of liberal democracy. Still, there are few quantitative studies of the impact on
conflict of less formalized aspects of governance, such as corruption, economic policies, or bureau-
cratic quality. In some cases, informal governance may be as important as formal institutions, e.g.
if political corruption is so rampant that elected officials are more accountable to their paymasters
than to those who elected them into office.
Our conception of governance captures the entire ‘chain’ or context of implementation that trans-
lates the aggregation of preferences into final implementations of policies. Such a wide definition of
governance implies that it is a multi-faceted concept, and various sources identify different dimen-
4

sions of it. In this paper, we look into seven aspects: (1) bureaucratic quality, (2) the rule of law,
(3) corruption, (4) economic policies, (5) military involvement in politics, (6) political exclusion
and repression, and (7) formal political institutions. Indicators of quality of governance along these
dimensions are drawn from several different datasets.
Bureaucratic quality
Efficient bureaucracies are necessary to implement public policies and to carry out day-to-day admin-
istration. High-quality bureaucracies may also function as an informal constraint on the executive
branch of the government, thereby reducing the incentives for extreme policies. With ‘bureaucratic
quality’, we mean the capacity of the political systems to implement decisions through its admin-
istrative apparatus.4 There are hardly any studies of the relationship between bureaucratic quality
and conflict, but several on the related concept of ‘state capacity’. There is, however, no consensus
definition of state capacity, and there is a tendency to conflate measures of regime type and capacity.5
Fearon and Laitin (2003) argue that state capacity, which they proxy by per capita income,
decreases the risk of onset of civil war. Other studies find that oil producers have higher risk of civil
war than expected from their income levels (Hegre and Sambanis 2006, 528). Fearon (2005) argues
this is because oil-producing states tend to be under-bureaucratized for their GDP levels, since they
have never needed to extract taxes and other resources from the citizenry at large.
Using similar data to what we employ below, Fjelde and de Soysa (2009) disaggregate state
capacity into the abilities to coerce, to coopt, and to cooperate. They argue that cooptation and
cooperation may be more important aspects of state capacity in preventing conflict than purely
coercive ability. To arrive at a better proxy for a state’s capacity, they use the ‘Relative Political
Capacity’ (RPC) index from Organski and Kugler (1980) which compares actual to predicted levels
of state tax extraction. Braithwaite (2010) finds some evidence for the hypothesis that countries with
good state capacity are better able to avoid spill-over from neighboring countries.
Rule of law
Countries differ considerably in the extent to which judicial systems succeed in applying laws equally
to all citizens. ‘Rule of law’ is also the aspect of good governance that ensures that contracts
and property rights are enforced and judiciaries are isolated from inference from decision-makers.
Countries characterized by such rule of law have less social conflict (Taydas, Peksen and James 2010).
This aspect of governance is related to formal democratic institutions as they allow citizens to elect
representatives to legislatures and to thereby influence law-making. However, many democracies such
4A bureaucracy which is able to implement decisions with great efficiency may prove extremely lethal when govern-ments deliberately use them in violent campaigns, such as in Stalin’s USSR or Hitler’s Germany. Our definition maypartly regard such bureaucracies as aspects of ‘good governance’. However, merit-based recruitment, hardly the maincharacteristic of these organizations, is also important for our definition. As it is, there are few similar cases in our1960–2008 period of study.
5In a recent review and assessment of state capacity measures, Hendrix (2010) lists 12 different operationalizationsof the concept. Some of these operationalizations are directly linked to state capacity, while others tend to conflatecharacteristics of regime type with the regime’s capabilities. All these measures are correlated and closely related toour other indicators of governance.
5

as Paraguay or Lebanon have weak rule of law, severly undermining this aspect of representation. At
the same time, some non-democracies such as Oman or Vietnam have good judicial systems according
to the ICRG (PRS Group 2010).
Corruption
Large-scale corruption has several detrimental effects on a political system, and several studies find
corruption to be associated with political instability (Le Billon 2003, Mauro 1995, Taydas, Peksen and
James 2010). Corruption’s effect on the allocation of public resources, Le Billon argues, may increase
grievance and elicit demands for political change. Moreover, the rents generated by corruption may
constitute a tempting prize for actors willing to use violence to capture political positions. It means
a diversion of public funds, thereby decreasing public spending that reduce political conflict in the
long run. Finally, corruption undermines the government’s ability to implement public policies that
generate economic growth and other outcomes that reduce the risk of conflict. Fjelde (2009) shows
that increasing corruption from the 5th to the 95th percentile more than triples the risk of conflict
onset. At the same time, she argues that corruption has no conflict-inducing effect in countries with
large oil revenues. In such states, where funds for discretionary use are ample, ‘a strategic use of
public resources for off-budget and selective accommodation of private interests might reduce the
risk of violent challenges to state authority’ (Fjelde 2009, 214).
Economic policies
Some policies with conflict-reducing potential can be assumed to be desirable for most decision-
makers, regardless of how accountable they are to the public. Policies that ensure economic growth,
for instance, have been shown to reduce discontent. Strong economic growth reduces poverty even
without redistribution, and even if inequality increases. This is the case in China, for instance.
Positive growth is strongly related to stability of political institutions and a low risk of armed conflict
(Przeworski et al. 2000, Collier and Hoeffler 2004, Gates et al. 2006).
A few studies show a direct link between economic policies and the risk of conflict. Bussmann
and Schneider (2007) conclude that economic openness in the form of interstate trade and FDI
inflows decrease the risk of internal conflict, although the process of opening up the economy often is
associated with increased levels of violence. Relatedly, Dreher, Gassebner and Siemers (2012) show
that economic freedom and globalization reduce countries’ human rights violations. In many cases,
economic policies that are inappropriate from the point of view of the public are implemented as part
of ‘kleptocratic’ strategies designed to enrich narrow elites. Accordingly, sound economic policies are
likely to reduce the risk of conflict even if growth is weak due to external market conditions.
Military in politics
Heavy military involvement in government may lead to poor governance, particularly as pertains
to the risk of conflict relapse. Military regimes, on average, tend to have poor rates of economic
performance (Wintrobe 1998, Knutsen 2011), and have the lowest life expectancy of any type of
6

regime (Geddes 1999). Militaries, moreover, are not accountable to the public, and are more likely to
distort public spending in favor of military spending than civilian actors, diverting funds from policies
that may reduce the long-term risk of conflict. In many cases, militaries seek military solutions to
conflict, or they invite militarized challenges to their power positions.
Political exclusion and repression
Systematic exclusion from decision-making bodies is likely to turn people against them (Cederman,
Wimmer and Min 2010). Such exclusion is particularly likely to lead to organized mass opposition
when exclusion is in terms of ethnic and religious groups, since such groups typically have networks
that facilitate organization and the exclusion is in terms of pre-existing identity markers. Repressive
policies reinforce such exclusion and accentuate group conflicts.
Political exclusion is obviously intrinsically linked to the indicators of formal institutions discussed
below – democratic institutions should in principle give every individual equal votes. But in practice
democratic institutions may also exclude citizens, either because they limit citizen rights such as is
the case for the territories occupied by Israel, or because permanent minorities in national assemblies
in practice are excluded from government positions. On the other hand, the rules of exclusion in
some non-democratic systems are independent of ethnic or religious cleavages in society.
We also include countries’ respect for human rights as one aspect of good governance. It is difficult
to estimate the direct consequence of repression on the risk of conflict, however, as dissent, repression
and poor economic performance are heavily intertwined (Carey 2007, Davenport 2007, Moore 1998).
Repression increases the risk of political violence, but repression also increases when armed conflict
breaks out. Some regimes, though, are clearly able to sustain repressive policies for decades. This
ability is likely connected with state capacity, as discussed above. Just as high-capacity or resource-
rich regimes have ample funds to co-opt the opposition, they are able to employ repression without
increasing the chances of regime collapse (Fjelde and de Soysa 2009).
2.2 Formal institutions
With ‘formal institutions’, we mean de jure institutions that ensure that the executive branch of
government is elected by a majority or plurality of the population and that guarantee that the
executive is constrained by an elected legislature. The academic consensus of the formal institution-
conflict relationship based on global comparisons is that democracy in itself does not reduce the risk
of civil war onset – if we take countries’ income into account, democracies are no less likely to have
internal conflicts than non-democracies (Muller and Weede 1990, Hegre et al. 2001, Fearon and Laitin
2003, Collier and Hoeffler 2004).6 Moreover, semi-democracies – regimes that are partly democratic,
partly autocratic such as Lebanon in the 1970s or Tanzania today – may even have the highest risk of
civil war onset. Democracies are not in a better position to end conflicts (Fearon 2004), nor is there
any conclusive evidence that democratic institutions do better in post-conflict settings than they do
6The issues treated in this section draws in part on Hegre and Fjelde (2009), which treats the questions related topost-conflict democracy and conflict recurrence in much more detail.
7

in general.7
A few studies note qualifications to the conclusion that formal political institutions have no
conflict-reducing effects. Hegre (2003) and Collier and Rohner (2008) note that democratic insti-
tutions are particularly ineffective in low-income countries. In the poorest countries in the world,
democratic institutions may even increase the risk of insurrections. In middle-income countries, these
studies indicate that democratic political systems are better able to prevent conflicts from erupting
and recurring. Formally democratic political institutions are clearly not sufficient in situations where
governments have only partial control over own territory, and therefore are easily challenged by nar-
row groups. But the inability of low-income democracies to prevent armed conflicts may also be
related to weak or inappropriate informal institutions of governance.
Democratic governments ideally succeed in reducing deprivation-based social discontent since the
executive and the legislature is recruited through free and fair elections and thereby represent the
‘will of the people’. In practice, however, elected decision-makers must abide by their own laws for
this to happen. The military, or actors with the means to grease politicians, should be unable to
influence decisions in their own favor. And, even if decisions are made with the sincere intention to
reduce poverty and provide public goods, decisions have to be implemented to be effective. Successful
implementation requires that the bureaucratic apparatus is competent and non-biased, and that the
government carries out economic policies that are suitable to achieve its political goals.
Countries may be formally democratic even when several of these criteria are not satisfied. De-
ficiencies in the less formal aspects of governance may be the reason why the correlation between
democracy and internal conflict is weak. If democratic institutions fail to produce good informal
governance, they should be ineffective in reducing the risk of conflict. In Section 4.3, we will dis-
tinguish between the ‘formal’ and ‘informal’ institutions of governance and seek to separate their
effects on the risk of internal armed conflict. We will also look into the importance of socio-economic
development in Section 4.4. It is well-known that formal democratic institutions are more frequently
found and more stable in developed countries (e.g., Lipset 1959). The same applies to our informal
institutions of governance (Fjelde and Hegre 2007). In Section 4.4 we look into whether the effect of
governance on conflict can be distinguished from that of development.
When formal institutions place power with the majority of the population (as principals in a chain
of representation), it is natural that this electorate instructs its delegates also to improve the quality
of informal governance. Without it, after all, democratically based decisions will not be implemented.
Formal democratic institutions should lead to good informal institutions, then. In practice, however,
it takes a long time for elected officials to substantially improve informal governance, and sometimes
very little improvement is seen. Powerful actors may benefit from poor informal governance, and
persistent poor governance also tends to erode the formal democratic institutions of a country. Fjelde
and Hegre (2007) show that high levels of corruption increases the probability of change into semi-
democracy or autocracy. In low-income or oil-dependent countries, this effect is stronger than the
tendency for democratic institutions to reduce corruption. In high-income, economically diversified
countries, democracies succeed in curbing corruption.
7For a comprehensive review of the relationship between democracy and conflict, see Hegre (2014).
8

3 Measuring governance
We have constructed seven indices of governance – six indices of informal institutions corresponding
to the categories outlined above, and one index of formal political institutions. Each of the informal
institutions indices is constructed using two or more indicators. We also created a composite index of
governance as an unweighted average of the seven sub-indices. All are normalized to have mean equal
0 and standard deviation 1, such that low values denote poor and high good governance. We perform
multiple imputation (Little and Rubin 2002, Honaker and King 2010), which involves using all the
information available in the dataset to predict missing values as detailed in Section 3. Descriptive
statistics for our imputed dataset are found in the online appendix, Table A-1.
Below we summarize the indicators we have used. They are labeled by the institutions that created
them: ‘ICRG’ represents data from the International Country Risk Guide/Political Risk Group (PRS
Group 2010); ‘WGI’ from World Governance Indicators (Kaufmann, Kray and Mastruzzi 2010, 4);
‘EF’ from the ‘Economic Freedom Network’ in collaboration with the Fraser Institute (Gwartney,
Hall and Lawson 2010, http://www.freetheworld.com);8 FH from Freedom House (Freedom House
2010); TI from Transparency International (http://www.transparency.org); WB from the World
Bank (World Bank 2009).
Bureaucratic quality
ICRG Bureaucratic quality: High values are given to countries were ‘the bureaucracy has the
strength and expertise to govern without drastic changes in policy or interruptions in government
services’ and ‘tends to be somewhat autonomous from political pressure and to have an established
mechanism for recruitment and training.
WGI Government effectiveness: Captures ‘perceptions of the quality of public services, the
quality of the civil service and the degree of its independence from political pressures, the quality of
policy formulation and implementation, and the credibility of the government’s commitment to such
policies.
The rule of law
WGI Rule of law: Captures ‘perceptions of the extent to which agents have confidence in and
abide by the rules of society, and in particular the quality of contract enforcement, property rights,
the police, and the courts, as well as the likelihood of crime and violence’.
EF Area 2: covers ‘commercial and economic law and security of property rights’. It is an ag-
gregate of indicators capturing the extent of military interference in rule of law and the political
process, integrity of the legal system, regulatory restrictions on the sale of real property, and the
legal enforcement of contracts.
8Economic freedom is defined as ‘when (a) property [individuals] acquire without the use of force, fraud, or theftis protected from physical invasions by others and (b) they are free to use, exchange, or give their property as long astheir actions do not violate the identical rights of others.’ (Ben Nasser Al Ismaily et al. 2010, 3)
9

FH Civil liberties: To be classified with top rating, countries must ‘enjoy a wide range of civil
liberties, including freedom of expression, assembly, association, education, and religion. They have
an established and generally fair system of the rule of law (including an independent judiciary), allow
free economic activity, and tend to strive for equality of opportunity for everyone, including women
and minority groups.’
Corruption
ICRG Corruption: The coding takes corruption in the form of demands for bribes into account, but
‘is more concerned with actual or potential corruption in the form of excessive patronage, nepotism,
job reservations, ‘favor-for‘-favors’, secret party funding, and suspiciously close ties between politics
and business.’
WGI Control of corruption: Captures ‘perceptions of the extent to which public power is exercised
for private gain, including both petty and grand forms of corruption, as well as ‘capture’ of the state
by elites and private interests.
TI Corruption Perception Index: An aggregate indicator which ranks countries in terms of the
degree to which corruption is perceived to exist among public officials and politicians. Transparency
International uses a wide range of sources comprising 13 different surveys or assessments from several
different institutions to construct the aggregate indicator.
Economic policies
WB CPIA score: Assesses the extent to which a country’s policy and institutional framework
supports sustainable growth, poverty reduction, and the effective use of development assistance.
Scores from 2005 onwards are publically available (http://data.worldbank.org/indicator).9 Perfor-
mance within four clusters are assessed: Economic Management, Structural Policies, Policies for
Social Inclusion and Equity, and Public Sector Management and Institutions. Among the 16 criteria
are assessments of property rights and rule-based governance, quality of budgetary and financial
management, efficiency of revenue mobilization, quality of public administration, and transparency,
accountability, and corruption in the public sector.
EF Area 1: Captures ‘Size of Government: Expenditures, Taxes, and Enterprises’, based on sub-
indicators for general government consumption spending as a percentage of total consumption, trans-
fers and subsidies as a percentage of GDP, government enterprises and investment, and top marginal
tax rate.
EF Area 3: Covers ‘Access to Sound Money’, as indicated by money growth, the standard deviation
of inflation, inflation in the most recent year, and citizens’ freedom to own foreign currency bank
accounts.
EF Area 4: Covers ‘Freedom to Trade Internationally’. The index is based on indicators on taxes
on international trade, black-market exchange rates, and capital controls.
9We have access to older scores, but are not allowed to disclose them except as aggregated over regions.
10

EF Area 5: Captures ‘Regulation of Credit, Labour, and Business’. It builds on indicators of credit
market regulations, labour market regulations, and business regulations.
EF Overall score: An aggregate of the five area scores.
Military in politics
ICRG Military in politics: Assesses the military participation in government.
Military spending: Each country’s military spending as a share of GDP from the World Bank’s
World Development Indicators (http://data.worldbank.org/indicator).
Political exclusion and repression
Political terror scale: Using country reports from the United States Department of State and
Amnesty International, the Political Terror Scale classifies the repressive activities of states (PTS;
Gibney, Cornett and Wood 2008, Wood and Gibney 2010, http://www.politicalterrorscale.org/ptsdata.php).
Ethnic exclusion: Cederman, Wimmer and Min (2010) have used country experts to systematically
code several aspects of ethnic power relations (http://www.icr.ethz.ch/research/epr). The measure
records the proportion of the population that are excluded based on their ethnic affiliation from
decision-making authority within the central state power.
Formal political institutions
We have based our index of formal political institutions on the ‘Scalar Index of Polities’ (SIP) devel-
oped in Gates et al. (2006). The SIP index is based on the Polity (Marshall n.d.) democracy index,
the most widely used dataset on formal political institutions in conflict research, and Polyarchy
(Vanhanen 2000). See the online appendix for more details on how we use this index.
4 Governance and conflict
In this section, we study how our seven disaggregated indicators of governance and the aggregated
governance indicator relate to the risk of conflict onset and recurrence. In the next section, we
decompose the effect of governance into what can be attributed to formal democratic institutions as
distinct from informal aspects of governance. Finally, we seek to distinguish between governance on
the one hand and economic development on the other.
4.1 Design
We have chosen a design that allows us to analyze how our governance indicators relate to the
incidence of civil war. Our dataset includes all independent countries for which data exist for all
years from 1960 through 2008. The dependent variable is whether an internal armed conflict is going
on in a country year, as coded in the UCDP/PRIO dataset (Gleditsch et al. 2002, Harbom and
Wallensteen 2010). We include all conflicts with at least 25 battle-related deaths per year, restricting
11

attention to countries listed as the location of conflict in the UCDP/PRIO dataset. All models
include a two-category lagged independent variable – the estimates for the other variables should
therefore be interpreted as the extent to which the variables change log odds of conflict incidence
given the conflict state the year before.
To facilitate a special focus on conflict recurrence, the models also include a term called ‘peace
years’ – the log of the number of years without conflict up to t− 1. If the country had a conflict at
t − 1, this variable is set to 0. The estimate for the peace years variable captures how the risk of
conflict changes with time in peace given that there was no conflict in the previous year, which is
roughly the same as the risk of conflict recurrence.10 To separate how governance affects the risk of
conflict onset from how it reduces the risk of recurrence, we have entered an interaction term between
the governance indicators and the peace years variable.
We control for whether a neighboring country has conflict, log GDP per capita, whether one ethnic
group is demographically dominant, log population size, and the presence of UN PKOs.11 In addition,
we have included 23 region dummies to partly account for unobserved regional heterogeneity. The
definition and justification of the regions is found in the online appendix, Section A-5.
4.2 Results, indicators of governance
Table 1 reports the results from an empirical analysis of how our governance variables affect the risk
of conflict recurrence. Models 1–7 estimate the effect of each of our seven governance indicators, and
Model 8 that of our combined governance measure. The results show that in general, the probability
that a country is in conflict is much higher if it was at conflict last year – the Conflict and War
at t − 1 terms are large, positive, and clearly significant. Likewise, the risk of conflict recurrence
gradually diminishes for each new consecutive year of peace. The ln(Peace years) terms are negative
and significant, ranging from –0.59 to –0.66 in size. They indicate the change in log odds of recurrence
when the duration of peace is multiplied by 2.7. The odds of conflict is reduced by 45–50% if peace
holds for the first 2.7 years. The estimated risk is reduced by the same factor if peace holds up to
year 7, and once again if it holds up to year 20.12
The main terms for six of our eight governance indicators are not statistically different from zero
– good governance has a negligible effect on the risk of conflict when time in peace is close to 0. Seven
of the interaction terms, on the other hand, are negative and significant. With good governance, the
10We do not distinguish between periods of peace that started with the termination of a conflict and those that startedwith the independence of a country. For simplicity, we will often refer to conflict after previous conflict or independenceas ‘recurrence’. Merging these two situations is obviously a simplification. However, the immediate post-independenceand post-conflict periods share some characteristics. In both cases, political institutions have been extensively reformedand new actors have come to power. Often, independence was achieved after a militarized contest. About half of theonsets in our dataset came after previous (observed) conflict, about half after independence. 42% of the countries inthe dataset never had conflict.
11The gross domestic product per capita variable is calculated based on data from Maddison (2007), World Bank(2011) and Gleditsch (2002), measured in international Geary-Khamis dollars (Int$), and log-transformed. The ethnicdominance variable is from Collier and Hoeffler (2004) and is coded 1 if one ethnic group in the country comprisesa majority of the population. The population variable originate from the World Population Prospects 2006 (UnitedNations 2007), and the PKO variables are from Hegre, Hultman and Nygard (2011).
12In the online appendix, Figure A-5, we show that the relationship between time in peace and conflict is roughlylinear.
12

Table 1: Internal conflict as function of eight governance indicators, 1960–2008, logit regression.
(1) (2) (3) (4) (5) (6) (7) (8)Bureaucracy Rule of law Corruption Economics Military Exclusion Formal Governance
conflictConflict, t-1 2.979∗∗∗ 2.993∗∗∗ 2.990∗∗∗ 2.976∗∗∗ 2.987∗∗∗ 2.861∗∗∗ 2.967∗∗∗ 2.992∗∗∗
(0.178) (0.178) (0.178) (0.178) (0.179) (0.180) (0.179) (0.178)War, t-1 4.313∗∗∗ 4.292∗∗∗ 4.267∗∗∗ 4.240∗∗∗ 4.221∗∗∗ 3.928∗∗∗ 4.267∗∗∗ 4.287∗∗∗
(0.295) (0.298) (0.293) (0.298) (0.294) (0.300) (0.294) (0.298)ln(Peace years) -0.660∗∗∗ -0.645∗∗∗ -0.664∗∗∗ -0.632∗∗∗ -0.611∗∗∗ -0.590∗∗∗ -0.617∗∗∗ -0.650∗∗∗
(0.0697) (0.0696) (0.0706) (0.0687) (0.0685) (0.0683) (0.0680) (0.0698)Bureaucratic quality index 0.198
(0.121)Bureaucratic quality · peace years -0.217∗∗∗
(0.0577)Rule of law index 0.104
(0.130)Rule of law · peace years -0.169∗∗
(0.0598)Corruption index 0.193
(0.125)Corruption · peace years -0.212∗∗∗
(0.0605)Economic policies index 0.0111
(0.0990)Economic policies · peace years -0.133∗∗
(0.0505)Military influence index -0.0235
(0.100)Military influence · peace years -0.108∗
(0.0502)Pol. exclusion and rep. Index -0.300∗∗
(0.0951)Pol. excl. · peace years 0.0479
(0.0514)Formal inst. index 0.294∗∗
(0.103)Formal inst · peace years -0.0989∗
(0.0504)Governance index, t-1 0.0934
(0.128)Governance index · peace years -0.167∗∗
(0.0584)Log population 0.378∗∗∗ 0.375∗∗∗ 0.371∗∗∗ 0.393∗∗∗ 0.385∗∗∗ 0.358∗∗∗ 0.378∗∗∗ 0.374∗∗∗
(0.0541) (0.0536) (0.0535) (0.0541) (0.0536) (0.0551) (0.0537) (0.0536)log GDP per capita, t-1 -0.129 -0.128 -0.145 -0.101 -0.134 -0.166 -0.254∗ -0.125
(0.120) (0.115) (0.114) (0.112) (0.106) (0.104) (0.107) (0.117)PKO, traditional -0.00279 0.0322 0.00346 0.0415 0.0192 -0.0240 -0.0244 0.0200
(0.227) (0.226) (0.227) (0.226) (0.227) (0.228) (0.230) (0.226)PKO, transformational -0.660 -0.709 -0.683 -0.745 -0.795 -0.942 -0.891 -0.714
(0.475) (0.476) (0.474) (0.477) (0.479) (0.482) (0.476) (0.475)Neighbor conflict, t-1 0.362∗ 0.347∗ 0.362∗ 0.335∗ 0.347∗ 0.289 0.341∗ 0.344∗
(0.155) (0.154) (0.153) (0.153) (0.152) (0.153) (0.153) (0.154)Ethnic dominance 0.336∗ 0.347∗ 0.336∗ 0.369∗ 0.372∗ 0.364∗ 0.380∗ 0.352∗
(0.150) (0.151) (0.151) (0.149) (0.149) (0.150) (0.150) (0.150)Intercept -4.636∗∗∗ -4.659∗∗∗ -4.451∗∗∗ -5.032∗∗∗ -4.815∗∗∗ -4.309∗∗∗ -3.717∗∗∗ -4.665∗∗∗
(1.099) (1.030) (1.014) (1.014) (0.945) (0.914) (0.946) (1.038)aic 2260.9 2266.7 2262.4 2265.9 2267.8 2264.8 2267.7 2266.7ll -1096.4 -1099.4 -1097.2 -1099.0 -1099.9 -1098.4 -1099.8 -1099.3N 6698 6698 6698 6698 6698 6698 6698 6698
Standard errors in parenthesesEstimation also includes 23 regional dummies, results not shown∗ p < 0.05, ∗∗ p < 0.01, ∗∗∗ p < 0.001
risk of conflict recurrence is reduced more quickly. The seven interaction term estimates range from
–0.099 to –.219. Compared to a country with poorer governance, a country with a one standard
deviation higher governance score sees an additional risk reduction of 10–20% over the first 2.7 years.
To illustrate these effects, Figure 1 shows the predicted probability of conflict as a function of
time since last conflict or independence for four of the models – for bureaucratic quality, exclusion
and repression, formal institutions, and the combined governance index.13 The plot shows the risk for
two hypothetical countries that are similar except that one has poor governance (governance index
= –1.28 or about the 10th percentile) and the other good governance (1.28/90th percentile). The
values for other predictors are set at the global averages in 2005.
13The predictions were obtained by means of the Clarify package (King, Tomz and Wittenberg 2000).
13

Figure 1: Predicted probability of conflict recurrence, governance indicators
.01
.02.
03.0
5.1
.2.5
Prob
abilit
y of
recu
rrenc
e
0 5 10 15 20 25Years after Conflict
Low Gov Low Gov, 10/90 pctile High Gov High Gov, 10/90 pctile
Bureaucratic quality
.01
.02
.03
.05
.1.2
.5Pr
obab
ility
of re
curre
nce
0 5 10 15 20 25Years after Conflict
Low Gov Low Gov, 10/90 pctile High Gov High Gov, 10/90 pctile
Exclusion and repression.0
1.0
2.0
3.0
5.1
.2.5
Prob
abilit
y of
recu
rrenc
e
0 5 10 15 20 25Years after Conflict
Low Gov Low Gov, 10/90 pctile High Gov High Gov, 10/90 pctile
Formal institutions
.01
.02.
03.0
5.1
.2.5
Prob
abilit
y of
recu
rrenc
e
0 5 10 15 20 25Years after Conflict
Low Gov Low Gov, 10/90 pctile High Gov High Gov, 10/90 pctile
Governance index
Systems with high bureaucratic quality may have slightly higher risk of conflict immediately after
a conflict or independence. As time goes by, however, the risk decreases much more rapidly when
bureaucratic quality is good than when it is poor. The conflict risk is twice as high in low-governance
systems after 6–8 years, and three times higher after 20. The plots for rule of law, corruption, and
economic policies are very similar to this plot (see the online Appendix, Figure A-4), as does that
for our combined governance indicator. The plot for the formal institutions index shows another
pattern. For this indicator, well-governed countries seem to have a higher initial risk of conflict. This
difference is steadily reduced over time, and changes sign after about 18 years. After another couple
of decades, well-governed (democratic) countries have a lower risk of conflict than non-democratic
ones. Only the good governance seen as absence of exclusion or repression seems to reduce the risk
of conflict onset.
The fact that most governance indicators pull in the same direction is useful for two reasons.
First, it allows us to treat ‘governance’ as a unified concept that is efficiently captured by our
combined governance indicator. We will limit our discussion to this indicator in the remainder of the
paper. Second, and more importantly, these results mean that all six aspects of informal governance
covered here are important to reduce the risk of conflict recurrence, implying that different forms of
governance are partial substitutes to each other. The absence of an aspect of good governance may
14

be offset by the presence of another.
4.3 Formal vs. informal institutions
It is clear from Table 1 that good governance reduces the risk of conflict recurrence. But to what
extent is the effect of our governance indices distinct from that of formal (democratic) institutions,
or from the economic resources available to governments?
To explore the first question, we created an index of ‘informal political institutions’ which is
simply the residuals from the regression line formed by the formal institutions index as x variable
and the governance index as y variable.14 The formal institutions index explains 65% of the variance
in the governance index, and a one-unit increase in formal institutions means on average an increase
of 0.8 in overall governance.
The residuals from this model were rescaled to have a standard deviation of 1, forming our ‘infor-
mal institutions index’. Figure 2 shows the relationship between the formal (x axis) and the informal
(residual) institutions (y axis) for the year 1990. Some countries, such as Oman, UAE, Singapore,
Switzerland, and Canada do much better in terms of governance than indicated by their formal in-
stitutions – the ‘informal institutions’ residual index is high. Others, such as Sudan, Ethiopia, Haiti,
and Peru do much worse.
The conflict experiences of the countries are also depicted in Figure 2. Countries with no conflicts
over the 1991–2005 period are marked with filled circles. Countries that had no conflict 1946–1990
but a new conflict during the 1991–2005 period are marked with diamonds. Countries with pre-
1990 conflicts recurring after 1990 are marked with a square. As expected from Table 1, it is clear
from Figure 2 that countries with poor governance have had more frequent conflicts and conflict
recurrences. No-conflict countries are concentrated in the right half of the figure, and particularly in
the upper right corner. Countries such as Botswana, Costa Rica, and Sweden have good formal and
informal governance and no conflict. The exceptions to the pattern of conflict and good governance
are the conflicts with the ETA, IRA, and Al-Qaida in Spain, UK, and the US, respectively.15
The new conflicts (diamond markers) are primarily found in the left half of Figure 2; in countries
with very incomplete democratic institutions in 1990, but often with fairly good informal governance.
Examples are Burundi, Cote d’Ivoire, and Mexico.
Conflict recurrences after 1990 (squared markers) are concentrated in the lower half of the figure,
i.e. in countries with poor informal governance relative to their formal governance. Examples are
Sudan, Ethiopia, and Haiti among the non-democracies, and Turkey and the Philippines among the
more formally democratic systems. Most exceptions to this pattern of poor governance and conflict
are countries with fairly robust formal institutions, such as Bolivia or Bulgaria – these, after all, are
well-governed overall since their formal institutions are democratic. One other exception is Syria,
which turned out to be less exceptional after the end year of our dataset (2008).
Table 2 shows the results of estimating a model including both the formal institutions index, the
14The relationship between the governance and formal institutions indices is shown for the year 1990 in the onlineappendix, Figure A-3.
15The UCDP project codes the attack of 9-11 2001 as an internal armed conflict in the US.
15

Figure 2: Informal institutions by formal institutions, 1990
Canada
Cuba
Dominican Republic
JamaicaTrinidad and Tobago
Honduras
Nicaragua
Costa Rica
Panama
Guyana
Ecuador
Brazil
Bolivia
Paraguay
Chile
ArgentinaUruguay
Ireland
Netherlands
Belgium
Luxembourg
France
Switzerland
Portugal
Germany
Poland
Austria
HungaryCzech Republic
Italy
Albania
Greece
Cyprus
Bulgaria
Romania
Finland
SwedenNorwayDenmark
Iceland
Equatorial GuineaGambia, The
Mauritania
Burkina Faso
Ghana
Cameroon
Kenya
Tanzania
Zambia
Zimbabwe
Malawi
South AfricaNamibia
Botswana
Swaziland
Madagascar
Mauritius
Morocco
TunisiaLibya
Syrian Arab Republic
Jordan
Saudi Arabia
Bahrain
Qatar
United Arab Emirates
Oman
ChinaMongolia
Taiwan, China
Korea, Dem. Rep.Korea, Rep.
Japan
Bhutan
Lao PDR
Vietnam
Malaysia
Singapore AustraliaNew Zealand
Solomon Islands
Fiji
United States
Mexico
SerbiaGuinea-Bissau
Niger
Cote d'Ivoire
Guinea
Sierra Leone
Nigeria
Central African Republic
Congo, Rep.
Burundi
Djibouti
Lesotho
Algeria
Egypt, Arab Rep.
Nepal
HaitiGuatemala
El Salvador
Colombia
Venezuela, RB
Peru
United Kingdom
SpainRussian Federation
Mali Senegal
TogoChad
Congo, Dem. Rep.
Uganda
Rwanda
Somalia
Ethiopia
Angola
Mozambique
Comoros
Sudan
Iran, Islamic Rep.
Turkey
Iraq
Israel
AfghanistanIndia
Pakistan
Bangladesh
MyanmarSri Lanka
Thailand
Philippines
Indonesia
Papua New Guinea
-3-2
-10
12
Info
rmal
inst
itutio
ns in
dex
-1.5 -1 0 1 2Formal institutions
No Conflict New Conflict Conflict Recurrence
informal institutions index, as well as their interaction terms with the ‘peace years’ variable. Model
9 (column 1) includes only the formal institutions index variables. The results are similar to Model
7, Table 1. In Model 10, the formal institutions variables are replaced by the informal (residual)
index and interaction term. The interaction term with peace years is negative and about the same
size as for the formal institutions index. The main term, on the other hand, is negative and close to
statistical significance. Good informal institutions relative to formal institutions reduces the risk of
conflict also in the early years after independence or earlier conflicts. The AIC of model 10 is clearly
lower than for model 9.
In Model 11, we include all four terms to assess the relative importance of formal and informal
terms. Only the interaction terms are significant, but the log likelihood of the model is considerably
higher than for the two preceding models, and the AIC is lower. As in the other two models, the
formal institutions main term is positive and the informal institutions main term negative. Neither
are clearly different from zero, but the difference between them is significant.
Figure 3 indicates how the results of Model 11 should be interpreted. The left panel shows the
median predicted probability of conflict just after conflict or independence, assuming typical values
for control variables.16 The predicted risk immediately after conflict or independence is highest in
16We used Clarify (King, Tomz and Wittenberg 2000) to obtain these predictions averaged across 1,000 simulations.We set control variable to typical values – log GDP per capita to 8.02 or Int$ 3040, log population to 8.87 or 7.1 million,population growth to 1.9%, ethnic dominance to 0.50, and other variables to zero in our Clarify simulations.
16

Table 2: Internal conflict as function of formal and informal institutions of governance, GDP percapita, ‘surplus governance’, 1960–2008, logit regression and instrumental analysis.
(9) (10) (11) (12) (13) (14) (15) (16)Formal Informal Formal GDPcap GDPcap GDPcap Governance Conflict
only only informal only surplus surplus IndexGDP/cap GDP/cap GDP/cap gov formal
mainConflict, t-1 2.966∗∗∗ 2.959∗∗∗ 2.973∗∗∗ 2.951∗∗∗ 2.971∗∗∗ 2.956∗∗∗ 1.635∗∗∗ 0.0520
(0.179) (0.178) (0.179) (0.185) (0.186) (0.186) (0.145) (0.0400)War, t-1 4.266∗∗∗ 4.153∗∗∗ 4.231∗∗∗ 4.231∗∗∗ 4.282∗∗∗ 4.227∗∗∗ 2.419∗∗∗ -0.251∗∗∗
(0.294) (0.295) (0.300) (0.299) (0.304) (0.305) (0.219) (0.0491)ln(Peace years) -0.617∗∗∗ -0.597∗∗∗ -0.617∗∗∗ 0.303 0.498 0.635 -0.351∗∗∗ 0.0787∗∗∗
(0.0680) (0.0694) (0.0710) (0.368) (0.391) (0.543) (0.0519) (0.0108)ln(GDP per capita), t-1 -0.252∗ -0.0560 -0.0679 -0.0548 -0.0321 -0.242 -0.289 0.455∗∗∗
(0.107) (0.107) (0.118) (0.121) (0.123) (0.153) (0.197) (0.0158)GDP per capita · peace years -0.118∗ -0.145∗∗ -0.157∗
(0.0467) (0.0501) (0.0695)Surplus governance index 0.0743 -0.184
(0.0989) (0.140)SGI · peace years -0.103∗ -0.130
(0.0513) (0.0733)Formal inst. index 0.292∗∗ 0.159 0.410∗
(0.103) (0.112) (0.161)Formal inst · peace years -0.0986 -0.120∗ 0.0368
(0.0504) (0.0527) (0.0843)Log population 0.378∗∗∗ 0.379∗∗∗ 0.366∗∗∗ 0.373∗∗∗ 0.363∗∗∗ 0.354∗∗∗ 0.158∗∗∗ -0.00459
(0.0537) (0.0537) (0.0540) (0.0547) (0.0549) (0.0553) (0.0413) (0.00646)Neighbor conflict, t-1 0.341∗ 0.294 0.305∗ 0.332∗ 0.331∗ 0.294 0.184 -0.0108
(0.153) (0.153) (0.155) (0.156) (0.157) (0.158) (0.120) (0.0203)Ethnic dominance 0.384∗ 0.368∗ 0.348∗ 0.358∗ 0.350∗ 0.342∗ 0.200 -0.0146
(0.150) (0.150) (0.151) (0.152) (0.153) (0.154) (0.111) (0.0188)PKO, traditional -0.0355 -0.0323 -0.0872 0.00588 -0.0208 -0.124 -0.0217 -0.0190
(0.229) (0.226) (0.229) (0.230) (0.230) (0.233) (0.169) (0.0391)PKO, transformational -0.841 -0.888 -0.847 -0.661 -0.632 -0.813 -0.559 0.169
(0.478) (0.482) (0.479) (0.479) (0.477) (0.481) (0.448) (0.113)Informal inst. index -0.203 -0.169
(0.105) (0.114)Informal inst · peace years -0.0951 -0.118∗
(0.0530) (0.0558)Governance index, t-1 0.267
(0.272)Governance index · peace years -0.0684
(0.0490)Governance t-20 0.272∗∗∗
(0.0226)Governance t-20 · peace years 0.00699
(0.00690)Democratic wave 0.288∗∗∗
(0.0771)Intercept -3.745∗∗∗ -5.507∗∗∗ -5.247∗∗∗ -5.193∗∗∗ -5.258∗∗∗ -3.692∗∗ -0.273 -3.869∗∗∗
(0.946) (0.961) (1.053) (1.025) (1.031) (1.241) (1.628) (0.141)aic 2268.0 2257.9 2256.5 2205.7 2205.2 2194.2 . 4167.3ll -1100.0 -1095.0 -1092.3 -1069.8 -1067.6 -1060.1 -2050.7N 6698 6698 6698 6539 6539 6539 3154 3154
Standard errors in parenthesesEstimation also includes 23 regional dummies, results not shown∗ p < 0.05, ∗∗ p < 0.01, ∗∗∗ p < 0.001
the lower right corner – in countries with good formal institutions but poor informal institutions
(e.g., the Philippines or Peru), and decreasing as the quality of the informal institutions improve.
The right panel shows the predicted probability 10 years after conflict. At this point, the risk is
highest in countries that score low on both indices (as in Myanmar and Sudan), and decrease with
improvement along both governance dimensions.
These predictions come with considerable uncertainty. Below the plots, we report the predicted
probability of conflict with confidence intervals for some combinations of values. Just after the
conflict, the median probability of conflict (recurrence) for a country with scores of –1.2 (about the
20th percentile) for both indices is 0.084. The 80% confidence interval for this prediction is (0.061,
0.113). The estimated uncertainty is considerable. It is fairly clear, however, that countries with non-
democratic institutions but excellent informal governance have lower immediate risk of recurrence
than states with democratic institutions but poor informal governance. The reduction in risk is
17

Figure 3: Predicted probability of conflict by extent of formal and informal governance, just afterconflict (left panel) and 10 years after conflict (right panel), based on Model 11. Uncertainty estimatesfor selected points reported below.
-2-1
01
2In
form
al in
stitu
tions
inde
x
-2 -1 0 1 2Formal institutions index
0
.02
.04
.06
.08
.1
.12
.14
Med
ian
pred
icte
d pr
obab
ility
-2-1
01
2In
form
al in
stitu
tions
inde
x
-2 -1 0 1 2Formal institutions index
0
.02
.04
.06
.08
.1
.12
.14
Med
ian
pred
icte
d pr
obab
ility
Formal Informal Just after conflict 10 years after conflictscore score p 80% C.I. p 80% C.I.
Poor (–1.2) Poor (–1.2) 0.084 (0.061, 0.113) 0.044 (0.034, 0.058)Poor (–1.2) Good (1.2) 0.071 (0.051, 0.095) 0.016 (0.012, 0.021)Good (1.2) Poor (–1.2) 0.114 (0.089, 0.147) 0.028 (0.023, 0.036)Good (1.2) Good (1.2) 0.096 (0.070, 0.132) 0.010 (0.007, 0.014)
strongest for countries with good governance along both dimensions. A country that scores well on
both dimensions has a predicted risk four times lower than a similar country that scores poorly on
both.
To summarize, both the formal and informal institutions of governance must be good in order
to effectively reduce the risk of conflict. However, the informal institutions seem to be even more
important substantially than the formal or democratic institutions.
4.4 Institutions vs. average income
An inspection of Figure 2 shows that countries that score high on both the governance and the formal
institutions index are relatively rich countries (e.g., Sweden, Switzerland, Ireland). Most countries
with low scores for the two indicators are poor (Sudan, Angola, and Bangladesh). We demonstrated
in Table 1 that good governance reduces the risk of conflict controlling for poverty (as measured
by GDP per capita). GDP per capita is among the most robust variables in the armed conflict
literature (Hegre and Sambanis 2006). The estimate for the variable is negative in all our models,
but significantly different from 0 in only one. This may imply that good governance is an important
intermediate variable between income and domestic peace. To look more closely into how wealth and
governance interrelate, we have defined a ‘surplus governance’ index as the residual from regressing
our combined governance index on log GDP per capita.
Figure 4 plots these ‘surplus governance’ residuals against GDP per capita for the year 1990.
Some countries are considerably better governed than expected from their average income levels.
That India, Botswana, and New Zealand are relatively well-governed is well known. In addition,
18

Malawi, Mongolia, and Costa Rica have surprisingly high values for our governance index. Sudan,
Peru, Serbia (Yugoslavia), and Syria, on the other hand, turn out as relatively poorly governed in
1990. A set of heavily oil-dependent countries (e.g., Qatar, Saudi Arabia, UAE) also stand out as
poorly governed relative to their average incomes, as argued by Fearon (2005).
Figure 4: ‘Surplus governance’ by average income, 1990. ‘Surplus governance’ is defined as theresidual of regressing governance on log GDP per capita, normalized to range from 0 to 1.
Canada
Cuba
Dominican Republic
Jamaica
Trinidad and TobagoHonduras
Nicaragua
Costa Rica
Panama
Guyana EcuadorBrazil
Bolivia
Paraguay
Chile
Argentina
Uruguay
Ireland NetherlandsBelgium
Luxembourg
France
Switzerland
Portugal
Germany
Poland
Austria
Hungary
Czech Republic
Italy
Albania
Greece
Cyprus
Bulgaria
Romania
FinlandSweden
NorwayDenmark
Iceland
Equatorial Guinea
Gambia, The
Mauritania
Burkina Faso
Ghana
Cameroon
Kenya
Tanzania
Zambia
Zimbabwe
Malawi
South Africa
Botswana
Swaziland
Madagascar Mauritius
MoroccoTunisia
Libya
Syrian Arab Republic
Jordan
Saudi Arabia
Bahrain
Qatar
United Arab Emirates
Oman
China
Mongolia
Taiwan, China
Korea, Dem. Rep.
Korea, Rep.
Japan
Bhutan
Lao PDR
Vietnam
MalaysiaSingapore
Australia
New Zealand
Solomon Islands
Fiji
United States
Mexico
Serbia
Guinea-Bissau
NigerCote d'Ivoire
Guinea
Sierra Leone
Nigeria
Central African Republic
Congo, Rep.
Burundi
Djibouti
Lesotho
Algeria
Egypt, Arab Rep.
Nepal
Haiti
Guatemala
El SalvadorColombia
Venezuela, RB
Peru
United Kingdom
Spain
Russian Federation
Mali
Senegal
Togo
Chad
Congo, Dem. Rep.
Uganda
Rwanda
Somalia
Ethiopia
Angola
Mozambique
Comoros
Sudan
Iran, Islamic Rep.
Turkey
Iraq
Israel
Afghanistan
India
Pakistan
Bangladesh
Myanmar
Sri Lanka
Thailand
Philippines
Indonesia
Papua New Guinea
-4-2
02
Sur
plus
gov
erna
nce
500 1000 2500 5000 10000 25000Log GDP per capita, constant 2000 USD
No conflict New conflict Conflict recurrence
As is well known from previous studies, Figure 4 shows that most conflict and conflict recurrence
countries (marked with diamonds and squares) have low average incomes. Spain, the UK and the
US are the main exceptions. Although patterns are less clear than in Figure 2, there is a tendency
for conflicts to recur more frequently in low-income countries that had relatively poor governance for
their income levels in 1990. Examples are DR Congo, Sudan, and Guatemala, with Syria as the most
evident exception. New conflicts, again, seem to occur more frequently in relatively well-governed
but poor countries.
To some extent, the apparent poor governance of these countries is due to lack of formal demo-
cratic institutions. In Figure 5, we have plotted the residual ‘informal governance’ index against
average income. Seen from this perspective, oil exporters such as Oman, Saudi Arabia, and the
United Arab Emirates appear as well-governed non-democracies, whereas fairly democratic countries
such as Venezuela, Lebanon, and Greece have poor informal governance relative to their income lev-
els. As before, there is a tendency for non-conflict countries to be in the upper, well-governed half of
the figure.
Given this correlation, to what extent does governance explain the risk of conflict recurrence
19

Figure 5: ‘Informal governance’ by average income, 1990. ‘Informal governance’ is defined as theresidual of regressing governance on our formal democratic institutions
Canada
Cuba
Dominican Republic
Jamaica Trinidad and Tobago
Honduras
Nicaragua
Costa Rica
Panama
Guyana
EcuadorBrazil
Bolivia
Paraguay
Chile
ArgentinaUruguay
Ireland
Netherlands
Belgium
Luxembourg
France
Switzerland
Portugal
Germany
Poland
Austria
Hungary Czech Republic
Italy
Albania
Greece
Cyprus
Bulgaria
Romania
Finland
SwedenNorway
Denmark
Iceland
Equatorial GuineaGambia, The
Mauritania
Burkina Faso
Ghana
Cameroon
Kenya
TanzaniaZambia
Zimbabwe
Malawi
South Africa
Botswana
Swaziland
Madagascar
Mauritius
Morocco
TunisiaLibya
Syrian Arab Republic
Jordan
Saudi Arabia
Bahrain
Qatar
United Arab Emirates
Oman
ChinaMongolia
Taiwan, China
Korea, Dem. Rep.Korea, Rep.
Japan
Bhutan
Lao PDR
Vietnam
Malaysia
SingaporeAustralia
New Zealand
Solomon Islands
Fiji
United States
Mexico
Serbia
Guinea-Bissau
Niger
Cote d'Ivoire
Guinea
Sierra Leone
Nigeria
Central African Republic
Congo, Rep.
Burundi
Djibouti
Lesotho
Algeria
Egypt, Arab Rep.
Nepal
Haiti Guatemala
El Salvador
Colombia
Venezuela, RB
Peru
United Kingdom
Spain
Russian Federation
MaliSenegal
Togo
Chad
Congo, Dem. Rep.
Uganda
Rwanda
Somalia
Ethiopia
Angola
Mozambique
Comoros
Sudan
Iran, Islamic Rep.
Turkey
Iraq
Israel
AfghanistanIndia
Pakistan
Bangladesh
MyanmarSri Lanka
Thailand
Philippines
Indonesia
Papua New Guinea
-3-2
-10
12
Info
rmal
inst
itutio
ns
500 1000 2500 5000 10000 25000Log GDP per capita, constant 2000 USD
No conflict New conflict
Conflict recurrence
beyond what can be attributed to a country’s average income level? Table 2 reports results from
models including our ‘surplus governance’ indicator. Model 12 (column 4) includes only GDP per
capita and its interaction with ‘peace years’. The main term is not significant on its own, but the
interaction with time in peace is. This finding may be less controversial than it seems, since our
model is a model of conflict incidence, controlling for whether the country was at conflict at t− 1.
Model 13 includes the ‘surplus governance’ indicators. As found for the other governance in-
dicators, ‘surplus governance’ has a negative relationship with the risk of conflict recurrence – the
estimates are roughly similar to those depicted in Figure 1 based on Model 8, Table 1.
Figure 6 helps interpreting the results in Model 13. Immediately after conflict (the left panel), the
estimated risk of renewed conflict is about 0.10 annually for all types of countries: neither the GDP
per capita nor ‘surplus governance’ are able to distinguish clearly between high- and low-probability
countries. 10 years after, however, both surplus governance and average income has made a big
difference. Poor countries with poor governance for their income levels have not decreased their
expected risk of conflict recurrence, whereas countries that are either well governed for their income
levels or have high average incomes have reduced their risks to about a quarter of the initial level.
The lowest estimated risk is, unsurprisingly, in countries with high income and good governance.
According to our Clarify simulations, the well-governed cases have a lower risk of conflict than
poorly-governed ones, for both income levels.
20

Figure 6: Predicted probability of conflict by extent of GDP per capita and ‘surplus’ governance, justafter conflict (left panel) and 10 years after conflict (right panel), based on Model 13. Uncertaintyestimates for selected points reported below.
-2-1
01
2S
urpl
us g
over
nanc
e
250 500 1000 2500 5000 10000GDP per capita
0
.02
.04
.06
.08
.1
.12
.14
Med
ian
pred
icte
d pr
obab
ility
-2-1
01
2S
urpl
us g
over
nanc
e
250 500 1000 2500 5000 10000GDP per capita
0
.02
.04
.06
.08
.1
.12
.14
Med
ian
pred
icte
d pr
obab
ility
GDP per Surplus Just after conflict 10 years after conflictcapita (USD) governance p 80% C.I. p 80% C.I.
520 Poor (–1.20) 0.088 (0.066, 0.121) 0.053 (0.041, 0.070)520 Good (1.20) 0.107 (0.080, 0.139) 0.033 (0.026, 0.044)
8100 Poor (–1.20) 0.106 (0.080, 0.139) 0.022 (0.017, 0.027)8100 Good (1.20) 0.126 (0.095, 0.166) 0.013 (0.010, 0.017)
4.5 Endogenity
It is not obvious that conflict and governance are exogenous to each other. Armed conflict often
leads governments to introduce martial law and limit political rights, the opposition sometimes to
boycott elections, and all parties to increase violence connected to elections. The poor governance of
Sudan and Angola in 1990 might very well be due to their past conflict history.
To test for endogenity bias, we estimate an instrumental-variable model based on model 8 in Table
1. The results are shown in the last two columns of Table 2. There are two key explanatory variables
in the original model: the country’s governance level, and the governance level interacted with time
in peace. As instrumental variables for governance, we use (1) a measure of democratic waves as
proposed by Knutsen (2011), and (2) the 20-year lag of the formal institutions index (Helliwell
1994). Since models with more than one instrumented variable are difficult to estimate by means of
maximum likelihood estimation (MLE), we use a two-step model proposed by Newey (1987). This
model is consistent, but less efficient than the MLE approach.
Model 15 gives the results from the first stage of the instrumental variable regression, Model 16
those of the second stage. The substantive effects are largely similar to the effects seen in Table 1. The
size of the effects are somewhat different, reflecting that the instrument is an imperfect rendition of
the original variable. The estimation shows that the instruments we use do not violate the exclusion
criteria. It also shows that the estimated effect of governance instrumented is roughly the same as
seen for the possibly endogenous variable in Table 1. In sum, we conclude that the endogeneity
bias in the models shown in Table 1 is moderate, and prefer to relate to the more efficient original
estimates.
21

5 Conclusion
This paper has investigated whether well-governed countries are better able to prevent armed conflict
than poorly governed ones, with a particular focus on avoiding conflict recurrence. We have defined
governance more broadly than in earlier studies, supplementing indices of ‘formal’ degree of demo-
craticness with less formal dimensions of governance. This broad conception of governance better
captures the logic of explanations for why some political systems should have less conflict, such as
the relative-deprivation account associated with Davies (1962) and Gurr (1968). Countries may be
formally democratic but have poor governance according to this definition. Deficiencies in informal
aspects of governance may be the reason why the correlation between democracy and internal con-
flict is weak (Hegre et al. 2001) – poor informal governance may completely undermine the decisions
reached in democratic institutions, and good governance may reduce deprivation effectively even in
non-democratic systems.
We have studied a set of indicators classified into seven aspects of governance: bureaucratic
quality, the rule of law, corruption, economic policies, military influence in politics, political exclusion
and repression, and formal political institutions, and operationalized these indices by means of data
from a wide range of available sources. Our statistical models show that good governance is crucial to
reducing the risk of conflict recurrence. Countries that have experienced conflict, have a higher risk
of seeing renewed conflict. The risk of renewed conflict in countries with good governance, however,
drops rapidly after the conflict has ended. In countries characterized by poor governance, this process
takes much longer.
At the same time, there are good reasons to believe that conflicts often erodes the quality of
governance. To account for this potential endogeneity, we constructed an instrument for governance
that is highly correlated with the observed governance indicator and yet clearly exogenous to conflict.
We reach the same conclusions using the instrumented governance variable.
We have also studied the importance of formal political institutions (the extent to which countries
are regarded as democratic or not) relative to informal institutions. The results indicate that coun-
tries need good institutions along both dimensions to minimize the risk of internal armed conflict,
but that informal governance might be somewhat more important than formal institutions.
Moreover, we have shown that good formal and informal governance is a partial explanation of the
conflict-reducing effect of economic development. High-income countries are on average well governed.
Still, a model that includes both GDP per capita and governance fits the data better than a model
with only GDP per capita. We find a discernible difference in the risk of conflict recurrence between
high-income countries that are well-governed and countries that have poor governance relative to
their income levels.
Even though a combination of good formal and informal institutions is optimal, the analysis also
shows that all our governance indicators are related to a decreased risk of conflict recurrence. We take
this as indication that reform in the different sectors can be partial substitutes to each other. Any
reform that improves governance may be conflict-reducing, be it to the formal political institutions,
bureaucratic quality, or corruption.
22

Our analysis sheds light on the somewhat inconclusive results from earlier studies of the rela-
tionship between democracy and conflict, that find a heightened risk of conflict in semi-democracies
(Hegre et al. 2001, Fearon and Laitin 2003). It is possible that some of the conflict-proneness of
semi-democracies is due to their poor governance in a wider sense. Given that good governance as
defined here is more frequent in middle- and high-income countries, our results are also in line with
Hegre (2003), and Collier and Rohner (2008) who find democracy to reduce the risk of conflict more
strongly the higher is GDP per capita.
In substantial terms, the difference between high-income and low-income countries is much larger
than the effect produced by different levels of governance. However, even with excellent economic
policies (one aspect of good governance), it takes many decades to close the gap between a low-
income and a high-income country. Good informal governance is a much more expedient means to
reduce the risk of conflict in the long run. In the longer run, strong economic growth and democratic
institutions will reinforce the beneficial effects of informal governance.
23

References
Beck, Nathaniel and Jonathan N. Katz. 2001. “Throwing out the Baby with the Bath Water: A Comment onGreen, Kim, and Yoon.” International Organization 55:187–195.
Beck, Nathaniel and Simon Jackman. 1998. “Beyond Linearity by Default: Generalized Additive Models.”American Journal of Political Science 42(2):596–627.
Ben Nasser Al Ismaily, Salem, Fred McMahon, Miguel Cervantes and Amela Karabegovic. 2010. EconomicFreedom of the Arab World: 2010 Annual Report. Fraser Institute.URL: http://www.freetheworld.com
Braithwaite, Alex. 2010. “Resisting infection: How state capacity conditions conflict contagion.” Journal ofPeace Research 47(3):311–319.
Bussmann, Margit and Gerald Schneider. 2007. “When Globalization Discontent Turns Violent: ForeignEconomic Liberalization and Internal War.” International Studies Quarterly 51(1):79–97.
Carey, Sabine C. 2007. “Rebellion in Africa: Disaggregating the Effect of Political Regimes.” Journal of PeaceResearch 44(1):47–64.
Cederman, Lars-Erik, Andreas Wimmer and Brian Min. 2010. “Why do ethnic groups rebel? New data andanalysis.” World Politics 62(1):87–119.
Cederman, Lars-Erik, Nils B. Weidmann and Kristian S. Gleditsch. 2011. “Horizontal Inequalities and Eth-nonationalist Civil War: A Global Comparison.” American Political Science Review 105(3):478–495.
Cederman, Lars-Erik, Simon Hug and Lutz F. Krebs. 2010. “Democratization and civil war: Empirical evi-dence.” Journal of Peace Research 47(4):377–394.
Collier, Paul and Anke Hoeffler. 2004. “Greed and Grievance in Civil War.”Oxford Economic Papers 56(4):563–595.
Collier, Paul and Dominic Rohner. 2008. “Democracy, Development and Conflict.” Journal of the EuropeanEconomic Association 6(1):531–540.
Davenport, Christian. 2007. “State Repression and Political Order.”Annual Review of Political Science 10:1–23.
Davies, James C. 1962. “Towards a Theory of Revolution.” American Sociological Review 27(1):5–19.
Dreher, Axel, Martin Gassebner and Lars-H. R. Siemers. 2012. “Globalization, Economic Freedom, and HumanRights.” Journal of Conflict Resolution 56(3):516–546.
Fearon, James D. 2004. “Why Do Some Civil Wars Last So Much Longer Than Others?” Journal of PeaceResearch 41(3):275–301.
Fearon, James D. 2005. “Primary Commodity Export and Civil War.”Journal of Conflict Resolution 49(4):483–507.
Fearon, James D. and David D. Laitin. 2003. “Ethnicity, Insurgency, and Civil War.” American PoliticalScience Review 97(1):75–90.
Fjelde, Hanne. 2009. “Buying Peace? Oil Wealth, Corruption and Civil War 1985–99.” Journal of PeaceResearch 47(2):199–218.
Fjelde, Hanne and Havard Hegre. 2007. “Democracy Depraved. Corruption and Institutional Change 1985–2000.” Paper presented to the 48th Annual Convention of the International Studies Association, Chicago,February 28–March 3.
24

Fjelde, Hanne and Indra de Soysa. 2009. “Coercion, Co-optation or Cooperation? State Capacity and the Riskof Civil War, 1961–2004.” Conflict Management and Peace Science 26(1):5–25.
Freedom House. 2010. Freedom in the World 2010. The annual survey of political rights and civil liberties.Rowman & Littlefield and Freedom House.
Gates, Scott, Havard Hegre, Mark P. Jones and Havard Strand. 2006. “Institutional Inconsistency and PoliticalInstability: Polity Duration, 1800–2000.” American Journal of Political Science 50(4):893–908.
Geddes, Barbara. 1999. “What Do We Know About Democratization After Twenty Years?” Annual Reviewof Political Science 2:115–144.
Gibney, Mark, Linda Cornett and Reed Wood. 2008. Political Terror Scale 1976-2006.
Gleditsch, Kristian S. 2002. “Expanded Trade and GDP data.” Journal of Conflict Resolution 46(5):712–724.
Gleditsch, Nils Petter, Peter Wallensteen, Mikael Eriksson, Margareta Sollenberg and Havard Strand. 2002.“Armed Conflict 1946–2001: A New Dataset.” Journal of Peace Research 39(5):615–637.
Gurr, Ted. 1968. “A causal model of civil strife: A comparative analysis using new indices.” American PoliticalScience Review 62(4):1104–1124.
Gwartney, James, Joshua Hall and Robert Lawson. 2010. Economic Freedom of the World. 2010 AnnualReport. Fraser Institute.
Harbom, Lotta and Peter Wallensteen. 2010. “Armed Conflicts, 1946–2009.” Journal of Peace Research47(4):501–509.
Hegre, Havard. 2003. “Disentangling Democracy and Development as Determinants of Armed Conflict.” Work-ing Paper 24637, the World Bank.
Hegre, Havard. 2014. “Democracy and armed conflict.” Journal of Peace Research 51(2):000–000.
Hegre, Havard and Hanne Fjelde. 2009. Post-Conflict Democracy and Conflict Recurrence. In Peace andConflict, ed. J. Joseph Hewitt, Jonathan Wilkenfeld and Ted Robert Gurr. Paradigm Publishers pp. 79–90.
Hegre, Havard and Nicholas Sambanis. 2006. “Sensitivity Analysis of Empirical Results on Civil War Onset.”Journal of Conflict Resolution 50(4):508–535.
Hegre, Havard, Tanja Ellingsen, Scott Gates and Nils Petter Gleditsch. 2001. “Toward a Democratic CivilPeace? Democracy, Political Change, and Civil War, 1816–1992.” American Political Science Review95(1):33–48.
Hegre, Havard and Havard. Mokleiv Nygard. 2014. “Governance and Conflict Relapse.” Journal of ConflictResolution 0:0.
Hegre, Havard and Jonas Nordkvelle. N.d. “How much goes out with the bath water? Omitted variable biasand efficiency loss in country-year studies with dichotomous dependent variables.”.
Hegre, Havard, Lisa Hultman and Havard Mokleiv Nygard. 2011. Simulating the Effect of PeacekeepingOperations, 2010–2035. In Social Computing, Behavioral-Cultural Modeling and Prediction, ed. John Salerno,Shanchieh Jay Yang, Dana Nau and Sun-Ki Chai. Lecture Notes in Computer Science 6589 New York:Springer pp. 325–334.
Helliwell, John F. 1994. “Empirical Linkages between Democracy and Economic Growth.” British Journal ofPolitical Science 24(2):225–248.
Hendrix, Cullen S. 2010. “Measuring State Capacity: Theoretical and Emperical Implication for the Study ofCivil Conflict.” Journal of Peace Research 47:271–285.
25
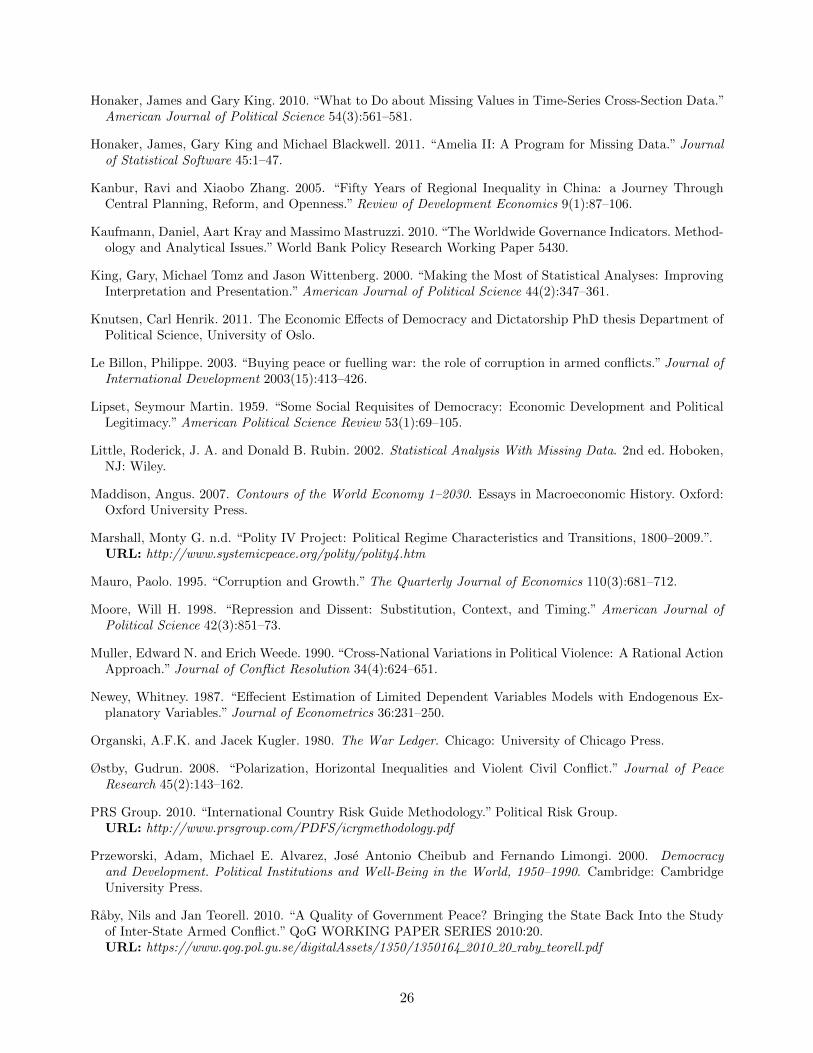
Honaker, James and Gary King. 2010. “What to Do about Missing Values in Time-Series Cross-Section Data.”American Journal of Political Science 54(3):561–581.
Honaker, James, Gary King and Michael Blackwell. 2011. “Amelia II: A Program for Missing Data.” Journalof Statistical Software 45:1–47.
Kanbur, Ravi and Xiaobo Zhang. 2005. “Fifty Years of Regional Inequality in China: a Journey ThroughCentral Planning, Reform, and Openness.” Review of Development Economics 9(1):87–106.
Kaufmann, Daniel, Aart Kray and Massimo Mastruzzi. 2010. “The Worldwide Governance Indicators. Method-ology and Analytical Issues.” World Bank Policy Research Working Paper 5430.
King, Gary, Michael Tomz and Jason Wittenberg. 2000. “Making the Most of Statistical Analyses: ImprovingInterpretation and Presentation.” American Journal of Political Science 44(2):347–361.
Knutsen, Carl Henrik. 2011. The Economic Effects of Democracy and Dictatorship PhD thesis Department ofPolitical Science, University of Oslo.
Le Billon, Philippe. 2003. “Buying peace or fuelling war: the role of corruption in armed conflicts.” Journal ofInternational Development 2003(15):413–426.
Lipset, Seymour Martin. 1959. “Some Social Requisites of Democracy: Economic Development and PoliticalLegitimacy.” American Political Science Review 53(1):69–105.
Little, Roderick, J. A. and Donald B. Rubin. 2002. Statistical Analysis With Missing Data. 2nd ed. Hoboken,NJ: Wiley.
Maddison, Angus. 2007. Contours of the World Economy 1–2030. Essays in Macroeconomic History. Oxford:Oxford University Press.
Marshall, Monty G. n.d. “Polity IV Project: Political Regime Characteristics and Transitions, 1800–2009.”.URL: http://www.systemicpeace.org/polity/polity4.htm
Mauro, Paolo. 1995. “Corruption and Growth.” The Quarterly Journal of Economics 110(3):681–712.
Moore, Will H. 1998. “Repression and Dissent: Substitution, Context, and Timing.” American Journal ofPolitical Science 42(3):851–73.
Muller, Edward N. and Erich Weede. 1990. “Cross-National Variations in Political Violence: A Rational ActionApproach.” Journal of Conflict Resolution 34(4):624–651.
Newey, Whitney. 1987. “Effecient Estimation of Limited Dependent Variables Models with Endogenous Ex-planatory Variables.” Journal of Econometrics 36:231–250.
Organski, A.F.K. and Jacek Kugler. 1980. The War Ledger. Chicago: University of Chicago Press.
Østby, Gudrun. 2008. “Polarization, Horizontal Inequalities and Violent Civil Conflict.” Journal of PeaceResearch 45(2):143–162.
PRS Group. 2010. “International Country Risk Guide Methodology.” Political Risk Group.URL: http://www.prsgroup.com/PDFS/icrgmethodology.pdf
Przeworski, Adam, Michael E. Alvarez, Jose Antonio Cheibub and Fernando Limongi. 2000. Democracyand Development. Political Institutions and Well-Being in the World, 1950–1990. Cambridge: CambridgeUniversity Press.
Raby, Nils and Jan Teorell. 2010. “A Quality of Government Peace? Bringing the State Back Into the Studyof Inter-State Armed Conflict.” QoG WORKING PAPER SERIES 2010:20.URL: https://www.qog.pol.gu.se/digitalAssets/1350/1350164 2010 20 raby teorell.pdf
26

Strand, Havard, Havard Hegre, Scott Gates and Marianne Dahl. 2012. “Why Waves? Global Patterns ofDemocratization, 1820–2008.” Typescript, PRIO.URL: http://folk.uio.no/hahegre/Papers/WhyWaves 2012.pdf
Taydas, Zeynep, Dursun Peksen and Patrick James. 2010. “Why do civil wars occur? Understanding theimportance of institutional quality.” Civil Wars 12(3):195–217.
United Nations. 2007. World Population Prospects. The 2006 Revision. New York: UN.
Vanhanen, Tatu. 2000. “A New Dataset for Measuring Democracy, 1810-1998.” Journal of Peace Research37(2):251–265.
Vreeland, James Raymond. 2008. “The Effect of Political Regime on Civil War: Unpacking Anocracy.” Journalof Conflict Resolution 52(3):401–425.
Walter, Barbara. 2004. “Does Conflict Beget Conflict? Explaining Recurring Civil War.” Journal of PeaceResearch 41(3):371–388.
Wintrobe, Ronald. 1998. The Political Economy of Dictatorship. Cambridge: Cambridge: Cambridge Univer-sity Press.
Wood, Reed M. and Mark Gibney. 2010. “The Political Terror Scale (PTS): A Re-introduction and a Com-parison to CIRI.” Human Rights Quarterly 32:367–400.
Wood, Simon N. 2006. Generalized Additive Models: An Introduction with R. New York: Chapman &Hall/CRC.
World Bank. 2009. “Country Policy and Instiutional Assessments – 2009 Assessment Questionnaire.”.URL: http://siteresources.worldbank.org/IDA/Resources/73153-1181752621336/CPIA09CriteriaB.pdf
World Bank. 2011. “World Development Indicators.” Washington, DC: World Bank.
Zakaria, Fareed. 1997. “The Rise of Iliberal Democracy.” Foreign Affairs 76:22–43.
27

Online Appendix:
Governance and Conflict RelapseHavard Hegre and Havard Mokleiv Nygard
Journal of Conflict Resolution, vol. 00, no. 00, p. 000–000
This online appendix provides supplemental material for Hegre and Nygard (2014). It proceedsas follows: Section A-1 provides additional information on how the combined governance index usedin Hegre and Nygard (2014) is constructed, and reports the relationship between the different sub-indicators the index consists of. Next, we report summary statistics for all the control variables usedin the paper, and describe and discuss how we dealt with missing data.
Section A-2 provides additional information of the logarithmic transformation of the formal insti-tutions index used in the paper, and reports information about the relationship between this indexand the overall governance index. Section A-3 shows the relationship between the formal and informalinstitution indices.
In Hegre and Nygard (2014) we discuss the substantive impact of the overall governance indexand several of the sub-indicators on the risk of conflict recurrence. Section A-4 in this appendix showplots for the sub-indicators not covered in the main paper. The substantive results for these subindicators are identical to those reported for the indicators in the main paper.
Section A-5 reports the full list of fairly fine-grained region dummy variables used as controls inthe study, and then the issue of whether the effect of governance on conflict is linear is discussed.Section A-6 shows that this relationship indeed is not strictly linear, but that the deviation fromlinearity is negligible. Section A-7 provides a set of robustness checks, looking at the extent to whichour results are robust to influential observations and different operationalizations of the dependentvariable. The last section discusses in more detail how we deal with endogenity in the paper.
A-1 Data
Table A-1 reports summary statistics for the variables included in Hegre and Nygard (2014). Severalof these variables, and especially the governance indicators have substantial amounts of missing data.To a large extent, this ‘missingness’ is not overlapping and listwise deletion would therefore toss outmore than 50 percent of our data. Listwise deletion is only appropriate when missing data is thoughtto be ‘missing completely at random’ (MCAR), meaning that the dependent variable is completelyunrelated to the missing data mechanism (Little and Rubin 2002). This is an untenable assumptionin our case. We assume therefore that the data is ‘missing at random’, implying that missing valuescan be predicted by observed information included in the data set. We perform multiple imputation(Little and Rubin 2002) by using all the information available in the dataset to predict missingvalues. Multiple imputation solves the problem of taking imputation uncertainty into considerationby producing a set of missing value candidates. The variance across these candidates is then directlyinterpretable as the imputation uncertainty. We perform multiple imputation using Amelia (Honakerand King 2010, Honaker, King and Blackwell 2011). In the imputation the time series and panelnature of our data is taken into consideration.
As discussed in Hegre and Nygard (2014) several of the governance indicators are highly cor-related. Figure A-1 shows the relationship between the seven indices. The scatter plots show therelationships between the indices for the year 2005 only, whereas the correlation matrix refers to allcountries in the world over the 1960–2008 period. The bureaucratic quality index is correlated by
1
Table A-1: Descriptive Statistics, 1960–2008
Variable Obs Mean S.D. Min .25 Median .75 MaxConflict 7539 0.17 0.37 0 0 0 0 1Bureaucratic quality index 7365 0 1 -2.66 -0.74 -0.12 0.63 3.04Rule of law index 7365 0 1 -2.59 -0.73 -0.17 0.62 3.01Corruption index 7365 0 1 -2.78 -0.69 -0.18 0.51 3.06Economic policies index 7365 0 1 -3.37 -0.69 0.02 0.74 3.34Military influence index 7365 0 1 -3.38 -0.75 0.03 0.79 3.60Pol. exclusion and rep. Index 7365 0 1 -3.84 -0.55 0.12 0.72 4.10Formal inst. index 6742 0 1 -1.35 -0.78 -0.13 1.02 1.69Governance index 6743 0 1 -2.33 -0.74 -0.17 0.65 2.59ln(Peace years) 7539 2.25 1.37 0 1.10 2.71 3.37 4.14log GDP per capita 7266 8.02 1.13 5.33 7.02 8.01 8.92 11.03PKO, traditional 7539 0.06 0.24 0 0 0 0 1PKO, transformational 7539 0.01 0.11 0 0 0 0 1Neighbor conflict 7539 0.59 0.49 -0.12 0 1 1 1Ethnic dominance 7539 0.50 0.51 -0.98 0 0.45 1 2.09Log population 7539 8.87 1.67 4.69 7.90 8.91 9.94 14.11
0.86 with corruption, but only by 0.46 with exclusion and repression. The formal institutions indexis correlated by 0.76 with rule of law, but only 0.44 with military influence. The bottom line inthe table part of Figure A-1 shows the correlation between each of the sub-indices and the overallgovernance index.
A-2 Formal political institutions
In Hegre and Nygard (2014) we develop an index for formal political institutions in order to evaluatethe effect of governance over and above the effect of such formal institutions. We have based our indexof formal political institutions on the ‘Scalar Index of Polities’ (SIP) developed in Gates et al. (2006).The SIP index is partly based on the Polity (Marshall n.d.) democracy index, the most widely useddataset on formal political institutions in conflict research. There are several other indices of formaldemocracy than the Polity and SIP indices used here, but few as detailed as these and with equallylong time series. Most democracy indicators correlate highly, and the Polity and SIP scores are bothrepresentative as well as widely used in the academic literature. Polity categorizes formal institutionsusing indicators along three dimensions: Openness and regulation of executive recruitment, opennessand regulation of popular participation, and the extent to which the executive branch is balanced byother institutions within the political system. A problem with the Polity index, however, is that theparticipation component includes political violence as part of the definition (Vreeland 2008). The SIPindex circumvents this problem by replacing the participation component with data from Vanhanen(2000).
The original SIP measure ranges from 0 to 1. The value 0 is given to political systems wherethe executive is not elected, where either the vast majority of the population has no right to voteor there is no party competition, and no institutions serves as checks and balances on the executive.A value close to 1 is given to systems where the executive is elected, voting rights are universal andparty competition effective, and an institution (typically an elected parliament) is equally influentialas the executive branch.
We have made one adjustment to the Gates et al. (2006) SIP index to obtain an index with a moreconvenient distribution. The transformation is illustrated in Figure A-2. The lower panel shows the
2

Figure A-1: Correlations between governance indicators, 2005
Bureaucraticquality
Ruleof law
Corruption
Economicpolicies
Militaryin
politics
Exclusionand
repression
Formalinstitutions
-2
0
2
-2 0 2
-2
0
2
-2 0 2
-2
0
2
-2 0 2
-2
0
2
-2 0 2
-2
0
2
-2 0 2
-4
-2
0
2
-4 -2 0 2
-2
0
2
-2 0 2
Bureaucratic Rule of Economic Military Exclusion and Formalquality law Corruption policies in politics repression institutions
Bureaucratic quality 1 .874 .862 .696 .671 .457 .621Rule of law .874 1 .860 .718 .676 .578 .760Corruption .862 .860 1 .606 .631 .491 .552Economic policies .696 .719 .606 1 .515 .359 .574Military in politics .671 .676 .631 .515 1 .501 .442Exclusion and repression .457 .578 .491 .359 .501 1 .360Formal institutions .621 .760 .552 .574 .442 .360 1Governance index .907 .964 .871 .757 .741 .634 .808GDP per capita .736 .728 .677 .625 .547 .389 .546
distribution of the original SIP score. Close to 20% of the country years over the 1960–2008 periodare coded as consistent autocracies with scores 0. Approximately 20% are consistent democracieswith values approaching 1, and only a small fraction occupy the territory between .2 and .8. Todistribute regimes more evenly, we replaced all observations lower than 0.03 with 0.03 and madea ‘logit’ transformation: D = ln( SIP
1−SIP ), and rescaled this measure to have mean 0 and standarddeviation of 1. We call this index ‘formal political institutions’.
The ‘formal political institutions’ index is plotted as a function of SIP in the upper right plot inFigure A-2. The distribution of the new measure is given in the upper left panel. The proportion ofobservations that are coded as 0 remains the same, but the remaining observations are distributedmuch more uniformly. Figure A-3 shows the relationship between the formal political institutionsindex and the governance index for the year 1990.
3

Figure A-2: Transformation of SIP index
-2-1
01
2F
orm
al in
stitu
tions
0.05.1.15.2Fraction
-2-1
01
2F
orm
al in
stitu
tions
0 .2 .4 .6 .8 1country's annual sip2 score
0.0
5.1
.15
.2F
ract
ion
0 .2 .4 .6 .8 1country's annual sip2 score
A-3 Relationship governance index and formal institutions index
In Section 4.3 of Hegre and Nygard (2014), we generate an ‘informal political institutions’ index,which is the residuals from a regression with the governance index as the dependent variable and theformal institutions index as the independent variable. Figure A-3 plots these two variables againsteach other for all observations for the year 1990.
4

Figure A-3: Governance index by formal institutions index, 1990
Canada
Cuba
Dominican Republic
JamaicaTrinidad and Tobago
HondurasNicaragua
Costa Rica
Panama
Guyana
EcuadorBrazil
BoliviaParaguay
Chile
Argentina
Uruguay
Ireland
NetherlandsBelgium
Luxembourg
France
Switzerland
Portugal
Germany
Poland
Austria
Hungary
Czech RepublicItaly
Albania
Greece
Cyprus
Bulgaria
Romania
FinlandSweden
NorwayDenmark
Iceland
Equatorial Guinea
Gambia, The
Mauritania
Burkina Faso
Ghana
Cameroon
KenyaTanzania
Zambia
Zimbabwe
Malawi
South Africa
Namibia
Botswana
SwazilandMadagascar
Mauritius
MoroccoTunisia
Libya
Syrian Arab Republic
JordanSaudi Arabia
BahrainQatar
United Arab Emirates
Oman
China
Mongolia
Taiwan, China
Korea, Dem. Rep.
Korea, Rep.
Japan
Bhutan
Lao PDR
Vietnam
Malaysia
Singapore
AustraliaNew Zealand
Solomon Islands
Fiji
United States
Mexico
SerbiaGuinea-Bissau
Niger
Cote d'Ivoire
GuineaSierra Leone
Nigeria
Central African Republic
Congo, Rep.
Burundi
Djibouti
Lesotho
Algeria
Egypt, Arab Rep.
Nepal
HaitiGuatemala
El Salvador
Colombia
Venezuela, RB
Peru
United Kingdom
Spain
Russian Federation
Mali
Senegal
TogoChad
Congo, Dem. Rep.
Uganda
Rwanda
SomaliaEthiopiaAngola
Mozambique
Comoros
Sudan
Iran, Islamic Rep.
Turkey
Iraq
Israel
Afghanistan
India
Pakistan
Bangladesh
Myanmar
Sri Lanka
Thailand
Philippines
Indonesia
Papua New Guinea
-2-1
01
2G
over
nanc
e in
dex
-1.5 -1 0 1 2Formal institutions
No conflict New conflict Conflict recurrence Fitted values
A-4 Governance indicators, substantive effects
In Hegre and Nygard (2014) we discuss the substantive impact of bureaucratic quality, repressionand exclusion, formal institutions and the overall governance index on the risk of conflict onset andrecurrence. Figure A-4 shows the estimated substantive effects for the remaining four sub-indicatorsnot presented in the main article.
5

Figure A-4: Predicted probability of conflict recurrence, governance indicators 5–7 and the combinedgovernance index
.01
.02
.03
.05
.1.2
.5Pr
obab
ility
of re
curre
nce
0 5 10 15 20 25Years after Conflict
Low Gov Low Gov, 10/90 pctile High Gov High Gov, 10/90 pctile
Military influence
.01
.02.
03.0
5.1
.2.5
Prob
abilit
y of
recu
rrenc
e
0 5 10 15 20 25Years after Conflict
Low Gov Low Gov, 10/90 pctile High Gov High Gov, 10/90 pctile
Rule of law
.01
.02.
03.0
5.1
.2.5
Prob
abilit
y of
recu
rrenc
e
0 5 10 15 20 25Years after Conflict
Low Gov Low Gov, 10/90 pctile High Gov High Gov, 10/90 pctile
Corruption
.01
.02
.03
.05
.1.2
.5Pr
obab
ility
of re
curre
nce
0 5 10 15 20 25Years after Conflict
Low Gov Low Gov, 10/90 pctile High Gov High Gov, 10/90 pctile
Economic policies
A-5 List of Regions
In all tables, we have omitted the estimated coefficients for 23 small regions designed to captureunobserved country/region-level heterogeneity. The regions are listed below. Table A-2 repeatsTable 1 in Hegre and Nygard (2014) with all estimates. The definition of the regions is given in thelist that follows.
The region dummies were designed to account for unobserved country-level heterogeneity without‘throwing the baby out with the bathwater’ (Beck and Katz 2001). They consist of mostly neighboringcountries, and were constructed to be as small as possible but always have some variation on thedependent variable within the region. See Hegre and Nordkvelle (N.d.) for validation of this design.
1: Bahamas, Barbados, Belize, Costa Rica, Cuba, Dominican Republic, El Salvador, Guatemala,Haiti, Honduras, Jamaica, Mexico, Nicaragua, Panama, Trinidad and Tobago,
2: Argentina, Bolivia, Brazil, Chile, Colombia, Ecuador, Guyana, Paraguay, Peru, Surinam, Uruguay,Venezuela
3: Australia, Austria, Belarus, Belgium, Canada, Cyprus, Denmark, Estonia, Fiji, Finland, France,German Federal Republic, Greece, Hungary, Iceland, Ireland, Italy, Latvia, Lithuania, Luxembourg,
6

Malta, Moldova, Netherlands, New Zealand, Norway, Papua New Guinea, Poland, Portugal, Ruma-nia, Russia/USSR, Solomon Islands, Spain, Sweden, Switzerland, Ukraine, United Kingdom, UnitedStates of America
5: Albania, Bosnia-Herzegovina, Bulgaria, Croatia, Czech Republic, FYR Macedonia, Montenegro,Serbia/former Yugoslavia, Slovakia, Slovenia
6: Armenia, Azerbaijan, Georgia
7: Algeria, Morocco, Tunisia
8: Egypt, Libya, Sudan
9: Iraq, Syria, Turkey
10: Bahrain, Israel, Jordan, Lebanon, Oman, Qatar, Saudi Arabia, United Arab Emirates, Yemen(Arab Republic of Yemen)
11: Burkina Faso, Cape Verde, Cote d’Ivoire, Gambia, Guinea, Guinea-Bissau, Liberia, Mali, Sene-gal
12: Benin, Equatorial Guinea, Ghana, Mauritania, Niger, Nigeria, Sierra Leone, Togo
13: Cameroon, Central African Republic, Chad, Gabon
14: Burundi, Congo, Democratic Republic of Congo, Rwanda
15: Kenya, Somalia, Tanzania, Uganda
16: Djibouti, Eritrea, Ethiopia, Malawi, Zambia, Zimbabwe
17: Angola, Botswana, Comoros, Lesotho, Madagascar, Mauritius, Mozambique, Namibia, SouthAfrica, Swaziland
18: Iran, Turkmenistan, Uzbekistan
19: Kazakhstan, Kyrgyz Republic, Tajikistan
20: Afghanistan, Bangladesh, Pakistan
21: India, Maldives, Sri Lanka
22: Bhutan, China, Japan, Mongolia, Myanmar, Nepal, North Korea, South Korea, Taiwan
23: Cambodia, Laos, Thailand, Vietnam
24: Brunei, East Timor, Indonesia, Malaysia, Philippines, Singapore
7

A-6 Assumption of linear relationship
In Hegre and Nygard (2014) we assume that the relationship between governance and conflict islinear. This, however, may not be the case, and even if the relationship is roughly linear the estimatesreported in Hegre and Nygard (2014) may ignore important and interesting local effects as the modelonly reports the global mean effect of governance on conflict. To investigate this further, we estimatea Generalized Additive Model (Beck and Jackman 1998, Wood 2006) where we allow for a non-lineareffect of time in peace, we find that the effect is not strictly linear. The departure from linearity isminor, however, and should not have any major theoretical implications.
The models presented above all assume that the effect of governance on conflict onset or recurrenceis linear. Beck and Jackman (1998) show that such linearity assumptions, although common, are notnecessarily harmless. To test whether this assumption holds, we fit a Generalized Additive Model(GAM) to the data. GAM models are estimated through non-parametric smoothing so the functionrelating two variables is not imposed but estimated from the data (Wood 2006). We fit splines tothree variables: the governance index, the time in peace variable and the interaction term betweenthe two.
Figure A-5: Partial Effect of governance and time since conflict on risk of conflict recurrence
−4 −2 0 2 4
−0.
10−
0.05
0.00
0.05
0.10
0.15
Interaction: Governance and Time since conflict
Par
tical
Effe
ct o
n R
ecur
renc
e
Figure A-5 plots the values of the governance and time in peace interaction term On the x axisand the partial effect on conflict recurrence (the effect after having taken the other covariates intoconsideration) on the y axis. The relationship is not strictly linear, but there are no major tippingpoints or break points that clearly distinguish some levels of the variable from others. By and large,a linear approximation appears to be valid. The other two terms are also well approximated by alinear function.
8

A-7 Robustness tests
Influential cases
To ensure the robustness of the results we ran a series of regression diagnostics. In this we focusedon the results from Model 8 in Table 1 in Hegre and Nygard (2014). First we checked the model foroutliers and influential observations that may drive the results. We examined Pearson residuals andDf-betas, which measure the impact each observation has on the effect of a particular parameter esti-mate. These diagnostics indicate that China, Tajikistan, Mozambique and Serbia may be unusuallyinfluential. We therefore removed these observations and re-estimated the model. This leads to onlymarginal changes in the estimated effects and the model therefore appears to be robust to outliers.
Definition of dependent variable
To check how sensitive our results are to a different definition of the dependent variable, we reesti-mated the models in Table 1 in Hegre and Nygard (2014) only looking at conflicts incurring morethan 1000 battle related deaths according to the UCDP/PRIO dataset. The results are shown inTable A-3. Most governance indicators are still associated with a lower estimated incidence of armedconflict, despite the fact that there is much less information in the more restrictive dependent vari-able. For the most serious conflicts, however, good governance seems to reduce the risk of conflictonset, not only recurrence.
A-8 Endogenity
As discussed in the Hegre and Nygard (2014) the relationship between governance and conflict couldpotentially be endogenous. To investigate this we develop an instrument for governance and run a2SLS model. The first instrument takes advantage of the fact that a regime change is more likely tobe into democracy during a democratic wave, and conversely more likely to be into non-democracyduring a reverse wave. Our instrument is the net proportion of changes toward democracy in theyear that the current political system was established, as measured in Strand et al. (2012). Thisvariable is positive if most changes in a year are democratizations, and negative if more countriesbecome more autocratic. For example, the system in effect in Romania in 2000 was established in1989, a peak year of the third wave of democratization where the net proportion changing towarddemocracy was 0.25. Knutsen (2011) shows that a similar variable is highly correlated with whethera country’s current regime is a democracy, yet still not violating the exclusion criteria, meaning it isexogenous to the current regime type.
The second instrument uses the value for formal institutions index at a time 20 years before thetime of observation as a proxy for current governance. Since we do not have data very far back intime for the full governance index, using the 20-year lag of this index is not feasible. The governanceindex and the formal institutions index are highly correlated (r = 0.75) so using the 20-year lag ofthe formal institutions index works well as a proxy for the overall governance index. Most conflictslast less than 20 years, so this instrument should be reasonably exogenous to current conflict.
Since the dependent variable is dichotomous, we estimate an instrumental probit model. Ourmodel includes two variables that need to be instrumented for: the governance variable and theinteraction term between governance level and time in current conflict status.17 The variables arefunctions of each other, but the algorithm still has to treat two variables as endogenous: governanceand governance interacted with time in peace.
17The time in status part of the term does not need to be instrumented for.
9

Figure A-6 plots the original governance index against the instrumented variable (the predictedgovernance level from the first stage reported in as Model 15 in Table 2 in Hegre and Nygard (2014).
Figure A-6: Relationship between instrument and governance index, 2005
United States
Canada
Cuba
Dominican Republic
Jamaica
Trinidad and TobagoMexico
Guatemala
Honduras
El Salvador
Nicaragua
Costa Rica
Panama
Colombia
Venezuela, RB
Guyana
Ecuador
Peru
Brazil
Bolivia Paraguay
Chile
Argentina
Uruguay
United KingdomIreland
Netherlands
Belgium
Luxembourg
France
Switzerland
SpainPortugal
Germany
Poland
Austria
HungaryItaly
Albania
Serbia
GreeceCyprus
Bulgaria
Romania
Russian Federation
Finland
SwedenNorway
DenmarkIceland
Guinea-BissauEquatorial Guinea
Gambia, The
Mali Senegal
Benin
Mauritania
Niger
Guinea
Burkina Faso
Sierra Leone
Ghana
Togo
CameroonNigeria
Gabon
Central African Republic
Chad
Congo, Rep.
Uganda
Kenya
Tanzania
Rwanda
Djibouti
Ethiopia
Angola
Mozambique
Zambia
Zimbabwe
Malawi
South Africa
Lesotho
Botswana
Swaziland
Madagascar
Comoros
Mauritius
Morocco
Algeria
Tunisia
Libya
Iran, Islamic Rep.
Turkey
Egypt, Arab Rep.
Syrian Arab Republic
Jordan
Israel
Saudi Arabia
Kuwait
Bahrain
Qatar
United Arab Emirates
Oman
China
Mongolia
Taiwan, China
Korea, Rep.
Japan
India
Bhutan
Pakistan
Bangladesh
Sri Lanka
Nepal
Thailand
Lao PDR
Vietnam
Malaysia
Singapore
Philippines
Indonesia
Australia
Papua New Guinea
New Zealand
Solomon Islands
Fiji
-1.5
-1-.5
0.5
11.
52
Gov
erna
nce
Inst
rum
ente
d
-1.5 -1 -.5 0 .5 1 1.5 2Governance Index
10

Table A-2: Same as Table 2 in Hegre and Nygard (2014), but showing estimates for all region dummyvariables
(1) (2) (3) (4) (5) (6) (7) (8)Formal Exclusion Rule of law Corruption Military Bureaucracy Economics Governance
conflictConflict, t-1 2.979∗∗∗ 2.993∗∗∗ 2.990∗∗∗ 2.976∗∗∗ 2.987∗∗∗ 2.861∗∗∗ 2.967∗∗∗ 2.992∗∗∗
(0.178) (0.178) (0.178) (0.178) (0.179) (0.180) (0.179) (0.178)War, t-1 4.313∗∗∗ 4.292∗∗∗ 4.267∗∗∗ 4.240∗∗∗ 4.221∗∗∗ 3.928∗∗∗ 4.267∗∗∗ 4.287∗∗∗
(0.295) (0.298) (0.293) (0.298) (0.294) (0.300) (0.294) (0.298)ln(Peace years) -0.660∗∗∗ -0.645∗∗∗ -0.664∗∗∗ -0.632∗∗∗ -0.611∗∗∗ -0.590∗∗∗ -0.617∗∗∗ -0.650∗∗∗
(0.0697) (0.0696) (0.0706) (0.0687) (0.0685) (0.0683) (0.0680) (0.0698)Bureaucratic quality index 0.198
(0.121)Bureaucratic quality · peace years -0.217∗∗∗
(0.0577)Rule of law index 0.104
(0.130)Rule of law · peace years -0.169∗∗
(0.0598)Corruption index 0.193
(0.125)Corruption · peace years -0.212∗∗∗
(0.0605)Economic policies index 0.0111
(0.0990)Economic policies · peace years -0.133∗∗
(0.0505)Military influence index -0.0235
(0.100)Military influence · peace years -0.108∗
(0.0502)Pol. exclusion and rep. Index -0.300∗∗
(0.0951)Pol. excl. · peace years 0.0479
(0.0514)Formal inst. index 0.294∗∗
(0.103)Formal inst · peace years -0.0989∗
(0.0504)Governance index, t-1 0.0934
(0.128)Governance index · peace years -0.167∗∗
(0.0584)Log population 0.378∗∗∗ 0.375∗∗∗ 0.371∗∗∗ 0.393∗∗∗ 0.385∗∗∗ 0.358∗∗∗ 0.378∗∗∗ 0.374∗∗∗
(0.0541) (0.0536) (0.0535) (0.0541) (0.0536) (0.0551) (0.0537) (0.0536)log GDP per capita, t-1 -0.129 -0.128 -0.145 -0.101 -0.134 -0.166 -0.254∗ -0.125
(0.120) (0.115) (0.114) (0.112) (0.106) (0.104) (0.107) (0.117)PKO, traditional -0.00279 0.0322 0.00346 0.0415 0.0192 -0.0240 -0.0244 0.0200
(0.227) (0.226) (0.227) (0.226) (0.227) (0.228) (0.230) (0.226)PKO, transformational -0.660 -0.709 -0.683 -0.745 -0.795 -0.942 -0.891 -0.714
(0.475) (0.476) (0.474) (0.477) (0.479) (0.482) (0.476) (0.475)Neighbor conflict, t-1 0.362∗ 0.347∗ 0.362∗ 0.335∗ 0.347∗ 0.289 0.341∗ 0.344∗
(0.155) (0.154) (0.153) (0.153) (0.152) (0.153) (0.153) (0.154)Ethnic dominance 0.336∗ 0.347∗ 0.336∗ 0.369∗ 0.372∗ 0.364∗ 0.380∗ 0.352∗
(0.150) (0.151) (0.151) (0.149) (0.149) (0.150) (0.150) (0.150)Ig region 2 0.0344 0.0854 0.0603 0.0593 0.0720 0.104 0.0940 0.0712
(0.301) (0.305) (0.301) (0.308) (0.301) (0.308) (0.307) (0.305)Ig region 3 -0.599 -0.531 -0.552 -0.654∗ -0.500 -0.454 -0.710∗ -0.537
(0.325) (0.330) (0.326) (0.318) (0.322) (0.318) (0.319) (0.331)Ig region 5 -0.982 -0.973 -0.989 -1.036 -0.867 -0.936 -0.959 -0.963
(0.547) (0.551) (0.551) (0.550) (0.557) (0.562) (0.543) (0.552)Ig region 6 -0.515 -0.532 -0.512 -0.547 -0.490 -0.487 -0.513 -0.537
(0.582) (0.591) (0.585) (0.597) (0.589) (0.594) (0.592) (0.590)Ig region 7 0.00184 0.00266 0.0349 -0.0534 0.0399 0.0131 0.110 -0.00255
(0.401) (0.395) (0.397) (0.397) (0.397) (0.404) (0.400) (0.394)Ig region 8 -0.150 -0.118 -0.130 -0.160 -0.0789 -0.248 -0.0176 -0.124
(0.445) (0.445) (0.444) (0.451) (0.453) (0.478) (0.454) (0.445)Ig region 9 0.362 0.369 0.369 0.243 0.348 0.113 0.602 0.346
(0.381) (0.388) (0.384) (0.388) (0.384) (0.400) (0.395) (0.391)Ig region 10 0.634 0.644 0.643 0.694∗ 0.848∗ 0.835∗ 0.745∗ 0.649
(0.343) (0.341) (0.341) (0.342) (0.345) (0.338) (0.344) (0.341)Ig region 11 -0.0123 0.0116 -0.00725 -0.00101 0.0179 0.136 -0.0215 -0.00518
(0.365) (0.370) (0.370) (0.367) (0.362) (0.370) (0.366) (0.368)Ig region 12 -0.305 -0.307 -0.335 -0.336 -0.346 -0.272 -0.318 -0.328
(0.358) (0.359) (0.359) (0.359) (0.355) (0.364) (0.358) (0.358)Ig region 13 0.429 0.405 0.391 0.390 0.476 0.415 0.442 0.400
(0.391) (0.386) (0.389) (0.385) (0.389) (0.390) (0.388) (0.386)Ig region 14 0.0152 -0.00716 -0.0401 -0.0513 -0.00505 -0.272 0.0533 -0.0191
(0.397) (0.394) (0.403) (0.396) (0.396) (0.416) (0.398) (0.393)Ig region 15 0.0855 0.127 0.0664 0.102 0.178 0.119 0.122 0.125
(0.401) (0.400) (0.402) (0.399) (0.400) (0.403) (0.392) (0.399)Ig region 16 -0.0555 -0.0528 -0.0942 -0.0886 0.0182 -0.104 -0.125 -0.0461
(0.399) (0.393) (0.399) (0.390) (0.397) (0.402) (0.391) (0.394)Ig region 17 0.0334 0.136 0.0774 0.0851 0.148 0.0697 0.0540 0.122
(0.348) (0.340) (0.348) (0.339) (0.337) (0.343) (0.334) (0.343)Ig region 18 -0.135 -0.122 -0.117 -0.180 -0.0320 -0.0370 0.0889 -0.131
(0.440) (0.440) (0.437) (0.446) (0.450) (0.447) (0.448) (0.441)Ig region 19 -0.546 -0.563 -0.587 -0.526 -0.505 -0.482 -0.524 -0.580
(0.626) (0.627) (0.623) (0.647) (0.641) (0.631) (0.640) (0.632)Ig region 20 -0.604 -0.625 -0.601 -0.674 -0.638 -0.582 -0.704 -0.621
(0.444) (0.444) (0.438) (0.448) (0.448) (0.452) (0.444) (0.446)Ig region 21 0.192 0.257 0.251 0.209 0.347 0.412 -0.0143 0.265
(0.506) (0.505) (0.491) (0.493) (0.503) (0.490) (0.501) (0.512)Ig region 22 -0.634 -0.674 -0.642 -0.726 -0.714 -0.747∗ -0.687 -0.692
(0.377) (0.376) (0.376) (0.382) (0.378) (0.380) (0.373) (0.374)Ig region 23 -0.372 -0.384 -0.383 -0.362 -0.384 -0.246 -0.349 -0.383
(0.402) (0.400) (0.396) (0.408) (0.398) (0.405) (0.404) (0.401)Ig region 24 0.153 0.188 0.216 0.183 0.248 0.332 0.129 0.195
(0.375) (0.371) (0.368) (0.376) (0.372) (0.370) (0.367) (0.375)Intercept -4.636∗∗∗ -4.659∗∗∗ -4.451∗∗∗ -5.032∗∗∗ -4.815∗∗∗ -4.309∗∗∗ -3.717∗∗∗ -4.665∗∗∗
(1.099) (1.030) (1.014) (1.014) (0.945) (0.914) (0.946) (1.038)aic 2260.9 2266.7 2262.4 2265.9 2267.8 2264.8 2267.7 2266.7ll -1096.4 -1099.4 -1097.2 -1099.0 -1099.9 -1098.4 -1099.8 -1099.3N 6698 6698 6698 6698 6698 6698 6698 6698
Standard errors in parenthesesEstimation also includes 23 regional dummies, results not shown∗ p < 0.05, ∗∗ p < 0.01, ∗∗∗ p < 0.001
11

Table A-3: Conflict relapse and governance, major internal conflicts only, 1960–2008
(1) (2) (3) (4) (5) (6) (7) (8)Bureaucracy Rule of law Corruption Economics Military Exclusion Formal Governance
warConflict, t-1 1.782∗∗∗ 1.676∗∗∗ 1.856∗∗∗ 1.757∗∗∗ 1.760∗∗∗ 1.521∗∗∗ 1.815∗∗∗ 1.685∗∗∗
(0.422) (0.419) (0.425) (0.421) (0.423) (0.424) (0.423) (0.422)War, t-1 4.599∗∗∗ 4.440∗∗∗ 4.730∗∗∗ 4.536∗∗∗ 4.611∗∗∗ 4.233∗∗∗ 4.683∗∗∗ 4.470∗∗∗
(0.423) (0.422) (0.425) (0.423) (0.424) (0.429) (0.422) (0.425)ln(Peace years) -0.510∗∗ -0.464∗∗ -0.545∗∗ -0.501∗∗ -0.524∗∗ -0.469∗∗ -0.552∗∗ -0.495∗∗
(0.179) (0.178) (0.184) (0.177) (0.180) (0.178) (0.183) (0.179)Bureaucratic quality index -0.382∗
(0.171)Bureaucratic quality · peace years 0.0549
(0.126)Rule of law index -0.696∗∗∗
(0.195)Rule of law · peace years 0.143
(0.128)Corruption index -0.0368
(0.175)Corruption · peace years -0.0945
(0.139)Economic policies index -0.344∗∗
(0.128)Economic policies · peace years 0.0974
(0.112)Military influence index -0.170
(0.135)Military influence · peace years 0.113
(0.115)Pol. exclusion and rep. Index -0.525∗∗∗
(0.129)Pol. excl. · peace years 0.101
(0.124)Formal inst. index -0.103
(0.139)Formal inst · peace years -0.0488
(0.114)Governance index, t-1 -0.581∗∗
(0.188)Governance index · peace years 0.0582
(0.130)Log population 0.124 0.131 0.0876 0.133 0.106 0.0772 0.0997 0.124
(0.0958) (0.0976) (0.0946) (0.0958) (0.0953) (0.0998) (0.0951) (0.0970)log GDP per capita, t-1 -0.353 -0.305 -0.534∗∗ -0.372∗ -0.556∗∗ -0.572∗∗ -0.518∗∗ -0.277
(0.201) (0.191) (0.192) (0.190) (0.175) (0.176) (0.184) (0.197)PKO, traditional -0.888∗∗ -0.864∗∗ -0.956∗∗ -0.930∗∗ -0.967∗∗ -1.071∗∗∗ -0.950∗∗ -0.896∗∗
(0.319) (0.322) (0.319) (0.320) (0.317) (0.321) (0.320) (0.320)PKO, transformational -2.082∗ -2.109∗ -2.089∗ -1.911∗ -2.200∗ -2.234∗ -2.093∗ -2.151∗
(0.902) (0.908) (0.910) (0.899) (0.914) (0.919) (0.915) (0.918)Neighbor conflict, t-1 0.488 0.498 0.560∗ 0.528 0.546 0.580∗ 0.560∗ 0.505
(0.286) (0.289) (0.283) (0.286) (0.284) (0.289) (0.283) (0.288)Ethnic dominance 0.322 0.392 0.353 0.353 0.336 0.261 0.347 0.310
(0.271) (0.273) (0.272) (0.270) (0.271) (0.283) (0.271) (0.273)Intercept -3.302 -3.864∗ -1.372 -3.123 -1.333 -0.973 -1.525 -3.893∗
(1.877) (1.789) (1.715) (1.773) (1.582) (1.571) (1.657) (1.834)aic 1066.6 1058.5 1071.0 1064.5 1069.7 1054.0 1070.6 1061.7ll -499.3 -495.2 -501.5 -498.2 -500.9 -493.0 -501.3 -496.9N 6698 6698 6698 6698 6698 6698 6698 6698
Standard errors in parenthesesEstimation also includes 23 regional dummies, results not shown∗ p < 0.05, ∗∗ p < 0.01, ∗∗∗ p < 0.001
12