Gordon R. Cunningham - alliedreit.com · Michael’s Hospital ... 3575 Saint-Laurent, MONTRÉAL 26...
22
1 Focused Focused Dependable Dependable Durable Durable Gordon R. Cunningham Gordon R. Cunningham CHAIRMAN CHAIRMAN
Transcript of Gordon R. Cunningham - alliedreit.com · Michael’s Hospital ... 3575 Saint-Laurent, MONTRÉAL 26...

1
FocusedFocused
DependableDependable
DurableDurable
Gordon R. CunninghamGordon R. CunninghamCHAIRMANCHAIRMAN

2
FocusedFocused
DependableDependable
DurableDurable
Michael EmoryMichael EmoryPRESIDENT & CEOPRESIDENT & CEO

3
5
AgendaAgenda
COMPANY OVERVIEW
OUTLOOK
Q1 FINANCIAL RESULTS
6
Forward-Looking StatementsForward-Looking Statements
This presentation may contain “forward looking”information about future events or the REIT’s future
performance. This information, by its nature, is subject to risks and uncertainties that may cause actual events or results to differ materially, including those described
under the heading “Risks and Uncertainties” in our most recently filed AIF. Material assumptions that
underpin any forward-looking statements I make include those described under “Forward Looking Disclaimer” in
our MD&A for the first quarter of 2009.

4
The First Six YearsThe First Six Years
8
VisionVision
Consolidate Ownership & OperationConsolidate Ownership & Operation
of Highly Fragmentedof Highly Fragmented
Class I SegmentClass I Segment
of Canadian Urban Office Marketof Canadian Urban Office Market

5
9
Enterprise ValueEnterprise Value
20032003
20092009
$125 M$125 M
$1 B$1 BCAGR 39%CAGR 39%
8X GROWTH8X GROWTH Over 6 yearsOver 6 years
10
Portfolio GrowthPortfolio Growth
(square feet)(square feet)
GROSS LEASEABLE AREAGROSS LEASEABLE AREA
NUMBER OF PROPERTIESNUMBER OF PROPERTIES 3737 5656 7070 81811414 2222

6
11
Market Leading PortfolioMarket Leading Portfolio
MARKETSMARKETS
Current PortfolioCurrent Portfolio
WINNIPEGWINNIPEG
7Properties
7Properties
387,064Sq.Ft.
387,064Sq.Ft.
TORONTOTORONTO
56Properties
56Properties
2,735,244Sq.Ft.
2,735,244Sq.Ft.
MONTRÉALMONTRÉAL
13Properties
13Properties
2,028,958Sq.Ft.
2,028,958Sq.Ft.
QUÉBEC CITYQUÉBEC CITY
5Properties
5Properties
183,445Sq.Ft.
183,445Sq.Ft.
12
Executed Our StrategyExecuted Our Strategy
Very Strong PortfolioVery Strong Portfolio
Growing Cash FlowGrowing Cash Flow
Multiple Value Creation OpportunitiesMultiple Value Creation Opportunities

7
13
Very Strong PortfolioVery Strong Portfolio
Growing Cash FlowGrowing Cash Flow
Multiple Value Creation OpportunitiesMultiple Value Creation Opportunities
Executed Our StrategyExecuted Our Strategy
VISIONVISION
PLATFORMPLATFORM
OPERATIONAL FIREPOWEROPERATIONAL FIREPOWER
ACCESS TO CAPITALACCESS TO CAPITAL
CREATE UNITHOLDER VALUECREATE UNITHOLDER VALUE
14
Financial GrowthFinancial Growth
1.24 1.26
1.51 1.53
1.14 1.18 1.22 1.26 1.32
2004 2005 2006 2007 2008
AFFO/unit (basic) Actual distributions/unit
1.24 1.26
1.51 1.53
1.14 1.18 1.22 1.26 1.32
2004 2005 2006 2007 2008
AFFO/unit (basic) Actual distributions/unit
DISTRIBUTIONSDISTRIBUTIONS
($)($)
1.131.13

8
15
50%55%60%65%70%75%80%85%90%95%
100%
Q4 03 Q4 04 Q4 05 Q4 06 Q4 07 Q4 0850%55%60%65%70%75%80%85%90%95%
100%
Q4 03 Q4 04 Q4 05 Q4 06 Q4 07 Q4 08
Consistent High OccupancyConsistent High Occupancy
16
High Quality TenantsHigh Quality Tenants
49.4
38.936.5
30.0
24.7 23.526.1
IPO 2004 2005 2006 2007 2008 Q1/09
49.4
38.936.5
30.0
24.7 23.526.1
IPO 2004 2005 2006 2007 2008 Q1/09
TOP 10 TENANTS AS % OF RENTAL REVENUE
TOP 10 TENANTS AS % OF RENTAL REVENUE
CGICGI
DesjardinsDesjardins
CossetteCossette
SAP LabsSAP Labs
MotorolaMotorola
St. Michael’s HospitalSt. Michael’s Hospital
Indigo Books & MusicIndigo Books & Music
Autodesk CanadaAutodesk Canada
Publicis TorontoPublicis Toronto
5.5%5.5%
3.7%3.7%
2.3%2.3%
2.0%2.0%
2.2%2.2%
1.7%1.7%
1.7%1.7%
1.5%1.5%
1.4%1.4%
TOTALTOTAL 26.1%26.1%
TOP 10 TENANTSTOP 10 TENANTS % OF RENTAL REVENUE
% OF RENTAL REVENUE
UbisoftUbisoft 4.1%4.1%

9
17
Diversity by TenantDiversity by Tenant
Media & entertainment
15.7%
Business service & professional
28.9%
Telecom & IT24.0%
Retail (head office & storefront)
15.1%
Government3.0%
Financial services5.9%
Other7.4%
18
Lease Maturity ScheduleLease Maturity Schedule
9.4%
19.9%
16.0%14.0% 13.3%
2009 2010 2011 2012 2013
9.4%
19.9%
16.0%14.0% 13.3%
2009 2010 2011 2012 2013
(as % of GLA)(as % of GLA)
AVERAGE OF 14.8% OVER 5 YEARSAVERAGE OF 14.8% OVER 5 YEARS

10
19
EvolutionEvolution
INTERNALIZED PROPERTY MANAGEMENT IN 2005INTERNALIZED PROPERTY MANAGEMENT IN 2005
INTERNALIZED DEVELOPMENT IN 2006INTERNALIZED DEVELOPMENT IN 2006
NOW FULLY INTERNALIZEDNOW FULLY INTERNALIZED
EXPECT TO QUALIFY FOR REIT EXEMPTION FROM TAXATION ON INCOME TRUSTS IN 2011EXPECT TO QUALIFY FOR REIT EXEMPTION
FROM TAXATION ON INCOME TRUSTS IN 2011
Looking ForwardLooking Forward

11
21
Continued Consolidation Continued Consolidation
Committed to consolidating ownership of Class I within our target marketsPlan to expand to other target markets Awaiting exceptional opportunities as a result of current economic conditions
Committed to consolidating ownership of Class I within our target marketsPlan to expand to other target markets Awaiting exceptional opportunities as a result of current economic conditions
22
Continued ConsolidationContinued Consolidation
Desirable venue for investmentCorrection underway
Desirable venue for investmentCorrection underway
VANCOUVERVANCOUVER

12
23
Adding ValueAdding Value
U P G R A D E
R E D E V E L O P M E N T
I N T E N S I F I C A T I O N
D E V E L O P M E N T
24
Adding ValueAdding Value
U P G R A D EU P G R A D E
R E D E V E L O P M E N T
I N T E N S I F I C A T I O N
D E V E L O P M E N T

13
25
Adding Value - UpgradeAdding Value - Upgrade
Reduced number of tenantsImproved tenant qualityBoosted NOI
Reduced number of tenantsImproved tenant qualityBoosted NOI
The Balfour Building3575 Saint-Laurent, MONTRÉAL
The Balfour Building3575 Saint-Laurent, MONTRÉAL
26
Adding ValueAdding Value
R E D E V E L O P M E N TR E D E V E L O P M E N T
I N T E N S I F I C A T I O N
D E V E L O P M E N T
U P G R A D E

14
27
96 Spadina AveTORONTO
96 Spadina AveTORONTO
255 Adelaide WTORONTO
255 Adelaide WTORONTO
QRC SouthTORONTOQRC SouthTORONTO
Adding Value - RedevelopmentAdding Value - Redevelopment
28
Adding ValueAdding Value
I N T E N S I F I C A T I O NI N T E N S I F I C A T I O N
D E V E L O P M E N T
U P G R A D E
R E D E V E L O P M E N T
15
29
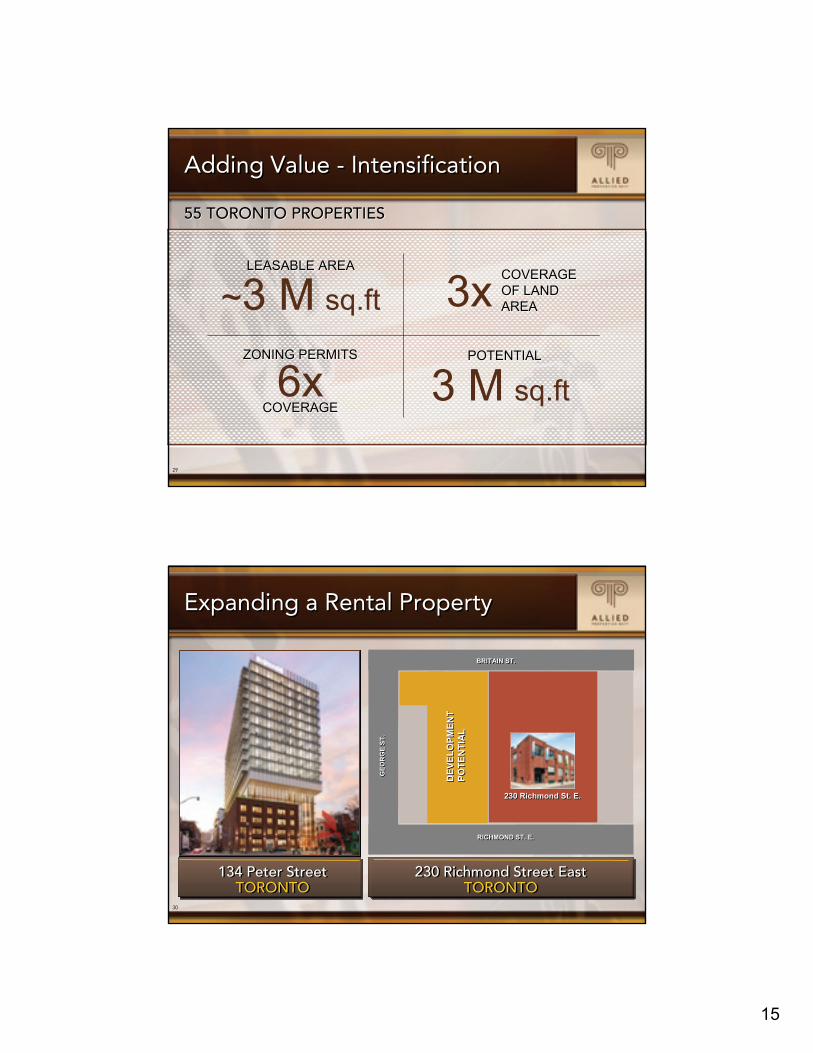
Adding Value - IntensificationAdding Value - Intensification
55 TORONTO PROPERTIES55 TORONTO PROPERTIES
LEASABLE AREALEASABLE AREA
~3 M sq.ftCOVERAGE OF LAND AREA
COVERAGE OF LAND AREA3x
ZONING PERMITSZONING PERMITS
6xPOTENTIALPOTENTIAL
3 M sq.ftCOVERAGECOVERAGE
30
RICHMOND ST. E.RICHMOND ST. E.
BRITAIN ST.BRITAIN ST.
GEO
RG
E ST
.G
EOR
GE
ST.
230 Richmond St. E.230 Richmond St. E.
Expanding a Rental PropertyExpanding a Rental Property
134 Peter StreetTORONTO
134 Peter StreetTORONTO
230 Richmond Street EastTORONTO
230 Richmond Street EastTORONTO
DEV
ELO
PMEN
T PO
TEN
TIAL
DEV
ELO
PMEN
T PO
TEN
TIAL

16
31
Adding ValueAdding Value
D E V E L O P M E N TD E V E L O P M E N T
U P G R A D E
R E D E V E L O P M E N T
I N T E N S I F I C A T I O N
32
Adding Value - DevelopmentAdding Value - Development
Demandfor
NewHuman Scale
GreenOffice
Buildings
Demandfor
NewHuman Scale
GreenOffice
Buildings

17
33
Adding Value - DevelopmentAdding Value - Development
544 King Street West, TORONTO544 King Street West, TORONTO
34
Development UpdateDevelopment Update
Zoning variances134 Peter received
544 King in late May
Focus on 134 Peter
Pre-leasing thresholds required prior to commencement
Zoning variances134 Peter received
544 King in late May
Focus on 134 Peter
Pre-leasing thresholds required prior to commencement
PRUDENT APPROACH MOVING FORWARD PRUDENT APPROACH MOVING FORWARD
18
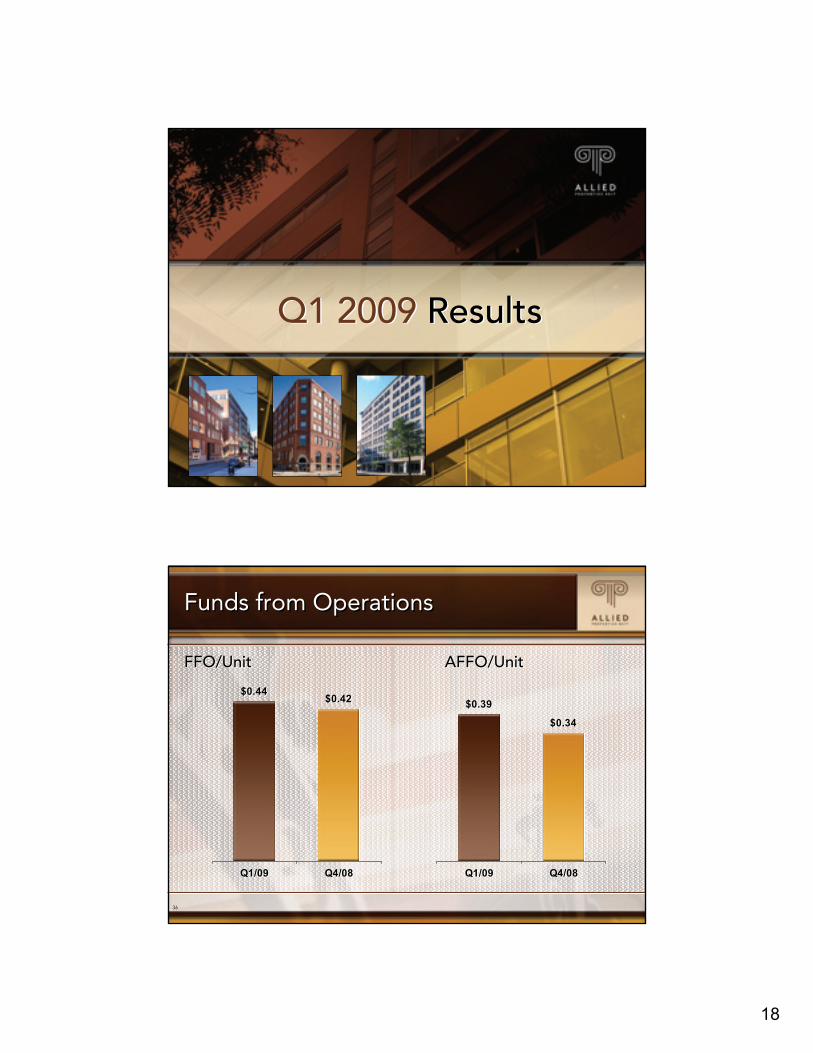
Q1 2009 ResultsQ1 2009 Results
36
Funds from OperationsFunds from Operations
$0.44$0.42
Q1/09 Q4/08
$0.44$0.42
Q1/09 Q4/08
FFO/UnitFFO/Unit AFFO/UnitAFFO/Unit
$0.39
$0.34
Q1/09 Q4/08
$0.39
$0.34
Q1/09 Q4/08
19
37
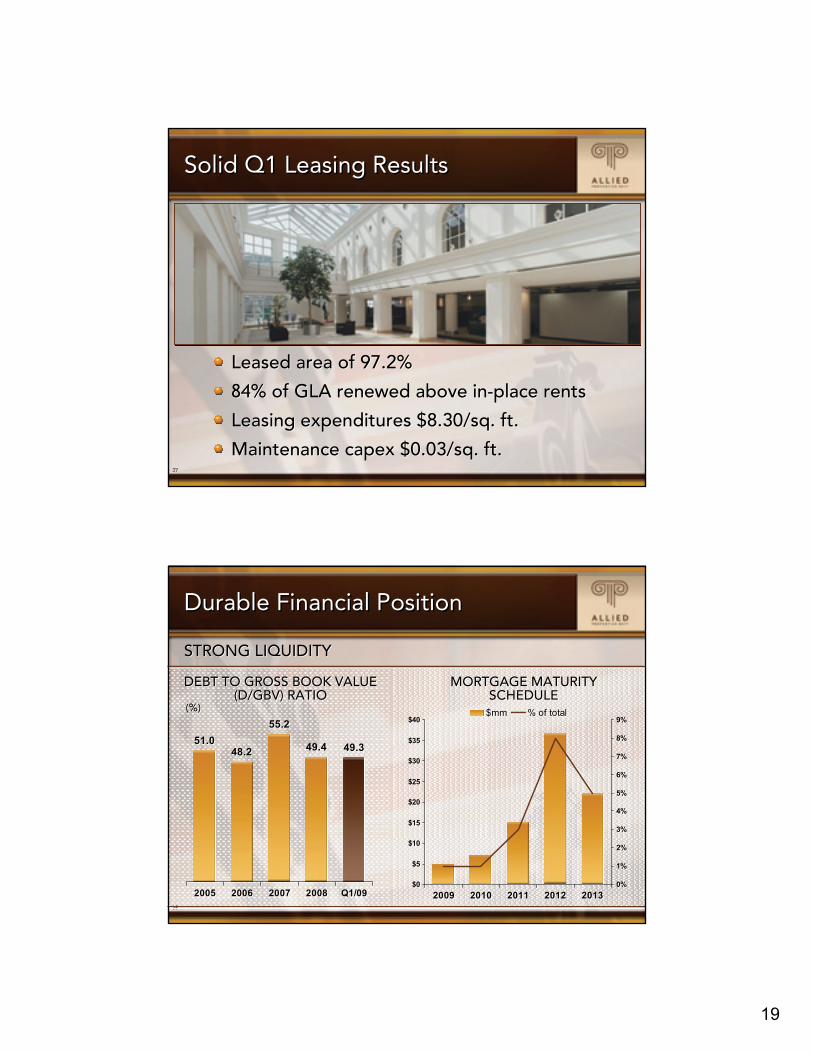
Solid Q1 Leasing ResultsSolid Q1 Leasing Results
Leased area of 97.2%
84% of GLA renewed above in-place rents
Leasing expenditures $8.30/sq. ft.
Maintenance capex $0.03/sq. ft.
Leased area of 97.2%
84% of GLA renewed above in-place rents
Leasing expenditures $8.30/sq. ft.
Maintenance capex $0.03/sq. ft.
38
51.048.2
55.2
49.4 49.3
2005 2006 2007 2008 Q1/09
51.048.2
55.2
49.4 49.3
2005 2006 2007 2008 Q1/09$0
$5
$10
$15
$20
$25
$30
$35
$40
2009 2010 2011 2012 20130%
1%
2%
3%
4%
5%
6%
7%
8%
9%$mm % of total
$0
$5
$10
$15
$20
$25
$30
$35
$40
2009 2010 2011 2012 20130%
1%
2%
3%
4%
5%
6%
7%
8%
9%$mm % of total
DEBT TO GROSS BOOK VALUE (D/GBV) RATIO
DEBT TO GROSS BOOK VALUE (D/GBV) RATIO
Durable Financial PositionDurable Financial Position
STRONG LIQUIDITYSTRONG LIQUIDITY
MORTGAGE MATURITY SCHEDULE
MORTGAGE MATURITY SCHEDULE
(%)(%)
20
39
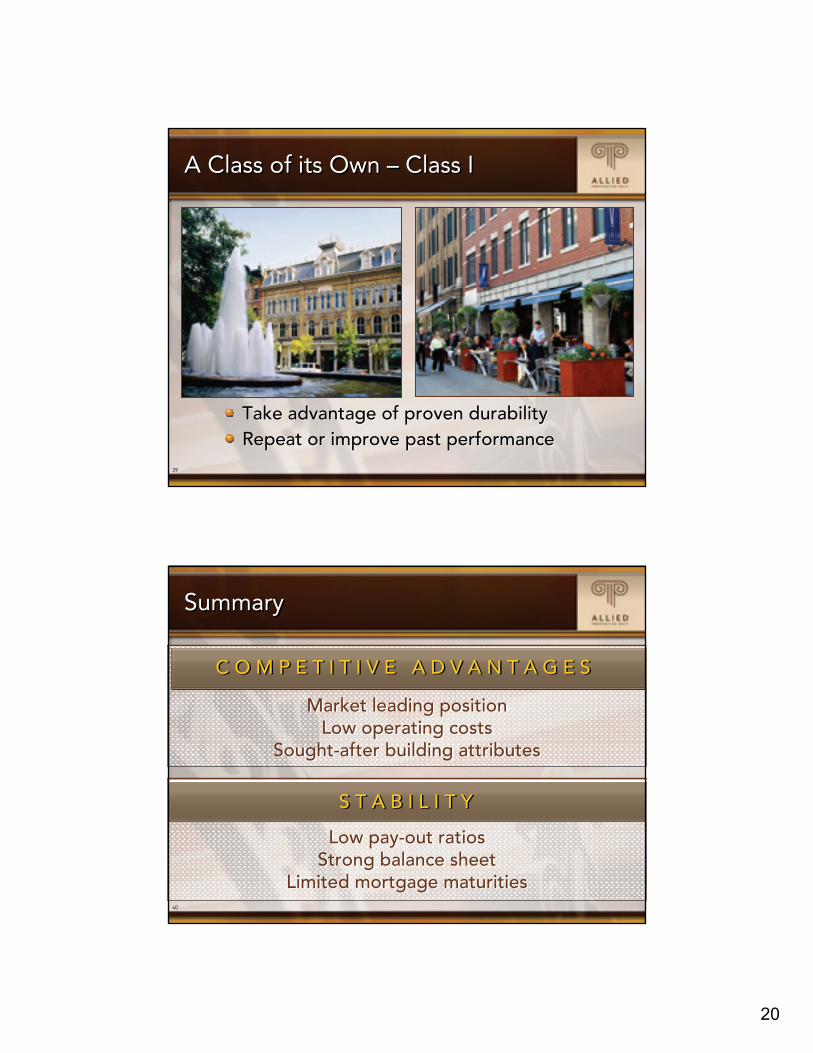
A Class of its Own – Class IA Class of its Own – Class I
Take advantage of proven durabilityRepeat or improve past performanceTake advantage of proven durabilityRepeat or improve past performance
40
S T A B I L I T YS T A B I L I T Y
C O M P E T I T I V E A D V A N T A G E S C O M P E T I T I V E A D V A N T A G E S
SummarySummary
Market leading positionLow operating costs
Sought-after building attributes
Market leading positionLow operating costs
Sought-after building attributes
Low pay-out ratiosStrong balance sheet
Limited mortgage maturities
Low pay-out ratiosStrong balance sheet
Limited mortgage maturities

21
41
President & CEOPresident & CEO
MICHAEL R. EMORYMICHAEL R. EMORY
MIKE ALLENMIKE ALLEN
VP & CFOVP & CFO Director Management Information Services
Director Management Information Services
TOM WENNERTOM WENNER
MARIANNE O’LEARYMARIANNE O’LEARY
Experienced Management TeamExperienced Management Team
Executive VPExecutive VP Senior VP, Real Estate Operations
Senior VP, Real Estate Operations
WAYNE L. JACOBSWAYNE L. JACOBS
42
Chairman, Cumberland Private Wealth Management Inc.
Chairman, Cumberland Private Wealth Management Inc.
GERALD R. CONNORGERALD R. CONNOR
ROBERT W. MARTINROBERT W. MARTIN
President, KLC Capital Investment CorporationPresident, KLC Capital
Investment Corporation Corporate DirectorCorporate Director
JAMES GRIFFITHSJAMES GRIFFITHS
MICHAEL R. EMORYMICHAEL R. EMORY
Experienced TrusteesExperienced Trustees
Corporate DirectorCorporate Director
GORDON R. CUNNINGHAMGORDON R. CUNNINGHAM
President & CEO of the TrustPresident & CEO of the Trust
DANIEL F. SULLIVANDANIEL F. SULLIVAN
Chartered Accountant and Tax Advisor
Chartered Accountant and Tax Advisor
Consul General of Canada in New York
Consul General of Canada in New York
RALPH T. NEVILLERALPH T. NEVILLE

22
43
Investment StrengthsInvestment Strengths
Pure Play Class I Office REITPure Play Class I Office REIT
Market-Leading Property PortfolioMarket-Leading Property Portfolio
Solid Distribution GrowthSolid Distribution Growth
Exceptional Potential to Add Value Exceptional Potential to Add Value
Skilled & Fully Aligned ManagementSkilled & Fully Aligned Management
FocusedFocused
DependableDependable
DurableDurable


![[Gordon R. Freeman and Phyllis J. Freeman] Stonehenge Archeology](https://static.fdocuments.us/doc/165x107/5571f81e49795991698cacea/gordon-r-freeman-and-phyllis-j-freeman-stonehenge-archeology.jpg)