goodrich Gabelli_9.7.06
23
1 Gabelli 11 th Annual Aircraft Supplier Conference September 7, 2006 Paul Gifford Vice President – Investor Relations
-
Upload
finance44 -
Category
Economy & Finance
-
view
336 -
download
7
Transcript of goodrich Gabelli_9.7.06

1
Gabelli11th Annual Aircraft Supplier
Conference
September 7, 2006
Paul GiffordVice President – Investor Relations

2
Certain statements made in this presentation are forward-looking statements within the meaning of the Private Securities Litigation Reform Act of 1995 regarding the Company's future plans, objectives and expected performance. The Company cautions readers that any such forward-looking statements are based on assumptions that the Company believes are reasonable, but are subject to a wide range of risks, and actual results may differ materially.
Important factors that could cause actual results to differ include, but are not limited to: demand for and market acceptance of new and existing products, such as the Airbus A350 and A380, the Boeing 787 Dreamliner, the Embraer 190, the Dassault Falcon 7X, and the Lockheed Martin F-35 Lightning II and F-22 Raptor; the health of the commercial aerospace industry, including the impact of bankruptcies in the airline industry; global demand for aircraft spare parts and aftermarket services; and other factors discussed in the Company's filings with the Securities and Exchange Commission and in the Company's July 27, 2006 Second Quarter 2006 Results press release.
The Company cautions you not to place undue reliance on the forward-looking statements contained in this presentation, which speak only as of the date on which such statements were made. The Company undertakes no obligation to release publicly any revisions to these forward-looking statements to reflect events or circumstances after the date on which such statements were made or to reflect the occurrence of unanticipated events.
Forward Looking Statements

3
Goodrich Value Proposition and Key Performance Drivers

4
Company Overview - Goodrich
GR Portfolio AttributesGR Portfolio AttributesProprietary productsNon-discretionary repair / replacement cyclesLarge installed base drives aftermarket salesParticipation on every large commercial and regional jet platformSignificant defense & space presence
ResultsResultsMore predictable revenue and income growthSignificant margin potentialSustainable leadership positionsDiverse product portfolio and balanced customer base

5
Great market positions
Good top line growth
Substantial margin improvement opportunity
Significant cash flow improvement expected in 2007
Sustainable income growth beyond the OE cycle
The Value Proposition for Goodrich2006 – 2010 Expectations

6
Goodrich – Key MarketLeadership Positions
$5.4B$10.5B$9.7B$16.5B2005 Aerospace Sales
Sensors
Cargo Systems
APUs
Wheel/BrakesEvacuation Systems
Lighting
Space Systems
Landing GearEnvironmental ControlsFlight Ctrl/ActuationElectronic ControlsAvionics
Power GenerationEnginesNacelles
GoodrichHONSAFRANUTC
Aerospace Focus Aerospace Focus -- Leadership Positions Leadership Positions -- Global Presence Global Presence -- Broad Systems Capability Broad Systems Capability -- Highly Engineered ProductsHighly Engineered Products
Goodrich has the broadest portfolio of system leadership positions;with approximately 85% of sales in markets with #1 or #2 positions world-wide

7
First Half 2006 Sales by Market ChannelTotal Sales $2,907M
Large Commercial AircraftAftermarket
27%
Regional, Business & General Aviation Aftermarket
7%
Boeing Commercial OE
9%
Airbus Commercial OE
17%
Defense & Space, OE & Aftermarket
24%
Other 6%
Heavy A/CMaint.
3%
OE
AM
Balanced business mix
Regional, Business & Gen.
Av. OE7%
Total Commercial Aftermarket37%
Total Commercial OE33%
Total Defense and Space24%

8
Top Line Growth -Large Commercial OE Market
2006 orders expected to be higher than deliveries – many for deliveries beyond 2008
Both manufacturers continue to increase production rates and deliveries
Airbus fleet growing faster than Boeing fleet
Sustained, steady growth will benefit both suppliers and manufacturers
Overall active fleet continues to increase
0
200
400
600
800
1990
1991
1992
1993
1994
1995
1996
1997
1998
1999
2000
2001
2002
2003
2004
2005
2006
Est
2007
Est
Airbus Boeing
Air
craf
t D
eliv
erie
s
Source: GR Estimates
Active Passenger Fleet - 2005 Active Passenger Fleet – 2014 (Est.)
Boeing76%
Airbus24%
Boeing63%
Airbus37%
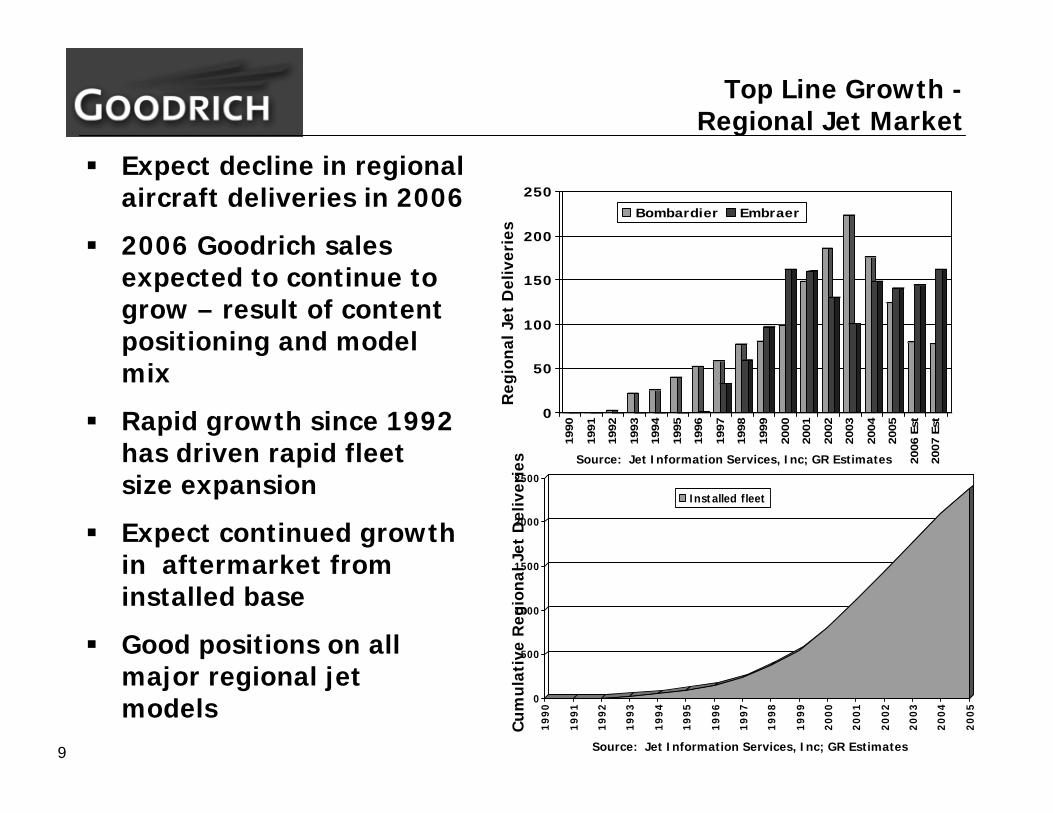
9
Top Line Growth -Regional Jet Market
Expect decline in regional aircraft deliveries in 2006
2006 Goodrich sales expected to continue to grow – result of content positioning and model mix
Rapid growth since 1992 has driven rapid fleet size expansion
Expect continued growth in aftermarket from installed base
Good positions on all major regional jet models
0
50
100
150
200
250
1990
1991
1992
1993
1994
1995
1996
1997
1998
1999
2000
2001
2002
2003
2004
2005
2006
Est
2007
Est
Bombardier Embraer
Reg
iona
l Jet
Del
iver
ies
0
500
1000
1500
2000
2500
19
90
19
91
19
92
19
93
19
94
19
95
19
96
19
97
19
98
19
99
20
00
20
01
20
02
20
03
20
04
20
05
Installed fleet
Cu
mu
lati
ve R
egio
nal J
et D
eliv
erie
s Source: Jet Information Services, Inc; GR Estimates
Source: Jet Information Services, Inc; GR Estimates

10
0
5000
10000
15000
20000
25000
30000
35000
1995
1997
1999
2001
2003
2005
2007
Est
2009
Est
2011
Est
2013
Est
2015
Est
Installed fleet
Top Line Growth -Aftermarket Products and Services
Driven by ASMs, fleet size, fleet age & GDP
Goodrich 2006 sales growth expected to continue to be above ASM growth rates
RPM and ASM growth expected to be about the same for 2006 - 2010
World fleet expected to continue to grow
Strong aftermarket trends expected to assist Goodrich margin expansion
-4.00%
-2.00%
0.00%
2.00%
4.00%
6.00%
8.00%
10.00%
12.00%
14.00%
1991
1992
1993
1994
1995
1996
1997
1998
1999
2000
2001
2002
2003
2004
2005
2006
Est
2007
Est
2008
Est
2009
Est
2010
Est
ASMs RPMs
Above average growth rates possible over next several years
World ASM and RPM Percent Change, Year Over Year
Source: The Airline Monitor
Total Aircraft in World Fleet
11
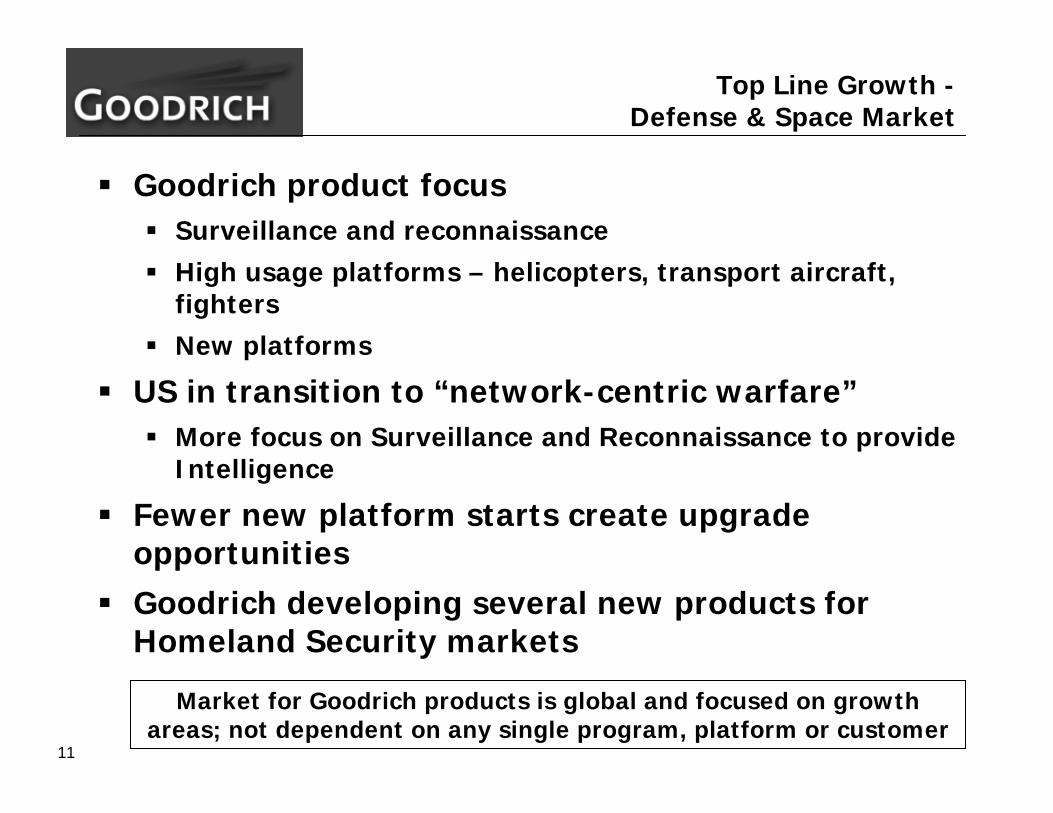
Top Line Growth -Defense & Space Market
Goodrich product focusSurveillance and reconnaissanceHigh usage platforms – helicopters, transport aircraft, fightersNew platforms
US in transition to “network-centric warfare”More focus on Surveillance and Reconnaissance to provide Intelligence
Fewer new platform starts create upgrade opportunitiesGoodrich developing several new products for Homeland Security markets
Market for Goodrich products is global and focused on growth areas; not dependent on any single program, platform or customer

12
Sales by Market Channel Second Quarter 2006 Change Analysis
2Q 2006 vs. 2Q 2005
IGT, Other
Aircraft aging, Parked Fleet
US, UK Defense Budgets
ASMs, Age, Cycles, Fleet size
Aircraft Deliveries
Aircraft Deliveries
Primary Market Drivers
(4%)7%(6%)Defense and Space –OE and Aftermarket
4%
(8%)
11%
8%
(2%)
--
2Q 2006 vs. 1Q 2006
Actual Goodrich Change Comparisons
5%(3%)Other
23%24%Regional, Business & General Aviation - OE
11%
(25%)
18%
22%
First Half 2006 vs. First Half
2005
(19%)Heavy Airframe Maintenance
10%Goodrich Total Sales
20%
Aftermarket – Large Commercial and Regional, Business and GA
18%Boeing and Airbus –OE Production
Market Channel

13
2006 Sales ExpectationsBy Market Channel
~5%Other6%
OE - Positions on funded platforms worldwide, new products provide stable growth Aftermarket - Platform utilization, upgrade opportunities support long-term growth
Flat to slightly down
Approx. Flat
Defense and Space OE and Aftermarket
28%
7 - 8%
Flat to slightly down
~10%
>10%
~15%(Due to delivery
lead times)
2006 Goodrich Growth
~7%
5%
~5%
0-5%
36%10%19%
2006Market Growth
Goodrich operating near capacity, sales fluctuate based on A/C age, timing and type of overhaul
Heavy Maintenance
4%
Total 100%
Airbus AM growing faster due to fleet aging, excellent product positions plus outsourcing trend support higher than market growth rate
Aftermarket (Commercial/Regional/Bus/GA)
32%
CF34-10 Engine Nacelles and tail cone support continued growth through the cycle
Regional/Bus/GA OE (Weighted)
6%
Market expectations - 2007 and beyondMarketGoodrich
2005Sales Mix
Strong growth in 737, 777, A320; A380, 787 and A350 introductions support deliveries past normal peak
Boeing OE Del.Airbus OE Del.
Total (GR Weight)
8%16%24%
14
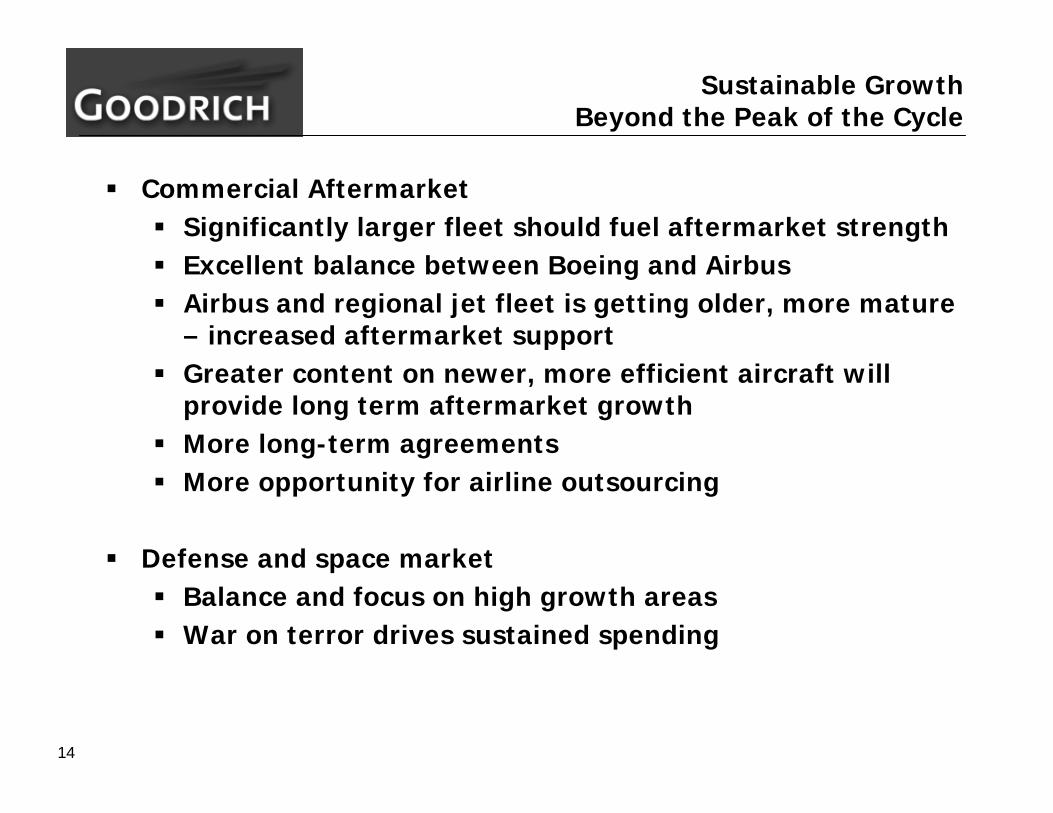
Sustainable Growth Beyond the Peak of the Cycle
Commercial AftermarketSignificantly larger fleet should fuel aftermarket strengthExcellent balance between Boeing and AirbusAirbus and regional jet fleet is getting older, more mature – increased aftermarket supportGreater content on newer, more efficient aircraft will provide long term aftermarket growthMore long-term agreementsMore opportunity for airline outsourcing
Defense and space marketBalance and focus on high growth areasWar on terror drives sustained spending

15
Sustainable Growth Beyond the Peak of the Cycle
Single Aisle Small TwinAisle
Large TwinAisle
Very LargeTwin Aisle
Current ModelsNew Models
Ave
rage
Con
ten
t pe
r A
ircr
aft
($
M)
B737,A320
B767,A330
B787,A350
B777,A340
B747
A380
Higher content per aircraft should dampen the effect from the next commercial down cycle

16
Full-year 2006 Outlook

17
2006 Outlook Summary
Continued robust growth in major Commercial Aerospace original equipment and aftermarket channelsContinue to expect ~100 basis point segment OI margin expansion in 2006, compared to 2005
Operational excellence and volume leverage
On track to achieve mid-teens segment OI margin by 2009-2010Expect growth in EPS from continuing operations to be greater than sales growth
Balancing short-term earnings improvement & long-term value creation

18
2006 Outlook Reconciliation
No change$240-260M$240-260MCapital Expenditures
Includes expected 2nd half 2006 tax payments of approx. $140 million, unwinding of A/R securitization program ($97M)
Approx. break-even
$100-150MCash flow from operations minus capital expenditures
Continued strong aftermarket, regional OE Rohr litigationRohr 1995-97 auditSale process terminated
$2.35-2.50
$0.93$0.12
$3.40-3.55
$2.25-2.45
$0.93$0.12$0.08
$3.38-3.58
EPS- Excl. Tax, TMP sale
- March 29 Tax Settlement- April Tax Settlement- TMP Sale
Net Income
Increased expectations for commercial aftermarket and regional OE sales
$5.75-5.85B$5.6-5.7BSales
CommentsCurrentOutlook
PriorOutlook
Outlook does not include•Resolution of remaining items in IRS examination cycle•Impact of acquisitions or divestitures•Resolution of remaining A380 contractual disputes with Northrop Grumman

19
Long-term Margin Expansion Outlook
8%
10%
12%
14%
16%
18%
2004 2005 2006 2007 2008 20098%
10%
12%
14%
16%
18%OI/Sales Margins
Total Company
ObjectiveExpect Airframe Systems margin improvement to ~10%Sustained, high Engine Systems marginsMid-teens Electronics Systems margins
DriversVolume leverageR&D costs on new programs mitigatePension, FX and stock-based compensation headwinds mitigate or reverse
Substantial margin upside potential

20
The Value Proposition for Goodrich2006 – 2010 Expectations
Great market positionsGood top line growth expected over the next several yearsSubstantial margin improvement opportunity
High margin aftermarket growth and OE volume leverageDevelopment program costs mitigateBelieve that Airframe margins bottomed out in 2005
Significant cash flow improvement expected in 2007Sustainable income growth beyond the OE cycle
Expect continued growth in aftermarket – faster than ASMsGoodrich should see “cycle on top of cycle” for OE production
• A380, Boeing 787, Boeing 747-8 and A350 all expected to have high Goodrich content
Key for 2006: Entire organization focused on margin improvement – with a sense of urgency

21
Supplemental Information
Additional information and presentations about Goodrich programs and products are available at www.goodrich.com. Presentations that are
available in the Investor Relations portion of the web site include the July 27, 2006 Second
Quarter Results presentation and the December 12, 2005 Annual Investor Conference
presentation.
22
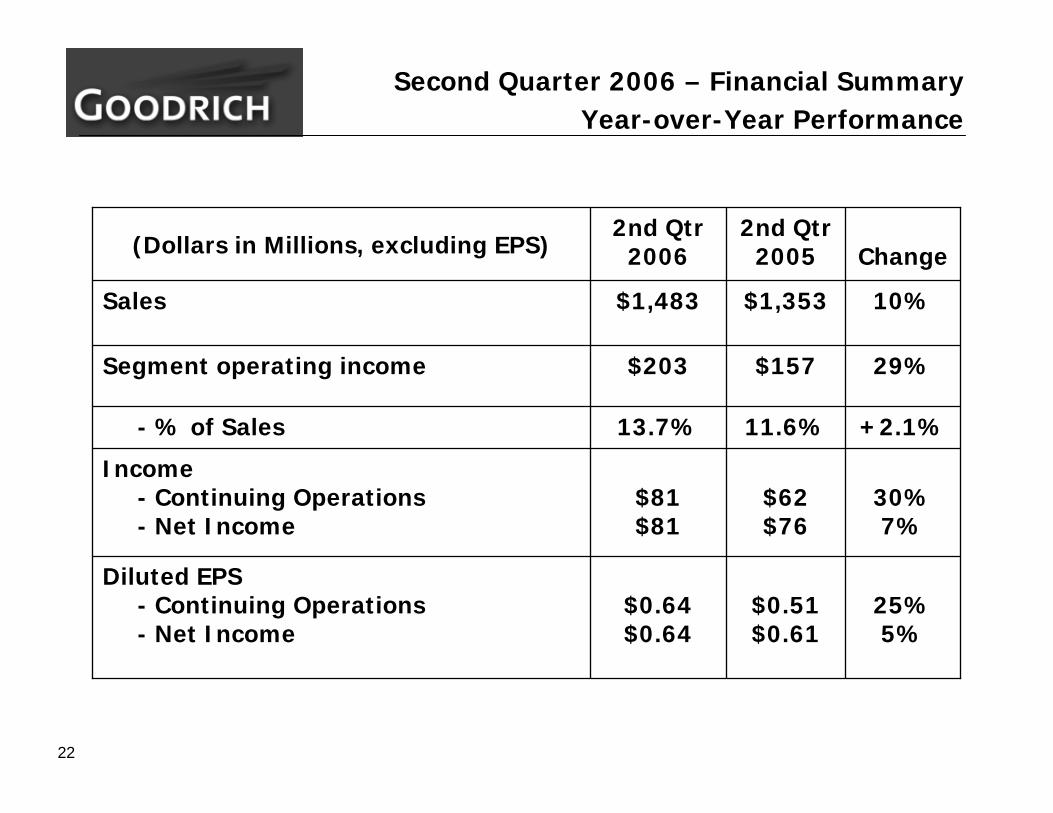
25%5%
30%7%
+2.1%
29%
10%
Change
$0.51$0.61
$0.64$0.64
Diluted EPS- Continuing Operations- Net Income
$62$76
$81$81
Income- Continuing Operations- Net Income
$157$203Segment operating income
11.6%13.7%- % of Sales
$1,353$1,483Sales
2nd Qtr 2005
2nd Qtr2006(Dollars in Millions, excluding EPS)
Second Quarter 2006 – Financial SummaryYear-over-Year Performance

23
130%107%
136%112%
+1.1%
21%
11%
Change
$0.97$1.08
$2.23$2.24
Diluted EPS- Continuing Operations- Net Income
$119$133
$281$283
Income- Continuing Operations- Net Income
$308$373Segment operating income
11.7%12.8%- % of Sales
$2,628$2,907Sales
First Half 2005
First Half2006(Dollars in Millions, excluding EPS)
Second Quarter YTD 2006 – Financial SummaryYear-over-Year Performance