Good to Great Indian Stocks to Invest Sep 2015
88
description
Good to Great Indian Stocks to Invest Sep 2015
Transcript of Good to Great Indian Stocks to Invest Sep 2015

Thematic | Good-to-Great
September 2015 2
Contents
Investment Framework: Static & Dynamic Value 3
The Static and Dynamic Value Framework 4
The theme: Good-to-Great 12
Applying Good-to-Great theme to our Framework 15
Static Value Applications 17
Dynamic Value Applications 22
Annexure I: Static Value Picks 28
Annexure II: Dynamic Value Picks 45
Annexure III: The Backtest 74
Investors are advised to refer through disclosures made at the end of the Research Report. Motilal Oswal research is available on www.motilaloswal.com/Institutional-Equities, Bloomberg, Thomson Reuters, Factset and S&P Capital.
Thematic | Good-to-Great
September 2015 3
Investment Framework: Static & Dynamic Value Identifying companies migrating from Good-to-Great
In this report, we introduce our proprietary Static and Dynamic Value framework of investing and use the Good-to-Great theme to identify the top large capitalization investment opportunities within our coverage universe.
Our studies indicate that combining our framework and the Good-to-Great theme has generated 1,500%+ outperformance over three years in Static Value stocks and ~500% outperformance over 10 years in Dynamic Value stocks.
The Framework: Static and Dynamic Value Our Static and Dynamic Value framework of investing finds academic support from the residual income model and revolves around the central concept of Intrinsic Value (IV). While Static Value hinges upon deep discount to IV, Dynamic Value is driven by growth in IV. Using a set of quantitative filters on our coverage universe that reflect the characteristics of static and dynamic value, we arrive at the shortlist of attractive stocks. The theme: Good-to-Great We adapt Jim Collins’ ‘Good-to-Great’ theme to Indian equities to identify businesses that have used the economic downturn over the last 2-3 years to transform themselves from ‘good’ to ‘great’. We believe these businesses could reap disproportionate benefits in an economic up-cycle. We apply this theme to narrow down our shortlist to top attractive investment opportunities. Our top Static Value picks: From our coverage universe, our top static value picks are Tata Motors, IOCL, ICICI Bank and IDFC. Our top Dynamic Value picks: Within our coverage universe, our top Dynamic Value picks are Maruti Suzuki, Larsen & Toubro, Ultratech Cement, Zee Entertainment, IndusInd Bank, ITC and United Spirits.
Thematic | Good-to-Great
Good-to-Great

Thematic | Good-to-Great
September 2015 4
The Static and Dynamic Value Framework The theory
To illustrate the Static and Dynamic Value framework, we start with the concept of ‘margin of safety’. "A margin of safety is achieved when securities are purchased at prices sufficiently below underlying value to allow for human error, bad luck, or extreme volatility in a complex, unpredictable and rapidly changing world." - Seth Klarman
‘Margin of safety’ is the key to investment returns on a stock. From an investment point of view, narrowing of price discount to underlying value or Intrinsic Value of the stock leads to superior investment returns.
Hence, estimating Intrinsic Value is a core area of analysis. Intrinsic Value is defined as net present value of cash flows of a firm available to equity investors. While Intrinsic Value is central to find attractive stocks, it is subjective, as it is highly dependent on analyst assumptions.
“Intrinsic value is an all-important concept that offers the only logical approach to evaluating the relative attractiveness of investments and businesses. Intrinsic value can be defined simply: It is the discounted value of the cash that can be taken out of a business during its remaining life.
The calculation of intrinsic value, though, is not so simple. As our definition suggests, intrinsic value is an estimate rather than a precise figure, and it is additionally an estimate that must be changed if interest rates move or forecasts of future cash flows are revised. Two people looking at the same set of facts, moreover – and this would apply even to Charlie and me – will almost inevitably come up with at least slightly different intrinsic value figures.” - Warren Buffett (Berkshire Hathaway’s 2014 Annual Report, page 123)
Of various approaches to estimate Intrinsic Value, we prefer the residual income model. This is mainly due to its relatively low dependence on future assumptions compared with other approaches like DCF. We reclassify the two key elements of intrinsic value from residual income model as highlighted below: Intrinsic Value (IV) = Static Value + Dynamic Value
Wherein,
Static Value = Starting Book Value + Terminal Value, and
𝑫𝒚𝒏𝒂𝒎𝒊𝒄 𝑽𝒂𝒍𝒖𝒆 = �(𝑹𝒐𝑹𝒕 − 𝒓)
(𝟏 + 𝒓)𝒕 𝑩𝒕
𝒎−𝟏
𝒕=𝟏

Thematic | Good-to-Great
September 2015 5
Academic Derivation: Static & Dynamic Value As per our Residual Income model,
𝑰𝒏𝒕𝒓𝒊𝒏𝒔𝒊𝒄 𝑽𝒂𝒍𝒖𝒆, 𝐼𝑉 = 𝐵𝑜 + �(𝑅𝑜𝐸𝑡 − 𝑟)
(1 + 𝑟)𝑡 𝐵𝑡 + �
𝑅𝐼𝑡(1 + 𝑟)𝑡
∞
𝑡=𝑚
𝑚−1
𝑡=1
Where, B = Book Value (at time = m) RIt = Residual Income (at time = t) r = Cost of Capital
𝑺𝒕𝒂𝒕𝒊𝒄 𝑽𝒂𝒍𝒖𝒆 = 𝑩𝒐 + �𝑹𝒐𝑹 − 𝒓𝒓 − 𝒈
� 𝑩𝒎
𝑫𝒚𝒏𝒂𝒎𝒊𝒄 𝑽𝒂𝒍𝒖𝒆 = �(𝑹𝒐𝑹𝒕 − 𝒓)
(𝟏 + 𝒓)𝒕 𝑩𝒕
𝒎−𝟏
𝒕=𝟏
Intrinsic Value = Static Value + Dynamic Value
As Warren Buffett says in the annual report: “Our long-term economic goal (subject to some qualifications later) is to maximize Berskshire’s annual rate of gain in intrinsic business value on a per-share basis.” In the context our framework, he is pointing to his intention to grow the Dynamic Value of Berkshire Hathaway over time. More specifically, the characteristics of the two groups as defined above are: (a) Static Value: This component of the equation is relatively stable over time and is
easier to calculate for a stock. For purposes of our analysis, we have used our in-house calculation of IV as a proxy for the same.
(b) Dynamic Value: This component of the equation varies over time, is more subjective and derives from growth in Intrinsic Value of the firm.
Static Value: From an investor perspective Static Value is typically created by a negative stock/sector/market specific event, which leads to indiscriminate selling, thus creating a steep valuation discount compared to its Intrinsic Value. While industry dynamics may not be in their favor over the long term, as investors, we can look to capitalize on this anomaly, as the sequence of negative events normalizes over a period of time.
= 𝑩𝒐 + �(𝑹𝒐𝑹𝒕 − 𝒓)
(𝟏 + 𝒓)𝒕 𝑩𝒕 +
𝒎−𝟏
𝒕=𝟏
�𝑹𝒐𝑹 − 𝒓𝒓 − 𝒈
� 𝑩𝒎

Thematic | Good-to-Great
September 2015 6
Case Study 1: State Bank of India For example, in mid-2013, as the rate-rise scare hit equity markets globally, Indian banking stocks, particularly, State Bank of India (SBIN) corrected about 40% over 3-4 months, creating Static Value. A reasonably well-timed purchase decision would have led to strong gains over the next 6-9 months, as the stock bounced back by about 70% during this period. It is worth noting that the long-term business dynamics are not in favor of Indian public sector (PSU) banks, as they are likely to lose market share to private sector banks. In the context of our framework, we would say that we do not expect the Intrinsic Value to grow over time. Exhibit 1: State Bank of India – price performance
Source: MOSL, Company
Case Study 2: Bharti Airtel During November 2014-March 2015, the stock corrected by ~20% from the peak, led by concerns on the spectrum auction scheduled in March 2015. Despite overbidding in the spectrum auction, the stock price rallied back by March 25, 2015, when the spectrum auction concluded. Exhibit 2: Bharti Airtel – price performance
Source: MOSL, Company
100
160
220
280
340
Sep-
10
Nov
-10
Feb-
11
May
-11
Aug-
11
Nov
-11
Jan-
12
Apr-
12
Jul-1
2
Oct
-12
Jan-
13
Apr-
13
Jun-
13
Sep-
13
Dec-
13
Mar
-14
Jun-
14
Sep-
14
Nov
-14
300
340
380
420
460
Oct
-14
Nov
-14
Dec-
14
Jan-
15
Feb-
15
Mar
-15
Apr-
15
Concerns on Spectrum Auction
Auction starts March
4th
Auction concludes March 25th

Thematic | Good-to-Great
September 2015 7
Case Study 3: BATA The stock had fallen 24% in the short-term, driven by supply chain issues due to migration to SAP in March 2015 quarter, thus creating Static Value. BATA resolved these issues in the subsequent quarter, leading to a rebound in sales growth as well as share-price performance of about 30% over the following months. This is also adequately captured in Exhibit 3. Exhibit 3: Bata – price performance
Source: MOSL, Company
Case Study 4: Tata Steel Tata Steel’s stock-price almost halved during 1H CY13 due to negative events like weak Indian steel prices and overall under-performance of the Indian stock market on fiscal/current account deficit concerns, thus creating static value. However, the stock doubled over the next 6-9 months as the extremely severe macro-fears didn’t materialize by 2H2013. The share-price chart highlighted below captures this time-frame adequately.
Exhibit 4: Tata Steel – price performance
Source: MOSL, Company
Dynamic Value: From an investor perspective As seen from the equation, Dynamic Value is typically created by a company that generates higher returns on capital employed / equity (RoCE / RoE) than the cost of capital and is able to grow by reinvesting its earnings to generate higher incremental returns.
As a corollary, Dynamic Value is typically associated in businesses wherein the industry attractiveness is high in the form of under-penetrated markets or a favorable market structure. Also, it is particularly advantageous for companies with an industry leading position to capitalize on the industry dynamics.
950 1,050 1,150 1,250
2-M
ar-1
5
12-M
ar-1
5
22-M
ar-1
5
1-Ap
r-15
11-A
pr-1
5
21-A
pr-1
5
1-M
ay-1
5
11-M
ay-1
5
21-M
ay-1
5
31-M
ay-1
5
10-Ju
n-15
20-Ju
n-15
30-Ju
n-15
10-Ju
l-15
20-Ju
l-15
30-Ju
l-15
BataSupply chain issues led to loss of sales
Supply chain issues were resolved and growth recovered
190
340
490
640
Dec-
12
Jan-
13
Feb-
13
Mar
-13
Apr-
13
May
-13
Jun-
13
Jul-1
3
Aug-
13
Sep-
13
Oct
-13
Nov
-13
Dec-
13
Jan-
14
Feb-
14
Mar
-14
Apr-
14
May
-14
Weak steel prices and Indian stock market under-performance
Slight recovery in global steel demand and INR depreciation created a window for export opportunities and pricing power Indian market.

Thematic | Good-to-Great
September 2015 8
Case Study 1: HDFC Bank For example, we expect 18%+ CAGR in banking industry loans over the medium term, driven by industry tailwind of low credit penetration of 52% versus 90% in other emerging markets. With its strong positioning amongst private sector banks, HDFC Bank has leveraged its position to create strong Dynamic Value for investors over the last 10 years as shown in Exhibit 6.
Exhibit 5: Aggressive expansion into India’s hinterland led to doubling of savings deposit m/s over last decade
Source: Company, MOSL
Exhibit 6: HDFCB - 25% CAGR returns over FY05-15
Source: Company, MOSL
Case Study 2: Amara Raja Batteries Amara Raja Batteries has created dynamic value by being a successful challenger to the incumbent, Exide since 2000. In this process, AMRJ has garnered 38% share of OEM market and 28% share of the after-market, mainly through technological innovations, witty advertising, and unique franchisee-based distribution model supported with competitive pricing. This led to improving margins and strong stock-price performance over long-term as shown in Exhibit below.
Exhibit 7: EBITDA margin to expand from 16.8% in FY15 to 19.2% by FY17 on back of lower commodity prices
Source: Company, MOSL
Exhibit 8: Stock generated return of 84% CAGR over FY11-FY15
Source: Company, MOSL
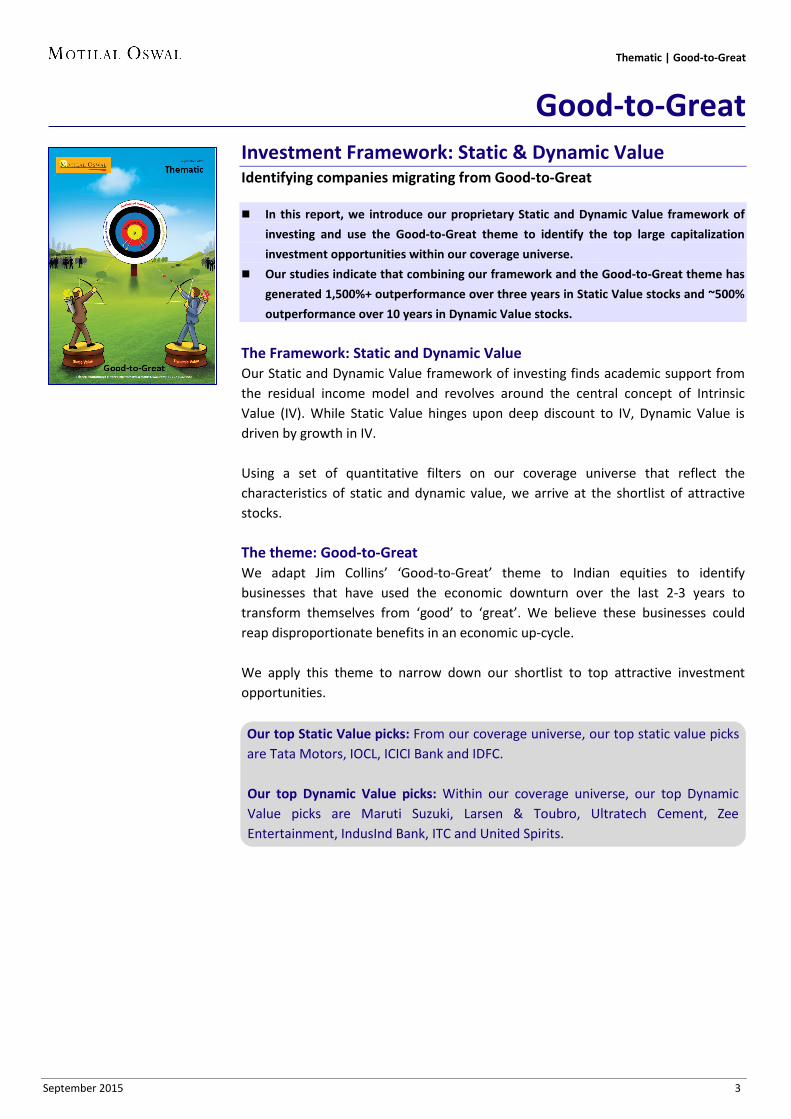
Case Study 3: Emami Emami has created dynamic value over long-term by gaining market-share in niche and under-penetrated categories through innovations, coupled with aggressive advertising and promotion strategy. This has resulted in an meaningful improvement in ROE from 23% to 45% over the last 8 years as shown in exhibit below. The subsequent stock-price performance is also highlighted below.
2.0 2.4 2.8 2.9 3.2 3.6
4.1 4.3 4.6 4.8 4.9 5.2
2004
2005
2006
2007
2008
2009
2010
2011
2012
2013
2014
2015
HDFCB Savings Dep. Market Share (%)
900
392
0
250
500
750
1000
Jan-
05Se
p-05
Apr-
06De
c-06
Jul-0
7M
ar-0
8O
ct-0
8Ju
n-09
Jan-
10Se
p-10
Apr-
11De
c-11
Jul-1
2M
ar-1
3O
ct-1
3M
ay-1
4Ja
n-15
Aug-
15
HDFC Bank Sensex-Rebased
14.6 14.4 15.2
16.3 16.8
17.9
19.2
FY11 FY12 FY13 FY14 FY15 FY16E FY17E
EBITDA Margins (%)1184
151
0200400600800
100012001400
Apr-
10Au
g-10
Dec-
10M
ar-1
1Ju
l-11
Oct
-11
Feb-
12Ju
n-12
Sep-
12Ja
n-13
Apr-
13Au
g-13
Nov
-13
Mar
-14
Jul-1
4O
ct-1
4Fe
b-15
May
-15
Sep-
15
Amara Raja Batt. Nifty
Thematic | Good-to-Great
September 2015 9
Exhibit 9: Consistently improving RoE (%)
Source: Company, MOSL
Exhibit 10: Performance of Emami v/s Sensex
Source: Company, MOSL
Case Study 4: Lupin Lupin has created dynamic value over longer-term by improving its product mix from lower margin API revenue stream towards higher margin revenue streams. This has resulted in an improvement in its RoE from 13% to 26.1% over the last decade. Subsequently, the stock has out-performed the benchmark meaningfully over the last 10 years as highlighted in the exhibit 11.
Exhibit 11: Outperformance of LPC vs. Sensex
Source: IMS, MOSL
Exhibit 12: Superior RoEs over time
Source: IMS, MOSL
23.3
35.8
31.1
38.8 34.8
37.1
42.4
47.1 44.9
FY07 FY08 FY09 FY10 FY11 FY12 FY13 FY14 FY15
Emami's RoE (%)2105
226 50
550
1050
1550
2050
2550
Mar
-06
Mar
-07
Mar
-08
Mar
-09
Mar
-10
Mar
-11
Mar
-12
Mar
-13
Mar
-14
Mar
-15
Emami Sensex
2479
100 433
Apr-
05
Apr-
06
Apr-
07
Apr-
08
Apr-
09
Apr-
10
Apr-
11
Apr-
12
Apr-
13
Apr-
14
Apr-
15
LPC (Price index) Sensex (Price Index)
13.3 14.6 16.1 17.2 18.6 17.8 17.3 21.3
24.2 26.1
FY06 FY07 FY08 FY09 FY10 FY11 FY12 FY13 FY14 FY15
RoE (%)
Thematic | Good-to-Great
September 2015 10
MCAP > USD2.5b Focus: High discount to IV IV gr.: Not necessarily High
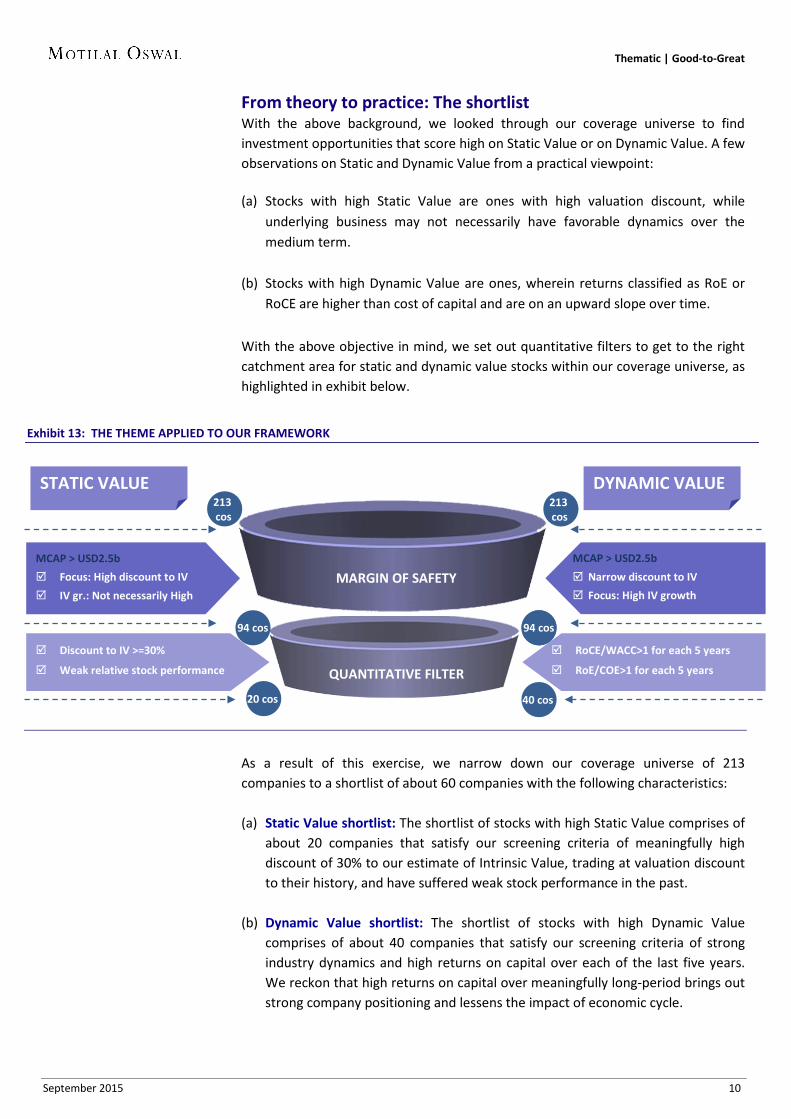
From theory to practice: The shortlist With the above background, we looked through our coverage universe to find investment opportunities that score high on Static Value or on Dynamic Value. A few observations on Static and Dynamic Value from a practical viewpoint: (a) Stocks with high Static Value are ones with high valuation discount, while
underlying business may not necessarily have favorable dynamics over the medium term.
(b) Stocks with high Dynamic Value are ones, wherein returns classified as RoE or RoCE are higher than cost of capital and are on an upward slope over time.
With the above objective in mind, we set out quantitative filters to get to the right catchment area for static and dynamic value stocks within our coverage universe, as highlighted in exhibit below.
As a result of this exercise, we narrow down our coverage universe of 213 companies to a shortlist of about 60 companies with the following characteristics: (a) Static Value shortlist: The shortlist of stocks with high Static Value comprises of
about 20 companies that satisfy our screening criteria of meaningfully high discount of 30% to our estimate of Intrinsic Value, trading at valuation discount to their history, and have suffered weak stock performance in the past.
(b) Dynamic Value shortlist: The shortlist of stocks with high Dynamic Value comprises of about 40 companies that satisfy our screening criteria of strong industry dynamics and high returns on capital over each of the last five years. We reckon that high returns on capital over meaningfully long-period brings out strong company positioning and lessens the impact of economic cycle.
MARGIN OF SAFETY
QUANTITATIVE FILTER
Discount to IV >=30%
Weak relative stock performance
STATIC VALUE DYNAMIC VALUE
MCAP > USD2.5b Narrow discount to IV Focus: High IV growth
RoCE/WACC>1 for each 5 years
RoE/COE>1 for each 5 years
Exhibit 13: THE THEME APPLIED TO OUR FRAMEWORK
94 cos 94 cos 94 cos
213 cos
213 cos
40 cos 20 cos

Thematic | Good-to-Great
September 2015 11
How are the characteristics of Static & Dynamic Value stocks different? As elaborated in the previous sections, the characteristics of the stocks in each of the categories are material different from each other. A brief summary of such differences in encapsulated in the exhibit below:
Exhibit 14: Comparison of Static Value and Dynamic Value stocks on valuation, growth and return parameters
P/B (x) P/E (x) EPS growth (%) ROE (%) ROCE/ROA (%)
FY15 FY16E FY17E FY15 FY16E FY17E FY15 FY16E FY17E FY15 FY16E FY17E FY15 FY16E FY17E
Static Value stocks 1.2 1.1 1.0 10.5 8.4 7.7
(3.6) 13.3 16.5
13.0 14.8 15.7
7.2 7.6 8.2
Dynamic Value stocks 6.7 5.6 5.0 31.4 26.7 21.4
10.0 22.4 24.3
22.3 24.9 25.3
19.8 23.2 26.3
Source: MOSL, company
As seen above, the contrasting features are clearly visible between Static Value and Dynamic Value stocks. For example: The static value stocks have material valuation discount….. a) The median FY17E P/B(x) of Static Value stocks is nearly one-fifth that of
Dynamic Value stocks. b) Also, median FY17E P/E(x) for Static Value stocks is nearly one-third of Dynamic
Value stocks, clearly indicating that Static Value stocks trade at deep discount. c) Also, static Value stocks under our coverage offer ~50% target price upside
compared with ~20% in case of Dynamic Value stocks.
….While dynamic value stocks have materially higher growth and returns
d) Similarly, Dynamic Value stocks have much higher growth forecasts and return ratios as visible in median FY17E EPS growth differential of almost 800bps.
e) Also, the return ratios of dynamic value stocks are materially higher, namely, 1,000bps in the case of RoE and 2,000bps in the case of RoCE.
The complete list of 60 companies along with key metrics can be seen in Exhibit 16. Now, we apply the Good-to-Great theme to cull out our list of most attractive investment opportunities.

Thematic | Good-to-Great
September 2015 12
The theme: Good-to-Great What is Good-to-Great? In the early 2000s, Jim Collins and his research team undertook a 5-year research project to find an answer to the following question: Can a Good company become a Great company and if so, how? Could the findings be generalized to form a timeless, universal framework that can be applied by any organization? They encapsulated their findings in the form of a generalized framework highlighted below and noticed that their sample size of such Good-to-Great businesses that made the final cut averaged cumulative stock returns that are 6.9x the general market over the 15 years following their transition point. The theme: Good-to-Great
We have summarized our understanding of the key blocks below:
a) Disciplined management: We refer this as quality of management with regards to capital allocation policies, shareholder focus and a strong drive to succeed.
For example, UltraTech Cement’s focus on consistent growth and cost leadership has ensured that it has had no year of revenue decline during the last decade despite being in a cyclical industry.
Post Diageo’s assuming control, United Spirits is focusing more on compliance and business ethics, translating into better capital allocation. Also, after 15 years
Industry Attractiveness
Disciplined Thought Disciplined Management
Disciplined Action Expected Results
GOOD -TO-
GREAT

Thematic | Good-to-Great
September 2015 13
of underinvestment, its power brand portfolio of 14 brands is set to receive significant jump in brand investments.
Larsen & Toubro has incubated and grown service businesses like IT and finance. By creating independent companies for different businesses and listing subsidiaries, it has kept business structure simple and promoted managerial talent.
b) Disciplined thought: We looked for businesses wherein management has set out clear goals to widen their moat during the downturn.
For example, having learnt its lessons during the previous deregulation period (2004-06), Indian Oil Corporation has focused on (a) expanding its retail reach, and on (b) improving service/fuel quality at its outlets to levels at par with global standards. This makes it better prepared to stand up to competition from the private sector as and when the industry is fully deregulated.
Maruti Suzuki is focusing on being future-ready by adding more premium products to its bouquet of offerings. Tata Motors has focused on filling gaps in its domestic and overseas product portfolios. ICICI Bank is focusing on capital management to improve return ratios and enhance shareholder value.
c) Disciplined action: We focus on those companies that have converted their thoughts into detailed action plan and are in the process of executing the same.
For example, Indian Oil Corporation has (a) almost doubled its outlets (>24,000 now), and (b) automated retail outlets having monthly sales of over 200KL.
UltraTech has been targeting 20-25% of its annual capex on garnering land and limestone reserves, which give it the ability to add 20-25m tons of capacity in a relatively short period.
With the Ciaz launch tasting good success, Maruti Suzuki intends to launch several other premium products (S-Cross, a premium hatchback, and a compact SUV) over the next 15 months. It has launched Nexa dealerships, focusing on premium products.
Tata Motors has planned two launches per annum under JLR, along with several refreshes. Similarly, its India business has also planned two launches per annum till 2020.
ICICI Bank has regularly repatriated capital (USD2b till date) from overseas subsidiaries and increased dividend payout from domestic subsidiaries (INR29b over FY13-15).
d) Expected results: We narrow down on those businesses that have translated all the management strategy and action points into improving market-share, operating margins or returns on capital employed over the next 3 years. For example, we expect Indian Oil Corporation’s profit to more than double by FY18, led by lower interest cost and higher marketing margins and RoE should sustain at >15%.
For IDFC, we expect RoE to be healthy at 11-12% in the first full year of operations as a bank and then steadily rise to ~18% in the next four years.
Thematic | Good-to-Great
September 2015 14
Larsen and Toubro’s consolidated RoE is likely to increase from 14% to 20% over the next three years. Maruti Suzuki’s market share should increase by ~200bp to ~48% over FY15-18. For United Spirits, we look for EBITDA margin of 20% by 2020 against our estimate of 12.6% for FY17. Its market share in the Prestige+ segment should inch up by 100-150bp per annum. We also expect its net debt to halve by FY18.
Has Good-to-Great worked in Indian equities? We back-test the theme to understand and illustrate that following this theme has been a fruitful investing experience within Indian equities in the past. In this context, we present our thoughts on Britannia and Eicher Motors as examples of Static Value and reflect on their performance over the last three years. Britannia: Following seven years of stagnant profits, Varun Bery, the newly-
appointed CEO, generated a thought of premiumization. He chose five brands to focus on and concentrated advertising spending in these brands. This resulted in revenue CAGR of 12%, EBITDA margin expansion of 500bp, and RoCE expansion from 16% to 54% over the next three years. During this process, the stock outperformed the local benchmark by 750%.
Eicher Motors: Following its initial success, the management of Eicher Motors generated a thought of extending its dominant position in leisure bikes and followed this up by action of tripling capacity over three years, expanding the target segment through model launches, and entering multiple countries. This resulted in a volume CAGR of 63%, EBITDA margin expansion of 1,300bp, while returns improved by 1,500bp over the next three years. During this process, the stock outperformed the local benchmark by 1,400%.
Also, we highlight HDFC Bank as an example of Dynamic Value stock over 10-year period. HDFC Bank: HDFC Bank set out a three-pronged thought of growing its retail
banking franchise, lowering its cost of funds, and focused expansion almost a decade ago. With a stable management team, the bank achieved flawless and disciplined execution on all these counts. This has resulted in an earnings CAGR of 33% since inception, along with industry leading RoA of 2%. Over the last 10 years, the stock has outperformed the local benchmark by 129%.
A detailed account of the industry dynamics, key elements of management strategy along with the actions and the results are presented in annexure-III.

Thematic | Good-to-Great
September 2015 15
MCAP > USD2.5b Focus: High discount to IV IV gr.: Not necessarily High
Applying Good-to-Great theme to our Framework From shortlist to top picks We put together all the concepts discussed earlier in the following exhibit to illustrate our process to get to our top picks within our coverage universe.
Post our initial screening driven by quantitative filters, we sieve through the list of about 60 companies with a fine comb to look for those companies have all attributes of our Good-to-Great theme. A summary of our key observations during this process is highlighted below:
MARGIN OF SAFETY
QUANTITATIVE FILTER
QUALITATIVE FILTER: GOOD TO GREAT
Discount to IV >=30%
Weak relative stock performance
STATIC VALUE DYNAMIC VALUE
MCAP > USD2.5b Narrow discount to IV Focus: High IV growth
RoCE/WACC>1 for each 5 years
RoE/COE>1 for each 5 years
Theme: Good to Great Industry Attractiveness Disciplined Management Disciplined Thought Disciplined Action Expected Results
Exhibit 15: THE THEME APPLIED TO OUR FRAMEWORK
TOP PICKS
Theme: Good to Great Industry Attractiveness Disciplined Management Disciplined Thought Disciplined Action Expected Results
Tata Motors IOCL
ICICI Bank IDFC
Maruti Suzuki Larsen & Toubro
Ultratech Cement Zee Entertainment
IndusInd Bank ITC
United Spirits
7 cos 4 cos 4 cos
20 cos 40 cos
94 cos 94 cos 94 cos
213 cos
213 cos

Thematic | Good-to-Great
September 2015 16
(a) Industry attractiveness is a key differentiating factor between Static and Dynamic Value: We note 84% of companies rich in Dynamic Value score high on favorable industry dynamics, while only 48% of the companies in the Static Value shortlist have similar dynamics.
(b) While most companies had disciplined thought, winners followed this up by
disciplined action. We note that 70-80% of the companies in the shortlist had disciplined thought, but only 50% followed up with disciplined action.
A brief description of how our top picks across each of the elements of Good-to-Great theme is summarized below.

Thematic | Good-to-Great
September 2015 17
Static Value Applications
Industry Attractiveness: Drives Intrinsic Value Growth Tata Motors The global luxury car industry has grown at a CAGR of ~17% over CY10-14,
driven by a CAGR of ~26% in China. While Chinese luxury car demand has cooled off, with ~3% growth in 1HCY15, the long-term growth potential of Chinese markets remains intact.
JLR is a niche player in the global luxury car market, with ~8% share. While it enjoys strong brand equity in SUVs, it is yet to enjoy similar success with Jaguar in luxury cars.
India CV business is expected to benefit from cyclical recovery. However, increasing competitive intensity would result in pressure on market share / margins.
IOC Per capita consumption to move towards world average: At 160 liters, India’s
per capita petroleum consumption is significantly lower than the world average of 730 liters. Increasing vehicle population led by per capita GDP growth would boost India’s per capita petroleum consumption.
Oligopolist market: Three players control 99% of market (IOCL’s share at ~46%). IOCL well placed for next 2-3 years led by (a) higher volume growth (1x of GDP),
(b) negligible private player presence, and (c) pricing power, led by auto fuel deregulation.
ICICI Bank India presents a huge opportunity for banks. Only 40% of the population has
access to banking. Credit-to-GDP is just ~52% against an average of ~90% for emerging markets and ~100% for developed markets.
Deepening financial penetration, increasing urbanization, and expansion of private banks into rural and semi-urban areas would drive retail loan growth. Consumer loans-to-GDP stands at just 15% against 20%+ for major economies.
IDFC India presents a huge opportunity for banks. Only 40% of the population has
access to banking. Credit-to-GDP is just ~52% against an average of ~90% for emerging markets and ~100% for developed markets.
The industry is likely to grow at a CAGR of 18%+ over the next five years. Incumbent state-owned banks still have 75%+ market share. In this digital era,
private sector banks should continue to gain share, with superior products and services.
Thematic | Good-to-Great
September 2015 18
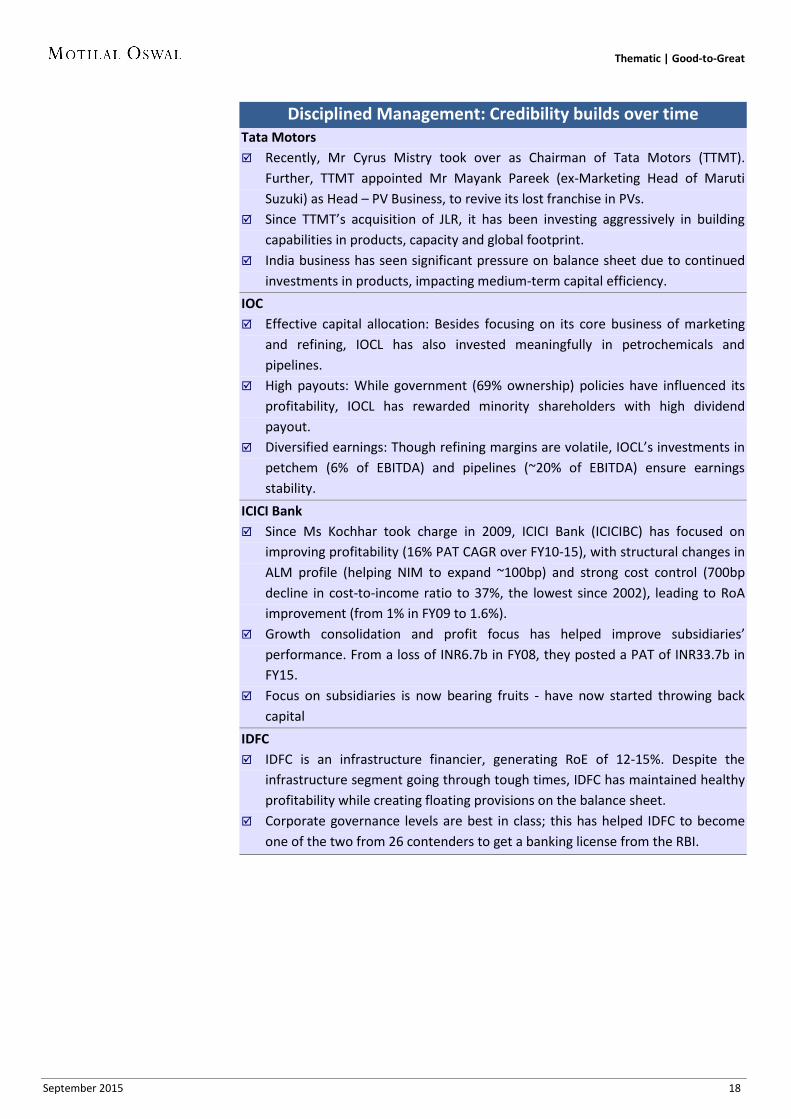
Disciplined Management: Credibility builds over time Tata Motors Recently, Mr Cyrus Mistry took over as Chairman of Tata Motors (TTMT).
Further, TTMT appointed Mr Mayank Pareek (ex-Marketing Head of Maruti Suzuki) as Head – PV Business, to revive its lost franchise in PVs.
Since TTMT’s acquisition of JLR, it has been investing aggressively in building capabilities in products, capacity and global footprint.
India business has seen significant pressure on balance sheet due to continued investments in products, impacting medium-term capital efficiency.
IOC Effective capital allocation: Besides focusing on its core business of marketing
and refining, IOCL has also invested meaningfully in petrochemicals and pipelines.
High payouts: While government (69% ownership) policies have influenced its profitability, IOCL has rewarded minority shareholders with high dividend payout.
Diversified earnings: Though refining margins are volatile, IOCL’s investments in petchem (6% of EBITDA) and pipelines (~20% of EBITDA) ensure earnings stability.
ICICI Bank Since Ms Kochhar took charge in 2009, ICICI Bank (ICICIBC) has focused on
improving profitability (16% PAT CAGR over FY10-15), with structural changes in ALM profile (helping NIM to expand ~100bp) and strong cost control (700bp decline in cost-to-income ratio to 37%, the lowest since 2002), leading to RoA improvement (from 1% in FY09 to 1.6%).
Growth consolidation and profit focus has helped improve subsidiaries’ performance. From a loss of INR6.7b in FY08, they posted a PAT of INR33.7b in FY15.
Focus on subsidiaries is now bearing fruits - have now started throwing back capital
IDFC IDFC is an infrastructure financier, generating RoE of 12-15%. Despite the
infrastructure segment going through tough times, IDFC has maintained healthy profitability while creating floating provisions on the balance sheet.
Corporate governance levels are best in class; this has helped IDFC to become one of the two from 26 contenders to get a banking license from the RBI.

Thematic | Good-to-Great
September 2015 19
Disciplined Thought: Leveraging the economic down-turn Tata Motors Focus on products: JLR has been focusing on filling gaps in its product portfolio.
Similarly, India PV business is focused on correcting under-investment in products.
Focus on modular platform: JLR is focused on improving its platform efficiency by increasing model to platform ratio, in turn reducing capital intensity.
Focus on diversification of manufacturing footprint: JLR’s manufacturing base is entirely located in UK, resulting in high cost structure and forex volatility on imports.
IOC Geared to counter private competition: Having learnt its lessons during the
previous deregulation period (2004-06), IOCL (a) has almost doubled its outlets (>24,000 now) to ensure wide reach, and (b) is focusing on improving service/fuel quality at its outlets to levels at par with global standards.
Financial cost control in difficult times: While debt levels were high (peak D/E of 1.4x) in an era of high under-recoveries (FY11-14), the management significantly increased the share of overseas loans to cut interest costs.
ICICI Bank The management is focusing on secured loans to augment loan market share
and maintain healthy credit quality. The retail segment remains a key focus area.
It is focusing on capital management to improve return ratios and enhance shareholder value, in which subsidiaries would play a major role.
To sustain dilution-free growth, ICICIBC is focusing on core profitability. It has enhanced margins and operating leverage, and is keeping a check on credit cost.
IDFC Focus on long-term shareholder value creation even at the cost of immediate
profitability Diversification: Considering the challenges in infrastructure financing, the
management focused on diversification of assets and liabilities. For the banking business, IDFC is focusing on innovation, technology and cross-
selling to existing customers to increase profitability.

Thematic | Good-to-Great
September 2015 20
Disciplined Action: Putting Strategy to Work Tata Motors Focus on products: JLR has planned two launches per annum, along with several
refreshes. This will help to fill gaps in its portfolio and expand addressable market manifold. Similarly, India business has also planned two launches per annum till 2020.
Focus on modular platform: Modular platform strategy is on track, with target of four cars per platform by FY18-19 (currently, two cars per platform).
Focus on diversification of manufacturing footprint: JLR now has plants in China and Brazil (upcoming), and is planning a plant in East Europe (Slovakia).
IOC Continuous capex to match volume growth: With 6-8% auto fuel volume growth,
IOCL will continue its retail network expansion to grow market share from the current ~46%.
Focus on low cost expansions: Post 15mmt greenfield refinery at Paradeep, medium-term expansions will be brownfield, and hence, cost effective.
Improving retail network efficiency: (a) Automated retail outlets with >200KL per month – ready for differential pricing, (b) increased pipeline network – lowers logistics cost.
ICICI Bank Healthy retail loan growth: Retail loans have grown at a CAGR of 24% over FY13-
15. The share of the retail segment has increased from 37% in FY12 to 42% in FY15. By moderating growth in loans to sensitive sectors (3% CAGR over FY13-15), ICICIBC has gradually lowered its exposure to these sectors to ~16%.
ICICIBC has regularly repatriated capital (USD2b till date) from overseas subsidiaries and increased dividend payout from domestic subsidiaries (INR29b over FY13-15).
Focus on operating leverage: Employees/branch have halved to 16 since 2008, CASA ratio has doubled, and share of retail fees has grown from 33% in 2011 to 52%.
IDFC During the troubled times of FY12-15, IDFC’s loan CAGR was just 2%. It created
provisions of ~4% of loans though reported NPAs were lower at <0.5%. Further, it also created provisions of 60bp on disbursements.
IDFC is one of the two from 26 contenders to receive a banking license. Operating under the banking model would enhance sustainable RoE by ~500bp.

Thematic | Good-to-Great
September 2015 21
Expected Results: Strong improvement in returns Tata Motors Success of Jaguar XE and F-Pace should result in ~2% market share gain for JLR
in the luxury vehicle segment, and drive benefits of operating leverage for JLR. JLR’s margins would see step-down due to (a) normalization of margins in China
business, and (b) accounting for JV. We expect JLR’s reported EBITDA margin to decline 380bp by FY18 (as compared with FY15).
However, strong volume growth in JLR (~13% CAGR incl JV) and sharp India business recovery would drive ~16% EPS CAGR over FY15-18.
IOC IOCL’s profit is likely to more than double, led by fall in interest cost and higher
marketing margins (we model an increase from INR1.4/liter to INR2.4/liter by FY18). RoE should sustain at >15%.
While refining margins would be governed by global demand-supply; likely higher marketing margins provide predictability to its earnings and should lead to re-rating, in our view. Fair value of INR570 implies 44% upside. The stock trades at 7.2x FY17E EPS.
ICICI Bank In the medium term, we expect loan growth to continue being driven by the
retail segment (25%+ CAGR), with funding from relatively low cost retail liabilities.
Cost control and productivity gains should continue. Focus on core profitability would lead to further improvement in core RoE (~17% in FY17, up 150bp from FY15).
Release of capital from subsidiaries would ensure dilution-free growth till FY18. IDFC RoE is expected to be healthy at 11-12% in the first full year of operations as a
bank and then steadily rise to ~18% in the next four years. IDFC would command significantly higher value as a bank (with higher retail
deposits and loans) than as an infrastructure financier. Investors are likely to focus more on the expected improvement in business,
higher and sustainable RoE, strong management team, and good corporate governance.
Thematic | Good-to-Great
September 2015 22
Dynamic Value Applications
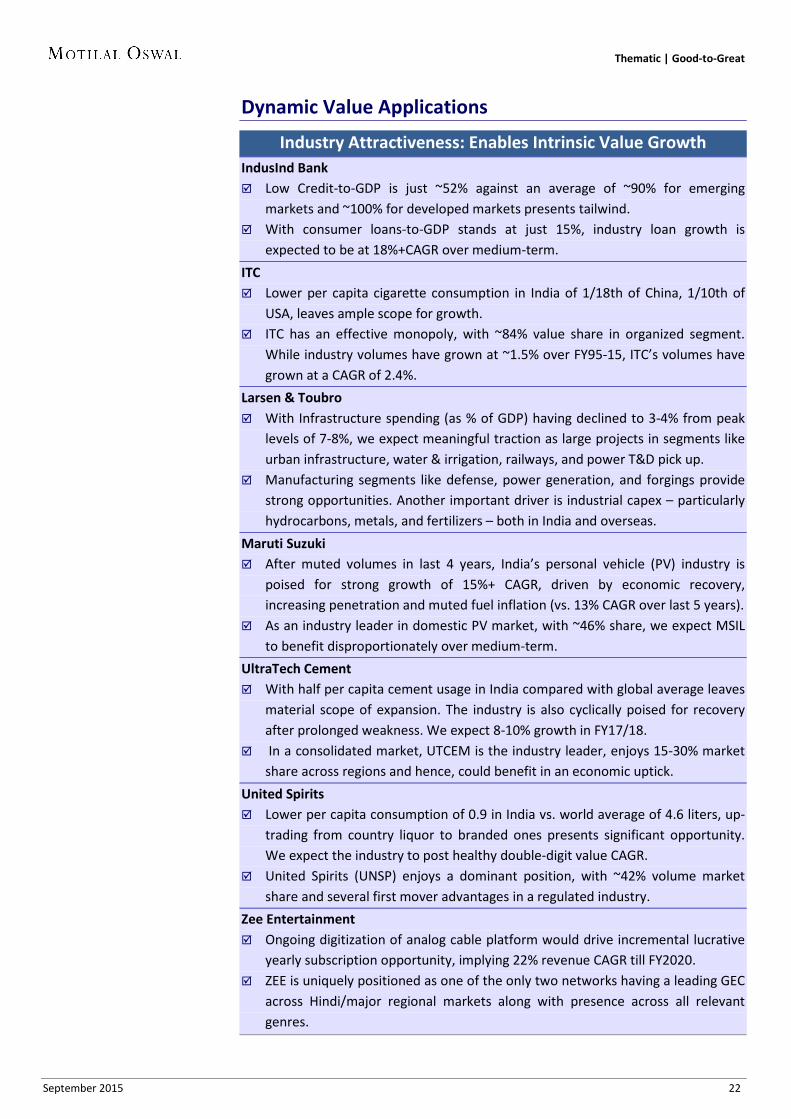
Industry Attractiveness: Enables Intrinsic Value Growth IndusInd Bank Low Credit-to-GDP is just ~52% against an average of ~90% for emerging
markets and ~100% for developed markets presents tailwind. With consumer loans-to-GDP stands at just 15%, industry loan growth is
expected to be at 18%+CAGR over medium-term. ITC Lower per capita cigarette consumption in India of 1/18th of China, 1/10th of
USA, leaves ample scope for growth. ITC has an effective monopoly, with ~84% value share in organized segment.
While industry volumes have grown at ~1.5% over FY95-15, ITC’s volumes have grown at a CAGR of 2.4%.
Larsen & Toubro With Infrastructure spending (as % of GDP) having declined to 3-4% from peak
levels of 7-8%, we expect meaningful traction as large projects in segments like urban infrastructure, water & irrigation, railways, and power T&D pick up.
Manufacturing segments like defense, power generation, and forgings provide strong opportunities. Another important driver is industrial capex – particularly hydrocarbons, metals, and fertilizers – both in India and overseas.
Maruti Suzuki After muted volumes in last 4 years, India’s personal vehicle (PV) industry is
poised for strong growth of 15%+ CAGR, driven by economic recovery, increasing penetration and muted fuel inflation (vs. 13% CAGR over last 5 years).
As an industry leader in domestic PV market, with ~46% share, we expect MSIL to benefit disproportionately over medium-term.
UltraTech Cement With half per capita cement usage in India compared with global average leaves
material scope of expansion. The industry is also cyclically poised for recovery after prolonged weakness. We expect 8-10% growth in FY17/18.
In a consolidated market, UTCEM is the industry leader, enjoys 15-30% market share across regions and hence, could benefit in an economic uptick.
United Spirits Lower per capita consumption of 0.9 in India vs. world average of 4.6 liters, up-
trading from country liquor to branded ones presents significant opportunity. We expect the industry to post healthy double-digit value CAGR.
United Spirits (UNSP) enjoys a dominant position, with ~42% volume market share and several first mover advantages in a regulated industry.
Zee Entertainment Ongoing digitization of analog cable platform would drive incremental lucrative
yearly subscription opportunity, implying 22% revenue CAGR till FY2020. ZEE is uniquely positioned as one of the only two networks having a leading GEC
across Hindi/major regional markets along with presence across all relevant genres.
Thematic | Good-to-Great
September 2015 23
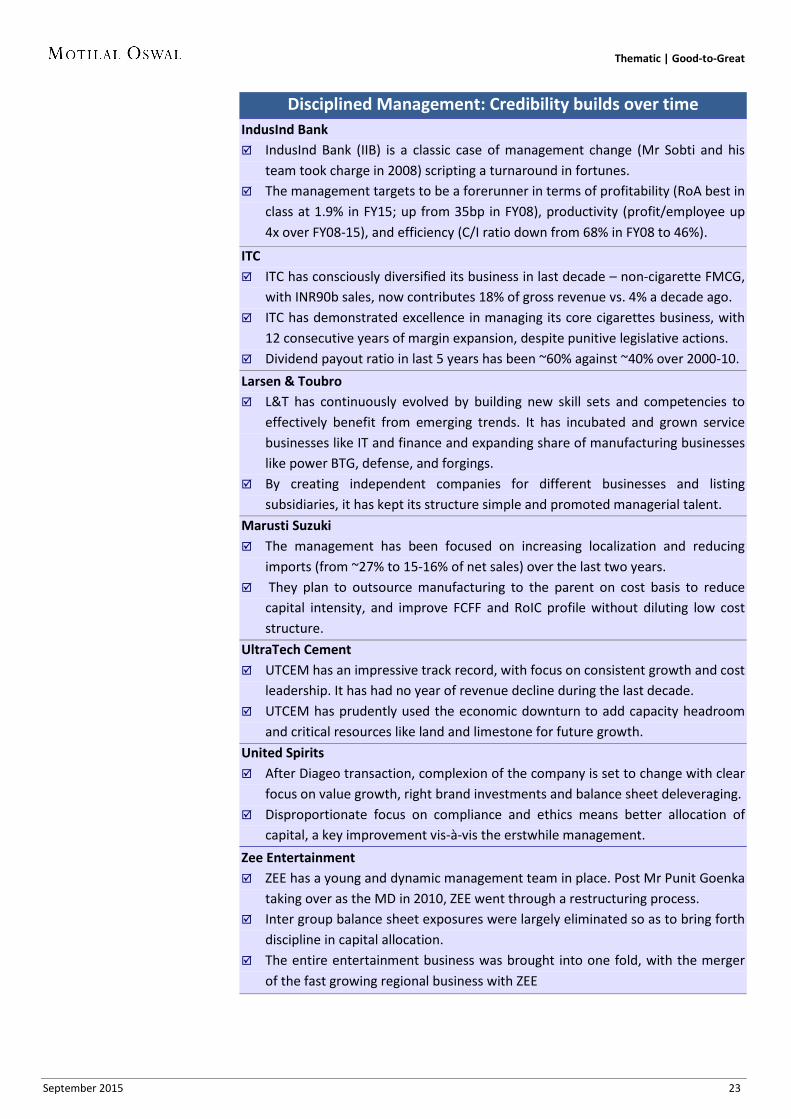
Disciplined Management: Credibility builds over time IndusInd Bank IndusInd Bank (IIB) is a classic case of management change (Mr Sobti and his
team took charge in 2008) scripting a turnaround in fortunes. The management targets to be a forerunner in terms of profitability (RoA best in
class at 1.9% in FY15; up from 35bp in FY08), productivity (profit/employee up 4x over FY08-15), and efficiency (C/I ratio down from 68% in FY08 to 46%).
ITC
ITC has consciously diversified its business in last decade – non-cigarette FMCG, with INR90b sales, now contributes 18% of gross revenue vs. 4% a decade ago.
ITC has demonstrated excellence in managing its core cigarettes business, with 12 consecutive years of margin expansion, despite punitive legislative actions.
Dividend payout ratio in last 5 years has been ~60% against ~40% over 2000-10. Larsen & Toubro L&T has continuously evolved by building new skill sets and competencies to
effectively benefit from emerging trends. It has incubated and grown service businesses like IT and finance and expanding share of manufacturing businesses like power BTG, defense, and forgings.
By creating independent companies for different businesses and listing subsidiaries, it has kept its structure simple and promoted managerial talent.
Marusti Suzuki The management has been focused on increasing localization and reducing
imports (from ~27% to 15-16% of net sales) over the last two years. They plan to outsource manufacturing to the parent on cost basis to reduce
capital intensity, and improve FCFF and RoIC profile without diluting low cost structure.
UltraTech Cement UTCEM has an impressive track record, with focus on consistent growth and cost
leadership. It has had no year of revenue decline during the last decade. UTCEM has prudently used the economic downturn to add capacity headroom
and critical resources like land and limestone for future growth. United Spirits After Diageo transaction, complexion of the company is set to change with clear
focus on value growth, right brand investments and balance sheet deleveraging. Disproportionate focus on compliance and ethics means better allocation of
capital, a key improvement vis-à-vis the erstwhile management. Zee Entertainment ZEE has a young and dynamic management team in place. Post Mr Punit Goenka
taking over as the MD in 2010, ZEE went through a restructuring process. Inter group balance sheet exposures were largely eliminated so as to bring forth
discipline in capital allocation. The entire entertainment business was brought into one fold, with the merger
of the fast growing regional business with ZEE

Thematic | Good-to-Great
September 2015 24
Disciplined Thought: Leveraging the economic down-turn IndusInd Bank In the current Three-year planning cycle (2014-17), management plans to: a) Focus on loan growth at double that of industry by capitalizing on niche areas (vehicle loans). b) Build at least 15 home markets (5%+ branch share) to sustain savings accounts. ITC Despite four consecutive years of 15%+ excise duty hikes, ITC continues to pass
on duty hikes to consumers through price increases and use its wide product portfolio (presence across segments) to retain market-share in cigarettes.
It plans to become a FMCG player by entering into various Home & Personal care and Foods categories. Notably, it has set target of INR1t for FMCG-others by 2030 from the current INR90b.
Larsen & Toubro L&T intends to increase opportunity set in its core E&C business by building
competencies in emerging segments and build manufacturing businesses in long term (including from privatization of defense and entry into power BTG).
It plans to improve capital allocation through various initiatives and thus improve consolidated RoE.
Maruti Suzuki Focus on rural markets: To offset the cyclical downturn in urban markets, MSIL
has started to develop underpenetrated rural markets. Focus on product portfolio expansion: During downturn, MSIL has focused on
launching new products to retain freshness in model-cycle. Focus on premiumization: MSIL is focusing on being future-ready by adding
more premium products to its bouquet of offerings. UltraTech Cement Ultratech plans meaningful capacity addition and attenuate growth constraints
though backward integration to remain prepared for an industry upcycle. Cost leadership: UTCEM continues to focus on optimizing energy mix, logistics
and synergies to widen profitability gap vs. peers (10-15% above Ambuja now). United Spirits Drive premiumization through power brand portfolio of 14 brands is the key
priority and represents a strategic departure from the past. Cost leadership: To drive cost cuts across all P&L line items – RM, PM,
overheads. Notably, it has appointed AT Kearney to identify areas of cost saving. Deleveraging: Over next 3 years, UNSP plans to raise INR20b by divesting non-
core assets. Zee Entertainment Grow market leadership: ZEE aims to be amongst top global media
conglomerates and is targeting 4-5x growth in viewership and content consumption by the year 2020.
High cost discipline to drive superior margins: With best-in-class cost management and margin focus, we believe target EBITDA margin of 30%+ is achievable.
Thematic | Good-to-Great
September 2015 25
Disciplined Action: Putting Strategy to Work
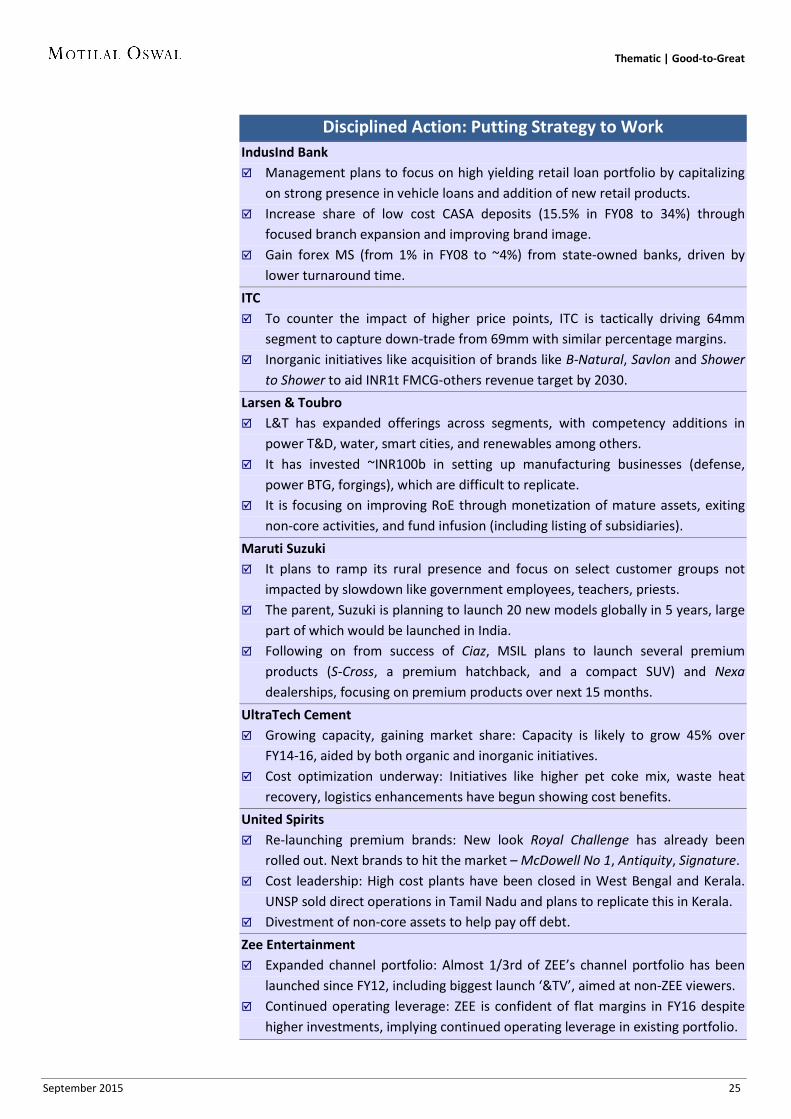
IndusInd Bank Management plans to focus on high yielding retail loan portfolio by capitalizing
on strong presence in vehicle loans and addition of new retail products. Increase share of low cost CASA deposits (15.5% in FY08 to 34%) through
focused branch expansion and improving brand image. Gain forex MS (from 1% in FY08 to ~4%) from state-owned banks, driven by
lower turnaround time. ITC To counter the impact of higher price points, ITC is tactically driving 64mm
segment to capture down-trade from 69mm with similar percentage margins. Inorganic initiatives like acquisition of brands like B-Natural, Savlon and Shower
to Shower to aid INR1t FMCG-others revenue target by 2030. Larsen & Toubro L&T has expanded offerings across segments, with competency additions in
power T&D, water, smart cities, and renewables among others. It has invested ~INR100b in setting up manufacturing businesses (defense,
power BTG, forgings), which are difficult to replicate. It is focusing on improving RoE through monetization of mature assets, exiting
non-core activities, and fund infusion (including listing of subsidiaries). Maruti Suzuki It plans to ramp its rural presence and focus on select customer groups not
impacted by slowdown like government employees, teachers, priests. The parent, Suzuki is planning to launch 20 new models globally in 5 years, large
part of which would be launched in India. Following on from success of Ciaz, MSIL plans to launch several premium
products (S-Cross, a premium hatchback, and a compact SUV) and Nexa dealerships, focusing on premium products over next 15 months.
UltraTech Cement Growing capacity, gaining market share: Capacity is likely to grow 45% over
FY14-16, aided by both organic and inorganic initiatives. Cost optimization underway: Initiatives like higher pet coke mix, waste heat
recovery, logistics enhancements have begun showing cost benefits. United Spirits Re-launching premium brands: New look Royal Challenge has already been
rolled out. Next brands to hit the market – McDowell No 1, Antiquity, Signature. Cost leadership: High cost plants have been closed in West Bengal and Kerala.
UNSP sold direct operations in Tamil Nadu and plans to replicate this in Kerala. Divestment of non-core assets to help pay off debt. Zee Entertainment Expanded channel portfolio: Almost 1/3rd of ZEE’s channel portfolio has been
launched since FY12, including biggest launch ‘&TV’, aimed at non-ZEE viewers. Continued operating leverage: ZEE is confident of flat margins in FY16 despite
higher investments, implying continued operating leverage in existing portfolio.

Thematic | Good-to-Great
September 2015 26
Expected Results: Strong improvement in returns
IndusInd Bank Healthy core revenues (5.6% of assets: best in industry), strong growth, high
margins and productivity gains should enable steady-state RoA of 2%+ and ~30% earnings CAGR over FY15-18.
Recent capital infusion would result in >600bp increase in tier-I ratio – sufficient for 3-4 years of 25%+ loan growth.
CASA ratio is expected to improve by 500bp+ to ~40% over FY15-18. ITC We expect operating margins to expand from 37.4% in FY15 to 39.2% in FY17. RoE and RoCE should remain steady at 33-34% and 40-42%, respectively. We view ITC as a medium-term play, given its dominance in its core franchise,
relatively cheap valuations in consumer universe, and muted expectations. Larsen & Toubro Core E&C revenue could double over next three years, as domestic intake in
FY15 was INR943b while revenue was INR460b. ‘Portfolio churn’ in concession portfolio and service segments would aid value
unlocking. Manufacturing business would be an important growth driver. We expect consolidated RoE to improve from 14% to 20% over next 3 years. Infotech / Tech Services IPO is expected by July 2016. Maruti Suzuki We expect MSIL’s market share increase (of ~200bp), coupled with better mix
would drive ~20% revenue CAGR in FY15-18. Discount moderation (+150bp over FY15), weak commodity prices (~100bp) and
op. leverage (50bp) could improve margin, leading to ~42% EPS CAGR (FY15-18). We expect RoE to improve by ~6pp to 22.6%, RoIC by 33.7pp to 59.3% by FY18. UltraTech Cement Growth: UTCEM would have ~18% capacity market share by FY18, aiding
industry-leading volume growth (11-12%) and strong operating leverage. Significant margin/RoE expansion: Cost initiatives and increase in pricing power
would drive 7-8pp margin and RoE expansion over FY16-18. Self-sustaining growth: FCFE generation of INR40b-45b per year from FY18
would help annual capacity growth of ~8% using only internal accruals. United Spirits We expect EBITDA margin to expand to 12.6% by FY17, as initial rounds of cost
saving kick in. We build in 20% EBITDA margin by 2020. We expect UNSP’s market share to remain steady in the Popular segment, but
inch up 100-150bp per annum in the Prestige+ segment. We also expect net debt to halve by FY18 from the existing INR46b [D/E of 1.3x]. Zee Entertainment 20% revenue CAGR: 22%/24% ad/domestic subs revenue CAGR led by mkt share
gains in rebounding ad market and increase in broadcasters' share of subscription revenue
25%+ EBITDA/PAT CAGR: EBITDA/PAT to double over FY15-18 (we are 10-20% above consensus). EBITDA margin to rebound sharply in FY17/18 to ~30% by FY18. We model 170bp margin decline in FY16 due to first year losses for &TV
RoE/RoCE of 30%+: RoE of 30%+; RoCE to increase from 27% to 36% (FY15-18). A detailed account of the industry dynamics, key elements of management strategy along with the actions and the results is presented in annexures.

September 2015 27
Thematic | Good to great
Exhibit 16: The complete list of 60 companies along with key metrics Static Dynamic Industry
Attractiveness Disciplined
Management Disciplined
Thought Disciplined
Action Expected Results
Mkt Cap P/B (x) P/E (x) EPS growth (%) ROE (%) ROCE/ROA (%) Company Sector Value Value (USD B) FY15 FY16E FY17E FY18E FY15 FY16E FY17E FY18E FY15 FY16E FY17E FY18E FY15 FY16E FY17E FY18E FY15 FY16E FY17E FY18E Bajaj Auto Auto Y N Y Y Y Y 9.5 6.0 5.2 4.4 3.8 21.0 16.9 13.1 12.0 -6.0 23.9 29.0 9.2 30.0 33.0 36.5 34.2 42.7 46.5 49.1 47.1 Tata Motors Auto Y Y Y Y Y Y 15.8 1.8 1.4 1.1 0.9 7.4 7.5 6.0 4.6 -1.1 -1.0 25.3 30.0 23.1 21.9 21.2 22.3 24.2 18.0 18.5 19.6 ACC Cement Y Y Y Y N N 3.9 3.1 3.0 2.9 2.6 29.5 32.4 19.0 12.9 -5.3 -9.1 70.9 47.4 10.7 9.5 15.8 21.6 13.4 12.2 20.4 27.7 Cadila Health Healthcare Y Y N N N N 5.7 8.8 6.7 5.0 3.8 31.2 23.3 17.4 13.5 45.5 33.7 34.3 28.7 30.8 34.7 34.8 32.3 24.9 31.2 33.3 33.2 Hindustan Zinc Metals Y N N Y Y N 7.8 1.3 1.2 1.1 1.0 6.9 8.2 8.0 7.8 18.0 -16.4 3.1 1.5 20.1 14.9 13.9 12.9 22.5 16.9 16.5 15.5 Cairn India Oil & Gas Y N N N N N 3.5 0.5 0.5 0.4 0.4 6.1 8.6 9.8 8.1 -63.3 -28.7 -11.9 20.7 12.0 5.3 4.5 5.3 12.2 6.0 6.4 7.4 HPCL Oil & Gas Y Y Y Y Y Y 3.9 1.7 1.4 1.3 1.1 9.7 8.0 7.4 6.5 57.6 21.9 8.2 13.0 17.6 19.3 18.4 18.5 11.0 14.5 14.2 14.8 IOC Oil & Gas Y Y Y Y Y Y 13.8 1.4 1.3 1.1 1.0 30.5 7.8 7.4 6.4 -39.2 289.9 5.8 15.2 4.7 17.2 16.1 16.7 6.4 16.4 15.5 16.5 Oil India Oil & Gas Y N Y Y N N 3.9 1.2 1.1 1.0 0.9 10.5 7.4 6.6 6.2 -15.8 40.6 13.0 6.6 11.7 15.3 15.9 15.5 12.8 17.6 18.3 18.3 ONGC Oil & Gas Y N Y Y N N 29.2 1.0 1.0 0.9 0.8 10.8 7.7 6.3 5.9 -32.0 40.6 22.7 5.9 10.0 13.1 14.7 14.2 9.3 10.9 12.3 12.1 DLF Real Estate Y N N N N N 2.6 0.7 0.7 0.7 0.7 38.4 23.4 19.7 15.2 -16.5 64.0 19.0 29.8 1.9 3.0 3.5 4.4 5.7 6.9 7.3 8.0 NTPC Utilities Y N N Y Y N 14.2 1.2 1.2 1.1 1.0 10.4 9.8 8.6 6.8 -8.9 6.8 13.9 25.7 10.8 12.2 13.8 16.0 8.4 9.7 11.3 13.3 Power Grid Corp. Utilities Y N N Y Y N 10.3 1.7 1.5 1.4 1.3 12.7 11.3 9.2 8.8 13.1 13.1 21.8 4.9 13.9 14.3 15.8 15.0 8.0 8.3 9.0 9.0 Axis Bank Banking Y Y Y Y Y Y 17.2 2.5 2.1 1.8 1.6 15.1 12.8 10.8 9.1 17.3 18.3 18.7 18.6 17.8 18.0 18.4 18.7 1.7 1.8 1.8 1.8 ICICI Bank Banking Y Y Y Y Y Y 23.4 2.2 2.0 1.7 1.5 13.4 11.8 10.0 8.4 13.5 13.2 17.8 18.9 15.2 15.0 15.6 16.3 1.8 1.8 1.8 1.8 IndusInd Bank Banking Y Y Y Y Y Y 7.5 4.3 2.9 2.5 2.2 24.8 20.1 16.1 12.6 26.5 23.5 24.5 27.8 19.0 18.0 16.8 18.5 1.8 2.0 2.1 2.2 State Bank Banking Y Y N Y Y Y 27.5 1.1 1.0 0.9 0.8 9.9 8.8 7.1 5.6 19.9 12.0 23.9 27.3 11.9 12.1 13.4 15.2 0.7 0.7 0.8 0.8 IDFC NBFCs Y Y Y Y Y Y 3.0 1.2 1.1 1.0 11.5 13.1 11.1 -6.1 -12.6 18.5 10.9 10.1 11.4 13.9 2.3 1.1 1.5 1.6 Power Finance Corp NBFCs Y N N N N N 3.9 0.8 0.7 0.6 0.5 4.3 3.8 3.3 2.9 12.1 13.3 15.3 15.8 20.7 20.3 20.2 20.2 3.1 3.1 3.1 3.1 Rural Electric. Corp. NBFCs Y N N N N N 3.3 0.9 0.8 0.7 0.6 4.5 3.7 3.1 2.7 7.6 20.4 19.4 16.3 22.7 22.9 22.9 22.3 3.2 3.2 3.2 3.2 Shriram Transport Fin. NBFCs Y Y N N N N 2.8 2.1 1.9 1.6 1.4 18.9 13.1 10.6 8.4 -24.3 44.0 24.1 25.8 14.1 14.7 16.5 17.9 2.0 2.2 2.5 2.7 * ROE/ROA for IDFC Bank; scheduled to start operations in 2HFY16 Eicher Motors Auto Y Y Y Y Y Y 7.5 19.5 16.0 10.6 5.3 79.9 49.6 28.5 17.9 55.6 61.2 73.9 59.5 26.9 35.4 44.7 34.3 27.6 38.3 52.5 43.8 Maruti Suzuki Auto Y Y Y Y Y Y 19.3 5.2 4.5 3.7 3.0 32.4 22.9 16.2 12.6 32.9 41.7 40.9 29.0 15.7 19.2 22.7 23.8 20.8 26.5 30.1 31.6 Bajaj Auto Auto Y N Y Y Y Y 9.5 6.0 5.2 4.4 3.8 21.0 16.9 13.1 12.0 -6.0 23.9 29.0 9.2 30.0 33.0 36.5 34.2 42.7 46.5 49.1 47.1 Mahindra & Mahindra Auto Y Y N Y Y N 11.6 3.4 3.0 2.5 2.2 23.3 15.5 11.4 9.0 -34.2 50.4 35.9 26.9 15.9 16.9 18.0 17.2 16.3 18.7 20.2 19.5 Bharat Forge Auto Y Y Y Y Y Y 3.9 7.3 6.0 4.9 3.9 34.2 26.0 19.5 15.1 64.8 31.5 33.0 29.0 24.1 25.4 27.7 28.7 22.0 26.5 30.6 34.0 Havells India Capital Goods Y Y Y Y Y Y 2.3 8.8 7.6 6.4 5.4 31.0 27.5 21.5 17.2 -4.7 12.9 27.6 25.2 28.4 27.6 29.9 31.2 27.7 35.7 40.0 43.3 Bharat Electronics Capital Goods Y Y Y N N Y 3.8 3.3 2.9 2.6 2.3 22.2 19.6 16.7 16.6 25.4 12.9 17.9 0.5 14.7 14.7 15.3 14.1 18.5 18.5 19.2 17.6 Cummins India Capital Goods Y Y Y Y Y Y 4.4 10.1 9.1 8.0 6.9 42.8 35.0 28.3 24.3 15.9 22.4 23.4 16.6 23.6 25.9 28.3 28.3 22.2 24.3 27.3 28.4 Larsen & Toubro Capital Goods Y Y Y Y Y Y 22.7 3.8 3.5 3.1 2.7 31.7 29.4 22.2 15.8 11.5 7.8 32.4 40.0 12.9 13.3 15.1 17.5 11.9 12.1 13.5 15.6 ACC Cement Y Y Y Y N N 3.9 3.1 3.0 2.9 2.6 29.5 32.4 19.0 12.9 -5.3 -9.1 70.9 47.4 10.7 9.5 15.8 21.6 13.4 12.2 20.4 27.7 Ultratech Cement Cement Y Y Y Y Y Y 11.7 4.2 3.8 3.3 2.8 39.7 31.3 22.7 15.2 -2.9 26.9 37.6 49.7 11.2 12.8 15.6 19.9 14.1 15.5 18.6 21.8 Colgate Consumer Y N Y Y Y Y 4.0 33.3 30.2 27.0 22.6 45.9 41.1 32.2 27.4 13.9 11.7 27.8 17.4 81.6 77.1 88.8 89.9 111.3 107.3 124.7 125.7 Godrej Consumer Consumer Y Y Y Y N Y 6.3 9.4 7.9 6.6 5.5 47.6 34.2 28.2 24.0 19.6 38.9 21.4 17.7 21.4 24.2 25.5 25.0 18.9 21.7 23.9 23.7 Marico Consumer Y Y Y Y Y N 3.8 14.3 10.2 8.6 7.2 45.4 37.0 29.6 25.5 18.1 22.6 25.1 16.0 36.0 32.1 31.5 30.6 35.6 35.3 35.2 34.8 Hind. Unilever Consumer Y Y Y Y Y N 27.7 48.2 47.0 46.9 39.6 47.5 41.2 34.6 30.5 6.4 15.3 19.1 13.3 108.1 115.6 135.8 140.8 137.6 153.5 179.4 186.1 Pidilite Inds. Consumer Y Y Y Y Y N 4.2 11.5 9.7 8.3 6.7 54.7 41.3 35.5 31.0 9.9 32.3 16.6 14.5 23.1 25.5 25.2 23.3 28.2 33.1 32.7 30.9 Asian Paints Consumer Y Y Y Y Y N 12.1 16.4 13.9 11.5 9.4 54.8 41.7 33.8 29.4 15.8 31.4 23.4 15.0 32.4 36.1 37.2 35.2 34.6 39.2 41.3 38.7 GSK Consumer Consumer Y N Y Y Y Y 3.7 12.0 10.2 8.6 7.1 43.5 35.3 29.3 24.9 -13.5 23.2 20.5 17.5 29.7 31.2 31.8 31.2 36.4 37.1 37.7 36.2 ITC Consumer Y Y Y Y Y Y 38.5 8.3 7.3 6.5 5.7 26.4 23.3 21.1 19.2 8.5 13.3 10.4 9.6 33.7 33.3 32.7 31.5 41.8 41.1 40.6 39.3 Dabur Consumer Y Y Y Y Y N 7.2 14.9 12.1 10.0 8.1 47.0 38.5 32.8 28.7 15.7 22.2 17.1 14.2 35.5 34.8 33.4 31.2 29.7 30.7 30.8 29.7 United Spirits Consumer Y Y Y Y Y Y 6.8 14.1 12.4 10.2 8.1 -67.7 103.2 56.6 38.4 426.4 -165.6 82.2 47.3 -21.7 12.8 19.8 21.1 0.7 14.8 20.4 25.3 GSK Pharma Healthcare Y Y Y Y Y Y 4.3 15.6 16.1 16.6 16.1 53.9 50.0 45.2 38.5 11.1 7.9 10.5 17.6 23.1 32.3 36.8 41.8 35.3 47.4 54.0 61.4 Cadila Health Healthcare Y Y N N N N 5.7 8.8 6.7 5.0 3.8 31.2 23.3 17.4 13.5 45.5 33.7 34.3 28.7 30.8 34.7 34.8 32.3 24.9 31.2 33.3 33.2 Divis Labs Healthcare Y Y Y Y Y Y 4.4 8.3 7.1 6.1 5.1 33.9 28.1 22.7 18.4 10.1 21.0 23.5 23.4 26.4 27.3 28.8 30.2 33.0 34.8 36.8 38.6 Glenmark Pharma Healthcare Y Y N Y Y Y 4.6 9.3 7.1 5.4 4.1 58.7 29.3 23.3 17.4 -37.8 100.4 25.9 33.3 15.8 24.3 23.0 23.4 14.4 22.0 25.4 26.4 Cipla Healthcare Y Y N N N N 7.6 4.8 4.1 3.6 3.1 44.2 25.6 23.9 20.0 -14.8 72.8 6.7 19.5 11.0 16.2 15.0 15.4 14.1 20.1 18.9 19.6 Dr Reddy’ s Labs Healthcare Y Y Y Y Y Y 10.3 6.2 5.1 4.3 3.6 31.2 25.5 21.3 18.1 4.5 22.3 19.5 17.8 19.9 20.2 20.0 19.6 16.9 19.5 19.9 20.7 Zee Entertainment Media Y Y Y Y Y Y 5.2 9.8 8.2 6.6 5.1 35.5 31.8 23.8 18.0 9.7 11.5 33.5 32.7 31.2 28.0 30.5 32.0 27.3 27.3 31.8 36.4 Oil India Oil & Gas Y N Y Y N N 3.9 1.2 1.1 1.0 0.9 10.5 7.4 6.6 6.2 -15.8 40.6 13.0 6.6 11.7 15.3 15.9 15.5 12.8 17.6 18.3 18.3 Reliance Inds. Oil & Gas Y Y N N Y N 40.2 1.1 1.0 0.9 0.8 10.8 9.8 8.4 7.0 3.2 9.3 17.9 20.2 11.0 11.0 11.9 12.8 10.2 10.2 11.2 12.8 GAIL Oil & Gas Y N Y Y N N 5.2 1.2 1.1 1.1 1.0 11.9 12.5 9.2 8.1 -31.6 -4.9 35.9 13.5 10.8 9.4 11.9 12.4 11.1 10.9 13.9 14.7 Coal India Utilities Y N N Y Y N 31.9 5.4 5.2 5.0 4.8 16.0 14.8 12.5 11.2 -14.1 7.9 18.0 12.0 34.0 35.4 40.1 43.0 54.3 56.7 63.3 66.9 Axis Bank Banking Y Y Y Y Y Y 17.2 2.5 2.1 1.8 1.6 15.1 12.8 10.8 9.1 17.3 18.3 18.7 18.6 17.8 18.0 18.4 18.7 1.7 1.8 1.8 1.8 IndusInd Bank Banking Y Y Y Y Y Y 7.5 4.3 2.9 2.5 2.2 24.8 20.1 16.1 12.6 26.5 23.5 24.5 27.8 19.0 18.0 16.8 18.5 1.8 2.0 2.1 2.2 LIC Housing Fin NBFCs Y Y N N N N 3.2 2.7 2.3 1.9 1.6 15.5 12.1 9.7 8.3 12.1 28.1 25.2 17.0 17.5 20.3 21.4 21.1 1.4 1.5 1.6 1.5 Shriram Transport Fin. NBFCs Y Y N N N N 2.8 2.1 1.9 1.6 1.4 18.9 13.1 10.6 8.4 -24.3 44.0 24.1 25.8 14.1 14.7 16.5 17.9 2.0 2.2 2.5 2.7 Indiabulls Housing NBFCs Y Y N Y Y Y 3.8 3.9 3.5 3.0 2.5 13.5 11.5 9.6 8.0 14.2 17.1 19.9 19.9 30.8 32.3 33.5 34.3 4.0 3.9 3.8 3.6
Source: MOSL, Company

Thematic | Good-to-Great
September 2015 28
Annexure I: Static Value Picks
Annexure I: Static Value Picks BSE Sensex: 25,202 S&P CNX: 7,655 4 September 2015
Tata Motors IOCL ICICI Bank IDFC

Thematic | Good-to-Great
September 2015 29
The global luxury car industry has grown at a CAGR of ~17% over CY10-14, driven by a CAGR of ~26% in China. While Chinese luxury car demand has cooled off, with ~3% growth in 1HCY15, the long-term growth potential of Chinese markets remains intact.
JLR is a niche player in the global luxury car market, with ~8% share. While it enjoys strong brand equity in SUVs, it is yet to enjoy similar success with Jaguar in luxury cars.
India CV business is expected to benefit from cyclical recovery. However, increasing competitive intensity would result in pressure on market share / margins.
Industry Attractiveness
Tata Motors CMP: INR323 TP: INR488 (+51%) Buy
Recently, Mr Cyrus Mistry took over as Chairman of Tata Motors (TTMT). Further, TTMT appointed Mr Mayank Pareek (ex-Marketing Head of Maruti Suzuki) as Head – PV Business, to revive its lost franchise in PVs.
Since TTMT’s acquisition of JLR, it has been investing aggressively in building capabilities in products, capacity and global footprint.
India business has seen significant pressure on balance sheet due to continued investments in products, impacting medium-term capital efficiency.
Disciplined Management
Focus on products: JLR has been focusing on filling gaps in its product portfolio. Similarly, India PV business is focused on correcting under-investment in products.
Focus on modular platform: JLR is focused on improving its platform efficiency by increasing model to platform ratio, in turn reducing capital intensity.
Focus on diversification of manufacturing footprint: JLR’s manufacturing base is entirely located in UK, resulting in high cost structure and forex volatility on imports.
Disciplined Thought
Focus on products: JLR has planned two launches per annum, along with several refreshes. This will help to fill gaps in its portfolio and expand addressable market manifold. Similarly, India business has also planned two launches per annum till 2020.
Focus on modular platform: Modular platform strategy is on track, with target of four cars per platform by FY18-19 (currently, two cars per platform).
Focus on diversification of manufacturing footprint: JLR now has plants in China and Brazil (upcoming), and is planning a plant in East Europe (Slovakia).
Disciplined Action
Success of Jaguar XE and F-Pace should result in ~2% market share gain for JLR in the luxury vehicle segment, and drive benefits of operating leverage for JLR.
JLR’s margins to see step-down due to (a) normalization of margins in China, and (b) accounting for JV, reflecting in 330bp decline in margins to 15.6% by FY18 (over FY15).
We lower our FY16/17E EPS by 17%/6% to INR43/54 to factor in for transitory issues. However, strong volume growth in JLR (~13% CAGR incl JV) and sharp India business
recovery would drive ~17% EPS CAGR over FY15-18.
Expected Results
Thematic | Good-to-Great
September 2015 30
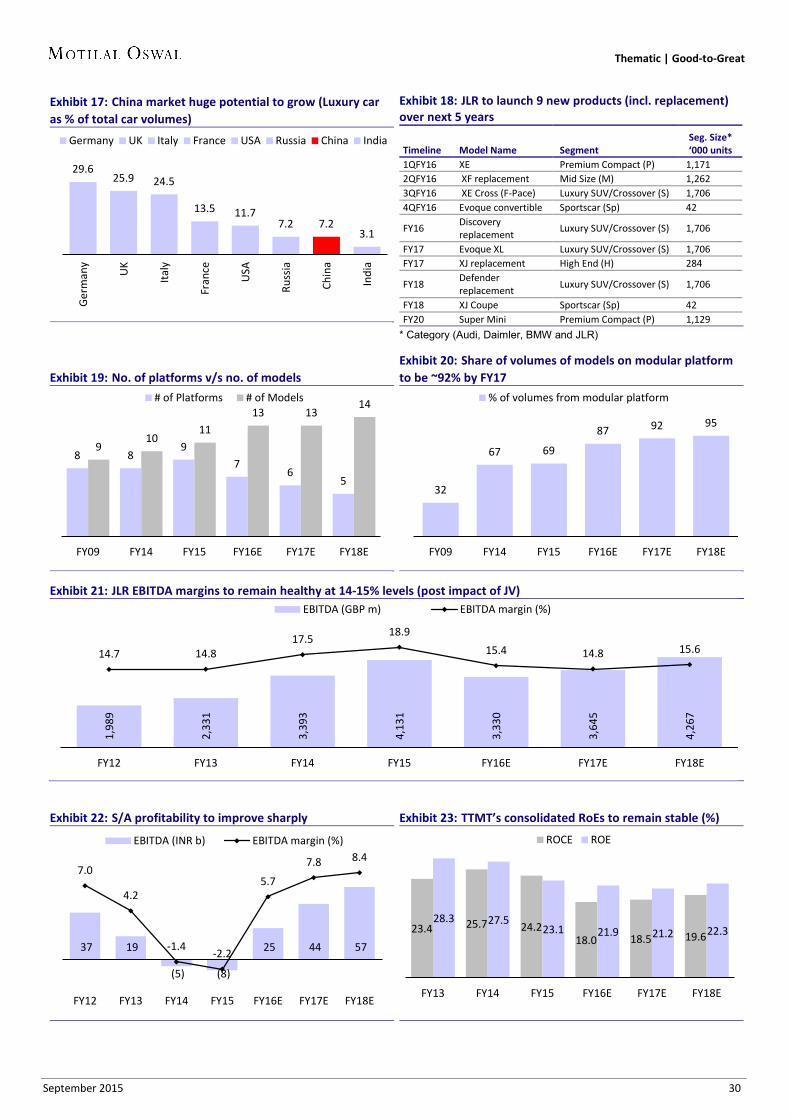
Exhibit 17: China market huge potential to grow (Luxury car as % of total car volumes)
Exhibit 18: JLR to launch 9 new products (incl. replacement) over next 5 years
Timeline Model Name Segment Seg. Size* ‘000 units
1QFY16 XE Premium Compact (P) 1,171 2QFY16 XF replacement Mid Size (M) 1,262 3QFY16 XE Cross (F-Pace) Luxury SUV/Crossover (S) 1,706 4QFY16 Evoque convertible Sportscar (Sp) 42
FY16 Discovery replacement Luxury SUV/Crossover (S) 1,706
FY17 Evoque XL Luxury SUV/Crossover (S) 1,706 FY17 XJ replacement High End (H) 284
FY18 Defender replacement Luxury SUV/Crossover (S) 1,706
FY18 XJ Coupe Sportscar (Sp) 42 FY20 Super Mini Premium Compact (P) 1,129
* Category (Audi, Daimler, BMW and JLR)
Exhibit 19: No. of platforms v/s no. of models
Exhibit 20: Share of volumes of models on modular platform to be ~92% by FY17
Exhibit 21: JLR EBITDA margins to remain healthy at 14-15% levels (post impact of JV)
Exhibit 22: S/A profitability to improve sharply
Exhibit 23: TTMT’s consolidated RoEs to remain stable (%)
29.6 25.9 24.5
13.5 11.7 7.2 7.2
3.1
Germ
any
UK
Italy
Fran
ce
USA
Russ
ia
Chin
a
Indi
a
Germany UK Italy France USA Russia China India
8 8 9
7 6
5
9 10
11 13 13
14
FY09 FY14 FY15 FY16E FY17E FY18E
# of Platforms # of Models
32
67 69
87 92 95
FY09 FY14 FY15 FY16E FY17E FY18E
% of volumes from modular platform
1,98
9
2,33
1
3,39
3
4,13
1
3,33
0
3,64
5
4,26
7
14.7 14.8 17.5 18.9
15.4 14.8 15.6
FY12 FY13 FY14 FY15 FY16E FY17E FY18E
EBITDA (GBP m) EBITDA margin (%)
37 19
(5) (8)
25 44 57
7.0
4.2
-1.4 -2.2
5.7
7.8 8.4
FY12 FY13 FY14 FY15 FY16E FY17E FY18E
EBITDA (INR b) EBITDA margin (%)
23.4 25.7 24.2 18.0 18.5 19.6
28.3 27.5 23.1 21.9 21.2 22.3
FY13 FY14 FY15 FY16E FY17E FY18E
ROCE ROE
Thematic | Good-to-Great
September 2015 31
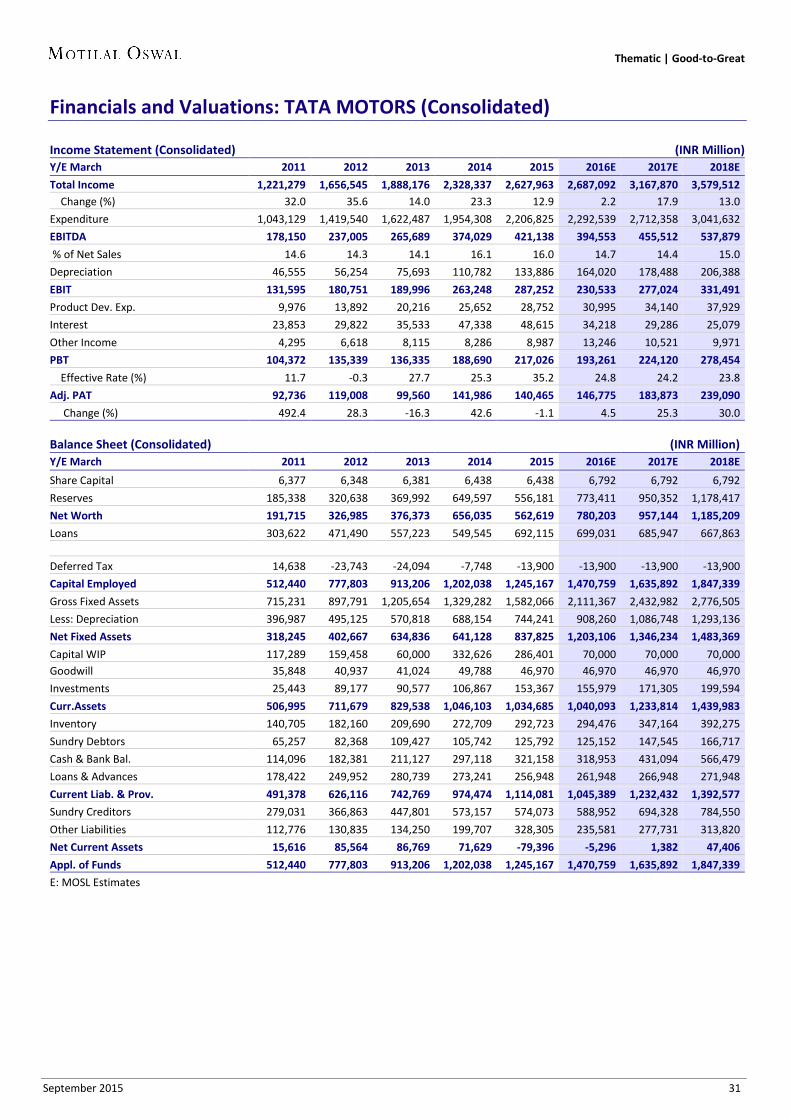
Financials and Valuations: TATA MOTORS (Consolidated)
Income Statement (Consolidated) (INR Million) Y/E March 2011 2012 2013 2014 2015 2016E 2017E 2018E Total Income 1,221,279 1,656,545 1,888,176 2,328,337 2,627,963 2,687,092 3,167,870 3,579,512 Change (%) 32.0 35.6 14.0 23.3 12.9 2.2 17.9 13.0 Expenditure 1,043,129 1,419,540 1,622,487 1,954,308 2,206,825 2,292,539 2,712,358 3,041,632 EBITDA 178,150 237,005 265,689 374,029 421,138 394,553 455,512 537,879 % of Net Sales 14.6 14.3 14.1 16.1 16.0 14.7 14.4 15.0 Depreciation 46,555 56,254 75,693 110,782 133,886 164,020 178,488 206,388 EBIT 131,595 180,751 189,996 263,248 287,252 230,533 277,024 331,491 Product Dev. Exp. 9,976 13,892 20,216 25,652 28,752 30,995 34,140 37,929 Interest 23,853 29,822 35,533 47,338 48,615 34,218 29,286 25,079 Other Income 4,295 6,618 8,115 8,286 8,987 13,246 10,521 9,971 PBT 104,372 135,339 136,335 188,690 217,026 193,261 224,120 278,454 Effective Rate (%) 11.7 -0.3 27.7 25.3 35.2 24.8 24.2 23.8 Adj. PAT 92,736 119,008 99,560 141,986 140,465 146,775 183,873 239,090 Change (%) 492.4 28.3 -16.3 42.6 -1.1 4.5 25.3 30.0
Balance Sheet (Consolidated) (INR Million) Y/E March 2011 2012 2013 2014 2015 2016E 2017E 2018E Share Capital 6,377 6,348 6,381 6,438 6,438 6,792 6,792 6,792 Reserves 185,338 320,638 369,992 649,597 556,181 773,411 950,352 1,178,417 Net Worth 191,715 326,985 376,373 656,035 562,619 780,203 957,144 1,185,209 Loans 303,622 471,490 557,223 549,545 692,115 699,031 685,947 667,863
Deferred Tax 14,638 -23,743 -24,094 -7,748 -13,900 -13,900 -13,900 -13,900 Capital Employed 512,440 777,803 913,206 1,202,038 1,245,167 1,470,759 1,635,892 1,847,339 Gross Fixed Assets 715,231 897,791 1,205,654 1,329,282 1,582,066 2,111,367 2,432,982 2,776,505 Less: Depreciation 396,987 495,125 570,818 688,154 744,241 908,260 1,086,748 1,293,136 Net Fixed Assets 318,245 402,667 634,836 641,128 837,825 1,203,106 1,346,234 1,483,369 Capital WIP 117,289 159,458 60,000 332,626 286,401 70,000 70,000 70,000 Goodwill 35,848 40,937 41,024 49,788 46,970 46,970 46,970 46,970 Investments 25,443 89,177 90,577 106,867 153,367 155,979 171,305 199,594 Curr.Assets 506,995 711,679 829,538 1,046,103 1,034,685 1,040,093 1,233,814 1,439,983 Inventory 140,705 182,160 209,690 272,709 292,723 294,476 347,164 392,275 Sundry Debtors 65,257 82,368 109,427 105,742 125,792 125,152 147,545 166,717 Cash & Bank Bal. 114,096 182,381 211,127 297,118 321,158 318,953 431,094 566,479 Loans & Advances 178,422 249,952 280,739 273,241 256,948 261,948 266,948 271,948 Current Liab. & Prov. 491,378 626,116 742,769 974,474 1,114,081 1,045,389 1,232,432 1,392,577 Sundry Creditors 279,031 366,863 447,801 573,157 574,073 588,952 694,328 784,550 Other Liabilities 112,776 130,835 134,250 199,707 328,305 235,581 277,731 313,820 Net Current Assets 15,616 85,564 86,769 71,629 -79,396 -5,296 1,382 47,406 Appl. of Funds 512,440 777,803 913,206 1,202,038 1,245,167 1,470,759 1,635,892 1,847,339 E: MOSL Estimates

Thematic | Good-to-Great
September 2015 32
Financials and Valuations: TATA MOTORS (Consolidated)
Ratios
Y/E March 2011 2012 2013 2014 2015 2016E 2017E 2018E
Basic (INR)
EPS 29.1 37.5 31.2 44.1 43.6 43.2 54.1 70.4
EPS Fully Diluted 28.8 37.0 30.9 44.1 43.6 43.2 54.1 70.4
Cash EPS 43.7 55.2 54.9 78.5 85.2 91.5 106.7 131.2
Book Value (Rs/Share) 60.1 103.0 118.0 203.8 174.8 229.7 281.9 349.0
DPS 4.0 4.0 2.0 2.0 0.0 1.0 3.0 4.0
Payout (Incl. Div. Tax) % 15.8 12.4 7.4 5.3 0.0 2.8 6.7 6.8
Valuation (x)
Consolidated P/E 7.3 7.4 7.5 6.0 4.6 Normalized P/E 18.2 23.0 33.7 17.3 9.8 EV/EBITDA 3.2 3.0 3.3 2.6 1.9 EV/Sales 0.5 0.5 0.5 0.4 0.3 Price to Book Value 1.6 1.8 1.4 1.1 0.9 Profitability Ratios (%)
RoE 48.4 45.9 28.3 27.5 23.1 21.9 21.2 22.3
RoCE 26.5 29.0 23.4 25.7 24.2 18.0 18.5 19.6
Turnover Ratios
Debtors (Days) 20 18 21 17 17 17 17 17
Inventory (Days) 42 40 41 43 41 40 40 40
Creditors (Days) 83 81 87 90 80 80 80 80
Asset Turnover (x) 2.4 2.1 2.1 1.9 2.1 1.8 1.9 1.9
Leverage Ratio
Debt/Equity (x) 1.6 1.4 1.5 0.8 1.2 0.9 0.7 0.6
Cash Flow Statement (INR Million) Y/E March 2011 2012 2013 2014 2015 2016E 2017E 2018E
OP/(Loss) before Tax 92,736 135,165 98,926 139,910 139,863 146,775 183,873 239,090
Int/Div. Received 4,115 5,376 8,062 6,933 7,777 13,246 10,521 9,971
Depreciation 46,510 56,209 75,648 110,736 133,864 164,020 178,488 206,388
Direct Taxes Paid -13,912 -17,679 -22,231 -43,083 -41,940 -48,006 -54,297 -66,188
(Inc)/Dec in WC -40,484 -22,801 -680 57,744 -36,718 -76,304 105,462 89,362
Other Items 29,639 24,401 64,617 88,983 136,570 1,091 1,276 1,465
CF from Op Activity 118,604 180,670 224,343 361,223 339,415 200,822 425,323 480,088
Extra-ordinary Items -7,773 8,549 4,342 7,221 20,191 0 0 0
CF after EO Items 110,830 189,219 228,684 368,444 359,606 200,822 425,323 480,088
(Inc)/Dec in FA+CWIP -81,128 -137,829 -187,203 -269,252 -315,396 -312,900 -321,616 -343,522
(Pur)/Sale of Invest. 4,158 -72,976 -54,984 -36,611 -37,570 -2,611 -15,326 -28,289
CF from Inv Activity -76,970 -210,804 -242,188 -305,863 -352,966 -315,511 -336,942 -371,812
Issue of Shares 32,550 1,386 7 1 0 74,901 5,344 5,344
Inc/(Dec) in Debt -11,677 113,054 45,082 30,092 122,288 6,916 -13,084 -18,084
Interest Paid -24,691 -33,737 -46,560 -61,706 -63,070 -34,218 -29,286 -25,079
Dividends Paid -10,195 -15,031 -15,087 -7,220 -7,204 -4,092 -12,276 -16,368
CF from Fin Activity -14,013 65,672 -16,558 -38,832 52,014 43,508 -49,302 -54,188
Inc/(Dec) in Cash 19,848 44,087 -30,061 23,749 58,655 -71,182 39,079 54,089
Add: Beginning Bal. 67,920 104,244 153,550 142,531 152,629 211,283 140,101 179,181
Closing Balance 87,768 148,330 123,488 166,280 211,283 140,101 179,181 233,270
Thematic | Good-to-Great
September 2015 33
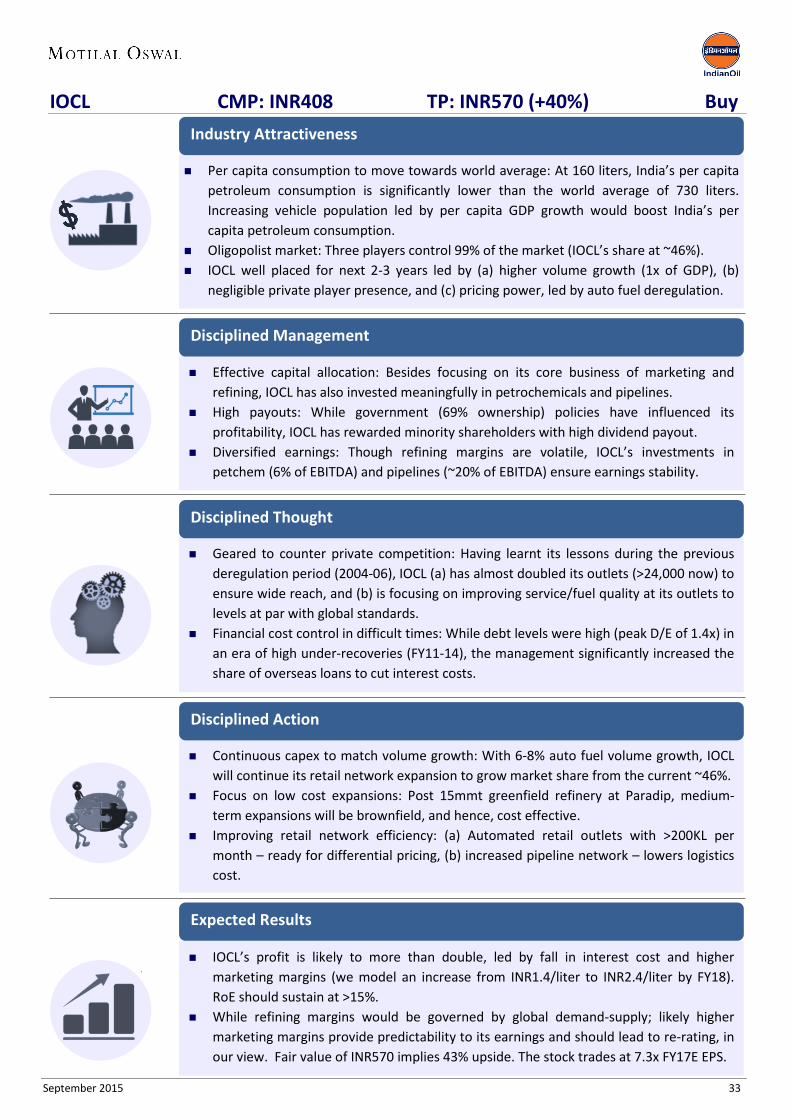
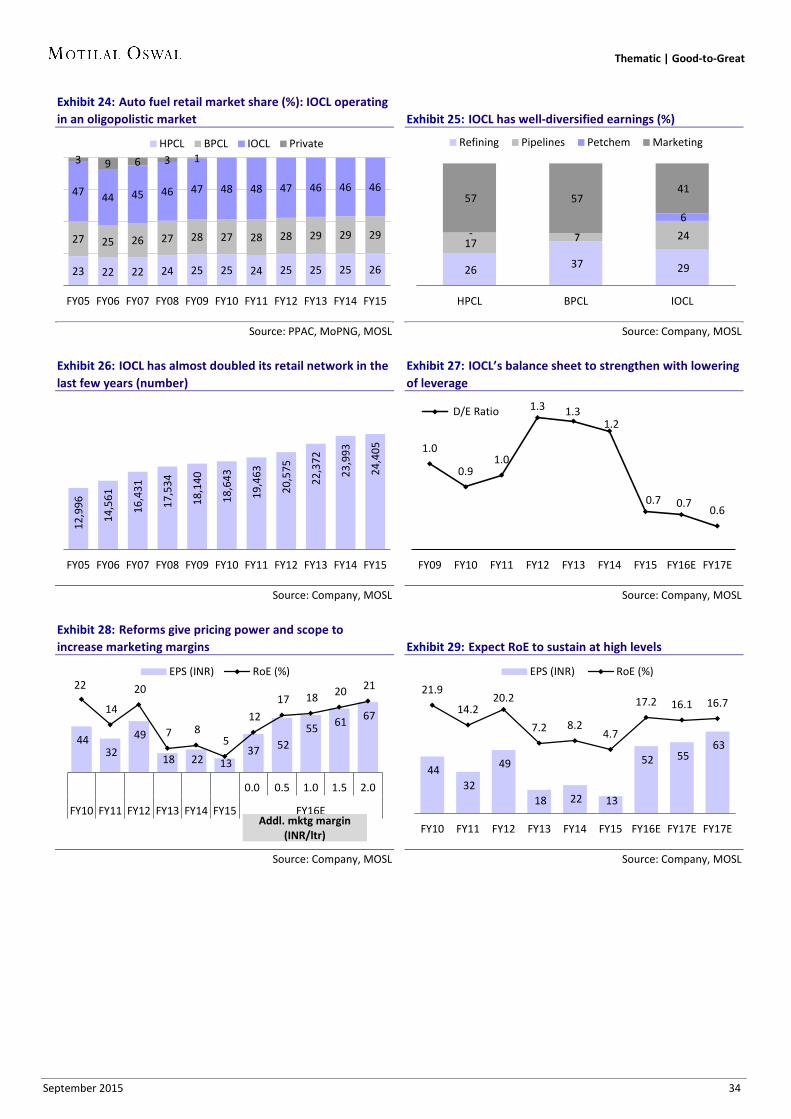
Per capita consumption to move towards world average: At 160 liters, India’s per capita petroleum consumption is significantly lower than the world average of 730 liters. Increasing vehicle population led by per capita GDP growth would boost India’s per capita petroleum consumption.
Oligopolist market: Three players control 99% of the market (IOCL’s share at ~46%). IOCL well placed for next 2-3 years led by (a) higher volume growth (1x of GDP), (b)
negligible private player presence, and (c) pricing power, led by auto fuel deregulation.
Industry Attractiveness
IOCL CMP: INR408 TP: INR570 (+40%) Buy
Effective capital allocation: Besides focusing on its core business of marketing and refining, IOCL has also invested meaningfully in petrochemicals and pipelines.
High payouts: While government (69% ownership) policies have influenced its profitability, IOCL has rewarded minority shareholders with high dividend payout.
Diversified earnings: Though refining margins are volatile, IOCL’s investments in petchem (6% of EBITDA) and pipelines (~20% of EBITDA) ensure earnings stability.
Disciplined Management
Geared to counter private competition: Having learnt its lessons during the previous deregulation period (2004-06), IOCL (a) has almost doubled its outlets (>24,000 now) to ensure wide reach, and (b) is focusing on improving service/fuel quality at its outlets to levels at par with global standards.
Financial cost control in difficult times: While debt levels were high (peak D/E of 1.4x) in an era of high under-recoveries (FY11-14), the management significantly increased the share of overseas loans to cut interest costs.
Disciplined Thought
Continuous capex to match volume growth: With 6-8% auto fuel volume growth, IOCL will continue its retail network expansion to grow market share from the current ~46%.
Focus on low cost expansions: Post 15mmt greenfield refinery at Paradip, medium-term expansions will be brownfield, and hence, cost effective.
Improving retail network efficiency: (a) Automated retail outlets with >200KL per month – ready for differential pricing, (b) increased pipeline network – lowers logistics cost.
Disciplined Action
IOCL’s profit is likely to more than double, led by fall in interest cost and higher marketing margins (we model an increase from INR1.4/liter to INR2.4/liter by FY18). RoE should sustain at >15%.
While refining margins would be governed by global demand-supply; likely higher marketing margins provide predictability to its earnings and should lead to re-rating, in our view. Fair value of INR570 implies 43% upside. The stock trades at 7.3x FY17E EPS.
Expected Results
Thematic | Good-to-Great
September 2015 34
Exhibit 24: Auto fuel retail market share (%): IOCL operating in an oligopolistic market
Source: PPAC, MoPNG, MOSL
Exhibit 25: IOCL has well-diversified earnings (%)
Source: Company, MOSL
Exhibit 26: IOCL has almost doubled its retail network in the last few years (number)
Source: Company, MOSL
Exhibit 27: IOCL’s balance sheet to strengthen with lowering of leverage
Source: Company, MOSL
Exhibit 28: Reforms give pricing power and scope to increase marketing margins
Source: Company, MOSL
Exhibit 29: Expect RoE to sustain at high levels
Source: Company, MOSL
23 22 22 24 25 25 24 25 25 25 26
27 25 26 27 28 27 28 28 29 29 29
47 44 45 46 47 48 48 47 46 46 46
3 9 6 3 1
FY05 FY06 FY07 FY08 FY09 FY10 FY11 FY12 FY13 FY14 FY15
HPCL BPCL IOCL Private
26 37 29
17 7 24 - - 6
57 57 41
HPCL BPCL IOCL
Refining Pipelines Petchem Marketing
12,9
96
14,5
61
16,4
31
17,5
34
18,1
40
18,6
43
19,4
63
20,5
75
22,3
72
23,9
93
24,4
05
FY05 FY06 FY07 FY08 FY09 FY10 FY11 FY12 FY13 FY14 FY15
1.0
0.9 1.0
1.3 1.3 1.2
0.7 0.7 0.6
FY09 FY10 FY11 FY12 FY13 FY14 FY15 FY16E FY17E
D/E Ratio
44 32
49
18 22 13 37 52
55 61 67
22
14
20
7 8 5
12 17 18 20 21
0.0 0.5 1.0 1.5 2.0
FY10 FY11 FY12 FY13 FY14 FY15 FY16E
EPS (INR) RoE (%)
Addl. mktg margin (INR/ltr)
44 32
49
18 22 13
52 55 63
21.9
14.2 20.2
7.2 8.2 4.7
17.2 16.1 16.7
FY10 FY11 FY12 FY13 FY14 FY15 FY16E FY17E FY17E
EPS (INR) RoE (%)
Thematic | Good-to-Great
September 2015 35
Financials and Valuations: IOCL
Income Statement (Consolidated)
(INR Million) Y/E March 2010 2011 2012 2013 2014 2015 2016E 2017E 2018E Net Sales 2,501,053 3,081,315 4,072,314 4,607,497 4,872,595 4,483,152 3,056,179 3,375,281 3,644,027 Change (%) -12.6 23.2 32.2 13.1 5.8 -8.0 -31.8 10.4 8.0 Finished Gds Pur. 1,007,775 1,275,911 1,572,508 1,555,286 1,560,457 1,408,174 1,224,966 1,045,748 1,100,858 Raw Materials Cons 1,158,063 1,445,071 2,041,610 2,590,820 2,767,619 2,583,039 1,255,663 1,745,272 2,036,362 Other Operating Costs 206,462 235,028 277,923 334,015 384,808 398,514 323,602 317,692 207,978 EBITDA 128,753 125,305 180,273 127,377 159,711 93,424 251,948 266,568 298,829 % of Net Sales 5.1 4.1 4.4 2.8 3.3 2.1 8.2 7.9 8.2 Depreciation 35,552 49,326 53,093 56,915 63,600 52,190 51,897 63,730 74,222 Interest 17,262 29,803 58,947 70,835 59,079 41,746 29,880 36,584 32,984 Other Income 74,547 54,964 48,797 45,416 45,278 53,975 32,455 37,654 40,382 Excep/Prior period items 0 0 -77,078 0 17,468 16,681 16,725 0 0 PBT 150,486 101,140 39,953 45,042 99,778 70,143 219,351 203,908 232,006 Tax 40,499 20,284 -2,700 8,770 30,113 21,426 75,812 68,074 77,100 Rate (%) 26.9 20.1 -6.8 19.5 30.2 30.5 34.6 33.4 33.2 PAT 109,987 80,856 42,653 36,273 69,666 48,718 143,539 135,834 154,905 Minority interest -2,855 -2,549 -393 8,217 1,190 402 -1,022 -892 -848 Group net profit 107,132 78,307 42,260 44,490 70,856 49,120 142,517 134,942 154,058 Adj. net profit 107,132 78,307 119,338 44,490 53,388 32,439 125,792 134,942 154,058 Change (%) 312.1 -26.9 52.4 -62.7 20.0 -39.2 287.8 7.3 14.2
532,911
Balance Sheet (INR Million) Y/E March 2010 2011 2012 2013 2014 2015 2016E 2017E 2018E Share Capital 24,280 24,280 24,280 24,280 24,280 24,280 24,280 24,280 24,280 Reserves 500,344 551,473 579,454 606,092 654,851 664,043 761,109 847,759 947,844 Net Worth 524,623 575,752 603,734 630,372 679,130 688,323 785,389 872,039 972,123 Minority interest 18,330 19,930 19,437 12,618 11,706 10,733 11,755 12,647 13,494 Loans 494,726 578,376 800,153 867,894 889,325 581,541 601,551 601,551 529,071 Deferred Tax 54,170 70,282 59,696 63,323 64,228 68,356 100,680 102,670 104,935 Capital Employed 1,091,849 1,244,341 1,483,020 1,574,207 1,644,389 1,348,952 1,499,376 1,588,908 1,619,625
Gross Fixed Assets 788,886 1,008,694 1,076,256 1,151,002 1,269,522 1,375,223 1,478,123 1,911,023 2,003,923 Less: Depreciation 334,111 382,229 430,447 484,133 544,856 608,119 660,015 723,745 797,967 Net Fixed Assets 454,775 626,465 645,809 666,869 724,666 767,104 818,107 1,187,277 1,205,956 Capital WIP 227,678 142,842 154,496 272,400 380,609 403,781 403,781 73,781 73,781
Investments 214,298 186,469 175,879 173,508 158,950 160,687 160,687 160,687 160,687 Goodwill 224 235 244 870 878 705 705 705 705 Cash & Bank Balance 15,984 15,374 8,220 12,198 37,045 12,211 79,200 134,604 152,804 Inventory 410,765 549,171 638,510 666,043 723,394 499,174 463,147 505,269 535,014 Debtors 56,062 76,546 115,518 125,021 125,517 76,448 79,968 86,887 92,156 Loans & Advances 152,070 233,573 436,202 456,188 470,905 385,358 363,996 364,062 364,128 Other assets 15,264 15,060 23,387 44,148 44,484 31,487 31,802 32,120 32,441 Curr. Assets, L & Adv.
Liabilities 351,658 532,103 561,218 619,702 751,018 707,229 623,426 677,893 719,458 Provisions 103,612 69,291 154,028 223,335 271,040 280,773 278,590 278,590 278,590 Net Current Assets 194,874 288,330 506,591 460,560 379,287 16,676 116,097 166,459 178,497 Application of Funds 1,091,849 1,244,341 1,483,020 1,574,207 1,644,389 1,348,952 1,499,376 1,588,908 1,619,625 E: MOSL Estimates

Thematic | Good-to-Great
September 2015 36
Financials and Valuations: IOCL
Ratios Y/E March 2010 2011 2012 2013 2014 2015 2016E 2017E 2018E Basic (INR)
Adj. EPS 44.1 32.3 49.2 18.3 22.0 13.4 51.8 55.6 63.5 Reported EPS 44.1 32.3 17.4 18.3 29.2 20.2 58.7 55.6 63.5 Cash EPS 58.8 52.6 71.0 41.8 48.2 34.9 73.2 81.8 94.0 Book Value 216.1 237.1 248.7 259.6 279.7 283.5 323.5 359.2 400.4 Dividend 13.0 9.5 5.0 6.2 8.7 6.6 16.0 17.0 19.0 Payout (incl. Div. Tax.) 36.1 38.4 12.2 35.2 35.2 52.0 36.9 36.5 35.7 Valuation (x)
P/E 12.7 18.6 30.5 7.8 7.3 6.4 Cash P/E 7.8 8.5 11.7 5.5 5.0 4.3 EV / EBITDA 11.7 11.1 16.1 5.9 5.4 4.5 EV / Sales 0.5 0.4 0.3 0.5 0.4 0.4 Price / Book Value 1.7 1.5 1.4 1.3 1.1 1.0 Dividend Yield (%) 2.3 2.1 1.6 3.9 4.2 4.7 Profitability Ratios (%)
RoE 21.9 14.2 20.2 7.2 8.2 4.7 17.1 16.3 16.7 RoCE 16.0 11.2 12.9 7.6 8.8 6.4 16.3 15.6 16.5 Turnover Ratios
Debtors (No. of Days) 7.6 7.9 8.6 9.5 9.4 8.2 9.3 9.0 9.0 Asset Turnover (x) 3.4 3.4 3.9 4.1 4.0 3.4 2.1 2.0 1.9 Leverage Ratio
Debt / Equity (x) 0.9 1.0 1.3 1.4 1.3 0.8 0.8 0.7 0.5
Cash Flow Statement (INR Million)
Y/E March 2010 2011 2012 2013 2014 2015 2016E 2017E 2018E OP/(Loss) before Tax 150,486 101,140 39,953 45,042 99,779 70,144 219,351 203,908 232,006 Depreciation 35,677 49,529 49,839 57,103 63,691 51,904 51,897 63,730 74,222 Interest Paid 17,263 29,832 59,016 71,184 59,101 41,746 29,880 36,584 32,984 Direct Taxes Paid -27,296 -40,032 -4,066 -11,690 -18,956 -23,442 -43,488 -66,084 -74,836 (Inc)/Dec in WC -182,446 -50,193 -132,204 -44,530 54,506 348,952 -32,432 5,042 6,162 Other op activities -9,774 -19,684 -20,192 -23,715 -16,081 -29,542 0 0 0 CF from Op. Activity -16,090 70,592 -7,654 93,395 242,040 459,762 225,209 243,180 270,537
(Inc)/Dec in FA & CWIP -138,236 -137,164 -170,184 -127,995 -218,243 -131,590 -102,900 -102,900 -92,900 Free Cash Flow -154,325 -66,572 -177,838 -34,600 23,797 328,172 122,309 140,280 177,637 (Pur)/Sale of Investments 174,184 53,856 39,652 1,153 -1,889 -1,918 0 0 0 CF from Inv. Activity 35,948 -83,308 -130,532 -92,936 -185,944 -101,770 -102,900 -102,900 -92,900
Inc / (Dec) in Debt 21,257 83,652 222,728 96,681 55,975 -304,857 20,010 0 -72,480 Dividends Paid -10,907 -38,124 -28,057 -14,922 -18,501 -26,090 -45,451 -48,292 -53,973 Interest Paid -24,276 -33,418 -63,643 -78,240 -68,722 -51,879 -29,880 -36,584 -32,984 CF from Fin. Activity -13,925 12,110 131,028 3,519 -31,248 -382,827 -55,321 -84,876 -159,437
Inc / ( Dec) in Cash 5,933 -606 -7,158 3,978 24,847 -24,835 66,988 55,405 18,200 Add: Opening Balance 10,052 15,985 15,379 8,221 12,199 37,046 12,212 79,200 134,605 Closing Balance 15,985 15,379 8,221 12,199 37,046 12,212 79,200 134,605 152,805 E: MOSL Estimates

Thematic | Good-to-Great
September 2015 37
Industry Attractiveness
India presents a huge opportunity for banks. Only 40% of the population has access to banking. Credit-to-GDP is just ~52% against an average of ~90% for emerging markets and ~100% for developed markets.
Deepening financial penetration, increasing urbanization, and expansion of private banks into rural and semi-urban areas would drive retail loan growth. Consumer loans-to-GDP stands at just 15% against 20%+ for major economies.
ICICI Bank CMP: INR258 TP: INR450 (+74%) Buy
Since Ms Kochhar took charge in 2009, ICICI Bank (ICICIBC) has focused on improving profitability (16% PAT CAGR over FY10-15), with structural changes in ALM profile (helping NIM to expand ~100bp) and strong cost control (700bp decline in cost-to-income ratio to 37%, the lowest since 2002), leading to RoA improvement (from 1% in FY09 to 1.6%).
Growth consolidation and profit focus has helped improve subsidiaries’ performance. From a loss of INR6.7b in FY08, they posted a PAT of INR33.7b in FY15.
Disciplined Management
The management is focusing on secured loans to augment loan market share and maintain healthy credit quality. The retail segment remains a key focus area.
It is focusing on capital management to improve return ratios and enhance shareholder value, in which subsidiaries would play a major role.
To sustain dilution-free growth, ICICIBC is focusing on core profitability. It has enhanced margins and operating leverage, and is keeping a check on credit cost.
Disciplined Thought
Healthy retail loan growth: Retail loans have grown at a CAGR of 24% over FY13-15. The share of the retail segment has increased from 37% in FY12 to 42% in FY15. By moderating growth in loans to sensitive sectors (3% CAGR over FY13-15), ICICIBC has gradually lowered its exposure to these sectors to ~16%.
ICICIBC has regularly repatriated capital (USD2b till date) from overseas subsidiaries and increased dividend payout from domestic subsidiaries (INR29b over FY13-15).
Focus on operating leverage: Employees/branch have halved to 16 since 2008, CASA ratio has doubled, and share of retail fees has grown from 33% in 2011 to 52%.
Disciplined Action
In the medium term, we expect loan growth to continue being driven by the retail segment (25%+ CAGR), with funding from relatively low cost retail liabilities.
Cost control and productivity gains should continue. Focus on core profitability would lead to further improvement in core RoE (~17% in FY17, up 150bp from FY15).
Release of capital from subsidiaries would ensure dilution-free growth till FY18.
Expected Results

Thematic | Good-to-Great
September 2015 38
Exhibit 30: Strong focus on core profitability would lead to further improvement in core RoA (1.8%+) and RoE (15%+)
Source: Company, MOSL
Exhibit 31: Retail loan growth is back to 25% levels (highest since FY08) - will remain a key focus area
Source: Company, MOSL
Exhibit 32: Contribution from retail segment now accounts for 17% of overall PBT v/s 6% in FY12
Source: Company, MOSL
Exhibit 33: Dividend income and capital repatriation from subsidiaries remains a key focus area
Source: Company, MOSL
Exhibit 34: In-line performance v/s Sensex…
Source: Company, MOSL
Exhibit 35: …and BSE100
Source: Company, MOSL
0.96 1.08 1.34 1.44 1.62 1.73 1.80 1.81 1.82 1.84
9.1 9.6 11.5
12.8 14.8 15.2 15.2 15.0 15.6 16.3
FY09
FY10
FY11
FY12
FY13
FY14
FY15
FY16
E
FY17
E
FY18
E
RoA RoE
1,277 1,317 1,070
790 837 964 1,074
1,320 1,644 39
3
-19 -26
6 15 11
23 25
FY07
FY08
FY09
FY10
FY11
FY12
FY13
FY14
FY15
Retail Loans (INR b) Growth YoY (%)
71 58 47 39
2 3
24 32
38 41
6 8 13 17
FY12 FY13 FY14 FY15
Wholesale Others Treasury Retail
7 7 6
8 8
11
14
FY09 FY10 FY11 FY12 FY13 FY14 FY15
Dividend & Repatriation income as % of PBT
131
141
50
80
110
140
170
Mar
-11
Sep-
11
Feb-
12
Jul-1
2
Dec-
12
Jun-
13
Nov
-13
Apr-
14
Oct
-14
Mar
-15
Aug-
15
ICICI Bank Sensex-Rebased
131
145
40
80
120
160
200
Mar
-11
Sep-
11
Feb-
12
Jul-1
2
Dec-
12
Jun-
13
Nov
-13
Apr-
14
Oct
-14
Mar
-15
Aug-
15
ICICI Bank BSE 100- Rebased

Thematic | Good-to-Great
September 2015 39
Financials and Valuations: ICICI Bank
Income Statement
(INR Million) Y/E March 2010 2011 2012 2013 2014 2015 2016E 2017E 2018E Interest Income 257,069 259,741 335,427 400,756 441,782 490,911 542,208 625,289 742,776 Interest Expended 175,926 169,572 228,085 262,092 277,026 300,515 328,285 370,681 437,920 Net Interest Income 81,144 90,169 107,342 138,664 164,756 190,396 213,923 254,608 304,856 Change (%) -3.0 11.1 19.0 29.2 18.8 15.6 12.4 19.0 19.7 Other Income 74,777 66,479 75,028 83,457 104,279 121,761 137,791 157,528 183,336 Net Income 155,920 156,648 182,369 222,121 269,034 312,157 351,714 412,137 488,192 Change (%) -2.4 0.5 16.4 21.8 21.1 16.0 12.7 17.2 18.5 Operating Exp. 58,598 66,172 78,504 90,129 103,089 114,958 130,777 153,253 179,604 Operating Profits 97,322 90,475 103,865 131,992 165,946 197,199 220,937 258,884 308,588 Change (%) 9.0 -7.0 14.8 27.1 25.7 18.8 12.0 17.2 19.2 Provisions & Cont. 43,869 22,868 15,830 18,025 26,264 39,000 41,502 47,524 57,177 PBT 53,453 67,607 88,034 113,967 139,682 158,199 179,434 211,360 251,411 Tax 13,203 16,093 23,382 30,712 41,577 46,446 52,933 62,351 74,166 Tax Rate (%) 24.7 23.8 26.6 26.9 29.8 29.4 29.5 29.5 29.5 PAT 40,250 51,514 64,653 83,255 98,105 111,754 126,501 149,009 177,245 Change (%) 7.1 28.0 25.5 28.8 17.8 13.9 13.2 17.8 18.9 Dividend (Including Tax) 15,020 18,170 21,228 25,996 28,336 31,729 36,179 42,617 50,692 Core PPP* 85,512 92,625 103,995 127,042 155,776 180,269 202,314 238,399 286,054 Change (%) 0.8 8.3 12.3 22.2 22.6 15.7 12.2 17.8 20.0 *Core PPP is (NII+Fee income-Opex)
Balance Sheet
(INR Million)
Y/E March 2010 2011 2012 2013 2014 2015 2016E 2017E 2018E Share Capital 14,649 15,018 15,028 15,036 15,050 15,097 15,097 15,097 15,097 Equity Share Capital 11,149 11,518 11,528 11,536 11,550 11,597 11,597 11,597 11,597 Preference Capital 3,500 3,500 3,500 3,500 3,500 3,500 3,500 3,500 3,500 Reserves & Surplus 505,035 539,391 592,525 655,523 720,583 792,697 883,019 989,411 1,115,964 Net Worth 519,684 554,409 607,552 670,560 735,633 807,794 898,115 1,004,508 1,131,061 Of which Equity Net Worth 516,184 550,909 604,052 667,060 732,133 804,294 894,615 1,001,008 1,127,561 Deposits 2,020,166 2,256,021 2,555,000 2,926,136 3,319,137 3,615,627 4,431,595 5,386,187 6,548,418 Change (%) -7.5 11.7 13.3 14.5 13.4 8.9 22.6 21.5 21.6 Of which CASA Deposits 842,158 1,016,465 1,110,194 1,225,763 1,423,784 1,643,799 1,876,717 2,148,858 2,430,502 Change (%) 34.4 20.7 9.2 10.4 16.2 15.5 14.2 14.5 13.1 Borrowings 939,136 1,092,043 1,398,149 1,449,915 1,544,091 1,720,673 1,857,719 2,029,978 2,226,575 Other Liabilities & Prov. 155,012 159,864 329,987 321,336 347,555 317,199 366,744 424,408 491,121 Total Liabilities 3,633,997 4,062,337 4,890,688 5,367,947 5,946,416 6,461,293 7,554,173 8,845,080 10,397,174 Current Assets 388,737 340,901 362,293 414,175 415,296 423,046 495,612 569,779 678,209 Investments 1,208,928 1,346,860 1,595,600 1,713,936 1,770,218 1,581,292 1,818,486 2,045,797 2,301,521 Change (%) 17.3 11.4 18.5 7.4 3.3 -10.7 15.0 12.5 12.5 Loans 1,812,056 2,163,659 2,537,277 2,902,494 3,387,026 3,875,221 4,603,983 5,533,709 6,656,065 Change (%) -17.0 19.4 17.3 14.4 16.7 14.4 18.8 20.2 20.3 Net Fixed Assets 32,127 47,443 46,147 46,471 46,781 47,255 48,166 49,076 49,987 Other Assets 192,149 163,475 349,371 290,871 327,094 534,479 587,927 646,719 711,391 Total Assets 3,633,997 4,062,337 4,890,688 5,367,947 5,946,416 6,461,293 7,554,173 8,845,080 10,397,174 Asset Quality (%) GNPA (INR m) 94,807 100,343 94,753 96,078 105,058 150,947 159,819 167,953 179,873 NNPA (INR m) 38,411 24,074 18,608 22,306 32,980 62,555 61,852 58,897 54,519 GNPA Ratio 5.1 4.5 3.6 3.2 3.0 3.8 3.4 3.0 2.7 NNPA Ratio 2.1 1.1 0.7 0.8 1.0 1.6 1.3 1.1 0.8 PCR (Excl Technical write off) 59.5 76.0 80.4 76.8 68.6 58.6 61.3 64.9 69.7 E: MOSL Estimates

Thematic | Good-to-Great
September 2015 40
Financials and Valuations: ICICI Bank
Ratios Y/E March 2010 2011 2012 2013 2014 2015 2016E 2017E 2018E Spreads Analysis (%)
Avg. Yield - Earning Assets 7.9 7.7 8.5 8.8 8.7 8.9 8.9 8.7 8.7 Avg. Yield on loans 8.7 8.3 9.4 10.1 10.0 9.8 9.3 9.2 9.3 Avg. Yield on Investments 5.8 6.2 6.6 6.7 6.6 6.3 6.5 6.1 6.1 Avg. Cost-Int. Bear. Liab. 5.2 4.8 5.6 5.7 5.5 5.5 5.3 5.1 5.1 Avg. Cost of Deposits 5.5 4.7 5.9 6.2 5.7 5.9 5.5 5.3 5.4 Interest Spread 2.7 2.9 2.8 3.0 3.2 3.5 3.6 3.6 3.6 Net Interest Margin 2.5 2.7 2.7 3.0 3.2 3.47 3.5 3.5 3.6 Profitability Ratios (%)
RoE 8.0 9.7 11.3 13.3 14.4 15.0 15.3 16.1 17.0 Adjusted RoE 9.6 11.5 12.8 14.8 15.2 15.2 15.0 15.6 16.3 RoA 1.1 1.3 1.4 1.62 1.73 1.80 1.81 1.82 1.84 Int. Expended/Int.Earned 68.4 65.3 68.0 65.4 62.7 61.2 60.5 59.3 59.0 Other Inc./Net Income 48.0 42.4 41.1 37.6 38.8 39.0 39.2 38.2 37.6 Efficiency Ratios (%)
Op. Exps./Net Income* 40.7 41.7 43.0 41.5 39.8 38.9 39.3 39.1 38.6 Empl. Cost/Op. Exps. 32.9 42.6 44.8 43.2 40.9 41.3 40.7 40.3 39.9 Busi. per Empl. (INR m) 99.8 72.4 81.6 88.0 86.8 104.6 112.5 128.7 147.7 NP per Empl. (INR lac) 9.8 9.0 11.1 13.4 13.6 16.5 17.2 19.2 21.7 * ex treasury Asset-Liability Profile (%)
Loan/Deposit Ratio 89.7 95.9 99.3 99.2 102.0 107.2 103.9 102.7 101.6 CASA Ratio % 41.7 45.1 43.5 41.9 42.9 45.5 42.3 39.9 37.1 Invest./Deposit Ratio 59.8 59.7 62.5 58.6 53.3 43.7 41.0 38.0 35.1 G-Sec/Invest. Ratio 56.6 47.6 54.5 53.9 53.8 66.8 68.7 72.4 76.6 CAR 19.4 19.5 18.5 18.7 17.7 17.0 16.2 15.6 15.0 Tier 1 14.4 13.2 12.7 12.8 12.8 12.8 12.4 12.2 12.0
Valuation Book Value (INR) 92.6 95.7 103.3 113.2 122.9 135.2 150.8 169.1 191.0 BV Growth (%) 5.1 3.4 7.9 9.6 8.5 10.0 11.5 12.2 12.9 Price-BV (x) 2.5 2.3 2.1 1.9 1.7 1.5 1.4 ABV (for Subsidaries) (INR) 70.7 74.1 81.7 91.9 102.1 116.1 131.7 150.0 171.8 ABV Growth (%) 6.6 4.8 10.2 12.5 11.1 13.7 13.4 13.9 14.5 Price-ABV (x) 2.7 2.4 2.1 1.7 1.5 1.2 1.0 ABV (for Subs Invst & NPA) (INR) 65.9 71.2 79.5 89.2 98.1 108.5 124.2 142.9 165.3 Adjusted Price-ABV (x) 2.8 2.4 2.2 1.9 1.6 1.3 1.0 EPS (INR) 7.2 8.9 11.2 14.4 17.0 19.3 21.8 25.7 30.6 EPS Growth (%) 6.9 23.9 25.4 28.7 17.7 13.5 13.2 17.8 18.9 Price-Earnings (x)
23.0 17.9 15.2 13.4 11.8 10.0 8.4
Adj. Price-Earnings (x) 19.5 15.0 12.5 10.5 8.9 7.2 5.7 Dividend Per Share (INR) 2.4 2.8 3.3 4.0 4.6 5.0 5.7 6.7 7.9 Dividend Yield (%) 1.3 1.6 1.8 1.9 2.2 2.6 3.1 E: MOSL Estimates

Thematic | Good-to-Great
September 2015 41
Industry Attractiveness
India presents a huge opportunity for banks. Only 40% of the population has access to banking. Credit-to-GDP is just ~52% against an average of ~90% for emerging markets and ~100% for developed markets.
The industry is likely to grow at a CAGR of 18%+ over the next five years. Incumbent state-owned banks still have 75%+ market share. In this digital era, private
sector banks should continue to gain share, with superior products and services.
IDFC CMP: INR128 TP: INR213 (+66%) Buy
IDFC is an infrastructure financier, generating RoE of 12-15%. Despite the infrastructure segment going through tough times, IDFC has maintained healthy profitability while creating floating provisions on the balance sheet.
Corporate governance levels are best in class; this has helped IDFC to become one of the two from 26 contenders to get a banking license from the RBI.
Disciplined Management
Focus on long-term shareholder value creation even at the cost of immediate profitability
Diversification: Considering the challenges in infrastructure financing, the management focused on diversification of assets and liabilities.
For the banking business, IDFC is focusing on innovation, technology and cross-selling to existing customers to increase profitability.
Disciplined Thought
During the troubled times of FY12-15, IDFC’s loan CAGR was just 2%. It created provisions of ~4% of loans though reported NPAs were lower at <0.5%. Further, it also created provisions of 60bp on disbursements.
IDFC is one of the two from 26 contenders to receive a banking license. Operating under the banking model would enhance sustainable RoE by ~500bp.
Disciplined Action
RoE is expected to be healthy at 11-12% in the first full year of operations as a bank and then steadily rise to ~18% in the next four years.
IDFC would command significantly higher value as a bank (with higher retail deposits and loans) than as an infrastructure financier.
Investors are likely to focus more on the expected improvement in business, higher and sustainable RoE, strong management team, and good corporate governance.
Expected Results

Thematic | Good-to-Great
September 2015 42
Exhibit 36: Leverage of IDFC Bank to increase gradually; RoE to be similar to peers, led by higher core profitability (%)
Source: Company, MOSL
Exhibit 37: Steady diversification of loan portfolio
Source: Company, MOSL
Exhibit 38: Cost efficiency to be key differentiator for IDFC Bank (opex; % of assets)
Source: Company, MOSL
Exhibit 39: Stress loans adequately provided for; unlikely to be a drag in banking setup
Source: Company, MOSL
Exhibit 40: Stock has underperformed Sensex…
Source: Company, MOSL
Exhibit 41: …and BSE100 post banking announcement
Source: Company, MOSL
1.6 1.6 1.7 1.8 1.9
11.2 13.6 14.5 16.2 17.8
FY17 FY18 FY19 FY20 FY21
RoA RoE
7.9 8.5 9.0 9.2
9.4
Leverage
460 529 627 742 879 1,041
88 88
82 79
76 74
FY16 FY17 FY18 FY19 FY20 FY21
Infrastructure loans (INR b) % of loans
1.1 1.1 1.1 1.2 1.2 1.2
2.2
3.5 3.9
3.3 3.3 3.1 2.6
Year 1 Year 2 Year 3 Year 4 Year 5 Year 6
IDFCB Private Banks averageYES, KMB (in initial years)
0.6 0.6 0.6 0.7 0.7 1.5
4.5 5.3
6.1 6.1
7.8 7.0
2.3 3.0 3.5 3.8 4.3 4.7
4QFY14 1QFY15 2QFY15 3QFY15 4QFY15 1QFY16
(% of loans) GNPARestructured loansOutstanding provisions
91
141
40
70
100
130
160
Mar
-11
Sep-
11
Feb-
12
Jul-1
2
Dec-
12
Jun-
13
Nov
-13
Apr-
14
Oct
-14
Mar
-15
Aug-
15
IDFC Sensex-Rebased
91
145
40
70
100
130
160
Mar
-11
Sep-
11
Feb-
12
Jul-1
2
Dec-
12
Jun-
13
Nov
-13
Apr-
14
Oct
-14
Mar
-15
Aug-
15
IDFC BSE 100- Rebased

Thematic | Good-to-Great
September 2015 43
Financials and Valuations: IDFC
Income Statement (Consolidated)
(INR Million) Y/E March 2010 2011 2012 2013 2014 2015 2016E 2017E Interest Income* 30,797 40,276 55,679 72,279 77,384 84,562 90,391 102,396 Interest Expended 19,535 23,875 34,562 46,758 50,552 56,556 62,707 71,734 Net Interest Income 11,262 16,401 21,117 25,521 26,831 28,006 27,685 30,662
Change (%) 21.4 45.6 28.8 20.9 5.1 4.4 -1.1 10.8 Other Income 9,829 9,054 8,672 9,205 10,516 12,235 13,700 15,216 Fees Based income 6,182 6,413 4,587 5,807 5,991 5,092 6,457 7,824 Principal Invt (Incl Carry Inc)** 3,330 2,260 3,890 2,060 3,280 4,067 3,917 4,017 Fixed income gains and others 317 382 195 1,339 1,245 3,075 3,325 3,375 Net Income 21,091 25,455 29,788 34,726 37,348 40,241 41,385 45,879
Change (%) 35.6 20.7 17.0 16.6 7.5 7.7 2.8 10.9 Operating Expenses 5,526 5,321 5,216 5,294 5,438 6,338 10,760 11,928 Operating Income 15,566 20,135 24,572 29,432 31,910 33,903 30,625 33,950
Change (%) 30.9 29.4 22.0 19.8 8.4 6.2 -9.7 10.9 Other Provisions 1,283 2,346 2,846 3,496 6,283 8,500 8,061 7,664 PBT 14,283 17,788 21,726 25,936 25,627 25,403 22,564 26,286 Tax 3,666 4,998 6,219 7,511 7,385 7,367 6,769 7,623
Tax Rate (%) 25.7 28.1 28.6 29.0 28.8 29.0 30.0 29.0 PAT 10,617 12,791 15,508 18,424 18,242 18,036 15,795 18,663
Change (%) 40.1 20.5 21.2 18.8 -1.0 -1.1 -12.4 18.2 (MI)/Associate profit 5.2 25.7 32.0 -62.3 -215.1 -300.0 -300.0 -300.0 Consolidated PAT 10,623 12,817 15,540 18,362 18,027 17,736 15,495 18,363
Change (%) 41.7 20.7 21.2 18.2 -1.8 -1.6 -12.6 18.5 Proposed Dividend 1,951 2,925 3,478 3,938 3,942 3,902 3,409 4,040 *Includes debt trading gains; ** Excludes debt trading gains Balance Sheet
(INR Million)
Y/E March 2010 2011 2012 2013 2014 2015 2016E 2017E Capital 13,006 14,609 15,124 15,147 15,163 15,893 15,893 15,893 Reserves & Surplus 57,097 89,475 107,733 121,682 135,241 157,703 169,226 182,883 Net Worth 70,103 104,084 122,856 136,829 150,404 173,596 185,119 198,776 Borrowings 265,439 371,439 472,750 542,270 565,650 673,164 742,987 879,497
Change (%) 12.7 39.9 27.3 14.7 4.3 19.0 10.4 18.4 Total Liabilities 335,605 475,526 595,784 679,353 716,456 847,161 928,508 1,078,675 Investments 46,554 69,611 75,339 110,042 113,087 294,026 352,831 423,398
Change (%) -28.4 49.5 8.2 46.1 2.8 160.0 20.0 20.0 Loans 250,311 376,523 481,846 557,370 585,450 526,905 553,250 636,238
Change (%) 21.5 50.4 28.0 15.7 5.0 -10.0 5.0 15.0 Goodwill 11,596 11,638 9,668 9,568 9,571 9,571 9,571 9,571 Net Fixed Assets 4,415 4,469 4,165 3,445 3,285 3,449 3,622 3,803 Deferred Tax Assets 1,755 2,480 3,180 3,938 4,875 4,875 4,875 4,875 Net current Assets 20,974 10,804 21,587 -5,008 188 8,334 4,358 791 Total Assets 335,605 475,526 595,784 679,353 716,456 847,161 928,508 1,078,675 E: MOSL Estimates

Thematic | Good-to-Great
September 2015 44
Financials and Valuations: IDFC
Ratios
Y/E March 2010 2011 2012 2013 2014 2015 2016E 2017E Spreads Analysis (%)
Avg. Yield - Infra. loans 11.3 11.0 11.2 12.3 11.8 12.0 11.5 11.5 Avg. Yield - Earning Assets 10.7 11.0 11.1 11.9 11.4 11.1 10.4 10.4 Avg. Cost-Int. Bear. Liab. 7.8 7.5 8.2 9.2 9.1 9.1 8.9 8.8 Interest Spread on loans 2.9 3.5 2.9 2.7 2.2 2.0 1.6 1.6 Net Interest Margin 3.0 3.8 3.7 3.8 3.6 3.3 2.9 2.8 Profitability Ratios (%)
RoE 16.1 14.7 13.7 14.1 12.6 10.9 8.6 9.6 Core RoE 17.6 17.8 16.2 15.1 13.1 11.4 8.8 9.8 RoA 3.4 3.2 2.9 2.9 2.6 2.3 1.7 1.8 Int. Expended/Int.Earned 63.4 59.3 62.1 64.7 65.3 66.9 69.4 70.1 Other Income./Net Income 46.6 35.6 29.1 26.5 28.2 30.4 33.1 33.2 Efficiency Ratios (%)
Total Assets/Equity(x) 4.8 4.6 4.8 5.0 4.8 4.9 5.0 5.4 Debt/Equity (x) 3.8 3.6 3.8 4.0 3.8 3.9 4.0 4.4 Fee income/Net Income 29.3 25.2 15.4 16.7 16.0 12.7 15.6 17.1 Op. Exps./Net Income 26.2 20.9 17.5 15.2 14.6 15.8 26.0 26.0 Empl. Cost/Op. Exps. 55.8 55.6 58.4 55.1 53.0 55.6 50.0 50.0 Asset Quality and capitalization (%)
Gross NPAs 797 1,483 851 3,330 3,576 9,899 18,197 Gross NPAs to Adv. 0.2 0.3 0.2 0.6 0.7 1.8 2.8 Net NPAs 389 714 289 2,206 1,196 5,019 10,817 Net NPAs to Adv. 0.1 0.1 0.1 0.4 0.2 0.9 1.7
Valuation Book Value (INR) 53.9 71.2 81.2 90.3 99.2 109.2 116.5 125.1 Price-BV (x) 1.6 1.4 1.3 1.2 1.1 1.0 Adjusted BV (INR)* 42.1 60.6 72.7 81.3 89.5 99.9 107.2 115.8 Price-ABV (x) 1.5 1.3 1.2 1.0 0.9 0.9 EPS (INR) 8.2 8.8 10.3 12.1 11.9 11.2 9.7 11.6 EPS Growth (%) 41.1 7.4 17.1 18.0 -1.9 -6.1 -12.6 18.5 Price-Earnings (x) 12.5 10.6 10.8 11.5 13.1 11.1 OPS (INR) 12.0 13.8 16.2 19.4 21.0 21.3 19.3 21.4 OPS Growth (%) 30.4 15.2 17.9 19.6 8.3 1.4 -9.7 10.9 Price-OP (x) 7.9 6.6 6.1 6.0 6.6 6.0 Dividend per Share (INR) 1.5 2.0 2.3 2.6 2.6 2.5 2.1 2.5 Dividend Yield (%) 1.8 2.0 2.0 1.9 1.7 2.0 E: MOSL Estimates; *Adj. for Inv. in subsidiaries, Prices adj. for other ventures
Thematic | Good-to-Great
September 2015 45
Annexure II: Dynamic Value Picks
Annexure II: Dynamic Value Picks BSE Sensex: 25,202 S&P CNX: 7,655 4 September 2015
IndusInd Bank ITC Larsen & Toubro Maruti Suzuki UltraTech Cem. United Spirits Zee Ent.

Thematic | Good-to-Great
September 2015 46
India presents a huge opportunity for banks. Only 40% of the population has access to banking. Credit-to-GDP is just ~52% against an average of ~90% for emerging markets and ~100% for developed markets.
Deepening financial penetration, increasing urbanization, and expansion of private banks into rural and semi-urban areas would drive retail loan growth. Consumer loans-to-GDP stands at just 15% against 20%+ for major economies.
IndusInd Bank CMP: INR840 TP: INR1,140 (+36%) Buy
IndusInd Bank (IIB) is a classic case of management change (Mr Sobti and his team took charge in 2008) scripting a turnaround in fortunes. The bank’s workforce has grown 6.6x over FY08-15 to 19k+ and the top management team remains intact.
The management targets to be a forerunner in terms of profitability (RoA best in class at 1.9% in FY15; up from 35bp in FY08), productivity (profit/employee up 4x over FY08-15), and efficiency (C/I ratio down from 68% in FY08 to 46%).
Disciplined Management
Focusing on high yielding retail loan portfolio (42% of book) by capitalizing on strong presence in vehicle loans and addition of new retail products. Expect 30-35% CAGR in this portfolio. IIB’s loan market share (MS) doubled over FY08-15 to 1%.
Increased share of low cost CASA deposits (15.5% in FY08 to 34%) through focused branch expansion and improving brand image. SA MS: 54bp in FY15 v/s 29bp in FY12)
Gaining forex MS (from 1% in FY08 to ~4%) at the cost of state-owned banks, driven by lower turnaround time. Fees to assets improved to 2.2% (+100bp from FY08).
Disciplined Action
Industry Attractiveness
Healthy core revenues (5.6% of assets – best in industry), strong growth, high margins (due to high yielding loans and low cost deposits), and productivity gains should enable IIB to report steady-state RoA of 2%+ and ~30% earnings CAGR over FY15-18.
Recent capital infusion would result in >600bp increase in tier-I ratio – sufficient for 3-4 years of 25%+ loan growth. (FY16/17 RoE would be impacted by the capital raising).
CASA ratio is expected to improve by 500bp+ to ~40% over FY15-18.
Expected Results
Three-year planning cycle (2014-17) a) Focus on outpacing system growth (loan CAGR of 25-30% v/s ~15% for industry) by capitalizing on niche areas (vehicle loans) b) Building at least 15 home markets (5%+ branch share) to sustain savings accounts c) Core fee growth to outpace loan growth, supporting RoA; focus remains on gaining forex market share and strong investment banking revenues
Disciplined Thought
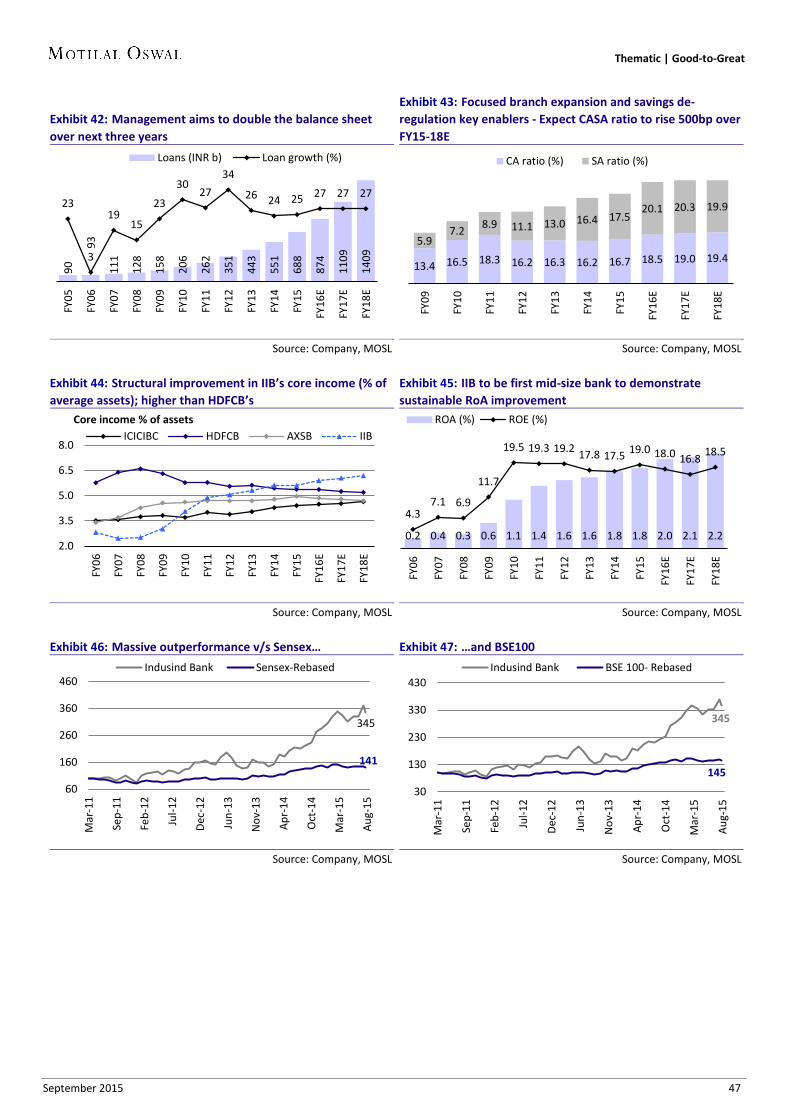
Thematic | Good-to-Great
September 2015 47
Exhibit 42: Management aims to double the balance sheet over next three years
Source: Company, MOSL
Exhibit 43: Focused branch expansion and savings de-regulation key enablers - Expect CASA ratio to rise 500bp over FY15-18E
Source: Company, MOSL
Exhibit 44: Structural improvement in IIB’s core income (% of average assets); higher than HDFCB’s
Source: Company, MOSL
Exhibit 45: IIB to be first mid-size bank to demonstrate sustainable RoA improvement
Source: Company, MOSL
Exhibit 46: Massive outperformance v/s Sensex…
Source: Company, MOSL
Exhibit 47: …and BSE100
Source: Company, MOSL
90
93
111
128
158
206
262
351
443
551
688
874
1109
1409
23
3
19 15
23
30 27
34
26 24 25 27 27 27
FY05
FY06
FY07
FY08
FY09
FY10
FY11
FY12
FY13
FY14
FY15
FY16
E
FY17
E
FY18
E
Loans (INR b) Loan growth (%)
13.4 16.5 18.3 16.2 16.3 16.2 16.7 18.5 19.0 19.4 5.9
7.2 8.9 11.1 13.0 16.4 17.5 20.1 20.3 19.9
FY09
FY10
FY11
FY12
FY13
FY14
FY15
FY16
E
FY17
E
FY18
E
CA ratio (%) SA ratio (%)
2.0
3.5
5.0
6.5
8.0
FY06
FY07
FY08
FY09
FY10
FY11
FY12
FY13
FY14
FY15
FY16
E
FY17
E
FY18
E
Core income % of assets ICICIBC HDFCB AXSB IIB
0.2 0.4 0.3 0.6 1.1 1.4 1.6 1.6 1.8 1.8 2.0 2.1 2.2
4.3 7.1 6.9
11.7
19.5 19.3 19.2 17.8 17.5 19.0 18.0 16.8 18.5
FY06
FY07
FY08
FY09
FY10
FY11
FY12
FY13
FY14
FY15
FY16
E
FY17
E
FY18
E
ROA (%) ROE (%)
345
141
60
160
260
360
460
Mar
-11
Sep-
11
Feb-
12
Jul-1
2
Dec-
12
Jun-
13
Nov
-13
Apr-
14
Oct
-14
Mar
-15
Aug-
15
Indusind Bank Sensex-Rebased
345
145
30
130
230
330
430
Mar
-11
Sep-
11
Feb-
12
Jul-1
2
Dec-
12
Jun-
13
Nov
-13
Apr-
14
Oct
-14
Mar
-15
Aug-
15
Indusind Bank BSE 100- Rebased

Thematic | Good-to-Great
September 2015 48
Financials and Valuations: IndusInd Bank
Income Statement (INR Million) Y/E March 2010 2011 2012 2013 2014 2015 2016E 2017E 2018E Interest Income 27,070 35,894 53,592 69,832 82,535 96,920 114,203 134,950 167,668 Interest Expense 18,206 22,129 36,549 47,504 53,628 62,717 70,129 80,135 97,886 Net Interest Income 8,864 13,765 17,042 22,329 28,907 34,203 44,073 54,815 69,782 Change (%) 93.1 55.3 23.8 31.0 29.5 18.3 28.9 24.4 27.3 Non Interest Income 5,534 7,137 10,118 13,630 18,905 24,039 31,475 38,754 47,645 Net Income 14,399 20,902 27,160 35,958 47,812 58,241 75,549 93,570 117,427 Change (%) 57.3 45.2 29.9 32.4 33.0 21.8 29.7 23.9 25.5 Operating Expenses 7,360 10,085 13,430 17,564 21,853 27,259 33,976 41,694 51,168 Pre Provision Profits 7,039 10,817 13,730 18,395 25,960 30,982 41,573 51,876 66,259 Change (%) 91.1 53.7 26.9 34.0 41.1 19.3 34.2 24.8 27.7 Provisions (excl tax) 1,709 2,019 1,804 2,631 4,676 3,891 5,037 6,397 8,124 PBT 5,330 8,798 11,927 15,764 21,283 27,092 36,536 45,479 58,135 Tax 1,827 3,025 3,900 5,152 7,203 9,155 12,239 15,235 19,475 Tax Rate (%) 34.3 34.4 32.7 32.7 33.8 33.8 33.5 33.5 33.5 PAT 3,503 5,773 8,026 10,612 14,080 17,937 24,296 30,243 38,660 Change (%) 136.1 64.8 39.0 32.2 32.7 27.4 35.5 24.5 27.8 Equity Dividend (Incl tax) 865 932 1,196 1,838 2,154 2,552 3,397 4,228 5,405 Core PPP* 5,827 9,764 12,680 17,325 23,327 28,232 37,073 46,626 60,259 Change (%) 129.9 67.6 29.9 36.6 34.6 21.0 31.3 25.8 29.2 *Core PPP is (NII+Fee income-Opex)
Balance Sheet (INR Million)
Y/E March 2010 2011 2012 2013 2014 2015 2016E 2017E 2018E Equity Share Capital 4,107 4,660 4,677 5,229 5,256 5,295 5,807 5,807 5,807 Reserves & Surplus 19,866 35,842 42,740 71,074 85,173 101,151 164,755 190,708 223,900 Net Worth 23,972 40,502 47,417 76,303 90,430 106,445 170,562 196,515 229,707 Of which Equity Networth 23,972 40,502 47,417 76,303 90,430 106,445 170,562 196,515 229,707 Deposits 267,102 343,654 423,615 541,167 605,023 741,344 867,372 1,101,563 1,398,984 Change (%) 20.8 28.7 23.3 27.7 11.8 22.5 17.0 27.0 27.0 of which CASA Dep 63,217 93,309 115,631 158,674 196,909 252,996 335,187 432,788 549,351 Change (%) 48.6 47.6 23.9 37.2 24.1 28.5 32.5 29.1 26.9 Borrowings 49,343 55,254 86,820 94,596 147,620 206,181 217,349 247,935 283,110 Other Liabilities & Prov. 13,278 16,948 18,108 21,000 27,187 37,190 44,684 53,730 64,651 Total Liabilities 353,695 456,358 575,961 733,065 870,259 1,091,159 1,299,967 1,599,743 1,976,452 Current Assets 26,032 40,246 55,396 68,487 67,694 107,791 84,652 94,402 110,968 Investments 104,018 135,508 145,719 196,542 215,630 248,594 285,883 328,765 378,080 Change (%) 28.7 30.3 7.5 34.9 9.7 15.3 15.0 15.0 15.0 Loans 205,506 261,656 350,640 443,206 551,018 687,882 873,610 1,109,485 1,409,046 Change (%) 30.3 27.3 34.0 26.4 24.3 24.8 27.0 27.0 27.0 Fixed Assets 6,448 5,965 6,568 7,561 10,164 11,576 11,677 11,909 12,140 Other Assets 11,691 12,983 17,638 17,269 25,753 35,316 44,145 55,182 66,218 Total Assets 353,695 456,358 575,961 733,065 870,259 1,091,159 1,299,967 1,599,743 1,976,452
1914% 2306% 2355%
Asset Quality (%) GNPA (INR m) 2,555 2,659 3,471 4,578 6,208 5,629 5,050 7,022 10,089 NNPA (INR m) 1,018 728 947 1,368 1,841 2,105 1,524 2,499 3,495 GNPA Ratio 1.2 1.0 1.0 1.0 1.1 0.8 0.6 0.6 0.7 NNPA Ratio 0.5 0.3 0.3 0.3 0.3 0.3 0.2 0.2 0.2 PCR (Excl Tech. write off) 60.1 72.6 72.7 70.1 70.4 62.6 69.8 64.4 65.4 E: MOSL Estimates
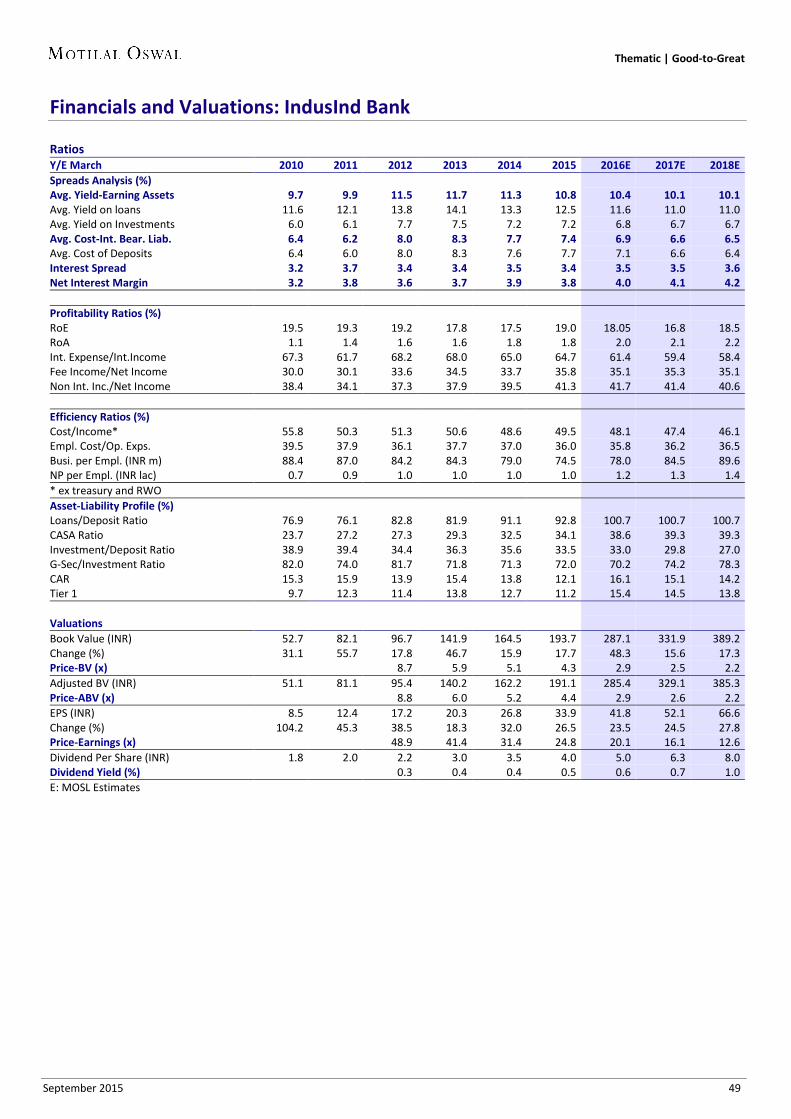
Thematic | Good-to-Great
September 2015 49
Financials and Valuations: IndusInd Bank
Ratios Y/E March 2010 2011 2012 2013 2014 2015 2016E 2017E 2018E Spreads Analysis (%) Avg. Yield-Earning Assets 9.7 9.9 11.5 11.7 11.3 10.8 10.4 10.1 10.1 Avg. Yield on loans 11.6 12.1 13.8 14.1 13.3 12.5 11.6 11.0 11.0 Avg. Yield on Investments 6.0 6.1 7.7 7.5 7.2 7.2 6.8 6.7 6.7 Avg. Cost-Int. Bear. Liab. 6.4 6.2 8.0 8.3 7.7 7.4 6.9 6.6 6.5 Avg. Cost of Deposits 6.4 6.0 8.0 8.3 7.6 7.7 7.1 6.6 6.4 Interest Spread 3.2 3.7 3.4 3.4 3.5 3.4 3.5 3.5 3.6 Net Interest Margin 3.2 3.8 3.6 3.7 3.9 3.8 4.0 4.1 4.2 Profitability Ratios (%) RoE 19.5 19.3 19.2 17.8 17.5 19.0 18.05 16.8 18.5 RoA 1.1 1.4 1.6 1.6 1.8 1.8 2.0 2.1 2.2 Int. Expense/Int.Income 67.3 61.7 68.2 68.0 65.0 64.7 61.4 59.4 58.4 Fee Income/Net Income 30.0 30.1 33.6 34.5 33.7 35.8 35.1 35.3 35.1 Non Int. Inc./Net Income 38.4 34.1 37.3 37.9 39.5 41.3 41.7 41.4 40.6 Efficiency Ratios (%) Cost/Income* 55.8 50.3 51.3 50.6 48.6 49.5 48.1 47.4 46.1 Empl. Cost/Op. Exps. 39.5 37.9 36.1 37.7 37.0 36.0 35.8 36.2 36.5 Busi. per Empl. (INR m) 88.4 87.0 84.2 84.3 79.0 74.5 78.0 84.5 89.6 NP per Empl. (INR lac) 0.7 0.9 1.0 1.0 1.0 1.0 1.2 1.3 1.4 * ex treasury and RWO Asset-Liability Profile (%) Loans/Deposit Ratio 76.9 76.1 82.8 81.9 91.1 92.8 100.7 100.7 100.7 CASA Ratio 23.7 27.2 27.3 29.3 32.5 34.1 38.6 39.3 39.3 Investment/Deposit Ratio 38.9 39.4 34.4 36.3 35.6 33.5 33.0 29.8 27.0 G-Sec/Investment Ratio 82.0 74.0 81.7 71.8 71.3 72.0 70.2 74.2 78.3 CAR 15.3 15.9 13.9 15.4 13.8 12.1 16.1 15.1 14.2 Tier 1 9.7 12.3 11.4 13.8 12.7 11.2 15.4 14.5 13.8 Valuations
Book Value (INR) 52.7 82.1 96.7 141.9 164.5 193.7 287.1 331.9 389.2 Change (%) 31.1 55.7 17.8 46.7 15.9 17.7 48.3 15.6 17.3 Price-BV (x) 8.7 5.9 5.1 4.3 2.9 2.5 2.2 Adjusted BV (INR) 51.1 81.1 95.4 140.2 162.2 191.1 285.4 329.1 385.3 Price-ABV (x) 8.8 6.0 5.2 4.4 2.9 2.6 2.2 EPS (INR) 8.5 12.4 17.2 20.3 26.8 33.9 41.8 52.1 66.6 Change (%) 104.2 45.3 38.5 18.3 32.0 26.5 23.5 24.5 27.8 Price-Earnings (x) 48.9 41.4 31.4 24.8 20.1 16.1 12.6 Dividend Per Share (INR) 1.8 2.0 2.2 3.0 3.5 4.0 5.0 6.3 8.0 Dividend Yield (%) 0.3 0.4 0.4 0.5 0.6 0.7 1.0 E: MOSL Estimates
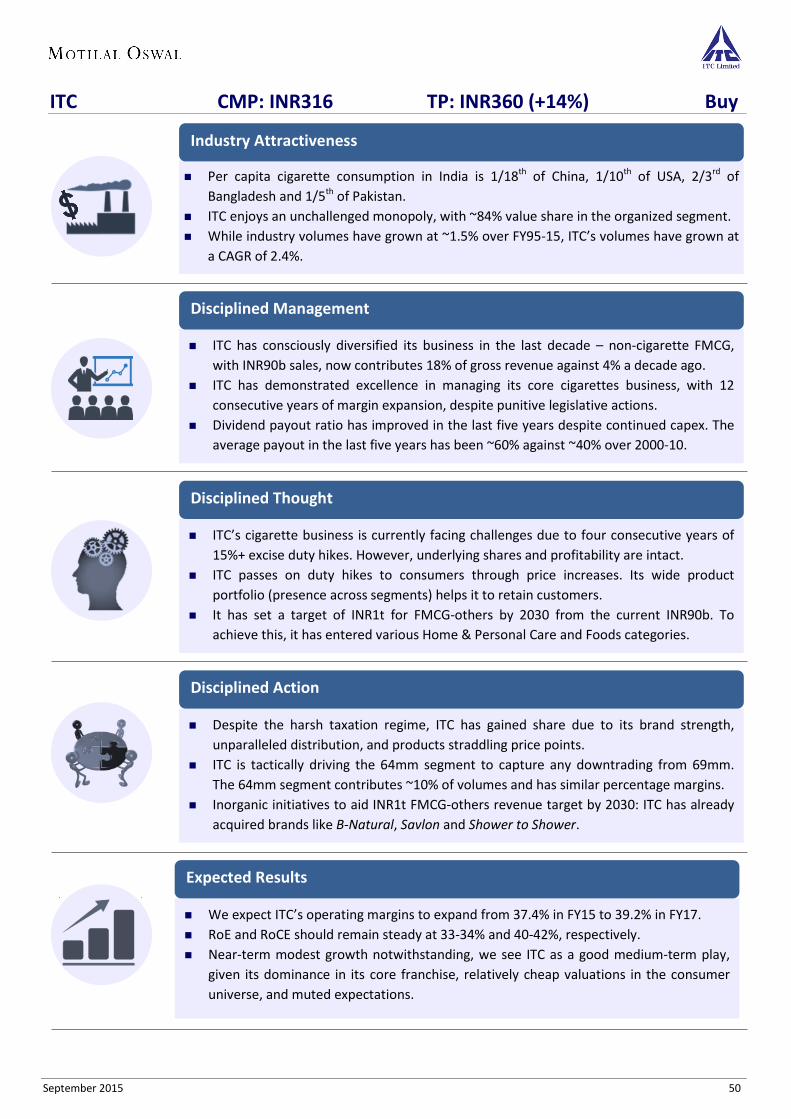
Thematic | Good-to-Great
September 2015 50
Per capita cigarette consumption in India is 1/18th of China, 1/10th of USA, 2/3rd of Bangladesh and 1/5th of Pakistan.
ITC enjoys an unchallenged monopoly, with ~84% value share in the organized segment. While industry volumes have grown at ~1.5% over FY95-15, ITC’s volumes have grown at
a CAGR of 2.4%.
Industry Attractiveness
ITC CMP: INR316 TP: INR360 (+14%) Buy
ITC’s cigarette business is currently facing challenges due to four consecutive years of 15%+ excise duty hikes. However, underlying shares and profitability are intact.
ITC passes on duty hikes to consumers through price increases. Its wide product portfolio (presence across segments) helps it to retain customers.
It has set a target of INR1t for FMCG-others by 2030 from the current INR90b. To achieve this, it has entered various Home & Personal Care and Foods categories.
Disciplined Thought
Despite the harsh taxation regime, ITC has gained share due to its brand strength, unparalleled distribution, and products straddling price points.
ITC is tactically driving the 64mm segment to capture any downtrading from 69mm. The 64mm segment contributes ~10% of volumes and has similar percentage margins.
Inorganic initiatives to aid INR1t FMCG-others revenue target by 2030: ITC has already acquired brands like B-Natural, Savlon and Shower to Shower.
Disciplined Action
We expect ITC’s operating margins to expand from 37.4% in FY15 to 39.2% in FY17. RoE and RoCE should remain steady at 33-34% and 40-42%, respectively. Near-term modest growth notwithstanding, we see ITC as a good medium-term play,
given its dominance in its core franchise, relatively cheap valuations in the consumer universe, and muted expectations.
Expected Results
ITC has consciously diversified its business in the last decade – non-cigarette FMCG, with INR90b sales, now contributes 18% of gross revenue against 4% a decade ago.
ITC has demonstrated excellence in managing its core cigarettes business, with 12 consecutive years of margin expansion, despite punitive legislative actions.
Dividend payout ratio has improved in the last five years despite continued capex. The average payout in the last five years has been ~60% against ~40% over 2000-10.
Disciplined Management
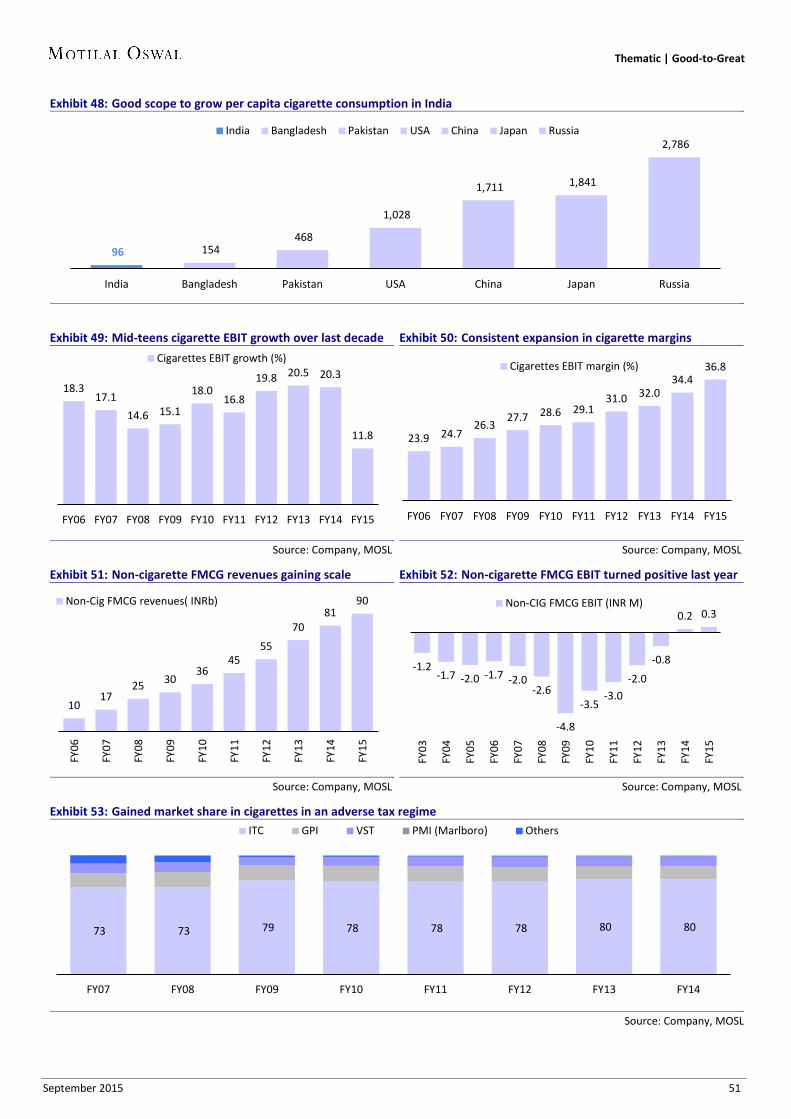
Thematic | Good-to-Great
September 2015 51
Exhibit 48: Good scope to grow per capita cigarette consumption in India
Exhibit 49: Mid-teens cigarette EBIT growth over last decade
Source: Company, MOSL
Exhibit 50: Consistent expansion in cigarette margins
Source: Company, MOSL
Exhibit 51: Non-cigarette FMCG revenues gaining scale
Source: Company, MOSL
Exhibit 52: Non-cigarette FMCG EBIT turned positive last year
Source: Company, MOSL
Exhibit 53: Gained market share in cigarettes in an adverse tax regime
Source: Company, MOSL
96 154 468
1,028
1,711 1,841
2,786
India Bangladesh Pakistan USA China Japan Russia
India Bangladesh Pakistan USA China Japan Russia
18.3 17.1
14.6 15.1
18.0 16.8
19.8 20.5 20.3
11.8
FY06 FY07 FY08 FY09 FY10 FY11 FY12 FY13 FY14 FY15
Cigarettes EBIT growth (%)
23.9 24.7 26.3
27.7 28.6 29.1 31.0 32.0
34.4 36.8
FY06 FY07 FY08 FY09 FY10 FY11 FY12 FY13 FY14 FY15
Cigarettes EBIT margin (%)
10 17
25 30 36
45 55
70 81
90
FY06
FY07
FY08
FY09
FY10
FY11
FY12
FY13
FY14
FY15
Non-Cig FMCG revenues( INRb)
-1.2 -1.7 -2.0 -1.7 -2.0
-2.6
-4.8
-3.5 -3.0
-2.0
-0.8
0.2 0.3
FY03
FY04
FY05
FY06
FY07
FY08
FY09
FY10
FY11
FY12
FY13
FY14
FY15
Non-CIG FMCG EBIT (INR M)
73 73 79 78 78 78 80 80
FY07 FY08 FY09 FY10 FY11 FY12 FY13 FY14
ITC GPI VST PMI (Marlboro) Others

Thematic | Good-to-Great
September 2015 52
Financials and Valuations: ITC
Income Statement (INR Million) Y/E March 2010 2011 2012 2013 2014 2015 2016E 2017E Net Sales 181,532 211,676 247,984 296,056 328,826 360,832 387,792 422,024 Operational Income 2,392 2,914 3,490 2,957 3,560 4,242 4,666 5,133 Total Revenue 183,924 214,590 251,475 299,013 332,386 365,074 392,458 427,157 Change (%) 16.4 16.7 17.2 18.9 11.2 9.8 7.5 8.8 Total Expenditure 120,619 140,467 162,788 192,543 207,631 230,128 241,500 261,860 EBITDA 63,305 74,123 88,687 106,470 124,755 134,946 150,958 165,297 Change (%) 24.8 17.1 19.6 20.1 17.2 8.2 11.9 9.5 Margin (%) 34.9 35.0 35.8 36.0 37.9 37.4 38.9 39.2 Depreciation 6,087 6,560 6,985 7,956 8,999 9,617 10,806 11,956 Int. and Fin. Charges 820 679 980 1,059 236 785 490 440 Other Inc. - Recurring 3,756 5,798 8,253 9,387 11,071 15,431 18,128 21,360 Profit before Taxes 60,153 72,682 88,975 106,842 126,591 139,975 157,790 174,262 Change (%) 24.7 20.8 22.4 20.1 18.5 10.6 12.7 10.4 Margin (%) 33.1 34.3 35.9 36.1 38.5 38.8 40.7 41.3 Tax 20,286 22,804 26,777 29,348 37,911 40,210 45,128 49,839 Deferred Tax -822 2 574 3,310 828 3,688 3,787 4,182 Tax Rate (%) 32.4 31.4 30.7 30.6 30.6 31.4 31.0 31.0 Profit after Taxes 40,689 49,876 61,624 74,184 87,852 96,077 108,875 120,241 Change (%) 24.7 22.6 23.6 20.4 18.4 9.4 13.3 10.4 Margin (%) 22.4 23.6 24.8 25.1 26.7 26.6 28.1 28.5 Reported PAT 40,689 49,876 61,624 74,184 87,852 96,077 108,875 120,241
Balance Sheet
(INR Million) Y/E March 2010 2011 2012 2013 2014 2015 2016E 2017E Share Capital 3,818 7,738 7,818 7,902 7,953 8,016 8,016 8,016 Reserves 136,826 151,795 180,101 214,977 254,667 299,341 338,155 381,021 Net Worth 140,644 159,533 187,919 222,879 262,620 307,357 346,171 389,037 Loans 160 343 119 113 155 143 143 143 Deferred Liability 7,850 8,019 8,727 12,037 12,970 16,316 12,217 7,690 Capital Employed 148,654 167,894 196,765 235,029 275,745 323,816 358,531 396,870 Gross Block 119,679 127,658 138,033 165,884 181,756 209,908 234,908 259,908 Less: Accum. Depn. 38,255 44,208 48,197 54,698 62,269 72,136 82,942 94,898 Net Fixed Assets 81,424 83,451 89,837 111,186 119,487 137,771 151,966 165,010 Capital WIP 10,090 13,334 23,923 15,786 23,598 25,155 25,155 25,155 Investments 57,269 55,547 63,166 70,603 88,234 84,055 105,774 127,157 Current 46,982 42,189 43,633 50,594 63,113 59,638 78,916 97,613 Non-current 10,287 13,358 19,533 20,009 25,122 24,416 26,858 29,544 Curr. Assets, L&A 81,279 97,901 112,957 142,600 160,975 194,976 207,985 226,154 Inventory 45,491 52,692 56,378 66,002 73,595 78,368 82,367 89,652 Account Receivables 8,581 8,851 9,824 11,633 21,654 17,224 21,249 23,125 Cash and Bank Balance 11,263 22,432 28,189 36,150 32,894 75,886 77,558 84,405 Others 15,945 13,926 18,565 28,815 32,832 23,498 26,811 28,973 Curr. Liab. and Prov. 81,408 82,338 93,117 105,146 116,549 118,140 132,350 146,606 Account Payables 34,449 39,685 46,989 50,571 54,498 53,817 57,876 64,377 Other Liabilities 8,777 8,219 10,945 13,091 14,332 14,226 14,593 16,097 Provisions 38,182 34,435 35,183 41,485 47,719 50,097 59,881 66,132 Net Current Assets -129 15,563 19,840 37,454 44,426 76,835 75,636 79,548 Application of Funds 148,654 167,894 196,765 235,029 275,745 323,816 358,530 396,870 E: MOSL Estimates

Thematic | Good-to-Great
September 2015 53
Financials and Valuations: ITC
Ratios Y/E March 2010 2011 2012 2013 2014 2015 2016E 2017E
Basic (INR)
EPS 10.7 6.4 7.9 9.4 11.0 12.0 13.6 15.0 Cash EPS 12.3 7.3 8.8 10.4 12.2 13.2 14.9 16.5 BV/Share 36.8 20.6 24.0 28.2 33.0 38.3 43.2 48.5 DPS 10.0 4.5 4.5 5.3 6.0 6.3 7.5 8.3 Payout % 93.8 69.0 57.1 55.9 54.3 52.1 55.0 55.0
Valuation (x)
P/E 28.6 26.4 24.0 21.7 Cash P/E 25.9 24.0 21.8 19.8 EV/Sales 7.3 6.6 6.3 5.7 EV/EBITDA 19.3 17.6 16.1 14.5 P/BV 9.6 8.2 7.5 6.7 Dividend Yield (%) 1.9 2.0 2.3 2.5
Return Ratios (%)
RoE 29.3 33.2 35.5 36.1 36.2 33.7 33.3 32.7 RoCE 38.6 42.7 44.8 45.6 45.3 41.8 41.1 40.6
Working Capital Ratios
Debtor (Days) 15 15 14 13 18 20 18 19 Asset Turnover (x) 1.2 1.3 1.3 1.3 1.2 1.1 1.1 1.1
Leverage Ratio
Debt/Equity (x) 0.0 0.0 0.0 0.0 0.0 0.0 0.0 0.0
Cash Flow Statement (INR Million) Y/E March 2010 2011 2012 2013 2014 2015 2016E 2017E OP/(loss) before Tax 60,153 72,682 88,975 106,842 126,591 139,975 157,790 174,262 Int./Div. Received 3,756 5,798 8,253 9,387 11,071 15,431 18,128 21,360 Depreciation and Amort. 6,087 6,560 6,985 7,956 8,999 9,617 10,806 11,956 Interest Paid 820 679 980 1,059 236 785 490 440 Direct Taxes Paid 19,464 22,806 27,352 32,658 38,739 43,898 48,915 54,021 Incr in WC -35,642 4,522 -1,480 9,654 10,228 -10,583 -2,872 -2,934 Diff in dep 700 607 2,996 1,454 1,428 -250 0 0 CF from Operations 80,183 47,402 65,811 65,612 77,217 101,381 104,915 114,210
Extraordinary Items 0 0 1 2 3 0 0 0 Incr Decr in FA 12,041 11,224 20,964 19,714 23,684 29,709 25,000 25,000 Free Cash Flow 68,142 36,178 44,847 45,898 53,532 71,673 79,915 89,210 Pur of Investments 28,891 -1,722 7,619 7,437 17,631 -4,180 21,719 21,383 CF from Invest. -40,933 -9,502 -28,582 -27,149 -41,313 -25,529 -46,719 -46,383
Issue of shares 7,207 5,220 7,650 9,223 6,911 9,788 0 0 Incr in Debt -1,616 183 -224 -6 43 -12 0 0 Interest Income 3,756 5,798 8,253 9,387 11,071 15,431 18,128 21,360 Interest Paid 820 679 980 1,059 236 785 490 440 Dividend Paid 13,965 38,182 34,435 35,183 41,485 47,719 50,097 59,881 Others -32,860 929 -11,737 -12,864 -15,464 -9,563 -24,064 -22,020 CF from Fin. Activity -38,298 -26,731 -31,472 -30,502 -39,160 -32,859 -56,523 -60,981
Incr of Cash 953 11,170 5,757 7,961 -3,256 42,993 1,672 6,846 Add: Opening Balance 10,310 11,263 22,432 28,189 36,150 32,894 75,886 77,558 Closing Balance 11,263 22,432 28,189 36,150 32,894 75,887 77,558 84,404 E: MOSL Estimates
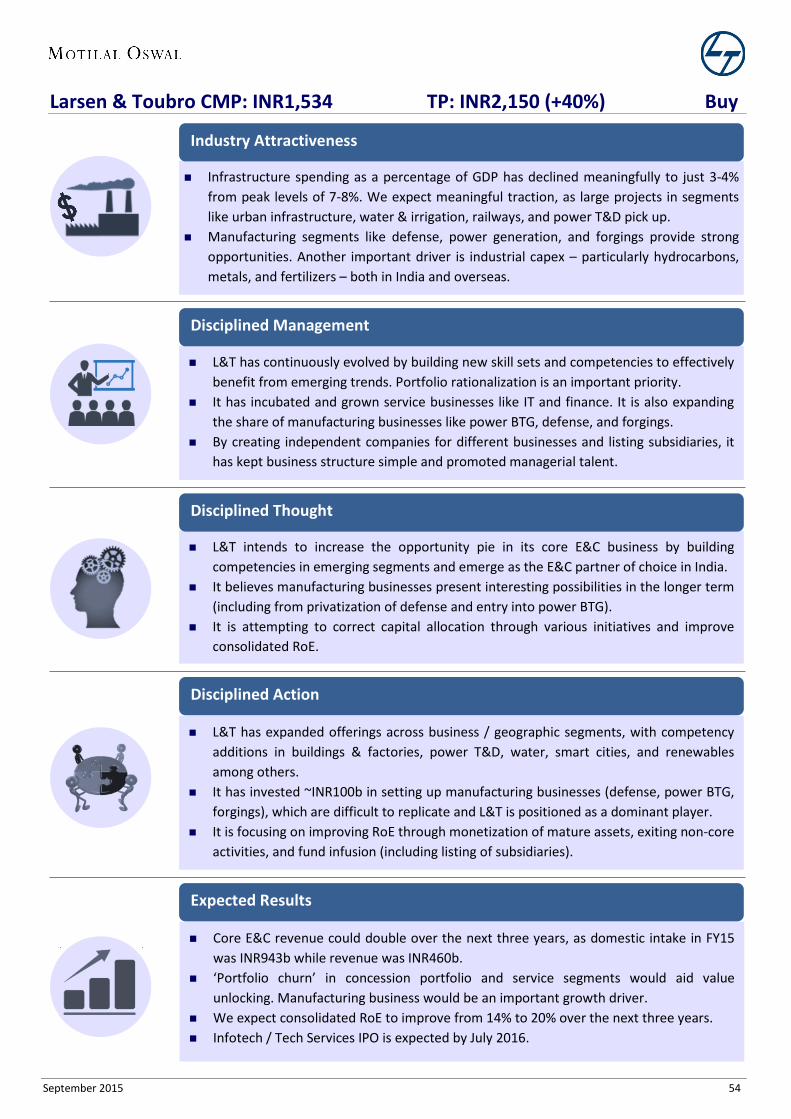
Thematic | Good-to-Great
September 2015 54
Infrastructure spending as a percentage of GDP has declined meaningfully to just 3-4% from peak levels of 7-8%. We expect meaningful traction, as large projects in segments like urban infrastructure, water & irrigation, railways, and power T&D pick up.
Manufacturing segments like defense, power generation, and forgings provide strong opportunities. Another important driver is industrial capex – particularly hydrocarbons, metals, and fertilizers – both in India and overseas.
Industry Attractiveness
Larsen & Toubro CMP: INR1,534 TP: INR2,150 (+40%) Buy
L&T has continuously evolved by building new skill sets and competencies to effectively benefit from emerging trends. Portfolio rationalization is an important priority.
It has incubated and grown service businesses like IT and finance. It is also expanding the share of manufacturing businesses like power BTG, defense, and forgings.
By creating independent companies for different businesses and listing subsidiaries, it has kept business structure simple and promoted managerial talent.
Disciplined Management
L&T intends to increase the opportunity pie in its core E&C business by building competencies in emerging segments and emerge as the E&C partner of choice in India.
It believes manufacturing businesses present interesting possibilities in the longer term (including from privatization of defense and entry into power BTG).
It is attempting to correct capital allocation through various initiatives and improve consolidated RoE.
Disciplined Thought
L&T has expanded offerings across business / geographic segments, with competency additions in buildings & factories, power T&D, water, smart cities, and renewables among others.
It has invested ~INR100b in setting up manufacturing businesses (defense, power BTG, forgings), which are difficult to replicate and L&T is positioned as a dominant player.
It is focusing on improving RoE through monetization of mature assets, exiting non-core activities, and fund infusion (including listing of subsidiaries).
Disciplined Action
Core E&C revenue could double over the next three years, as domestic intake in FY15 was INR943b while revenue was INR460b.
‘Portfolio churn’ in concession portfolio and service segments would aid value unlocking. Manufacturing business would be an important growth driver.
We expect consolidated RoE to improve from 14% to 20% over the next three years. Infotech / Tech Services IPO is expected by July 2016.
Expected Results

Thematic | Good-to-Great
September 2015 55
Exhibit 54: Core standalone RoE robust, despite challenging macro environment
Source: Company, MOSL
Exhibit 55: Diversified business/geographic presence has ensured robust order inflow momentum
Source: MOSL, Company
Exhibit 56: Revenue CAGR of 19% over FY05-15 reflects strong execution skill sets in a constrained environment
Source: MOSL, Company
Exhibit 57: Net project addition in negative zone for over two years, indicating constrained macro environment
Source: Company, MOSL
12.
5
19.
8
24.
1
25.
3
34.
9
39.
4
38.
4
38.
0
34.
8
34.
1
23.
8
24.
0
19.
7
21.
2
25.
8
12.
2
19.
2
18.
7
18.
6
24.
0
22.
0
21.
7
17.
4
16.
6
18.
0
14.
4
15.
1
12.
9
13.
3
15.
1
FY03
FY04
FY05
FY06
FY07
FY08
FY09
FY10
FY11
FY12
FY13
FY14
FY15
E
FY16
E
FY17
E
Core E&C RoE (%) Standalone Reported RoE (%)
117 131 196 252 354 454 639 601 597 767
1,011 1,227
1,570
10 12
50
29
40 28 41
(6)
(1)
28
32 21
28
FY05
FY06
FY07
FY08
FY09
FY10
FY11
FY12
FY13
FY14
FY15
FY16
E
FY17
EOrder inflow (INR b) Growth YoY
113 113 131 190 280 318 377
465 597 642 622
697
894
38
0
16
44
48
14
18 23 29
7 (3) 12
28
FY05
FY06
FY07
FY08
FY09
FY10
FY11
FY12
FY13
FY14
FY15
FY16
E
FY17
E
Revenue (INR b) Growth YoY
-10,000
0
10,000
20,000
30,000
Mar
-96
Dec-
96
Sep-
97
Jun-
98
Mar
-99
Dec-
99
Sep-
00
Jun-
01
Mar
-02
Dec-
02
Sep-
03
Jun-
04
Mar
-05
Dec-
05
Sep-
06
Jun-
07
Mar
-08
Dec-
08
Sep-
09
Jun-
10
Mar
-11
Dec-
11
Sep-
12
Jun-
13
Mar
-14
Dec-
14
Net Projects added (INR b, ttm)

Thematic | Good-to-Great
September 2015 56
Financials and Valuations: Larsen & Toubro
Income Statement
(INR Million) Y/E March 2010 2011 2012 2013 2014 2015 2016E 2017E 2018E Net Revenues 370,348 439,059 531,705 516,110 565,989 595,213 635,099 819,957 1,108,675 Growth Rate (%) 9.1 18.6 21.1 -2.9 9.7 5.2 6.7 29.1 35.2 Manufacturing Expenses 285,374 334,681 410,224 402,048 433,464 443,966 491,432 645,803 883,447 Staff Cost 23,791 28,301 36,661 38,609 46,624 41,508 45,659 50,225 55,248 S G &A Expenses 13,789 19,778 22,182 20,857 19,320 19,822 25,645 33,109 44,768
EBITDA 47,394 56,299 62,639 54,595 66,581 89,918 72,364 90,819 125,213 Change (%) 21.6 18.8 11.3 -12.8 22.0 35.1 -19.5 25.5 37.9 Adj EBIDTA 47,394 56,299 64,639 57,445 67,161 64,879 72,364 90,819 125,213 EBITDA Margin (%) 12.8 12.8 12.2 11.1 11.9 11.4 11.4 11.1 11.3 Depreciation 3,797 5,905 6,807 7,141 7,835 10,082 10,754 12,304 15,016 EBIT 43,597 50,394 55,831 47,454 58,746 79,836 61,610 78,516 110,198 Net Interest 5,053 6,193 6,661 9,548 10,761 14,190 13,000 12,000 12,000 Other Income 7,422 9,106 11,748 16,364 18,558 22,834 25,468 28,968 28,968 Non-recurring Other Income 2,280 2,369 1,635 2,509 251 0 0 0 0 Profit before Tax 48,259 55,686 62,553 56,779 66,794 88,480 74,078 95,484 127,166 Tax 16,409 19,436 18,538 15,478 17,748 16,450 19,631 25,781 34,335 Effective Tax Rate (%) 34.0 34.9 29.6 27.3 26.6 18.6 26.5 27.0 27.0 Reported Profit 43,760 39,580 44,565 43,845 54,931 72,029 54,447 69,703 92,831 EO Adjustments 11,910 3,329 550 2,544 5,885 0 0 0 0 Adjusted Profit 31,850 36,250 45,375 41,861 50,718 47,705 54,447 69,703 92,831 Growth (%) 17.6 13.8 25.2 -7.7 21.2 -5.9 14.1 28.0 33.2 Cons. Profit (Reported) 54,507 44,562 46,937 52,056 49,019 47,648 48,389 64,086 89,746 Cons. Profit (Adj) 37,110 42,416 47,730 49,327 40,244 44,867 48,389 64,086 89,746 Growth (%) 23.5 14.3 12.5 3.3 -18.4 11.5 7.8 32.4 40.0
Balance Sheet
(INR Million) Y/E March 2010 2011 2012 2013 2014 2015 2016E 2017E 2018E Equity Capital 1,204 1,218 1,225 1,231 1,854 1,854 1,854 1,854 1,854 Reserves and Surplus 181,912 217,245 251,005 290,196 334,764 369,166 408,975 459,939 527,812 Net Worth 183,116 218,463 252,230 291,427 336,618 371,020 410,829 461,793 529,666 Debt 68,008 71,611 98,958 88,342 114,589 120,000 120,000 120,000 120,000 Deferred Tax Liability 774 2,635 1,328 2,420 4,099 4,099 4,099 4,099 4,099 Capital Employed 251,899 292,708 352,516 382,190 455,307 495,119 534,928 585,892 653,765
Gross Fixed Assets 72,901 89,465 105,544 119,856 116,632 128,756 148,756 168,756 188,756 Less : Depreciation 17,916 23,025 29,495 36,806 39,884 50,160 60,913 73,217 88,232 Add : Capital WIP 8,742 7,713 7,587 5,968 5,624 4,500 4,500 4,500 4,500 Net Fixed Assets 63,727 74,153 83,636 89,018 82,372 83,096 92,343 100,039 105,024 Investments 137,054 146,848 158,719 161,034 192,146 219,714 230,297 303,451 211,605 Inventory 14,154 15,772 17,766 20,642 19,825 21,096 25,404 30,748 41,575 Sundry Debtors 111,584 124,276 187,169 226,130 215,388 222,368 254,040 311,584 421,297 Cash & Bank 14,319 17,296 17,781 14,557 17,829 35,442 60,663 29,408 137,905 Loans & Advances 60,365 82,253 90,616 94,128 100,672 97,449 104,043 124,275 138,410 Other Current Assets 63,532 110,501 120,636 118,730 154,814 154,575 165,754 205,617 277,797 Current Assets 263,883 350,099 433,968 474,187 508,527 530,929 609,903 701,632 1,016,983 Current Liabilities 212,765 278,392 323,807 342,049 327,739 338,621 397,614 519,230 679,847 Net Current Assets 51,118 71,707 110,162 132,138 180,788 192,308 212,289 182,402 337,137 Capital Deployed 251,899 292,708 352,516 382,191 455,306 495,119 534,928 585,892 653,765 E: MOSL Estimates

Thematic | Good-to-Great
September 2015 57
Financials and Valuations: Larsen & Toubro
Ratios Y/E March 2010 2011 2012 2013 2014 2015 2016E 2017E 2018E Basic (INR)
Standalone EPS Adj 35.3 39.7 49.4 45.3 54.7 51.5 58.7 75.2 100.2 Growth (%) 14.3 12.6 24.4 -8.2 20.7 -5.9 14.1 28.0 33.2 Consolidated EPS Adj 41.1 46.4 52.0 53.4 43.4 48.4 52.2 69.1 96.8 Growth (%) 20.1 13.0 11.9 2.8 -18.7 11.5 7.8 32.4 40.0 Cash EPS 39.9 46.3 57.0 53.2 63.3 62.3 70.3 88.5 116.4 Book Value 202.7 239.2 274.6 315.7 363.2 400.3 443.2 498.2 571.4 Dividend Per Share 8.3 9.7 11.0 12.3 14.3 16.2 14.7 18.8 25.0 Div. Payout (Incl. Div Tax ) % 27.6 28.4 25.0 27.9 25.5 32.0 26.9 26.9 26.9
Valuation (x)
P/E (Standalone) 17.7 30.6 26.1 20.4 15.3 P/E (Consolidated) 22.2 32.5 29.4 22.2 15.8 Price / CEPS 24.2 24.6 21.8 17.3 13.2 EV/EBITDA 14.3 22.8 19.6 15.4 10.3 EV/ Sales 1.7 2.6 2.2 1.7 1.2 Price / Book Value 2.7 3.9 3.5 3.1 2.7 Dividend Yield 1.5 1.0 1.0 1.2 1.6
Return Ratio (%)
RoE 17.4 16.6 18.0 14.4 15.1 12.9 13.3 15.1 17.5 RoCE 14.0 13.9 14.3 12.9 13.0 11.9 12.1 13.5 15.6
Turnover Ratios
Debtors (Days) 109.0 102.4 127.1 158.1 137.5 141.0 144.6 137.4 137.4 Inventory (Days) 13.8 13.0 12.1 14.4 12.7 13.4 14.5 13.6 13.6 Asset Turnover (x) 1.5 1.5 1.5 1.4 1.3 1.2 1.2 1.4 1.7
Leverage Ratio
Current Ratio (x) 1.2 1.3 1.3 1.4 1.6 1.6 1.5 1.4 1.5 D/E (x) -0.1 -0.1 0.1 0.1 0.2 0.1 0.0 -0.1 -0.3
Cash Flow Statement (INR Million) Y/E March 2010 2011 2012 2013 2014 2015 2016E 2017E 2018E PBT before EO Items 48,259 55,686 63,103 59,323 72,679 67,012 74,078 95,484 127,166 Add : Depreciation 4,159 6,003 7,005 7,277 7,924 10,082 10,754 12,304 15,016 Interest 5,053 6,193 6,661 9,548 10,761 14,190 13,000 12,000 12,000 Less : Direct Taxes Paid 16,409 19,436 18,538 15,478 17,748 16,450 19,631 25,781 34,335 (Inc)/Dec in WC 11,407 -9,338 -34,430 -27,542 -43,718 -772 6,762 -5,469 -52,456 CF from Operations 52,469 39,107 23,801 33,127 29,899 74,061 84,963 88,538 67,391 (Inc)/Dec in FA -15,940 -16,429 -16,487 -12,660 -1,278 -10,806 -20,000 -20,000 -20,000 Free Cash Flow 36,529 22,678 7,313 20,467 28,621 63,255 64,963 68,538 47,391 (Pur)/Sale of Investments -26,536 6,812 4,968 12,065 14,334 -18,527 0 -55,000 0 Investment in subs -27,880 -16,607 -16,839 -14,380 -46,457 -8,030 -10,583 -18,154 91,846 Advances to subs -1,366 -9,598 -4,703 1,217 -2,393 3,681 0 0 0 CF from Investments -71,722 -35,822 -33,061 -13,758 -35,794 -33,682 -30,583 -93,154 71,846 (Inc)/Dec in Net Worth 23,851 7,927 -978 8,687 5,924 0 0 0 0 (Inc)/Dec in Debt 2,448 3,603 27,347 -10,616 26,247 5,411 0 0 0 Less : Interest Paid 5,053 6,193 6,661 9,548 10,761 14,190 13,000 12,000 12,000 Dividend Paid 7,338 8,973 9,962 11,119 12,243 13,987 16,160 14,638 18,740 CF from Fin. Activity 13,908 -3,636 9,746 -22,595 9,167 -22,766 -29,160 -26,638 -30,740 Inc/Dec of Cash 6,566 2,979 485 -3,226 3,272 17,613 25,221 -31,255 108,497 Add: Beginning Balance 7,753 14,319 17,296 17,781 14,557 17,829 35,442 60,663 29,408 Closing Balance 14,319 17,298 17,781 14,555 17,828 35,441 60,663 29,408 137,905 E: MOSL Estimates

Thematic | Good-to-Great
September 2015 58
After muted volumes in the last four years, India’s personal vehicle (PV) industry is poised for strong growth of over 15% CAGR, driven by economic recovery, increasing penetration, and muted fuel inflation (against 13% CAGR over the last five years).
PV penetration in India is just 1.7% against 11.3% in China and 81% in the US. Maruti Suzuki (MSIL) is the leader in the domestic PV market, with ~46% share. We expect competitive intensity in the PV industry to remain stable, with top-5 players
controlling ~80% market share.
Industry Attractiveness
Maruti Suzuki CMP: INR4,069 TP: INR5,290 (+30%) Buy
The management has been focused on increasing localization and reducing imports (from ~27% of net sales to 15-16% of net sales) over the last two years.
Plans to outsource manufacturing to the parent on cost basis would reduce capital intensity, and improve FCFF and RoIC profile without diluting low cost structure.
MSIL enjoys significant competitive advantage due to (a) wide product portfolio, (b) widest distribution network, and (c) lowest total cost of ownership.
Disciplined Management
We expect MSIL’s market share to increase by ~200bp to ~48%, led by ~16.5% volume CAGR over FY15-18. This coupled with better mix would drive ~20% revenue CAGR.
We expect EBITDA margin of 18% in FY18 driven by discount moderation along with a few other factors. We estimate EPS CAGR of ~42% over FY15-18.
We expect RoE to improve by ~6pp to 22.6% and RoIC by 33.7pp to 59.3% by FY18.
Expected Results
Increasing rural presence: Having ramped up its rural presence to ~125k villages as at the end of FY15, MSIL plans to expand to 150k villages by the end of FY16. It has also focused on select customer groups not impacted by the slowdown (for example, government employees, teachers, priests).
Strong new product pipeline: The parent, Suzuki is planning to launch 20 new models globally in five years, a large part of which would be launched in India as well.
Premiumization drive: With the Ciaz launch tasting good success, MSIL plans to launch several premium products (S-Cross, a premium hatchback, and a compact SUV) over the next 15 months. It has launched Nexa dealerships, focusing on premium products.
Disciplined Action
Focus on rural markets: To offset the downturn in urban markets due to economic headwinds, MSIL has started to develop underpenetrated rural markets.
Focus on product portfolio expansion: During the downturn, MSIL has focused on launching new products to create excitement in the market.
Focus on premiumization: MSIL is focusing on being future-ready by adding more premium products to its bouquet of offerings.
Disciplined Thought

Thematic | Good-to-Great
September 2015 59
Exhibit 58: Estimate 16% volume CAGR, of which 8% driven by new models
Source: Company, MOSL
Exhibit 59: Product mix improves as new launches are in premium segment
Source: Company, MOSL
Exhibit 60: EBITDA margin could be 18% v/s estimate of 17%
Source: Company, MOSL
Exhibit 61: FCF generation would be substantial, as capacity-related capex to be incurred by Suzuki
Source: Company, MOSL
Exhibit 62: RoIC to improve, driven by strong operating performance and lower capex intensity (%)
Source: Company, MOSL
108
40 3 4 5 4 5 170
FY15
Exist
ing
Mod
els
Ciaz
S-Cr
oss
YRA
Hatc
hbac
k
YBA
Com
pact
SUV Expo
rts
FY18
MSIL Average Monthly Volumes (`000 Units)
8% CAGR
New models contributes 8pp to 16% volume CAGR (FY15-18)
69 65 52 52 48 45 42 42
19 22 23 24 26 25 24 24
10 11 23 24 23 23 27 28
2 2 1 0 3 6 7 7
FY11 FY12 FY13 FY14 FY15 FY16 FY17 FY18
Upto 400k Price 400-600kPrice 600-800k Price 800k and above
18.5
13.4 1.6
1 1
0.5 1
FY15
Mar
gins
Low
erdi
scou
nts Fx
Com
mod
itypr
ices
Prod
uct M
ix
Ope
ratin
gle
vera
ge
FY18
Mar
gins
26 44 49
64 80
116
-29.6 -38.1 -34.9 -32.4 -30.0 -30.0
-4.0 5.7 14.1
31.7 50.3
86.4
FY12 FY13 FY14E FY15E FY16E FY17E
CFO Capex FCF
18.3
40.5 30.6
13.6 16.8 17.7 25.6
40.8
59.3
80.0
FY09 FY10 FY11 FY12 FY13 FY14 FY15E FY16E FY17E FY18E
ROIC

Thematic | Good-to-Great
September 2015 60
Financials and Valuations: Maruti Suzuki
Income Statement (INR Million) Y/E March 2010 2011 2012 2013 2014 2015 2016E 2017E 2018E Total Op. Income 296,231 369,199 355,872 435,879 437,918 499,706 582,929 725,858 855,986 Change (%) 41.7 24.6 -3.6 22.5 0.5 14.1 16.7 24.5 17.9 Total Cost 256,883 333,363 330,741 393,583 386,047 432,577 487,318 603,400 710,120 EBITDA 39,348 35,837 25,130 42,296 51,871 67,129 95,611 122,458 145,866 Change (%) 92.0 -8.9 -29.9 68.3 22.6 29.4 42.4 28.1 19.1
EBITDA Margins (%) 13.3 9.7 7.1 9.7 11.8 13.4 16.4 16.9 17.0 Depreciation 8,250 10,135 11,384 18,612 20,844 24,703 27,693 30,252 32,231 EBIT 31,098 25,702 13,747 23,684 31,027 42,426 67,918 92,205 113,635 Interest 335 244 552 1,898 1,759 2,060 1,750 1,750 1,750 Other Income 4,998 5,665 8,268 8,124 7,317 8,316 6,594 8,736 16,080 PBT 35,925 31,088 21,463 29,910 36,585 48,682 72,762 99,191 127,965 Effective tax Rate (%) 30.5 26.4 23.8 20.0 23.9 23.8 27.5 25.0 25.0 PAT 24,976 22,886 16,353 23,921 27,830 37,112 52,752 74,393 95,974 Change (%) 104.9 -8.4 -28.5 46.3 16.3 33.4 42.1 41.0 29.0 Adj. PAT 25,068 23,101 16,353 23,921 27,830 37,112 52,752 74,393 95,974 Change (%) 88.0 -7.8 -29.2 46.3 16.3 33.4 42.1 41.0 29.0
Balance Sheet (INR Million) Y/E March 2010 2011 2012 2013 2014 2015 2016E 2017E 2018E Share Capital 1,445 1,445 1,445 1,510 1,510 1,510 1,510 1,510 1,510 Reserves 116,906 137,230 150,429 184,279 208,270 235,532 273,760 328,183 402,371 Net Worth 118,351 138,675 151,873 185,790 209,781 237,043 275,271 329,693 403,881 Loans 8,214 3,093 11,749 14,928 16,851 1,802 1,802 1,802 1,802 Deferred Tax Liability 1,370 1,644 3,025 4,087 5,866 4,810 4,810 4,810 4,810 Capital Employed 127,935 143,412 166,647 204,805 232,498 243,655 281,883 336,305 410,493 Net Fixed Assets 50,247 55,294 75,207 97,992 107,904 122,593 133,728 133,476 131,245 Capital WIP 3,876 14,286 9,419 19,422 26,214 18,828 10,000 10,000 10,000 Investments 71,766 51,067 61,474 70,783 101,179 128,140 128,140 128,140 128,140 Curr.Assets, Loans 37,724 63,563 76,922 78,683 70,061 65,949 106,202 181,490 274,099 Inventory 12,088 14,150 17,965 18,407 17,060 26,150 25,553 31,818 37,523 Sundry Debtors 8,099 8,933 9,376 14,237 14,137 10,698 17,568 21,875 25,797 Cash & Bank Balances 982 25,085 24,362 7,750 6,298 183 34,163 98,878 181,861 Loans & Advances 15,707 13,722 21,193 23,940 28,895 25,221 25,221 25,221 25,221 Others 848 1,673 4,027 14,349 3,672 3,698 3,698 3,698 3,698 Current Liab. & Prov. 35,678 40,798 56,376 62,076 72,860 91,856 96,187 116,800 132,991 Sundry Creditors 29,365 35,540 49,391 53,335 64,103 75,326 72,415 85,337 97,102 Provisions 6,313 5,258 6,985 8,741 8,757 16,530 23,772 31,463 35,888 Net Current Assets 2,046 22,765 20,546 16,608 -2,800 -25,907 10,015 64,690 141,109 Appl. of Funds 127,935 143,412 166,647 204,805 232,497 243,654 281,883 336,305 410,493 E: MOSL Estimates

Thematic | Good-to-Great
September 2015 61
Financials and Valuations: Maruti Suzuki
Ratios Y/E March 2010 2011 2012 2013 2014 2015 2016E 2017E 2018E Basic (INR)
Adjusted EPS 86.7 79.9 56.6 79.2 92.1 122.9 174.6 246.3 317.7 EPS Growth (%) 88.0 (7.8) (29.2) 39.9 16.3 33.4 42.1 41.0 29.0 Consol EPS 90.8 82.4 58.2 81.7 94.4 127.5 179.5 251.5 323.3 Cash EPS 115.3 115.0 96.0 143.4 163.4 209.3 271.1 351.6 430.0 Book Value per Share 409.5 479.8 525.7 615 694 785 911 1,091 1,337 DPS 6.0 7.5 7.5 8.0 12.0 25.0 40.0 55.0 60.0 Div. payout (%) 8.1 11.0 15.4 11.7 15.2 24.5 27.5 26.8 22.7 Valuation (x)
Consol. P/E 43.1 31.9 22.7 16.2 12.6 Cash P/E 24.9 19.4 15.0 11.6 9.5 EV/EBITDA 21.9 16.4 11.2 8.2 6.3 EV/Sales 2.7 2.3 1.9 1.4 1.1 P/BV 5.9 5.2 4.5 3.7 3.0 Dividend Yield (%) 0.3 0.6 1.0 1.4 1.5 Profitability Ratios (%)
ROIC 40.5 30.6 13.6 16.8 17.7 25.6 40.8 59.3 80.0 RoE 21.1 16.5 10.8 12.9 13.3 15.7 19.2 22.6 23.8 RoCE 28.4 22.1 13.2 15.5 16.5 20.8 26.4 30.0 31.6 Turnover Ratios
Debtors (Days) 9 8 9 11 11 7 10 10 10 Inventory (Days) 17 15 20 17 16 22 19 19 19 Creditors (Days) 48 45 64 60 75 78 67 63 61 Work. Cap. (Days) -21 -21 -35 -32 -48 -49 -37 -34 -31 Asset Turnover (x) 2 3 2 2 2 2 2 2 2 Leverage Ratio
Debt/Equity (x) 0.1 0.0 0.1 0.1 0.1 0.0 0.0 0.0 0.0
Cash Flow Statement (INR Million) Y/E March 2010 2011 2012 2013 2014 2015 2016E 2017E 2018E OP/(Loss) before Tax 31,020 26,437 21,462 29,910 36,585 48,682 67,918 92,205 113,635 Int./Div. Received 4,103 3,595 -7,003 -4,470 -7,636 -7,228 6,594 8,736 16,080 Depreciation 8,250 10,135 11,384 18,612 20,844 24,703 27,693 30,252 32,231 Direct Taxes Paid -10,279 -10,240 -2,509 -5,333 -8,320 -10,407 -20,009 -24,798 -31,991 (Inc)/Dec in WC 1,327 4,171 2,265 5,123 7,562 8,356 -1,941 10,040 6,564 CF from Oper.Activity 34,421 34,098 25,599 43,842 49,035 64,106 80,254 116,435 136,519 CF after EO Items 34,421 34,098 25,599 43,842 49,035 64,106 80,254 116,435 136,519 (Inc)/Dec in FA -14,593 -24,114 -29,630 -38,100 -34,927 -32,386 -30,000 -30,000 -30,000 Free Cash Flow 19,828 9,984 -4,032 5,742 14,108 31,720 50,254 86,435 106,519 (Pur)/Sale of Invest. -38,787 21,253 -1,328 2,359 -14,002 -12,613 0 0 0 CF from Inv. Activity -53,380 -2,861 -30,958 -35,741 -48,929 -44,999 -30,000 -30,000 -30,000
Inc/(Dec) in Debt 1,881 -5,123 8,758 -5,493 3,373 -13,898 0 0 0 Interest Paid -319 -278 -426 -2,003 -1,615 -2,098 -1,750 -1,750 -1,750 Dividends Paid -1,011 -1,733 -2,167 -2,167 -2,417 -3,625 -14,524 -19,971 -21,786 CF from Fin. Activity 551 -7,134 6,165 -9,663 -659 -19,621 -16,274 -21,721 -23,536
Inc/(Dec) in Cash -18,408 24,103 806 -1,562 -553 -514 33,980 64,715 82,983 Add: Op. Balance 19,390 982 25,085 24,362 7,750 6,298 183 34,163 98,878 Closing Balance 982 25,085 25,891 22,799 7,197 5,784 34,163 98,878 181,861

Thematic | Good-to-Great
September 2015 62
Per capita cement usage in India is sub-normal at ~200kg v/s the global average of ~400kg. The top-5 cement groups control ~50% of the pan-India market.
UTCEM is the industry leader, with ~17% capacity market share (71m tons by FY16) and enjoys 15-30% market share across regions (#1 in South & West; #2 in North & East).
The industry is poised for recovery after prolonged weakness (~4% CAGR over FY12-15 v/s normal demand CAGR of 8%). We expect 5% growth in FY16 and 8-10% in FY17/18.
Industry Attractiveness
Ultratech CMP: INR2,917 TP: INR3,704 (+27%) Buy
UTCEM has an impressive track record, with focus on consistent growth and cost leadership. It has had no year of revenue decline during the last decade.
Cash PAT CAGR of ~30% over the past 10 years was well harmonized with doubling of payout ratio from 7% in FY07 to 14% in FY15.
UTCEM has prudently used the economic downturn to add capacity headroom and critical resources like land and limestone for future growth.
Disciplined Management
Gaining market share and bridging regional weak links ahead of demand up-cycle. UTCEM targets capacity of 100m tons by 2020 (1.5x next largest group). It would lead to strong utilization levers, higher pricing power, and logistics synergies across regions.
Cost leadership: UTCEM continues to focus on optimizing energy mix, logistics and synergies to widen the profitability gap with peers (10-15% above Ambuja now).
Attenuate growth constraints: Garnering land and limestone (20-25% of annual capex) before competition makes it better prepared to face macro / regulatory headwinds.
Disciplined Thought
Growing capacity, gaining market share: Capacity is likely to grow 45% over FY14-16, aided by both organic and inorganic initiatives. Market share would grow from 15% to 18% by FY17-18 (20-22% by FY19-20 assuming merger of BK Birla group assets).
Cost optimization underway; benefits visible: Initiatives like higher pet coke mix (70% v/s 45% a year ago), waste heat recovery (5-6% mix), logistics enhancements (bulk terminus, jetty) have begun showing cost benefits over 1QCY15, ahead of peers.
Better placed to tackle supply constraints: UTCEM has the ability to add 20-25m tons of capacity in a relatively short period, given its current land and limestone reserves.
Disciplined Action
Growth outperformance: UTCEM would have ~18% capacity market share by FY18, aiding industry leading volume growth (11-12%) and strong operating leverage.
Significant margin/RoE expansion: Cost initiatives and increase in pricing power would drive 7-8pp margin and RoE expansion over FY16-18.
Self-sustaining growth: FCFE generation of INR40b-45b per year from FY18 would give it the ability to execute annual capacity growth of ~8% using only internal accruals.
Expected Results

Thematic | Good-to-Great
September 2015 63
Exhibit 63: UTCEM has delivered consistent performance over the last 10 years (FY05-15 CAGR, %)
Exhibit 64: Consistent addition of capacity aids strong levers to ramp up utilization and drive up market share
Exhibit 65: Created capacity faster than peers (m tons)
Source: Company, MOSL
Exhibit 66: UTCEM’s market share in different regions (%) shows the strong pricing power it is gaining
Source: Company, MOSL
Exhibit 67: UTCEM steadily emerging as profit leader among peers, led by cost measures and strong price resilience (INR/t)
Source: Company, MOSL
Exhibit 68: UTCEM could record 4x scale-up in EBITDA over next five years assuming 100mt by 2020 (INR b)
Source: Company, MOSL
24 24 27
38 33
7
15
Revenue EBITDA PAT BV MarketCap
PayoutFY06
PayoutFY15
17 17 18 22 23 49 49 49 51 54 62 66 71
11 11 11 12 11
18 16 15 15 15
16 17 18
FY05
FY06
FY07
FY08
FY09
FY10
FY11
FY12
FY13
FY14
FY15
FY16
E
FY17
E
UTCEM Capcity (mt) UTCEM capacity market share (%)
31 20 16
6
49
31 27
14
71
32 30 24
UTCEM ACC ACEM SRCM
FY07 FY12 FY16
16 18
28
19 18 17
28 31
22
8
North East West Central South
FY14 Market share (Volume) FY16E Market share (Capacity)
0
350
700
1050
1400
FY06
FY09
FY12
FY13
FY14
FY15
FY16
E
FY17
E
UTCEM ACEM SRCM ACC
39 10 14 9 72
40 8
47 167
FY15
EBI
TDA
Volu
me
grow
th
Real
izatio
n gr
owth
Cost
mod
erat
ion
FY17
E EB
ITDA
Volu
me
impa
ct
Syne
rgy
impa
ct
Prof
itabi
lity
grow
th
FY20
E EB
ITDA
Period of narrowing margin gap with Ambuja
UTCEM to enjoy better margins here on

Thematic | Good-to-Great
September 2015 64
Financials and Valuations: UltraTech Cement
Income Statement (INR Million) Y/E March 2010 2011 2012 2013 2014 2015 2016E 2017E 2018E Net Sales 70,497 132,062 181,664 199,991 200,779 226,565 248,544 311,589 370,829 Change (%) 10.4 87.3 37.6 10.1 0.4 12.8 9.7 25.4 19.0 Total Expenditure 50,786 106,465 141,625 155,045 164,619 187,411 203,783 245,508 283,007
% of Sales 72.0 80.6 78.0 77.5 82.0 82.7 82.0 78.8 76.3 EBITDA 19,711 25,597 40,039 44,946 36,160 39,153 44,761 66,080 87,823 Margin (%) 28.0 19.4 22.0 22.5 18.0 17.3 18.0 21.2 23.7 Depreciation 3,881 7,657 9,026 9,454 10,523 11,331 13,851 18,373 19,053 EBIT 15,830 17,939 31,013 35,492 25,637 27,822 30,910 47,708 68,770 Int. and Finance Charges 1,175 2,725 2,239 2,097 3,192 5,475 6,154 10,061 9,772 Other Income - Rec. 1,227 2,619 4,568 4,620 5,310 6,515 5,000 6,000 8,000 PBT 15,882 17,833 33,343 38,015 27,755 28,863 29,756 43,646 66,998 EO Expense/(Income) 0 0 -666 0 -956 0 0 0 0 PBT after EO expense 15,882 17,833 34,009 38,015 28,711 28,863 29,756 43,646 66,998 Tax 4,949 3,791 9,467 11,700 7,266 8,715 8,927 12,221 19,429 Tax Rate (%) 31.2 21.3 27.8 30.8 25.3 30.2 30.0 28.0 29.0 Reported PAT 10,932 14,042 24,542 26,315 21,445 20,147 20,829 31,425 47,568 Adj PAT 10,932 14,042 24,062 26,315 20,731 20,147 20,829 31,425 47,568 Change (%) 11.9 28.4 71.4 9.4 -21.2 -2.8 3.4 50.9 51.4 Margin (%) 15.5 10.6 13.2 13.2 10.3 8.9 8.4 10.1 12.8
Balance Sheet (INR Million) Y/E March 2010 2011 2012 2013 2014 2015 2016E 2017E 2018E Equity Share Capital 1,245 2,740 2,741 2,742 2,742 2,744 2,744 2,744 2,744 Reserves 44,842 103,920 125,858 149,606 168,233 185,833 203,001 229,644 271,634 Net Worth 46,087 106,660 128,598 152,348 170,975 188,576 205,745 232,388 274,377
Deferred liabilities 8307 17301 17378 19059 22958 27920 29408 30936 33950
Secured Loan 16,045 26,373 41,529 54,085 51,993 74,142 74,142 123,142 118,142 Unsecured Laon
Loans 16,045 26,373 41,529 54,085 51,993 74,142 74,142 123,142 118,142 Capital Employed 70,439 150,334 187,505 225,493 245,927 290,638 309,295 386,465 426,469 Goodwill
29,000 29,000
Gross Block 80,781 179,423 190,138 213,822 250,778 325,662 375,662 423,162 433,162 Less: Accum. Deprn. 31,365 65,420 73,797 82,599 92,059 105,044 118,896 137,269 156,322 Net Fixed Assets 49,417 114,003 116,342 131,224 158,718 200,212 256,767 285,894 276,840 Capital WIP 2,594 6,831 18,965 35,054 20,384 30,000 15,000 22,500 27,500 Investments 16,696 37,303 37,888 51,087 53,917 52,088 24,500 29,500 34,500
Curr. Assets 14,724 41,809 56,257 56,723 64,489 69,850 77,718 96,402 144,987 Inventory 8,217 19,565 20,359 23,505 23,684 27,514 30,642 38,415 45,719 Debtors 2,158 6,023 7,660 10,172 12,810 12,032 13,619 15,366 18,287 Cash & Bank Bal 837 1,448 1,896 1,427 2,775 2,139 2,814 4,206 35,262 Others 3,511 14,773 26,342 21,619 25,220 28,165 30,642 38,415 45,719 Curr. Liability & Prov. 12,991 49,612 41,947 48,595 51,614 61,511 64,689 76,830 86,358 Creditors 11,381 43,877 33,740 37,903 41,884 48,481 51,071 64,025 71,118 Provisions 1,610 5,735 8,207 10,692 9,730 13,030 13,619 12,805 15,240 Net Current Assets 1,733 -7,803 14,310 8,128 12,875 8,339 13,028 19,572 58,629 Appl. of Funds 70,439 150,334 187,505 225,493 245,927 290,638 309,295 386,465 426,469 E: MOSL Estimates

Thematic | Good-to-Great
September 2015 65
Financials and Valuations: UltraTech Cement
Ratios Y/E March 2010 2011 2012 2013 2014 2015 2016E 2017E 2018E Basic (INR)
EPS 87.8 51.2 87.8 96.0 75.6 73.4 93.2 128.3 191.9 Cash EPS 119.0 79.2 120.7 130.5 114.0 114.7 138.6 193.8 261.4 BV/Share 370.2 389.2 469.2 556 623 687 767 878 1,050 DPS 6.0 6.0 8.0 9.0 9.0 9.0 11.0 15.0 17.5 Payout (%) 8.0 13.6 10.4 11.0 13.5 14.2 13.7 13.6 10.6
Valuation (x)
P/E 38.6 39.7 31.3 22.7 15.1 Cash P/E 25.6 25.4 21.1 15.1 11.1 P/BV 4.7 4.2 3.8 3.3 2.8 EV/Sales 3.9 3 3 2.7 2.2 EV/EBITDA 21.4 20.2 16.6 11.9 8.5 EV/Ton (Cap-USD) 223 200 195 189 178 Dividend Yield (%) 0.3 0.3 0.4 0.5 0.6
Return Ratios (%)
RoIC 17.2 13.0 15.7 14.2 9.1 7.1 8.2 9.4 12.8 RoE 26.6 18.4 20.5 18.7 12.8 11.2 12.8 15.6 19.9 RoCE 28.5 21.1 23.5 21.3 14.4 14.1 15.5 18.6 21.8
Working Capital Ratios
Fixed Asset Turnover (x) 1.1 1.4 1.0 1.1 1.2 1.4 1.5 1.3 1.2 Debtor (Days) 11 17 15 19 23 19 20 18 18 Creditor (Days) 59 121 68 69 76 78 75 75 70 Inventory (Days) 43 54 41 43 43 44 45 45 45 Wkg. Capital Turnover (Days) 9 -22 29 15 23 13 24 32 71
Leverage Ratio
Current Ratio 1.1 0.8 1.3 1.2 1.2 1.1 1.3 1.4 1.9 Interest Cover Ratio 13.5 6.6 13.9 16.9 8.0 5.1 6.3 5.4 7.8 Debt/Equity 0.3 0.2 0.3 0.4 0.3 0.4 0.4 0.5 0.4
Cash Flow Statement (INR Million) Y/E March 2010 2011 2012 2013 2014 2015 2016E 2017E 2018E
Op. Profit/(Loss) before Tax 19,692 25,635 41,304 46,244 36,160 39,153 49,909 72,302 94,991 Interest/Dividends Recd. 562 1,223 478 566 5,310 6,515 5,000 6,000 8,000 Direct Taxes Paid -3,891 -5,190 -7,340 -7,165 -3,367 -3,753 -9,132 -12,315 -18,171 (Inc)/Dec in WC -642 -925 158 -3,887 -3,399 3,900 -4,095 -5,188 -10,106 CF from Operations 15,721 20,743 34,600 35,759 34,704 45,815 41,682 60,799 74,715 EO expense 2 0 22 32 -956 0 0 0 0 CF from Operating incl EO Exp. 15,719 20,743 34,578 35,727 35,660 45,815 41,682 60,799 74,715
(inc)/dec in FA -2,741 -12,169 -31,575 -32,676 -23,348 -62,440 -55,406 -84,000 -15,000 Free Cash Flow 12,979 8,574 3,003 3,051 12,312 -16,625 -13,725 -23,201 59,715 (Pur)/Sale of Investments -5,776 -4,321 2,159 -10,349 -2,830 1,829 27,588 -5,000 -5,000 CF from investments -8,517 -16,489 -29,416 -43,025 -26,178 -60,611 -27,819 -89,000 -20,000 Issue of Shares 1 14 16 79 69 323 -154 0 0 (Inc)/Dec in Debt -4,547 -664 83 12,557 -2,092 22,149 0 49,000 -5,000 Interest Paid -1,459 -2,930 -2,907 -3,268 -3,192 -5,475 -5,931 -10,061 -9,772 Dividend Paid -1,405 -728 -1,905 -2,539 -2,887 -2,869 -3,507 -4,782 -5,579 CF from Fin. Activity -7,410 -4,309 -4,714 6,829 -8,102 14,128 -9,592 34,156 -20,351 Inc/Dec of Cash -208 -55 448 -469 1,380 -668 4,271 5,955 34,364 Add: Beginning Balance 1,045 1,503 1,448 1,896 1,427 2,775 2,139 6,410 12,365 Closing Balance 837 1,448 1,896 1,427 2,775 2,139 6,410 12,365 46,729 E: MOSL Estimates
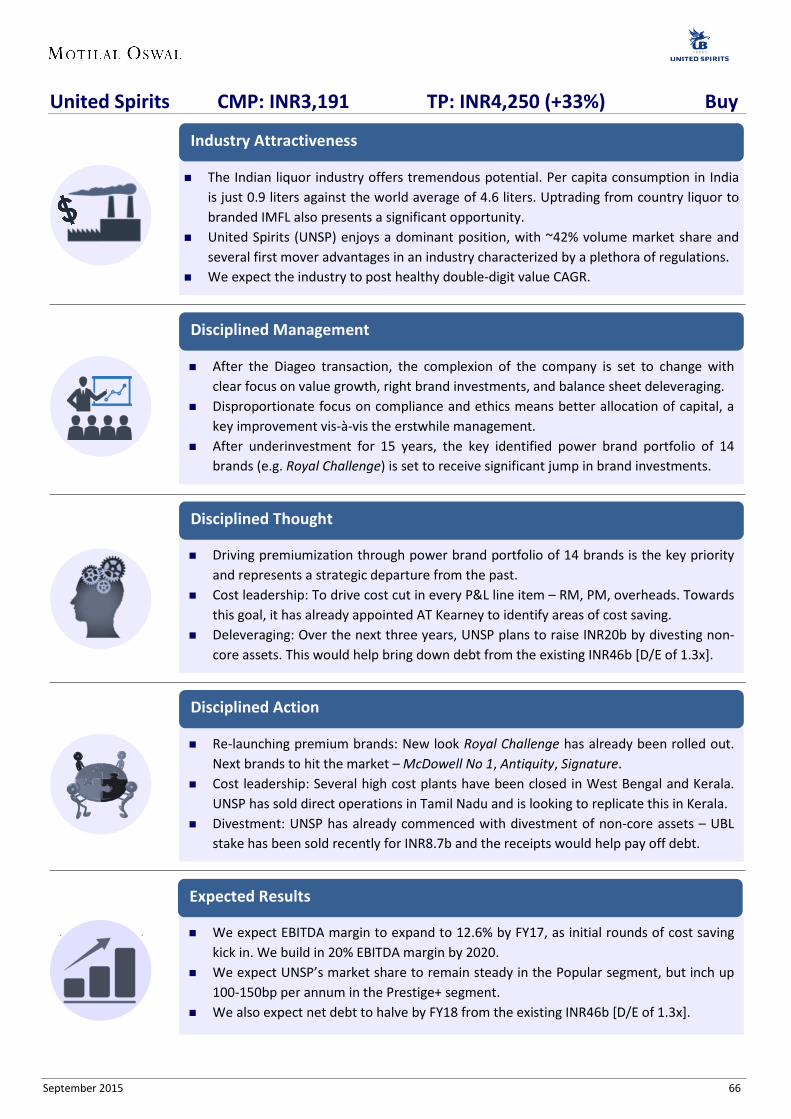
Thematic | Good-to-Great
September 2015 66
The Indian liquor industry offers tremendous potential. Per capita consumption in India is just 0.9 liters against the world average of 4.6 liters. Uptrading from country liquor to branded IMFL also presents a significant opportunity.
United Spirits (UNSP) enjoys a dominant position, with ~42% volume market share and several first mover advantages in an industry characterized by a plethora of regulations.
We expect the industry to post healthy double-digit value CAGR.
Industry Attractiveness
United Spirits CMP: INR3,191 TP: INR4,250 (+33%) Buy
After the Diageo transaction, the complexion of the company is set to change with clear focus on value growth, right brand investments, and balance sheet deleveraging.
Disproportionate focus on compliance and ethics means better allocation of capital, a key improvement vis-à-vis the erstwhile management.
After underinvestment for 15 years, the key identified power brand portfolio of 14 brands (e.g. Royal Challenge) is set to receive significant jump in brand investments.
Disciplined Management
Driving premiumization through power brand portfolio of 14 brands is the key priority and represents a strategic departure from the past.
Cost leadership: To drive cost cut in every P&L line item – RM, PM, overheads. Towards this goal, it has already appointed AT Kearney to identify areas of cost saving.
Deleveraging: Over the next three years, UNSP plans to raise INR20b by divesting non-core assets. This would help bring down debt from the existing INR46b [D/E of 1.3x].
Disciplined Thought
We expect EBITDA margin to expand to 12.6% by FY17, as initial rounds of cost saving kick in. We build in 20% EBITDA margin by 2020.
We expect UNSP’s market share to remain steady in the Popular segment, but inch up 100-150bp per annum in the Prestige+ segment.
We also expect net debt to halve by FY18 from the existing INR46b [D/E of 1.3x].
Expected Results
Re-launching premium brands: New look Royal Challenge has already been rolled out. Next brands to hit the market – McDowell No 1, Antiquity, Signature.
Cost leadership: Several high cost plants have been closed in West Bengal and Kerala. UNSP has sold direct operations in Tamil Nadu and is looking to replicate this in Kerala.
Divestment: UNSP has already commenced with divestment of non-core assets – UBL stake has been sold recently for INR8.7b and the receipts would help pay off debt.
Disciplined Action

Thematic | Good-to-Great
September 2015 67
Exhibit 69: Per capita liquor consumption in India is a fraction of even developing market peers
Source: Company, MOSL
Exhibit 70: IMFL industry expected to post healthy double-digit value CAGR INR m 2013 2014 2015E 2016E 2017E CAGR Spirits 994.7 1,110.3 1,227.2 1,345.8 1,463.7 12.5 Brandy and Cognac 164.2 185.8 207.8 229.7 250.5 13.7 Rum 115.1 125.0 134.6 144.4 154.8 9.7 Whiskies 666.9 745.1 824.2 904.6 984.7 13.3 Gin 6.9 6.8 6.7 6.7 6.6 3.3 Vodka 41.5 47.5 53.8 60.4 67.1 25.0
Source: Industry Sources, Company, MOSL
Exhibit 71: Significant EBITDA margin decline over the years
Source: Company, MOSL
Exhibit 72: Excise duty as a % of gross sales has gone up substantially
Source: Company, MOSL
9.5 8.5
5.0 4.7 4.5 4.6
0.9
Russia Brazil Thailand USA UK World India
Russia Brazil Thailand USA UK World India
5.2 5.6 5.5
10.2
15.7
18.8
15.3 15.7 15.1 12.6 12.5
9.1 7.0
FY03 FY04 FY05 FY06 FY07 FY08 FY09 FY10 FY11 FY12 FY13 FY14 FY15
EBITDA Margin (%)
34.5 37.1 36.5
46.2 44.4 45.1 47.3 48.5
52.3 54.6
57.3 60.8 61.2
FY03 FY04 FY05 FY06 FY07 FY08 FY09 FY10 FY11 FY12 FY13 FY14 FY15
Excise duty as a % of gross sales

Thematic | Good-to-Great
September 2015 68
Financials and Valuations: United Spirits
Income Statement (INR Million) Y/E March 2010 2011 2012 2013 2014 2015 2016E 2017E 2018E Net Sales 58,530 68,586 86,372 98,524 99,116 91,594 93,868 108,904 128,593 Other Operating Inc 5,093 5,175 5,493 5,591 5,894 1,756 7,034 7,706 8,492 Total Revenue 63,623 73,762 91,865 104,115 105,009 93,350 100,903 116,609 137,085 Change (%) 16.4 15.9 24.5 13.3 0.9 -11.1 8.1 15.6 17.6 Total Expenditure -52,500 -63,109 -81,262 -94,078 -96,298 -85,677 -90,687 -101,910 -118,711 EBITDA 11,123 10,653 10,603 10,037 8,711 7,673 10,215 14,699 18,374 Change (%) 12.9 -4.2 -0.5 -5.3 -13.2 -11.9 33.1 43.9 25.0 Margin (%) 17.5 14.4 11.5 9.6 8.3 8.2 10.1 12.6 13.4 Depreciation -950 -1,023 -1,474 -1,784 -2,026 -2,229 -2,472 -2,752 -1,971 Int. and Fin. Charges -6,069 -4,985 -7,773 -8,861 -12,771 -6,873 -4,059 -3,050 -2,056 Other Income - Recurring 849 904 2,106 1,446 7,550 -4,904 3,025 3,328 3,660 Profit before Taxes 4,952 5,549 3,461 838 1,463 -6,333 6,709 12,224 18,007 Change (%) 77.5 12.1 -37.6 -75.8 74.5 -532.8 -205.9 82.2 47.3 Margin (%) 7.8 7.5 3.8 0.8 1.4 -6.8 6.6 10.5 13.1 Tax 1,932 2,098 1,481 1,781 2,762 520 2,214 4,034 5,942 Tax Rate (%) 39.0 37.8 42.8 212.4 188.8 -8.2 33.0 33.0 33.0 Minority Interest -4.9 -11.9 -7.2 -38.3 3.1 0.0 0 0 Adjusted PAT 3,026 3,463 1,988 -904 -1,302 -6,854 4,495 8,190 12,065 Change (%) 61.4 14.5 -42.6 -145.5 44.1 426.4 -165.6 82.2 47.3 Margin (%) 4.8 4.7 2.2 -0.9 -1.2 -7.3 4.5 7.0 8.8 Non-rec. (Exp)/Income -3,253 2,238 -108 -108 -43,589 -10,020 0 0 0 Reported PAT -227 5,701 1,880 -1,012 -44,891 -16,873 4,495 8,190 12,065 Balance Sheet (INR Million) Y/E March 2010 2011 2012 2013 2014 2015E 2016E 2017E 2018E Share Capital 1,207 1,259 1,259 1,259 1,453 1,453 1,453 1,453 1,453 Reserves 36,529 40,527 45,359 46,614 28,869 31,385 35,877 44,064 55,702 Minority Interest 85 175 146 111 7 7 7 7 7 Net Worth 37,820 41,961 46,764 47,984 30,330 32,845 37,338 45,525 57,163 Loans 58,504 67,107 75,231 72,517 81,563 41,563 36,063 30,063 22,563 Deffered Tax Liabilities -715 -325 -592 -589 -967 -905 -794 -592 -295 Capital Employed 95,610 108,743 121,403 119,911 110,927 73,504 72,607 74,996 79,431 Gross Block 23,745 26,972 29,620 31,026 35,317 31,317 35,317 39,317 43,317 Less: Accum. Depn. -6,493 -7,573 -9,432 -10,721 -13,413 -14,884 -17,357 -20,109 -22,080 Net Fixed Assets 17,251 19,399 20,188 20,305 21,905 16,433 17,961 19,208 21,238 Capital WIP 943 1,291 1,080 1,312 1,097 1,097 1,097 1,097 1,097 Goodwill 42,444 44,320 58,618 58,386 35,099 20,099 20,099 20,099 20,099 Investments 1,265 1,544 2,358 2,179 2,380 2,380 2,380 2,380 2,380 Foregin Monetary term 1,413 - - - - - - - - Curr. Assets, L&A 49,490 61,842 75,729 82,059 87,129 68,535 71,917 78,788 90,980 Inventory 17,462 21,168 27,548 25,112 29,351 22,549 23,498 28,753 32,675 Account Receivables 13,401 14,825 17,737 24,170 22,652 18,751 21,839 23,961 28,168 Cash and Bank 3,189 4,944 2,690 1,115 1,063 1,500 1,500 1,500 1,500 Bank Deposit 4,497 1,426 942 1,701 5,984 3,187 1,582 614 469 Others 10,940 19,479 26,812 29,960 28,078 22,549 23,498 23,961 28,168 Curr. Liab. and Prov. 17,644 20,102 36,570 44,330 36,683 35,040 40,846 46,577 56,362 Account Payables 10,280 13,304 16,792 15,653 14,267 13,055 16,587 19,169 24,412 Other Liabilities 4,516 5,026 17,328 24,864 16,275 15,428 17,969 20,766 24,412 Provisions 2,848 1,771 2,451 3,812 6,141 6,557 6,291 6,642 7,538 Net Current Assets 31,846 41,741 39,159 37,729 50,447 33,495 31,070 32,212 34,618 Msc Expenses 448 448 - - (1) - Application of Funds 95,610 108,742 121,403 119,911 110,927 73,504 72,607 74,996 79,431

Thematic | Good-to-Great
September 2015 69
Financials and Valuations: United Spirits
Ratios Y/E March 2010 2011 2012 2013 2014 2015 2016E 2017E 2018E Basic (INR) EPS 25.8 28.3 16.2 -7.4 -9.0 -47.2 30.9 56.4 83.0 Cash EPS 32.9 36.7 28.3 7.2 5.0 -31.8 47.9 75.3 96.6 BV/Share 313.4 342.8 382.0 392.0 208.7 226.0 256.9 313.3 393.3 DPS 2.5 2.5 2.5 2.5 2.5 0.0 0.0 0.0 2.5 Payout % 9.7 8.8 15.4 -33.9 -27.9 0.0 0.0 0.0 3.0 Valuation (x) P/E -356.2 -67.7 106.6 58.5 39.7 Cash P/E 640.4 -100.3 68.8 43.8 34.1 EV/Sales 4.7 4.9 4.5 3.8 3.2 EV/EBITDA 56.9 59.3 45.4 31.1 24.5 P/BV 15.3 14.6 12.8 10.5 8.4 Dividend Yield (%) 0.1 0.0 0.0 0.0 0.1 Return Ratios (%) RoE 9.8 8.7 4.5 -1.9 -3.3 -21.7 12.8 19.8 21.1 RoCE 11.5 9.7 9.3 8.1 12.8 0.7 14.8 20.4 25.3 Working Capital Ratios Debtor (Days) 77 73 70 85 79 73 79 75 75 Asset Turnover (x) 0.7 0.7 0.8 0.9 0.9 1.3 1.4 1.6 1.7 Leverage Ratio Debt/Equity (x) 1.5 1.6 1.6 1.5 2.7 1.3 1.0 0.7 0.4 Cash Flow Statement (INR Million) Y/E March 2010 2011 2012 2013 2014 2015 2016E 2017E 2018E OP/(loss) before Tax 4,952 5,549 3,461 838 1,463 -6,333 6,709 12,224 18,007 Int./Div. Received -849 -904 -2,106 -1,446 -7,550 4,904 -3,025 -3,328 -3,660 Depreciation and Amort.
Interest Paid 6,069 4,985 7,773 8,861 12,771 6,873 4,059 3,050 2,056 Direct Taxes Paid -1,932 -2,098 -1,481 -1,781 -2,762 -520 -2,214 -4,034 -5,942 Incr/Decr in WC -4,741 -11,211 -156 614 -8,487 14,591 820 -2,109 -2,551 CF from Operations 3,500 -3,679 7,492 7,086 -4,564 19,515 6,349 5,804 7,910 Extraordinary Items -3,253 2,238 -108 -108 -43,589 -10,020 0 0 0 (Incr)/Decr in FA 815 -5,452 -16,736 -1,406 19,211 19,000 -4,000 -4,000 -4,000 Free Cash Flow 1,063 -6,893 -9,352 5,572 -28,942 28,495 2,349 1,804 (Pur)/Sale of Investments 8,236 -279 -814 179 -201 0 0 0 0 Msc Exp -285 0 -448 0 -1 1 0 0 0 CF from Invest. 5,513 -3,493 -18,106 -1,335 -24,580 8,981 -4,000 -4,000 -4,000 Issue of Shares 14,494 -1,179 3,303 2,611 27,278 19,389 -3 -3 -3 (Incr)/Decr in Debt -19,532 8,603 8,124 -2,714 9,047 -40,000 -5,500 -6,000 -7,500 Dividend Paid -366 -381 -379 -379 -41 0 0 0 -424 Others -413 -1,186 -3,172 -6,085 -2,910 -10,245 1,549 3,231 4,888 CF from Fin. Activity -5,817 5,856 7,876 -6,568 33,375 -30,856 -3,954 -2,772 -3,039 Incr/Decr of Cash 3,197 -1,316 -2,738 -816 4,231 -2,361 -1,605 -968 871 Add: Opening Balance 4,490 7,686 6,370 3,632 2,816 7,047 4,687 3,082 2,114 Closing Balance 7,687 6,370 3,632 2,816 7,047 4,686 3,081 2,113 2,985 E: MOSL Estimates
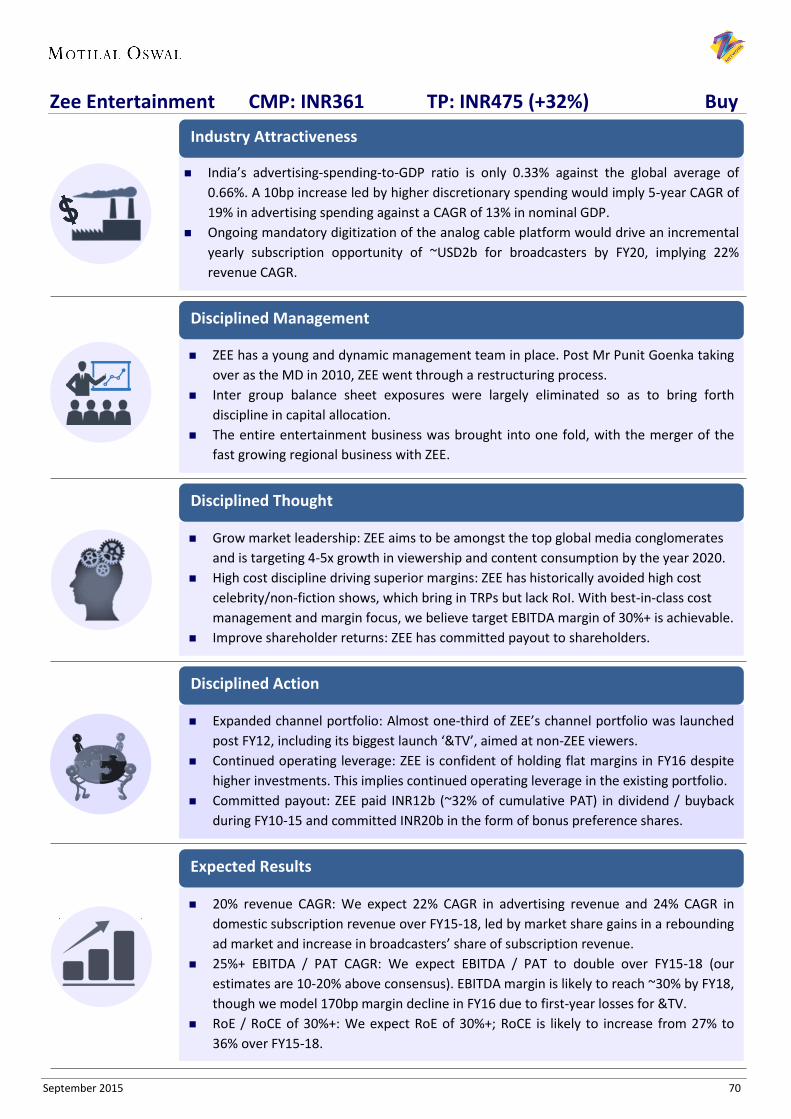
Thematic | Good-to-Great
September 2015 70
India’s advertising-spending-to-GDP ratio is only 0.33% against the global average of 0.66%. A 10bp increase led by higher discretionary spending would imply 5-year CAGR of 19% in advertising spending against a CAGR of 13% in nominal GDP.
Ongoing mandatory digitization of the analog cable platform would drive an incremental yearly subscription opportunity of ~USD2b for broadcasters by FY20, implying 22% revenue CAGR.
Industry Attractiveness
Zee Entertainment CMP: INR361 TP: INR475 (+32%) Buy
ZEE has a young and dynamic management team in place. Post Mr Punit Goenka taking over as the MD in 2010, ZEE went through a restructuring process.
Inter group balance sheet exposures were largely eliminated so as to bring forth discipline in capital allocation.
The entire entertainment business was brought into one fold, with the merger of the fast growing regional business with ZEE.
Disciplined Management
Expanded channel portfolio: Almost one-third of ZEE’s channel portfolio was launched post FY12, including its biggest launch ‘&TV’, aimed at non-ZEE viewers.
Continued operating leverage: ZEE is confident of holding flat margins in FY16 despite higher investments. This implies continued operating leverage in the existing portfolio.
Committed payout: ZEE paid INR12b (~32% of cumulative PAT) in dividend / buyback during FY10-15 and committed INR20b in the form of bonus preference shares.
Disciplined Action
20% revenue CAGR: We expect 22% CAGR in advertising revenue and 24% CAGR in domestic subscription revenue over FY15-18, led by market share gains in a rebounding ad market and increase in broadcasters’ share of subscription revenue.
25%+ EBITDA / PAT CAGR: We expect EBITDA / PAT to double over FY15-18 (our estimates are 10-20% above consensus). EBITDA margin is likely to reach ~30% by FY18, though we model 170bp margin decline in FY16 due to first-year losses for &TV.
RoE / RoCE of 30%+: We expect RoE of 30%+; RoCE is likely to increase from 27% to 36% over FY15-18.
Expected Results
Grow market leadership: ZEE aims to be amongst the top global media conglomerates and is targeting 4-5x growth in viewership and content consumption by the year 2020.
High cost discipline driving superior margins: ZEE has historically avoided high cost celebrity/non-fiction shows, which bring in TRPs but lack RoI. With best-in-class cost management and margin focus, we believe target EBITDA margin of 30%+ is achievable.
Improve shareholder returns: ZEE has committed payout to shareholders.
Disciplined Thought

Thematic | Good-to-Great
September 2015 71
Exhibit 73: Ad/GDP ratio: Global comparison (%)
Exhibit 74: Pay TV ARPU: Global comparison (USD)
Exhibit 75: FY15-18 incremental ad revenue analysis for Zee
Exhibit 76: Analysis of Broadcaster’s share of Pay TV subscription revenue
FY15 FY18E Pay TV subscription rev (INR b) -Analog 132 66 -Digital 213 463 Total 346 529 Broadcaster's share (INR b) -Analog 13 7 -Digital 65 139 Total 79 146 Broadcaster's share ( %) -Analog 10 10 -Digital 31 30 Total 23 28
Exhibit 77: EPS impact of &TV launch
Exhibit 78: EBITDA margin trajectory
Exhibit 79: We are meaningfully ahead of consensus FY16E FY17E FY18E
FY16E FY17E FY18E
Revenue (INR b)
EBITDA margin (%) MOSL 57.6 69.4 83.8
MOSL 23.9 27.2 30.4
Consensus 56.7 66.0 76.7
Consensus 25.1 27.4 29 MOSL vs Consensus (%) 1.5 5.1 9.3
MOSL vs Consensus (bp) -118bp -24bp 140bp
EBITDA (INR b)
EPS (INR) MOSL 13.8 18.9 25.5
MOSL 11.4 15.2 20.1
Consensus 14.3 18.1 22.3
Consensus 10.4 13.2 16.6
MOSL vs Consensus (%) -3.3 4.2 14.6 MOSL vs Consensus (%) 9.4 14.7 21.2
Source: Company, MOSL
0.3
0.5 0.6 0.7
0.8 0.9
1.1
India China Brazil Global Japan UK US
3 5 15 18
55 65
75
India China Malaysia Thailand Brazil UK USA
27
49 6
5 4
8
FY15 adrevenue
&TV Regional Hindi GECex-&TV
Others FY18E adrevenue
10.8 13.1
15.8 19.7
-0.6 -1.8 -0.7 0.5 10.2 11.4
15.2
20.1
FY15E* FY16E FY17E FY18E
ZEE EPS excl '&TV'&TV EPS contributionZEE EPS incl '&TV'
25.7 24.3 25.8 27.2 25.7 23.9 27.2 30.4 30.1 28.7
31.9 34.8
38.6 33.5 32.5 34.6
32.3 35.7 36.4 37.7
FY11 FY12 FY13 FY14 FY15 FY16E FY17E FY18E
Consolidated EBITDA marginNon sports EBITDA margin (incl &TV)Non sports EBITDA margin (excl &TV)
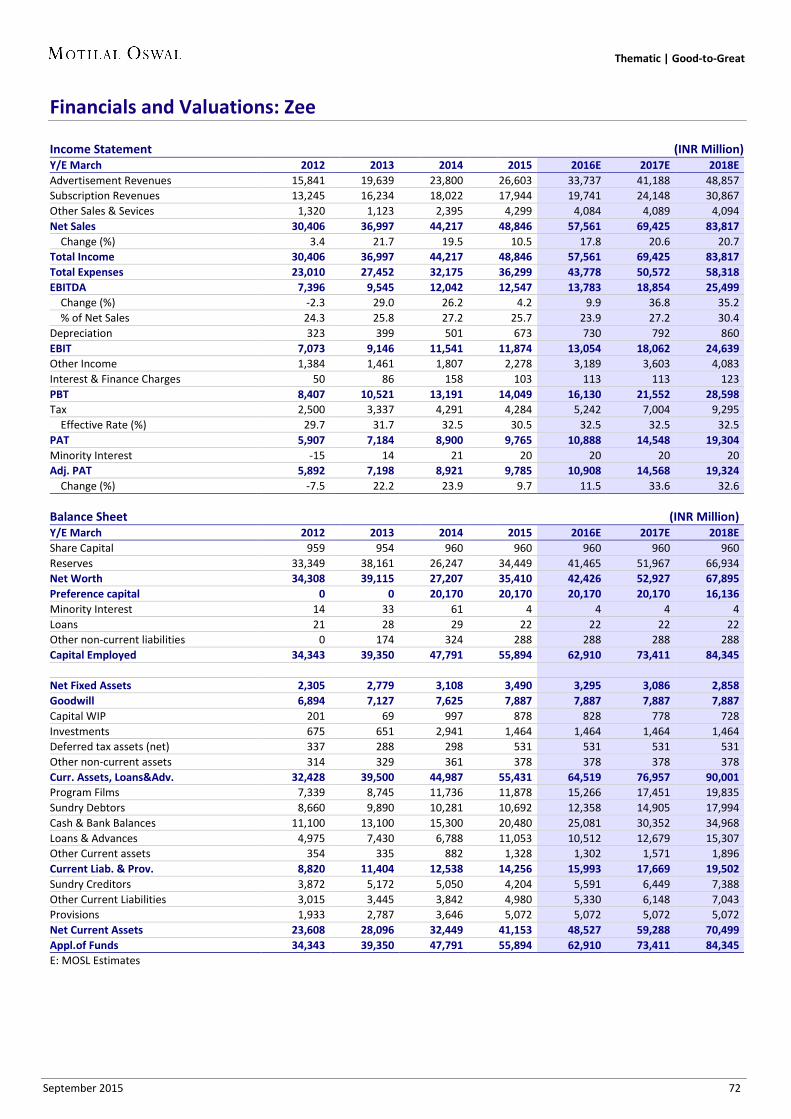
Thematic | Good-to-Great
September 2015 72
Financials and Valuations: Zee
Income Statement
(INR Million) Y/E March 2012 2013 2014 2015 2016E 2017E 2018E Advertisement Revenues 15,841 19,639 23,800 26,603 33,737 41,188 48,857 Subscription Revenues 13,245 16,234 18,022 17,944 19,741 24,148 30,867 Other Sales & Sevices 1,320 1,123 2,395 4,299 4,084 4,089 4,094 Net Sales 30,406 36,997 44,217 48,846 57,561 69,425 83,817 Change (%) 3.4 21.7 19.5 10.5 17.8 20.6 20.7 Total Income 30,406 36,997 44,217 48,846 57,561 69,425 83,817 Total Expenses 23,010 27,452 32,175 36,299 43,778 50,572 58,318 EBITDA 7,396 9,545 12,042 12,547 13,783 18,854 25,499 Change (%) -2.3 29.0 26.2 4.2 9.9 36.8 35.2 % of Net Sales 24.3 25.8 27.2 25.7 23.9 27.2 30.4 Depreciation 323 399 501 673 730 792 860 EBIT 7,073 9,146 11,541 11,874 13,054 18,062 24,639 Other Income 1,384 1,461 1,807 2,278 3,189 3,603 4,083 Interest & Finance Charges 50 86 158 103 113 113 123 PBT 8,407 10,521 13,191 14,049 16,130 21,552 28,598 Tax 2,500 3,337 4,291 4,284 5,242 7,004 9,295 Effective Rate (%) 29.7 31.7 32.5 30.5 32.5 32.5 32.5 PAT 5,907 7,184 8,900 9,765 10,888 14,548 19,304 Minority Interest -15 14 21 20 20 20 20 Adj. PAT 5,892 7,198 8,921 9,785 10,908 14,568 19,324 Change (%) -7.5 22.2 23.9 9.7 11.5 33.6 32.6 Balance Sheet
(INR Million)
Y/E March 2012 2013 2014 2015 2016E 2017E 2018E Share Capital 959 954 960 960 960 960 960 Reserves 33,349 38,161 26,247 34,449 41,465 51,967 66,934 Net Worth 34,308 39,115 27,207 35,410 42,426 52,927 67,895 Preference capital 0 0 20,170 20,170 20,170 20,170 16,136 Minority Interest 14 33 61 4 4 4 4 Loans 21 28 29 22 22 22 22 Other non-current liabilities 0 174 324 288 288 288 288 Capital Employed 34,343 39,350 47,791 55,894 62,910 73,411 84,345
Net Fixed Assets 2,305 2,779 3,108 3,490 3,295 3,086 2,858 Goodwill 6,894 7,127 7,625 7,887 7,887 7,887 7,887 Capital WIP 201 69 997 878 828 778 728 Investments 675 651 2,941 1,464 1,464 1,464 1,464 Deferred tax assets (net) 337 288 298 531 531 531 531 Other non-current assets 314 329 361 378 378 378 378 Curr. Assets, Loans&Adv. 32,428 39,500 44,987 55,431 64,519 76,957 90,001 Program Films 7,339 8,745 11,736 11,878 15,266 17,451 19,835 Sundry Debtors 8,660 9,890 10,281 10,692 12,358 14,905 17,994 Cash & Bank Balances 11,100 13,100 15,300 20,480 25,081 30,352 34,968 Loans & Advances 4,975 7,430 6,788 11,053 10,512 12,679 15,307 Other Current assets 354 335 882 1,328 1,302 1,571 1,896 Current Liab. & Prov. 8,820 11,404 12,538 14,256 15,993 17,669 19,502 Sundry Creditors 3,872 5,172 5,050 4,204 5,591 6,449 7,388 Other Current Liabilities 3,015 3,445 3,842 4,980 5,330 6,148 7,043 Provisions 1,933 2,787 3,646 5,072 5,072 5,072 5,072 Net Current Assets 23,608 28,096 32,449 41,153 48,527 59,288 70,499 Appl.of Funds 34,343 39,350 47,791 55,894 62,910 73,411 84,345 E: MOSL Estimates

Thematic | Good-to-Great
September 2015 73
Financials and Valuations: Zee
Ratios
Y/E March 2012 2013 2014 2015 2016E 2017E 2018E Basic (INR)
EPS 6.1 7.5 9.3 10.2 11.4 15.2 20.1 Cash EPS 6.4 7.9 9.8 10.9 12.1 16.0 21.0 EPS (excl '&TV' loss) 6.1 7.5 9.3 10.8 13.1 15.8 19.7 Book Value per Share 35.4 40.9 28.5 36.9 44.2 55.1 70.7 DPS 1.5 2.0 2.0 2.3 2.1 2.3 2.5 Payout (Incl. Div. Tax) % 24.4 26.5 21.5 22.1 18.5 14.8 12.4
Valuation
P/E 35.4 31.8 23.8 17.9 P/E (excl '&TV' loss) 33.4 27.5 22.8 18.4 EV/EBITDA 27.6 24.8 17.9 12.9 EV/Sales 7.1 5.9 4.8 3.9 Price/Book Value 9.8 8.2 6.6 5.1 Dividend Yield (%) 0.6 0.6 0.6 0.7
Profitability Ratios (%)
RoE 18.0 19.6 26.9 31.2 28.0 30.6 32.0 RoCE 25.8 28.8 30.6 27.3 27.3 31.8 36.4
Turnover Ratios
Debtors (No. of Days) 104 98 85 80 78 78 78 Inventory (No. of Days) 162 169 181 201 201 201 201 Creditors (No. of Days) 78 69 66 53 53 53 53 Asset Turnover (x) 0.9 1.0 1.0 0.9 1.0 1.0 1.1
Leverage Ratio
Debt/Equity (x) 0.0 0.0 0.0 0.0 0.0 0.0 0.0
Cash Flow Statement
(INR Million) Y/E March 2012 2013 2014 2015 2016E 2017E 2018E EBITDA 7,396 9,545 12,042 12,547 13,783 18,854 25,499 Other Inc/excep. items 1,384 1,461 1,807 2,278 3,189 3,603 4,083 Interest paid -50.0 -85.5 -157.8 -102.6 -112.6 -112.6 -122.6 Direct Taxes Paid -2,645.0 -3,288.0 -4,301.0 -4,517.0 -5242.4 -7004.4 -9294.5 (Inc)/Dec in Wkg. Capital -4,622.2 -3,837.9 -462.0 -5,132.4 -4114.2 -6944.4 -8049.2 Preference dividend paid CF from Oper. Activity 1,463 3,794 8,929 5,072 7,504 8,395 12,115
(Inc)/Dec in FA + CWIP -1,617 -974 -2,256 -1,198 -485 -532 -583 (Pur)/Sale of Invest. -52 24 -2,290 1,477 0 0 0 CF from Invest. Activity -1,669 -950 -4,546 279 -485 -532 -583
Issue of Shares 606 1,348 -20,159 2,472 0 0 0 Inc/(Dec) in Debt 4 7 20,171 -7 0 0 -4,034 Dividends Paid -1,683 -2,232 -2,244 -2,601 -2,439 -2,613 -2,903 Others -120 33 49 -37 20 20 20 CF from Finan. Activity -1,193 -844 -2,183 -173 -2,419 -2,593 -6,917
Inc/(Dec) in Cash -1,399 2,000 2,200 5,179 4,600 5,270 4,615 Add: Beginning Balance 12,500 11,100 13,100 15,300 20,480 25,081 30,352 Closing Balance 11,100 13,100 15,300 20,480 25,081 30,352 34,968 E: MOSL Estimates

Thematic | Good-to-Great
September 2015 74
Annexure III: The Backtest
Annexure III: The Backtest BSE Sensex: 25,202 S&P CNX: 7,655 4 September 2015
Britannia Inds. Eicher Motors HDFC Bank
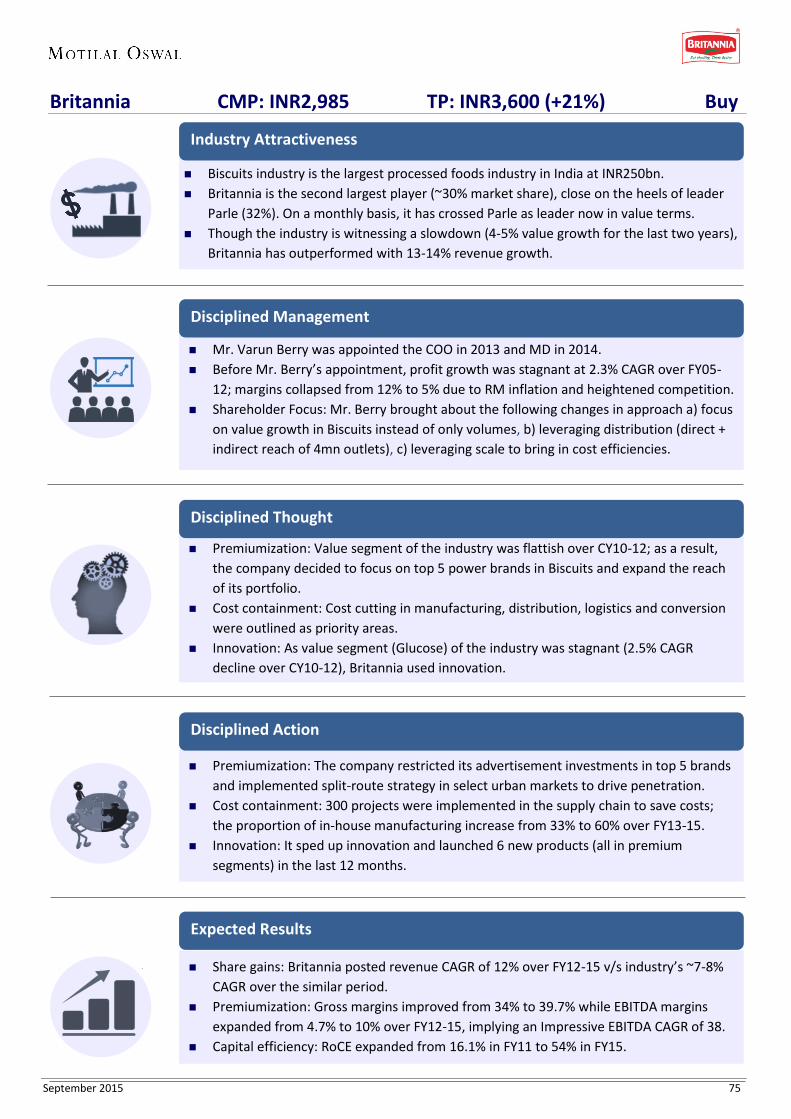
Thematic | Good-to-Great
September 2015 75
Biscuits industry is the largest processed foods industry in India at INR250bn. Britannia is the second largest player (~30% market share), close on the heels of leader
Parle (32%). On a monthly basis, it has crossed Parle as leader now in value terms. Though the industry is witnessing a slowdown (4-5% value growth for the last two years),
Britannia has outperformed with 13-14% revenue growth.
Industry Attractiveness
Britannia CMP: INR2,985 TP: INR3,600 (+21%) Buy
Share gains: Britannia posted revenue CAGR of 12% over FY12-15 v/s industry’s ~7-8% CAGR over the similar period.
Premiumization: Gross margins improved from 34% to 39.7% while EBITDA margins expanded from 4.7% to 10% over FY12-15, implying an Impressive EBITDA CAGR of 38.
Capital efficiency: RoCE expanded from 16.1% in FY11 to 54% in FY15.
Expected Results
Mr. Varun Berry was appointed the COO in 2013 and MD in 2014. Before Mr. Berry’s appointment, profit growth was stagnant at 2.3% CAGR over FY05-
12; margins collapsed from 12% to 5% due to RM inflation and heightened competition. Shareholder Focus: Mr. Berry brought about the following changes in approach a) focus
on value growth in Biscuits instead of only volumes, b) leveraging distribution (direct + indirect reach of 4mn outlets), c) leveraging scale to bring in cost efficiencies.
Disciplined Management
Premiumization: Value segment of the industry was flattish over CY10-12; as a result, the company decided to focus on top 5 power brands in Biscuits and expand the reach of its portfolio.
Cost containment: Cost cutting in manufacturing, distribution, logistics and conversion were outlined as priority areas.
Innovation: As value segment (Glucose) of the industry was stagnant (2.5% CAGR decline over CY10-12), Britannia used innovation.
Disciplined Thought
Premiumization: The company restricted its advertisement investments in top 5 brands and implemented split-route strategy in select urban markets to drive penetration.
Cost containment: 300 projects were implemented in the supply chain to save costs; the proportion of in-house manufacturing increase from 33% to 60% over FY13-15.
Innovation: It sped up innovation and launched 6 new products (all in premium segments) in the last 12 months.
Disciplined Action

Thematic | Good-to-Great
September 2015 76
Exhibit 80: Gross margin improved from 34% to 39.7% over FY11-FY15
Source: Company, MOSL
Exhibit 81: …while EBITDA margins expanded from 4.7% to 10% over the same period
Source: Company, MOSL
Exhibit 82: RoCE consistently improving over FY11-FY15
Source: Company, MOSL
Exhibit 83: Innovations in the past one year
Source: Company, MOSL
Exhibit 84: Massive outperformance v/s Sensex….
Source: Company, MOSL
Exhibit 85: …and BSE100
Source: Company, MOSL
41.1 41.3
35.8
39.0 38.1
36.1
34.0 35.3
37.1
38.9 39.7
FY05
FY06
FY07
FY08
FY09
FY10
FY11
FY12
FY13
FY14
FY15
Gross Margin (%) 12.3 11.7
5.8
8.5 7.0
4.3 4.7 5.2 6.0
8.0
10.0
FY05
FY06
FY07
FY08
FY09
FY10
FY11
FY12
FY13
FY14
FY15
EBITDA Margin (%)
55.6
36.7
15.9 22.6
17.4 10.8
16.1 22.9
30.5
48.7 54.3
FY05
FY06
FY07
FY08
FY09
FY10
FY11
FY12
FY13
FY14
FY15
RoCE (%)
907
143
50
300
550
800
1050
Mar
-11
Sep-
11
Feb-
12
Jul-1
2
Dec-
12
Jun-
13
Nov
-13
Apr-
14
Oct
-14
Mar
-15
Aug-
15
Britannia Inds. Sensex-Rebased
907
147
20
270
520
770
1020
Mar
-11
Sep-
11
Feb-
12
Jul-1
2
Dec-
12
Jun-
13
Nov
-13
Apr-
14
Oct
-14
Mar
-15
Aug-
15
Britannia Inds. BSE 100- Rebased

Thematic | Good-to-Great
September 2015 77
Financials and Valuations: Britannia
Income Statement (INR Million) Y/E March 2010 2011 2012 2013 2014 2015 2016E 2017E Net Revenues 37,729 45,897 54,608 61,359 68,293 77,751 89,157 103,905 Change (%) 10.3 21.6 19.0 12.4 11.3 13.8 14.7 16.5 Gross Profit 13,614 15,621 19,280 22,746 26,583 30,833 37,857 44,528
Margin (%) 36.1 34.0 35.3 37.1 38.9 39.7 42.5 42.9 Other Expenditure 8,976 10,123 12,221 13,691 15,108 16,510 18,151 21,059 EBITDA 1,629 2,170 2,863 3,711 5,438 7,806 12,217 14,845 Change (%) -31.6 33.3 31.9 29.7 46.5 43.5 56.5 21.5 Margin (%) 4.3 4.7 5.2 6.0 8.0 10.0 13.7 14.3 Depreciation 582 649 618 732 832 1,445 1,513 1,671 Int. and Fin. Charges 235 436 416 413 83 39 31 32 Financial Other Income 547 472 584 514 336 880 950 1,140 Operating Other Income 36 314 253 504 834 833 923 973 PBT 1,394 1,871 2,666 3,584 5,693 8,035 12,545 15,256 Tax 216 409 650 934 1,775 2,553 3,889 4,729 Deferred Tax -160 120 19 52 -39 -260 0 0 Tax Rate (%) 4.0 28.3 25.1 27.5 30.5 28.5 31.0 31.0 PAT 1,338 1,342 1,997 2,599 3,957 5,743 8,656 10,526 Change (%) 6.9 0.3 48.8 30.1 52.3 45.1 50.7 21.6 Margin (%) 3.5 2.9 3.7 4.2 5.8 7.4 9.7 10.1 Non-rec. (Exp.)/Income -307 0 0 0 0 1,142 0 0 Reported PAT 1,032 1,343 1,996 2,595 3,953 6,886 8,656 10,526
Balance Sheet (INR Million) Y/E March 2010 2011 2012 2013 2014 2015 2016E 2017E Share Capital 239 239 239 239 240 240 240 240 Reserves 2,589 3,021 3,853 5,269 7,698 12,176 17,147 23,392 Networth 2,828 3,260 4,092 5,508 7,938 12,415 17,387 23,632 Loans 6,570 6,188 6,042 3,800 1,498 1,451 1,499 1,499 Capital Employed 9,419 9,469 10,155 9,401 9,503 13,926 18,886 25,131
Gross Block 9,247 9,691 11,211 12,893 14,930 16,065 17,565 19,565 Less: Accum. Depn. -5,112 -5,498 -5,912 -6,517 -7,524 -8,731 -10,244 -11,915 Net Fixed Assets 4,135 4,193 5,300 6,376 7,406 7,334 7,321 7,650 Goodwill on consolidation 858 856 944 992 1,070 1,107 1,107 1,107 Capital WIP 102 128 1,113 1,473 1,071 484 484 484 Investments 3,664 3,885 2,485 1,082 1,979 5,179 8,554 12,054 Current 2,776 2,461 1,064 729 1,629 4,859 8,359 11,859 Non-current 889 1,424 1,421 353 350 321 195 195 Deferred Liability -61 58 76 128 89 -234 -234 -234 Currents Assets 6,313 7,126 8,579 8,912 9,543 13,596 17,402 22,034 Inventory 3,042 3,470 4,318 3,747 4,203 4,040 5,349 6,234 Account Receivables 733 810 1,130 1,228 1,087 1,358 1,561 1,808 Cash and Bank Balance 427 769 613 1,029 1,091 2,263 4,433 7,609 Others 2,111 2,078 2,518 2,908 3,163 5,934 6,058 6,383 Curr. Liab. & Prov. 5,714 6,661 8,189 9,306 11,477 14,007 16,214 18,431 Account Payables 1,614 2,680 3,870 3,935 5,567 7,034 7,345 8,312 Other Liabilities 3,163 2,700 2,748 3,722 3,799 4,273 4,571 4,893 Provisions 936 1,280 1,570 1,649 2,111 2,700 4,298 5,227 Net Current Assets 599 465 390 -394 -1,934 -411 1,187 3,603 Net Assets 9,419 9,470 10,156 9,401 9,503 13,926 18,886 25,131 E: MOSL Estimates

Thematic | Good-to-Great
September 2015 78
Financials and Valuations: Britannia
Ratios 1.45111 1.50732 1.21608 Y/E March 2010 2011 2012 2013 2014 2015 2016E 2017E Basic (INR)
EPS 11.2 11.2 16.7 21.7 33.0 47.9 72.2 87.8 BV/Share 23.7 27.3 34.3 46.1 66.2 103.5 145.0 197.0 DPS 5.0 6.5 8.5 8.5 12.0 16.0 25.3 30.7 Payout (%) 44.6 57.9 50.8 39.1 36.4 33.4 35.0 35.0 Valuation (x)
P/E 96.3 66.4 44.0 36.2 EV/Sales 5.3 4.6 3.9 3.3 EV/EBITDA 69.8 48.1 30.3 24.4 P/BV 45.5 29.1 21.9 16.1 Dividend Yield 0.4 0.5 0.8 1.0 Return Ratios (%)
RoE 26.7 44.1 54.3 54.1 58.9 56.4 58.1 51.3 RoCE 10.8 16.1 22.9 30.5 48.7 54.3 65.2 59.9 Working Capital Ratios
Debtor (Days) 7 6 8 7 6 6 6 6 Asset Turnover (x) 4.0 4.8 5.4 6.5 7.2 5.6 4.7 4.1 Leverage Ratio
Debt/Equity (x) 2.3 1.9 1.5 0.7 0.2 0.1 0.1 0.1
Cash Flow Statement (INR Million) Y/E March 2010 2011 2012 2013 2014 2015 2016E 2017E OP Profit 1,394 1,871 2,666 3,584 5,693 8,035 12,545 15,256 Dep 582 649 618 732 832 1,445 1,513 1,671 Financial Other Income -547 -472 -584 -514 -336 -880 -950 -1,140 Interest Paid -235 -436 -416 -413 -83 -39 -31 -32 Direct Taxes Paid 216 409 650 934 1,775 2,553 3,889 4,729 Inc in WC -427 -475 81 -1,200 -1,602 350 -572 -760 CF from Operations 1,875 2,550 2,385 4,481 6,099 5,736 9,822 11,849
Extraordinary Items
(Inc)/Dec in FA -504 -470 -2,505 -2,042 -1,634 -548 -1,500 -2,000 (Pur.)/Sale of Investments 109 -221 1,400 1,403 -897 -3,201 -3,375 -3,500 Other Non Rec Exp 307 0 0 0 0 -1,142 0 0 CF from Investments -87 -690 -1,105 -639 -2,531 -4,891 -4,875 -5,500
Issue of Shares 0 0 0 0 1 0 0 0 Inc in Debt 3,821 -381 -146 -2,242 -2,302 -47 48 0 Dividend Paid 1,118 696 902 1,180 1,189 1,684 2,309 3,520 Other Item 4,752 441 387 4 15 -2,058 516 -347 CF from Fin. Activity -2,049 -1,519 -1,436 -3,426 -3,506 327 -2,777 -3,173
Inc/Dec of Cash -261 341 -155 416 62 1,172 2,170 3,175 Add: Beginning Balance 688 427 769 613 1,029 1,091 2,263 4,433 Closing Balance 428 769 613 1,029 1,091 2,263 4,434 7,609 E: MOSL Estimates
Thematic | Good-to-Great
September 2015 79
Eicher’s key product Royal Enfield (RE) was part of the nascent leisure biking industry, which was estimated to contribute ~1% of domestic 2W volumes in CY12.
RE enjoyed virtual monopoly in the leisure biking segment, with ~78% market share of the segment.
The Leisure biking segment in India posted ~54% CAGR over CY12-14E, restricted by capacity constraints with Royal Enfield.
Industry Attractiveness
Eicher Motors CMP: INR18,147 TP: INR24,137 (+33%) Buy
After witnessing initial success with UCE-based engine for Royal Enfield, Eicher channelized its energy toward expanding production capacity and improving efficiencies.
More importantly, it worked on its marketing strategy—with focus on creating experiential marketing and building community of RE riders.
Eicher has a majority ownership in VECV JV with Volvo but its management is focused just on RE, leaving VECV’s management to Volvo.
Disciplined Management
Expanding capacity: Eicher expanded capacity from 100k in CY12 to ~300k in CY14 and ~600k in CY15. Subsequently, it expanded its capacity from ~180 dealers in CY11 to ~400 in CY14 and ~500 in CY15.
Focus on developing products: Eicher launched Thunderbird and Continental GT on its existing platform. It plans to launch two platforms over the next two years.
Focus on developing export markets: Apart from its existing export markets in the developed world, Eicher has started working on developing export markets in LatAm and Southeast Asia.
Disciplined Action
RE’s volumes posted 60% CAGR over CY12-15E, driven by new capacities and products. New capacities also led to improvement in efficiencies, driving S/A gross margin and EBITDA margin expansion of 7.3pp/13pp over CY12-15E.
As a result, RoEs improved ~15.4pp to 35.4% in CY15E.
Expected Results
Focus on building capacity: With strong demand and consistent waiting period of over six months for RE, the entire focus of the management was on building capacity. Subsequently it worked to expand its distribution network.
Focus on developing products: To ensure continued success of RE, Eicher’s next step was to broadbase product portfolio and expand addressable market.
Focus on developing export markets: With an eye on global mid-level motorcycle segment and noticeable gap in leisure segment in the 250-750cc category, Eicher was focused on replicating its India success globally.
Disciplined Thought

Thematic | Good-to-Great
September 2015 80
Exhibit 86: EPS and EPS growth (%)
Exhibit 87: RoE and RoCE (%)
Exhibit 88: Gross margins and EBITDA margins
Exhibit 89: Capacity and sales
Exhibit 90: Eicher Motors outperform Sensex
0
20
40
60
80
0
200
400
600
800
CY10 CY11 CY12 CY13 CY14 CY15E CY16E
EPS (INR) EPS Growth (%)-L.H.S
0
15
30
45
60
CY10 CY11 CY12 CY13 CY14 CY15E CY16E
RoE RoCE
0
10
20
30
40
0
15
30
45
60
CY10 CY11 CY12 CY13 CY14 CY15E CY16E
Gross Margins (%) EBITDA Margins (%) - L.H.S
60,
000
60,
000
100
,000
175
,000
300
,000
450
,000
720
,000
52,
576
74,
626
113
,432
178
,118
302
,591
462
,778
661
,959
CY10 CY11 CY12 CY13 CY14 CY15E CY16E
Capacity Sales
134
1,586
0
500
1,000
1,500
2,000
Jan-
11
Apr-
11
Aug-
11
Nov
-11
Feb-
12
Jun-
12
Sep-
12
Jan-
13
Apr-
13
Aug-
13
Nov
-13
Mar
-14
Jun-
14
Sep-
14
Jan-
15
Apr-
15
Aug-
15
BSE Sensex Eicher Motors

Thematic | Good-to-Great
September 2015 81
Financials and Valuations: Eicher Motors
Income Statement (Consolidated)
(INR Million) Y/E December 2010 2011 2012 2013 2014 2015E 2016E 2017E Net Sales 43,971 56,775 63,299 66,858 85,987 120,418 170,426 209,646 Change (%) 49.6 29.1 11.5 5.6 28.6 40.0 41.5 23.0 EBITDA 3,811 6,037 5,490 7,137 11,148 19,052 32,478 41,863
EBITDA Margin (%) 8.6 10.5 8.6 10.5 12.8 15.6 18.8 19.7 Depreciation 573 640 822 1,300 2,198 3,375 4,243 5,197 Interest cost 95 77 38 79 98 78 78 78 Other Income 1,034 1,281 1,366 953 1,074 685 1,218 2,315 PBT 4,177 6,602 5,997 6,711 9,926 16,284 29,374 38,903 Tax 1,108 1,628 1,249 1,452 2,909 4,854 8,744 11,550 Effective Rate (%) 26.5 24.7 20.8 21.6 29.3 29.8 29.8 29.7 PAT 3,068 4,974 4,749 5,259 7,017 11,430 20,630 27,353 Change (%) 137.0 62.1 -4.5 10.8 33.4 62.9 80.5 32.6 Less: Minority Interest 1,179.3 1,886.3 1,505.9 1,314.4 863.8 1,508.5 3,376.3 4,480.1 Adj. PAT 1,889 3,088 3,243 3,945 6,154 9,921 17,254 22,873
Change (%) 126.6 63.4 5.0 21.7 56.0 61.2 73.9 32.6
Balance Sheet (Consolidated)
(INR Million) Y/E December 2010 2011 2012 2013 2014 2015E 2016E 2017E Share Capital 269 270 270 270 271 271 271 271 Net Worth 12,321 14,931 17,549 20,554 25,159 30,815 46,401 67,424 Minority Interest 6,774 8,377 9,485 10,397 10,851 12,359 15,735 20,215 Deferred Tax 249 645 1,232 1,805 2,394 2,647 3,146 3,806 Loans 956 504 384 839 584 584 584 584 Capital Employed 20,301 24,456 28,649 33,595 38,986 46,405 65,865 92,029 Application of Funds
Gross Fixed Assets 8,113 9,887 15,260 22,993 31,374 43,243 53,243 64,493 Less: Depreciation 4,269 4,843 5,342 6,431 8,280 11,655 15,898 21,095 Net Fixed Assets 3,844 5,044 9,918 16,561 23,093 31,588 37,345 43,398 Capital WIP 703 4,128 5,044 4,636 4,188 1,250 1,250 1,250 - of which Goodwill 223 223 223 223 223 223 223 223 Investments 4,586 5,126 6,385 8,255 10,777 9,171 9,171 9,171 Curr.Assets, L & Adv. 20,500 23,501 23,368 23,914 26,018 34,390 60,340 90,259 Inventory 3,265 4,280 4,888 5,268 6,455 8,893 12,583 15,442 Sundry Debtors 2,609 3,434 4,459 5,125 5,622 5,332 7,346 8,776 Cash & Bank Balances 12,457 11,973 8,035 6,826 4,806 12,453 29,674 52,851 Loans & Advances 1,814 3,391 5,503 6,163 8,578 6,837 9,507 11,689 Others 355 424 483 532 557 875 1,231 1,501 Current Liab. & Prov. 9,332 13,343 16,066 19,771 25,089 29,994 42,241 52,049 Sundry Creditors 7,596 11,238 14,356 17,612 21,876 22,057 31,287 38,492 Other Liabilities 346 608 6 0 0 4,602 6,814 8,727 Provisions 1,391 1,497 1,704 2,159 3,213 3,336 4,141 4,830 Net Current Assets 11,168 10,157 7,302 4,143 928 4,396 18,099 38,210 Application of Funds 20,301 24,456 28,649 33,595 38,987 46,405 65,865 92,029 E: MOSL Estimates

Thematic | Good-to-Great
September 2015 82
Financials and Valuations: Eicher Motors
Ratios (Consolidated)
Y/E December 2010 2011 2012 2013 2014 2015E 2016E 2017E Basic (INR)
EPS 70.1 114.4 120.1 145.9 227.1 366.1 636.7 844.0 EPS Growth (%) 6.5 63.1 5.0 21.5 55.6 61.2 73.9 32.6 Cash EPS 91.4 138.1 150.5 194.0 308.2 490.6 793.2 1,035.8 Book Value per Share 457.4 553.2 650.0 760.1 928.4 1,137.1 1,712.2 2,488.0 DPS 11.0 16.0 20.0 30.0 35.0 40.0 45.0 50.0 Payout (Incl. Div. Tax) % 18.3 16.3 19.5 24.1 27.5 12.8 8.3 6.9 Valuation (x)
P/E 124.4 79.9 49.6 28.5 21.5 Cash P/E 93.5 58.9 37.0 22.9 17.5 EV/EBITDA 88.6 51.0 29.0 16.8 12.5 EV/Sales 10.6 7.8 5.4 3.6 2.8 Price to Book Value 23.9 19.5 16.0 10.6 7.3 Dividend Yield (%) 0.2 0.2 0.2 0.2 0.3 Profitability Ratios (%)
RoE 16.4 22.7 20.0 20.7 26.9 35.4 44.7 40.2 RoCE 22.4 29.8 22.7 21.8 27.6 38.3 52.5 49.4 RoIC 35.0 40.0 20.0 19.5 25.7 39.2 63.3 74.5 Turnover Ratios
Debtors (Days) 22 22 25 27 23 16 15 15 Inventory (Days) 27 27 28 28 27 27 27 26 Creditors (Days) 63 72 82 94 91 66 66 66 Working Capital (Days) -14 -22 -29 -39 -41 -23 -24 -24 Asset Turnover (x) 2.2 2.3 2.2 2.0 2.2 2.6 2.6 2.3 Fixed Asset Turnover
Leverage Ratio
Debt/Equity (x) 0.1 0.0 0.0 0.0 0.0 0.0 0.0 0.0
Cash Flow Statement (Consolidated)
(INR Million) Y/E December 2010 2011 2012 2013 2014 2015E 2016E 2017E Profit before Tax 4,177 6,602 5,997 6,706 9,926 16,284 29,374 38,903 Depreciation & Amort. 573 640 822 1,300 2,198 3,375 4,243 5,197 Direct Taxes Paid -831 -1,668 -1,077 -1,504 -2,810 -4,600 -8,245 -10,890 (Inc)/Dec in Working Capital 374 -234 391 1,491 2,020 -1,968 3,527 2,916 Interest/Div. Received 1,039 1,316 1,351 1,023 950 685 1,218 2,315 Other Items -933 -1,305 -1,308 -819 -1,809 5,541 -1,148 -2,087 CF from Oper. Activity 4,399 5,351 6,177 8,197 10,475 19,316 28,968 36,354 (Inc)/Dec in FA+CWIP -1,315 -4,173 -7,820 -7,054 -9,682 -8,932 -10,000 -11,250 Free Cash Flow 3,084 1,178 -1,644 1,143 793 10,385 18,968 25,104 (Pur)/Sale of Invest. -1,645 -540 -1,263 -1,879 -1,190 1,606 0 0 CF from Inv. Activity -2,960 -4,713 -9,083 -8,933 -10,872 -7,326 -10,000 -11,250 Issue of Shares 88 24 4 17 79 -2,996 -242 -264 Inc/(Dec) in Debt -307 -453 -43 610 -255 0 0 0 Interest Paid -118 -84 -40 -80 -98 -78 -78 -78 Dividends Paid -351 -609 -895 -1,020 -1,348 -1,268 -1,427 -1,585 CF from Fin. Activity -689 -1,122 -974 -474 -1,622 -4,343 -1,747 -1,928 Inc/(Dec) in Cash 750 -484 -3,880 -1,209 -2,020 7,648 17,221 23,177 Add: Beginning Balance 11,707 12,457 11,915 8,035 6,826 4,806 12,454 29,675 Closing Balance 12,457 11,973 8,035 6,826 4,806 12,454 29,675 52,852 E: MOSL Estimates
0 0 0 0 0 0 0

Thematic | Good-to-Great
September 2015 83
HDFC Bank CMP: INR996 TP: INR1,350 (+36%) Buy
Industry Attractiveness
Only 40% of the population has access to banking. Credit-to-GDP is lowest at ~52% v/s ~90% for emerging market average and ~100% for the developed market
The industry is expected to grow at 18%+ CAGR over the next five years; retail loans-to-GDP stands at just 15% and is a key growth driver.
The incumbent state-owned banks still have 75%+ MS in the industry. In this digital era, private banks will continue to gain market share with superior product and services.
Mr. Aditya Puri (MD since inception) is widely credited for the success of HDFC Bank, which has the highest market capitalization among private banks in India.
Under his leadership, the bank reported earnings and loan CAGR of 20%+ for ~80 consecutive quarters.
Most of the senior management has been with the bank since its inception in 1994; the board boasts of best-in-class corporate governance practices.
Disciplined Management
Since inception, average RoE has stood at 19.9% and EPS CAGR at 33%; considering overall growth of ~20%+ and RoE of 20%, we expect internal accruals to take care of the next 4-5 years of growth.
SA market share gains to continue, led by aggressive expansion in rural and competitive digital offerings.
Cost control and productivity gains to continue. Focus on core profitability would lead to 20%+ earnings CAGR over FY15-18E; RoA to remain healthy at 1.9-2%.
Expected Results
Built expertise in secured retail segment like Home and Auto to gain loan and profit MS—avoided risky/high-yielding segments like Infrastructure and Iron & Steel.
Building a strong retail liability franchise through aggressive branch network expansion and digital offerings to ensure stable cost of funds.
Focus on long-term shareholder value creation by maintaining best-in-class return ratios—internal accruals a key source of growth capital.
Disciplined Thought
Retail loans largely secured, form 50% of the book; exposure to sensitive sectors (<10%) is significantly lower than peers—net stressed loans remain at just 50bp.
Consistently maintained best-in-class CASA ratio of >40%—thrust on the Indian rural sector will continue to pay rewards.
Equity capital raised by HDFCB since inception forms ~40% of the net worth, lowest amongst peers—showcasing the bank’s strong accruals; despite sporadic capital infusions, the bank has maintained T1 ratio 300-400bp more than the regulatory requirements.
Disciplined Action

Thematic | Good-to-Great
September 2015 84
Exhibit 91: Focus remains on granular retail book—largely secured
Source: Company, MOSL
Exhibit 92: Share of retail deposits continues to improve, demonstrating power of strong liability franchise (Deposits mix %)
Source: Company, MOSL
Exhibit 93: Strong cost control; productivity gains continue
Source: Company, MOSL
Exhibit 94: Healthy core operating performance and low delinquencies to sustain RoA near the current levels
Source: Company, MOSL
Exhibit 95: Massive outperformance v/s Sensex….
Source: Company, MOSL
Exhibit 96: …and BSE100
Source: Company, MOSL
Auto Loans, 23.4
Personal Loans, 14.9
Loan against
securities, 0.8
Two wheeler,
2.4
Com. Vehle & const
equip, 7.4 Credit
Cards, 9.3
Business Bkg, 10.9
Home loans, 14.0
Gold loans, 2.3
Kissan gold cards, 9.4
Others, 5.1
24 30 30 30 30 28 28
20 22 22 18 18 17 16
45 38 37 42 45 50 51
11 10 11 9 7 5 5
FY09
FY10
FY11
FY12
FY13
FY14
FY15
Saving Dep. Current Dep.Retail term dep. Corp. term dep.
60 55 54 54 54 50 48
3.8 3.2 3.1 3.0 3.0
2.7 2.6
2009 2010 2011 2012 2013 2014 2015
C/I ratio (%) Opex to assets (%)
1.4 1.4 1.4 1.4 1.5 1.6 1.7 1.8 1.9 1.9 1.9 1.9 1.8
17.7 19.5
17.7 16.9 16.1 16.7 18.7
20.3 21.3
19.4 18.4 19.2 19.9
FY06
FY07
FY08
FY09
FY10
FY11
FY12
FY13
FY14
FY15
FY16
E
FY17
E
FY18
E
RoA RoE
900
392
0
250
500
750
1,000
Jan-
05Se
p-05
Apr-
06De
c-06
Jul-0
7M
ar-0
8O
ct-0
8Ju
n-09
Jan-
10Se
p-10
Apr-
11De
c-11
Jul-1
2M
ar-1
3O
ct-1
3M
ay-1
4Ja
n-15
Aug-
15
HDFC Bank Sensex-Rebased
900
388
0
250
500
750
1,000
Jan-
05Se
p-05
Apr-
06De
c-06
Jul-0
7M
ar-0
8O
ct-0
8Ju
n-09
Jan-
10Se
p-10
Apr-
11De
c-11
Jul-1
2M
ar-1
3O
ct-1
3M
ay-1
4Ja
n-15
Aug-
15
HDFC Bank BSE 100- Rebased

Thematic | Good-to-Great
September 2015 85
Financials and Valuations: HDFCB
Income Statement (INR Million) Y/E March 2010 2011 2012 2013 2014 2015 2016E 2017E 2018E Interest Income 164,679 203,808 278,742 350,649 411,355 484,699 595,995 704,552 863,899 Interest Expense 77,863 93,851 149,896 192,538 226,529 260,742 324,277 378,990 465,423 Net Interest Income 86,816 109,957 128,846 158,111 184,826 223,957 271,718 325,563 398,475 Change (%) 13.1 26.7 17.2 22.7 16.9 21.2 21.3 19.8 22.4 Non Interest Income 45,736 49,452 57,836 68,526 79,196 89,964 108,593 126,398 147,234 Net Income 132,553 159,409 186,682 226,637 264,023 313,920 380,311 451,960 545,709 Change (%) 16.5 20.3 17.1 21.4 16.5 18.9 21.1 18.8 20.7 Operating Expenses 64,757 77,800 92,776 112,361 120,422 139,875 172,469 204,653 246,952 Pre Provision Profits 67,795 81,609 93,906 114,276 143,601 174,045 207,843 247,307 298,757 Change (%) 25.0 20.4 15.1 21.7 25.7 21.2 19.4 19.0 20.8 Provisions (excl tax) 24,904 23,422 18,774 16,770 15,880 20,758 21,476 27,525 35,032 PBT 42,891 58,187 75,132 97,506 127,721 153,287 186,366 219,782 263,725 Tax 13,404 18,923 23,461 30,249 42,937 51,128 63,364 71,429 85,711 Tax Rate (%) 31.3 32.5 31.2 31.0 33.6 33.4 34.0 32.5 32.5 PAT 29,487 39,264 51,671 67,257 84,784 102,159 123,002 148,353 178,014 Change (%) 31.3 33.2 31.6 30.2 26.1 20.5 20.4 20.6 20.0 Equity Dividend (Incl tax) 6,414 8,948 11,749 15,360 19,275 24,142 28,659 34,566 41,477 Core PPP* 52,167 68,179 79,428 97,607 122,227 150,674 177,943 213,588 260,704 Change (%) 24.6 30.7 16.5 22.9 25.2 23.3 18.1 20.0 22.1 *Core PPP is (NII+Fee income-Opex)
Balance Sheet (INR Million) Y/E March 2010 2011 2012 2013 2014 2015 2016E 2017E 2018E Equity Share Capital 4,577 4,652 4,693 4,759 4,798 5,013 5,013 5,013 5,013 Reserves & Surplus 210,648 249,140 294,553 357,383 429,988 615,081 709,423 823,210 959,747 Net Worth 215,225 253,793 299,247 362,141 434,786 620,094 714,436 828,223 964,760 Deposits 1,674,044 2,085,864 2,467,064 2,962,470 3,673,375 4,507,956 5,499,707 6,819,636 8,456,349 Change (%) 17.2 24.6 18.3 20.1 24.0 22.7 22.0 24.0 24.0 of which CASA Dep 871,039 1,099,083 1,194,059 1,405,215 1,646,214 1,984,921 2,421,603 3,027,004 3,783,755 Change (%) 37.5 26.2 8.6 17.7 17.2 20.6 22.0 25.0 25.0 Borrowings 129,157 143,941 238,465 330,066 394,390 452,136 524,290 613,534 724,051 Other Liabilities & Prov. 206,159 289,929 374,319 348,642 413,444 324,845 405,668 506,844 633,314 Total Liabilities 2,224,586 2,773,526 3,379,095 4,003,319 4,915,995 5,905,031 7,144,101 8,768,237 10,778,474 Current Assets 299,424 296,688 209,377 272,802 395,836 363,315 433,880 513,773 617,645 Investments 586,076 709,294 974,829 1,116,136 1,209,511 1,664,599 1,914,289 2,297,147 2,756,577 Change (%) -0.4 21.0 37.4 14.5 8.4 37.6 15.0 20.0 20.0 Loans 1,258,306 1,599,827 1,954,200 2,397,206 3,030,003 3,654,950 4,532,138 5,665,173 7,081,466 Change (%) 27.3 27.1 22.2 22.7 26.4 20.6 24.0 25.0 25.0 Fixed Assets 21,228 21,706 23,472 27,031 29,399 31,217 34,654 40,091 45,528 Other Assets 59,551 146,011 217,216 190,144 251,246 190,949 229,139 252,053 277,258 Total Assets 2,224,586 2,773,526 3,379,095 4,003,319 4,915,995 5,905,031 7,144,101 8,768,237 10,778,474 Asset Quality (%) Y/E March 2010 2011 2012 2013 2014 2015 2016E 2017E 2018E GNPA (INR m) 18,168 16,943 19,994 23,346 29,893 34,384 43,263 61,840 90,584 NNPA (INR m) 3,921 2,964 3,523 4,690 8,200 8,963 12,374 20,458 32,335 GNPA Ratio 1.4 1.0 1.0 1.0 1.0 0.9 0.9 1.1 1.3 NNPA Ratio 0.3 0.2 0.2 0.2 0.3 0.2 0.3 0.4 0.5 PCR (Excl Tech. write off) 78.4 82.5 82.4 79.9 72.6 73.9 71.4 66.9 64.3

Thematic | Good-to-Great
September 2015 86
Financials and Valuations: HDFCB
Ratios Y/E March 2010 2011 2012 2013 2014 2015 2016E 2017E 2018E
Spreads Analysis (%) Avg. Yield-Earning Assets 9.1 9.4 10.4 10.6 10.3 9.9 9.9 9.5 9.5 Avg. Yield on loans 11.0 10.9 11.9 12.3 11.7 11.1 10.9 10.4 10.2 Avg. Yield on Invt 6.8 7.2 7.7 7.5 7.8 7.4 7.5 7.4 7.4 Avg. Cost-Int. Bear. Liab. 4.7 4.7 6.1 6.4 6.2 5.8 5.9 5.6 5.6 Avg. Cost of Deposits 4.5 4.3 5.6 6.0 5.7 5.7 5.9 5.6 5.6 Interest Spread 4.4 4.7 4.4 4.2 4.1 4.1 4.0 3.9 3.9 Net Interest Margin 4.8 5.1 4.8 4.8 4.6 4.6 4.5 4.4 4.4
Profitability Ratios (%) RoE 16.1 16.7 18.7 20.3 21.3 19.4 18.4 19.2 19.9 RoA 1.5 1.6 1.7 1.8 1.9 1.9 1.9 1.9 1.8 Int. Expense/Int.Income 47.3 46.0 53.8 54.9 55.1 53.8 54.4 53.8 53.9 Fee Income/Net Income 27.4 27.5 29.3 27.3 27.2 24.5 24.1 23.9 23.4 Non Int. Inc./Net Income 34.5 31.0 31.0 30.2 30.0 28.7 28.6 28.0 27.0
Efficiency Ratios (%) Cost/Income* 50.2 48.6 49.2 49.9 45.8 47.0 47.8 47.7 47.6 Empl. Cost/Op. Exps. 35.4 36.5 36.6 35.3 34.7 34.0 33.1 33.4 33.8 Busi. per Empl. (INR m) 51.2 61.5 66.5 72.4 87.9 102.7 116.5 138.8 166.6 NP per Empl. (INR lac) 0.6 0.7 0.8 1.0 1.2 1.4 1.6 1.8 2.1 * ex treasury
Asset-Liability Profile (%) Loans/Deposit 75.2 76.7 79.2 80.9 82.5 81.1 82.4 83.1 83.7 CASA Ratio 52.0 52.7 48.4 47.4 44.8 44.0 44.0 44.4 44.7 Investment/Deposit 35.0 34.0 39.5 37.7 32.9 36.9 34.8 33.7 32.6 CAR 17.4 16.2 16.5 16.8 16.1 16.8 15.6 14.4 13.3 Tier 1 13.3 12.2 11.6 11.1 11.8 13.7 13.0 12.2 11.4 Valuation
Book Value (INR) 94.0 109.1 127 152 181 247 285 330 385 Change (%) 32.9 16.0 16.8 19.4 19.2 36.5 15.2 15.9 16.5 Price-BV (x) 10.6 9.1 7.8 6.5 5.5 4.0 3.5 3.0 2.6
Adjusted BV (INR) 92.8 108.2 126.4 150.7 178.9 244.9 281.6 324.7 375.9 Price-ABV (x) 10.7 9.2 7.9 6.6 5.6 4.1 3.5 3.1 2.6
EPS (INR) 12.9 16.9 22.0 28.3 35.3 40.8 49.1 59.2 71.0 Change (%) 22.1 31.0 30.4 28.4 25.0 15.3 20.4 20.6 20.0 Price-Earnings (x) 59.0 45.2 35.2 28.2 24.4 20.3 16.8 14.0
Dividend Per Sh (INR) 2.4 3.3 4.3 5.5 6.9 8.0 9.8 11.8 14.2 Dividend Yield (%) 0.3 0.4 0.6 0.7 0.8 1.0 1.2 1.4 E: MOSL Estimates

Motilal Oswal India Strategy Gallery
Thematic | Good-to-Great
September 2015 88
Disclosures This document has been prepared by Motilal Oswal Securities Limited (hereinafter referred to as Most) to provide information about the company(ies) and/sector(s), if any, covered in the report and may be distributed by it and/or its affiliated company(ies). This report is for personal information of the selected recipient/s and does not construe to be any investment, legal or taxation advice to you. This research report does not constitute an offer, invitation or inducement to invest in securities or other investments and Motilal Oswal Securities Limited (hereinafter referred as MOSt) is not soliciting any action based upon it. This report is not for public distribution and has been furnished to you solely for your general information and should not be reproduced or redistributed to any other person in any form. This report does not constitute a personal recommendation or take into account the particular investment objectives, financial situations, or needs of individual clients. Before acting on any advice or recommendation in this material, investors should consider whether it is suitable for their particular circumstances and, if necessary, seek professional advice. The price and value of the investments referred to in this material and the income from them may go down as well as up, and investors may realize losses on any investments. Past performance is not a guide for future performance, future returns are not guaranteed and a loss of original capital may occur.
MOSt and its affiliates are a full-service, integrated investment banking, investment management, brokerage and financing group. We and our affiliates have investment banking and other business relationships with a some companies covered by our Research Department. Our research professionals may provide input into our investment banking and other business selection processes. Investors should assume that MOSt and/or its affiliates are seeking or will seek investment banking or other business from the company or companies that are the subject of this material and that the research professionals who were involved in preparing this material may educate investors on investments in such business. The research professionals responsible for the preparation of this document may interact with trading desk personnel, sales personnel and other parties for the purpose of gathering, applying and interpreting information. Our research professionals are paid on the profitability of MOSt which may include earnings from investment banking and other business.
MOSt generally prohibits its analysts, persons reporting to analysts, and members of their households from maintaining a financial interest in the securities or derivatives of any companies that the analysts cover. Additionally, MOSt generally prohibits its analysts and persons reporting to analysts from serving as an officer, director, or advisory board member of any companies that the analysts cover. Our salespeople, traders, and other professionals or affiliates may provide oral or written market commentary or trading strategies to our clients that reflect opinions that are contrary to the opinions expressed herein, and our proprietary trading and investing businesses may make investment decisions that are inconsistent with the recommendations expressed herein. In reviewing these materials, you should be aware that any or all of the foregoing among other things, may give rise to real or potential conflicts of interest. MOSt and its affiliated company(ies), their directors and employees and their relatives may; (a) from time to time, have a long or short position in, act as principal in, and buy or sell the securities or derivatives thereof of companies mentioned herein. (b) be engaged in any other transaction involving such securities and earn brokerage or other compensation or act as a market maker in the financial instruments of the company(ies) discussed herein or act as an advisor or lender/borrower to such company(ies) or may have any other potential conflict of interests with respect to any recommendation and other related information and opinions.; however the same shall have no bearing whatsoever on the specific recommendations made by the analyst(s), as the recommendations made by the analyst(s) are completely independent of the views of the affiliates of MOSt even though there might exist an inherent conflict of interest in some of the stocks mentioned in the research report Reports based on technical and derivative analysis center on studying charts company's price movement, outstanding positions and trading volume, as opposed to focusing on a company's fundamentals and, as such, may not match with a report on a company's fundamental analysis. In addition MOST has different business segments / Divisions with independent research separated by Chinese walls catering to different set of customers having various objectives, risk profiles, investment horizon, etc, and therefore may at times have different contrary views on stocks sectors and markets.
Unauthorized disclosure, use, dissemination or copying (either whole or partial) of this information, is prohibited. The person accessing this information specifically agrees to exempt MOSt or any of its affiliates or employees from, any and all responsibility/liability arising from such misuse and agrees not to hold MOSt or any of its affiliates or employees responsible for any such misuse and further agrees to hold MOSt or any of its affiliates or employees free and harmless from all losses, costs, damages, expenses that may be suffered by the person accessing this information due to any errors and delays. The information contained herein is based on publicly available data or other sources believed to be reliable. Any statements contained in this report attributed to a third party represent MOSt’s interpretation of the data, information and/or opinions provided by that third party either publicly or through a subscription service, and such use and interpretation have not been reviewed by the third party. This Report is not intended to be a complete statement or summary of the securities, markets or developments referred to in the document. While we would endeavor to update the information herein on reasonable basis, MOSt and/or its affiliates are under no obligation to update the information. Also there may be regulatory, compliance, or other reasons that may prevent MOSt and/or its affiliates from doing so. MOSt or any of its affiliates or employees shall not be in any way responsible and liable for any loss or damage that may arise to any person from any inadvertent error in the information contained in this report. MOSt or any of its affiliates or employees do not provide, at any time, any express or implied warranty of any kind, regarding any matter pertaining to this report, including without limitation the implied warranties of merchantability, fitness for a particular purpose, and non-infringement. The recipients of this report should rely on their own investigations.
This report is intended for distribution to institutional investors. Recipients who are not institutional investors should seek advice of their independent financial advisor prior to taking any investment decision based on this report or for any necessary explanation of its contents.
Most and it’s associates may have managed or co-managed public offering of securities, may have received compensation for investment banking or merchant banking or brokerage services, may have received any compensation for products or services other than investment banking or merchant banking or brokerage services from the subject company in the past 12 months. Most and it’s associates have not received any compensation or other benefits from the subject company or third party in connection with the research report. Subject Company may have been a client of Most or its associates during twelve months preceding the date of distribution of the research report
MOSt and/or its affiliates and/or employees may have interests/positions, financial or otherwise of over 1 % at the end of the month immediately preceding the date of publication of the research in the securities mentioned in this report. To enhance transparency, MOSt has incorporated a Disclosure of Interest Statement in this document. This should, however, not be treated as endorsement of the views expressed in the report.
Motilal Oswal Securities Limited is registered as a Research Analyst under SEBI (Research Analyst) Regulations, 2014. SEBI Reg. No. INH000000412
There are no material disciplinary action that been taken by any regulatory authority impacting equity research analysis activities
Analyst Certification The views expressed in this research report accurately reflect the personal views of the analyst(s) about the subject securities or issues, and no part of the compensation of the research analyst(s) was, is, or will be directly or indirectly related to the specific recommendations and views expressed by research analyst(s) in this report. The research analysts, strategists, or research associates principally responsible for preparation of MOSt research receive compensation based upon various factors, including quality of research, investor client feedback, stock picking, competitive factors and firm revenues
Disclosure of Interest Statement Companies where there is interest Analyst ownership of the stock No Served as an officer, director or employee No
A graph of daily closing prices of securities is available at www.nseindia.com and http://economictimes.indiatimes.com/markets/stocks/stock-quotes
Regional Disclosures (outside India) This report is not directed or intended for distribution to or use by any person or entity resident in a state, country or any jurisdiction, where such distribution, publication, availability or use would be contrary to law, regulation or which would subject MOSt & its group companies to registration or licensing requirements within such jurisdictions.
For U.S. Motilal Oswal Securities Limited (MOSL) is not a registered broker - dealer under the U.S. Securities Exchange Act of 1934, as amended (the"1934 act") and under applicable state laws in the United States. In addition MOSL is not a registered investment adviser under the U.S. Investment Advisers Act of 1940, as amended (the "Advisers Act" and together with the 1934 Act, the "Acts), and under applicable state laws in the United States. Accordingly, in the absence of specific exemption under the Acts, any brokerage and investment services provided by MOSL, including the products and services described herein are not available to or intended for U.S. persons.
This report is intended for distribution only to "Major Institutional Investors" as defined by Rule 15a-6(b)(4) of the Exchange Act and interpretations thereof by SEC (henceforth referred to as "major institutional investors"). This document must not be acted on or relied on by persons who are not major institutional investors. Any investment or investment activity to which this document relates is only available to major institutional investors and will be engaged in only with major institutional investors. In reliance on the exemption from registration provided by Rule 15a-6 of the U.S. Securities Exchange Act of 1934, as amended (the "Exchange Act") and interpretations thereof by the U.S. Securities and Exchange Commission ("SEC") in order to conduct business with Institutional Investors based in the U.S., MOSL has entered into a chaperoning agreement with a U.S. registered broker-dealer, Motilal Oswal Securities International Private Limited. ("MOSIPL"). Any business interaction pursuant to this report will have to be executed within the provisions of this chaperoning agreement.
The Research Analysts contributing to the report may not be registered /qualified as research analyst with FINRA. Such research analyst may not be associated persons of the U.S. registered broker-dealer, MOSIPL, and therefore, may not be subject to NASD rule 2711 and NYSE Rule 472 restrictions on communication with a subject company, public appearances and trading securities held by a research analyst account.
For Singapore Motilal Oswal Capital Markets Singapore Pte Limited is acting as an exempt financial advisor under section 23(1)(f) of the Financial Advisers Act(FAA) read with regulation 17(1)(d) of the Financial Advisors Regulations and is a subsidiary of Motilal Oswal Securities Limited in India. This research is distributed in Singapore by Motilal Oswal Capital Markets Singapore Pte Limited and it is only directed in Singapore to accredited investors, as defined in the Financial Advisers Regulations and the Securities and Futures Act (Chapter 289), as amended from time to time. In respect of any matter arising from or in connection with the research you could contact the following representatives of Motilal Oswal Capital Markets Singapore Pte Limited: Kadambari Balachandran Email : [email protected] Contact : (+65) 68189233 / 65249115 Office Address : 21 (Suite 31),16 Collyer Quay,Singapore 04931
Motilal Oswal Securities Ltd
Motilal Oswal Tower, Level 9, Sayani Road, Prabhadevi, Mumbai 400 025 Phone: +91 22 3982 5500 E-mail: [email protected]