GOOD JOBS THAT PAY WITHOUT A BA · PDF filethe members of the technical review...
136
A STATE-BY-STATE ANALYSIS A STATE-BY-STATE ANALYSIS GOOD JOBS THAT PAY WITHOUT A BA GOOD JOBS THAT PAY WITHOUT A BA By Anthony P. Carnevale, Jeff Strohl, and Neil Ridley 2017 SOLD SOLD
Transcript of GOOD JOBS THAT PAY WITHOUT A BA · PDF filethe members of the technical review...

linkedin.com/company/GeorgetownCEW
twitter.com/GeorgetownCEW
facebook.com/GeorgetownCEW
Good Jobs That Pay without a BA: A State-by-State Analysis can be accessed online at GoodJobsData.org.
The Georgetown University Center on Education and the Workforce3300 Whitehaven St. NW, Suite 3200Washington, D.C. 20007cew.georgetown.edu
A STATE-BY-STATE ANALYSISA STATE-BY-STATE ANALYSIS
GOOD JOBS THAT PAY WITHOUT A BA
GOOD JOBS THAT PAY WITHOUT A BA
By Anthony P. Carnevale, Je Strohl, and Neil Ridley
2017
SOLD
SOLD


Acknowledgements
We are grateful to JPMorgan Chase & Co. for the generous support which made this report possible, particularly
to Chauncy Lennon, Sarah Steinberg, and Whitney Smith who contributed their insights and feedback as the
report was developed.
Many experts contributed their thoughts and feedback to the Good Jobs Project. We offer special thanks to
the members of the technical review panel—David Autor, Harry Holzer, Alicia Sasser Modestino, and Jonathan
Rothwell—all of whom provided helpful comments on the methodology and research direction as the Center
began the Good Jobs Project.
The staff of the Georgetown University Center on Education and the Workforce was instrumental in the
production of this report from conception to publication. In particular, we would like to thank:
• Andrea Porter for strategic guidance
• Ban Cheah for project conceptualization, and data programming and analysis
• Nicole Smith for economic methodology
• Artem Gulish and Meagan Siu for data analysis
• Martin Van Der Werf, Tanya I. Garcia, and Andrew Hanson for editorial and qualitative feedback
• Hilary Strahota, Vikki Hartt Salinkas, Wendy Chang, and Precious Stephens-Ihedigbo for communications
efforts, including design development and public relations
• Joe Leonard and Coral Castro for assistance with logistics and operations
Many others contributed their thoughts and feedback throughout the production of this report. We are especially
grateful to our talented designers, editorial advisors, and printers, whose efforts were vital to our success.
The views expressed in this publication are those of the authors and do not necessarily represent those
of JPMorgan Chase & Co. or any of its officers or employees. All errors, omissions, and views remain the
responsibility of the authors.
Reprint PermissionThe Georgetown University Center on Education and the
Workforce carries a Creative Commons license, which permits
non-commercial re-use of any of our content when proper
attribution is provided.
You are free to copy, display, and distribute our work, or
include our content in derivative works, under the CEW’s
following conditions:
Attribution: You must clearly attribute the work
to the Center on Education and the Workforce
and provide a print or digital copy of the work to
Our preference is to cite figures and tables as
follows: Source: Georgetown University Center on
Education and the Workforce, Good Jobs That Pay
without a BA: A State-by-State Analysis, 2017.
Noncommercial: You may not use this work for
commercial purposes. Written permission must be
obtained from the owners of the copy/literary rights
and from Georgetown University for any publication
or commercial use of reproductions.
Approval: If you are using one or more of our
available data representations (figures, charts,
tables, etc), please visit our website at cew.
georgetown.edu/publications/reprint-permission
for more information.
For the full legal code of this Creative Commons
license, please visit creativecommons.org.
Should you need a form to be filled out by us, please email
[email protected] and we will respond in a
timely manner.

About The Good Jobs Project
The Georgetown University Center on Education and the Workforce has launched the Good Jobs Project website, which shows the concentration of good jobs for non-BA workers both nationally and by state. The interactive website details the level of economic opportunity for workers without BAs across the country. The project also focuses on the share of good jobs by industry and occupation. Visit GoodJobsData.org to explore.

Table of Contents
1 Introduction
3 PART 1. The Shift of Good Jobs for Workers without BAs from Blue-Collar to Skilled-Services Industries
3 Most states gained good jobs for workers without BAs, but states that were
hit the hardest by the decline of manufacturing suffered the most dramatic
losses of good jobs.
5 The shift from traditional blue-collar industries to skilled-services industries
has played out in different ways in the states.
7 Good jobs for workers without BAs are increasingly concentrated in skilled-
services industries rather than traditional blue-collar industries.
7 The decline in manufacturing was pervasive, but good jobs in other blue-
collar industries expanded in most states.
10 PART 2. Good Jobs Require More Education.
10 High school graduates’ share of good jobs has declined in nearly every
state, while associate’s degree holders’ share of good jobs has increased.
12 PART 3. Where Are the Good Jobs Today?
12 States differ in the size and importance of the non-BA job market.
12 Good jobs that pay without a BA are concentrated in the most populous
states, but some small states have a higher share of good jobs.
16 PART 4. State-by-State Analysis
20 State Profiles
125 References
126 APPENDIX. Data Sources and Methodology
A State-by-State Analysis | Good Jobs That Pay without a BA VII
Figures and Tables
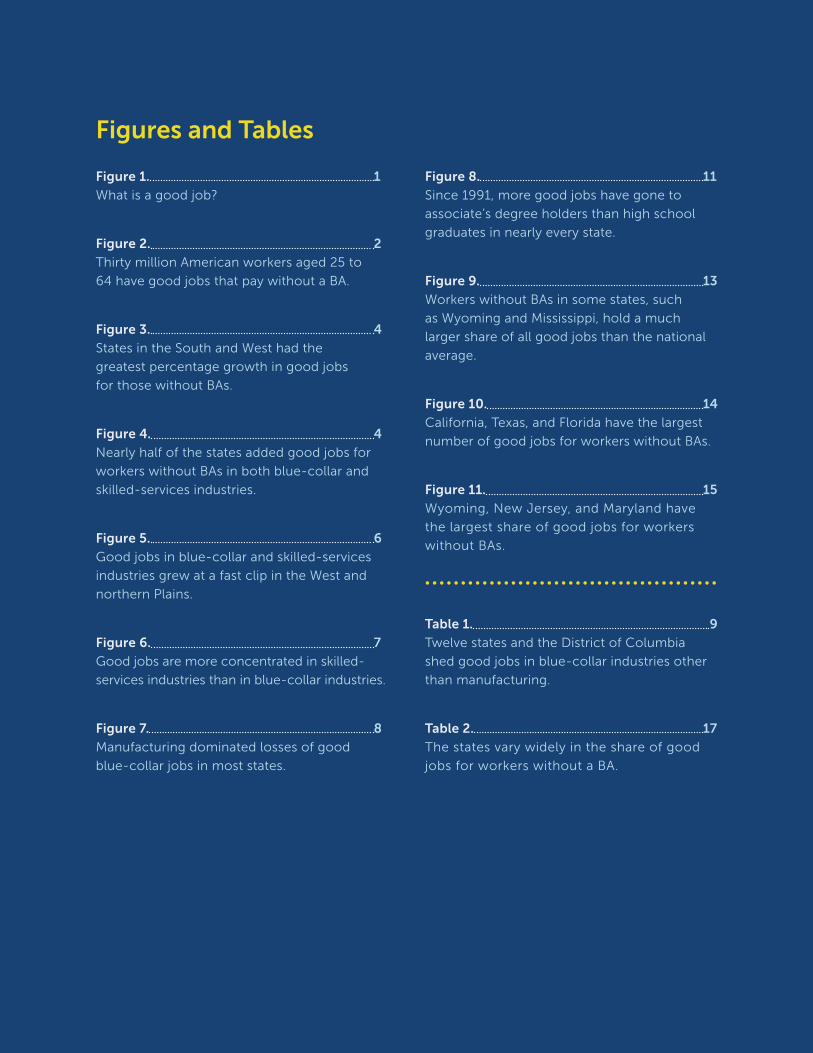
Figure 1. 1
What is a good job?
Figure 2. 2
Thirty million American workers aged 25 to
64 have good jobs that pay without a BA.
Figure 3. 4
States in the South and West had the
greatest percentage growth in good jobs
for those without BAs.
Figure 4. 4
Nearly half of the states added good jobs for
workers without BAs in both blue-collar and
skilled-services industries.
Figure 5. 6
Good jobs in blue-collar and skilled-services
industries grew at a fast clip in the West and
northern Plains.
Figure 6. 7
Good jobs are more concentrated in skilled-
services industries than in blue-collar industries.
Figure 7. 8
Manufacturing dominated losses of good
blue-collar jobs in most states.
Figure 8. 11
Since 1991, more good jobs have gone to
associate’s degree holders than high school
graduates in nearly every state.
Figure 9. 13
Workers without BAs in some states, such
as Wyoming and Mississippi, hold a much
larger share of all good jobs than the national
average.
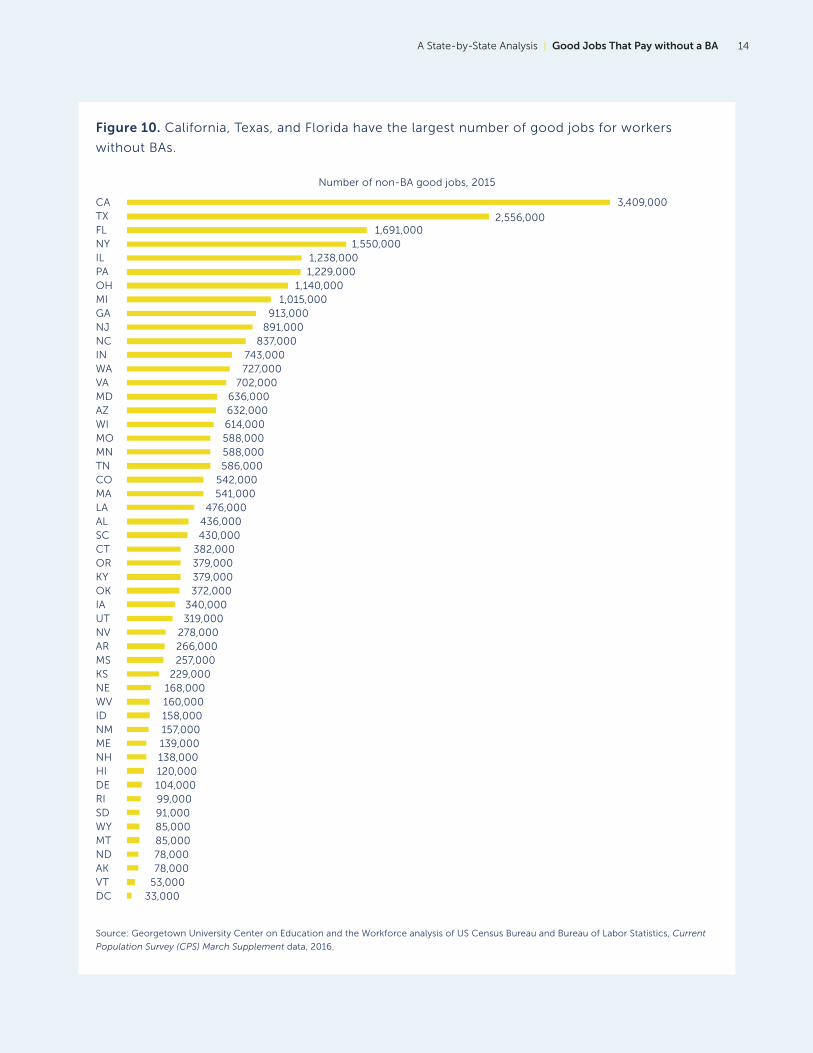
Figure 10. 14
California, Texas, and Florida have the largest
number of good jobs for workers without BAs.
Figure 11. 15
Wyoming, New Jersey, and Maryland have
the largest share of good jobs for workers
without BAs.
Table 1. 9
Twelve states and the District of Columbia
shed good jobs in blue-collar industries other
than manufacturing.
Table 2. 17
The states vary widely in the share of good
jobs for workers without a BA.
. . . . . . . . . . . . . . . . . . . . . . . . . . . . . . . . . . . . . . . . .

Good Jobs That Pay without a BA | A State-by-State Analysis1
Figure 1. What is a good job?
In defining a good job, we have chosen $35,000 ($17 per hour for a full-time job) as the minimum earnings for those under age 45 and $45,000 ($22 per hour for a full-time job) for workers age 45 and older.
$35,000 $55,000
In 2015, these good jobs had median earnings of $55,000 per year.
Source: Carnevale et al., Good Jobs That Pay without a BA, 2017.
Introduction
The reported death of the middle economy is greatly exaggerated. There are 30 million
good jobs in the United States today that pay without a BA (bachelor’s degree). These good
jobs have median earnings of $55,000 annually (Figure 1). Traditionally, many people with
good jobs that pay without a BA have worked in manufacturing. Those jobs are declining
while the number of good jobs in skilled-services industries, such as health services and
financial services, is increasing.
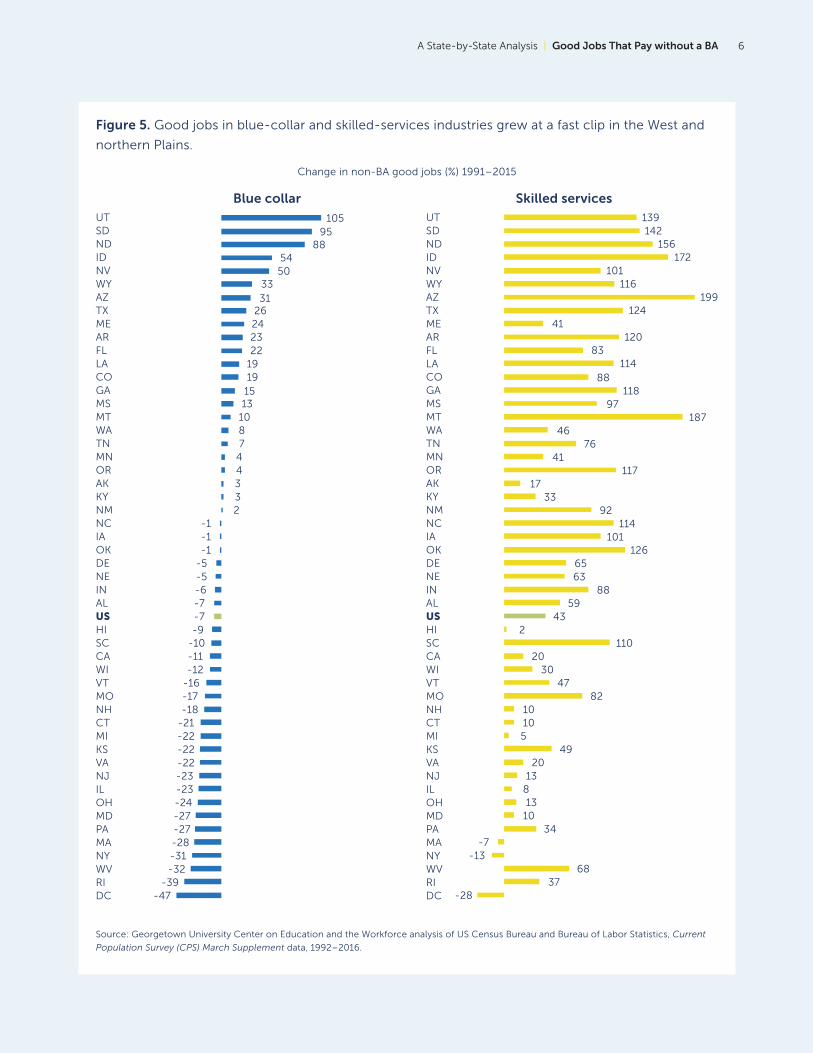
These trends vary across states. Twenty-three states gained good blue-collar jobs from 1991
to 2015. For instance, Utah had a 105 percent increase in good blue-collar jobs, and Nevada
had a 50 percent increase. However, many Northeast and Midwest states saw steep declines:
Rhode Island lost 39 percent of its good blue-collar jobs for workers without BAs during this
period. New York saw a 31 percent decline in these jobs, and Pennsylvania saw a 27 percent
decline. Good jobs in skilled-services industries increased in most states, growing by almost
200 percent in Arizona and 124 percent in Texas.
Education matters. More and more, good jobs are going to workers with bachelor’s degrees,
who now hold 55 percent of all good jobs. For workers without BAs, associate’s degrees
have become increasingly important for finding a good job. More associate’s degree holders
are getting good jobs, while the number of these jobs held by workers with a high school
diploma or less is in decline. This is especially true in Midwest states like Minnesota and Iowa.
A State-by-State Analysis | Good Jobs That Pay without a BA 2
Overall:
• Even with the job losses in manufacturing, blue-collar jobs rose in 23 states because
of growth in construction and blue-collar industries other than manufacturing. These
states—mostly in the South, West, and northern Plains—saw increases in good jobs for
workers without BAs in both blue-collar industries and skilled-services industries.
• Even as good jobs are going to workers with postsecondary education and training at
higher rates, some states have economies that continue to rely on workers with a high
school education. Delaware and West Virginia have the greatest percentage of good jobs
held by workers with a high school diploma or less.
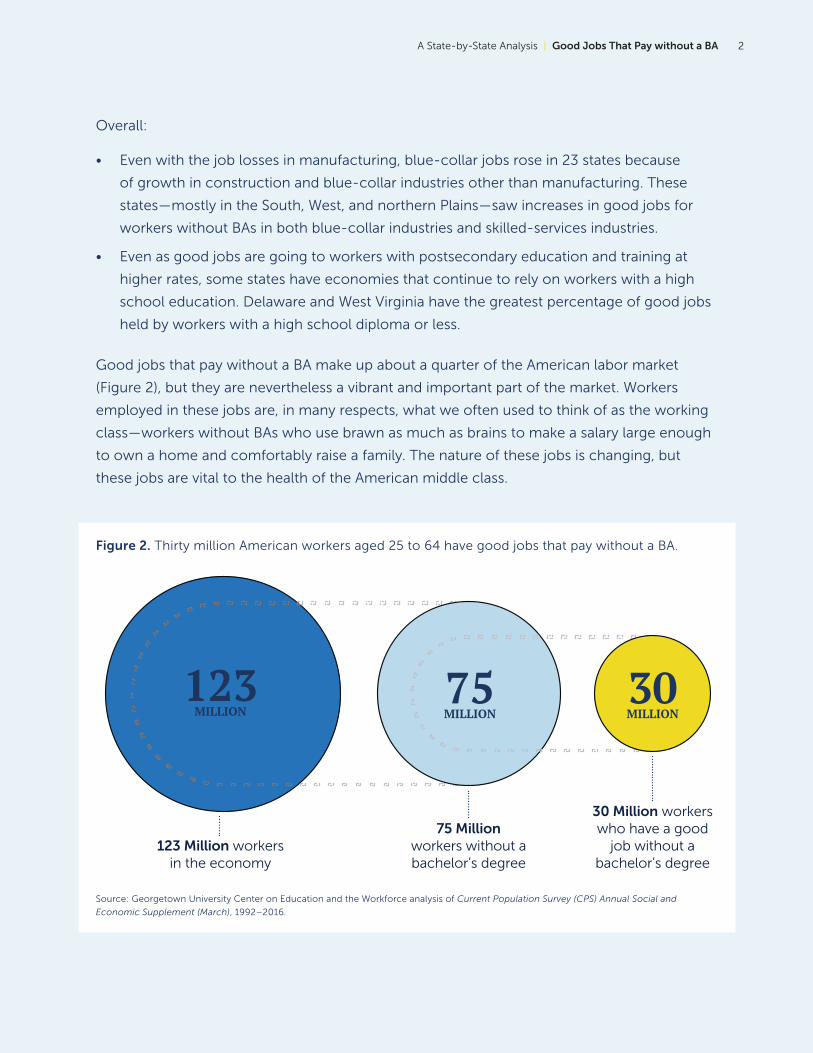
Good jobs that pay without a BA make up about a quarter of the American labor market
(Figure 2), but they are nevertheless a vibrant and important part of the market. Workers
employed in these jobs are, in many respects, what we often used to think of as the working
class—workers without BAs who use brawn as much as brains to make a salary large enough
to own a home and comfortably raise a family. The nature of these jobs is changing, but
these jobs are vital to the health of the American middle class.
Figure 2. Thirty million American workers aged 25 to 64 have good jobs that pay without a BA.
Source: Georgetown University Center on Education and the Workforce analysis of Current Population Survey (CPS) Annual Social and
Economic Supplement (March), 1992–2016.
30 MILLION
75 MILLION
123 MILLION
123 Million workers in the economy
75 Million workers without a bachelor’s degree
30 Million workers who have a good
job without a bachelor’s degree

Good Jobs That Pay without a BA | A State-by-State Analysis3
Part 1. The Shift of Good Jobs for
Workers without BAs from Blue-Collar to
Skilled-Services Industries
Most states gained good jobs for workers without BAs, but states that were hit the hardest by the decline of manufacturing suffered the most dramatic losses of good jobs.
As the American workforce has grown over the last three decades, workers with BAs have
gained far more good jobs than workers without BAs, especially since the end of the
Great Recession in 2009. Good jobs for workers without BAs grew slowly between 1991
and 2015, rising from 27 million to 30 million. Overall, the share of good jobs for workers
without BAs declined from about 60 percent of workers in 1991 to 45 percent in 2015.
The slow national growth rate masks the uneven spread of good jobs for workers without
BAs across the country.
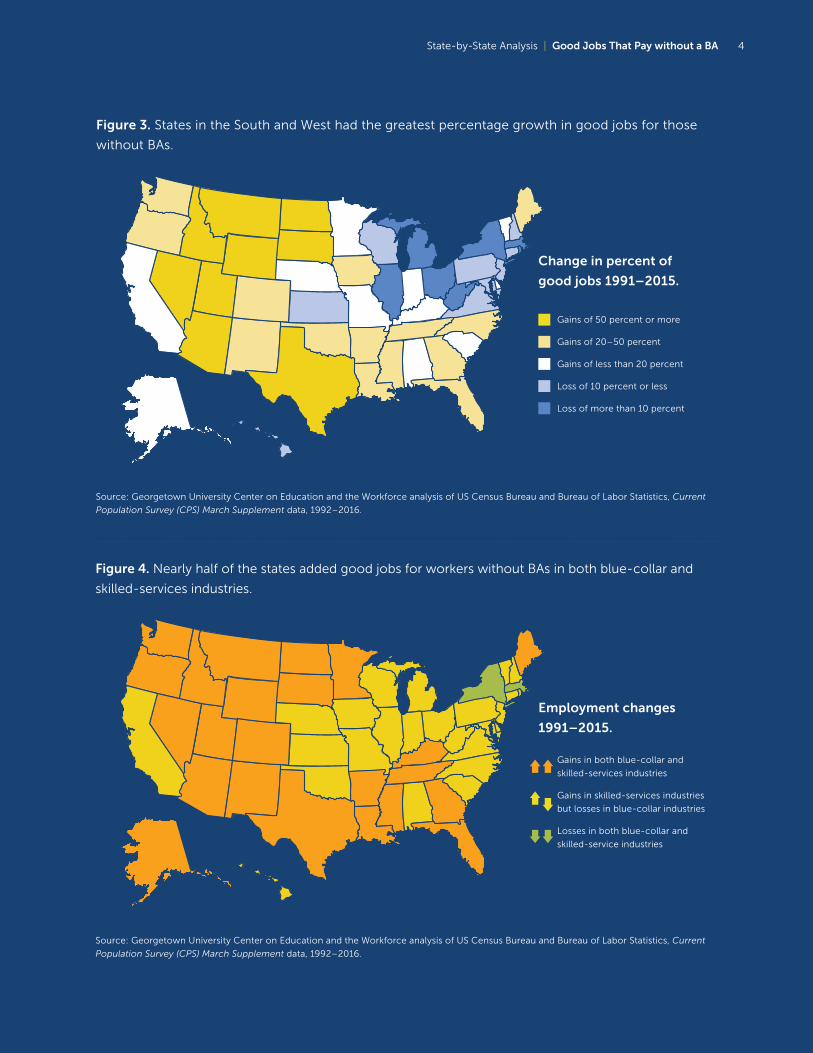
• Thirty-four states—mostly in the South and the West—added good jobs for workers
without BAs between 1991 and 2015 (Figure 3). Many Sunbelt states, such as Texas and
Arizona, experienced strong good job growth in skilled-services industries and did not
lose large numbers of good blue-collar jobs. Some states in the northern Plains, such
as North Dakota and Montana, had large gains in good jobs, both in the blue-collar and
skilled-services industries.
• Sixteen states plus the District of Columbia have fewer good jobs for workers without BAs
now than they had in 1991. These states, primarily in the Northeast and Midwest, were hit
hard by manufacturing declines.
A State-by-State Analysis | Good Jobs That Pay without a BA 4
Figure 3. States in the South and West had the greatest percentage growth in good jobs for those
without BAs.
Figure 4. Nearly half of the states added good jobs for workers without BAs in both blue-collar and
skilled-services industries.
Source: Georgetown University Center on Education and the Workforce analysis of US Census Bureau and Bureau of Labor Statistics, Current
Population Survey (CPS) March Supplement data, 1992–2016.
Source: Georgetown University Center on Education and the Workforce analysis of US Census Bureau and Bureau of Labor Statistics, Current
Population Survey (CPS) March Supplement data, 1992–2016.
Gains of 50 percent or more
Gains of 20–50 percent
Gains of less than 20 percent
Loss of 10 percent or less
Loss of more than 10 percent
Change in percent of
good jobs 1991–2015.
Gains in both blue-collar and
skilled-services industries
Gains in skilled-services industries
but losses in blue-collar industries
Losses in both blue-collar and
skilled-service industries
Employment changes
1991–2015.
State-by-State Analysis | Good Jobs That Pay without a BA 4

Good Jobs That Pay without a BA | A State-by-State Analysis5
The shift from traditional blue-collar industries to skilled-services industries has played out in different ways in the states.
Nationally, blue-collar jobs have been in decline. About 2.5 million jobs for workers without
BAs in manufacturing, the largest blue-collar industry, have been lost since 1991. Increasingly,
however, they have been replaced by skilled-services jobs in areas such as financial services.
The labor market has added 4 million good jobs in skilled-services since 1991. Half of the states
experienced the national trend of declining good jobs in blue-collar industries and growing
good jobs in skilled-services industries (Figure 4). These states—mostly in the Midwest, upper
South, and Northeast—lost good jobs in blue-collar industries when factories and mines were
shut down permanently. States with the most significant blue-collar losses were New York,
Pennsylvania, California, Ohio, and Illinois. California in particular was a state in which large
blue-collar job losses resulted in weak overall growth of good jobs for workers without BAs.
However, 23 states added good jobs for workers without BAs in both blue-collar and
skilled-services industries. These states—mostly in the South, the West, and the northern
Plains—experienced substantial employment gains between 1991 and 2015. Only two states
(Massachusetts and New York) and the District of Columbia shed good jobs in both blue-
collar and skilled-services industries.
There is considerable variation among states in the rates of growth or decline in good jobs
that pay without a BA in both blue-collar and skilled-services industries. Between 1991 and
2015, the growth of good jobs in blue-collar industries was strongest in the Western states and
weakest in the Northeast (Figure 5). The number of good blue-collar jobs more than doubled
in Utah and nearly doubled in North Dakota and South Dakota. But good blue-collar jobs
declined by nearly 40 percent in Rhode Island and by about 30 percent in West Virginia, New
York, and Massachusetts.
States in the West and northern Plains experienced the largest gains in skilled-services good
jobs, with especially strong growth in Arizona, Montana, Idaho, and North Dakota. Other
states, primarily in the Northeast and Midwest, experienced much slower growth in skilled-
services employment than the national average.
A State-by-State Analysis | Good Jobs That Pay without a BA 6
Figure 5. Good jobs in blue-collar and skilled-services industries grew at a fast clip in the West and
northern Plains.
Source: Georgetown University Center on Education and the Workforce analysis of US Census Bureau and Bureau of Labor Statistics, Current
Population Survey (CPS) March Supplement data, 1992–2016.
Change in non-BA good jobs (%) 1991–2015
Skilled servicesUTSDNDIDNVWYAZTXMEARFLLACOGAMSMTWATNMNORAKKYNMNCIAOKDENEINALUSHISCCAWIVTMONHCTMIKSVANJILOHMDPAMANYWVRIDC -28
2
20
33
-7
63
10
76
68
59
5
117
10
126
47
187
8
114
20
118
37
43
49
17
34
65
82
46
-13
88
10
41
13
101
30
97
13
92
110
88114
124
120
116
172
142
83
199
41
101
156
139
Blue collarUTSDNDIDNVWYAZTXMEARFLLACOGAMSMTWATNMNORAKKYNMNCIAOKDENEINALUSHISCCAWIVTMONHCTMIKSVANJILOHMDPAMANYWVRIDC -47
-9
-22
3
-28
-5
-18
7
-32
-7
-22
4
-27
-1
-16
10
-23
-1
-11
15
-39
-7
-22
3
-27
-5
-17
8
-31
-6
-21
4
-24
-1
-12
13
-23
2
-10
1919
26
23
33
54
95
22
31
24
50
88
105
Good Jobs That Pay without a BA | A State-by-State Analysis7
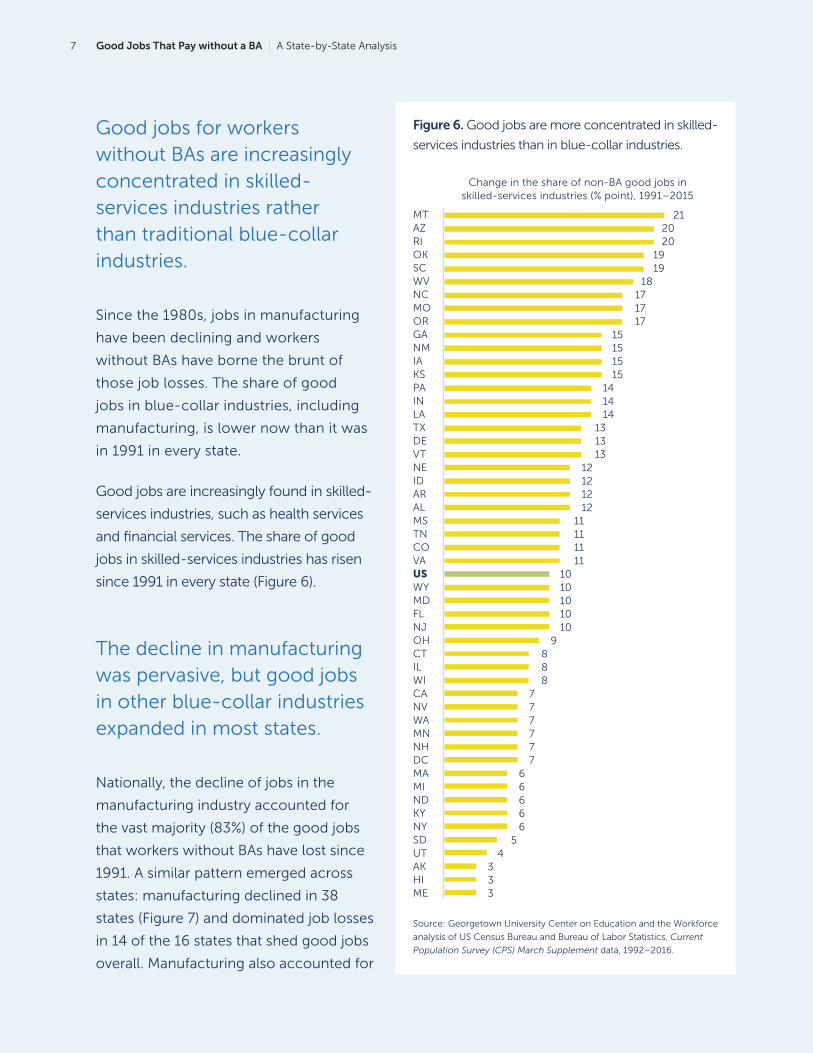
Good jobs for workers without BAs are increasingly concentrated in skilled-services industries rather than traditional blue-collar industries.
Since the 1980s, jobs in manufacturing
have been declining and workers
without BAs have borne the brunt of
those job losses. The share of good
jobs in blue-collar industries, including
manufacturing, is lower now than it was
in 1991 in every state.
Good jobs are increasingly found in skilled-
services industries, such as health services
and financial services. The share of good
jobs in skilled-services industries has risen
since 1991 in every state (Figure 6).
The decline in manufacturing was pervasive, but good jobs in other blue-collar industries expanded in most states.
Nationally, the decline of jobs in the
manufacturing industry accounted for
the vast majority (83%) of the good jobs
that workers without BAs have lost since
1991. A similar pattern emerged across
states: manufacturing declined in 38
states (Figure 7) and dominated job losses
in 14 of the 16 states that shed good jobs
overall. Manufacturing also accounted for
Source: Georgetown University Center on Education and the Workforce
analysis of US Census Bureau and Bureau of Labor Statistics, Current
Population Survey (CPS) March Supplement data, 1992–2016.
Figure 6. Good jobs are more concentrated in skilled-
services industries than in blue-collar industries.
Change in the share of non-BA good jobs in skilled-services industries (% point), 1991–2015
MTAZRIOKSCWVNCMOORGANMIAKSPAINLATXDEVTNEIDARALMSTNCOVAUSWYMDFLNJOHCTILWICANVWAMNNHDCMAMINDKYNYSDUTAKHIME 3
10
7
12
5
10
7
13
3
10
7
12
6
11
8
14
6
11
8
14
3
10
7
12
6
11
7
13
4
10
7
13
6
11
8
14
6
12
9
1515
17
15
18
19
20
15
17
17
19
20
21

A State-by-State Analysis | Good Jobs That Pay without a BA 8
Figure 7. Manufacturing dominated losses of good blue-collar jobs in most states.
Note: Alaska, the District of Columbia, and Nevada were excluded from this analysis due to small sample size.
Source: Georgetown University Center on Education and the Workforce analysis of US Census Bureau and Bureau of Labor Statistics, Current
Population Survey (CPS) March Supplement data, 1992–2016.
Change in non-BA manufacturing good jobs
CA
IL
OH
NY
PA
MI
VA
NJ
CT
MA
IN
SC
AL
WI
KS
KY
NC
MO
TX
WA
MD
CO
WV
IA
NH
LA
DE
OK
FL
GA
ME
HI
RI
VT
NE
MN
TN
NM
WY
MT
AZ
ID
MS
ND
SD
OR
AR
UT
-7,700
2,400
-29,300
14,600
-22,600
-3,100
-45,500
-16,700
400
-36,300
8,900
-24,700
-4,200
-48,000
5,600
-24,900
-7,100
-59,000
-9,300
1,000
-30,400
9,800
-22,900
-3,400
-47,400
22,500
-18,700
-1,900
-43,700
6,500
-24,700
-6,300
-54,000
3,700
-25,700
-7,200
-61,300
-71,300
-137,000
-74,300
-175,400
-232,900
-423,700
-72,200
-170,200
-96,500
-181,100
-244,300

Good Jobs That Pay without a BA | A State-by-State Analysis9
the bulk of job losses in 25 of the 27
states that hemorrhaged good blue-
collar jobs between 1991 and 2015.
At the same time, good jobs in
non-manufacturing blue-collar
industries, such as construction and
transportation, increased in 38 states.
North Dakota, South Dakota, and
Utah experienced the most robust job
growth in non-manufacturing blue-
collar industries, as well as in the total
number of blue-collar jobs. Twelve
states and the District of Columbia
lost good jobs in blue-collar industries
other than manufacturing (Table 1).
Table 1. Twelve states and the District of
Columbia shed good jobs in blue-collar
industries other than manufacturing.
STATE
JOB
LOSSES
PERCENT
CHANGE
Rhode Island -21,000 -43%
District of Columbia -6,000 -39%
Maryland -74,000 -24%
West Virginia -21,000 -22%
New York -159,000 -22%
Massachusetts -33,000 -14%
Pennsylvania -71,000 -14%
Missouri -26,000 -10%
New Jersey -36,000 -9%
Michigan -8,000 -2%
Nebraska -1,000 -2%
Oregon -2,000 -1%
Wisconsin -2,000 -1%
Source: Georgetown University Center on Education and the Workforce
analysis of US Census Bureau and Bureau of Labor Statistics, Current
Population Survey (CPS) March Supplement data, 1992–2016.
A State-by-State Analysis | Good Jobs That Pay without a BA 10
Part 2. Good Jobs Require More Education.
High school graduates’ share of good jobs has declined in nearly every state, while associate’s degree holders’ share of good jobs has increased.
Across the nation, good jobs have shifted toward associate’s degree holders and away from
workers with a high school diploma or less. In 1991, high school graduates in 20 states held
more than half of the good jobs for those without a BA. By 2015, they had lost ground,
claiming the majority of good jobs in only two states: Delaware and West Virginia.
The share of good jobs held by high school graduates declined in the overwhelming
majority of states in line with declining manufacturing and blue-collar employment (Figure
8). Only four states and the District of Columbia experienced a rising share of high school
graduates with good jobs.
By comparison, associate’s degree holders have gained more than 3 million good jobs across
the country since 1991. Associate’s degree holders held a larger share of good jobs in 2015
than in 1991 in every state. In Minnesota, workers with associate’s degrees increased their
share of good jobs by 31 percentage points from 1991 to 2015 (Figure 8).

Good Jobs That Pay without a BA | A State-by-State Analysis11
Figure 8. Since 1991, more good jobs have gone to associate’s degree holders than high school
graduates in nearly every state.
Source: Georgetown University Center on Education and the Workforce analysis of US Census Bureau and Bureau of Labor Statistics, Current
Population Survey (CPS) March Supplement data, 1992–2016.
Percentage point change in the share of non-BA good jobs held by workers with different education levels, 1991–2015
Associate’s degree holders
MNSDMOMTIAINKSNMMDKYAZPAIDSCWINVVAOKNENYMEFLMSWAUSARALILUTRICTNCHITXNHVTNJCOCAOHNDMIWVWYGAORMALATNDEAKDC 3
10
9
10
11
11
8
7
8
12
6
4
9
10
2
8
11
7
10
3
14
9
2
4
12
8
12
15
11
2
11
14
8
13
6
14
7
820
216
18
22
17
11
12
16
1816
31
High school graduates
MNSDMOMTIAINKSNMMDKYAZPAIDSCWINVVAOKNENYMEFLMSWAUSARALILUTRICTNCHITXNHVTNJCOCAOHNDMIWVWYGAORMALATNDEAKDC 7
-6
-3
-9
1
-7
-4
-10
2
-6
-4
-9
-1
-8
-5
-11
-2
-8
-5
-12
4
-6
-3
-9
-1
-8
-5
-11
1
-7
-4
-9
-1
-8
-5
-12
-2
-9
-5
-12-12
-13
-13
-14
-15
-21
-13
-14
-13
-15
-16
-25
7
3

A State-by-State Analysis | Good Jobs That Pay without a BA 12
Part 3. Where Are the Good Jobs Today?
States differ in the size and importance of the non-BA job market.
Workers without BAs have a smaller share of good jobs now than in 1991, but the landscape
of good jobs for workers without BAs varies substantially across states (Figure 9). In
Massachusetts, workers without BAs hold only about a third of good jobs. In the District of
Columbia, workers without BAs hold only 15 percent good jobs. By comparison, workers
without BAs hold 62 percent of good jobs in Wyoming.
Good jobs that pay without a BA are concentrated in the most populous states, but some small states have a higher share of good jobs.
Not surprisingly, good jobs are concentrated in the most populous states. The three states
with the largest populations—California, Texas, and Florida—account for more than a quarter
(26%) of all good jobs for workers without BAs in the nation (Figure 10).
However, examining the share or prevalence of good jobs for workers without BAs within
each state reveals a different picture. Sparsely-populated Wyoming becomes the top state,
and California falls to the middle of the pack. Wyoming is followed by densely populated
states on the East Coast—New Jersey, Maryland, and Connecticut (Figure 11).

Good Jobs That Pay without a BA | A State-by-State Analysis13
Figure 9. Workers without BAs in some states, such as Wyoming and Mississippi, hold a much larger
share of all good jobs than the national average.
Source: Georgetown University Center on Education and the Workforce analysis of US Census Bureau and Bureau of Labor Statistics, Current
Population Survey (CPS) March Supplement data, 1992–2016.
Share of good jobs held by workers without a BA (%)
WYMSNVWVOKINLAIDNMARUTMEALWIAZSDIAMIOHMTDEAKNDSCORKYHITNFLMOTXGAPANCUSRIWACANHMNMDCTKSNECOILNJVTNYVAMADC 15
46
43
50
39
48
44
51
36
47
43
51
41
48
44
52
42
49
45
53
32
46
43
50
40
48
44
51
37
48
43
51
42
48
45
52
42
49
45
5353
54
53
55
56
61
53
55
54
56
57
62
A State-by-State Analysis | Good Jobs That Pay without a BA 14
Figure 10. California, Texas, and Florida have the largest number of good jobs for workers
without BAs.
Source: Georgetown University Center on Education and the Workforce analysis of US Census Bureau and Bureau of Labor Statistics, Current
Population Survey (CPS) March Supplement data, 2016.
Number of non-BA good jobs, 2015
CATXFLNYILPAOHMIGANJNCINWAVAMDAZWIMOMNTNCOMALAALSCCTORKYOKIAUTNVARMSKSNEWVIDNMMENHHIDERISDWYMTNDAKVTDC 33,000
138,000
85,000
160,000
78,000
157,000
91,000
104,000
53,000
139,000
85,000
78,000
158,000
99,000
120,000
319,000
541,000
379,000
588,000
372,000
586,000
229,000
632,000
436,000
266,000
702,000
340,000
542,000
382,000
168,000
614,000
379,000
588,000
430,000
257,000
636,000
476,000
278,000
727,000743,000
1,015,000
891,000
1,229,000
1,550,000
2,556,000
837,000
1,140,000
913,000
1,238,000
1,691,000
3,409,000

Good Jobs That Pay without a BA | A State-by-State Analysis15
Figure 11. Wyoming, New Jersey, and Maryland have the largest share of good jobs for workers
without BAs.
Source: Georgetown University Center on Education and the Workforce analysis of US Census Bureau and Bureau of Labor Statistics, Current
Population Survey (CPS) March Supplement data, 2016.
Percentage of non-BA workers with a good job, 2015
WYNJMDCTUTMNNHAKNDCOMIWAINPAILDESDIATXMALANYVTORMEMTWIAZCAVAMOOHGAKYWVOKRISCALIDARNEHITNFLNVNCDCMSNMKS 33
37
36
38
35
38
36
36
33
37
36
35
38
36
37
39
40
39
40
39
40
38
41
40
38
42
39
40
39
38
40
39
40
39
38
41
40
38
4242
45
43
45
46
47
43
45
45
46
47
50
A State-by-State Analysis | Good Jobs That Pay without a BA 16
Part 4. State-by-State Analysis
The Center’s research on good jobs comes at a time of renewed interest in apprenticeships
and other education and training programs that prepare people for jobs that pay without a
BA. Many states are taking steps to reinvigorate career and technical education programs
at the secondary and postsecondary levels. For instance, Iowa recently enacted new career
and technical education legislation. California launched a campaign to promote the value
of career-focused programs offered by community colleges, while other states authorized
financial support for students pursuing certificate programs.
A look at the states (Table 2) shows a surprising amount of variation underlying the national
findings from our earlier report, Good Jobs That Pay without a BA. The shift in good jobs
for workers without BAs from blue-collar industries to skilled-services industries—a strong
national trend described in the earlier report—has played out in unexpected ways. While the
decline of manufacturing eliminated many good jobs for workers without BAs, most states
experienced robust job growth in other blue-collar industries, such as construction and
transportation. Nearly half of the states experienced growth of good jobs in both blue-collar
and skilled-services industries, breaking with the national pattern.
Today, states differ markedly in the vitality of their non-BA labor markets. While good jobs have
increasingly gone to workers with BAs across the nation, workers without BAs have a firm grasp
on good jobs in some states. In Wyoming and Mississippi, these workers hold more than three
out of five good jobs. Among workers without BAs, opportunity has shifted toward associate’s
degree holders, who have increased their share of good jobs in every state since 1991.

Good Jobs That Pay without a BA | A State-by-State Analysis17
Table 2. The states vary widely in the share of good jobs for workers without a BA.
State
Number of non-BA good jobs
State share of all US workers without BAs who have a good job
Share of workers without a BA who have a good job
Buying power
relative to
national
average*1991 2015 ChangePercent change 1991 2015 1991 2015
AK 71,000 78,000 7,000 10% 0.3% 0.3% 46.9% 44.9% -5.6%
AL 391,000 436,000 45,000 12% 1.5% 1.5% 32.7% 37.6% 13.2%
AR 183,000 266,000 83,000 45% 0.7% 0.9% 25.9% 36.8% 12.6%
AZ 340,000 632,000 292,000 86% 1.3% 2.1% 35.1% 38.8% 3.8%
CA 3,377,000 3,409,000 32,000 1% 12.5% 11.5% 41.6% 38.8% -13.4%
CO 378,000 542,000 164,000 44% 1.4% 1.8% 39.0% 43.1% -3.2%
CT 422,000 382,000 -40,000 -9% 1.6% 1.3% 48.4% 46.2% -8.7%
DC 51,000 33,000 -18,000 -35% 0.2% 0.1% 37.3% 35.4% -17.0%
DE 87,000 104,000 17,000 20% 0.3% 0.3% 38.7% 40.7% -0.4%
FL 1,139,000 1,691,000 552,000 48% 4.2% 5.7% 30.3% 35.9% 0.5%
GA 618,000 913,000 295,000 48% 2.3% 3.1% 34.0% 38.4% 7.4%
HI 125,000 120,000 -5,000 -4% 0.5% 0.4% 39.6% 36.3% -18.8%
IA 278,000 340,000 62,000 22% 1.0% 1.1% 32.0% 40.4% 9.7%
ID 86,000 157,000 71,000 83% 0.3% 0.5% 29.2% 37.5% 6.6%
IL 1,430,000 1,238,000 -192,000 -13% 5.3% 4.2% 42.3% 41.3% 0.3%
IN 646,000 743,000 97,000 15% 2.4% 2.5% 36.7% 41.6% 9.3%
KS 235,000 229,000 -6,000 -2% 0.9% 0.8% 34.2% 32.9% 9.6%
KY 340,000 379,000 39,000 12% 1.3% 1.3% 35.1% 38.1% 11.4%
LA 322,000 476,000 154,000 48% 1.2% 1.6% 28.9% 40.0% 9.4%
MA 666,000 541,000 -125,000 -19% 2.5% 1.8% 42.8% 40.2% -6.9%
MD 707,000 636,000 -71,000 -10% 2.6% 2.1% 46.8% 46.7% -9.6%
ME 106,000 138,000 32,000 30% 0.4% 0.5% 28.5% 39.4% 2.0%
MI 1,177,000 1,015,000 -162,000 -14% 4.4% 3.4% 42.6% 42.9% 6.5%
MN 504,000 588,000 84,000 17% 1.9% 2.0% 37.2% 45.3% 2.6%
MO 546,000 588,000 42,000 8% 2.0% 2.0% 34.6% 38.6% 10.7%
MS 193,000 257,000 64,000 33% 0.7% 0.9% 26.5% 35.0% 13.8%
MT 60,000 91,000 31,000 51% 0.2% 0.3% 25.8% 39.2% 5.2%

A State-by-State Analysis | Good Jobs That Pay without a BA 18
State
Number of non-BA good jobs
State share of all US workers without BAs who have a good job
Share of workers without a BA who have a good job
Buying power
relative to
national
average*1991 2015 ChangePercent change 1991 2015 1991 2015
NC 647,000 837,000 190,000 29% 2.4% 2.8% 30.9% 35.5% 8.8%
ND 41,000 85,000 44,000 106% 0.2% 0.3% 25.2% 44.8% 7.7%
NE 147,000 168,000 21,000 14% 0.5% 0.6% 31.6% 36.7% 9.4%
NH 151,000 139,000 -12,000 -8% 0.6% 0.5% 40.6% 45.2% -5.0%
NJ 971,000 891,000 -80,000 -8% 3.6% 3.0% 46.3% 47.4% -13.4%
NM 122,000 160,000 38,000 31% 0.5% 0.5% 32.0% 33.4% 5.6%
NV 157,000 278,000 121,000 77% 0.6% 0.9% 38.2% 35.6% 2.0%
NY 2,010,000 1,550,000 -460,000 -23% 7.5% 5.2% 42.7% 39.9% -15.3%
OH 1,322,000 1,140,000 -182,000 -14% 4.9% 3.8% 40.2% 38.5% 10.8%
OK 278,000 372,000 94,000 34% 1.0% 1.3% 31.4% 37.8% 10.1%
OR 280,000 379,000 99,000 36% 1.0% 1.3% 32.3% 39.5% 0.8%
PA 1,332,000 1,229,000 -103,000 -8% 4.9% 4.1% 37.1% 41.5% 2.1%
RI 112,000 99,000 -13,000 -12% 0.4% 0.3% 39.6% 37.7% 1.3%
SC 359,000 430,000 71,000 20% 1.3% 1.5% 31.8% 37.6% 9.7%
SD 40,000 85,000 45,000 112% 0.1% 0.3% 21.9% 40.4% 11.8%
TN 459,000 586,000 127,000 28% 1.7% 2.0% 31.4% 35.9% 10.1%
TX 1,618,000 2,556,000 938,000 58% 6.0% 8.6% 33.0% 40.3% 3.2%
UT 146,000 319,000 173,000 119% 0.5% 1.1% 35.4% 45.6% 3.0%
VA 744,000 702,000 -42,000 -6% 2.8% 2.4% 37.2% 38.6% -2.5%
VT 51,000 53,000 2,000 4% 0.2% 0.2% 31.0% 39.7% -1.6%
WA 604,000 727,000 123,000 20% 2.2% 2.5% 44.2% 41.6% -4.8%
WI 627,000 614,000 -13,000 -2% 2.3% 2.1% 40.5% 39.1% 6.9%
WV 179,000 158,000 -21,000 -12% 0.7% 0.5% 35.6% 38.1% 11.1%
WY 51,000 78,000 27,000 54% 0.2% 0.3% 37.0% 50.0% 3.8%
Source: Georgetown University Center on Education and the Workforce analysis of US Census Bureau and Bureau of Labor Statistics, Current
Population Survey (CPS) March Supplement data, 1992–2016 and US Bureau of Economic Analysis, “Regional Price Parities by State,” Real
Personal Income for States and Metropolitan Areas, 2015, 2017.
* Buying power expresses the value of a dollar, based on the cost of living in states, as captured by regional price parities reported by the federal
Bureau of Economic Analysis.


State Profiles
Good Jobs That Pay without a BA | A State-by-State Analysis21
earn between $35,000 and $45,000
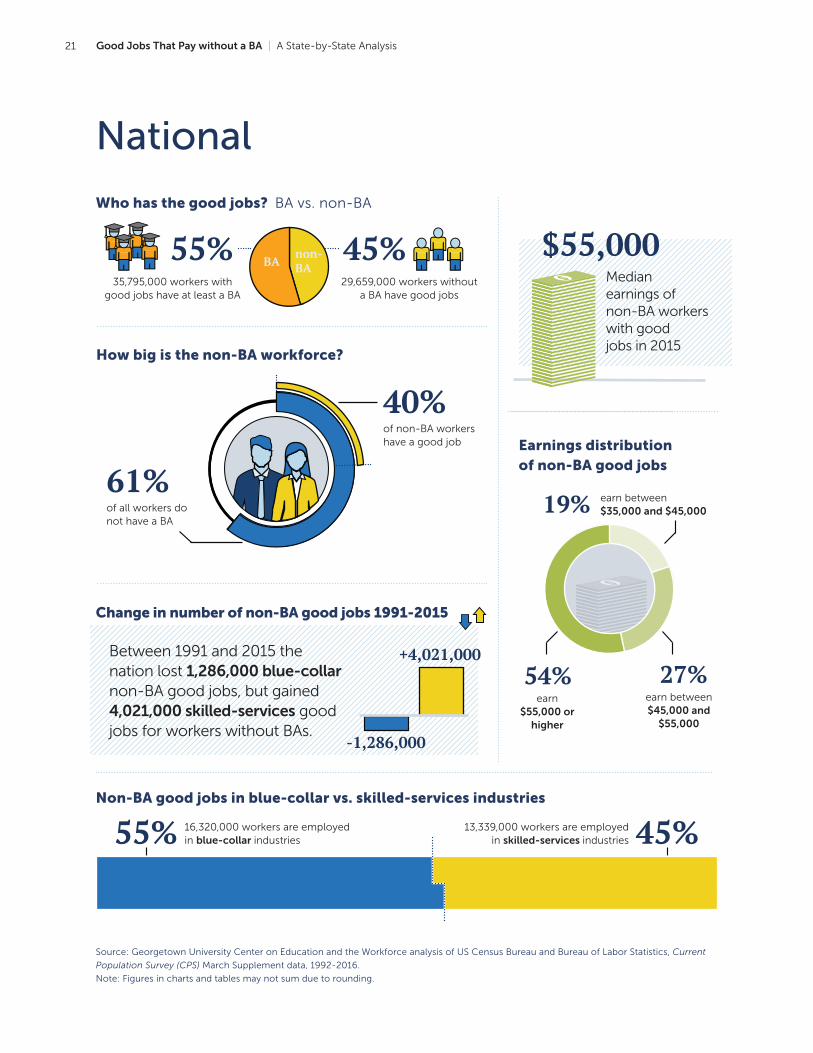
National
$55,000Median earnings of non-BA workers with good jobs in 2015
55%35,795,000 workers with
good jobs have at least a BA
BAnon- BA
45%29,659,000 workers without
a BA have good jobs
Earnings distribution of non-BA good jobs
19%
27%54%earn between $45,000 and
$55,000
earn $55,000 or
higher
Non-BA good jobs in blue-collar vs. skilled-services industries
45%16,320,000 workers are employed in blue-collar industries
Source: Georgetown University Center on Education and the Workforce analysis of US Census Bureau and Bureau of Labor Statistics, Current
Population Survey (CPS) March Supplement data, 1992-2016.
Note: Figures in charts and tables may not sum due to rounding.
55% 13,339,000 workers are employed in skilled-services industries
61%of all workers do not have a BA
40%of non-BA workers have a good job
How big is the non-BA workforce?
Who has the good jobs? BA vs. non-BA
-1,286,000
+4,021,000Between 1991 and 2015 the nation lost 1,286,000 blue-collar non-BA good jobs, but gained 4,021,000 skilled-services good jobs for workers without BAs.
Change in number of non-BA good jobs 1991-2015

A State-by-State Analysis | Good Jobs That Pay without a BA 22
Top five industries
Industry
Number of non-
BA good jobs
Share of non-BA
good jobs
Share of non-BA
workers with good jobs
Median
earnings
Manufacturing 4,686,000 16% 58% $58,000
Financial activities, real estate, professional, and management services 3,775,000 13% 29% $58,000
Transportation, communi-cations, and utilities 3,697,000 12% 61% $60,000
Wholesale and retail trade 3,644,000 12% 57% $55,000
Construction 3,477,000 12% 79% $59,000
NON-BA GOOD JOBS
Jobs by educational attainment
Educational attainment
Number of
workers
Workers with
good jobs
Median
earnings
Median earnings of
workers with good jobs
Non-BA Workers
Less than high school 9,365,000 1,746,000 $22,000 $50,000
High school graduate 31,245,000 11,618,000 $31,000 $55,000
Some college 20,474,000 9,292,000 $35,000 $57,000
Associate's degree 13,724,000 7,003,000 $40,000 $60,000
All non-BA workers 74,807,000 29,659,000 $32,000 $55,000
BA+ Workers
Bachelor’s or higher 47,868,000 35,795,000 $60,000 $75,000
All workers 122,676,000 65,454,000 $40,000 $65,000
Top five occupations
Occupation
Number of non-
BA good jobs
Share of non-BA
good jobs
Share of non-BA
workers with good jobs
Median
earnings
Sales and office related 6,244,000 21% 34% $53,000
Management and business and financial operations 5,334,000 18% 66% $63,000
STEM and healthcare practitioners 3,301,000 11% 65% $60,000
Natural resources, construction, and extraction 3,133,000 11% 47% $58,000
Transportation and material moving 2,744,000 9% 40% $54,002
Source: Georgetown University Center on Education and the Workforce analysis of US Census Bureau and Bureau of Labor Statistics, Current
Population Survey (CPS) March Supplement data, 1992-2016.
Note: Figures in charts and tables may not sum due to rounding.

Good Jobs That Pay without a BA | A State-by-State Analysis23
Alabama
earn between $35,000 and $45,000
70%of all workers do not have a BA
32%of non-BA workers have a good job
$56,000Median earnings of non-BA workers with good jobs in 2015
48%347,000 workers with good
jobs have at least a BA
BA non- BA
52%378,000 workers without
a BA have good jobs
Earnings distribution of non-BA good jobs
20%
29%51%earn between $45,000 and
$55,000
earn $55,000 or
higher-19,000
+64,000Between 1991 and 2015 Alabama lost 19,000 blue-collar non-BA good jobs, but gained 64,000 skilled-services good jobs for workers without BAs.
Change in number of non-BA good jobs 1991-2015
Source: Georgetown University Center on Education and the Workforce analysis of Bureau of the Census, American Community Survey
microdata 2013-2015, US Census Bureau and Bureau of Labor Statistics, Current Population Survey (CPS) March Supplement data, 1992-2016.
Note: Figures in charts and tables may not sum due to rounding.
Non-BA good jobs in blue-collar vs. skilled-services industries
41%223,000 workers are employed in blue-collar industries59% 153,000 workers are employed
in skilled-services industries
How big is the non-BA workforce?
Who has the good jobs? BA vs. non-BA

A State-by-State Analysis | Good Jobs That Pay without a BA 24
Jobs by educational attainment
Educational attainment
Number of
workers
Workers with
good jobs
Median
earnings
Median earnings of
workers with good jobs
Non-BA Workers
Less than high school 142,000 22,000 $20,000 $52,000
High school graduate 474,000 135,000 $26,000 $56,000
Some college 399,000 141,000 $30,000 $56,000
Associate's degree 174,000 79,000 $36,000 $55,000
All non-BA workers 1,188,000 378,000 $28,000 $56,000
BA+ Workers
Bachelor’s or higher 507,000 347,000 $51,000 $67,000
All workers 1,695,000 725,000 $33,000 $60,000
Top five industries
Industry
Number of non-
BA good jobs
Share of non-BA
good jobs
Share of non-BA
workers with good jobs
Median
earnings
Manufacturing 95,000 25% 43% $58,000
Health services 43,000 11% 26% $51,000
Transportation and utilities 42,000 11% 55% $61,000
Construction 32,000 9% 35% $57,000
Retail trade 29,000 8% 19% $51,000
NON-BA GOOD JOBS
Top five occupations
Occupation
Number of non-
BA good jobs
Share of non-BA
good jobs
Share of non-BA
workers with good jobs
Median
earnings
Production 58,000 15% 38% $56,000
Management 45,000 12% 60% $65,000
Office and administrative support 40,000 11% 22% $51,000
Transportation and material moving 36,000 10% 31% $52,000
Installation, maintenance, and repair 34,000 9% 51% $59,000
Source: Georgetown University Center on Education and the Workforce analysis of Bureau of the Census, American Community Survey
microdata 2013-2015.
Note: Figures in charts and tables may not sum due to rounding.
Good Jobs That Pay without a BA | A State-by-State Analysis25
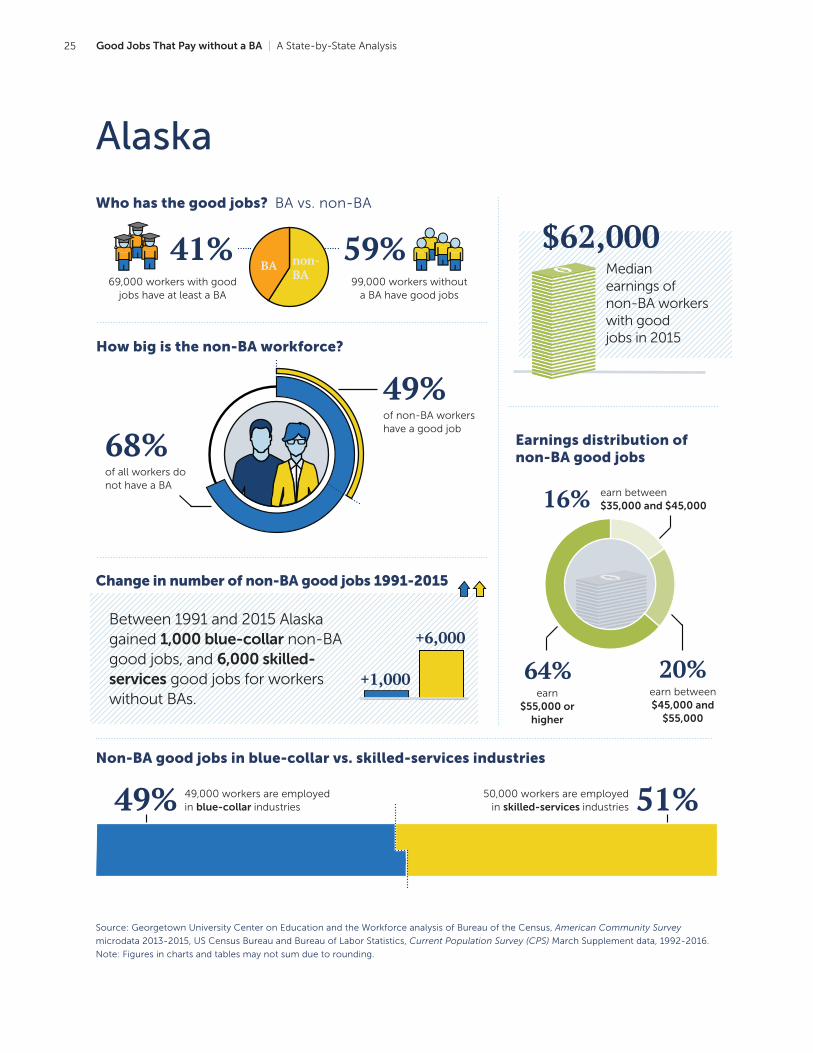
Alaska
Source: Georgetown University Center on Education and the Workforce analysis of Bureau of the Census, American Community Survey
microdata 2013-2015, US Census Bureau and Bureau of Labor Statistics, Current Population Survey (CPS) March Supplement data, 1992-2016.
Note: Figures in charts and tables may not sum due to rounding.
51%49,000 workers are employed in blue-collar industries49% 50,000 workers are employed
in skilled-services industries
earn between $35,000 and $45,000
$62,000Median earnings of non-BA workers with good jobs in 2015
Earnings distribution of non-BA good jobs
16%
20%64%earn between $45,000 and
$55,000
earn $55,000 or
higher
Between 1991 and 2015 Alaska gained 1,000 blue-collar non-BA good jobs, and 6,000 skilled-services good jobs for workers without BAs.
+1,000
+6,000
41%69,000 workers with good
jobs have at least a BA
BA non- BA
59%99,000 workers without
a BA have good jobs
68%of all workers do not have a BA
49%of non-BA workers have a good job
How big is the non-BA workforce?
Who has the good jobs? BA vs. non-BA
Change in number of non-BA good jobs 1991-2015
Non-BA good jobs in blue-collar vs. skilled-services industries

A State-by-State Analysis | Good Jobs That Pay without a BA 26
Jobs by educational attainment
Educational attainment
Number of
workers
Workers with
good jobs
Median
earnings
Median earnings of
workers with good jobs
Non-BA Workers
Less than high school 15,000 4,000 $22,000 $66,000
High school graduate 77,000 35,000 $35,000 $63,000
Some college 82,000 44,000 $41,000 $61,000
Associate's degree 27,000 16,000 $45,000 $69,000
All non-BA workers 201,000 99,000 $38,000 $62,000
BA+ Workers
Bachelor’s or higher 95,000 69,000 $61,000 $72,000
All workers 297,000 168,000 $44,000 $67,000
Top five industries
Industry
Number of non-
BA good jobs
Share of non-BA
good jobs
Share of non-BA
workers with good jobs
Median
earnings
Construction 15,000 15% 64% $72,000
Public administration 14,000 14% 63% $62,000
Transportation and utilities 11,000 11% 57% $71,000
Health services 11,000 11% 46% $52,000
Natural resources 9,000 9% 70% $83,000
NON-BA GOOD JOBS
Top five occupations
Occupation
Number of non-
BA good jobs
Share of non-BA
good jobs
Share of non-BA
workers with good jobs
Median
earnings
Office and administrative support 15,000 15% 44% $54,000
Construction and extraction 14,000 14% 66% $73,000
Management 12,000 12% 72% $72,000
Transportation and material moving 10,000 10% 53% $69,000
Installation, maintenance, and repair 9,000 9% 72% $71,000
Source: Georgetown University Center on Education and the Workforce analysis of Bureau of the Census, American Community Survey
microdata 2013-2015.
Note: Figures in charts and tables may not sum due to rounding.

Good Jobs That Pay without a BA | A State-by-State Analysis27
Arizona
Source: Georgetown University Center on Education and the Workforce analysis of Bureau of the Census, American Community Survey
microdata 2013-2015, US Census Bureau and Bureau of Labor Statistics, Current Population Survey (CPS) March Supplement data, 1992-2016.
Note: Figures in charts and tables may not sum due to rounding.
54%265,000 workers are employed in blue-collar industries46% 306,000 workers are employed
in skilled-services industries
earn between $35,000 and $45,000
$55,000Median earnings of non-BA workers with good jobs in 2015
Earnings distribution of non-BA good jobs
22%
27%51%earn between $45,000 and
$55,000
earn $55,000 or
higher
Between 1991 and 2015 Arizona gained 70,000 blue-collar non-BA good jobs, and 223,000 skilled-services good jobs for workers without BAs.
+70,000
+223,000
48%517,000 workers with good
jobs have at least a BA
BA non- BA
52%571,000 workers without
a BA have good jobs
68%of all workers do not have a BA
36%of non-BA workers have a good job
How big is the non-BA workforce?
Who has the good jobs? BA vs. non-BA
Change in number of non-BA good jobs 1991-2015
Non-BA good jobs in blue-collar vs. skilled-services industries

A State-by-State Analysis | Good Jobs That Pay without a BA 28
Jobs by educational attainment
Educational attainment
Number of
workers
Workers with
good jobs
Median
earnings
Median earnings of
workers with good jobs
Non-BA Workers
Less than high school 232,000 39,000 $20,000 $50,000
High school graduate 512,000 160,000 $28,000 $53,000
Some college 609,000 257,000 $34,000 $56,000
Associate's degree 232,000 115,000 $37,000 $59,000
All non-BA workers 1,586,000 571,000 $31,000 $55,000
BA+ Workers
Bachelor’s or higher 751,000 517,000 $53,000 $72,000
All workers 2,337,000 1,088,000 $36,000 $61,000
Top five industries
Industry
Number of non-
BA good jobs
Share of non-BA
good jobs
Share of non-BA
workers with good jobs
Median
earnings
Information, financial activities, and real estate 74,000 13% 51% $55,000
Construction 61,000 11% 42% $53,000
Health services 59,000 10% 30% $53,000
Manufacturing 59,000 10% 47% $59,000
Retail trade 57,000 10% 27% $52,000
NON-BA GOOD JOBS
Top five occupations
Occupation
Number of non-
BA good jobs
Share of non-BA
good jobs
Share of non-BA
workers with good jobs
Median
earnings
Management 81,000 14% 70% $65,000
Office and administrative support 76,000 13% 28% $50,000
Sales and related 65,000 11% 36% $58,000
Construction and extraction 46,000 8% 39% $52,000
Installation, maintenance, and repair 42,000 7% 53% $57,000
Source: Georgetown University Center on Education and the Workforce analysis of Bureau of the Census, American Community Survey
microdata 2013-2015.
Note: Figures in charts and tables may not sum due to rounding.

Good Jobs That Pay without a BA | A State-by-State Analysis29
Arkansas
Source: Georgetown University Center on Education and the Workforce analysis of Bureau of the Census, American Community Survey
microdata 2013-2015, US Census Bureau and Bureau of Labor Statistics, Current Population Survey (CPS) March Supplement data, 1992-2016.
Note: Figures in charts and tables may not sum due to rounding.
39%135,000 workers are employed in blue-collar industries61% 87,000 workers are employed
in skilled-services industries
earn between $35,000 and $45,000
$54,000Median earnings of non-BA workers with good jobs in 2015
22%
29%48%earn between $45,000 and
$55,000
earn $55,000 or
higher
Between 1991 and 2015 Arkansas gained 32,000 blue-collar non-BA good jobs, and 51,000 skilled-services good jobs for workers without BAs.
+32,000
+51,000
45%180,000 workers with good
jobs have at least a BA
BA non- BA
55%221,000 workers without
a BA have good jobs
73%of all workers do not have a BA
30%of non-BA workers have a good job
How big is the non-BA workforce?
Who has the good jobs? BA vs. non-BA
Earnings distribution of non-BA good jobs
Change in number of non-BA good jobs 1991-2015
Non-BA good jobs in blue-collar vs. skilled-services industries

A State-by-State Analysis | Good Jobs That Pay without a BA 30
Jobs by educational attainment
Educational attainment
Number of
workers
Workers with
good jobs
Median
earnings
Median earnings of
workers with good jobs
Non-BA Workers
Less than high school 88,000 14,000 $21,000 $51,000
High school graduate 326,000 87,000 $26,000 $54,000
Some college 250,000 85,000 $30,000 $54,000
Associate's degree 83,000 35,000 $33,000 $56,000
All non-BA workers 748,000 221,000 $27,000 $54,000
BA+ Workers
Bachelor’s or higher 276,000 180,000 $50,000 $64,000
All workers 1,024,000 401,000 $31,000 $58,000
Top five industries
Industry
Number of non-
BA good jobs
Share of non-BA
good jobs
Share of non-BA
workers with good jobs
Median
earnings
Manufacturing 48,000 22% 35% $53,000
Transportation and utilities 28,000 13% 55% $60,000
Health services 27,000 12% 25% $52,000
Retail trade 24,000 11% 24% $52,000
Construction 19,000 9% 32% $52,000
NON-BA GOOD JOBS
Top five occupations
Occupation
Number of non-
BA good jobs
Share of non-BA
good jobs
Share of non-BA
workers with good jobs
Median
earnings
Production 29,000 13% 30% $52,000
Management 26,000 12% 55% $62,000
Office and administrative support 24,000 11% 21% $50,000
Transportation and material moving 22,000 10% 30% $53,000
Sales and related 21,000 10% 30% $57,000
Source: Georgetown University Center on Education and the Workforce analysis of Bureau of the Census, American Community Survey
microdata 2013-2015.
Note: Figures in charts and tables may not sum due to rounding.

Good Jobs That Pay without a BA | A State-by-State Analysis31
California
Source: Georgetown University Center on Education and the Workforce analysis of Bureau of the Census, American Community Survey
microdata 2013-2015, US Census Bureau and Bureau of Labor Statistics, Current Population Survey (CPS) March Supplement data, 1992-2016.
Note: Figures in charts and tables may not sum due to rounding.
53%1,587,000 workers are employed in blue-collar industries47% 1,763,000 workers are employed
in skilled-services industries
earn between $35,000 and $45,000
$59,000Median earnings of non-BA workers with good jobs in 2015
19%
25%56%earn between $45,000 and
$55,000
earn $55,000 or
higher-232,000
+265,000Between 1991 and 2015 California lost 232,000 blue-collar non-BA good jobs, but gained 265,000 skilled-services good jobs for workers without BAs.
54%3,910,000 workers with
good jobs have at least a BA
BAnon- BA
46%3,353,000 workers without
a BA have good jobs
63%of all workers do not have a BA
37%of non-BA workers have a good job
How big is the non-BA workforce?
Who has the good jobs? BA vs. non-BA
Earnings distribution of non-BA good jobs
Change in number of non-BA good jobs 1991-2015
Non-BA good jobs in blue-collar vs. skilled-services industries

A State-by-State Analysis | Good Jobs That Pay without a BA 32
Jobs by educational attainment
Educational attainment
Number of
workers
Workers with
good jobs
Median
earnings
Median earnings of
workers with good jobs
Non-BA Workers
Less than high school 1,830,000 290,000 $20,000 $51,000
High school graduate 2,758,000 946,000 $29,000 $55,000
Some college 3,180,000 1,491,000 $36,000 $61,000
Associate's degree 1,194,000 625,000 $41,000 $65,000
All non-BA workers 8,961,000 3,353,000 $30,000 $59,000
BA+ Workers
Bachelor’s or higher 5,293,000 3,910,000 $67,000 $84,000
All workers 14,255,000 7,263,000 $40,000 $71,000
Top five industries
Industry
Number of non-
BA good jobs
Share of non-BA
good jobs
Share of non-BA
workers with good jobs
Median
earnings
Manufacturing 419,000 13% 42% $60,000
Health services 389,000 12% 35% $56,000
Information, financial activities, and real estate 371,000 11% 55% $62,000
Construction 351,000 11% 47% $60,000
Retail trade 315,000 9% 29% $53,000
NON-BA GOOD JOBS
Top five occupations
Occupation
Number of non-
BA good jobs
Share of non-BA
good jobs
Share of non-BA
workers with good jobs
Median
earnings
Office and administrative support 522,000 16% 37% $52,000
Management 442,000 13% 70% $72,000
Sales and related 337,000 10% 37% $60,000
Construction and extraction 285,000 9% 45% $60,000
Transportation and material moving 253,000 8% 32% $54,000
Source: Georgetown University Center on Education and the Workforce analysis of Bureau of the Census, American Community Survey
microdata 2013-2015.
Note: Figures in charts and tables may not sum due to rounding.
Good Jobs That Pay without a BA | A State-by-State Analysis33
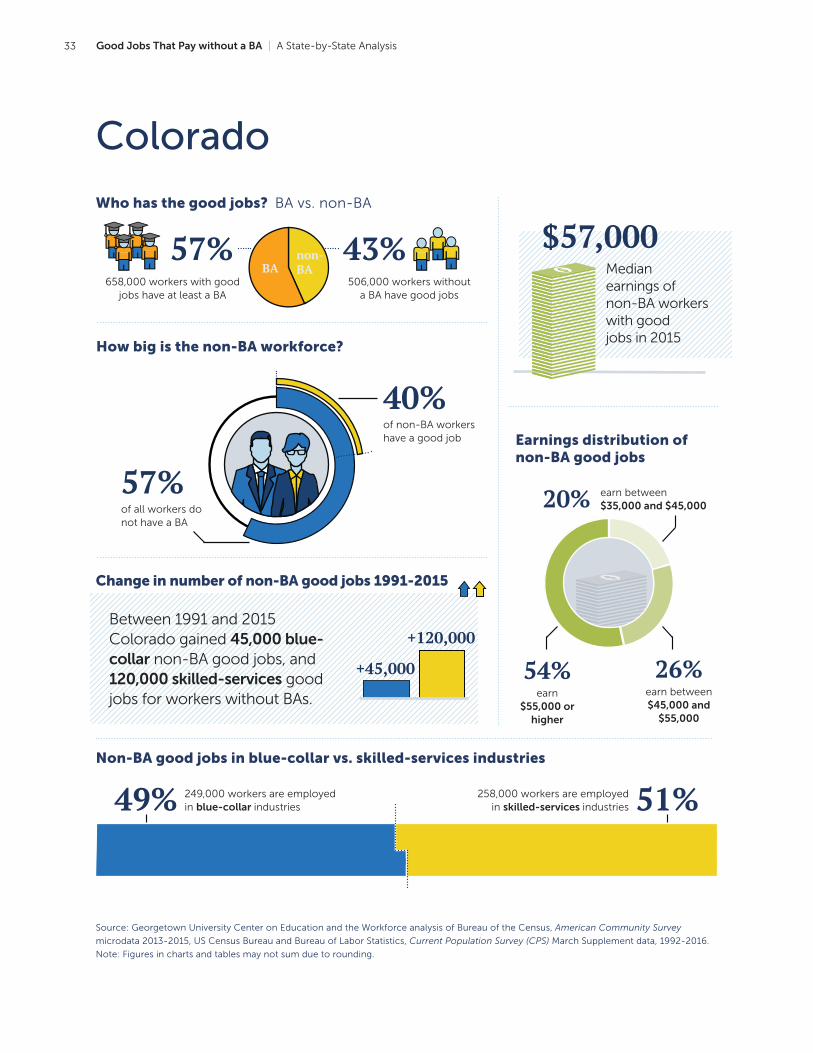
Colorado
Source: Georgetown University Center on Education and the Workforce analysis of Bureau of the Census, American Community Survey
microdata 2013-2015, US Census Bureau and Bureau of Labor Statistics, Current Population Survey (CPS) March Supplement data, 1992-2016.
Note: Figures in charts and tables may not sum due to rounding.
51%249,000 workers are employed in blue-collar industries49% 258,000 workers are employed
in skilled-services industries
earn between $35,000 and $45,000
$57,000Median earnings of non-BA workers with good jobs in 2015
20%
26%54%earn between $45,000 and
$55,000
earn $55,000 or
higher
Between 1991 and 2015 Colorado gained 45,000 blue-collar non-BA good jobs, and 120,000 skilled-services good jobs for workers without BAs.
+45,000
+120,000
57%658,000 workers with good
jobs have at least a BA
BAnon- BA
43%506,000 workers without
a BA have good jobs
57%of all workers do not have a BA
40%of non-BA workers have a good job
How big is the non-BA workforce?
Who has the good jobs? BA vs. non-BA
Earnings distribution of non-BA good jobs
Change in number of non-BA good jobs 1991-2015
Non-BA good jobs in blue-collar vs. skilled-services industries
A State-by-State Analysis | Good Jobs That Pay without a BA 34
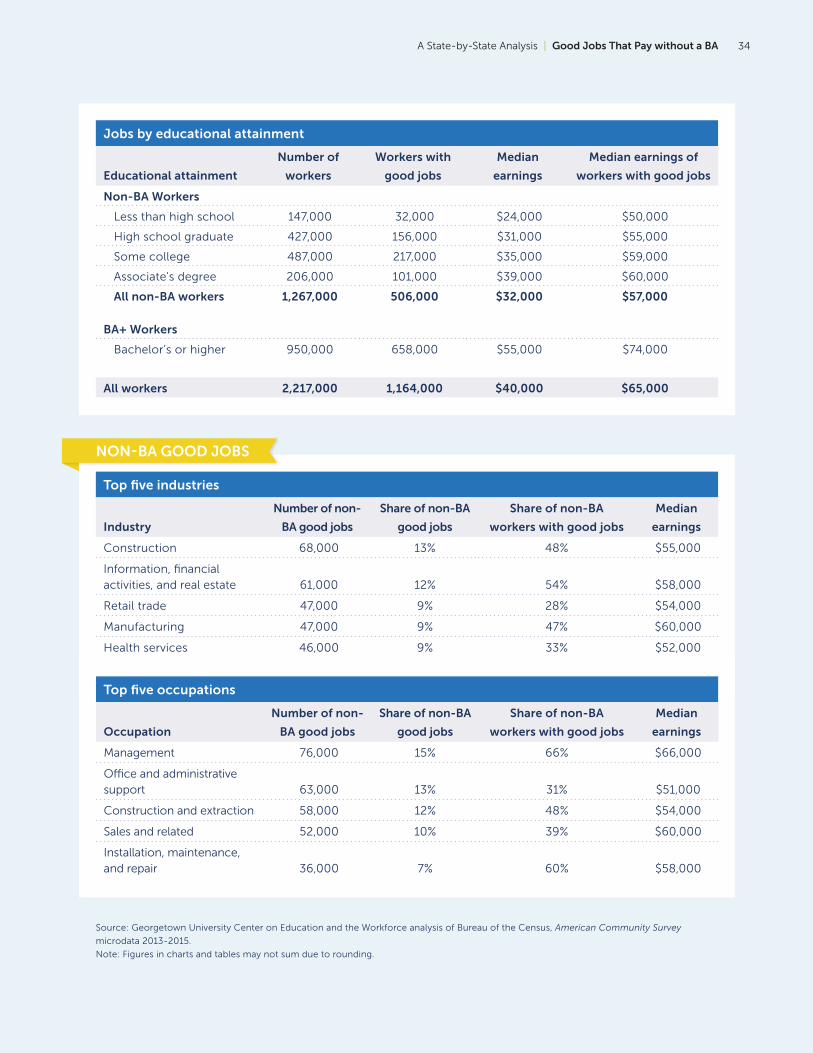
Jobs by educational attainment
Educational attainment
Number of
workers
Workers with
good jobs
Median
earnings
Median earnings of
workers with good jobs
Non-BA Workers
Less than high school 147,000 32,000 $24,000 $50,000
High school graduate 427,000 156,000 $31,000 $55,000
Some college 487,000 217,000 $35,000 $59,000
Associate's degree 206,000 101,000 $39,000 $60,000
All non-BA workers 1,267,000 506,000 $32,000 $57,000
BA+ Workers
Bachelor’s or higher 950,000 658,000 $55,000 $74,000
All workers 2,217,000 1,164,000 $40,000 $65,000
Top five industries
Industry
Number of non-
BA good jobs
Share of non-BA
good jobs
Share of non-BA
workers with good jobs
Median
earnings
Construction 68,000 13% 48% $55,000
Information, financial activities, and real estate 61,000 12% 54% $58,000
Retail trade 47,000 9% 28% $54,000
Manufacturing 47,000 9% 47% $60,000
Health services 46,000 9% 33% $52,000
NON-BA GOOD JOBS
Top five occupations
Occupation
Number of non-
BA good jobs
Share of non-BA
good jobs
Share of non-BA
workers with good jobs
Median
earnings
Management 76,000 15% 66% $66,000
Office and administrative support 63,000 13% 31% $51,000
Construction and extraction 58,000 12% 48% $54,000
Sales and related 52,000 10% 39% $60,000
Installation, maintenance, and repair 36,000 7% 60% $58,000
Source: Georgetown University Center on Education and the Workforce analysis of Bureau of the Census, American Community Survey
microdata 2013-2015.
Note: Figures in charts and tables may not sum due to rounding.

Good Jobs That Pay without a BA | A State-by-State Analysis35
Connecticut
Source: Georgetown University Center on Education and the Workforce analysis of Bureau of the Census, American Community Survey
microdata 2013-2015, US Census Bureau and Bureau of Labor Statistics, Current Population Survey (CPS) March Supplement data, 1992-2016.
Note: Figures in charts and tables may not sum due to rounding.
52%174,000 workers are employed in blue-collar industries48% 190,000 workers are employed
in skilled-services industries
earn between $35,000 and $45,000
$60,000Median earnings of non-BA workers with good jobs in 2015
15%
26%58%earn between $45,000 and
$55,000
earn $55,000 or
higher-56,000
+16,000Between 1991 and 2015 Connecticut lost 56,000 blue-collar non-BA good jobs, but gained 16,000 skilled-services good jobs for workers without BAs.
58%493,000 workers with good
jobs have at least a BA
BAnon- BA
42%364,000 workers without
a BA have good jobs
56%of all workers do not have a BA
45%of non-BA workers have a good job
How big is the non-BA workforce?
Who has the good jobs? BA vs. non-BA
Earnings distribution of non-BA good jobs
Change in number of non-BA good jobs 1991-2015
Non-BA good jobs in blue-collar vs. skilled-services industries

A State-by-State Analysis | Good Jobs That Pay without a BA 36
Jobs by educational attainment
Educational attainment
Number of
workers
Workers with
good jobs
Median
earnings
Median earnings of
workers with good jobs
Non-BA Workers
Less than high school 81,000 19,000 $24,000 $52,000
High school graduate 351,000 144,000 $35,000 $58,000
Some college 265,000 131,000 $39,000 $61,000
Associate's degree 120,000 70,000 $46,000 $62,000
All non-BA workers 818,000 364,000 $36,000 $60,000
BA+ Workers
Bachelor’s or higher 640,000 493,000 $70,000 $84,000
All workers 1,458,000 856,000 $47,000 $71,000
Top five industries
Industry
Number of non-
BA good jobs
Share of non-BA
good jobs
Share of non-BA
workers with good jobs
Median
earnings
Manufacturing 58,000 16% 55% $62,000
Health services 50,000 14% 37% $55,000
Information, financial activities, and real estate 41,000 11% 63% $66,000
Construction 40,000 11% 57% $59,000
Retail trade 35,000 10% 34% $53,000
NON-BA GOOD JOBS
Top five occupations
Occupation
Number of non-
BA good jobs
Share of non-BA
good jobs
Share of non-BA
workers with good jobs
Median
earnings
Office and administrative support 55,000 15% 42% $53,000
Management 43,000 12% 76% $78,000
Construction and extraction 35,000 10% 55% $58,000
Sales and related 34,000 9% 42% $60,000
Production 30,000 8% 43% $60,000
Source: Georgetown University Center on Education and the Workforce analysis of Bureau of the Census, American Community Survey
microdata 2013-2015.
Note: Figures in charts and tables may not sum due to rounding.

Good Jobs That Pay without a BA | A State-by-State Analysis37
Delaware
Source: Georgetown University Center on Education and the Workforce analysis of Bureau of the Census, American Community Survey
microdata 2013-2015, US Census Bureau and Bureau of Labor Statistics, Current Population Survey (CPS) March Supplement data, 1992-2016.
Note: Figures in charts and tables may not sum due to rounding.
55%41,000 workers are employed in blue-collar industries45% 50,000 workers are employed
in skilled-services industries
earn between $35,000 and $45,000
$56,000Median earnings of non-BA workers with good jobs in 2015
18%
29%53%earn between $45,000 and
$55,000
earn $55,000 or
higher-3,000
+20,000Between 1991 and 2015 Delaware lost 3,000 blue-collar non-BA good jobs, but gained 20,000 skilled-services good jobs for workers without BAs.
51%98,000 workers with good
jobs have at least a BA
BA non- BA
49%94,000 workers without
a BA have good jobs
63%of all workers do not have a BA
41%of non-BA workers have a good job
How big is the non-BA workforce?
Who has the good jobs? BA vs. non-BA
Earnings distribution of non-BA good jobs
Change in number of non-BA good jobs 1991-2015
Non-BA good jobs in blue-collar vs. skilled-services industries

A State-by-State Analysis | Good Jobs That Pay without a BA 38
Jobs by educational attainment
Educational attainment
Number of
workers
Workers with
good jobs
Median
earnings
Median earnings of
workers with good jobs
Non-BA Workers
Less than high school 25,000 6,000 $23,000 $54,000
High school graduate 96,000 35,000 $31,000 $54,000
Some college 76,000 34,000 $36,000 $57,000
Associate's degree 34,000 19,000 $41,000 $61,000
All non-BA workers 231,000 94,000 $33,000 $56,000
BA+ Workers
Bachelor’s or higher 135,000 98,000 $58,000 $73,000
All workers 366,000 192,000 $41,000 $63,000
Top five industries
Industry
Number of non-
BA good jobs
Share of non-BA
good jobs
Share of non-BA
workers with good jobs
Median
earnings
Health services 13,000 14% 37% $57,000
Information, financial activities, and real estate 12,000 13% 57% $57,000
Manufacturing 11,000 12% 53% $57,000
Retail trade 10,000 11% 32% $50,000
Construction 9,000 9% 45% $58,000
NON-BA GOOD JOBS
Top five occupations
Occupation
Number of non-
BA good jobs
Share of non-BA
good jobs
Share of non-BA
workers with good jobs
Median
earnings
Office and administrative support 14,000 15% 35% $53,000
Management 13,000 14% 65% $67,000
Sales and related 9,000 10% 40% $51,000
Healthcare practitioners and technical 8,000 8% 68% $61,000
Construction and extraction 7,000 8% 45% $58,000
Source: Georgetown University Center on Education and the Workforce analysis of Bureau of the Census, American Community Survey
microdata 2013-2015.
Note: Figures in charts and tables may not sum due to rounding.
Good Jobs That Pay without a BA | A State-by-State Analysis39
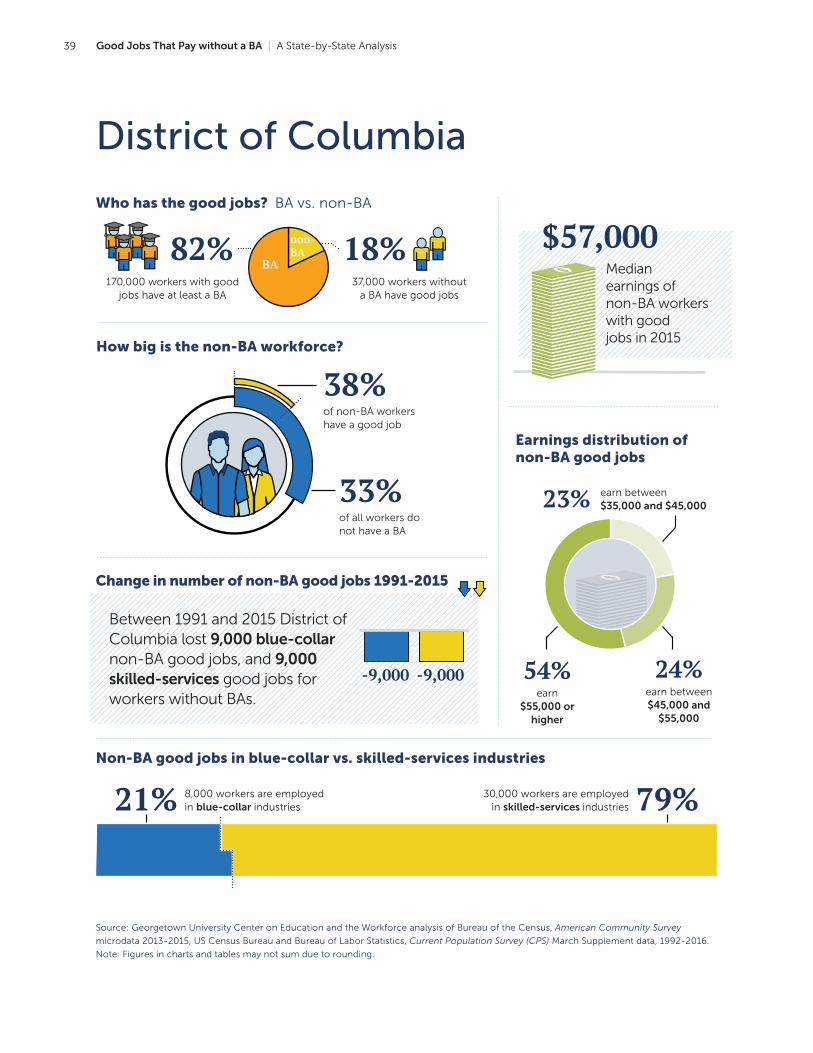
District of Columbia
Source: Georgetown University Center on Education and the Workforce analysis of Bureau of the Census, American Community Survey
microdata 2013-2015, US Census Bureau and Bureau of Labor Statistics, Current Population Survey (CPS) March Supplement data, 1992-2016.
Note: Figures in charts and tables may not sum due to rounding.
79%8,000 workers are employed in blue-collar industries21% 30,000 workers are employed
in skilled-services industries
earn between $35,000 and $45,000
$57,000Median earnings of non-BA workers with good jobs in 2015
23%
24%54%earn between $45,000 and
$55,000
earn $55,000 or
higher
Between 1991 and 2015 District of Columbia lost 9,000 blue-collar non-BA good jobs, and 9,000 skilled-services good jobs for workers without BAs.
-9,000 -9,000
82%170,000 workers with good
jobs have at least a BA
BA
non- BA 18%
37,000 workers without a BA have good jobs
33%of all workers do not have a BA
38%of non-BA workers have a good job
How big is the non-BA workforce?
Who has the good jobs? BA vs. non-BA
Earnings distribution of non-BA good jobs
Change in number of non-BA good jobs 1991-2015
Non-BA good jobs in blue-collar vs. skilled-services industries

A State-by-State Analysis | Good Jobs That Pay without a BA 40
Jobs by educational attainment
Educational attainment
Number of
workers
Workers with
good jobs
Median
earnings
Median earnings of
workers with good jobs
Non-BA Workers
Less than high school 15,000 3,000 $23,000 $50,000
High school graduate 39,000 12,000 $29,000 $56,000
Some college 35,000 17,000 $37,000 $61,000
Associate's degree 10,000 5,000 $40,000 $56,000
All non-BA workers 100,000 37,000 $31,000 $57,000
BA+ Workers
Bachelor’s or higher 201,000 170,000 $75,000 $86,000
All workers 301,000 207,000 $57,000 $80,000
Top five industries
Industry
Number of non-
BA good jobs
Share of non-BA
good jobs
Share of non-BA
workers with good jobs
Median
earnings
Public administration 8,000 20% 70% $69,000
Health services 5,000 12% 31% $52,000
Professional and management services 4,000 12% 75% $63,000
Construction 3,000 8% 45% $50,000
Information, financial activities, and real estate 3,000 9% 49% $52,000
NON-BA GOOD JOBS
Top five occupations
Occupation
Number of non-
BA good jobs
Share of non-BA
good jobs
Share of non-BA
workers with good jobs
Median
earnings
Office and administrative support 6,000 16% 42% $55,000
Management 5,000 13% 73% $69,000
Business and financial operations 3,000 9% 82% $75,000
Protective service 3,000 7% 46% $58,000
Computer and mathematical 3,000 8% 89% $63,000
Source: Georgetown University Center on Education and the Workforce analysis of Bureau of the Census, American Community Survey
microdata 2013-2015.
Note: Figures in charts and tables may not sum due to rounding.

Good Jobs That Pay without a BA | A State-by-State Analysis41
Florida
Source: Georgetown University Center on Education and the Workforce analysis of Bureau of the Census, American Community Survey
microdata 2013-2015, US Census Bureau and Bureau of Labor Statistics, Current Population Survey (CPS) March Supplement data, 1992-2016.
Note: Figures in charts and tables may not sum due to rounding.
58%620,000 workers are employed in blue-collar industries42% 844,000 workers are employed
in skilled-services industries
earn between $35,000 and $45,000
$54,000Median earnings of non-BA workers with good jobs in 2015
23%
28%49%earn between $45,000 and
$55,000
earn $55,000 or
higher
Between 1991 and 2015 Florida gained 142,000 blue-collar non-BA good jobs, and 409,000 skilled-services good jobs for workers without BAs.
+142,000
+409,000
51%1,505,000 workers with
good jobs have at least a BA
BA non- BA
49%1,465,000 workers without
a BA have good jobs
68%of all workers do not have a BA
30%of non-BA workers have a good job
How big is the non-BA workforce?
Who has the good jobs? BA vs. non-BA
Earnings distribution of non-BA good jobs
Change in number of non-BA good jobs 1991-2015
Non-BA good jobs in blue-collar vs. skilled-services industries

A State-by-State Analysis | Good Jobs That Pay without a BA 42
Jobs by educational attainment
Educational attainment
Number of
workers
Workers with
good jobs
Median
earnings
Median earnings of
workers with good jobs
Non-BA Workers
Less than high school 564,000 79,000 $20,000 $50,000
High school graduate 1,913,000 483,000 $26,000 $52,000
Some college 1,535,000 547,000 $31,000 $56,000
Associate's degree 846,000 356,000 $34,000 $56,000
All non-BA workers 4,858,000 1,465,000 $27,000 $54,000
BA+ Workers
Bachelor’s or higher 2,333,000 1,505,000 $50,000 $68,000
All workers 7,191,000 2,969,000 $33,000 $60,000
Top five industries
Industry
Number of non-
BA good jobs
Share of non-BA
good jobs
Share of non-BA
workers with good jobs
Median
earnings
Information, financial activities, and real estate 189,000 13% 45% $56,000
Health services 181,000 12% 29% $52,000
Retail trade 157,000 11% 23% $52,000
Construction 141,000 10% 31% $52,000
Transportation and utilities 137,000 9% 44% $58,000
NON-BA GOOD JOBS
Top five occupations
Occupation
Number of non-
BA good jobs
Share of non-BA
good jobs
Share of non-BA
workers with good jobs
Median
earnings
Management 230,000 16% 62% $63,000
Office and administrative support 196,000 13% 24% $50,000
Sales and related 189,000 13% 32% $57,000
Healthcare practitioners and technical 112,000 8% 51% $56,000
Installation, maintenance, and repair 99,000 7% 44% $53,000
Source: Georgetown University Center on Education and the Workforce analysis of Bureau of the Census, American Community Survey
microdata 2013-2015.
Note: Figures in charts and tables may not sum due to rounding.
Good Jobs That Pay without a BA | A State-by-State Analysis43
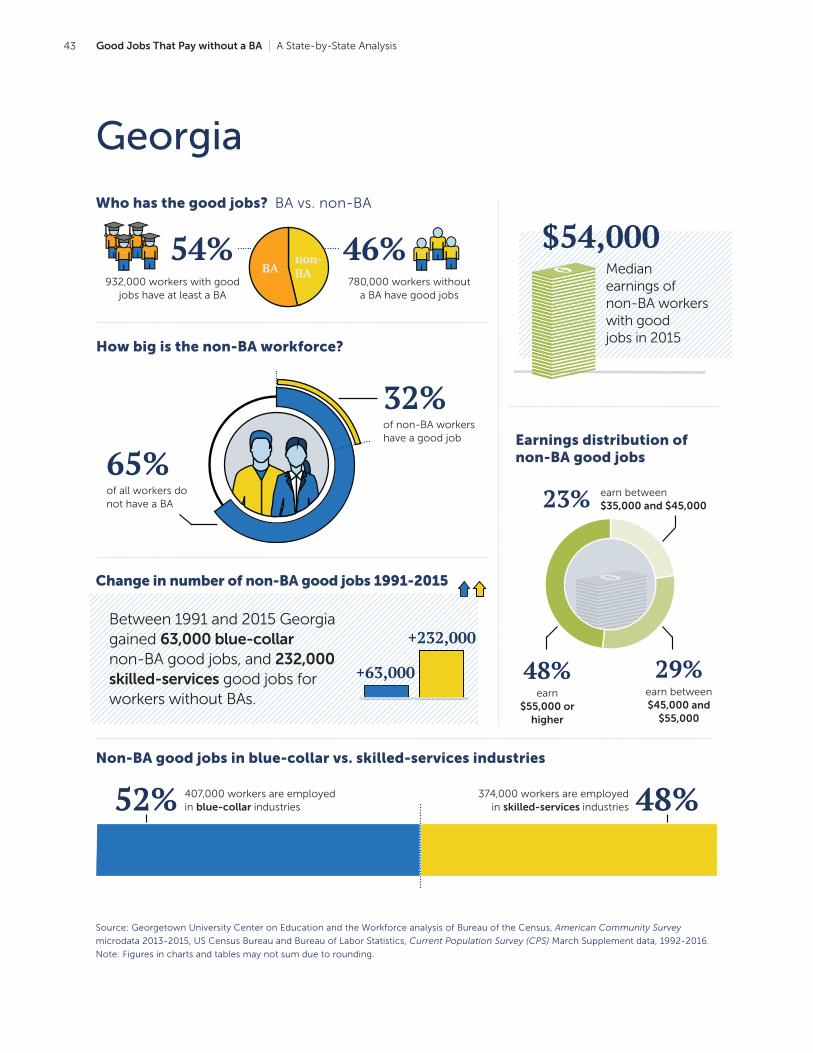
Georgia
Source: Georgetown University Center on Education and the Workforce analysis of Bureau of the Census, American Community Survey
microdata 2013-2015, US Census Bureau and Bureau of Labor Statistics, Current Population Survey (CPS) March Supplement data, 1992-2016.
Note: Figures in charts and tables may not sum due to rounding.
48%407,000 workers are employed in blue-collar industries52% 374,000 workers are employed
in skilled-services industries
earn between $35,000 and $45,000
$54,000Median earnings of non-BA workers with good jobs in 2015
23%
29%48%earn between $45,000 and
$55,000
earn $55,000 or
higher
Between 1991 and 2015 Georgia gained 63,000 blue-collar non-BA good jobs, and 232,000 skilled-services good jobs for workers without BAs.
+63,000
+232,000
54%932,000 workers with good
jobs have at least a BA
BAnon- BA
46%780,000 workers without
a BA have good jobs
65%of all workers do not have a BA
32%of non-BA workers have a good job
How big is the non-BA workforce?
Who has the good jobs? BA vs. non-BA
Earnings distribution of non-BA good jobs
Change in number of non-BA good jobs 1991-2015
Non-BA good jobs in blue-collar vs. skilled-services industries

A State-by-State Analysis | Good Jobs That Pay without a BA 44
Jobs by educational attainment
Educational attainment
Number of
workers
Workers with
good jobs
Median
earnings
Median earnings of
workers with good jobs
Non-BA Workers
Less than high school 325,000 48,000 $20,000 $50,000
High school graduate 938,000 267,000 $27,000 $52,000
Some college 842,000 318,000 $31,000 $55,000
Associate's degree 320,000 146,000 $36,000 $57,000
All non-BA workers 2,426,000 780,000 $28,000 $54,000
BA+ Workers
Bachelor’s or higher 1,334,000 932,000 $54,000 $71,000
All workers 3,760,000 1,712,000 $35,000 $61,000
Top five industries
Industry
Number of non-
BA good jobs
Share of non-BA
good jobs
Share of non-BA
workers with good jobs
Median
earnings
Manufacturing 130,000 17% 38% $53,000
Transportation and utilities 89,000 11% 47% $57,000
Information, financial ac-tivities, and real estate 85,000 11% 48% $60,000
Health services 80,000 10% 28% $51,000
Retail trade 76,000 10% 24% $52,000
NON-BA GOOD JOBS
Top five occupations
Occupation
Number of non-
BA good jobs
Share of non-BA
good jobs
Share of non-BA
workers with good jobs
Median
earnings
Management 107,000 14% 60% $66,000
Office and administrative support 103,000 13% 26% $50,000
Sales and related 87,000 11% 34% $57,000
Production 71,000 9% 30% $51,000
Transportation and material moving 68,000 9% 27% $52,000
Source: Georgetown University Center on Education and the Workforce analysis of Bureau of the Census, American Community Survey
microdata 2013-2015.
Note: Figures in charts and tables may not sum due to rounding.

Good Jobs That Pay without a BA | A State-by-State Analysis45
Hawaii
Source: Georgetown University Center on Education and the Workforce analysis of Bureau of the Census, American Community Survey
microdata 2013-2015, US Census Bureau and Bureau of Labor Statistics, Current Population Survey (CPS) March Supplement data, 1992-2016.
Note: Figures in charts and tables may not sum due to rounding.
59%56,000 workers are employed in blue-collar industries41% 82,000 workers are employed
in skilled-services industries
earn between $35,000 and $45,000
$57,000Median earnings of non-BA workers with good jobs in 2015
21%
26%53%earn between $45,000 and
$55,000
earn $55,000 or
higher-6,000
+1,000Between 1991 and 2015 Hawaii lost 6,000 blue-collar non-BA good jobs, but gained 1,000 skilled-services good jobs for workers without BAs.
49%131,000 workers with good
jobs have at least a BA
BA non- BA
51%138,000 workers without
a BA have good jobs
64%of all workers do not have a BA
40%of non-BA workers have a good job
How big is the non-BA workforce?
Who has the good jobs? BA vs. non-BA
Earnings distribution of non-BA good jobs
Change in number of non-BA good jobs 1991-2015
Non-BA good jobs in blue-collar vs. skilled-services industries

A State-by-State Analysis | Good Jobs That Pay without a BA 46
Jobs by educational attainment
Educational attainment
Number of
workers
Workers with
good jobs
Median
earnings
Median earnings of
workers with good jobs
Non-BA Workers
Less than high school 24,000 5,000 $24,000 $60,000
High school graduate 137,000 50,000 $31,000 $53,000
Some college 120,000 52,000 $36,000 $57,000
Associate's degree 63,000 31,000 $38,000 $60,000
All non-BA workers 345,000 138,000 $33,000 $57,000
BA+ Workers
Bachelor’s or higher 192,000 131,000 $52,000 $67,000
All workers 536,000 269,000 $39,000 $61,000
Top five industries
Industry
Number of non-
BA good jobs
Share of non-BA
good jobs
Share of non-BA
workers with good jobs
Median
earnings
Public administration 20,000 14% 68% $60,000
Construction 20,000 14% 58% $62,000
Food services 17,000 12% 29% $50,000
Information, financial activities, and real estate 13,000 10% 48% $61,000
Transportation and utilities 12,000 9% 51% $60,000
NON-BA GOOD JOBS
Top five occupations
Occupation
Number of non-
BA good jobs
Share of non-BA
good jobs
Share of non-BA
workers with good jobs
Median
earnings
Office and administrative support 18,000 13% 33% $51,000
Construction and extraction 17,000 12% 58% $62,000
Management 15,000 11% 62% $65,000
Sales and related 14,000 10% 35% $55,000
Installation, maintenance, and repair 10,000 8% 63% $60,000
Source: Georgetown University Center on Education and the Workforce analysis of Bureau of the Census, American Community Survey
microdata 2013-2015.
Note: Figures in charts and tables may not sum due to rounding.

Good Jobs That Pay without a BA | A State-by-State Analysis47
Idaho
Source: Georgetown University Center on Education and the Workforce analysis of Bureau of the Census, American Community Survey
microdata 2013-2015, US Census Bureau and Bureau of Labor Statistics, Current Population Survey (CPS) March Supplement data, 1992-2016.
Note: Figures in charts and tables may not sum due to rounding.
42%73,000 workers are employed in blue-collar industries58% 52,000 workers are employed
in skilled-services industries
earn between $35,000 and $45,000
$54,000Median earnings of non-BA workers with good jobs in 2015
23%
29%47%earn between $45,000 and
$55,000
earn $55,000 or
higher
Between 1991 and 2015 Idaho gained 34,000 blue-collar non-BA good jobs, and 37,000 skilled-services good jobs for workers without BAs.
+34,000 +37,000
46%106,000 workers with good
jobs have at least a BA
BA non- BA
54%126,000 workers without
a BA have good jobs
71%of all workers do not have a BA
30%of non-BA workers have a good job
How big is the non-BA workforce?
Who has the good jobs? BA vs. non-BA
Earnings distribution of non-BA good jobs
Change in number of non-BA good jobs 1991-2015
Non-BA good jobs in blue-collar vs. skilled-services industries

A State-by-State Analysis | Good Jobs That Pay without a BA 48
Jobs by educational attainment
Educational attainment
Number of
workers
Workers with
good jobs
Median
earnings
Median earnings of
workers with good jobs
Non-BA Workers
Less than high school 46,000 9,000 $22,000 $46,000
High school graduate 152,000 42,000 $26,000 $52,000
Some college 157,000 51,000 $29,000 $55,000
Associate's degree 62,000 24,000 $32,000 $56,000
All non-BA workers 417,000 126,000 $27,000 $54,000
BA+ Workers
Bachelor’s or higher 173,000 106,000 $48,000 $67,000
All workers 590,000 232,000 $31,000 $59,000
Top five industries
Industry
Number of non-
BA good jobs
Share of non-BA
good jobs
Share of non-BA
workers with good jobs
Median
earnings
Manufacturing 19,000 15% 38% $52,000
Construction 14,000 11% 36% $51,000
Transportation and utilities 13,000 11% 52% $60,000
Retail trade 13,000 10% 24% $52,000
Health services 11,000 9% 21% $52,000
NON-BA GOOD JOBS
Top five occupations
Occupation
Number of non-
BA good jobs
Share of non-BA
good jobs
Share of non-BA
workers with good jobs
Median
earnings
Management 16,000 13% 55% $61,000
Transportation and material moving 14,000 11% 34% $52,000
Sales and related 14,000 11% 31% $57,000
Construction and extraction 13,000 11% 38% $56,000
Office and administrative support 13,000 10% 19% $52,000
Source: Georgetown University Center on Education and the Workforce analysis of Bureau of the Census, American Community Survey
microdata 2013-2015.
Note: Figures in charts and tables may not sum due to rounding.

Good Jobs That Pay without a BA | A State-by-State Analysis49
Illinois
Source: Georgetown University Center on Education and the Workforce analysis of Bureau of the Census, American Community Survey
microdata 2013-2015, US Census Bureau and Bureau of Labor Statistics, Current Population Survey (CPS) March Supplement data, 1992-2016.
Note: Figures in charts and tables may not sum due to rounding.
44%664,000 workers are employed in blue-collar industries56% 520,000 workers are employed
in skilled-services industries
earn between $35,000 and $45,000
$58,000Median earnings of non-BA workers with good jobs in 2015
18%
27%56%earn between $45,000 and
$55,000
earn $55,000 or
higher-226,000
+34,000Between 1991 and 2015 Illinois lost 226,000 blue-collar non-BA good jobs, but gained 34,000 skilled-services good jobs for workers without BAs.
55%1,475,000 workers with
good jobs have at least a BA
BAnon- BA
45%1,184,000 workers without
a BA have good jobs
61%of all workers do not have a BA
38%of non-BA workers have a good job
How big is the non-BA workforce?
Who has the good jobs? BA vs. non-BA
Earnings distribution of non-BA good jobs
Change in number of non-BA good jobs 1991-2015
Non-BA good jobs in blue-collar vs. skilled-services industries

A State-by-State Analysis | Good Jobs That Pay without a BA 50
Jobs by educational attainment
Educational attainment
Number of
workers
Workers with
good jobs
Median
earnings
Median earnings of
workers with good jobs
Non-BA Workers
Less than high school 373,000 74,000 $22,000 $51,000
High school graduate 1,160,000 401,000 $30,000 $56,000
Some college 1,107,000 476,000 $35,000 $60,000
Associate's degree 474,000 233,000 $39,000 $60,000
All non-BA workers 3,114,000 1,184,000 $31,000 $58,000
BA+ Workers
Bachelor’s or higher 2,035,000 1,475,000 $60,000 $76,000
All workers 5,148,000 2,658,000 $40,000 $66,000
Top five industries
Industry
Number of non-
BA good jobs
Share of non-BA
good jobs
Share of non-BA
workers with good jobs
Median
earnings
Manufacturing 226,000 19% 45% $56,000
Transportation and utilities 147,000 12% 56% $60,000
Construction 134,000 11% 55% $62,000
Information, financial activities, and real estate 112,000 10% 50% $60,000
Health services 110,000 9% 27% $53,000
NON-BA GOOD JOBS
Top five occupations
Occupation
Number of non-
BA good jobs
Share of non-BA
good jobs
Share of non-BA
workers with good jobs
Median
earnings
Office and administrative support 167,000 14% 32% $52,000
Management 136,000 12% 66% $70,000
Production 127,000 11% 37% $53,000
Transportation and material moving 122,000 10% 36% $55,000
Construction and extraction 120,000 10% 56% $63,000
Source: Georgetown University Center on Education and the Workforce analysis of Bureau of the Census, American Community Survey
microdata 2013-2015.
Note: Figures in charts and tables may not sum due to rounding.

Good Jobs That Pay without a BA | A State-by-State Analysis51
Indiana
Source: Georgetown University Center on Education and the Workforce analysis of Bureau of the Census, American Community Survey
microdata 2013-2015, US Census Bureau and Bureau of Labor Statistics, Current Population Survey (CPS) March Supplement data, 1992-2016.
Note: Figures in charts and tables may not sum due to rounding.
36%404,000 workers are employed in blue-collar industries64% 224,000 workers are employed
in skilled-services industries
earn between $35,000 and $45,000
$55,000Median earnings of non-BA workers with good jobs in 2015
21%
29%51%earn between $45,000 and
$55,000
earn $55,000 or
higher-31,000
+128,000Between 1991 and 2015 Indiana lost 31,000 blue-collar non-BA good jobs, but gained 128,000 skilled-services good jobs for workers without BAs.
45%507,000 workers with good
jobs have at least a BA
BA non- BA
55%628,000 workers without
a BA have good jobs
70%of all workers do not have a BA
36%of non-BA workers have a good job
How big is the non-BA workforce?
Who has the good jobs? BA vs. non-BA
Earnings distribution of non-BA good jobs
Change in number of non-BA good jobs 1991-2015
Non-BA good jobs in blue-collar vs. skilled-services industries

A State-by-State Analysis | Good Jobs That Pay without a BA 52
Jobs by educational attainment
Educational attainment
Number of
workers
Workers with
good jobs
Median
earnings
Median earnings of
workers with good jobs
Non-BA Workers
Less than high school 171,000 34,000 $21,000 $51,000
High school graduate 765,000 251,000 $30,000 $54,000
Some college 572,000 218,000 $31,000 $56,000
Associate's degree 262,000 124,000 $38,000 $57,000
All non-BA workers 1,770,000 628,000 $31,000 $55,000
BA+ Workers
Bachelor’s or higher 763,000 507,000 $51,000 $67,000
All workers 2,533,000 1,135,000 $36,000 $60,000
Top five industries
Industry
Number of non-
BA good jobs
Share of non-BA
good jobs
Share of non-BA
workers with good jobs
Median
earnings
Manufacturing 203,000 32% 48% $57,000
Construction 63,000 10% 48% $57,000
Health services 62,000 10% 26% $51,000
Transportation and utilities 60,000 10% 52% $60,000
Retail trade 46,000 7% 22% $52,000
NON-BA GOOD JOBS
Top five occupations
Occupation
Number of non-
BA good jobs
Share of non-BA
good jobs
Share of non-BA
workers with good jobs
Median
earnings
Production 117,000 19% 42% $53,000
Management 70,000 11% 62% $63,000
Transportation and material moving 68,000 11% 35% $53,000
Office and administrative support 61,000 10% 23% $51,000
Construction and extraction 56,000 9% 49% $58,000
Source: Georgetown University Center on Education and the Workforce analysis of Bureau of the Census, American Community Survey
microdata 2013-2015.
Note: Figures in charts and tables may not sum due to rounding.

Good Jobs That Pay without a BA | A State-by-State Analysis53
Iowa
Source: Georgetown University Center on Education and the Workforce analysis of Bureau of the Census, American Community Survey
microdata 2013-2015, US Census Bureau and Bureau of Labor Statistics, Current Population Survey (CPS) March Supplement data, 1992-2016.
Note: Figures in charts and tables may not sum due to rounding.
35%206,000 workers are employed in blue-collar industries65% 111,000 workers are employed
in skilled-services industries
earn between $35,000 and $45,000
$53,000Median earnings of non-BA workers with good jobs in 2015
22%
32%47%earn between $45,000 and
$55,000
earn $55,000 or
higher-3,000
+65,000Between 1991 and 2015 Iowa lost 3,000 blue-collar non-BA good jobs, but gained 65,000 skilled-services good jobs for workers without BAs.
46%276,000 workers with good
jobs have at least a BA
BA non- BA
54%319,000 workers without
a BA have good jobs
68%of all workers do not have a BA
38%of non-BA workers have a good job
How big is the non-BA workforce?
Who has the good jobs? BA vs. non-BA
Earnings distribution of non-BA good jobs
Change in number of non-BA good jobs 1991-2015
Non-BA good jobs in blue-collar vs. skilled-services industries

A State-by-State Analysis | Good Jobs That Pay without a BA 54
Jobs by educational attainment
Educational attainment
Number of
workers
Workers with
good jobs
Median
earnings
Median earnings of
workers with good jobs
Non-BA Workers
Less than high school 59,000 13,000 $25,000 $50,000
High school graduate 331,000 113,000 $31,000 $52,000
Some college 275,000 108,000 $33,000 $55,000
Associate's degree 173,000 85,000 $38,000 $54,000
All non-BA workers 837,000 319,000 $33,000 $53,000
BA+ Workers
Bachelor’s or higher 401,000 276,000 $52,000 $65,000
All workers 1,238,000 594,000 $38,000 $58,000
Top five industries
Industry
Number of non-
BA good jobs
Share of non-BA
good jobs
Share of non-BA
workers with good jobs
Median
earnings
Manufacturing 84,000 26% 48% $52,000
Construction 38,000 12% 53% $53,000
Transportation and utilities 31,000 10% 60% $60,000
Health services 30,000 10% 26% $51,000
Information, financial activities, and real estate 28,000 9% 43% $55,000
NON-BA GOOD JOBS
Top five occupations
Occupation
Number of non-
BA good jobs
Share of non-BA
good jobs
Share of non-BA
workers with good jobs
Median
earnings
Production 47,000 15% 40% $51,000
Management 37,000 12% 61% $65,000
Office and administrative support 35,000 11% 26% $50,000
Transportation and material moving 34,000 11% 39% $51,000
Sales and related 31,000 10% 41% $56,000
Source: Georgetown University Center on Education and the Workforce analysis of Bureau of the Census, American Community Survey
microdata 2013-2015.
Note: Figures in charts and tables may not sum due to rounding.

Good Jobs That Pay without a BA | A State-by-State Analysis55
Kansas
Source: Georgetown University Center on Education and the Workforce analysis of Bureau of the Census, American Community Survey
microdata 2013-2015, US Census Bureau and Bureau of Labor Statistics, Current Population Survey (CPS) March Supplement data, 1992-2016.
Note: Figures in charts and tables may not sum due to rounding.
39%152,000 workers are employed in blue-collar industries61% 98,000 workers are employed
in skilled-services industries
earn between $35,000 and $45,000
$55,000Median earnings of non-BA workers with good jobs in 2015
22%
29%49%earn between $45,000 and
$55,000
earn $55,000 or
higher-37,000
+32,000Between 1991 and 2015 Kansas lost 37,000 blue-collar non-BA good jobs, but gained 32,000 skilled-services good jobs for workers without BAs.
53%279,000 workers with good
jobs have at least a BA
BAnon- BA
47%249,000 workers without
a BA have good jobs
64%of all workers do not have a BA
35%of non-BA workers have a good job
How big is the non-BA workforce?
Who has the good jobs? BA vs. non-BA
Earnings distribution of non-BA good jobs
Change in number of non-BA good jobs 1991-2015
Non-BA good jobs in blue-collar vs. skilled-services industries

A State-by-State Analysis | Good Jobs That Pay without a BA 56
Jobs by educational attainment
Educational attainment
Number of
workers
Workers with
good jobs
Median
earnings
Median earnings of
workers with good jobs
Non-BA Workers
Less than high school 77,000 15,000 $24,000 $48,000
High school graduate 253,000 79,000 $30,000 $54,000
Some college 278,000 106,000 $32,000 $56,000
Associate's degree 106,000 49,000 $36,000 $55,000
All non-BA workers 715,000 249,000 $31,000 $55,000
BA+ Workers
Bachelor’s or higher 409,000 279,000 $51,000 $67,000
All workers 1,124,000 528,000 $37,000 $60,000
Top five industries
Industry
Number of non-
BA good jobs
Share of non-BA
good jobs
Share of non-BA
workers with good jobs
Median
earnings
Manufacturing 57,000 23% 47% $55,000
Construction 27,000 11% 42% $55,000
Transportation and utilities 27,000 11% 56% $61,000
Health services 24,000 10% 25% $51,000
Information, financial activities, and real estate 20,000 8% 41% $60,000
NON-BA GOOD JOBS
Top five occupations
Occupation
Number of non-
BA good jobs
Share of non-BA
good jobs
Share of non-BA
workers with good jobs
Median
earnings
Management 33,000 13% 64% $62,000
Production 30,000 12% 39% $52,000
Office and administrative support 27,000 11% 23% $51,000
Transportation and material moving 26,000 10% 37% $55,000
Construction and extraction 24,000 10% 40% $54,000
Source: Georgetown University Center on Education and the Workforce analysis of Bureau of the Census, American Community Survey
microdata 2013-2015.
Note: Figures in charts and tables may not sum due to rounding.

Good Jobs That Pay without a BA | A State-by-State Analysis57
Kentucky
Source: Georgetown University Center on Education and the Workforce analysis of Bureau of the Census, American Community Survey
microdata 2013-2015, US Census Bureau and Bureau of Labor Statistics, Current Population Survey (CPS) March Supplement data, 1992-2016.
Note: Figures in charts and tables may not sum due to rounding.
38%227,000 workers are employed in blue-collar industries62% 140,000 workers are employed
in skilled-services industries
earn between $35,000 and $45,000
$54,000Median earnings of non-BA workers with good jobs in 2015
21%
30%49%earn between $45,000 and
$55,000
earn $55,000 or
higher
Between 1991 and 2015 Kentucky gained 7,000 blue-collar non-BA good jobs, and 33,000 skilled-services good jobs for workers without BAs.
+7,000
+33,000
46%313,000 workers with good
jobs have at least a BA
BA non- BA
54%367,000 workers without
a BA have good jobs
70%of all workers do not have a BA
33%of non-BA workers have a good job
How big is the non-BA workforce?
Who has the good jobs? BA vs. non-BA
Earnings distribution of non-BA good jobs
Change in number of non-BA good jobs 1991-2015
Non-BA good jobs in blue-collar vs. skilled-services industries

A State-by-State Analysis | Good Jobs That Pay without a BA 58
Jobs by educational attainment
Educational attainment
Number of
workers
Workers with
good jobs
Median
earnings
Median earnings of
workers with good jobs
Non-BA Workers
Less than high school 109,000 19,000 $20,000 $52,000
High school graduate 480,000 147,000 $28,000 $54,000
Some college 363,000 128,000 $30,000 $54,000
Associate's degree 162,000 72,000 $35,000 $56,000
All non-BA workers 1,115,000 367,000 $29,000 $54,000
BA+ Workers
Bachelor’s or higher 472,000 313,000 $50,000 $64,000
All workers 1,586,000 680,000 $34,000 $59,000
Top five industries
Industry
Number of non-
BA good jobs
Share of non-BA
good jobs
Share of non-BA
workers with good jobs
Median
earnings
Manufacturing 96,000 26% 47% $56,000
Transportation and utilities 41,000 11% 49% $59,000
Health services 39,000 11% 25% $51,000
Construction 33,000 9% 43% $56,000
Information, financial activities, and real estate 28,000 8% 41% $53,000
NON-BA GOOD JOBS
Top five occupations
Occupation
Number of non-
BA good jobs
Share of non-BA
good jobs
Share of non-BA
workers with good jobs
Median
earnings
Production 59,000 16% 40% $52,000
Transportation and material moving 40,000 11% 34% $53,000
Management 40,000 11% 59% $66,000
Office and administrative support 39,000 11% 22% $50,000
Construction and extraction 36,000 10% 46% $60,000
Source: Georgetown University Center on Education and the Workforce analysis of Bureau of the Census, American Community Survey
microdata 2013-2015.
Note: Figures in charts and tables may not sum due to rounding.

Good Jobs That Pay without a BA | A State-by-State Analysis59
Louisiana
Source: Georgetown University Center on Education and the Workforce analysis of Bureau of the Census, American Community Survey
microdata 2013-2015, US Census Bureau and Bureau of Labor Statistics, Current Population Survey (CPS) March Supplement data, 1992-2016.
Note: Figures in charts and tables may not sum due to rounding.
40%261,000 workers are employed in blue-collar industries60% 171,000 workers are employed
in skilled-services industries
earn between $35,000 and $45,000
$60,000Median earnings of non-BA workers with good jobs in 2015
17%
25%58%earn between $45,000 and
$55,000
earn $55,000 or
higher
Between 1991 and 2015 Louisiana gained 43,000 blue-collar non-BA good jobs, and 111,000 skilled-services good jobs for workers without BAs.
+43,000
+111,000
43%330,000 workers with good
jobs have at least a BA
BA non- BA
57%435,000 workers without
a BA have good jobs
71%of all workers do not have a BA
36%of non-BA workers have a good job
How big is the non-BA workforce?
Who has the good jobs? BA vs. non-BA
Earnings distribution of non-BA good jobs
Change in number of non-BA good jobs 1991-2015
Non-BA good jobs in blue-collar vs. skilled-services industries

A State-by-State Analysis | Good Jobs That Pay without a BA 60
Jobs by educational attainment
Educational attainment
Number of
workers
Workers with
good jobs
Median
earnings
Median earnings of
workers with good jobs
Non-BA Workers
Less than high school 155,000 36,000 $20,000 $56,000
High school graduate 528,000 185,000 $28,000 $61,000
Some college 393,000 155,000 $31,000 $60,000
Associate's degree 119,000 58,000 $37,000 $60,000
All non-BA workers 1,195,000 435,000 $30,000 $60,000
BA+ Workers
Bachelor’s or higher 480,000 330,000 $50,000 $65,000
All workers 1,675,000 764,000 $36,000 $61,000
Top five industries
Industry
Number of non-
BA good jobs
Share of non-BA
good jobs
Share of non-BA
workers with good jobs
Median
earnings
Manufacturing 68,000 16% 58% $65,000
Construction 54,000 13% 45% $61,000
Natural resources 48,000 11% 68% $77,000
Transportation and utilities 44,000 10% 56% $61,000
Health services 40,000 9% 24% $52,000
NON-BA GOOD JOBS
Top five occupations
Occupation
Number of non-
BA good jobs
Share of non-BA
good jobs
Share of non-BA
workers with good jobs
Median
earnings
Construction and extraction 63,000 14% 51% $66,000
Production 51,000 12% 53% $62,000
Management 50,000 11% 64% $70,000
Office and administrative support 45,000 10% 25% $52,000
Transportation and material moving 42,000 10% 41% $60,000
Source: Georgetown University Center on Education and the Workforce analysis of Bureau of the Census, American Community Survey
microdata 2013-2015.
Note: Figures in charts and tables may not sum due to rounding.
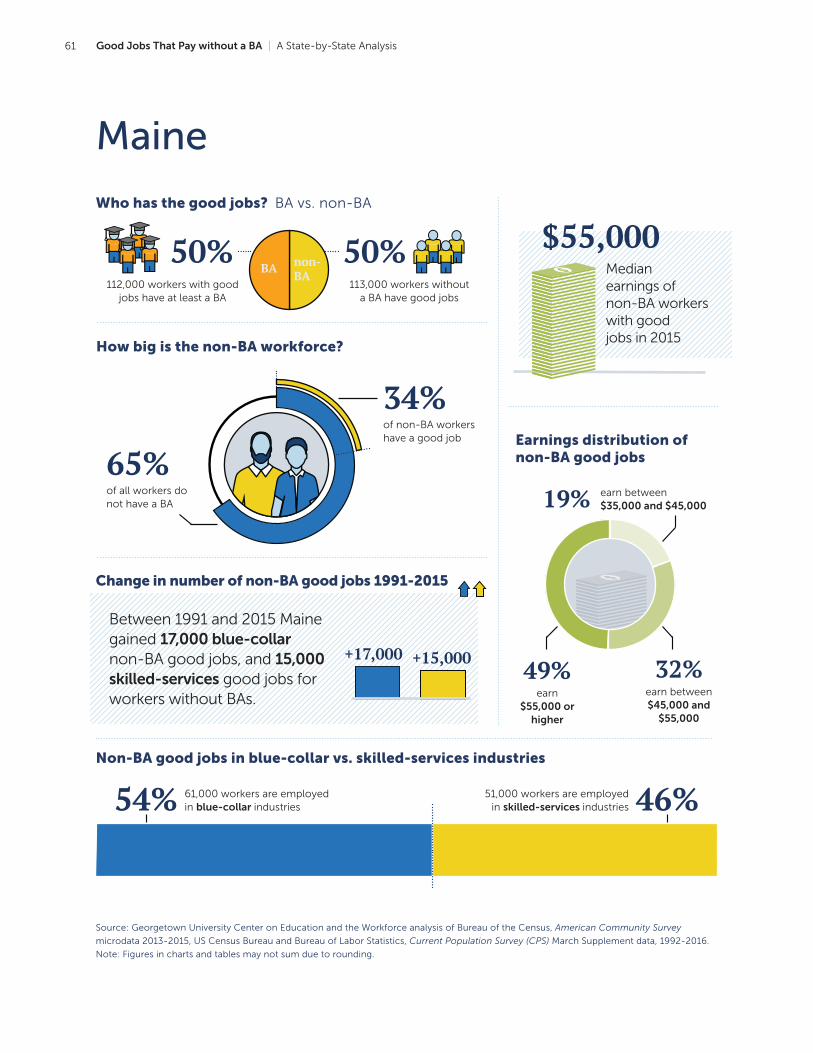
Good Jobs That Pay without a BA | A State-by-State Analysis61
Maine
Source: Georgetown University Center on Education and the Workforce analysis of Bureau of the Census, American Community Survey
microdata 2013-2015, US Census Bureau and Bureau of Labor Statistics, Current Population Survey (CPS) March Supplement data, 1992-2016.
Note: Figures in charts and tables may not sum due to rounding.
46%61,000 workers are employed in blue-collar industries54% 51,000 workers are employed
in skilled-services industries
earn between $35,000 and $45,000
$55,000Median earnings of non-BA workers with good jobs in 2015
19%
32%49%earn between $45,000 and
$55,000
earn $55,000 or
higher
Between 1991 and 2015 Maine gained 17,000 blue-collar non-BA good jobs, and 15,000 skilled-services good jobs for workers without BAs.
+17,000 +15,000
50%112,000 workers with good
jobs have at least a BA
BA non- BA
50%113,000 workers without
a BA have good jobs
65%of all workers do not have a BA
34%of non-BA workers have a good job
How big is the non-BA workforce?
Who has the good jobs? BA vs. non-BA
Earnings distribution of non-BA good jobs
Change in number of non-BA good jobs 1991-2015
Non-BA good jobs in blue-collar vs. skilled-services industries

A State-by-State Analysis | Good Jobs That Pay without a BA 62
Jobs by educational attainment
Educational attainment
Number of
workers
Workers with
good jobs
Median
earnings
Median earnings of
workers with good jobs
Non-BA Workers
Less than high school 16,000 3,000 $21,000 $52,000
High school graduate 147,000 41,000 $28,000 $52,000
Some college 108,000 39,000 $31,000 $55,000
Associate's degree 64,000 30,000 $38,000 $55,000
All non-BA workers 335,000 113,000 $31,000 $55,000
BA+ Workers
Bachelor’s or higher 178,000 112,000 $48,000 $65,000
All workers 513,000 225,000 $35,000 $60,000
Top five industries
Industry
Number of non-
BA good jobs
Share of non-BA
good jobs
Share of non-BA
workers with good jobs
Median
earnings
Manufacturing 22,000 19% 53% $60,000
Health services 14,000 12% 24% $52,000
Retail trade 13,000 11% 24% $51,000
Construction 12,000 10% 40% $55,000
Information, financial activities, and real estate 11,000 10% 46% $54,000
NON-BA GOOD JOBS
Top five occupations
Occupation
Number of non-
BA good jobs
Share of non-BA
good jobs
Share of non-BA
workers with good jobs
Median
earnings
Management 16,000 14% 63% $65,000
Office and administrative support 14,000 12% 24% $52,000
Sales and related 11,000 10% 32% $55,000
Production 11,000 10% 40% $58,000
Construction and extraction 10,000 9% 42% $52,000
Source: Georgetown University Center on Education and the Workforce analysis of Bureau of the Census, American Community Survey
microdata 2013-2015.
Note: Figures in charts and tables may not sum due to rounding.

Good Jobs That Pay without a BA | A State-by-State Analysis63
Maryland
Source: Georgetown University Center on Education and the Workforce analysis of Bureau of the Census, American Community Survey
microdata 2013-2015, US Census Bureau and Bureau of Labor Statistics, Current Population Survey (CPS) March Supplement data, 1992-2016.
Note: Figures in charts and tables may not sum due to rounding.
62%245,000 workers are employed in blue-collar industries38% 397,000 workers are employed
in skilled-services industries
earn between $35,000 and $45,000
$60,000Median earnings of non-BA workers with good jobs in 2015
16%
25%59%earn between $45,000 and
$55,000
earn $55,000 or
higher-103,000
+32,000Between 1991 and 2015 Maryland lost 103,000 blue-collar non-BA good jobs, but gained 32,000 skilled-services good jobs for workers without BAs.
57%865,000 workers with good
jobs have at least a BA
BAnon- BA
43%641,000 workers without
a BA have good jobs
56%of all workers do not have a BA
46%of non-BA workers have a good job
How big is the non-BA workforce?
Who has the good jobs? BA vs. non-BA
Earnings distribution of non-BA good jobs
Change in number of non-BA good jobs 1991-2015
Non-BA good jobs in blue-collar vs. skilled-services industries

A State-by-State Analysis | Good Jobs That Pay without a BA 64
Jobs by educational attainment
Educational attainment
Number of
workers
Workers with
good jobs
Median
earnings
Median earnings of
workers with good jobs
Non-BA Workers
Less than high school 159,000 38,000 $25,000 $52,000
High school graduate 566,000 234,000 $34,000 $57,000
Some college 496,000 266,000 $41,000 $62,000
Associate's degree 182,000 104,000 $44,000 $65,000
All non-BA workers 1,402,000 641,000 $36,000 $60,000
BA+ Workers
Bachelor’s or higher 1,107,000 865,000 $70,000 $83,000
All workers 2,509,000 1,506,000 $48,000 $71,000
Top five industries
Industry
Number of non-
BA good jobs
Share of non-BA
good jobs
Share of non-BA
workers with good jobs
Median
earnings
Public administration 98,000 15% 76% $71,000
Construction 75,000 12% 51% $58,000
Health services 72,000 11% 37% $54,000
Information, financial activities, and real estate 61,000 10% 59% $62,000
Professional and management services 58,000 9% 70% $70,000
NON-BA GOOD JOBS
Top five occupations
Occupation
Number of non-
BA good jobs
Share of non-BA
good jobs
Share of non-BA
workers with good jobs
Median
earnings
Office and administrative support 106,000 17% 44% $55,000
Management 86,000 13% 76% $73,000
Construction and extraction 53,000 8% 47% $55,000
Sales and related 52,000 8% 40% $58,000
Installation, maintenance, and repair 44,000 7% 64% $60,000
Source: Georgetown University Center on Education and the Workforce analysis of Bureau of the Census, American Community Survey
microdata 2013-2015.
Note: Figures in charts and tables may not sum due to rounding.

Good Jobs That Pay without a BA | A State-by-State Analysis65
Massachusetts
Source: Georgetown University Center on Education and the Workforce analysis of Bureau of the Census, American Community Survey
microdata 2013-2015, US Census Bureau and Bureau of Labor Statistics, Current Population Survey (CPS) March Supplement data, 1992-2016.
Note: Figures in charts and tables may not sum due to rounding.
54%294,000 workers are employed in blue-collar industries46% 341,000 workers are employed
in skilled-services industries
earn between $35,000 and $45,000
$60,000Median earnings of non-BA workers with good jobs in 2015
15%
26%59%earn between $45,000 and
$55,000
earn $55,000 or
higher
Between 1991 and 2015 Massachusetts lost 105,000 blue-collar non-BA good jobs, and 20,000 skilled-services good jobs for workers without BAs. -105,000
-20,000
62%1,035,000 workers with
good jobs have at least a BA
BA
non- BA
38%633,000 workers without
a BA have good jobs
51%of all workers do not have a BA
44%of non-BA workers have a good job
How big is the non-BA workforce?
Who has the good jobs? BA vs. non-BA
Earnings distribution of non-BA good jobs
Change in number of non-BA good jobs 1991-2015
Non-BA good jobs in blue-collar vs. skilled-services industries

A State-by-State Analysis | Good Jobs That Pay without a BA 66
Jobs by educational attainment
Educational attainment
Number of
workers
Workers with
good jobs
Median
earnings
Median earnings of
workers with good jobs
Non-BA Workers
Less than high school 139,000 33,000 $24,000 $52,000
High school graduate 600,000 245,000 $34,000 $58,000
Some college 450,000 222,000 $39,000 $61,000
Associate's degree 237,000 132,000 $43,000 $63,000
All non-BA workers 1,426,000 633,000 $36,000 $60,000
BA+ Workers
Bachelor’s or higher 1,357,000 1,035,000 $66,000 $80,000
All workers 2,783,000 1,668,000 $49,000 $71,000
Top five industries
Industry
Number of non-
BA good jobs
Share of non-BA
good jobs
Share of non-BA
workers with good jobs
Median
earnings
Health services 96,000 15% 38% $57,000
Manufacturing 89,000 14% 53% $59,000
Construction 69,000 11% 58% $62,000
Information, financial activities, and real estate 65,000 10% 62% $63,000
Retail trade 60,000 10% 35% $57,000
NON-BA GOOD JOBS
Top five occupations
Occupation
Number of non-
BA good jobs
Share of non-BA
good jobs
Share of non-BA
workers with good jobs
Median
earnings
Office and administrative support 95,000 15% 40% $53,000
Management 76,000 12% 75% $72,000
Construction and extraction 59,000 9% 58% $62,000
Sales and related 56,000 9% 43% $62,000
Production 50,000 8% 42% $54,000
Source: Georgetown University Center on Education and the Workforce analysis of Bureau of the Census, American Community Survey
microdata 2013-2015.
Note: Figures in charts and tables may not sum due to rounding.
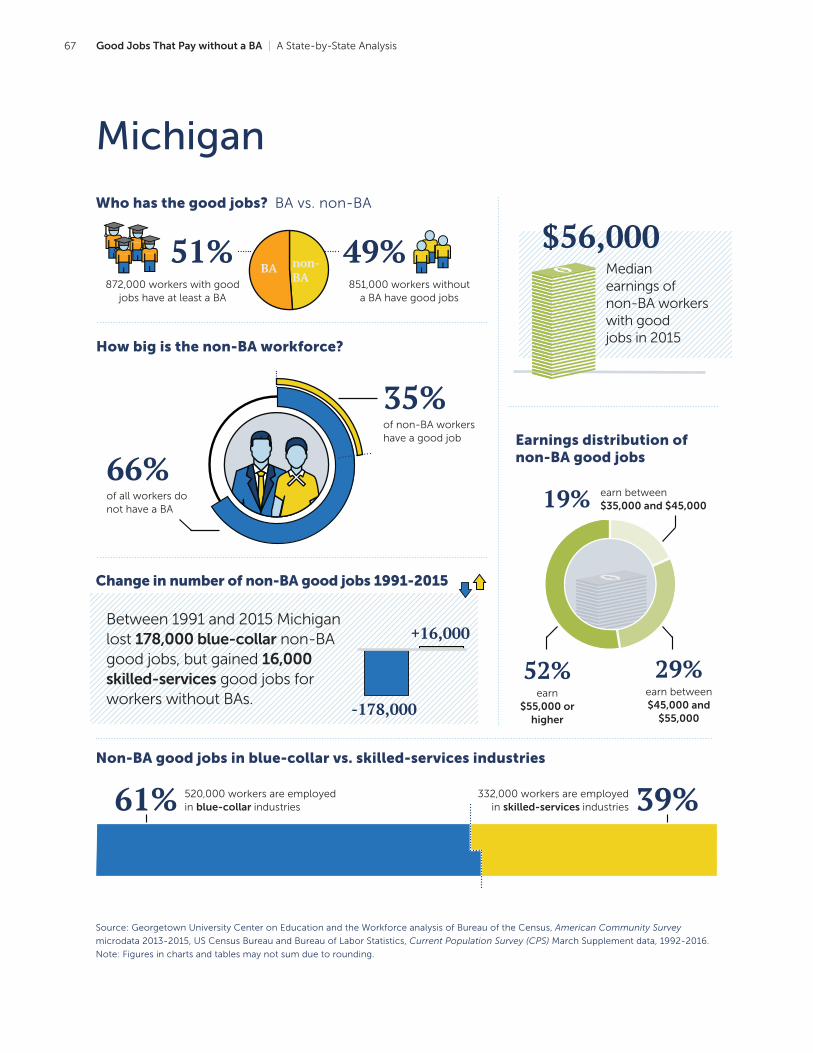
Good Jobs That Pay without a BA | A State-by-State Analysis67
Michigan
Source: Georgetown University Center on Education and the Workforce analysis of Bureau of the Census, American Community Survey
microdata 2013-2015, US Census Bureau and Bureau of Labor Statistics, Current Population Survey (CPS) March Supplement data, 1992-2016.
Note: Figures in charts and tables may not sum due to rounding.
39%520,000 workers are employed in blue-collar industries61% 332,000 workers are employed
in skilled-services industries
earn between $35,000 and $45,000
$56,000Median earnings of non-BA workers with good jobs in 2015
19%
29%52%earn between $45,000 and
$55,000
earn $55,000 or
higher-178,000
+16,000Between 1991 and 2015 Michigan lost 178,000 blue-collar non-BA good jobs, but gained 16,000 skilled-services good jobs for workers without BAs.
51%872,000 workers with good
jobs have at least a BA
BA non- BA
49%851,000 workers without
a BA have good jobs
66%of all workers do not have a BA
35%of non-BA workers have a good job
How big is the non-BA workforce?
Who has the good jobs? BA vs. non-BA
Earnings distribution of non-BA good jobs
Change in number of non-BA good jobs 1991-2015
Non-BA good jobs in blue-collar vs. skilled-services industries

A State-by-State Analysis | Good Jobs That Pay without a BA 68
Jobs by educational attainment
Educational attainment
Number of
workers
Workers with
good jobs
Median
earnings
Median earnings of
workers with good jobs
Non-BA Workers
Less than high school 192,000 37,000 $20,000 $52,000
High school graduate 903,000 271,000 $28,000 $54,000
Some college 932,000 358,000 $31,000 $57,000
Associate's degree 409,000 186,000 $36,000 $59,000
All non-BA workers 2,436,000 851,000 $30,000 $56,000
BA+ Workers
Bachelor’s or higher 1,251,000 872,000 $56,000 $72,000
All workers 3,686,000 1,723,000 $36,000 $62,000
Top five industries
Industry
Number of non-
BA good jobs
Share of non-BA
good jobs
Share of non-BA
workers with good jobs
Median
earnings
Manufacturing 264,000 31% 50% $60,000
Health services 90,000 11% 26% $52,000
Construction 77,000 9% 48% $57,000
Transportation and utilities 73,000 9% 53% $60,000
Retail trade 66,000 8% 22% $52,000
NON-BA GOOD JOBS
Top five occupations
Occupation
Number of non-
BA good jobs
Share of non-BA
good jobs
Share of non-BA
workers with good jobs
Median
earnings
Production 143,000 17% 40% $55,000
Office and administrative support 99,000 12% 26% $51,000
Management 95,000 11% 61% $66,000
Transportation and material moving 73,000 9% 34% $53,000
Sales and related 73,000 9% 30% $57,000
Source: Georgetown University Center on Education and the Workforce analysis of Bureau of the Census, American Community Survey
microdata 2013-2015.
Note: Figures in charts and tables may not sum due to rounding.

Good Jobs That Pay without a BA | A State-by-State Analysis69
Minnesota
Source: Georgetown University Center on Education and the Workforce analysis of Bureau of the Census, American Community Survey
microdata 2013-2015, US Census Bureau and Bureau of Labor Statistics, Current Population Survey (CPS) March Supplement data, 1992-2016.
Note: Figures in charts and tables may not sum due to rounding.
43%334,000 workers are employed in blue-collar industries57% 257,000 workers are employed
in skilled-services industries
earn between $35,000 and $45,000
$56,000Median earnings of non-BA workers with good jobs in 2015
19%
29%52%earn between $45,000 and
$55,000
earn $55,000 or
higher
Between 1991 and 2015 Minnesota gained 14,000 blue-collar non-BA good jobs, and 70,000 skilled-services good jobs for workers without BAs.
+14,000
+70,000
53%671,000 workers with good
jobs have at least a BA
BAnon- BA
47%590,000 workers without
a BA have good jobs
61%of all workers do not have a BA
42%of non-BA workers have a good job
How big is the non-BA workforce?
Who has the good jobs? BA vs. non-BA
Earnings distribution of non-BA good jobs
Change in number of non-BA good jobs 1991-2015
Non-BA good jobs in blue-collar vs. skilled-services industries

A State-by-State Analysis | Good Jobs That Pay without a BA 70
Jobs by educational attainment
Educational attainment
Number of
workers
Workers with
good jobs
Median
earnings
Median earnings of
workers with good jobs
Non-BA Workers
Less than high school 100,000 21,000 $22,000 $51,000
High school graduate 503,000 181,000 $31,000 $54,000
Some college 508,000 220,000 $36,000 $56,000
Associate's degree 306,000 169,000 $41,000 $59,000
All non-BA workers 1,417,000 590,000 $35,000 $56,000
BA+ Workers
Bachelor’s or higher 922,000 671,000 $59,000 $72,000
All workers 2,339,000 1,261,000 $41,000 $62,000
Top five industries
Industry
Number of non-
BA good jobs
Share of non-BA
good jobs
Share of non-BA
workers with good jobs
Median
earnings
Manufacturing 124,000 21% 51% $55,000
Construction 72,000 12% 60% $60,000
Health services 66,000 11% 31% $52,000
Information, financial activities, and real estate 61,000 10% 57% $57,000
Transportation and utilities 55,000 9% 57% $60,000
NON-BA GOOD JOBS
Top five occupations
Occupation
Number of non-
BA good jobs
Share of non-BA
good jobs
Share of non-BA
workers with good jobs
Median
earnings
Office and administrative support 79,000 14% 34% $50,000
Management 71,000 12% 67% $68,000
Production 65,000 11% 41% $51,000
Construction and extraction 61,000 10% 61% $58,000
Sales and related 53,000 9% 42% $60,000
Source: Georgetown University Center on Education and the Workforce analysis of Bureau of the Census, American Community Survey
microdata 2013-2015.
Note: Figures in charts and tables may not sum due to rounding.

Good Jobs That Pay without a BA | A State-by-State Analysis71
Mississippi
Source: Georgetown University Center on Education and the Workforce analysis of Bureau of the Census, American Community Survey
microdata 2013-2015, US Census Bureau and Bureau of Labor Statistics, Current Population Survey (CPS) March Supplement data, 1992-2016.
Note: Figures in charts and tables may not sum due to rounding.
39%135,000 workers are employed in blue-collar industries61% 88,000 workers are employed
in skilled-services industries
earn between $35,000 and $45,000
$53,000Median earnings of non-BA workers with good jobs in 2015
24%
29%47%earn between $45,000 and
$55,000
earn $55,000 or
higher
Between 1991 and 2015 Mississippi gained 20,000 blue-collar non-BA good jobs, and 45,000 skilled-services good jobs for workers without BAs.
+20,000+45,000
42%161,000 workers with good
jobs have at least a BA
BA non- BA
58%223,000 workers without
a BA have good jobs
74%of all workers do not have a BA
30%of non-BA workers have a good job
How big is the non-BA workforce?
Who has the good jobs? BA vs. non-BA
Earnings distribution of non-BA good jobs
Change in number of non-BA good jobs 1991-2015
Non-BA good jobs in blue-collar vs. skilled-services industries

A State-by-State Analysis | Good Jobs That Pay without a BA 72
Jobs by educational attainment
Educational attainment
Number of
workers
Workers with
good jobs
Median
earnings
Median earnings of
workers with good jobs
Non-BA Workers
Less than high school 88,000 14,000 $20,000 $52,000
High school graduate 279,000 80,000 $26,000 $53,000
Some college 253,000 82,000 $30,000 $54,000
Associate's degree 120,000 46,000 $31,000 $53,000
All non-BA workers 740,000 223,000 $27,000 $53,000
BA+ Workers
Bachelor’s or higher 264,000 161,000 $44,000 $61,000
All workers 1,004,000 383,000 $31,000 $56,000
Top five industries
Industry
Number of non-
BA good jobs
Share of non-BA
good jobs
Share of non-BA
workers with good jobs
Median
earnings
Manufacturing 48,000 22% 37% $52,000
Health services 28,000 12% 27% $51,000
Transportation and utilities 25,000 11% 53% $59,000
Construction 22,000 10% 38% $55,000
Retail trade 17,000 8% 19% $51,000
NON-BA GOOD JOBS
Top five occupations
Occupation
Number of non-
BA good jobs
Share of non-BA
good jobs
Share of non-BA
workers with good jobs
Median
earnings
Production 29,000 13% 31% $52,000
Construction and extraction 25,000 11% 43% $54,000
Management 25,000 11% 55% $66,000
Transportation and material moving 23,000 11% 32% $53,000
Office and administrative support 22,000 10% 21% $50,000
Source: Georgetown University Center on Education and the Workforce analysis of Bureau of the Census, American Community Survey
microdata 2013-2015.
Note: Figures in charts and tables may not sum due to rounding.

Good Jobs That Pay without a BA | A State-by-State Analysis73
Missouri
Source: Georgetown University Center on Education and the Workforce analysis of Bureau of the Census, American Community Survey
microdata 2013-2015, US Census Bureau and Bureau of Labor Statistics, Current Population Survey (CPS) March Supplement data, 1992-2016.
Note: Figures in charts and tables may not sum due to rounding.
44%286,000 workers are employed in blue-collar industries56% 224,000 workers are employed
in skilled-services industries
earn between $35,000 and $45,000
$54,000Median earnings of non-BA workers with good jobs in 2015
21%
30%49%earn between $45,000 and
$55,000
earn $55,000 or
higher-70,000
+112,000Between 1991 and 2015 Missouri lost 70,000 blue-collar non-BA good jobs, but gained 112,000 skilled-services good jobs for workers without BAs.
51%522,000 workers with good
jobs have at least a BA
BA non- BA
49%508,000 workers without
a BA have good jobs
66%of all workers do not have a BA
33%of non-BA workers have a good job
How big is the non-BA workforce?
Who has the good jobs? BA vs. non-BA
Earnings distribution of non-BA good jobs
Change in number of non-BA good jobs 1991-2015
Non-BA good jobs in blue-collar vs. skilled-services industries

A State-by-State Analysis | Good Jobs That Pay without a BA 74
Jobs by educational attainment
Educational attainment
Number of
workers
Workers with
good jobs
Median
earnings
Median earnings of
workers with good jobs
Non-BA Workers
Less than high school 137,000 23,000 $21,000 $52,000
High school graduate 625,000 183,000 $29,000 $53,000
Some college 546,000 203,000 $31,000 $55,000
Associate's degree 216,000 99,000 $36,000 $55,000
All non-BA workers 1,524,000 508,000 $30,000 $54,000
BA+ Workers
Bachelor’s or higher 784,000 522,000 $51,000 $67,000
All workers 2,308,000 1,029,000 $35,000 $60,000
Top five industries
Industry
Number of non-
BA good jobs
Share of non-BA
good jobs
Share of non-BA
workers with good jobs
Median
earnings
Manufacturing 96,000 19% 43% $54,000
Transportation and utilities 59,000 12% 54% $60,000
Construction 58,000 11% 46% $57,000
Health services 57,000 11% 25% $52,000
Information, financial activities, and real estate 55,000 11% 45% $56,000
NON-BA GOOD JOBS
Top five occupations
Occupation
Number of non-
BA good jobs
Share of non-BA
good jobs
Share of non-BA
workers with good jobs
Median
earnings
Management 65,000 13% 59% $64,000
Office and administrative support 62,000 12% 24% $50,000
Production 54,000 11% 35% $52,000
Transportation and material moving 50,000 10% 34% $53,000
Construction and extraction 50,000 10% 46% $57,000
Source: Georgetown University Center on Education and the Workforce analysis of Bureau of the Census, American Community Survey
microdata 2013-2015.
Note: Figures in charts and tables may not sum due to rounding.
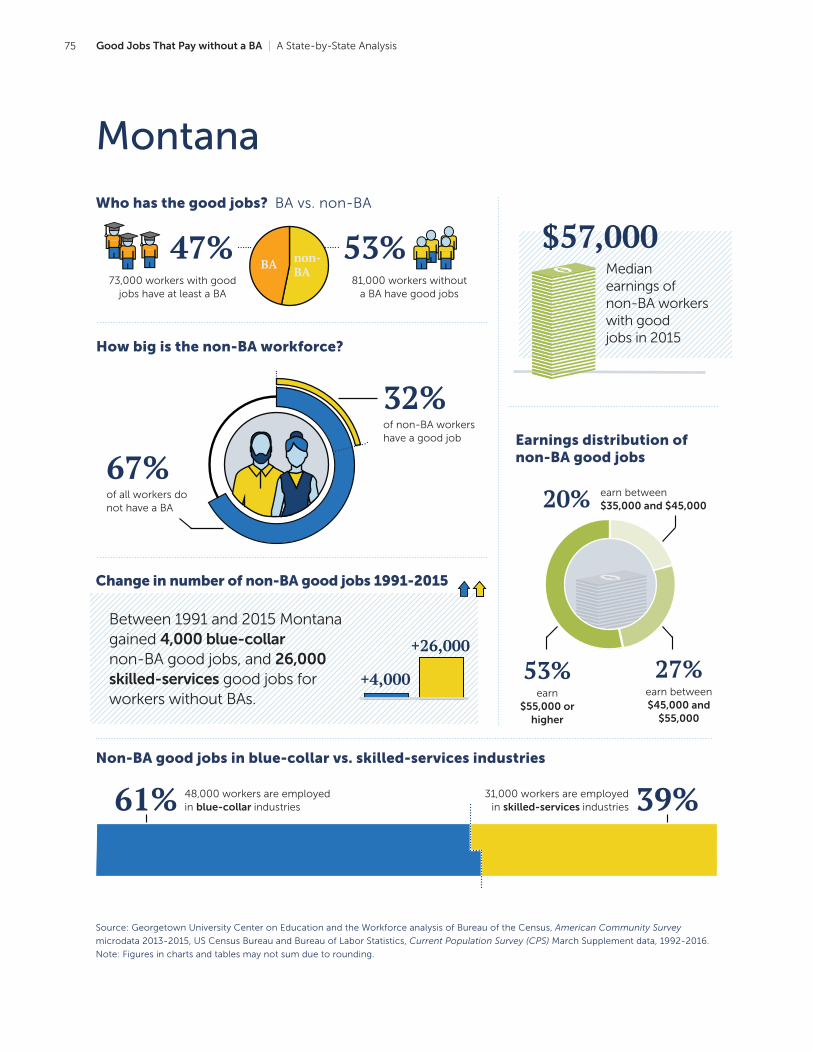
Good Jobs That Pay without a BA | A State-by-State Analysis75
Montana
Source: Georgetown University Center on Education and the Workforce analysis of Bureau of the Census, American Community Survey
microdata 2013-2015, US Census Bureau and Bureau of Labor Statistics, Current Population Survey (CPS) March Supplement data, 1992-2016.
Note: Figures in charts and tables may not sum due to rounding.
39%48,000 workers are employed in blue-collar industries61% 31,000 workers are employed
in skilled-services industries
earn between $35,000 and $45,000
$57,000Median earnings of non-BA workers with good jobs in 2015
20%
27%53%earn between $45,000 and
$55,000
earn $55,000 or
higher
Between 1991 and 2015 Montana gained 4,000 blue-collar non-BA good jobs, and 26,000 skilled-services good jobs for workers without BAs.
+4,000
+26,000
47%73,000 workers with good
jobs have at least a BA
BA non- BA
53%81,000 workers without
a BA have good jobs
67%of all workers do not have a BA
32%of non-BA workers have a good job
How big is the non-BA workforce?
Who has the good jobs? BA vs. non-BA
Earnings distribution of non-BA good jobs
Change in number of non-BA good jobs 1991-2015
Non-BA good jobs in blue-collar vs. skilled-services industries

A State-by-State Analysis | Good Jobs That Pay without a BA 76
Jobs by educational attainment
Educational attainment
Number of
workers
Workers with
good jobs
Median
earnings
Median earnings of
workers with good jobs
Non-BA Workers
Less than high school 16,000 3,000 $18,000 $60,000
High school graduate 104,000 32,000 $27,000 $56,000
Some college 95,000 29,000 $28,000 $57,000
Associate's degree 41,000 17,000 $34,000 $56,000
All non-BA workers 256,000 81,000 $28,000 $57,000
BA+ Workers
Bachelor’s or higher 127,000 73,000 $45,000 $63,000
All workers 382,000 154,000 $32,000 $60,000
Top five industries
Industry
Number of non-
BA good jobs
Share of non-BA
good jobs
Share of non-BA
workers with good jobs
Median
earnings
Construction 12,000 15% 46% $56,000
Natural resources 10,000 12% 48% $75,000
Transportation and utilities 9,000 11% 56% $64,000
Information, financial activities, and real estate 7,000 8% 39% $50,000
Retail trade 7,000 9% 22% $55,000
NON-BA GOOD JOBS
Top five occupations
Occupation
Number of non-
BA good jobs
Share of non-BA
good jobs
Share of non-BA
workers with good jobs
Median
earnings
Construction and extraction 14,000 17% 51% $60,000
Management 12,000 15% 47% $61,000
Sales and related 8,000 10% 31% $56,000
Office and administrative support 8,000 10% 18% $50,000
Installation, maintenance, and repair 7,000 9% 56% $60,000
Source: Georgetown University Center on Education and the Workforce analysis of Bureau of the Census, American Community Survey
microdata 2013-2015.
Note: Figures in charts and tables may not sum due to rounding.

Good Jobs That Pay without a BA | A State-by-State Analysis77
Nebraska
Source: Georgetown University Center on Education and the Workforce analysis of Bureau of the Census, American Community Survey
microdata 2013-2015, US Census Bureau and Bureau of Labor Statistics, Current Population Survey (CPS) March Supplement data, 1992-2016.
Note: Figures in charts and tables may not sum due to rounding.
38%108,000 workers are employed in blue-collar industries62% 65,000 workers are employed
in skilled-services industries
earn between $35,000 and $45,000
$53,000Median earnings of non-BA workers with good jobs in 2015
20%
33%47%earn between $45,000 and
$55,000
earn $55,000 or
higher-6,000
+26,000Between 1991 and 2015 Nebraska lost 6,000 blue-collar non-BA good jobs, but gained 26,000 skilled-services good jobs for workers without BAs.
51%184,000 workers with good
jobs have at least a BA
BA non- BA
49%174,000 workers without
a BA have good jobs
64%of all workers do not have a BA
36%of non-BA workers have a good job
How big is the non-BA workforce?
Who has the good jobs? BA vs. non-BA
Earnings distribution of non-BA good jobs
Change in number of non-BA good jobs 1991-2015
Non-BA good jobs in blue-collar vs. skilled-services industries

A State-by-State Analysis | Good Jobs That Pay without a BA 78
Jobs by educational attainment
Educational attainment
Number of
workers
Workers with
good jobs
Median
earnings
Median earnings of
workers with good jobs
Non-BA Workers
Less than high school 47,000 8,000 $23,000 $49,000
High school graduate 170,000 54,000 $30,000 $53,000
Some college 180,000 68,000 $32,000 $54,000
Associate's degree 90,000 43,000 $37,000 $53,000
All non-BA workers 487,000 174,000 $31,000 $53,000
BA+ Workers
Bachelor’s or higher 272,000 184,000 $51,000 $64,000
All workers 759,000 357,000 $37,000 $59,000
Top five industries
Industry
Number of non-
BA good jobs
Share of non-BA
good jobs
Share of non-BA
workers with good jobs
Median
earnings
Manufacturing 34,000 20% 44% $51,000
Transportation and utilities 24,000 14% 68% $61,000
Construction 20,000 12% 43% $53,000
Information, financial activities, and real estate 17,000 10% 43% $57,000
Retail trade 15,000 8% 24% $52,000
NON-BA GOOD JOBS
Top five occupations
Occupation
Number of non-
BA good jobs
Share of non-BA
good jobs
Share of non-BA
workers with good jobs
Median
earnings
Management 25,000 15% 64% $62,000
Production 20,000 12% 37% $51,000
Office and administrative support 19,000 11% 23% $50,000
Sales and related 17,000 10% 36% $60,000
Construction and extraction 16,000 9% 41% $52,000
Source: Georgetown University Center on Education and the Workforce analysis of Bureau of the Census, American Community Survey
microdata 2013-2015.
Note: Figures in charts and tables may not sum due to rounding.

Good Jobs That Pay without a BA | A State-by-State Analysis79
Nevada
Source: Georgetown University Center on Education and the Workforce analysis of Bureau of the Census, American Community Survey
microdata 2013-2015, US Census Bureau and Bureau of Labor Statistics, Current Population Survey (CPS) March Supplement data, 1992-2016.
Note: Figures in charts and tables may not sum due to rounding.
60%116,000 workers are employed in blue-collar industries40% 177,000 workers are employed
in skilled-services industries
earn between $35,000 and $45,000
$55,000Median earnings of non-BA workers with good jobs in 2015
23%
26%51%earn between $45,000 and
$55,000
earn $55,000 or
higher
Between 1991 and 2015 Nevada gained 38,000 blue-collar non-BA good jobs, and 83,000 skilled-services good jobs for workers without BAs.
+38,000
+83,000
39%186,000 workers with good
jobs have at least a BA
BA non- BA
61%294,000 workers without
a BA have good jobs
75%of all workers do not have a BA
36%of non-BA workers have a good job
How big is the non-BA workforce?
Who has the good jobs? BA vs. non-BA
Earnings distribution of non-BA good jobs
Change in number of non-BA good jobs 1991-2015
Non-BA good jobs in blue-collar vs. skilled-services industries

A State-by-State Analysis | Good Jobs That Pay without a BA 80
Jobs by educational attainment
Educational attainment
Number of
workers
Workers with
good jobs
Median
earnings
Median earnings of
workers with good jobs
Non-BA Workers
Less than high school 125,000 24,000 $24,000 $50,000
High school graduate 302,000 101,000 $30,000 $52,000
Some college 292,000 122,000 $33,000 $58,000
Associate's degree 97,000 47,000 $37,000 $59,000
All non-BA workers 816,000 294,000 $31,000 $55,000
BA+ Workers
Bachelor’s or higher 278,000 186,000 $51,000 $69,000
All workers 1,094,000 480,000 $35,000 $60,000
Top five industries
Industry
Number of non-
BA good jobs
Share of non-BA
good jobs
Share of non-BA
workers with good jobs
Median
earnings
Food services 41,000 14% 26% $50,000
Construction 31,000 10% 47% $58,000
Retail trade 27,000 9% 27% $53,000
Information, financial activities, and real estate 27,000 9% 47% $55,000
Transportation and utilities 24,000 8% 47% $58,000
NON-BA GOOD JOBS
Top five occupations
Occupation
Number of non-
BA good jobs
Share of non-BA
good jobs
Share of non-BA
workers with good jobs
Median
earnings
Office and administrative support 37,000 13% 29% $50,000
Management 35,000 12% 66% $62,000
Sales and related 32,000 11% 34% $55,000
Construction and extraction 27,000 9% 48% $60,000
Transportation and material moving 21,000 7% 32% $52,000
Source: Georgetown University Center on Education and the Workforce analysis of Bureau of the Census, American Community Survey
microdata 2013-2015.
Note: Figures in charts and tables may not sum due to rounding.

Good Jobs That Pay without a BA | A State-by-State Analysis81
New Hampshire
Source: Georgetown University Center on Education and the Workforce analysis of Bureau of the Census, American Community Survey
microdata 2013-2015, US Census Bureau and Bureau of Labor Statistics, Current Population Survey (CPS) March Supplement data, 1992-2016.
Note: Figures in charts and tables may not sum due to rounding.
45%83,000 workers are employed in blue-collar industries55% 67,000 workers are employed
in skilled-services industries
earn between $35,000 and $45,000
$58,000Median earnings of non-BA workers with good jobs in 2015
18%
26%57%earn between $45,000 and
$55,000
earn $55,000 or
higher-17,000
+5,000
Between 1991 and 2015 New Hampshire lost 17,000 blue-collar non-BA good jobs, but gained 5,000 skilled-services good jobs for workers without BAs.
51%160,000 workers with good
jobs have at least a BA
BA non- BA
49%151,000 workers without
a BA have good jobs
60%of all workers do not have a BA
44%of non-BA workers have a good job
How big is the non-BA workforce?
Who has the good jobs? BA vs. non-BA
Earnings distribution of non-BA good jobs
Change in number of non-BA good jobs 1991-2015
Non-BA good jobs in blue-collar vs. skilled-services industries

A State-by-State Analysis | Good Jobs That Pay without a BA 82
Jobs by educational attainment
Educational attainment
Number of
workers
Workers with
good jobs
Median
earnings
Median earnings of
workers with good jobs
Non-BA Workers
Less than high school 21,000 6,000 $30,000 $52,000
High school graduate 145,000 57,000 $34,000 $56,000
Some college 113,000 53,000 $37,000 $59,000
Associate's degree 61,000 35,000 $44,000 $62,000
All non-BA workers 339,000 151,000 $36,000 $58,000
BA+ Workers
Bachelor’s or higher 224,000 160,000 $60,000 $75,000
All workers 563,000 310,000 $43,000 $65,000
Top five industries
Industry
Number of non-
BA good jobs
Share of non-BA
good jobs
Share of non-BA
workers with good jobs
Median
earnings
Manufacturing 31,000 20% 55% $61,000
Construction 18,000 12% 54% $60,000
Health services 17,000 12% 35% $57,000
Retail trade 16,000 11% 35% $53,000
Information, financial activities, and real estate 14,000 9% 60% $64,000
NON-BA GOOD JOBS
Top five occupations
Occupation
Number of non-
BA good jobs
Share of non-BA
good jobs
Share of non-BA
workers with good jobs
Median
earnings
Office and administrative support 20,000 13% 35% $51,000
Management 19,000 13% 69% $71,000
Production 15,000 10% 45% $52,000
Sales and related 14,000 9% 41% $61,000
Construction and extraction 13,000 9% 52% $57,000
Source: Georgetown University Center on Education and the Workforce analysis of Bureau of the Census, American Community Survey
microdata 2013-2015.
Note: Figures in charts and tables may not sum due to rounding.

Good Jobs That Pay without a BA | A State-by-State Analysis83
New Jersey
Source: Georgetown University Center on Education and the Workforce analysis of Bureau of the Census, American Community Survey
microdata 2013-2015, US Census Bureau and Bureau of Labor Statistics, Current Population Survey (CPS) March Supplement data, 1992-2016.
Note: Figures in charts and tables may not sum due to rounding.
53%423,000 workers are employed in blue-collar industries47% 473,000 workers are employed
in skilled-services industries
earn between $35,000 and $45,000
$61,000Median earnings of non-BA workers with good jobs in 2015
15%
24%62%earn between $45,000 and
$55,000
earn $55,000 or
higher-133,000
+53,000Between 1991 and 2015 New Jersey lost 133,000 blue-collar non-BA good jobs, but gained 53,000 skilled-services good jobs for workers without BAs.
58%1,220,000 workers with
good jobs have at least a BA
BAnon- BA
42%897,000 workers without
a BA have good jobs
56%of all workers do not have a BA
44%of non-BA workers have a good job
How big is the non-BA workforce?
Who has the good jobs? BA vs. non-BA
Earnings distribution of non-BA good jobs
Change in number of non-BA good jobs 1991-2015
Non-BA good jobs in blue-collar vs. skilled-services industries

A State-by-State Analysis | Good Jobs That Pay without a BA 84
Jobs by educational attainment
Educational attainment
Number of
workers
Workers with
good jobs
Median
earnings
Median earnings of
workers with good jobs
Non-BA Workers
Less than high school 239,000 55,000 $22,000 $57,000
High school graduate 903,000 367,000 $33,000 $60,000
Some college 641,000 321,000 $39,000 $62,000
Associate's degree 273,000 153,000 $43,000 $65,000
All non-BA workers 2,056,000 897,000 $35,000 $61,000
BA+ Workers
Bachelor’s or higher 1,599,000 1,220,000 $70,000 $86,000
All workers 3,655,000 2,117,000 $47,000 $73,000
Top five industries
Industry
Number of non-
BA good jobs
Share of non-BA
good jobs
Share of non-BA
workers with good jobs
Median
earnings
Health services 107,000 12% 37% $56,000
Construction 102,000 11% 55% $66,000
Information, financial ac-tivities, and real estate 100,000 11% 62% $67,000
Transportation and utilities 99,000 11% 55% $62,000
Manufacturing 94,000 11% 49% $62,000
NON-BA GOOD JOBS
Top five occupations
Occupation
Number of non-
BA good jobs
Share of non-BA
good jobs
Share of non-BA
workers with good jobs
Median
earnings
Office and administrative support 150,000 17% 42% $55,000
Management 114,000 13% 76% $77,000
Sales and related 86,000 10% 43% $63,000
Construction and extraction 83,000 9% 54% $64,000
Transportation and material moving 76,000 9% 35% $58,000
Source: Georgetown University Center on Education and the Workforce analysis of Bureau of the Census, American Community Survey
microdata 2013-2015.
Note: Figures in charts and tables may not sum due to rounding.

Good Jobs That Pay without a BA | A State-by-State Analysis85
New Mexico
Source: Georgetown University Center on Education and the Workforce analysis of Bureau of the Census, American Community Survey
microdata 2013-2015, US Census Bureau and Bureau of Labor Statistics, Current Population Survey (CPS) March Supplement data, 1992-2016.
Note: Figures in charts and tables may not sum due to rounding.
50%76,000 workers are employed in blue-collar industries50% 75,000 workers are employed
in skilled-services industries
earn between $35,000 and $45,000
$58,000Median earnings of non-BA workers with good jobs in 2015
19%
25%56%earn between $45,000 and
$55,000
earn $55,000 or
higher
Between 1991 and 2015 New Mexico gained 2,000 blue-collar non-BA good jobs, and 36,000 skilled-services good jobs for workers without BAs.
+2,000
+36,000
48%139,000 workers with good
jobs have at least a BA
BA non- BA
52%151,000 workers without
a BA have good jobs
70%of all workers do not have a BA
31%of non-BA workers have a good job
How big is the non-BA workforce?
Who has the good jobs? BA vs. non-BA
Earnings distribution of non-BA good jobs
Change in number of non-BA good jobs 1991-2015
Non-BA good jobs in blue-collar vs. skilled-services industries

A State-by-State Analysis | Good Jobs That Pay without a BA 86
Jobs by educational attainment
Educational attainment
Number of
workers
Workers with
good jobs
Median
earnings
Median earnings of
workers with good jobs
Non-BA Workers
Less than high school 73,000 11,000 $19,000 $56,000
High school graduate 176,000 51,000 $26,000 $56,000
Some college 177,000 60,000 $28,000 $59,000
Associate's degree 69,000 29,000 $33,000 $60,000
All non-BA workers 494,000 151,000 $26,000 $58,000
BA+ Workers
Bachelor’s or higher 212,000 139,000 $51,000 $67,000
All workers 706,000 290,000 $31,000 $61,000
Top five industries
Industry
Number of non-
BA good jobs
Share of non-BA
good jobs
Share of non-BA
workers with good jobs
Median
earnings
Public administration 18,000 12% 47% $57,000
Transportation and utilities 17,000 11% 54% $62,000
Construction 16,000 11% 34% $56,000
Health services 16,000 11% 24% $56,000
Natural resources 15,000 10% 53% $70,000
NON-BA GOOD JOBS
Top five occupations
Occupation
Number of non-
BA good jobs
Share of non-BA
good jobs
Share of non-BA
workers with good jobs
Median
earnings
Construction and extraction 20,000 13% 40% $58,000
Management 20,000 13% 59% $62,000
Office and administrative support 19,000 13% 24% $52,000
Installation, maintenance, and repair 13,000 8% 48% $57,000
Sales and related 12,000 8% 26% $60,000
Source: Georgetown University Center on Education and the Workforce analysis of Bureau of the Census, American Community Survey
microdata 2013-2015.
Note: Figures in charts and tables may not sum due to rounding.

Good Jobs That Pay without a BA | A State-by-State Analysis87
New York
Source: Georgetown University Center on Education and the Workforce analysis of Bureau of the Census, American Community Survey
microdata 2013-2015, US Census Bureau and Bureau of Labor Statistics, Current Population Survey (CPS) March Supplement data, 1992-2016.
Note: Figures in charts and tables may not sum due to rounding.
56%757,000 workers are employed in blue-collar industries44% 977,000 workers are employed
in skilled-services industries
earn between $35,000 and $45,000
$59,000Median earnings of non-BA workers with good jobs in 2015
17%
27%56%earn between $45,000 and
$55,000
earn $55,000 or
higher
Between 1991 and 2015 New York lost 340,000 blue-collar non-BA good jobs, and 120,000 skilled-services good jobs for workers without BAs. -340,000
-120,000
58%2,420,000 workers with
good jobs have at least a BA
BAnon- BA
42%1,735,000 workers without
a BA have good jobs
58%of all workers do not have a BA
39%of non-BA workers have a good job
How big is the non-BA workforce?
Who has the good jobs? BA vs. non-BA
Earnings distribution of non-BA good jobs
Change in number of non-BA good jobs 1991-2015
Non-BA good jobs in blue-collar vs. skilled-services industries

A State-by-State Analysis | Good Jobs That Pay without a BA 88
Jobs by educational attainment
Educational attainment
Number of
workers
Workers with
good jobs
Median
earnings
Median earnings of
workers with good jobs
Non-BA Workers
Less than high school 615,000 112,000 $21,000 $52,000
High school graduate 1,780,000 622,000 $31,000 $57,000
Some college 1,296,000 592,000 $36,000 $60,000
Associate's degree 792,000 409,000 $40,000 $61,000
All non-BA workers 4,483,000 1,735,000 $31,000 $59,000
BA+ Workers
Bachelor’s or higher 3,269,000 2,420,000 $62,000 $80,000
All workers 7,752,000 4,155,000 $41,000 $69,000
Top five industries
Industry
Number of non-
BA good jobs
Share of non-BA
good jobs
Share of non-BA
workers with good jobs
Median
earnings
Health services 241,000 14% 31% $53,000
Construction 195,000 11% 51% $61,000
Information, financial ac-tivities, and real estate 194,000 11% 55% $62,000
Transportation and utilities 178,000 10% 53% $61,000
Manufacturing 169,000 10% 45% $57,000
NON-BA GOOD JOBS
Top five occupations
Occupation
Number of non-
BA good jobs
Share of non-BA
good jobs
Share of non-BA
workers with good jobs
Median
earnings
Office and administrative support 266,000 15% 36% $53,000
Management 194,000 11% 69% $70,000
Construction and extraction 170,000 10% 51% $61,000
Sales and related 149,000 9% 35% $60,000
Transportation and material moving 144,000 8% 37% $57,000
Source: Georgetown University Center on Education and the Workforce analysis of Bureau of the Census, American Community Survey
microdata 2013-2015.
Note: Figures in charts and tables may not sum due to rounding.

Good Jobs That Pay without a BA | A State-by-State Analysis89
North Carolina
Source: Georgetown University Center on Education and the Workforce analysis of Bureau of the Census, American Community Survey
microdata 2013-2015, US Census Bureau and Bureau of Labor Statistics, Current Population Survey (CPS) March Supplement data, 1992-2016.
Note: Figures in charts and tables may not sum due to rounding.
48%375,000 workers are employed in blue-collar industries52% 349,000 workers are employed
in skilled-services industries
earn between $35,000 and $45,000
$53,000Median earnings of non-BA workers with good jobs in 2015
23%
31%47%earn between $45,000 and
$55,000
earn $55,000 or
higher-6,000
+196,000Between 1991 and 2015 North Carolina lost 6,000 blue-collar non-BA good jobs, but gained 196,000 skilled-services good jobs for workers without BAs.
54%866,000 workers with good
jobs have at least a BA
BAnon- BA
46%724,000 workers without
a BA have good jobs
65%of all workers do not have a BA
30%of non-BA workers have a good job
How big is the non-BA workforce?
Who has the good jobs? BA vs. non-BA
Earnings distribution of non-BA good jobs
Change in number of non-BA good jobs 1991-2015
Non-BA good jobs in blue-collar vs. skilled-services industries

A State-by-State Analysis | Good Jobs That Pay without a BA 90
Jobs by educational attainment
Educational attainment
Number of
workers
Workers with
good jobs
Median
earnings
Median earnings of
workers with good jobs
Non-BA Workers
Less than high school 304,000 39,000 $20,000 $51,000
High school graduate 851,000 222,000 $27,000 $52,000
Some college 843,000 287,000 $30,000 $54,000
Associate's degree 400,000 176,000 $35,000 $55,000
All non-BA workers 2,397,000 724,000 $28,000 $53,000
BA+ Workers
Bachelor’s or higher 1,303,000 866,000 $51,000 $70,000
All workers 3,700,000 1,590,000 $34,000 $60,000
Top five industries
Industry
Number of non-
BA good jobs
Share of non-BA
good jobs
Share of non-BA
workers with good jobs
Median
earnings
Manufacturing 140,000 19% 36% $54,000
Health services 97,000 14% 28% $51,000
Information, financial activities, and real estate 71,000 10% 46% $57,000
Retail trade 66,000 9% 22% $52,000
Construction 66,000 9% 32% $52,000
NON-BA GOOD JOBS
Top five occupations
Occupation
Number of non-
BA good jobs
Share of non-BA
good jobs
Share of non-BA
workers with good jobs
Median
earnings
Management 103,000 14% 61% $65,000
Office and administrative support 85,000 12% 24% $50,000
Production 76,000 11% 27% $52,000
Sales and related 72,000 10% 30% $56,000
Healthcare practitioners and technical 62,000 9% 55% $53,000
Source: Georgetown University Center on Education and the Workforce analysis of Bureau of the Census, American Community Survey
microdata 2013-2015.
Note: Figures in charts and tables may not sum due to rounding.
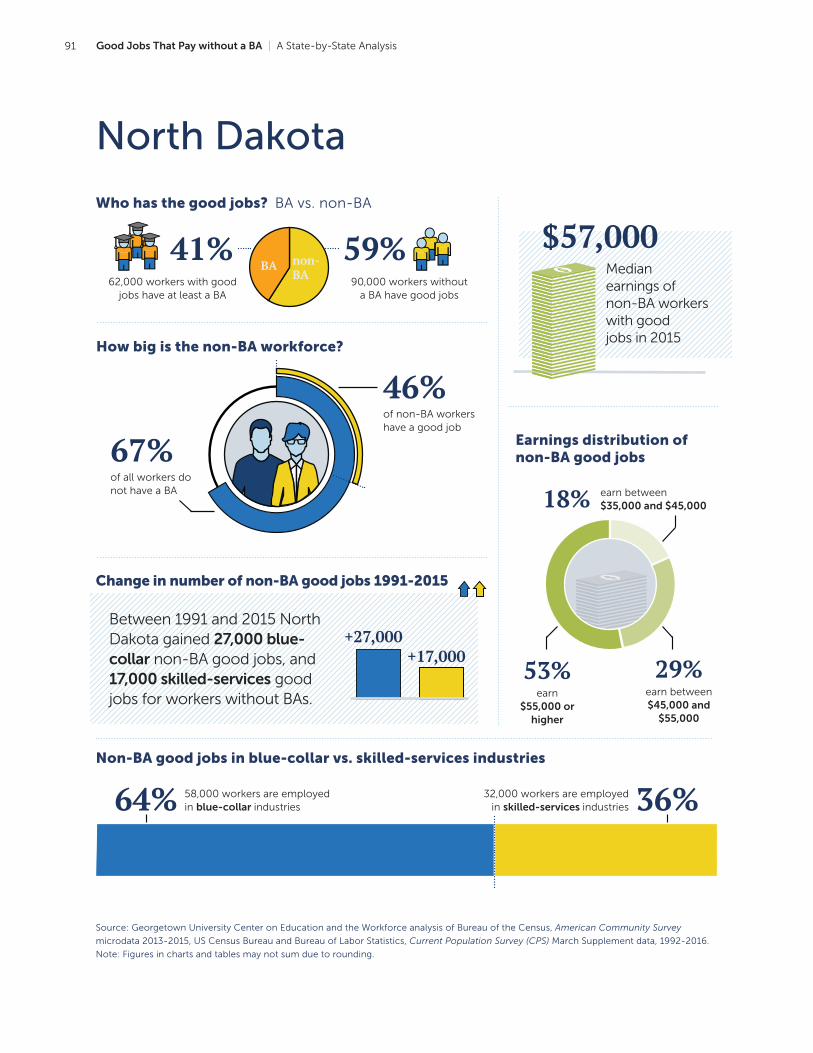
Good Jobs That Pay without a BA | A State-by-State Analysis91
North Dakota
Source: Georgetown University Center on Education and the Workforce analysis of Bureau of the Census, American Community Survey
microdata 2013-2015, US Census Bureau and Bureau of Labor Statistics, Current Population Survey (CPS) March Supplement data, 1992-2016.
Note: Figures in charts and tables may not sum due to rounding.
36%58,000 workers are employed in blue-collar industries64% 32,000 workers are employed
in skilled-services industries
earn between $35,000 and $45,000
$57,000Median earnings of non-BA workers with good jobs in 2015
18%
29%53%earn between $45,000 and
$55,000
earn $55,000 or
higher
Between 1991 and 2015 North Dakota gained 27,000 blue-collar non-BA good jobs, and 17,000 skilled-services good jobs for workers without BAs.
+27,000+17,000
41%62,000 workers with good
jobs have at least a BA
BA non- BA
59%90,000 workers without
a BA have good jobs
67%of all workers do not have a BA
46%of non-BA workers have a good job
How big is the non-BA workforce?
Who has the good jobs? BA vs. non-BA
Earnings distribution of non-BA good jobs
Change in number of non-BA good jobs 1991-2015
Non-BA good jobs in blue-collar vs. skilled-services industries

A State-by-State Analysis | Good Jobs That Pay without a BA 92
Jobs by educational attainment
Educational attainment
Number of
workers
Workers with
good jobs
Median
earnings
Median earnings of
workers with good jobs
Non-BA Workers
Less than high school 9,000 4,000 $32,000 $56,000
High school graduate 66,000 27,000 $35,000 $56,000
Some college 71,000 32,000 $36,000 $60,000
Associate's degree 49,000 27,000 $41,000 $56,000
All non-BA workers 196,000 90,000 $36,000 $57,000
BA+ Workers
Bachelor’s or higher 97,000 62,000 $47,000 $62,000
All workers 293,000 152,000 $40,000 $60,000
Top five industries
Industry
Number of non-
BA good jobs
Share of non-BA
good jobs
Share of non-BA
workers with good jobs
Median
earnings
Construction 13,000 14% 64% $56,000
Natural resources 12,000 13% 67% $80,000
Transportation and utilities 11,000 12% 72% $67,000
Manufacturing 9,000 10% 56% $51,000
Retail trade 8,000 9% 32% $57,000
NON-BA GOOD JOBS
Top five occupations
Occupation
Number of non-
BA good jobs
Share of non-BA
good jobs
Share of non-BA
workers with good jobs
Median
earnings
Construction and extraction 13,000 15% 69% $61,000
Management 12,000 13% 67% $70,000
Transportation and material moving 11,000 12% 55% $62,000
Office and administrative support 10,000 11% 32% $48,000
Production 9,000 10% 58% $54,000
Source: Georgetown University Center on Education and the Workforce analysis of Bureau of the Census, American Community Survey
microdata 2013-2015.
Note: Figures in charts and tables may not sum due to rounding.
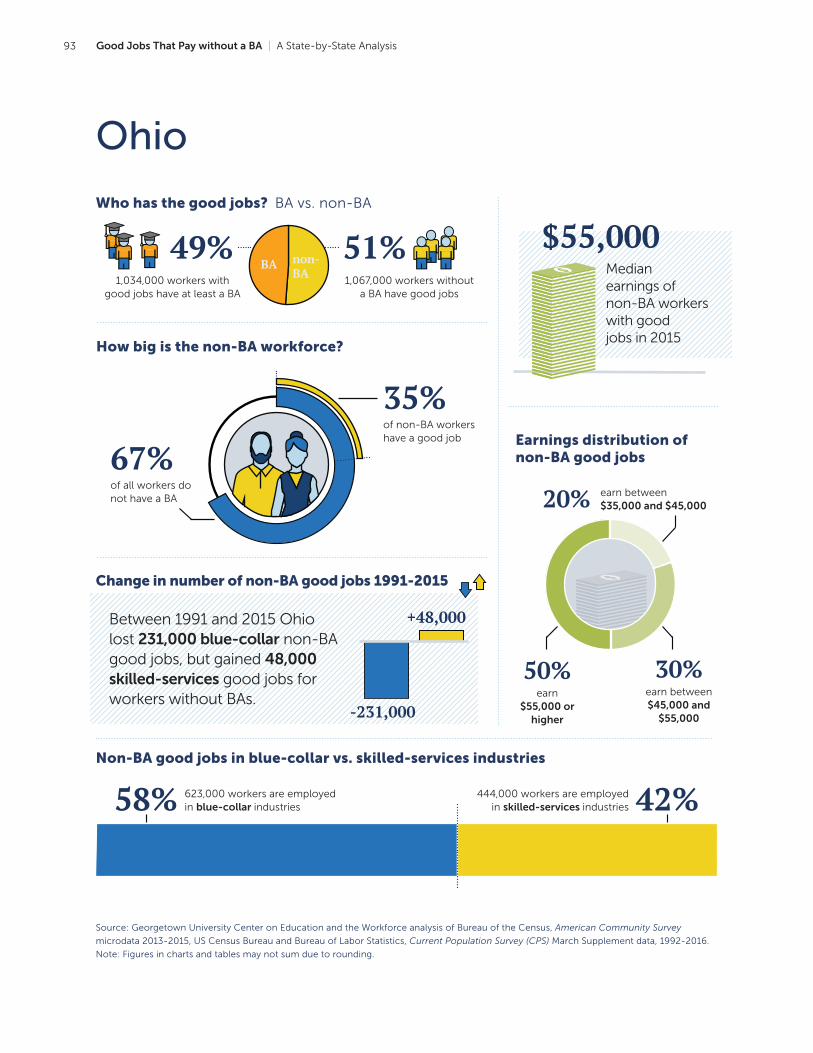
Good Jobs That Pay without a BA | A State-by-State Analysis93
Ohio
Source: Georgetown University Center on Education and the Workforce analysis of Bureau of the Census, American Community Survey
microdata 2013-2015, US Census Bureau and Bureau of Labor Statistics, Current Population Survey (CPS) March Supplement data, 1992-2016.
Note: Figures in charts and tables may not sum due to rounding.
42%623,000 workers are employed in blue-collar industries58% 444,000 workers are employed
in skilled-services industries
earn between $35,000 and $45,000
$55,000Median earnings of non-BA workers with good jobs in 2015
20%
30%50%earn between $45,000 and
$55,000
earn $55,000 or
higher-231,000
+48,000Between 1991 and 2015 Ohio lost 231,000 blue-collar non-BA good jobs, but gained 48,000 skilled-services good jobs for workers without BAs.
49%1,034,000 workers with
good jobs have at least a BA
BA non- BA
51%1,067,000 workers without
a BA have good jobs
67%of all workers do not have a BA
35%of non-BA workers have a good job
How big is the non-BA workforce?
Who has the good jobs? BA vs. non-BA
Earnings distribution of non-BA good jobs
Change in number of non-BA good jobs 1991-2015
Non-BA good jobs in blue-collar vs. skilled-services industries

A State-by-State Analysis | Good Jobs That Pay without a BA 94
Jobs by educational attainment
Educational attainment
Number of
workers
Workers with
good jobs
Median
earnings
Median earnings of
workers with good jobs
Non-BA Workers
Less than high school 234,000 41,000 $20,000 $51,000
High school graduate 1,329,000 420,000 $30,000 $54,000
Some college 989,000 387,000 $32,000 $56,000
Associate's degree 469,000 220,000 $37,000 $57,000
All non-BA workers 3,020,000 1,067,000 $31,000 $55,000
BA+ Workers
Bachelor’s or higher 1,471,000 1,034,000 $55,000 $70,000
All workers 4,491,000 2,101,000 $36,000 $61,000
Top five industries
Industry
Number of non-
BA good jobs
Share of non-BA
good jobs
Share of non-BA
workers with good jobs
Median
earnings
Manufacturing 288,000 27% 48% $56,000
Health services 125,000 12% 27% $52,000
Transportation and utilities 99,000 9% 53% $59,000
Construction 99,000 9% 48% $55,000
Information, financial activities, and real estate 93,000 9% 45% $55,000
NON-BA GOOD JOBS
Top five occupations
Occupation
Number of non-
BA good jobs
Share of non-BA
good jobs
Share of non-BA
workers with good jobs
Median
earnings
Production 157,000 15% 40% $54,000
Management 128,000 12% 64% $65,000
Office and administrative support 127,000 12% 26% $51,000
Transportation and material moving 98,000 9% 32% $52,000
Sales and related 87,000 8% 32% $56,000
Source: Georgetown University Center on Education and the Workforce analysis of Bureau of the Census, American Community Survey
microdata 2013-2015.
Note: Figures in charts and tables may not sum due to rounding.
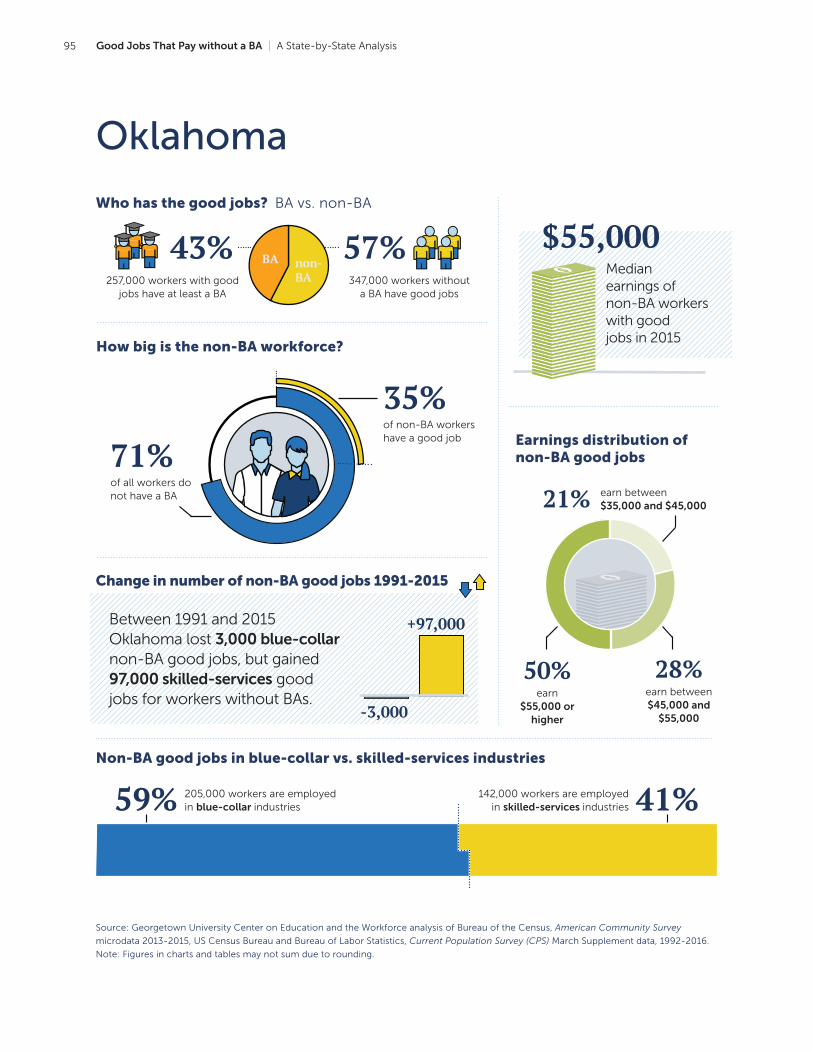
Good Jobs That Pay without a BA | A State-by-State Analysis95
Oklahoma
Source: Georgetown University Center on Education and the Workforce analysis of Bureau of the Census, American Community Survey
microdata 2013-2015, US Census Bureau and Bureau of Labor Statistics, Current Population Survey (CPS) March Supplement data, 1992-2016.
Note: Figures in charts and tables may not sum due to rounding.
41%205,000 workers are employed in blue-collar industries59% 142,000 workers are employed
in skilled-services industries
earn between $35,000 and $45,000
$55,000Median earnings of non-BA workers with good jobs in 2015
21%
28%50%earn between $45,000 and
$55,000
earn $55,000 or
higher-3,000
+97,000Between 1991 and 2015 Oklahoma lost 3,000 blue-collar non-BA good jobs, but gained 97,000 skilled-services good jobs for workers without BAs.
43%257,000 workers with good
jobs have at least a BA
BA non- BA
57%347,000 workers without
a BA have good jobs
71%of all workers do not have a BA
35%of non-BA workers have a good job
How big is the non-BA workforce?
Who has the good jobs? BA vs. non-BA
Earnings distribution of non-BA good jobs
Change in number of non-BA good jobs 1991-2015
Non-BA good jobs in blue-collar vs. skilled-services industries

A State-by-State Analysis | Good Jobs That Pay without a BA 96
Jobs by educational attainment
Educational attainment
Number of
workers
Workers with
good jobs
Median
earnings
Median earnings of
workers with good jobs
Non-BA Workers
Less than high school 121,000 25,000 $22,000 $51,000
High school graduate 403,000 127,000 $28,000 $54,000
Some college 340,000 135,000 $32,000 $56,000
Associate's degree 126,000 60,000 $37,000 $57,000
All non-BA workers 990,000 347,000 $30,000 $55,000
BA+ Workers
Bachelor’s or higher 408,000 257,000 $46,000 $65,000
All workers 1,398,000 604,000 $35,000 $59,000
Top five industries
Industry
Number of non-
BA good jobs
Share of non-BA
good jobs
Share of non-BA
workers with good jobs
Median
earnings
Manufacturing 61,000 18% 47% $55,000
Transportation and utilities 35,000 10% 57% $60,000
Natural resources 34,000 10% 61% $64,000
Health services 33,000 9% 25% $51,000
Construction 32,000 9% 37% $55,000
NON-BA GOOD JOBS
Top five occupations
Occupation
Number of non-
BA good jobs
Share of non-BA
good jobs
Share of non-BA
workers with good jobs
Median
earnings
Management 45,000 13% 62% $62,000
Production 42,000 12% 41% $53,000
Office and administrative support 38,000 11% 24% $50,000
Construction and extraction 37,000 11% 41% $56,000
Installation, maintenance, and repair 32,000 9% 61% $58,000
Source: Georgetown University Center on Education and the Workforce analysis of Bureau of the Census, American Community Survey
microdata 2013-2015.
Note: Figures in charts and tables may not sum due to rounding.
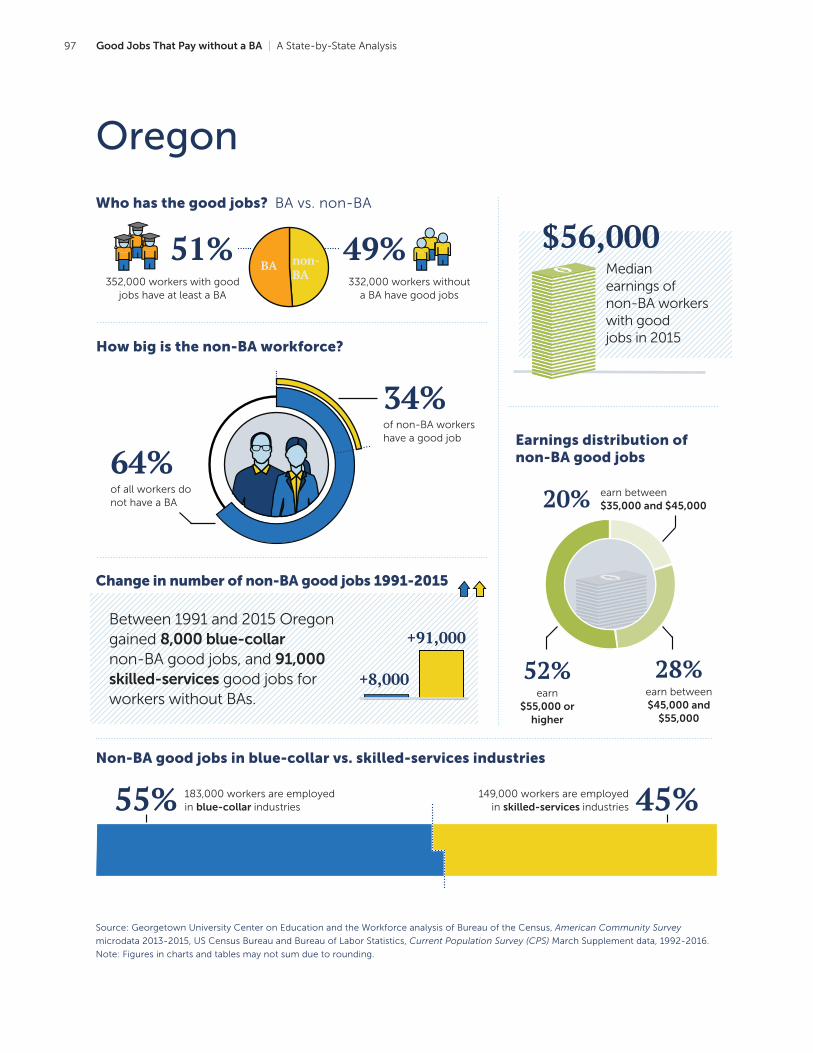
Good Jobs That Pay without a BA | A State-by-State Analysis97
Oregon
Source: Georgetown University Center on Education and the Workforce analysis of Bureau of the Census, American Community Survey
microdata 2013-2015, US Census Bureau and Bureau of Labor Statistics, Current Population Survey (CPS) March Supplement data, 1992-2016.
Note: Figures in charts and tables may not sum due to rounding.
45%183,000 workers are employed in blue-collar industries55% 149,000 workers are employed
in skilled-services industries
earn between $35,000 and $45,000
$56,000Median earnings of non-BA workers with good jobs in 2015
20%
28%52%earn between $45,000 and
$55,000
earn $55,000 or
higher
Between 1991 and 2015 Oregon gained 8,000 blue-collar non-BA good jobs, and 91,000 skilled-services good jobs for workers without BAs.
+8,000
+91,000
51%352,000 workers with good
jobs have at least a BA
BA non- BA
49%332,000 workers without
a BA have good jobs
64%of all workers do not have a BA
34%of non-BA workers have a good job
How big is the non-BA workforce?
Who has the good jobs? BA vs. non-BA
Earnings distribution of non-BA good jobs
Change in number of non-BA good jobs 1991-2015
Non-BA good jobs in blue-collar vs. skilled-services industries

A State-by-State Analysis | Good Jobs That Pay without a BA 98
Jobs by educational attainment
Educational attainment
Number of
workers
Workers with
good jobs
Median
earnings
Median earnings of
workers with good jobs
Non-BA Workers
Less than high school 116,000 18,000 $21,000 $50,000
High school graduate 317,000 95,000 $27,000 $53,000
Some college 395,000 148,000 $31,000 $57,000
Associate's degree 149,000 71,000 $37,000 $61,000
All non-BA workers 977,000 332,000 $29,000 $56,000
BA+ Workers
Bachelor’s or higher 544,000 352,000 $52,000 $72,000
All workers 1,521,000 684,000 $35,000 $63,000
Top five industries
Industry
Number of non-
BA good jobs
Share of non-BA
good jobs
Share of non-BA
workers with good jobs
Median
earnings
Manufacturing 58,000 18% 45% $57,000
Construction 38,000 11% 49% $60,000
Health services 38,000 11% 29% $55,000
Retail trade 32,000 10% 24% $51,000
Information, financial activities, and real estate 31,000 9% 46% $58,000
NON-BA GOOD JOBS
Top five occupations
Occupation
Number of non-
BA good jobs
Share of non-BA
good jobs
Share of non-BA
workers with good jobs
Median
earnings
Management 44,000 13% 62% $67,000
Office and administrative support 42,000 13% 28% $50,000
Sales and related 35,000 11% 34% $57,000
Production 31,000 9% 36% $52,000
Construction and extraction 28,000 9% 46% $55,000
Source: Georgetown University Center on Education and the Workforce analysis of Bureau of the Census, American Community Survey
microdata 2013-2015.
Note: Figures in charts and tables may not sum due to rounding.

Good Jobs That Pay without a BA | A State-by-State Analysis99
Pennsylvania
Source: Georgetown University Center on Education and the Workforce analysis of Bureau of the Census, American Community Survey
microdata 2013-2015, US Census Bureau and Bureau of Labor Statistics, Current Population Survey (CPS) March Supplement data, 1992-2016.
Note: Figures in charts and tables may not sum due to rounding.
46%657,000 workers are employed in blue-collar industries54% 553,000 workers are employed
in skilled-services industries
earn between $35,000 and $45,000
$56,000Median earnings of non-BA workers with good jobs in 2015
18%
30%52%earn between $45,000 and
$55,000
earn $55,000 or
higher-246,000
+143,000Between 1991 and 2015 Pennsylvania lost 246,000 blue-collar non-BA good jobs, but gained 143,000 skilled-services good jobs for workers without BAs.
51%1,284,000 workers with
good jobs have at least a BA
BA non- BA
49%1,212,000 workers without
a BA have good jobs
64%of all workers do not have a BA
38%of non-BA workers have a good job
How big is the non-BA workforce?
Who has the good jobs? BA vs. non-BA
Earnings distribution of non-BA good jobs
Change in number of non-BA good jobs 1991-2015
Non-BA good jobs in blue-collar vs. skilled-services industries
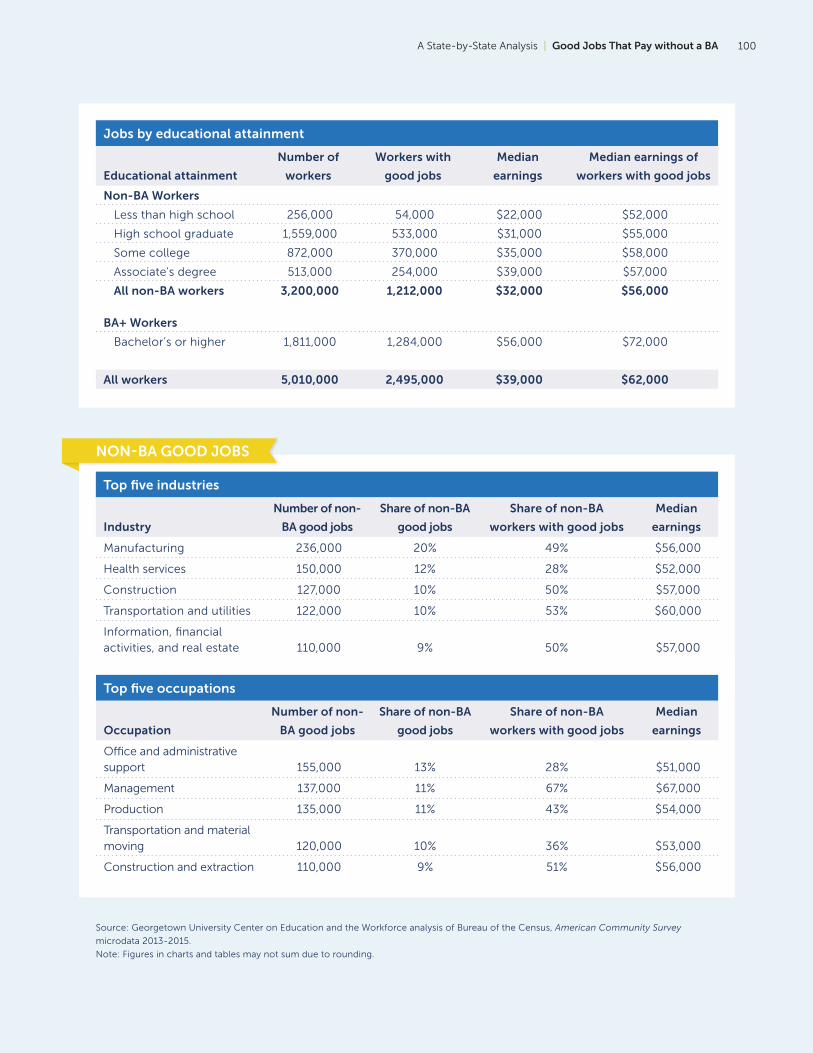
A State-by-State Analysis | Good Jobs That Pay without a BA 100
Jobs by educational attainment
Educational attainment
Number of
workers
Workers with
good jobs
Median
earnings
Median earnings of
workers with good jobs
Non-BA Workers
Less than high school 256,000 54,000 $22,000 $52,000
High school graduate 1,559,000 533,000 $31,000 $55,000
Some college 872,000 370,000 $35,000 $58,000
Associate's degree 513,000 254,000 $39,000 $57,000
All non-BA workers 3,200,000 1,212,000 $32,000 $56,000
BA+ Workers
Bachelor’s or higher 1,811,000 1,284,000 $56,000 $72,000
All workers 5,010,000 2,495,000 $39,000 $62,000
Top five industries
Industry
Number of non-
BA good jobs
Share of non-BA
good jobs
Share of non-BA
workers with good jobs
Median
earnings
Manufacturing 236,000 20% 49% $56,000
Health services 150,000 12% 28% $52,000
Construction 127,000 10% 50% $57,000
Transportation and utilities 122,000 10% 53% $60,000
Information, financial activities, and real estate 110,000 9% 50% $57,000
NON-BA GOOD JOBS
Top five occupations
Occupation
Number of non-
BA good jobs
Share of non-BA
good jobs
Share of non-BA
workers with good jobs
Median
earnings
Office and administrative support 155,000 13% 28% $51,000
Management 137,000 11% 67% $67,000
Production 135,000 11% 43% $54,000
Transportation and material moving 120,000 10% 36% $53,000
Construction and extraction 110,000 9% 51% $56,000
Source: Georgetown University Center on Education and the Workforce analysis of Bureau of the Census, American Community Survey
microdata 2013-2015.
Note: Figures in charts and tables may not sum due to rounding.

Good Jobs That Pay without a BA | A State-by-State Analysis101
Rhode Island
Source: Georgetown University Center on Education and the Workforce analysis of Bureau of the Census, American Community Survey
microdata 2013-2015, US Census Bureau and Bureau of Labor Statistics, Current Population Survey (CPS) March Supplement data, 1992-2016.
Note: Figures in charts and tables may not sum due to rounding.
52%51,000 workers are employed in blue-collar industries48% 56,000 workers are employed
in skilled-services industries
earn between $35,000 and $45,000
$56,000Median earnings of non-BA workers with good jobs in 2015
20%
28%52%earn between $45,000 and
$55,000
earn $55,000 or
higher-28,000
+15,000Between 1991 and 2015 Rhode Island lost 28,000 blue-collar non-BA good jobs, but gained 15,000 skilled-services good jobs for workers without BAs.
52%115,000 workers with good
jobs have at least a BA
BA non- BA
48%107,000 workers without
a BA have good jobs
62%of all workers do not have a BA
41%of non-BA workers have a good job
How big is the non-BA workforce?
Who has the good jobs? BA vs. non-BA
Earnings distribution of non-BA good jobs
Change in number of non-BA good jobs 1991-2015
Non-BA good jobs in blue-collar vs. skilled-services industries

A State-by-State Analysis | Good Jobs That Pay without a BA 102
Jobs by educational attainment
Educational attainment
Number of
workers
Workers with
good jobs
Median
earnings
Median earnings of
workers with good jobs
Non-BA Workers
Less than high school 32,000 8,000 $25,000 $53,000
High school graduate 101,000 39,000 $33,000 $53,000
Some college 87,000 37,000 $35,000 $56,000
Associate's degree 43,000 23,000 $43,000 $62,000
All non-BA workers 261,000 107,000 $34,000 $56,000
BA+ Workers
Bachelor’s or higher 159,000 115,000 $60,000 $74,000
All workers 421,000 222,000 $41,000 $64,000
Top five industries
Industry
Number of non-
BA good jobs
Share of non-BA
good jobs
Share of non-BA
workers with good jobs
Median
earnings
Manufacturing 17,000 16% 46% $56,000
Health services 16,000 15% 37% $52,000
Construction 11,000 10% 54% $57,000
Retail trade 10,000 9% 30% $51,000
Information, financial activities, and real estate 10,000 10% 53% $58,000
NON-BA GOOD JOBS
Top five occupations
Occupation
Number of non-
BA good jobs
Share of non-BA
good jobs
Share of non-BA
workers with good jobs
Median
earnings
Office and administrative support 16,000 15% 34% $51,000
Management 12,000 11% 73% $71,000
Sales and related 11,000 10% 40% $56,000
Production 10,000 9% 38% $55,000
Construction and extraction 9,000 9% 52% $56,000
Source: Georgetown University Center on Education and the Workforce analysis of Bureau of the Census, American Community Survey
microdata 2013-2015.
Note: Figures in charts and tables may not sum due to rounding.

Good Jobs That Pay without a BA | A State-by-State Analysis103
South Carolina
Source: Georgetown University Center on Education and the Workforce analysis of Bureau of the Census, American Community Survey
microdata 2013-2015, US Census Bureau and Bureau of Labor Statistics, Current Population Survey (CPS) March Supplement data, 1992-2016.
Note: Figures in charts and tables may not sum due to rounding.
43%209,000 workers are employed in blue-collar industries57% 160,000 workers are employed
in skilled-services industries
earn between $35,000 and $45,000
$53,000Median earnings of non-BA workers with good jobs in 2015
22%
31%47%earn between $45,000 and
$55,000
earn $55,000 or
higher-28,000
+99,000Between 1991 and 2015 South Carolina lost 28,000 blue-collar non-BA good jobs, but gained 99,000 skilled-services good jobs for workers without BAs.
49%359,000 workers with good
jobs have at least a BA
BA non- BA
51%370,000 workers without
a BA have good jobs
68%of all workers do not have a BA
31%of non-BA workers have a good job
How big is the non-BA workforce?
Who has the good jobs? BA vs. non-BA
Earnings distribution of non-BA good jobs
Change in number of non-BA good jobs 1991-2015
Non-BA good jobs in blue-collar vs. skilled-services industries

A State-by-State Analysis | Good Jobs That Pay without a BA 104
Jobs by educational attainment
Educational attainment
Number of
workers
Workers with
good jobs
Median
earnings
Median earnings of
workers with good jobs
Non-BA Workers
Less than high school 136,000 21,000 $20,000 $52,000
High school graduate 478,000 122,000 $26,000 $52,000
Some college 393,000 139,000 $31,000 $54,000
Associate's degree 191,000 88,000 $36,000 $55,000
All non-BA workers 1,198,000 370,000 $28,000 $53,000
BA+ Workers
Bachelor’s or higher 553,000 359,000 $50,000 $65,000
All workers 1,751,000 729,000 $33,000 $59,000
Top five industries
Industry
Number of non-
BA good jobs
Share of non-BA
good jobs
Share of non-BA
workers with good jobs
Median
earnings
Manufacturing 95,000 26% 44% $56,000
Health services 41,000 11% 26% $52,000
Transportation and utilities 35,000 10% 51% $57,000
Retail trade 31,000 9% 20% $52,000
Construction 30,000 8% 31% $52,000
NON-BA GOOD JOBS
Top five occupations
Occupation
Number of non-
BA good jobs
Share of non-BA
good jobs
Share of non-BA
workers with good jobs
Median
earnings
Production 54,000 15% 36% $52,000
Management 46,000 13% 57% $63,000
Office and administrative support 40,000 11% 22% $50,000
Sales and related 35,000 10% 28% $55,000
Installation, maintenance, and repair 30,000 8% 52% $56,000
Source: Georgetown University Center on Education and the Workforce analysis of Bureau of the Census, American Community Survey
microdata 2013-2015.
Note: Figures in charts and tables may not sum due to rounding.

Good Jobs That Pay without a BA | A State-by-State Analysis105
South Dakota
Source: Georgetown University Center on Education and the Workforce analysis of Bureau of the Census, American Community Survey
microdata 2013-2015, US Census Bureau and Bureau of Labor Statistics, Current Population Survey (CPS) March Supplement data, 1992-2016.
Note: Figures in charts and tables may not sum due to rounding.
41%44,000 workers are employed in blue-collar industries59% 30,000 workers are employed
in skilled-services industries
earn between $35,000 and $45,000
$52,000Median earnings of non-BA workers with good jobs in 2015
25%
33%42%earn between $45,000 and
$55,000
earn $55,000 or
higher
Between 1991 and 2015 South Dakota gained 24,000 blue-collar non-BA good jobs, and 21,000 skilled-services good jobs for workers without BAs.
+24,000 +21,000
45%61,000 workers with good
jobs have at least a BA
BA non- BA
55%74,000 workers without
a BA have good jobs
69%of all workers do not have a BA
32%of non-BA workers have a good job
How big is the non-BA workforce?
Who has the good jobs? BA vs. non-BA
Earnings distribution of non-BA good jobs
Change in number of non-BA good jobs 1991-2015
Non-BA good jobs in blue-collar vs. skilled-services industries

A State-by-State Analysis | Good Jobs That Pay without a BA 106
Jobs by educational attainment
Educational attainment
Number of
workers
Workers with
good jobs
Median
earnings
Median earnings of
workers with good jobs
Non-BA Workers
Less than high school 17,000 3,000 $23,000 $50,000
High school graduate 92,000 27,000 $29,000 $51,000
Some college 75,000 25,000 $30,000 $52,000
Associate's degree 46,000 20,000 $35,000 $54,000
All non-BA workers 230,000 74,000 $30,000 $52,000
BA+ Workers
Bachelor’s or higher 104,000 61,000 $42,000 $58,000
All workers 334,000 135,000 $34,000 $54,000
Top five industries
Industry
Number of non-
BA good jobs
Share of non-BA
good jobs
Share of non-BA
workers with good jobs
Median
earnings
Manufacturing 11,000 16% 37% $50,000
Construction 9,000 12% 42% $50,000
Information, financial ac-tivities, and real estate 7,000 10% 38% $55,000
Transportation and utilities 7,000 10% 60% $61,000
Retail trade 7,000 9% 26% $50,000
NON-BA GOOD JOBS
Top five occupations
Occupation
Number of non-
BA good jobs
Share of non-BA
good jobs
Share of non-BA
workers with good jobs
Median
earnings
Sales and related 10,000 13% 39% $56,000
Management 10,000 13% 52% $59,000
Production 8,000 10% 32% $46,000
Construction and extraction 8,000 11% 42% $50,000
Office and administrative support 8,000 10% 20% $48,000
Source: Georgetown University Center on Education and the Workforce analysis of Bureau of the Census, American Community Survey
microdata 2013-2015.
Note: Figures in charts and tables may not sum due to rounding.

Good Jobs That Pay without a BA | A State-by-State Analysis107
Tennessee
Source: Georgetown University Center on Education and the Workforce analysis of Bureau of the Census, American Community Survey
microdata 2013-2015, US Census Bureau and Bureau of Labor Statistics, Current Population Survey (CPS) March Supplement data, 1992-2016.
Note: Figures in charts and tables may not sum due to rounding.
44%283,000 workers are employed in blue-collar industries56% 219,000 workers are employed
in skilled-services industries
earn between $35,000 and $45,000
$54,000Median earnings of non-BA workers with good jobs in 2015
23%
29%48%earn between $45,000 and
$55,000
earn $55,000 or
higher
Between 1991 and 2015 Tennessee gained 24,000 blue-collar non-BA good jobs, and 103,000 skilled-services good jobs for workers without BAs.
+24,000
+103,000
50%499,000 workers with good
jobs have at least a BA
BA non- BA
50%503,000 workers without
a BA have good jobs
68%of all workers do not have a BA
31%of non-BA workers have a good job
How big is the non-BA workforce?
Who has the good jobs? BA vs. non-BA
Earnings distribution of non-BA good jobs
Change in number of non-BA good jobs 1991-2015
Non-BA good jobs in blue-collar vs. skilled-services industries

A State-by-State Analysis | Good Jobs That Pay without a BA 108
Jobs by educational attainment
Educational attainment
Number of
workers
Workers with
good jobs
Median
earnings
Median earnings of
workers with good jobs
Non-BA Workers
Less than high school 173,000 24,000 $20,000 $51,000
High school graduate 722,000 195,000 $26,000 $53,000
Some college 533,000 193,000 $31,000 $54,000
Associate's degree 200,000 92,000 $36,000 $57,000
All non-BA workers 1,629,000 503,000 $28,000 $54,000
BA+ Workers
Bachelor’s or higher 760,000 499,000 $50,000 $66,000
All workers 2,389,000 1,003,000 $33,000 $60,000
Top five industries
Industry
Number of non-
BA good jobs
Share of non-BA
good jobs
Share of non-BA
workers with good jobs
Median
earnings
Manufacturing 112,000 22% 40% $54,000
Transportation and utilities 64,000 13% 48% $59,000
Health services 62,000 12% 28% $51,000
Information, financial activities, and real estate 44,000 9% 40% $57,000
Construction 43,000 8% 35% $53,000
NON-BA GOOD JOBS
Top five occupations
Occupation
Number of non-
BA good jobs
Share of non-BA
good jobs
Share of non-BA
workers with good jobs
Median
earnings
Production 66,000 13% 32% $52,000
Office and administrative support 62,000 12% 23% $50,000
Management 61,000 12% 62% $65,000
Transportation and material moving 46,000 9% 28% $53,000
Sales and related 45,000 9% 29% $58,000
Source: Georgetown University Center on Education and the Workforce analysis of Bureau of the Census, American Community Survey
microdata 2013-2015.
Note: Figures in charts and tables may not sum due to rounding.

Good Jobs That Pay without a BA | A State-by-State Analysis109
Texas
Source: Georgetown University Center on Education and the Workforce analysis of Bureau of the Census, American Community Survey
microdata 2013-2015, US Census Bureau and Bureau of Labor Statistics, Current Population Survey (CPS) March Supplement data, 1992-2016.
Note: Figures in charts and tables may not sum due to rounding.
44%1,347,000 workers are employed in blue-collar industries56% 1,080,000 workers are employed
in skilled-services industries
earn between $35,000 and $45,000
$57,000Median earnings of non-BA workers with good jobs in 2015
21%
26%54%earn between $45,000 and
$55,000
earn $55,000 or
higher
Between 1991 and 2015 Texas gained 290,000 blue-collar non-BA good jobs, and 648,000 skilled-services good jobs for workers without BAs.
+290,000
+648,000
50%2,426,000 workers with
good jobs have at least a BA
BA non- BA
50%2,428,000 workers without
a BA have good jobs
67%of all workers do not have a BA
36%of non-BA workers have a good job
How big is the non-BA workforce?
Who has the good jobs? BA vs. non-BA
Earnings distribution of non-BA good jobs
Change in number of non-BA good jobs 1991-2015
Non-BA good jobs in blue-collar vs. skilled-services industries
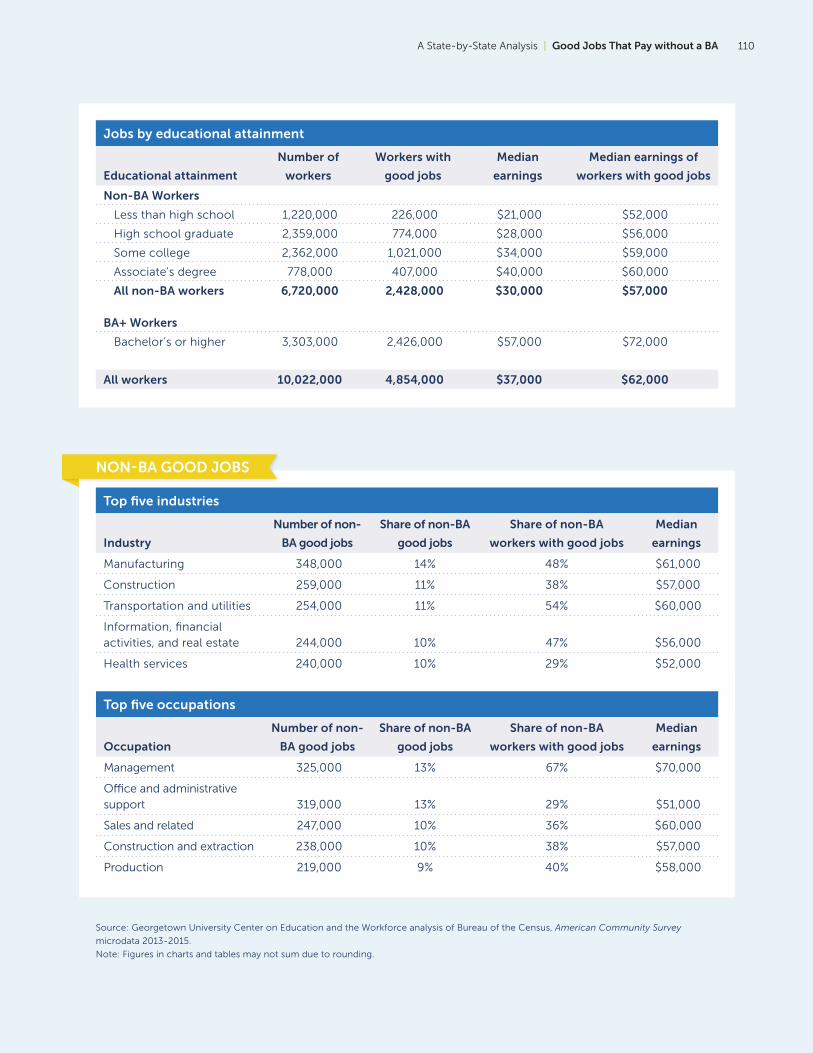
A State-by-State Analysis | Good Jobs That Pay without a BA 110
Jobs by educational attainment
Educational attainment
Number of
workers
Workers with
good jobs
Median
earnings
Median earnings of
workers with good jobs
Non-BA Workers
Less than high school 1,220,000 226,000 $21,000 $52,000
High school graduate 2,359,000 774,000 $28,000 $56,000
Some college 2,362,000 1,021,000 $34,000 $59,000
Associate's degree 778,000 407,000 $40,000 $60,000
All non-BA workers 6,720,000 2,428,000 $30,000 $57,000
BA+ Workers
Bachelor’s or higher 3,303,000 2,426,000 $57,000 $72,000
All workers 10,022,000 4,854,000 $37,000 $62,000
Top five industries
Industry
Number of non-
BA good jobs
Share of non-BA
good jobs
Share of non-BA
workers with good jobs
Median
earnings
Manufacturing 348,000 14% 48% $61,000
Construction 259,000 11% 38% $57,000
Transportation and utilities 254,000 11% 54% $60,000
Information, financial activities, and real estate 244,000 10% 47% $56,000
Health services 240,000 10% 29% $52,000
NON-BA GOOD JOBS
Top five occupations
Occupation
Number of non-
BA good jobs
Share of non-BA
good jobs
Share of non-BA
workers with good jobs
Median
earnings
Management 325,000 13% 67% $70,000
Office and administrative support 319,000 13% 29% $51,000
Sales and related 247,000 10% 36% $60,000
Construction and extraction 238,000 10% 38% $57,000
Production 219,000 9% 40% $58,000
Source: Georgetown University Center on Education and the Workforce analysis of Bureau of the Census, American Community Survey
microdata 2013-2015.
Note: Figures in charts and tables may not sum due to rounding.

Good Jobs That Pay without a BA | A State-by-State Analysis111
Utah
Source: Georgetown University Center on Education and the Workforce analysis of Bureau of the Census, American Community Survey
microdata 2013-2015, US Census Bureau and Bureau of Labor Statistics, Current Population Survey (CPS) March Supplement data, 1992-2016.
Note: Figures in charts and tables may not sum due to rounding.
44%153,000 workers are employed in blue-collar industries56% 121,000 workers are employed
in skilled-services industries
earn between $35,000 and $45,000
$56,000Median earnings of non-BA workers with good jobs in 2015
23%
26%52%earn between $45,000 and
$55,000
earn $55,000 or
higher
Between 1991 and 2015 Utah gained 92,000 blue-collar non-BA good jobs, and 81,000 skilled-services good jobs for workers without BAs.
+92,000 +81,000
47%244,000 workers with good
jobs have at least a BA
BA non- BA
53%275,000 workers without
a BA have good jobs
66%of all workers do not have a BA
39%of non-BA workers have a good job
How big is the non-BA workforce?
Who has the good jobs? BA vs. non-BA
Earnings distribution of non-BA good jobs
Change in number of non-BA good jobs 1991-2015
Non-BA good jobs in blue-collar vs. skilled-services industries

A State-by-State Analysis | Good Jobs That Pay without a BA 112
Jobs by educational attainment
Educational attainment
Number of
workers
Workers with
good jobs
Median
earnings
Median earnings of
workers with good jobs
Non-BA Workers
Less than high school 74,000 15,000 $23,000 $51,000
High school graduate 235,000 87,000 $30,000 $53,000
Some college 291,000 123,000 $32,000 $58,000
Associate's degree 112,000 51,000 $35,000 $57,000
All non-BA workers 711,000 275,000 $31,000 $56,000
BA+ Workers
Bachelor’s or higher 363,000 244,000 $52,000 $71,000
All workers 1,075,000 519,000 $36,000 $62,000
Top five industries
Industry
Number of non-
BA good jobs
Share of non-BA
good jobs
Share of non-BA
workers with good jobs
Median
earnings
Manufacturing 46,000 17% 47% $56,000
Construction 32,000 12% 47% $54,000
Information, financial ac-tivities, and real estate 27,000 10% 49% $59,000
Retail trade 27,000 10% 29% $53,000
Transportation and utilities 25,000 9% 55% $60,000
NON-BA GOOD JOBS
Top five occupations
Occupation
Number of non-
BA good jobs
Share of non-BA
good jobs
Share of non-BA
workers with good jobs
Median
earnings
Management 40,000 15% 67% $67,000
Sales and related 32,000 12% 41% $60,000
Office and administrative support 32,000 12% 25% $50,000
Construction and extraction 27,000 10% 48% $54,000
Production 27,000 10% 39% $53,000
Source: Georgetown University Center on Education and the Workforce analysis of Bureau of the Census, American Community Survey
microdata 2013-2015.
Note: Figures in charts and tables may not sum due to rounding.

Good Jobs That Pay without a BA | A State-by-State Analysis113
Vermont
Source: Georgetown University Center on Education and the Workforce analysis of Bureau of the Census, American Community Survey
microdata 2013-2015, US Census Bureau and Bureau of Labor Statistics, Current Population Survey (CPS) March Supplement data, 1992-2016.
Note: Figures in charts and tables may not sum due to rounding.
43%32,000 workers are employed in blue-collar industries57% 24,000 workers are employed
in skilled-services industries
earn between $35,000 and $45,000
$54,000Median earnings of non-BA workers with good jobs in 2015
20%
32%48%earn between $45,000 and
$55,000
earn $55,000 or
higher
-5,000
+8,000Between 1991 and 2015 Vermont lost 5,000 blue-collar non-BA good jobs, but gained 8,000 skilled-services good jobs for workers without BAs.
54%65,000 workers with good
jobs have at least a BA
BAnon- BA
46%55,000 workers without
a BA have good jobs
59%of all workers do not have a BA
37%of non-BA workers have a good job
How big is the non-BA workforce?
Who has the good jobs? BA vs. non-BA
Earnings distribution of non-BA good jobs
Change in number of non-BA good jobs 1991-2015
Non-BA good jobs in blue-collar vs. skilled-services industries

A State-by-State Analysis | Good Jobs That Pay without a BA 114
Jobs by educational attainment
Educational attainment
Number of
workers
Workers with
good jobs
Median
earnings
Median earnings of
workers with good jobs
Non-BA Workers
Less than high school 10,000 3,000 $23,000 $53,000
High school graduate 69,000 24,000 $32,000 $51,000
Some college 46,000 17,000 $32,000 $56,000
Associate's degree 23,000 12,000 $41,000 $58,000
All non-BA workers 148,000 55,000 $33,000 $54,000
BA+ Workers
Bachelor’s or higher 103,000 65,000 $49,000 $65,000
All workers 251,000 120,000 $38,000 $59,000
Top five industries
Industry
Number of non-
BA good jobs
Share of non-BA
good jobs
Share of non-BA
workers with good jobs
Median
earnings
Manufacturing 12,000 21% 47% $54,000
Construction 7,000 12% 50% $53,000
Health services 6,000 11% 30% $51,000
Retail trade 5,000 9% 25% $52,000
Information, financial activities, and real estate 5,000 10% 51% $60,000
NON-BA GOOD JOBS
Top five occupations
Occupation
Number of non-
BA good jobs
Share of non-BA
good jobs
Share of non-BA
workers with good jobs
Median
earnings
Management 8,000 15% 63% $65,000
Office and administrative support 7,000 13% 32% $52,000
Production 6,000 11% 39% $50,000
Sales and related 5,000 9% 35% $57,000
Construction and extraction 5,000 9% 44% $52,000
Source: Georgetown University Center on Education and the Workforce analysis of Bureau of the Census, American Community Survey
microdata 2013-2015.
Note: Figures in charts and tables may not sum due to rounding.
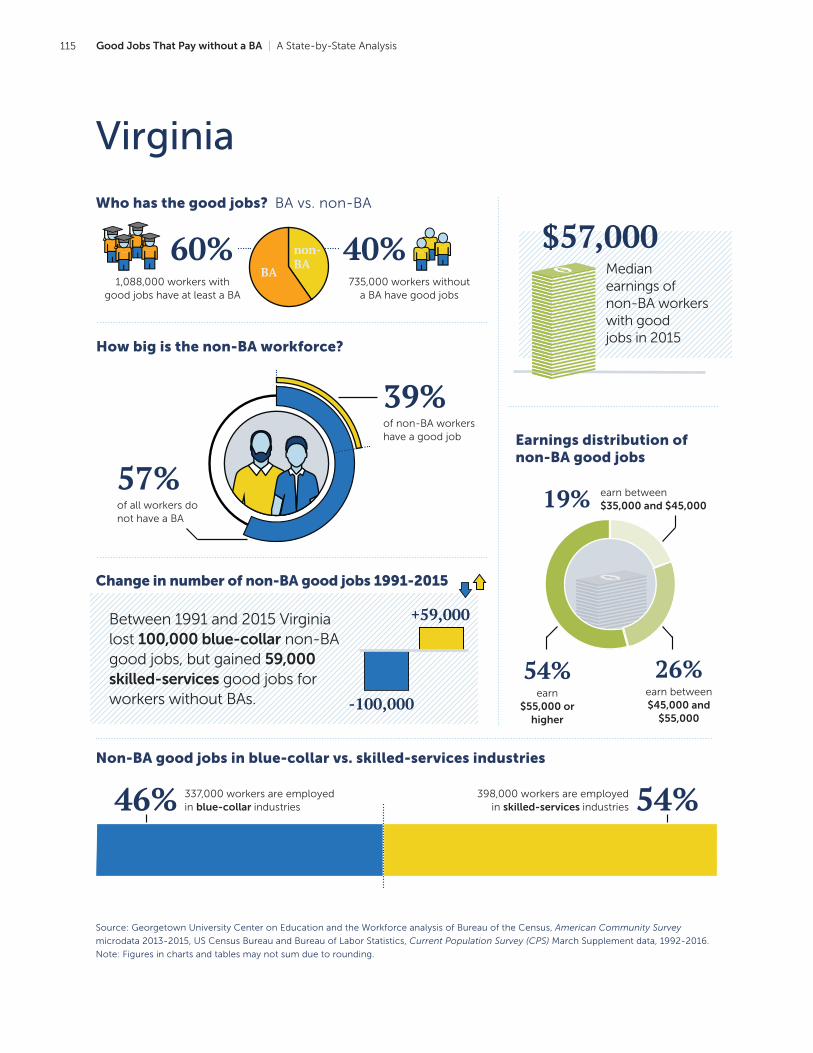
Good Jobs That Pay without a BA | A State-by-State Analysis115
Virginia
Source: Georgetown University Center on Education and the Workforce analysis of Bureau of the Census, American Community Survey
microdata 2013-2015, US Census Bureau and Bureau of Labor Statistics, Current Population Survey (CPS) March Supplement data, 1992-2016.
Note: Figures in charts and tables may not sum due to rounding.
54%337,000 workers are employed in blue-collar industries46% 398,000 workers are employed
in skilled-services industries
earn between $35,000 and $45,000
$57,000Median earnings of non-BA workers with good jobs in 2015
19%
26%54%earn between $45,000 and
$55,000
earn $55,000 or
higher-100,000
+59,000Between 1991 and 2015 Virginia lost 100,000 blue-collar non-BA good jobs, but gained 59,000 skilled-services good jobs for workers without BAs.
60%1,088,000 workers with
good jobs have at least a BA
BA
non- BA
40%735,000 workers without
a BA have good jobs
57%of all workers do not have a BA
39%of non-BA workers have a good job
How big is the non-BA workforce?
Who has the good jobs? BA vs. non-BA
Earnings distribution of non-BA good jobs
Change in number of non-BA good jobs 1991-2015
Non-BA good jobs in blue-collar vs. skilled-services industries

A State-by-State Analysis | Good Jobs That Pay without a BA 116
Jobs by educational attainment
Educational attainment
Number of
workers
Workers with
good jobs
Median
earnings
Median earnings of
workers with good jobs
Non-BA Workers
Less than high school 212,000 44,000 $23,000 $51,000
High school graduate 744,000 251,000 $30,000 $55,000
Some college 679,000 302,000 $36,000 $60,000
Associate's degree 275,000 138,000 $39,000 $60,000
All non-BA workers 1,911,000 735,000 $31,000 $57,000
BA+ Workers
Bachelor’s or higher 1,442,000 1,088,000 $65,000 $83,000
All workers 3,353,000 1,822,000 $42,000 $70,000
Top five industries
Industry
Number of non-
BA good jobs
Share of non-BA
good jobs
Share of non-BA
workers with good jobs
Median
earnings
Manufacturing 98,000 13% 50% $57,000
Public administration 88,000 12% 61% $63,000
Construction 79,000 11% 43% $53,000
Health services 73,000 10% 30% $54,000
Information, financial activities, and real estate 72,000 10% 53% $60,000
NON-BA GOOD JOBS
Top five occupations
Occupation
Number of non-
BA good jobs
Share of non-BA
good jobs
Share of non-BA
workers with good jobs
Median
earnings
Management 101,000 14% 69% $72,000
Office and administrative support 96,000 13% 31% $53,000
Construction and extraction 66,000 9% 42% $52,000
Sales and related 65,000 9% 34% $56,000
Installation, maintenance, and repair 55,000 8% 58% $56,000
Source: Georgetown University Center on Education and the Workforce analysis of Bureau of the Census, American Community Survey
microdata 2013-2015.
Note: Figures in charts and tables may not sum due to rounding.

Good Jobs That Pay without a BA | A State-by-State Analysis117
Washington
Source: Georgetown University Center on Education and the Workforce analysis of Bureau of the Census, American Community Survey
microdata 2013-2015, US Census Bureau and Bureau of Labor Statistics, Current Population Survey (CPS) March Supplement data, 1992-2016.
Note: Figures in charts and tables may not sum due to rounding.
45%401,000 workers are employed in blue-collar industries55% 333,000 workers are employed
in skilled-services industries
earn between $35,000 and $45,000
$59,000Median earnings of non-BA workers with good jobs in 2015
18%
26%56%earn between $45,000 and
$55,000
earn $55,000 or
higher
Between 1991 and 2015 Washington gained 30,000 blue-collar non-BA good jobs, and 93,000 skilled-services good jobs for workers without BAs.
+30,000
+93,000
51%770,000 workers with good
jobs have at least a BA
BA non- BA
49%733,000 workers without
a BA have good jobs
62%of all workers do not have a BA
42%of non-BA workers have a good job
How big is the non-BA workforce?
Who has the good jobs? BA vs. non-BA
Earnings distribution of non-BA good jobs
Change in number of non-BA good jobs 1991-2015
Non-BA good jobs in blue-collar vs. skilled-services industries
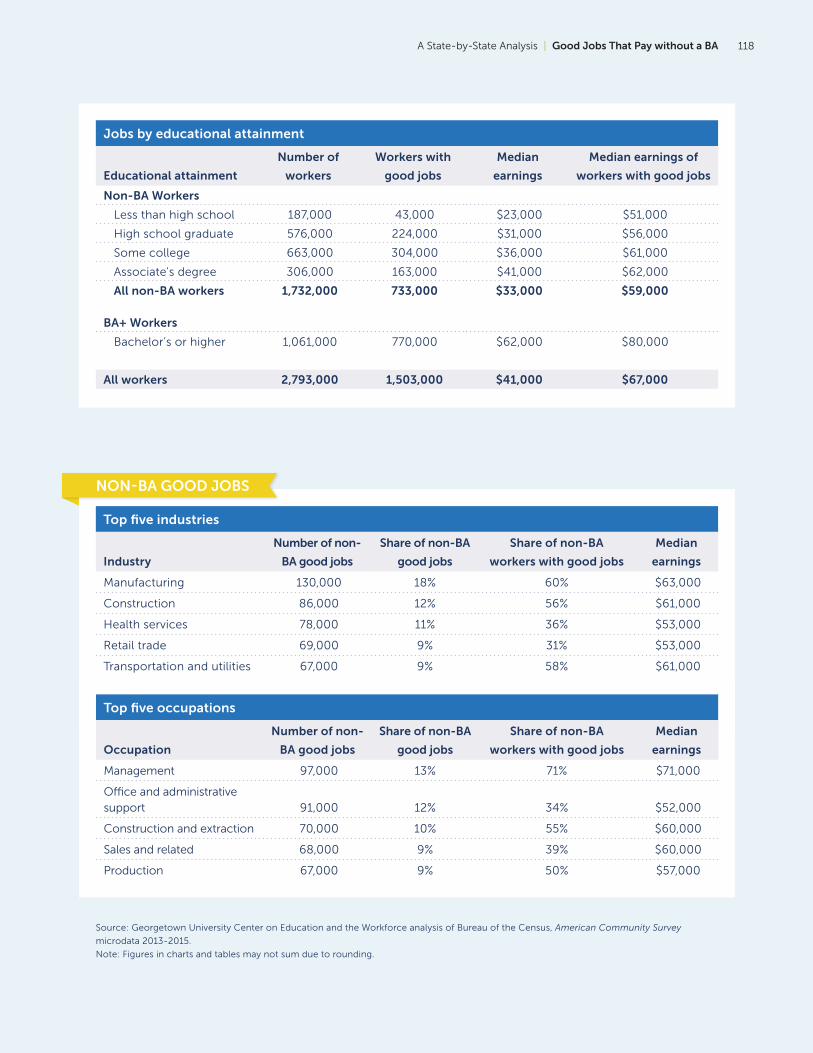
A State-by-State Analysis | Good Jobs That Pay without a BA 118
Jobs by educational attainment
Educational attainment
Number of
workers
Workers with
good jobs
Median
earnings
Median earnings of
workers with good jobs
Non-BA Workers
Less than high school 187,000 43,000 $23,000 $51,000
High school graduate 576,000 224,000 $31,000 $56,000
Some college 663,000 304,000 $36,000 $61,000
Associate's degree 306,000 163,000 $41,000 $62,000
All non-BA workers 1,732,000 733,000 $33,000 $59,000
BA+ Workers
Bachelor’s or higher 1,061,000 770,000 $62,000 $80,000
All workers 2,793,000 1,503,000 $41,000 $67,000
Top five industries
Industry
Number of non-
BA good jobs
Share of non-BA
good jobs
Share of non-BA
workers with good jobs
Median
earnings
Manufacturing 130,000 18% 60% $63,000
Construction 86,000 12% 56% $61,000
Health services 78,000 11% 36% $53,000
Retail trade 69,000 9% 31% $53,000
Transportation and utilities 67,000 9% 58% $61,000
NON-BA GOOD JOBS
Top five occupations
Occupation
Number of non-
BA good jobs
Share of non-BA
good jobs
Share of non-BA
workers with good jobs
Median
earnings
Management 97,000 13% 71% $71,000
Office and administrative support 91,000 12% 34% $52,000
Construction and extraction 70,000 10% 55% $60,000
Sales and related 68,000 9% 39% $60,000
Production 67,000 9% 50% $57,000
Source: Georgetown University Center on Education and the Workforce analysis of Bureau of the Census, American Community Survey
microdata 2013-2015.
Note: Figures in charts and tables may not sum due to rounding.
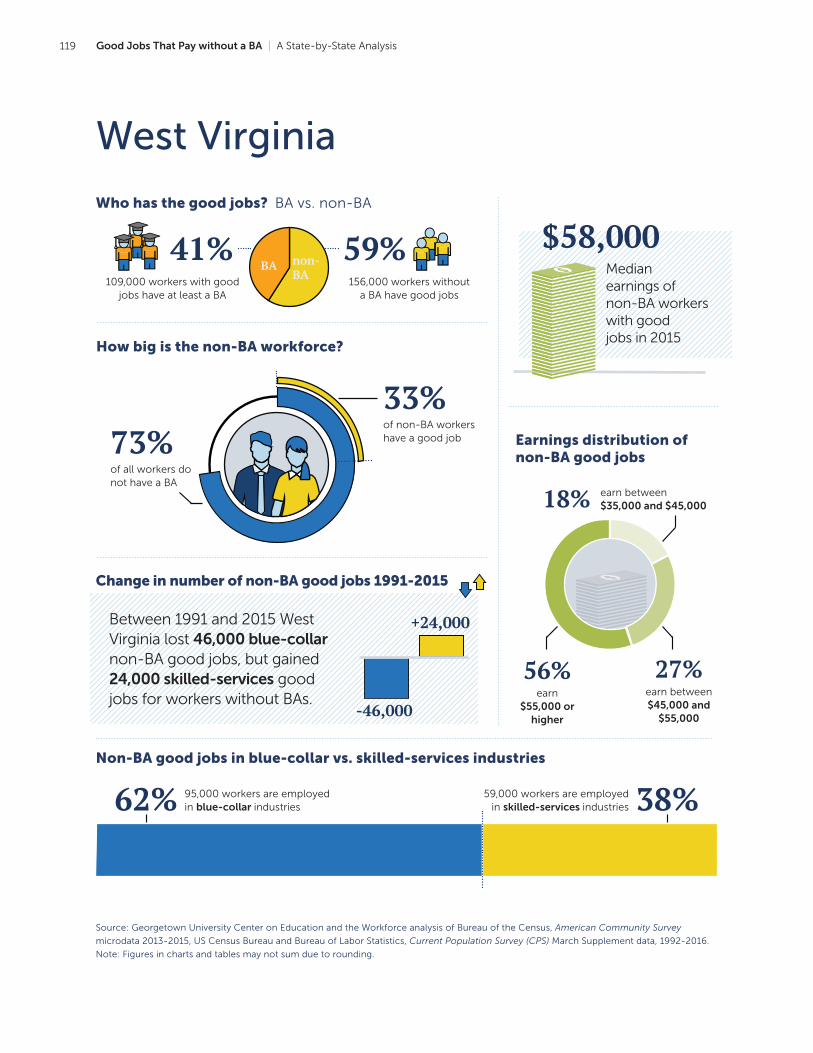
Good Jobs That Pay without a BA | A State-by-State Analysis119
West Virginia
Source: Georgetown University Center on Education and the Workforce analysis of Bureau of the Census, American Community Survey
microdata 2013-2015, US Census Bureau and Bureau of Labor Statistics, Current Population Survey (CPS) March Supplement data, 1992-2016.
Note: Figures in charts and tables may not sum due to rounding.
38%95,000 workers are employed in blue-collar industries62% 59,000 workers are employed
in skilled-services industries
earn between $35,000 and $45,000
$58,000Median earnings of non-BA workers with good jobs in 2015
18%
27%56%earn between $45,000 and
$55,000
earn $55,000 or
higher-46,000
+24,000Between 1991 and 2015 West Virginia lost 46,000 blue-collar non-BA good jobs, but gained 24,000 skilled-services good jobs for workers without BAs.
41%109,000 workers with good
jobs have at least a BA
BA non- BA
59%156,000 workers without
a BA have good jobs
73%of all workers do not have a BA
33%of non-BA workers have a good job
How big is the non-BA workforce?
Who has the good jobs? BA vs. non-BA
Earnings distribution of non-BA good jobs
Change in number of non-BA good jobs 1991-2015
Non-BA good jobs in blue-collar vs. skilled-services industries

A State-by-State Analysis | Good Jobs That Pay without a BA 120
Jobs by educational attainment
Educational attainment
Number of
workers
Workers with
good jobs
Median
earnings
Median earnings of
workers with good jobs
Non-BA Workers
Less than high school 38,000 7,000 $21,000 $56,000
High school graduate 241,000 77,000 $28,000 $58,000
Some college 133,000 46,000 $30,000 $60,000
Associate's degree 56,000 25,000 $35,000 $56,000
All non-BA workers 469,000 156,000 $29,000 $58,000
BA+ Workers
Bachelor’s or higher 170,000 109,000 $47,000 $62,000
All workers 638,000 265,000 $33,000 $60,000
Top five industries
Industry
Number of non-
BA good jobs
Share of non-BA
good jobs
Share of non-BA
workers with good jobs
Median
earnings
Natural resources 22,000 14% 69% $70,000
Manufacturing 21,000 14% 48% $58,000
Transportation and utilities 18,000 12% 55% $62,000
Construction 17,000 11% 44% $61,000
Health services 17,000 11% 23% $52,000
NON-BA GOOD JOBS
Top five occupations
Occupation
Number of non-
BA good jobs
Share of non-BA
good jobs
Share of non-BA
workers with good jobs
Median
earnings
Construction and extraction 28,000 18% 55% $66,000
Production 17,000 11% 44% $60,000
Transportation and material moving 16,000 10% 35% $59,000
Management 14,000 9% 55% $65,000
Office and administrative support 14,000 9% 20% $51,000
Source: Georgetown University Center on Education and the Workforce analysis of Bureau of the Census, American Community Survey
microdata 2013-2015.
Note: Figures in charts and tables may not sum due to rounding.

Good Jobs That Pay without a BA | A State-by-State Analysis121
Wisconsin
Source: Georgetown University Center on Education and the Workforce analysis of Bureau of the Census, American Community Survey
microdata 2013-2015, US Census Bureau and Bureau of Labor Statistics, Current Population Survey (CPS) March Supplement data, 1992-2016.
Note: Figures in charts and tables may not sum due to rounding.
36%377,000 workers are employed in blue-collar industries64% 215,000 workers are employed
in skilled-services industries
earn between $35,000 and $45,000
$54,000Median earnings of non-BA workers with good jobs in 2015
20%
31%49%earn between $45,000 and
$55,000
earn $55,000 or
higher-56,000
+44,000Between 1991 and 2015 Wisconsin lost 56,000 blue-collar non-BA good jobs, but gained 44,000 skilled-services good jobs for workers without BAs.
48%554,000 workers with good
jobs have at least a BA
BA non- BA
52%591,000 workers without
a BA have good jobs
66%of all workers do not have a BA
37%of non-BA workers have a good job
How big is the non-BA workforce?
Who has the good jobs? BA vs. non-BA
Earnings distribution of non-BA good jobs
Change in number of non-BA good jobs 1991-2015
Non-BA good jobs in blue-collar vs. skilled-services industries

A State-by-State Analysis | Good Jobs That Pay without a BA 122
Jobs by educational attainment
Educational attainment
Number of
workers
Workers with
good jobs
Median
earnings
Median earnings of
workers with good jobs
Non-BA Workers
Less than high school 116,000 22,000 $22,000 $51,000
High school graduate 647,000 217,000 $31,000 $52,000
Some college 514,000 199,000 $32,000 $56,000
Associate's degree 305,000 154,000 $40,000 $56,000
All non-BA workers 1,582,000 591,000 $32,000 $54,000
BA+ Workers
Bachelor’s or higher 799,000 554,000 $53,000 $67,000
All workers 2,380,000 1,145,000 $38,000 $60,000
Top five industries
Industry
Number of non-
BA good jobs
Share of non-BA
good jobs
Share of non-BA
workers with good jobs
Median
earnings
Manufacturing 187,000 32% 49% $55,000
Construction 64,000 11% 55% $59,000
Health services 61,000 10% 27% $52,000
Transportation and utilities 49,000 8% 56% $58,000
Information, financial activities, and real estate 47,000 8% 46% $54,000
NON-BA GOOD JOBS
Top five occupations
Occupation
Number of non-
BA good jobs
Share of non-BA
good jobs
Share of non-BA
workers with good jobs
Median
earnings
Production 102,000 17% 42% $52,000
Management 68,000 12% 63% $67,000
Office and administrative support 67,000 11% 26% $50,000
Construction and extraction 55,000 9% 56% $58,000
Transportation and material moving 52,000 9% 34% $52,000
Source: Georgetown University Center on Education and the Workforce analysis of Bureau of the Census, American Community Survey
microdata 2013-2015.
Note: Figures in charts and tables may not sum due to rounding.

Good Jobs That Pay without a BA | A State-by-State Analysis123
Wyoming
Source: Georgetown University Center on Education and the Workforce analysis of Bureau of the Census, American Community Survey
microdata 2013-2015, US Census Bureau and Bureau of Labor Statistics, Current Population Survey (CPS) March Supplement data, 1992-2016.
Note: Figures in charts and tables may not sum due to rounding.
35%50,000 workers are employed in blue-collar industries65% 27,000 workers are employed
in skilled-services industries
earn between $35,000 and $45,000
$62,000Median earnings of non-BA workers with good jobs in 2015
15%
23%62%earn between $45,000 and
$55,000
earn $55,000 or
higher
Between 1991 and 2015 Wyoming gained 12,000 blue-collar non-BA good jobs, and 15,000 skilled-services good jobs for workers without BAs.
+12,000 +15,000
39%47,000 workers with good
jobs have at least a BA
BA non- BA
61%75,000 workers without
a BA have good jobs
71%of all workers do not have a BA
44%of non-BA workers have a good job
Who has the good jobs? BA vs. non-BA
How big is the non-BA workforce?
Earnings distribution of non-BA good jobs
Change in number of non-BA good jobs 1991-2015
Non-BA good jobs in blue-collar vs. skilled-services industries
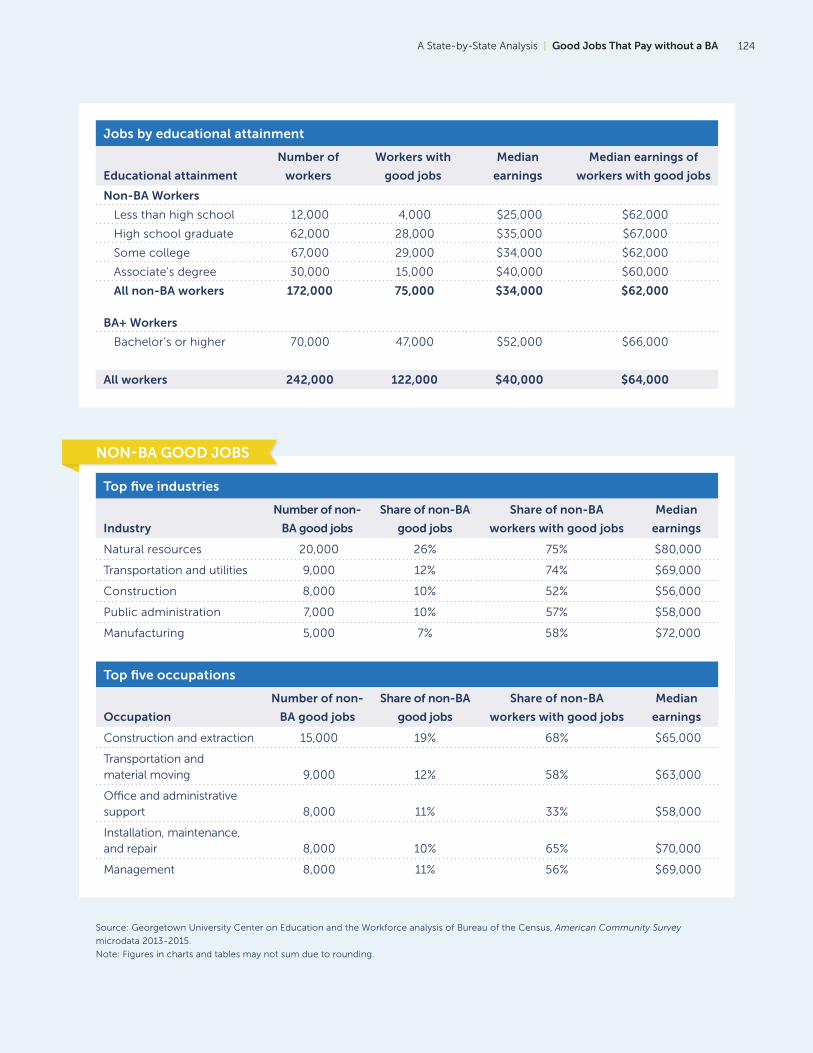
A State-by-State Analysis | Good Jobs That Pay without a BA 124
Jobs by educational attainment
Educational attainment
Number of
workers
Workers with
good jobs
Median
earnings
Median earnings of
workers with good jobs
Non-BA Workers
Less than high school 12,000 4,000 $25,000 $62,000
High school graduate 62,000 28,000 $35,000 $67,000
Some college 67,000 29,000 $34,000 $62,000
Associate's degree 30,000 15,000 $40,000 $60,000
All non-BA workers 172,000 75,000 $34,000 $62,000
BA+ Workers
Bachelor’s or higher 70,000 47,000 $52,000 $66,000
All workers 242,000 122,000 $40,000 $64,000
Top five industries
Industry
Number of non-
BA good jobs
Share of non-BA
good jobs
Share of non-BA
workers with good jobs
Median
earnings
Natural resources 20,000 26% 75% $80,000
Transportation and utilities 9,000 12% 74% $69,000
Construction 8,000 10% 52% $56,000
Public administration 7,000 10% 57% $58,000
Manufacturing 5,000 7% 58% $72,000
NON-BA GOOD JOBS
Top five occupations
Occupation
Number of non-
BA good jobs
Share of non-BA
good jobs
Share of non-BA
workers with good jobs
Median
earnings
Construction and extraction 15,000 19% 68% $65,000
Transportation and material moving 9,000 12% 58% $63,000
Office and administrative support 8,000 11% 33% $58,000
Installation, maintenance, and repair 8,000 10% 65% $70,000
Management 8,000 11% 56% $69,000
Source: Georgetown University Center on Education and the Workforce analysis of Bureau of the Census, American Community Survey
microdata 2013-2015.
Note: Figures in charts and tables may not sum due to rounding.
Good Jobs That Pay without a BA | A State-by-State Analysis125
References
Carnevale, Anthony P., Tamara Jayasundera, and Artem Gulish. America’s Divided Recovery: College Haves and Have-Nots. Washington, DC: Georgetown University Center on Education and the Workforce, 2016.
Carnevale, Anthony P., Tamara Jayasundera, and Andrew R. Hanson. Career and Technical Education: Five Ways That Pay Along the Way to the B.A. Washington, DC: Georgetown University Center on Education and the Workforce, 2012.
Carnevale, Anthony P., Jeff Strohl, Ban Cheah, and Neil Ridley. Good Jobs That Pay without a BA. Washington, DC: Georgetown University Center on Education and the Workforce, 2017.
Carnevale, Anthony P., and Stephen J. Rose. The Economy Goes to College: The Hidden Promise of Higher Education in the Post-Industrial Service Economy. Washington, DC: Georgetown University Center on Education and the Workforce, 2015.
Carnevale, Anthony P., and Nicole Smith. A Decade Behind: Breaking Out of the Low-Skill Trap in the Southern Economy. Washington, DC: Georgetown University Center on Education and the Workforce, 2012.
Carnevale, Anthony P., Nicole Smith, and Jeff Strohl. Recovery: Job Growth and Education Requirements Through 2020. Washington, DC: Georgetown University Center on Education and the Workforce, 2013.
Carnevale, Anthony P., Tamara Jayasundera, Dmitri Repnikov, and Artem Gulish. State Online College Job Market: Ranking the States. Washington, DC: Georgetown University Center on Education and the Workforce, 2015.
Holzer, Harry. Job Market Polarization and U.S. Worker Skills: A Tale of Two Middles. Washington, DC: The Brookings Institution, 2015.
US Bureau of Economic Analysis. “Regional Price Parities by State,” Real Personal Income for States and Metropolitan Areas, 2015. Washington, DC: US Department of Commerce, 2017.
US Census Bureau and Bureau of Labor Statistics, Current Population Survey March Supplement (Annual Economic and Social Supplement) microdata files. Washington, DC: US Census Bureau and Bureau of Labor Statistics, 1992–2016. https://thedataweb.rm.census.gov/ftp/cps_ftp.html.
A State-by-State Analysis | Good Jobs That Pay without a BA 126
Appendix. Data Sources and
Methodology
This report uses data from Current Population Survey (CPS) Annual Social and Economic
Supplement (ASEC, also known as the March Supplement), 1992–2016, an annual survey
administered by the US Census Bureau on behalf of the US Bureau of Labor Statistics (BLS).
The survey reports information from the previous year, so the report refers to the period
of 1991 to 2015. The CPS surveys from 1992–2016 for workers aged 25-to-64 are used to
estimate the employment by state, level of educational attainment, industry, and occupation.
This report uses the 1992 survey as the first year because it is the first time the “some
college” category can be separately identified from associate’s degrees. Workers’ educational
attainment level is presented using four levels: less than high school, high school graduate,
some college, and associate’s degree.
The industry analysis in the main report uses 10 major industry groups based on the North
American Industry Classification System. For the purposes of this analysis, we further group
industries into two categories: traditional blue collar and skilled services. Traditional blue-
collar industries include manufacturing; transportation and utilities; construction; wholesale
and retail trade; and natural resources. Skilled-services industries include financial and
business services; education services; healthcare services; leisure and hospitality, and
personal services; and government services.
State profiles are based on micro data from the American Community Survey, an annual
survey from the US Census Bureau. Data from 2013, 2014, and 2015 were pooled and
limited to workers aged 25-64 who were employed. For the state profiles, we use industry
classifications established by the US Census Bureau.


Good Jobs That Pay without a BA: A State-by-State Analysis can be accessed online at GoodJobsData.org.
The Georgetown University Center on Education and the Workforce3300 Whitehaven St. NW, Suite 3200Washington, D.C. 20007cew.georgetown.edu
facebook.com/GeorgetownCEW
twitter.com/GeorgetownCEW
linkedin.com/company/GeorgetownCEW