GOMS Analysis & Automated Usability Assessment Melody Y. Ivory (UCB CS) SIMS 213, UI Design &...
44
GOMS Analysis & Automated Usability Assessment Melody Y. Ivory (UCB CS) SIMS 213, UI Design & Development March 8, 2001
-
date post
19-Dec-2015 -
Category
Documents
-
view
214 -
download
0
Transcript of GOMS Analysis & Automated Usability Assessment Melody Y. Ivory (UCB CS) SIMS 213, UI Design &...
GOMS Analysis & Automated Usability Assessment
Melody Y. Ivory (UCB CS)
SIMS 213, UI Design & DevelopmentMarch 8, 2001

2
GOMS Analysis Outline
GOMS at a glance Model Human Processor Original GOMS (CMN-GOMS) Variants of GOMS GOMS in practice Summary
3
GOMS at a glance
Proposed by Card, Moran & Newell in 1983– apply psychology to CS
employ user model (MHP) to predict performance of tasks in UI
– task completion time, short-term memory requirements
– applicable to user interface design and evaluation training and documentation

4
Model Human Processor (MHP)
Card, Moran & Newell (1983)– most influential model of user
interaction – 3 interacting subsystems
cognitive, perceptual & motor each with processor & memory
– described by parameters e.g. capacity, cycle time
serial & parallel processing
Adapted from slide by Dan Glaser
5
MHP
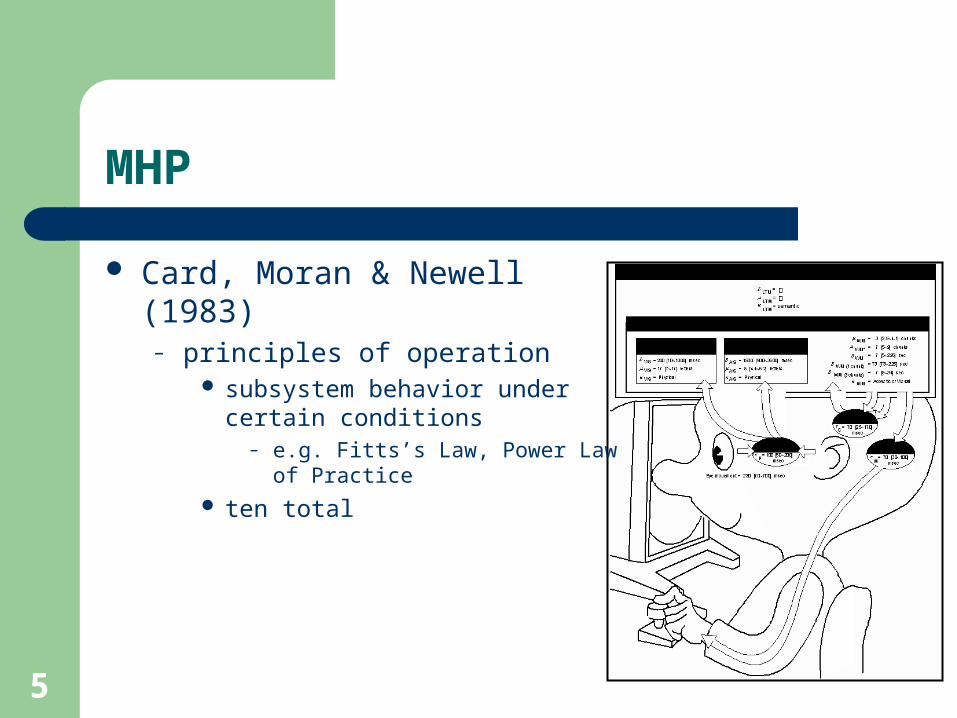
Card, Moran & Newell (1983)– principles of operation
subsystem behavior under certain conditions
– e.g. Fitts’s Law, Power Law of Practice
ten total
6
MHP Subsystems
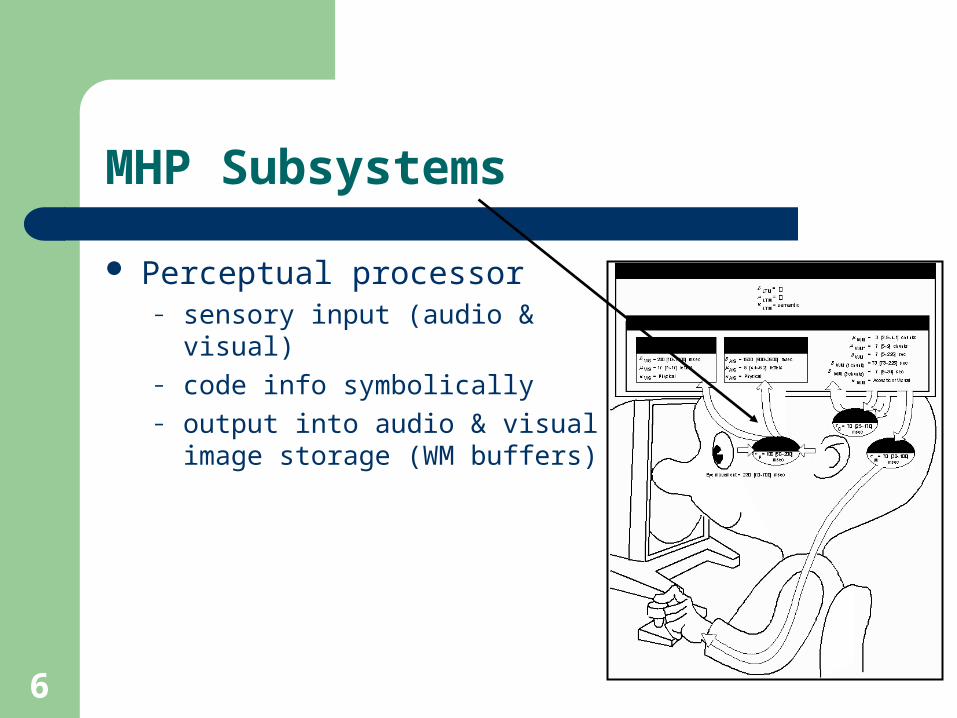
Perceptual processor– sensory input (audio & visual)– code info symbolically– output into audio & visual image
storage (WM buffers)

7
MHP Subsystems
Cognitive processor– input from sensory buffers– access LTM to determine response
previously stored info
– output response into WM
8
MHP Subsystems
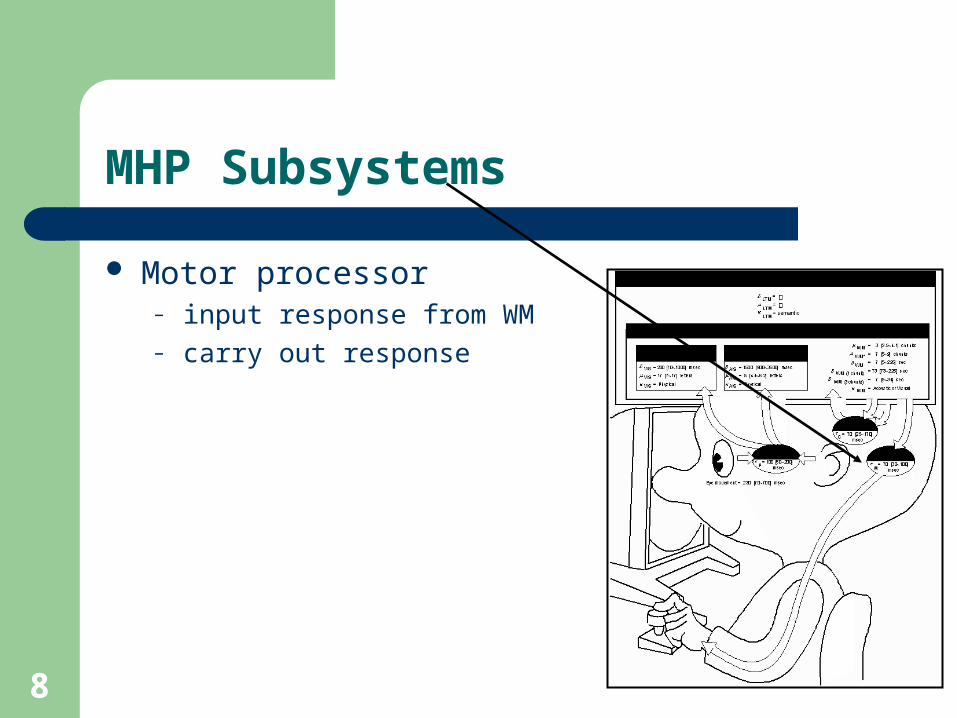
Motor processor– input response from WM– carry out response
9
MHP Subsystem Interactions
Input/output Processing
– serial action pressing key in response to light
– parallel perception driving, reading signs & hearing

10
MHP Parameters
Based on empirical data– word processing in the ‘70s
Processors have – cycle time ()
Memories have – storage capacity ()– decay time of an item ()– info code type ()
physical, acoustic, visual & semantic

11
Perceptual Subsystem Parameters
Processor– cycle time () = 100 msec
Visual Image Store– storage capacity () = 17
letters– decay time of an item () =
200 msec– info code type () = physical
physical properties of visual stimulus
– e.g. intensity, color, curvature, length

12
One Principle of Operation
Power Law of Practice– task time on the nth trial follows a power law
Tn = T1 n-a, where a = .4
i.e., you get faster the more times you do it! applies to skilled behavior (perceptual & motor) does not apply to knowledge acquisition or quality
13
Original GOMS (CMN-GOMS)
Card, Moran & Newell (1983) Engineering model of user interaction
– task analysis (“how to” knowledge) Goals - user’s intentions (tasks)
– e.g. delete a file, edit text, assist a customer Operators - actions to complete task
– cognitive, perceptual & motor (MHP)– low-level (e.g. move the mouse to menu)
14
CMN-GOMS
Engineering model of user interaction– task analysis (“how to” knowledge)
Methods - sequences of actions (operators)– based on error-free expert– may be multiple methods for accomplishing same goal
e.g. shortcut key or menu selection Selections - rules for choosing appropriate method
– method predicted based on context
– explicit task structure hierarchy of goals & sub-goals

15
Text-Editing Example

16
CMN-GOMS Analysis
Analysis of explicit task structure– add parameters for operators
approximations (MHP) or empirical data single value or parameterized estimate
– predict user performance execution time (count statements in task structure) short-term memory requirements (stacking depth of task
structure)
– apply before user testing (reduce costs)
17
Limitations of CMN-GOMS
No directions for task analysis– granularity (start & stop)
Serial v.s. parallel perceptual processing– contrary to MHP
Only one active goal Error-free expert performance
– no problem solving or evaluation Norman’s Action Cycle
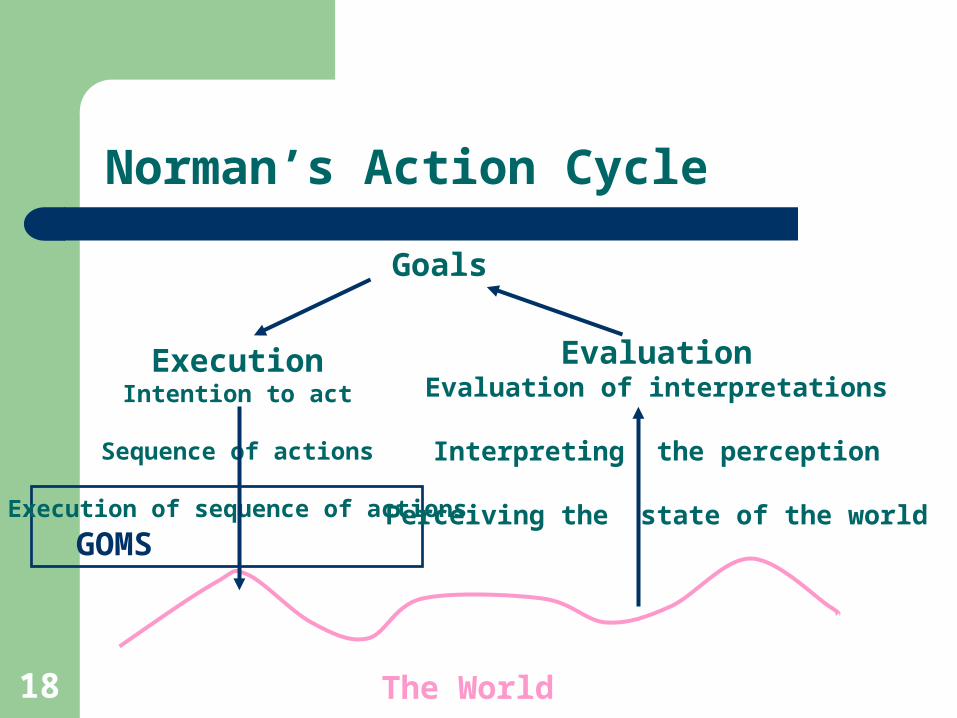
18
Norman’s Action Cycle
Goals
EvaluationEvaluation of interpretations
Interpreting the perception
Perceiving the state of the world
ExecutionIntention to act
Sequence of actions
Execution of sequence of actions
The World
GOMS
19
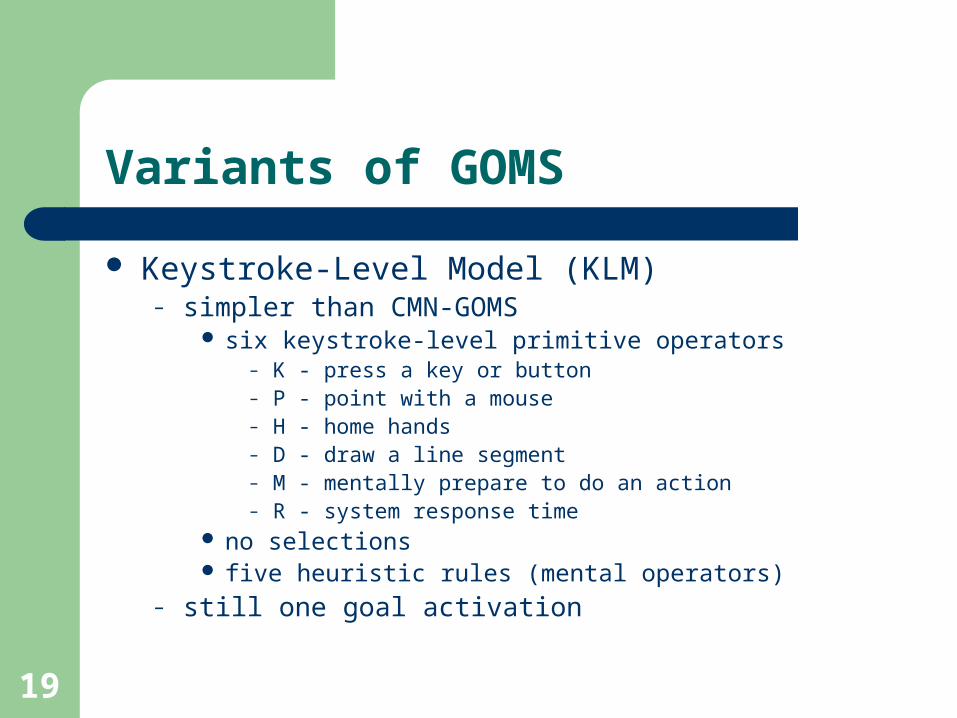
Variants of GOMS
Keystroke-Level Model (KLM)– simpler than CMN-GOMS
six keystroke-level primitive operators– K - press a key or button– P - point with a mouse– H - home hands– D - draw a line segment– M - mentally prepare to do an action– R - system response time
no selections five heuristic rules (mental operators)
– still one goal activation

20
Text-Editing Example (KLM)
21
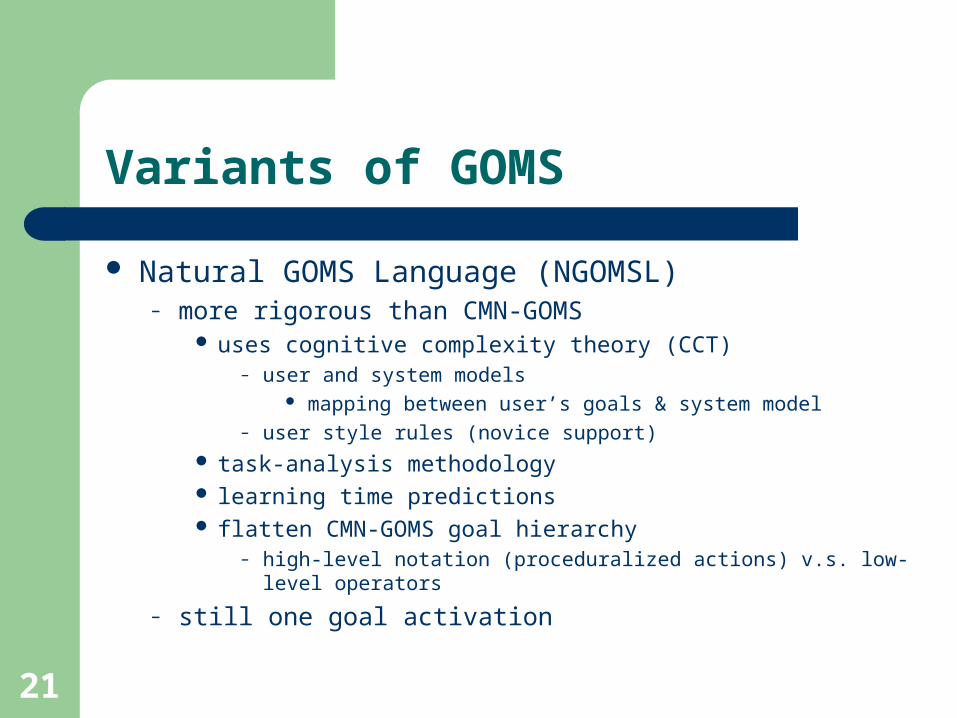
Variants of GOMS
Natural GOMS Language (NGOMSL)– more rigorous than CMN-GOMS
uses cognitive complexity theory (CCT)– user and system models
mapping between user’s goals & system model– user style rules (novice support)
task-analysis methodology learning time predictions flatten CMN-GOMS goal hierarchy
– high-level notation (proceduralized actions) v.s. low-level operators
– still one goal activation

22
Text-Editing Example (NGOMSL)
23
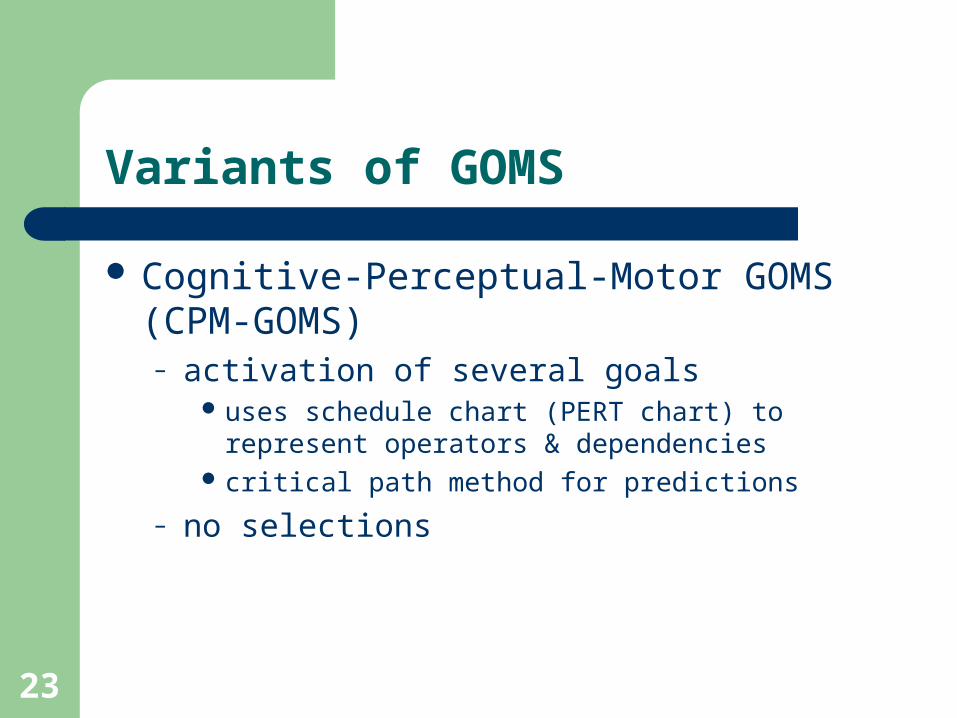
Variants of GOMS
Cognitive-Perceptual-Motor GOMS (CPM-GOMS)– activation of several goals
uses schedule chart (PERT chart) to represent operators & dependencies
critical path method for predictions
– no selections

24
Text-Editing Ex. (CPM-GOMS)
25
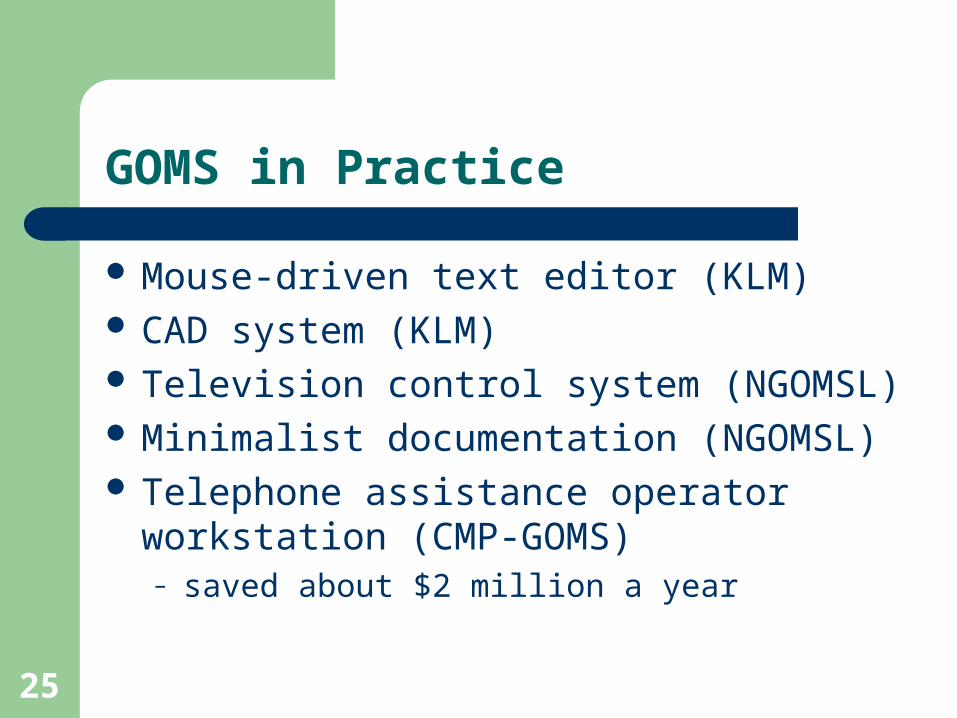
GOMS in Practice
Mouse-driven text editor (KLM) CAD system (KLM) Television control system (NGOMSL) Minimalist documentation (NGOMSL) Telephone assistance operator workstation
(CMP-GOMS)– saved about $2 million a year
26
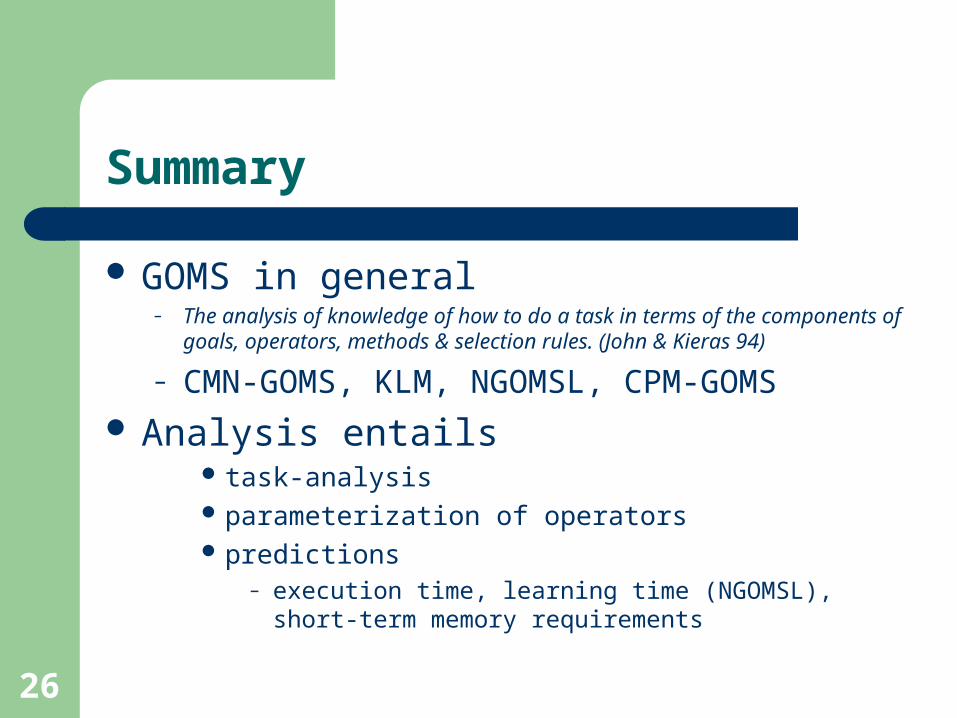
Summary
GOMS in general– The analysis of knowledge of how to do a task in terms of the components of
goals, operators, methods & selection rules. (John & Kieras 94)
– CMN-GOMS, KLM, NGOMSL, CPM-GOMS
Analysis entails task-analysis parameterization of operators predictions
– execution time, learning time (NGOMSL), short-term memory requirements

27
Automated Usability Assessment Outline
Automated Usability Assessment? Characterizing Automated Methods Automated Assessment Methods Summary

28
Automated Usability Assessment?
What does it mean to automate assessment? How could this be done? What does it require?
29
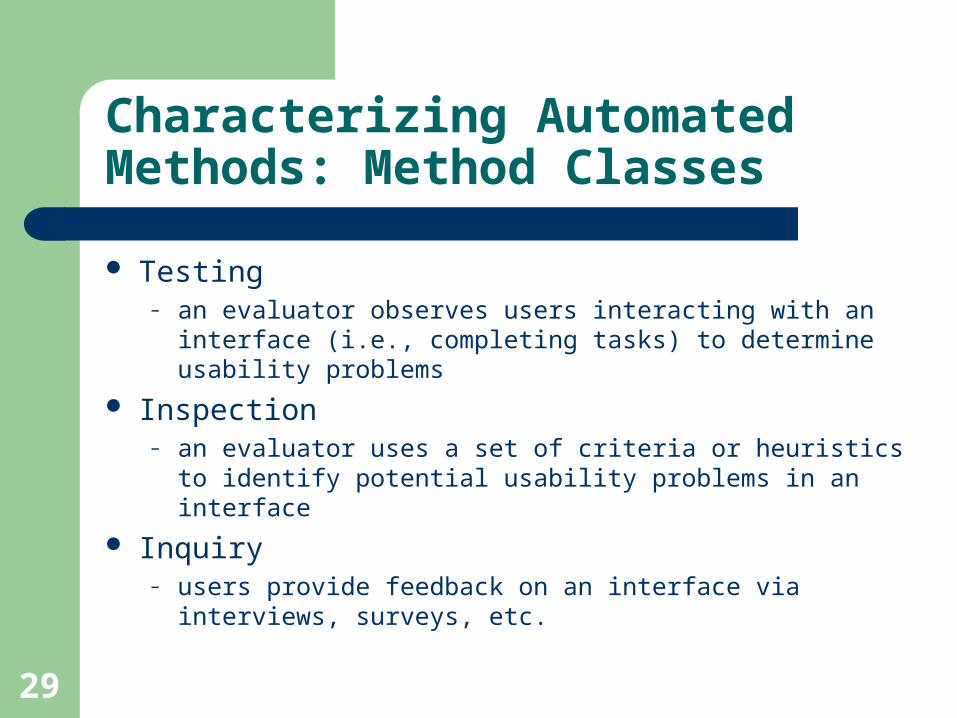
Characterizing Automated Methods: Method Classes
Testing– an evaluator observes users interacting with an interface (i.e.,
completing tasks) to determine usability problems
Inspection– an evaluator uses a set of criteria or heuristics to identify
potential usability problems in an interface
Inquiry– users provide feedback on an interface via interviews,
surveys, etc.
30
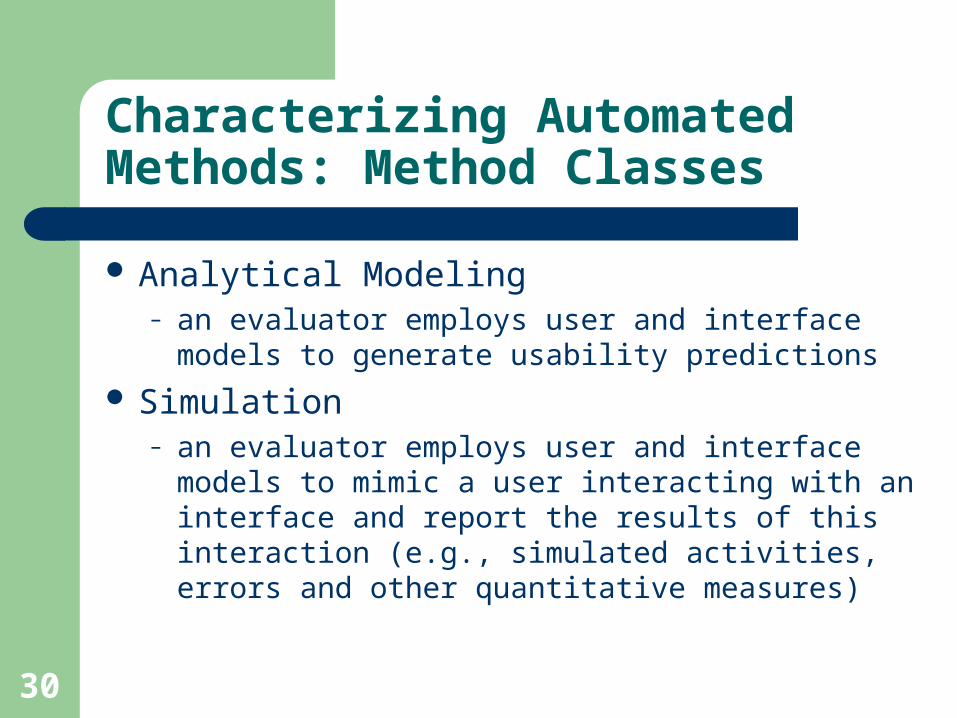
Characterizing Automated Methods: Method Classes
Analytical Modeling– an evaluator employs user and interface models to
generate usability predictions
Simulation– an evaluator employs user and interface models to
mimic a user interacting with an interface and report the results of this interaction (e.g., simulated activities, errors and other quantitative measures)
31
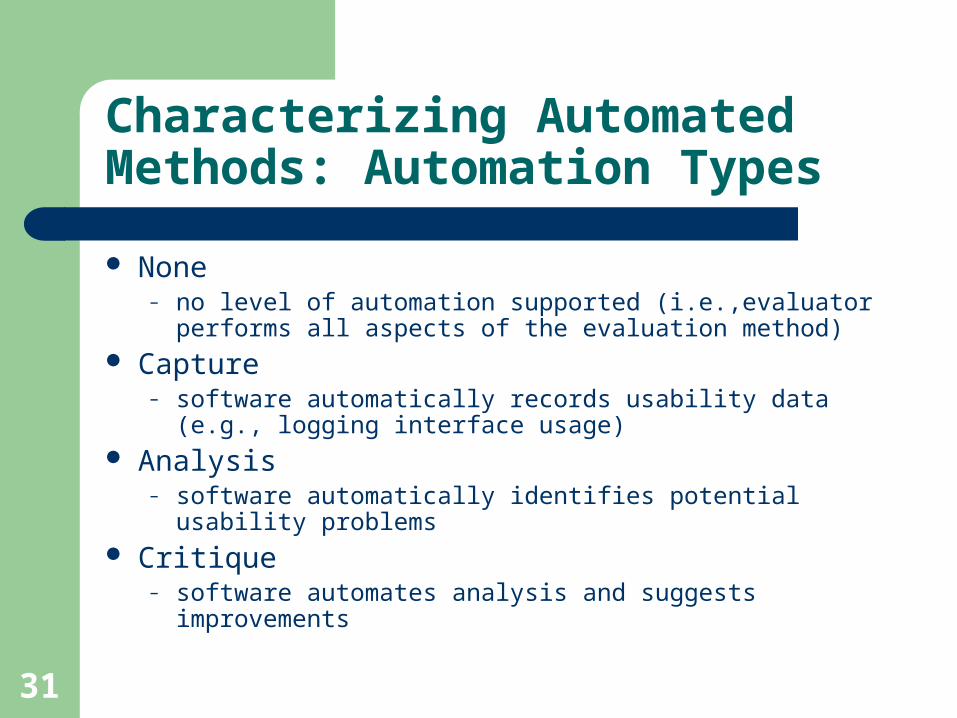
Characterizing Automated Methods: Automation Types
None– no level of automation supported (i.e.,evaluator performs all
aspects of the evaluation method) Capture
– software automatically records usability data (e.g., logging interface usage)
Analysis– software automatically identifies potential usability problems
Critique– software automates analysis and suggests improvements
32
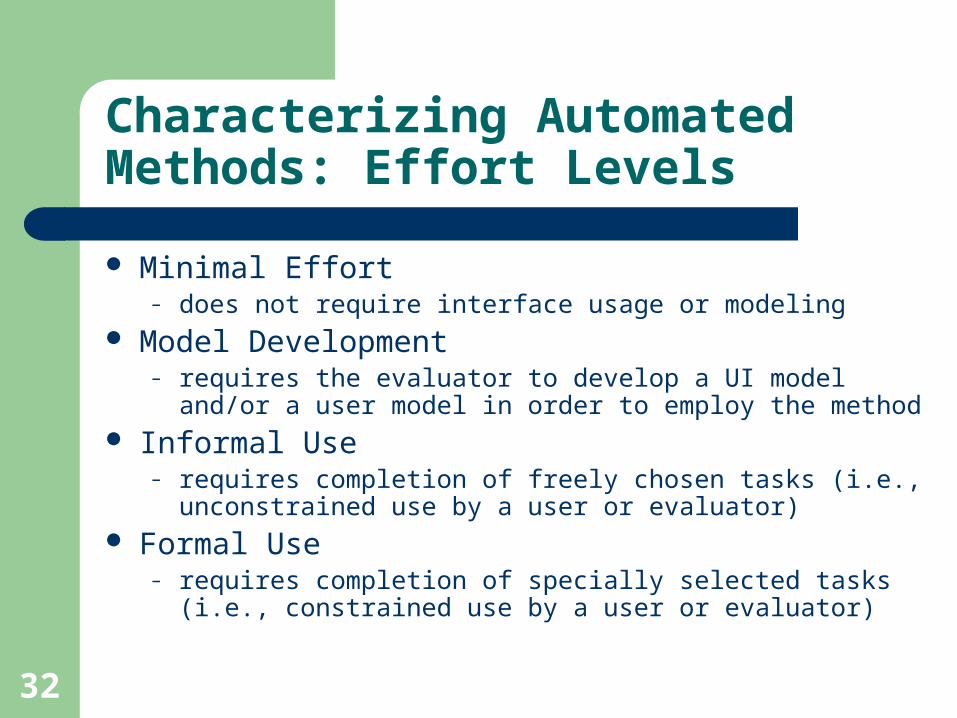
Characterizing Automated Methods: Effort Levels
Minimal Effort– does not require interface usage or modeling
Model Development– requires the evaluator to develop a UI model and/or a user
model in order to employ the method Informal Use
– requires completion of freely chosen tasks (i.e., unconstrained use by a user or evaluator)
Formal Use– requires completion of specially selected tasks (i.e.,
constrained use by a user or evaluator)
33
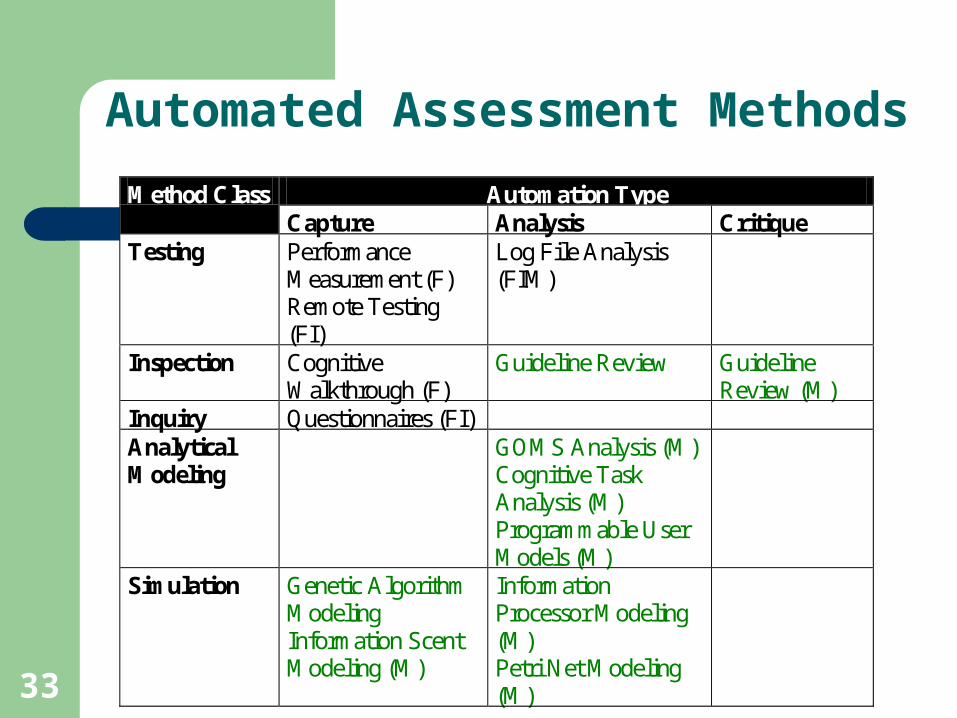
Automated Assessment Methods
Automation Type Method Class Capture Analysis Critique
Testing Performance Measurement (F) Remote Testing (FI)
Log File Analysis (FIM)
Inspection Cognitive Walkthrough (F)
Guideline Review Guideline Review (M)
Inquiry Questionnaires (FI) Analytical Modeling
GOMS Analysis (M) Cognitive Task Analysis (M) Programmable User Models (M)
Simulation Genetic Algorithm Modeling Information Scent Modeling (M)
Information Processor Modeling (M) Petri Net Modeling (M)
34
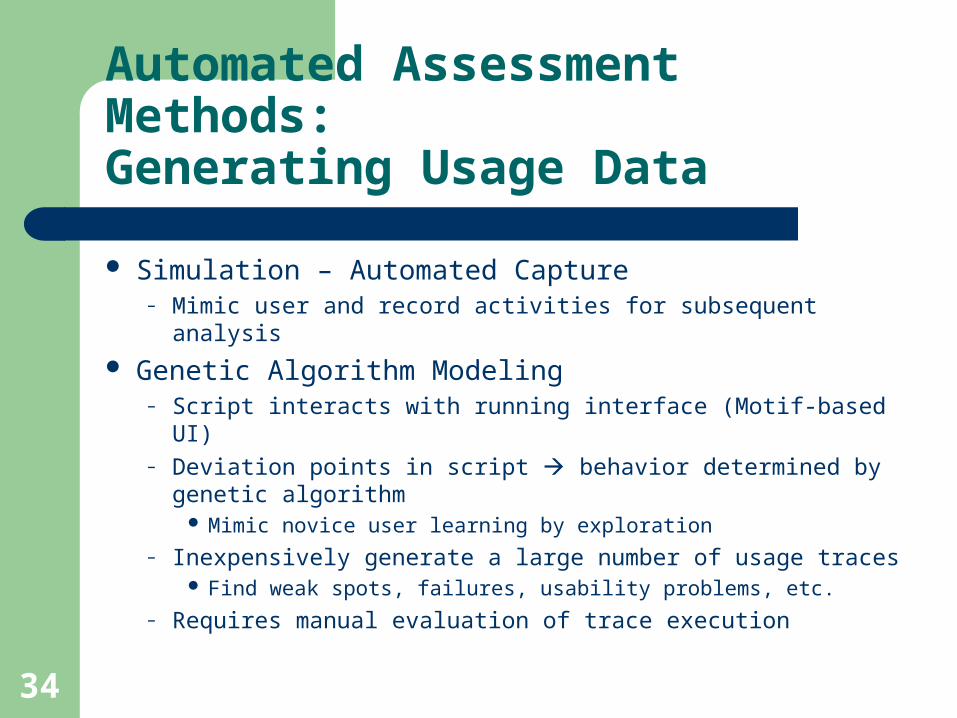
Automated Assessment Methods:Generating Usage Data
Simulation – Automated Capture– Mimic user and record activities for subsequent analysis
Genetic Algorithm Modeling– Script interacts with running interface (Motif-based UI)– Deviation points in script behavior determined by genetic
algorithm Mimic novice user learning by exploration
– Inexpensively generate a large number of usage traces Find weak spots, failures, usability problems, etc.
– Requires manual evaluation of trace execution
35
Automated Assessment Methods:Generating Usage Data
Information Scent Modeling– Mimic users navigating a Web site and record paths
Web site model – linking structure, usage data, and content similarity Considers information scent (common keywords between user goals
and link text) in choosing links– Percentage of agents follow higher- and lower-scent links
Does not consider impact of page elements, such as images, reading complexity, etc.
Stopping criteria– Reach target pages or some threshold (e.g., maximum navigation time)
– Requires manual evaluation of navigation paths Log file visualization tool (Dome-Tree Visualization)

36
Automated Assessment Methods:Detecting Guideline Conformance
Inspection – Automated Analysis– Cannot automatically detect conformance for all guidelines– One study – 78% best case, 44% worst case
Quantitative Screen Measures– Size of screen elements, alignment, balance, etc.– Possibly generate initial layouts (AIDE)
Interface Consistency (Sherlock)– Same widget placement and terminology (Visual– Studies showed 10-25% speedup for consistent UIs
37
Automated Assessment Methods:Detecting Guideline Conformance
Quantitative Web Measures– Words, links, graphics, page breadth & depth, etc.
(Rating Game, HyperAT, TANGO)– Most techniques not empirically-validated
Web TANGO uses expert ratings to develop prediction models
HTML Analysis (WebSAT)– All images have alt tags, one outgoing link/page,
etc.

38
Automated Assessment Methods:Detecting Guideline Conformance
Web Scanning Path (Design Advisor)
– Determine how users will scan a page based on attentional effects of elements
motion, size, images, color, text style, and position

39
Automated Assessment Methods:Suggesting Improvements
Inspection – Automated Critique Rule-based critique systems
– Typically done within a user interface management system Very limited application
– X Window UIs (KRI/AG), control systems (SYNOP), space systems (CHIMES)
Object-based critique systems (Ergoval)– Apply guidelines relevant to each graphical object– Widely applicable to Windows UIs
HTML Critique– Syntax, validation, accessibility (Bobby), and others– Although useful, not empirically validated

40
Automated Assessment Methods:Modeling User Performance
Analytical Modeling – Automated Analysis– Predict user behavior, mainly execution time– No methods for Web interfaces
GOMS Analysis (previously discussed)– Generate predictions for GOMS models (CATHCI, QGOMS)– Generate model and predictions (USAGE, CRITIQUE)
UIs developed within user interface development environment
Cognitive Task Analysis– Input interface parameters to an underlying theoretical model (expert system)
Do not construct new model for each task– Generate predictions based on parameters as well as theoretical basis for
predictions– Similar to cognitive walkthrough (supportive evaluation)
41
Automated Assessment Methods:Modeling User Performance
Programmable User Models– Cross between GOMS and CTA analyses– Program UI on a psychologically-constrained
architecture Constraint violations suggest usability problems Generate quantitative predictions
42
Automated Assessment Methods:Simulating User Behavior
Simulation – Automated Analysis Petri Net Modeling (AMME)
– Construct petri net from logged interface usage– Simulates problem solving process (learning, decisions, and
task completion)– Outputs measure of behavior complexity
Information Processor Modeling (ACT-R, SOAR, CCT,…)
– Methods employ sophisticated cognitive architecture with varying features
Modeled tasks and components, predictions, etc.
43
Automated Assessment Methods:Simulating User Behavior
Web Site Navigation (WebCriteria)– Similar to GOMS Analysis
Constructs model of site and predicts navigation time for a specified path
– Based on idealized Web user (Max)– Navigation time only for shortest path between endpoints
Does not consider impact of page elements (e.g., colors,reading complexity, etc.)
– Reports on page freshness and composition of pages (text, image, applets, etc.)
– Supports only a small fraction of analysis possible with guideline review approaches
– Used to compare sites (Industry Benchmarks)

44
Summary
Characterizing Automated Methods– Method Class, Automation Types, Effort Levels
Automated Methods– Mainly automated capture and analysis– Guideline review enables automated critique– Represented only 33% of 132 surveyed approaches– Most require formal or informal interface usage
More Information– webtango.berkeley.edu– Survey paper on automated methods– Papers on quantitative Web page analysis