Goldman Sachs Investor Conference New York City June 5, 2007.
description

June 3, 2013
Europe: Energy: Oil & Gas - E&P
Equity Research
Looking for value and scale: Coastal Energy, Gulf Keystone, Heritage & IGas up to Buy
Small E&P stocks offer significant value…
In the last two years, smaller E&Ps (with market
caps of less than US$1 bn) have significantly
underperformed larger E&Ps. The dislocation
between these small stocks and the long dated
crude price is now at levels not seen since early
2009: 14 stocks offer more than 40% upside to
core value + discoveries at commercial costs of
capital.
…but asset quality is key
Although smaller companies offer significantly
greater upside using standard costs of capital,
asset quality is typically lower with much of the
value sitting in smaller assets. Our backtesting of
deals suggests that large, high quality assets that
can attract major IOCs and NOCs as acquirers can
command significant premiums over less
strategic assets where smaller independents are
acquirers (8% cost of capital vs. 16% cost of
capital). We therefore highlight both those
companies which screen as inexpensive and
those which have portfolios containing higher
quality assets.
Updating valuations & ratings for news flow
We upgrade Coastal, Gulf Keystone, Heritage and
IGas to Buy from Neutral. Coastal: we believe the
recent share price pull-back offers a compelling
opportunity to buy production growth and de-
risked basin led exploration. Gulf Keystone:
despite the risk inherent in the ongoing court case,
we believe recent underperformance offers an
attractive entry point into one of the largest assets
in Kurdistan – an emerging area which we believe
could prove highly strategic to the industry should
direct exports commence. Heritage: although
recent production from its OML30 asset has been
disappointing, we believe the inflection point for
growth is near and that the value inherent in this
significant asset is now being underestimated by
the market. IGas: offers significant re-rating
potential via UK shale exploration with good value
support from conventional assets and a political
tailwind additional attractions.
We downgrade Maurel et Prom and Bankers to
Neutral from Buy, as we see superior upside and
catalysts elsewhere in our universe.
SUMMARY OF RATINGS/LIST CHANGES
Prices in this report are based on the market close of May 30, 2013
Source: Goldman Sachs Research estimates.
COVERAGE VIEW: ATTRACTIVE
Christophor Jost +44(20)7774-0014 [email protected] Goldman Sachs International Goldman Sachs does and seeks to do business with companies
covered in its research reports. As a result, investors should be aware that the firm may have a conflict of interest that could affect the objectivity of this report. Investors should consider this report as only a single factor in making their investment decision. For Reg AC certification and other important disclosures, see the Disclosure Appendix, or go to www.gs.com/research/hedge.html. Analysts employed by non-US affiliates are not registered/qualified as research analysts with FINRA in the U.S.
Ruth Brooker +44(20)7774-6842 [email protected] Goldman Sachs International Michele della Vigna, CFA +44(20)7552-9383 [email protected] Goldman Sachs International
Peter Hackworth, CFA +44(20)7774-7073 [email protected] Goldman Sachs International
The Goldman Sachs Group, Inc. Global Investment Research
Old rating/list New rating/listBankers Petroleum Buy NeutralCoastal Energy Neutral BuyGulf Keystone Neutral BuyHeritage Oil Neutral BuyIGas Energy Neutral BuyMaurel et Prom Buy Neutral

June 3, 2013 Europe: Energy: Oil & Gas - E&P
Goldman Sachs Global Investment Research 2
Significant divergence in performance between larger and smaller E&Ps
Recent performance of the E&P universe has been poor, driven in part by the falling spot oil price (although we maintain that
valuations should primarily be driven by the end of the curve which has been far more stable). We note that the divergence between
larger and smaller companies has been extreme, with smaller companies continually underperforming over the last two years. Even
smaller companies with production and less volatile funding requirements have been hit hard vs. the larger universe. We note that
in the last few months, this trend has slowed somewhat for smaller companies with production assets.
Exhibit 1: Smaller stocks have seen significant underperformance since 2011, with lack of production a further negative driver Indexed performance of E&P stocks split into those above US$1 bn market cap and stocks below US$1 bn with and without production
Source: Datastream.
0
20
40
60
80
100
120
140
03/01/20
11
03/02/20
11
03/03/20
11
03/04/20
11
03/05/20
11
03/06/20
11
03/07/20
11
03/08/20
11
03/09/20
11
03/10/20
11
03/11/20
11
03/12/20
11
03/01/20
12
03/02/20
12
03/03/20
12
03/04/20
12
03/05/20
12
03/06/20
12
03/07/20
12
03/08/20
12
03/09/20
12
03/10/20
12
03/11/20
12
03/12/20
12
03/01/20
13
03/02/20
13
03/03/20
13
03/04/20
13
03/05/20
13
Small ‐ producing Small ‐ non producing Large (all)

June 3, 2013 Europe: Energy: Oil & Gas - E&P
Goldman Sachs Global Investment Research 3
Smaller E&Ps at levels of dislocation vs. long dated crude not seen since early 2009…
The result of this underperformance of small companies has meant that the dislocation vs. the long dated crude price is extreme – at
levels not seen since early 2009. Typically we believe that high levels of dislocation between equity and commodity values presages
M&A activity, offering an opportunity for larger, well funded industry participants to acquire cheap assets valued with the forward
curve. We believe that the dislocation between the long dated Brent price and the smaller E&Ps is now wide enough to offer
compelling valuations.
Exhibit 2: Larger stocks have held up well vs. the longer dated crude price..
E&Ps > US$1 bn market cap vs. five-year forward Brent price
Exhibit 3: … while smaller names have underperformed significantly
E&Ps < US$1 bn market cap vs. five-year forward Brent price
Source: Datastream.
Source: Datastream.
‐0.7
‐0.6
‐0.5
‐0.4
‐0.3
‐0.2
‐0.1
0
0.1
0.2
0.3
01/01/20
07
01/03/20
07
01/05/20
07
01/07/20
07
01/09/20
07
01/11/20
07
01/01/20
08
01/03/20
08
01/05/20
08
01/07/20
08
01/09/20
08
01/11/20
08
01/01/20
09
01/03/20
09
01/05/20
09
01/07/20
09
01/09/20
09
01/11/20
09
01/01/20
10
01/03/20
10
01/05/20
10
01/07/20
10
01/09/20
10
01/11/20
10
01/01/20
11
01/03/20
11
01/05/20
11
01/07/20
11
01/09/20
11
01/11/20
11
01/01/20
12
01/03/20
12
01/05/20
12
01/07/20
12
01/09/20
12
01/11/20
12
01/01/20
13
01/03/20
13
01/05/20
13‐0.8
‐0.7
‐0.6
‐0.5
‐0.4
‐0.3
‐0.2
‐0.1
0
0.1
0.2
01/01/20
07
01/03/20
07
01/05/20
07
01/07/20
07
01/09/20
07
01/11/20
07
01/01/20
08
01/03/20
08
01/05/20
08
01/07/20
08
01/09/20
08
01/11/20
08
01/01/20
09
01/03/20
09
01/05/20
09
01/07/20
09
01/09/20
09
01/11/20
09
01/01/20
10
01/03/20
10
01/05/20
10
01/07/20
10
01/09/20
10
01/11/20
10
01/01/20
11
01/03/20
11
01/05/20
11
01/07/20
11
01/09/20
11
01/11/20
11
01/01/20
12
01/03/20
12
01/05/20
12
01/07/20
12
01/09/20
12
01/11/20
12
01/01/20
13
01/03/20
13
01/05/20
13

June 3, 2013 Europe: Energy: Oil & Gas - E&P
Goldman Sachs Global Investment Research 4
… and valuations among some smaller names look compelling…
We believe that, except in exceptional circumstances, acquirers are unlikely to pay significant amounts for high risk exploration or
appraisal, and that if stocks are to be sufficiently inexpensive to justify M&A on valuation grounds, the value of discovered resource
likely to be commercialized must offer compelling upside to share prices. We highlight below those names which are trading at or
below the value of core + discoveries which have a chance of success in excess of 60%. We believe that at least 50% upside to the
value of these assets is required for M&A to be a consideration owing to the need to offer a control premium and still generate a
tangible return for an acquirer – a metric which rules out most of the larger E&P companies using commercial costs of capital.
Exhibit 4: Many smaller names offer highly compelling upside to discovered resource on our estimates Value by type as % of market cap
Source: Company data, Goldman Sachs Research estimates, Bloomberg.
‐200%
‐100%
0%
100%
200%
300%
400%
500%
600%
‐200%
‐100%
0%
100%
200%
300%
400%
500%
600%
Producing assets Cash / debt Developments Discoveries to be sanctioned Overall upside to core + low risk discoveries
June 3, 2013 Europe: Energy: Oil & Gas - E&P
Goldman Sachs Global Investment Research 5
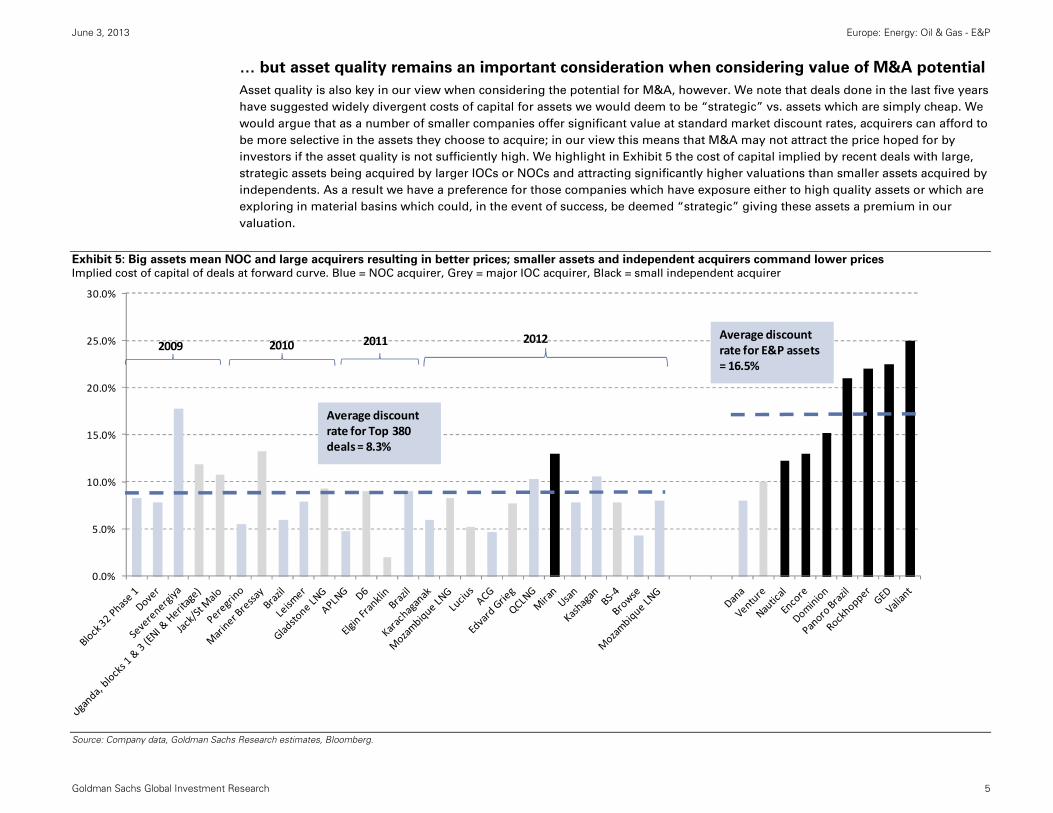
… but asset quality remains an important consideration when considering value of M&A potential
Asset quality is also key in our view when considering the potential for M&A, however. We note that deals done in the last five years
have suggested widely divergent costs of capital for assets we would deem to be “strategic” vs. assets which are simply cheap. We
would argue that as a number of smaller companies offer significant value at standard market discount rates, acquirers can afford to
be more selective in the assets they choose to acquire; in our view this means that M&A may not attract the price hoped for by
investors if the asset quality is not sufficiently high. We highlight in Exhibit 5 the cost of capital implied by recent deals with large,
strategic assets being acquired by larger IOCs or NOCs and attracting significantly higher valuations than smaller assets acquired by
independents. As a result we have a preference for those companies which have exposure either to high quality assets or which are
exploring in material basins which could, in the event of success, be deemed “strategic” giving these assets a premium in our
valuation.
Exhibit 5: Big assets mean NOC and large acquirers resulting in better prices; smaller assets and independent acquirers command lower prices Implied cost of capital of deals at forward curve. Blue = NOC acquirer, Grey = major IOC acquirer, Black = small independent acquirer
Source: Company data, Goldman Sachs Research estimates, Bloomberg.
0.0%
5.0%
10.0%
15.0%
20.0%
25.0%
30.0%
2009 2010 2011 2012
Average discount rate for Top 380 deals = 8.3%
Average discount rate for E&P assets = 16.5%

June 3, 2013 Europe: Energy: Oil & Gas - E&P
Goldman Sachs Global Investment Research 6
Which stocks have exposure to the large assets?
As a result of the clear divergence in transaction prices relating to asset quality, we highlight those companies which have large
scale assets within their portfolio. Exhibit 6 shows the proportion of our valuation in discovered (>60% CoS) fields that have either a
gross size of 300mnbls or greater, or a net stake in a field of greater than 100mnbls. Exhibit 7 displays the same data but includes
the value of exploration targeting fields of the same gross and net sizes. We believe that asset sales involving these larger
discovered assets will be simpler and command higher prices than smaller, more fragmented assets. While we recognize that sales
of exploration assets are unlikely to be at particularly compelling prices owing to the risk inherent in the exploration phase, we
believe that in the event of success, these assets will also be advantaged vs. portfolios containing smaller assets.
Exhibit 6: High levels of value in large, high quality assets is a positive…
% of value in large discovered assets (at non-strategic costs of capital)
Exhibit 7: … while exploration is best directed at assets of material size % of value in large discovered assets or large exploration targets (at non-strategic
costs of capital)
Source: Goldman Sachs Research estimates
Source: Goldman Sachs Research estimates
0%
20%
40%
60%
80%
100%
120%
0%
20%
40%
60%
80%
100%
120%
Discovered value in large assets Exploration value in large assets
June 3, 2013 Europe: Energy: Oil & Gas - E&P
Goldman Sachs Global Investment Research 7
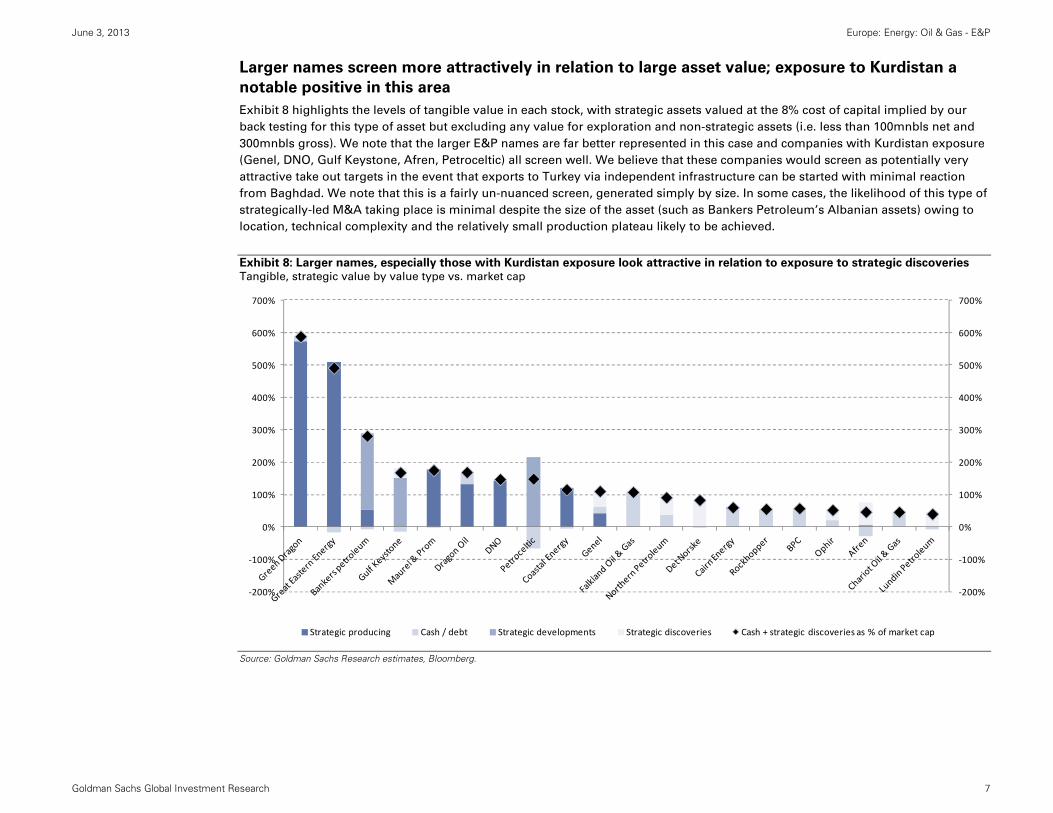
Larger names screen more attractively in relation to large asset value; exposure to Kurdistan a
notable positive in this area
Exhibit 8 highlights the levels of tangible value in each stock, with strategic assets valued at the 8% cost of capital implied by our
back testing for this type of asset but excluding any value for exploration and non-strategic assets (i.e. less than 100mnbls net and
300mnbls gross). We note that the larger E&P names are far better represented in this case and companies with Kurdistan exposure
(Genel, DNO, Gulf Keystone, Afren, Petroceltic) all screen well. We believe that these companies would screen as potentially very
attractive take out targets in the event that exports to Turkey via independent infrastructure can be started with minimal reaction
from Baghdad. We note that this is a fairly un-nuanced screen, generated simply by size. In some cases, the likelihood of this type of
strategically-led M&A taking place is minimal despite the size of the asset (such as Bankers Petroleum’s Albanian assets) owing to
location, technical complexity and the relatively small production plateau likely to be achieved.
Exhibit 8: Larger names, especially those with Kurdistan exposure look attractive in relation to exposure to strategic discoveries Tangible, strategic value by value type vs. market cap
Source: Goldman Sachs Research estimates, Bloomberg.
‐200%
‐100%
0%
100%
200%
300%
400%
500%
600%
700%
‐200%
‐100%
0%
100%
200%
300%
400%
500%
600%
700%
Strategic producing Cash / debt Strategic developments Strategic discoveries Cash + strategic discoveries as % of market cap

June 3, 2013 Europe: Energy: Oil & Gas - E&P
Goldman Sachs Global Investment Research 8
High impact exploration relatively sparse; only four names with > 200% re-rating potential in 2013
Compared to previous years, the levels of high-impact basin opening exploration is relatively limited. The drilling campaigns with
the most significant upside in our universe for the remainder of 2013 are IGas (UK shale), San Leon (Polish shale and Morocco),
Salamander (Thailand and Indonesia) and Serica (Morocco), all of which we rate Buy.
Exhibit 9: Re-rating potential in 2013 is concentrated in a relatively small group of companies in our view Exploration re-rating potential spudding in 2013
Source: Goldman Sachs Research estimates.
0%
100%
200%
300%
400%
500%
600%
700%
800%
900%
1000%
2Q13 3Q13 4Q13

June 3, 2013 Europe: Energy: Oil & Gas - E&P
Goldman Sachs Global Investment Research 9
Balance of value vs. exploration re-rating potential is of particular attraction
In Exhibit 10 we assess the relationship between exploration upside in the remainder of 2013 and the support provided to the share
price by core value + risked discoveries. We have a preference for those companies in the top right of the chart where meaningful
exploration re-rating potential is well supported by tangible value and highlight conviction buy rated Salamander and Serica as
names that screen particularly attractively on this metric.
Exhibit 10: Exploration re-rating potential vs. tangible value support is a key driver of attractiveness in our view
Scale limited to 350% re-rating potential and 280% core + discoveries vs. market cap. Companies not included are San Leon, IGas, Great Eastern, Rockhopper, Green Dragon
Source: Goldman Sachs Research estimates, Bloomberg.
0%
50%
100%
150%
200%
250%
300%
350%
‐20% 30% 80% 130% 180% 230% 280%
Exploration up
side
within 12
mon
ths
Core value / price
Increasinglyattractive relationship between short term exploration potential and tangible value
Salamander
Serica
Bowleven
PetrocelticOphir
Cairn EnergyAfrica Oil
Genel Northern PetroleumAfren
Det NorskeCoastal Energy
Lundin PetroleumAmerisurMaurel & Prom
Gulf KeystonePremier Oil
Dragon Oil
Soco Enquest Bankers petroleum Borders and SouthernBPCChariot
DNOFalkland Oil & Gas Heritage OilTower Resources

June 3, 2013 Europe: Energy: Oil & Gas - E&P
Goldman Sachs Global Investment Research 10
Which stocks are the development losers?
We are negative on development, believing that unproductive capital is a hindrance to share price performance, especially at a time
when implied costs of capital for the E&P sector are so high. As we noted in our note of December 16, 2012, “The cost of
development", we typically see severe underperformance from stocks which have a significant proportion of their value under
development. We highlight in Exhibit 11 those stocks which we believe are due to see significant value under development and
therefore increasing levels of unproductive capital through to the end of 2014.
Exhibit 11: High levels of value in development is a negative trigger for E&P companies in our view Value under development as % of market cap
Source: Goldman Sachs Research estimates.
‐100%
‐50%
0%
50%
100%
150%
200%
250%
300%
‐100%
‐50%
0%
50%
100%
150%
200%
250%
300%
Current developments Change in development ‐ 2013 Change in development ‐ 2014 Total at end 2014
June 3, 2013 Europe: Energy: Oil & Gas - E&P
Goldman Sachs Global Investment Research 11
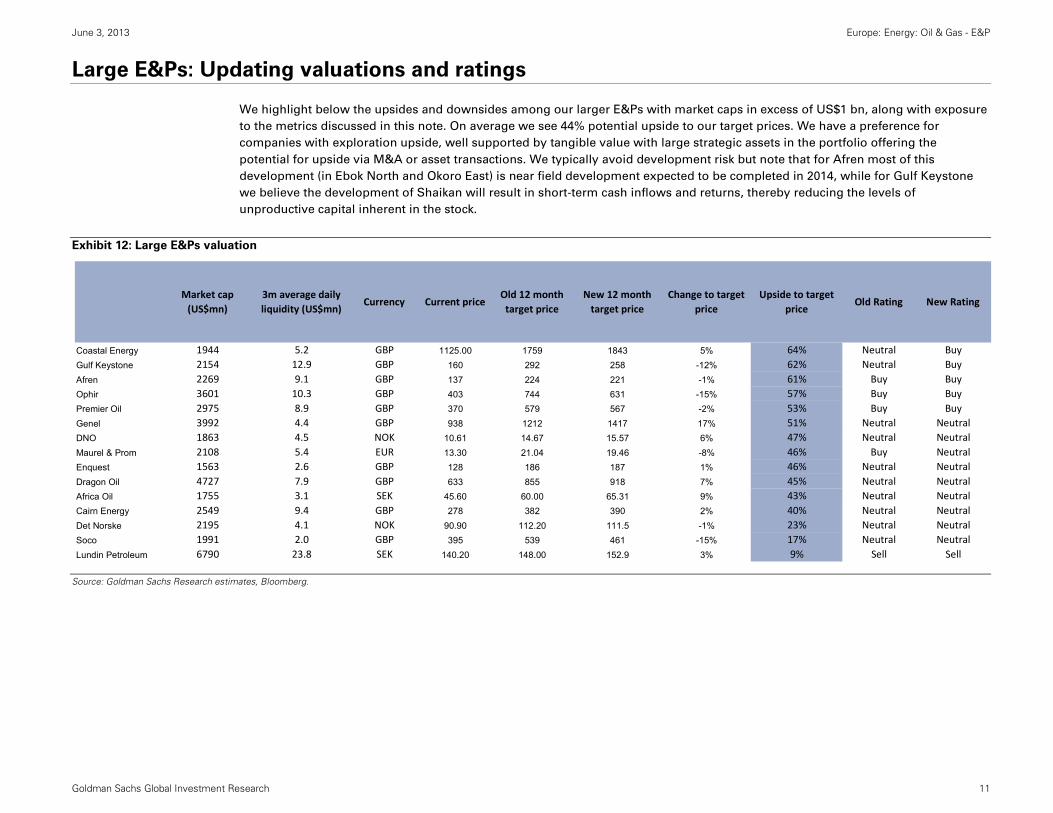
Large E&Ps: Updating valuations and ratings
We highlight below the upsides and downsides among our larger E&Ps with market caps in excess of US$1 bn, along with exposure
to the metrics discussed in this note. On average we see 44% potential upside to our target prices. We have a preference for
companies with exploration upside, well supported by tangible value with large strategic assets in the portfolio offering the
potential for upside via M&A or asset transactions. We typically avoid development risk but note that for Afren most of this
development (in Ebok North and Okoro East) is near field development expected to be completed in 2014, while for Gulf Keystone
we believe the development of Shaikan will result in short-term cash inflows and returns, thereby reducing the levels of
unproductive capital inherent in the stock.
Exhibit 12: Large E&Ps valuation
Source: Goldman Sachs Research estimates, Bloomberg.
Market cap (US$mn)
3m average daily liquidity (US$mn)
Currency Current priceOld 12 month target price
New 12 month target price
Change to target price
Upside to target price
Old Rating New Rating
Coastal Energy 1944 5.2 GBP 1125.00 1759 1843 5% 64% Neutral BuyGulf Keystone 2154 12.9 GBP 160 292 258 -12% 62% Neutral BuyAfren 2269 9.1 GBP 137 224 221 -1% 61% Buy BuyOphir 3601 10.3 GBP 403 744 631 -15% 57% Buy BuyPremier Oil 2975 8.9 GBP 370 579 567 -2% 53% Buy BuyGenel 3992 4.4 GBP 938 1212 1417 17% 51% Neutral NeutralDNO 1863 4.5 NOK 10.61 14.67 15.57 6% 47% Neutral NeutralMaurel & Prom 2108 5.4 EUR 13.30 21.04 19.46 -8% 46% Buy NeutralEnquest 1563 2.6 GBP 128 186 187 1% 46% Neutral NeutralDragon Oil 4727 7.9 GBP 633 855 918 7% 45% Neutral NeutralAfrica Oil 1755 3.1 SEK 45.60 60.00 65.31 9% 43% Neutral NeutralCairn Energy 2549 9.4 GBP 278 382 390 2% 40% Neutral NeutralDet Norske 2195 4.1 NOK 90.90 112.20 111.5 -1% 23% Neutral NeutralSoco 1991 2.0 GBP 395 539 461 -15% 17% Neutral NeutralLundin Petroleum 6790 23.8 SEK 140.20 148.00 152.9 3% 9% Sell Sell

June 3, 2013 Europe: Energy: Oil & Gas - E&P
Goldman Sachs Global Investment Research 12
Exhibit 13: Large E&Ps valuation metrics Blue shading indicates positive attribute. Black shading indicates negative attribute
Source: Goldman Sachs Research estimates, Bloomberg.
% of mc in production and
cash
% of mc in development
% of mc in discoveries
% of mc supported by
tangible value
% of value supported by tangible assets w/ strategic valuation
Change in 2013 development value (% of mc)
Change in 2014 development value (% of mc)
basin exploration (% of mc)
1Q exploration re‐rating
2Q exploration re‐
rating
3Q exploration re‐rating
4Q exploration re‐rating
Total 2013E re‐rating potential
Coastal Energy 103% 0% 6% 109% 116% 0% 0% 49% 0% 13% 2% 27% 43%Gulf Keystone ‐15% 78% 16% 79% 168% 0% ‐8% 0% 0% 1% 4% 19% 24%Afren 18% 42% 58% 119% 47% 26% ‐26% 27% 7% 29% 20% 0% 56%Ophir 23% 0% 18% 41% 53% 0% 0% 79% 0% 1% 36% 67% 105%Premier Oil 65% 13% 66% 145% ‐42% 15% 24% 0% 0% 3% 6% 3% 12%Genel 51% 0% 27% 78% 111% 0% 27% 38% 0% 1% 4% 59% 63%DNO 122% 1% 7% 130% 147% 0% 6% 0% 0% 0% 0% 0% 0%Maurel & Prom 142% 0% 6% 147% 175% 5% 3% 8% 0% 0% 17% 9% 26%Enquest 81% 11% 48% 140% 3% 14% 14% 0% 0% 0% 0% 0% 0%Dragon Oil 126% 0% 6% 133% 169% 6% 0% 0% 0% 0% 0% 13% 13%Africa Oil 4% 0% 9% 13% 19% 0% 0% 71% 34% 41% 0% 0% 75%Cairn Energy 93% 0% 26% 120% 60% 21% 5% 1% 0% 0% 0% 94% 94%Det Norske 15% 7% 77% 98% 83% 2% 68% 0% 10% 0% 30% 15% 55%Soco 110% 0% 0% 110% 10% 0% 0% 0% 0% 4% 0% 0% 4%Lundin Petroleum 29% 11% 39% 79% 40% 0% 35% 10% 0% 4% 23% 7% 35%

June 3, 2013 Europe: Energy: Oil & Gas - E&P
Goldman Sachs Global Investment Research 13
Small E&Ps: We favour basin-led exploration with strong value support
We highlight below the upsides and downsides among our smaller E&Ps with market caps of less than US$1 bn. On average we see
161% potential upside to our target prices. Our Conviction List Buys – Serica, Northern and Salamander – exhibit combinations of
high impact, basin-led exploration upside (especially in the case of Salamander and Serica) with strong valuation support.
Exhibit 14: Small E&Ps – valuation
* denotes Conviction List membership
Source: Goldman Sachs Research estimates, Bloomberg.
Market cap (US$mn)3m average daily liquidity (US$mn)
Currency Current priceOld 12 month target price
New 12 month target price
Change to target price
Upside to target price
Old Rating New Rating
Tower Resources 41 0.1 GBp 1.7 7.3 6.2 -15% 274% Buy BuyBPC 81 0.3 GBP 4 14.4 16 8% 261% Buy BuyRockhopper 602 4.5 GBp 139 444 466 5% 234% Buy BuyNorthern Petroleum 51 0.4 GBP 35 110 117 6% 233% Buy* Buy*Green Dragon 407 0.1 GBp 196 673 604 -10% 208% Buy BuyBorders and Southern 118 0.3 GBP 16 41 47 15% 196% Buy BuyGreat Eastern Energy 525 0.0 GBP 274 707 798 13% 192% Buy BuySan Leon 210 0.8 GBP 7 19 19 0% 161% Buy BuySerica 66 0.2 GBP 24 53 58 10% 146% Buy* Buy*Salamander 676 1.5 GBP 173 391 397 2% 130% Buy* Buy*Heritage Oil 564 1.4 GBP 145 341 333 -2% 130% Neutral BuyIgas 250 0.5 GBP 88 146 202 38% 129% Neutral BuyBowleven 319 6.5 GBp 71 157 163 4% 129% Buy BuyChariot Oil & Gas 61 0.3 GBP 20 45 43 -5% 115% Neutral NeutralPetrocelt ic 417 0.9 GBP 6 13 13 1% 113% Neutral NeutralBankers petroleum 753 5.6 GBP 196 348 390 12% 99% Buy NeutralAmerisur 734 2.5 GBP 47 65 82 27% 77% Neutral NeutralFalkland Oil & Gas 123 0.4 GBP 25 53 44 -16% 75% Neutral Neutral

June 3, 2013 Europe: Energy: Oil & Gas - E&P
Goldman Sachs Global Investment Research 14
Exhibit 15: Small E&Ps – valuation metrics Blue shading indicates positive attribute. Black shading indicates negative attribute
Source: Goldman Sachs Research estimates, Bloomberg.
Market cap (US$mn)3m average daily liquidity (US$mn)
% of mc in production and
cash
% of mc in development
% of mc in discoveries
% of mc supported by tangible value
% of mc supported by tangible value + strategic premium
Change in 2013 development value
(% of mc)
Change in 2014 development value
(% of mc)
basin exploration (%
of mc)
1Q exploration re‐rating
2Q exploration re‐
rating
3Q exploration re‐rating
4Q exploration re‐rating
Total 2013E re‐rating potential
Tower Resources 41 0.1 ‐14% 0% 0% ‐14% ‐14% 0% 0% 809% 0% 0% 0% 0% 0%BPC 81 0.3 57% 0% 0% 57% 57% 0% 0% 204% 0% 0% 0% 0% 0%Rockhopper 602 4.5 55% 0% 279% 334% 55% 0% 240% 0% 0% 0% 0% 0% 0%Northern Petroleum 51 0.4 87% 4% 146% 237% 91% 154% ‐59% 24% 0% 0% 50% 9% 59%Green Dragon 407 0.1 419% 0% 0% 419% 588% 0% 0% 0% 0% 0% 0% 0% 0%Borders and Southern 118 0.3 84% 0% 143% 226% 0% 0% 0% 0% 0% 0% 0% 0% 0%Great Eastern Energy 525 0.0 340% 0% 0% 340% 491% 0% 8% 0% 0% 0% 0% 0% 0%San Leon 210 0.8 24% 9% 0% 33% 19% ‐9% 64% 33% 8% 0% 616% 381% 1005%Serica 66 0.2 32% 0% 115% 147% 25% 94% 0% 136% 0% 0% 0% 191% 191%Salamander 676 1.5 44% 19% 41% 103% ‐36% 19% ‐35% 108% 0% 41% 59% 170% 269%Heritage Oil 564 1.4 56% 177% 0% 233% 13% 0% 0% 0% 0% 0% 0% 0% 0%Igas 250 0.5 74% 2% 0% 75% ‐56% 10% 0% 0% 0% 0% 0% 1698% 1698%Bowleven 319 6.5 31% 0% 141% 172% 16% 0% 150% 47% 0% 0% 0% 142% 142%Chariot Oil & Gas 61 0.3 46% 0% 0% 46% 46% 0% 0% 0% 0% 0% 0% 0% 0%Petroceltic 417 0.9 46% 110% 19% 175% 149% 4% 13% 24% 0% 0% 80% 34% 114%Bankers petroleum 753 5.6 32% 162% 0% 194% 281% 0% 21% 0% 0% 0% 0% 0% 0%Amerisur 734 2.5 70% 65% 31% 167% 5% ‐58% 31% 0% 0% 28% 0% 0% 28%Falkland Oil & Gas 123 0.4 108% 0% 0% 108% 108% 0% 0% 139% 0% 0% 0% 0% 0%
June 3, 2013 Europe: Energy: Oil & Gas - E&P
Goldman Sachs Global Investment Research 15
Updating price targets and ratings for recent news
We update our price targets and ratings for recent news flow in the European E&P sector. On a sector basis we roll forward our
numbers to 2013 and our exploration timeline forward to the end of 2013. We also update for the latest cash position (where
applicable) and for FX.
We upgrade Coastal Energy, Gulf Keystone, Heritage Oil and IGas Energy from Neutral to Buy. We downgrade Bankers Petroleum
and Maurel et Prom from Buy to Neutral.
Afren
We update our assumptions regarding the company’s drilling programme, most notably modeling the farm-out for OPL310, and
remodel our assumptions for the company’s core assets to include updated assumed capex for Ebok North and Okoro East. We also
include a strategic premium for the company’s assets in Kurdistan following indications of hydrocarbons at Simrit 3, and progress in
beginning production at the company’s Barda Rash asset.
Africa Oil
We reduce our estimates to reflect the impact of FX, offset by our NPV/bl roll-forward.
Amerisur Resources
Given Amerisur’s increased levels of liquidity, we no longer model a liquidity discount for the stock. We increase our estimates to
reflect an increase in reserves at the Platanillo field and on updating our risking profile for the field. Given the cash generative nature
of the Platanillo asset, we also remove our funding discount on the Fenix block.
Bahamas Petroleum Company
We increase our valuation to account for the announcement on March 10 by the Government of The Bahamas to grant permission
for exploration drilling ahead of any referendum. We view this as a positive for BPC and as such reduce our political risking on the
stock; we now model an 80% chance of political success versus 60% previously. BPC anticipates drilling preparations will take a year
to complete based on the existing FEED work. We therefore expect an exploration well to be drilled, pending a farm-out from 2Q14
onwards, and push back our assumed sanction date for any potential discovery by a year to account for the pre-drill work required.
We continue to model a farm-out for BPC, assuming the company retains a 40% stake in the exploration prospect in return for a
carry on its portion of the well cost and back costs.
Borders & Southern
Following Borders & Southern’s Darwin discovery in 2012, the company is currently undertaking a farm-out process on its acreage
in the South Falkland basin. We currently assume that a farm-in partner pays sufficient costs to cover 50% of previous back costs as
well as funding an appraisal campaign on Darwin and a single exploration well, in return for 50% of the acreage. Following technical
updates by the company we increase our volume assumptions for the Darwin discovery and analogous exploration prospects. We
continue to view the stock positively and retain our Buy rating.
June 3, 2013 Europe: Energy: Oil & Gas - E&P
Goldman Sachs Global Investment Research 16
Bowleven
We increase our valuation to account for the company’s well result at IM-5 on Block 7, Cameroon. We increase our volumetric
assumptions for the Isongo Marine (IM) field following a resource update from the company and de-risk it to 70% from 60%. Given
the increase in condensate volumes we also de-risk the remainder of Block MLHP-7 from an average overall chance of success of
60% to 65%. We view the increase in volumes positively in the context of the planned phased development of the Etinde permit,
where a FID is expected to be reached by end 2013.
Cairn Energy
We include exploration catalysts in Morocco as these now fit within our investible time horizon for exploration. This is offset to a
degree by the inclusion of an assumed placing discount for the company’s Cairn India stake. We also reduce our valuation of the
company’s North Sea portfolio marginally in order to account for our assumptions of rising costs in this mature basin.
Chariot Oil & Gas
We increase our valuation for Chariot as we include value for a farm-out on the company’s northern license in Namibia. We assume
Chariot farms out a 50% working interest in its Zamba prospect in return for a carry on its portion of the well cost. We also increase
our volumetric estimates for the Central Block prospect, where we assume Chariot farms out 50% of its current 90% interest for a
carry on its portion of the well cost. Offsetting this increase in valuation, we push back our assumed sanction date for any potential
discovery given the anticipated drilling timetable.
Det Norske
We update our modeling assumptions for the Ivar Aasen field, incorporating new estimates on capex and production timing which
has a negative impact on our valuation. We also update for recent disappointing exploration activity. This is largely offset by an
increase in reserves in Block PL265 which contains the western portion of the Johan Sverdrup field.
DNO
We update our estimates to reflect the latest audited reserves report.
Dragon
We update our Cheleken model to account for latest reserves numbers from the company and include risked value for the
company’s water flood programme which we believe has the potential to increase reserves in the event of success (28p/share risked,
112p/share unrisked). We also reduce our assumed flow rate assumptions as drilling on the Zhdanov field is due to commence
shortly, and as we expect well performance to be poorer than for the Lan field.
Enquest
We update our estimates to reflect the company’s latest stated reserves position. We also reduce our valuation to account for our
assumption of an increasing cost base in the North Sea.
Falkland Oil & Gas
The reduction in our target price is primarily a function of 2013 capex ahead of our original expectations; FOGL has allocated $60 mn
for three seismic campaigns. We continue to value a mid-Cretaceous prospect for drilling in 2014 and, given the lack of clarity on the
nature of the prospect to be drilled and the gas risk highlighted by Loligo and Scotia results, we continue to model a 5% chance of

June 3, 2013 Europe: Energy: Oil & Gas - E&P
Goldman Sachs Global Investment Research 17
success pending further information. Given that drilling in the South Falklands is not anticipated until mid-2014, we also push back
the sanction date in the event of a discovery.
Genel Energy
We update our assumptions for exploration success at the company’s Chia Surkh asset. We also upgrade our estimates of volumes
at Bina Bawi following highly encouraging preliminary appraisal results that indicated a hydrocarbon column in excess of 1,500
metres with the potential for an additional 500 metres to the spill point. We now believe reserves could be at the top of previous
volume guidance. We also include value for the company’s exploration campaigns in Morocco and Malta as they are now beginning
to come within our investible time horizon for exploration. Given the work we perform on the Top 380 highlighting the attractive
position of Kurdistan within the oil industry cost curve, we also increase our M&A weighting to 50% from 30%.
Green Dragon
We update our production profile to assume a more conservative ramp-up, bringing it in line with previously observed levels of
production increase.
Lundin
We reduce our volumetric assumptions for the portion of the Johan Sverdrup in block PL501 following Lundin’s guidance that
reserves will be in the lower end of the previously guided range. We now assume gross reserves of 1,100 mnbls for the block. This
is offset by the inclusion of the company’s updated exploration programme and positive upgrades to Johan Sverdrup reserves in
block PL265. We adjust our valuation for the Edvard Grieg asset, bringing it more in line with the valuations of recent transactions.
We also update for recent drilling activity, including the recent success at the company’s Luno II well which also leads us to increase
our assumptions on the exploration potential of the south western portion of the Utsira High. We now assume net risked exploration
potential in the area of 150mnbls.
Northern Petroleum
We roll forward our numbers to price from 2013 which has a positive effect on valuation and update for FX. We also make
adjustments for the company’s Canadian acquisition following the publication of more details on the asset.
Ophir
We adjust our valuation to include the recent rights issue We make adjustments to the company’s assumed exploration programme,
in line with company guidance. The main changes in this respect are a reduction of the chance of success in the basin floor and the
inclusion of Mlinzi as it moves into what we would consider to be an investible time horizon for exploration, while some drilling in
Gabon drifts out. We also update discovered resource estimates in Tanzania and Equatorial Guinea based on the company’s recent
prospectus (but adjusted for subsequent appraisal results) which has a negative impact on our valuation. We reduce our M&A
weighting on the stock to 50% (from 65%) over concerns that Tanzania may be falling behind Mozambique, thereby reducing the
desirability of the asset to potential purchasers.
Petroceltic
We update our volumetric estimates for the year end reserve report, make minor adjustments to our valuation for the Ain Tsila field
and remove value for the North Tarif and Mesha-1 wells which were plugged and abandoned. Offsetting this we update our

June 3, 2013 Europe: Energy: Oil & Gas - E&P
Goldman Sachs Global Investment Research 18
estimates for the 2013 exploration campaign, including value for the exploration wells in Kurdistan and Romania which have now
rolled onto our investible time horizon.
Premier Oil
Adjusting for success at recent exploration prospects such as Bonneville and Luno II is offset by the assumption of rising costs in the
North Sea. We reduce the valuation of our Catcher model, assuming higher costs than previously (now c. US$18/boe).
Rockhopper
We update our valuation to reflect updated FX and rolling forward of our valuation to 2013. This positive impact is partially offset by
a slight reduction in our assumptions for valuations of the tie-in prospects around Sea Lion as we push back timing.
Serica
We increase our assumptions on the size of the company’s Prospect B in Namibia from 470mnbls to 670mnbls following company
guidance.
Soco International
The major change we make is to adjust our assumptions of TGT reserves to c.228mnbls, down from 300mnbls previously following
the audited reserves report from RPS. We include risked upside to 300mnbls in our estimates, but the net effect of this change is to
reduce our valuation. We also make minor adjustments to our modelling, for example including the Cabinda acreage in the
company’s drilling programme following the announcement that the sale of this asset will no longer go ahead.
Tower Resources
Following the annual report we update our assumptions on the company’s funding position. We now assume the company reduces
its 30% working interest in the Welwitschia-1 well on the Delta structure in Namibia via a farm-out/asset-swap to 15% in return for a
carry on its remaining portion of the well cost. As a result we now assume the company completes a c.US$10 mn equity raise, vs.
US$30 mn previously, to fund its 2013 expenditure. We also push back our assumed sanction date for any potential discovery by a
year to account for drilling in 1H 2014. Despite reducing our target price on the stock from 7.3p to 6.2p, we remain positive on the
name and retain our Buy rating.

June 3, 2013 Europe: Energy: Oil & Gas - E&P
Goldman Sachs Global Investment Research 19
Exhibit 16: Risks to our price targets All price targets are on 12-month timeframes and derived from a SOTP methodology at an oil price of US$100/bl. M&A weightings (on strategic assets only) are now:: Gulf
Keystone 50% (from 30%), Northern Petroleum 30%, Hardy Oil 20%, DNO 35% (from 30%), Det Norske 66% (from 50%), Great Eastern 20%, Coastal Energy 10%, Soco 10%,
Dragon 10%, Lundin 50%, Green Dragon 25%, Maurel et Prom 20%, Ophir 50% (from 65%), Genel 50% (from 30%), Afren 35%, Petroceltic 10% and Africa Oil 50%.
Exploration value given for basin led wells or prospects being drilled within six months. In our M&A scenarios we value strategic assets at an 8% cost of capital.
Source: Goldman Sachs Research estimates.
Company Risks to 12 month target price
Afren Disappointing exploration results in upcoming exploration programme and deterioration in operating environment in Kurdistan and NigeriaAfrica Oil Failure in the exploration programme in onshore Kenya and EthiopiaAmerisur Inability to resolve export capacity bottlenecks for Platanillo field production and exploration failure on the Fenix blockBankers Petroleum Disappointing production numbers, worse than expected conversion of contingent resources to reservesBorders and Southern Inability to secure funding for further drilling and or a deterioration of political relations between the UK and ArgentinaBowleven Disappointment and or delays at Bomono exploration well or in the FID in the Etinde permit, CameroonBPC Delays in or a failure to farm out acreage and political risks in the BahamasCairn Disappointing exploration results in upcoming exploration programmeChariot Oil & Gas Inability to secure a farm‐out partner for the Northern and Central blocks offshore NamibiaCoastal Energy Delays or cost overruns in developing assets and a disappointing exploration / appraisal result in ThailandDet Norske Failure in exploration programme, falls in the commodity price, poor appraisal results on Johan SverdrupDNO Disappointing exploration results in upcoming programme and deterioration in operating environment in KurdistanDragon Oil Production disappointments, value destructive acquisitions or drops in the oil priceEnquest Lower than expected production or drops in the oil priceFalkland Oil & Gas Failure in the exploration programme or a deterioration of political relations between the UK and ArgentinaGenel Failure to achieve premium listing, deterioration of political environment in KurdistanGreat Eastern Energy Drop in regional gas prices, poor well performance or difficulties in ramping up productionGreen Dragon Difficulties in developing the resource base and political risks in ChinaGulf Keystone Exploration / appraisal failure or deterioration in operating environment in KurdistanHeritage Oil Operational problems in Nigeria impacting productionIgas Technical failures in the development of the asset base or persistent weakness in the UK gas marketLundin Petroleum Better than expected exploration success, especially at the company's core Luno acreageMaurel & Prom Difficulties in ramping up Columbian production or worse than expected success in the exploration programmeNorthern Petroleum Weakening NWE gas prices, cost overruns in developing assets or delays in exploration and sanctioning in ItalyOphir Poor exploration / appraisal results in East Africa programmePetroceltic Failure to secure farm out or a farm out on disappointing terms in AlgeriaPremier Oil Failure of exploration / development campaign and lower commodity pricesRockhopper Deterioration of UK / Argentine relations, cost overruns or delays for the Sea Lion developmentSalamander Failure in exploration campaign in the company's acreage in Thailand and IndonesiaSan Leon Exploration failure, disappointing flow test results in Poland or failure to farm out AlbaniaSerica Further delays in the sanctioning of the Columbus field, disappointing farm‐out terms on Irish and UK licensesSoco Disappointing ramp up of TGT asset and exploration failure in CongoTower Resources Delays to drilling or exploration disappointment in Namibia
June 3, 2013 Europe: Energy: Oil & Gas - E&P
Goldman Sachs Global Investment Research 20
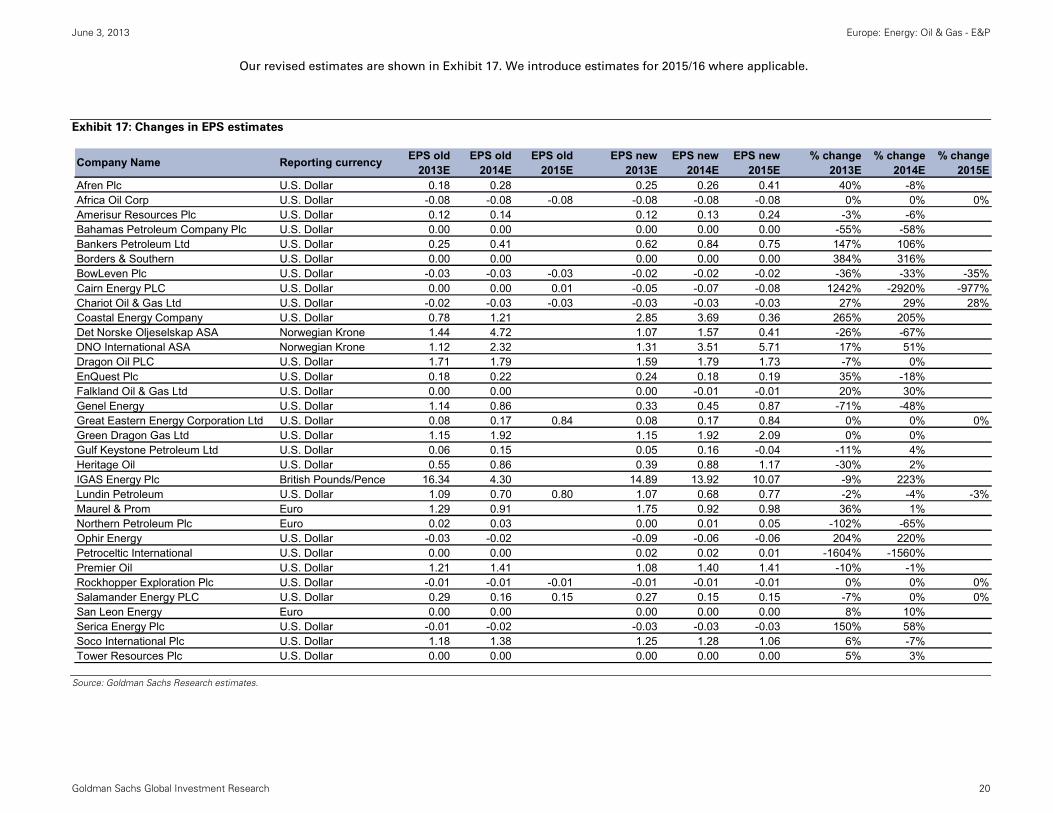
Our revised estimates are shown in Exhibit 17. We introduce estimates for 2015/16 where applicable.
Exhibit 17: Changes in EPS estimates
Source: Goldman Sachs Research estimates.
EPS old EPS old EPS old EPS new EPS new EPS new % change % change % change2013E 2014E 2015E 2013E 2014E 2015E 2013E 2014E 2015E
Afren Plc U.S. Dollar 0.18 0.28 0.25 0.26 0.41 40% -8%Africa Oil Corp U.S. Dollar -0.08 -0.08 -0.08 -0.08 -0.08 -0.08 0% 0% 0%Amerisur Resources Plc U.S. Dollar 0.12 0.14 0.12 0.13 0.24 -3% -6%Bahamas Petroleum Company Plc U.S. Dollar 0.00 0.00 0.00 0.00 0.00 -55% -58%Bankers Petroleum Ltd U.S. Dollar 0.25 0.41 0.62 0.84 0.75 147% 106%Borders & Southern U.S. Dollar 0.00 0.00 0.00 0.00 0.00 384% 316%BowLeven Plc U.S. Dollar -0.03 -0.03 -0.03 -0.02 -0.02 -0.02 -36% -33% -35%Cairn Energy PLC U.S. Dollar 0.00 0.00 0.01 -0.05 -0.07 -0.08 1242% -2920% -977%Chariot Oil & Gas Ltd U.S. Dollar -0.02 -0.03 -0.03 -0.03 -0.03 -0.03 27% 29% 28%Coastal Energy Company U.S. Dollar 0.78 1.21 2.85 3.69 0.36 265% 205%Det Norske Oljeselskap ASA Norwegian Krone 1.44 4.72 1.07 1.57 0.41 -26% -67%DNO International ASA Norwegian Krone 1.12 2.32 1.31 3.51 5.71 17% 51%Dragon Oil PLC U.S. Dollar 1.71 1.79 1.59 1.79 1.73 -7% 0%EnQuest Plc U.S. Dollar 0.18 0.22 0.24 0.18 0.19 35% -18%Falkland Oil & Gas Ltd U.S. Dollar 0.00 0.00 0.00 -0.01 -0.01 20% 30%Genel Energy U.S. Dollar 1.14 0.86 0.33 0.45 0.87 -71% -48%Great Eastern Energy Corporation Ltd U.S. Dollar 0.08 0.17 0.84 0.08 0.17 0.84 0% 0% 0%Green Dragon Gas Ltd U.S. Dollar 1.15 1.92 1.15 1.92 2.09 0% 0%Gulf Keystone Petroleum Ltd U.S. Dollar 0.06 0.15 0.05 0.16 -0.04 -11% 4%Heritage Oil U.S. Dollar 0.55 0.86 0.39 0.88 1.17 -30% 2%IGAS Energy Plc British Pounds/Pence 16.34 4.30 14.89 13.92 10.07 -9% 223%Lundin Petroleum U.S. Dollar 1.09 0.70 0.80 1.07 0.68 0.77 -2% -4% -3%Maurel & Prom Euro 1.29 0.91 1.75 0.92 0.98 36% 1%Northern Petroleum Plc Euro 0.02 0.03 0.00 0.01 0.05 -102% -65%Ophir Energy U.S. Dollar -0.03 -0.02 -0.09 -0.06 -0.06 204% 220%Petroceltic International U.S. Dollar 0.00 0.00 0.02 0.02 0.01 -1604% -1560%Premier Oil U.S. Dollar 1.21 1.41 1.08 1.40 1.41 -10% -1%Rockhopper Exploration Plc U.S. Dollar -0.01 -0.01 -0.01 -0.01 -0.01 -0.01 0% 0% 0%Salamander Energy PLC U.S. Dollar 0.29 0.16 0.15 0.27 0.15 0.15 -7% 0% 0%San Leon Energy Euro 0.00 0.00 0.00 0.00 0.00 8% 10%Serica Energy Plc U.S. Dollar -0.01 -0.02 -0.03 -0.03 -0.03 150% 58%Soco International Plc U.S. Dollar 1.18 1.38 1.25 1.28 1.06 6% -7%Tower Resources Plc U.S. Dollar 0.00 0.00 0.00 0.00 0.00 5% 3%
Company Name Reporting currency

June 3, 2013 Europe: Energy: Oil & Gas - E&P
Goldman Sachs Global Investment Research 21
Coastal (CEO.L): Opportunity to buy inexpensive basin explorer; Buy (from Neutral)
Source of opportunity
Coastal Energy’s performance has been weak ytd (-7% vs. flat performance for our larger cap universe) driven in
our view by some negative exploration news around the Bua Ban Terrace A-01 and the Songkhla M wells as well
as disappointing 1Q production numbers that make us cautious on Coastal’s ability to hit full-year production
guidance. We lower our production numbers and reflect the exploration disappointment but, despite this, we
believe that the share price pull back offers an opportunity to buy into a cash generative basin exploration story
which is well supported by 2P reserves, with debt + production worth more than 100% of the share price in our
view. We believe that exploration activity should continue at a strong pace in 2013, with further wells into the
Bua Ban Terrace and Benjarong South wells of particular importance – in our view the company’s offshore
Thailand exploration is highly attractive owing to the low cost of wells and the quick lead times from discovery
to production. This exploration could be material and we believe drilling in 2013 could offer an additional 43%
upside to the current share price, and drilling beyond that offering further re-rating potential of almost 200%. We
also believe that the recently shot 3D seismic could also generate additional prospects around the end of the
basin; analogues in Malaysia and Indonesia suggest that these could be material. The company will remain
attractive to potential purchasers, in our view; we note recent press reports citing interest from Petronas at $23
per share.
Catalyst
We believe that despite disappointing production numbers in 1Q13, production should continue to rise in the
company’s offshore assets, and that commencement of operations in Malaysia towards the end of 2013 should
highlight this new area’s potential for additional production and cash generation. We also believe that
exploration should remain a key part of the story, with results from the 3D seismic due shortly. We believe that
in the event of total de-risking, exploration for the remainder of the year could result in 43% uplift to the current
share price with significant further potential to follow.
Valuation
Our 12-month SOTP-based target price is 1843p (from 1759p) and is calculated using an oil price of US$100/bl.
Discoveries and exploration assets are valued using a risked NPV/bl approach. We assume a longer dated time
horizon for exploration in the company’s offshore Thai acreage owing to the relatively de-risked, basin-led
nature of the exploration. We include an 10% weighting for M&A in our target price.
Key risks
Short term downside risks are further production and exploration disappointments offshore Thailand and delays
or problems in ramping up production in Malaysia.
Source: Company data, Goldman Sachs Research estimates, FactSet.
Growth
Returns *
Multiple
Volatility Volatility
Multiple
Returns *
Growth
Investment Profile
Low High
Percentile 20th 40th 60th 80th 100th
* Returns = Return on Capital For a complete description of the investment
profile measures please refer to the
disclosure section of this document.
Coastal Energy Company (CEO.L)
Europe Oil & Gas Peer Group Average
Key data Current
Price (p) 1,125
12 month price target (p) 1,843
Upside/(downside) (%) 64
Market cap (£ mn) 1,262.6
Enterprise value ($ mn) 1,899.0
12/12 12/13E 12/14E 12/15E
EBIT ($ mn) New 394.5 583.5 638.8 512.8
EBIT revision (%) (18.4) 240.4 141.9 --
EPS ($) New 2.03 2.85 3.69 0.36
EPS ($) Old 2.12 0.78 1.21 --
EV/DACF (X) 8.3 4.8 2.6 7.3
P/E (X) 8.3 6.0 4.6 47.8
Dividend yield (%) 0.0 0.0 0.0 0.0
FCF yield (%) 12.0 3.1 24.8 8.4
CROCI (%) NM NM NM NM
CROCI/WACC (X) -- -- -- --
EV/GCI NM NM NM NM
300
320
340
360
380
400
420
440
800
900
1,000
1,100
1,200
1,300
1,400
1,500
May-12 Sep-12 Dec-12 Mar-13
Price performance chart
Coastal Energy Company (L) FTSE World Europe (GBP) (R)
Share price performance (%) 3 month 6 month 12 month
Absolute (12.8) (9.8) 22.3
Rel. to FTSE World Europe (GBP) (16.3) (22.3) (9.8)
Source: Company data, Goldman Sachs Research estimates, FactSet. Price as of 5/30/2013 close.

June 3, 2013 Europe: Energy: Oil & Gas - E&P
Goldman Sachs Global Investment Research 22
IGas Energy (IGAS.L): Shale opportunity; up to Buy (from Neutral)
Source of opportunity
We upgrade IGas Energy from Neutral to Buy. We increase our estimates for the company’s shale gas resource
and now model c.15 tcf recoverable based on the company’s recent estimate of a mean volume of c.102 tcf in
place. Offsetting this, we remove value for the company’s CBM assets as we believe operations will be focused
primarily on shale in the near term, with two appraisal wells planned for 2013. We also update our estimates for
the company’s latest debt position, including the placing in January 2013, which raised gross proceeds of c.£23
mn, and the Singleton acquisition and associated tax losses. Although we acknowledge shale is at an early stage
in the UK, the re-rating potential for IGas in the event of success could be material, (almost c.1700% on our
estimates). We also note that political sentiment appears to be improving in the UK with the fraccing ban lifted
on December 13, 2012, and the establishment of the Office for Unconventional Gas and Oil which should provide
a political tailwind for the stock. We view the re-rating potential as attractive in combination with the company’s
conventional portfolio which is largely producing, providing cash flow and downside support to the share price;
on our estimates the stock is c.75% supported by core value + risked discoveries. On a sector relative basis, we
believe IGas offers a compelling opportunity and add the stock to the Buy List.
Catalyst
We expect a number of catalysts in 2013 to drive the stock. Two appraisal wells are scheduled to be drilled in
2H13 by the company on its shale acreage which could significantly de-risk the Bowland shale from a technical
perspective. A farm-out process is ongoing on the company’s shale assets, however we think it unlikely a farm-
out will be concluded until the potential of the shale resource is fully evaluated.
Valuation
Our 12-month SOTP-based target price of 202p (from 146p) is calculated using an oil price of US$100/bl with
discoveries and exploration assets valued using a risked NPV/bbl approach. We update estimates for the latest
actual data, movements in FX and revise EPS assumptions on updating our capex and production profiles. We
also introduce 2015 estimates for the stock.
Key risks
Key downside risks include worse than expected drilling results on the company’s shale assets or a change in
political sentiment on fraccing.
Source: Company data, Goldman Sachs Research estimates, FactSet.
Growth
Returns *
Multiple
Volatility Volatility
Multiple
Returns *
Growth
Investment Profile
Low High
Percentile 20th 40th 60th 80th 100th
* Returns = Return on Capital For a complete description of the investment
profile measures please refer to the
disclosure section of this document.
IGAS Energy Plc (IGAS.L)
Europe Oil & Gas Peer Group Average
Key data Current
Price (p) 88
12 month price target (p) 202
Upside/(downside) (%) 130
Market cap (£ mn) 131.1
Enterprise value (£ mn) 183.7
3/12 3/13E 3/14E 3/15E
EBIT (£ mn) New 5.1 31.6 28.6 25.5
EBIT revision (%) 191.7 (33.3) (51.6) (61.0)
EPS (p) New (4.13) 21.26 14.89 13.92
EPS (p) Old 0.34 12.45 16.34 4.30
EV/DACF (X) NM 4.6 5.0 4.3
P/E (X) NM 4.1 5.9 6.3
Dividend yield (%) 0.0 0.0 0.0 0.0
FCF yield (%) (23.2) 23.0 16.0 14.4
CROCI (%) NM NM NM NM
CROCI/WACC (X) -- -- -- --
EV/GCI NM NM NM NM
300
320
340
360
380
400
420
440
460
480
500
60
70
80
90
100
110
120
130
140
150
160
May-12 Sep-12 Dec-12 Mar-13
Price performance chart
IGAS Energy Plc (L) FTSE World Europe (GBP) (R)
Share price performance (%) 3 month 6 month 12 month
Absolute (6.4) 30.4 35.4
Rel. to FTSE World Europe (GBP) (10.1) 12.4 (0.1)
Source: Company data, Goldman Sachs Research estimates, FactSet. Price as of 5/30/2013 close.

June 3, 2013 Europe: Energy: Oil & Gas - E&P
Goldman Sachs Global Investment Research 23
Gulf Keystone (GKP.L): Attractive entry point for Kurdistan exposure despite litigation
risk; up to Buy
Source of opportunity
Recent performance of Gulf Keystone shares has been poor (-15% vs. our larger E&Ps ytd). We believe that this
has, in part, been driven by concerns over the outcome of the Excalibur court case (in which Excalibur is
claiming a stake in the Gulf Keystone assets in Kurdistan), but believe that the stock is now pricing in too
negative an outcome. We believe that the progress that has been made in bringing Kurdistan exports to fruition
is not being recognized in the share price. We currently assume a 25% chance of Gulf Keystone losing the case
at a cost of US$1.6 bn and see significant upside despite this approach. We regard Kurdistan as a highly
attractive source of low cost growth in the oil complex, with breakevens below US$30/bl and believe that further
progress towards exports should help crystallize this value. Given the low breakevens and large scale of the
assets, we believe that these assets will be attractive to larger oil companies, struggling to find growth at current
oil prices. Our backtesting of strategic assets from our Top 380 database suggests such asset transactions take
place at discount rates of 8%; 50% of our target price is based on a valuation of Gulf Keystone using this 5% cost
of capital. Of the names under our coverage with exposure to Kurdistan, Gulf Keystone is the most inexpensive
on our estimates; the Shaikan asset offers significant scale and potential for production growth. We have
revisited our model for Shaikan: we now assume higher costs for light oil as a result of the sulphur content and
assume that heavy oil is developed before light. We also adjust our assumptions on the recoverable split
between heavy and light oil (we assume heavy oil makes up c.75% of the total vs. 70% previously).
Catalyst
We believe that independent export infrastructure linking Kurdistan and Turkey should be in place by end 2013 /
early 2014 and that commencement of exports and payment should lead to a de-risking of assets by the equity
market and increasing speculation around high-value M&A in the region. Asset sales by peers or sales of
peripheral assets by GKP (such as the Akri Bijeel block) should result in a boost to the share price as should
imminent commencement of production at Shaikan (expected mid-2013). A resolution of the court case that
does not involve a significant cash payment should also be a significant positive catalyst in our view.
Valuation
Our 12-month SOTP-based target price is 258p (from 292p) and is calculated using an oil price of US$100/bl.
Discoveries and exploration assets are valued using a risked NPV/bbl approach. We assume a 50% M&A
weighting in which strategic assets (i.e. Shaikan) are valued using an 8% cost of capital.
Key risks
The key short-term risk is a worse than expected resolution to the court case. Deterioration in the political
environment in Kurdistan or poor flow rates from production facilities at Shaikan would also be negative.
Source: Company data, Goldman Sachs Research estimates, FactSet.
Growth
Returns *
Multiple
Volatility Volatility
Multiple
Returns *
Growth
Investment Profile
Low High
Percentile 20th 40th 60th 80th 100th
* Returns = Return on Capital For a complete description of the investment
profile measures please refer to the
disclosure section of this document.
Gulf Keystone Petroleum Ltd (GKP.L)
Europe Oil & Gas Peer Group Average
Key data Current
Price (p) 159.5
12 month price target (p) 258
Upside/(downside) (%) 62
Market cap (£ mn) 1,203.0
Enterprise value ($ mn) 1,895.4
12/11 12/12E 12/13E 12/14E
EBIT ($ mn) New (70.4) 4.8 23.9 111.1
EBIT revision (%) 0.0 (29.8) (18.6) 5.3
EPS ($) New (0.08) 0.03 0.05 0.16
EPS ($) Old (0.08) 0.03 0.06 0.15
EV/DACF (X) 73.3 51.1 29.7 8.9
P/E (X) NM 82.8 46.7 15.5
Dividend yield (%) 0.0 0.0 0.0 0.0
FCF yield (%) (7.0) (2.5) 3.1 9.1
CROCI (%) NM NM NM NM
CROCI/WACC (X) -- -- -- --
EV/GCI NM NM NM NM
300
320
340
360
380
400
420
440
120
140
160
180
200
220
240
260
May-12 Sep-12 Dec-12 Mar-13
Price performance chart
Gulf Keystone Petroleum Ltd (L) FTSE World Europe (GBP) (R)
Share price performance (%) 3 month 6 month 12 month
Absolute (15.5) (17.8) (19.2)
Rel. to FTSE World Europe (GBP) (18.9) (29.1) (40.4)
Source: Company data, Goldman Sachs Research estimates, FactSet. Price as of 5/30/2013 close.
June 3, 2013 Europe: Energy: Oil & Gas - E&P
Goldman Sachs Global Investment Research 24
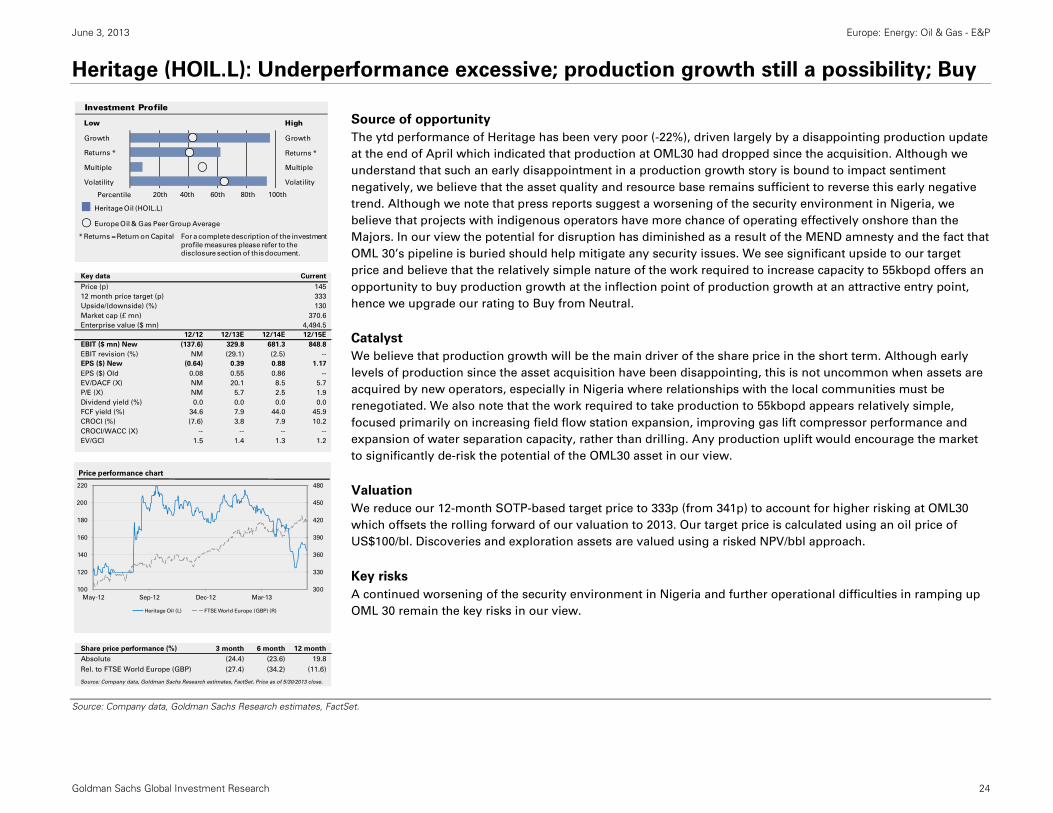
Heritage (HOIL.L): Underperformance excessive; production growth still a possibility; Buy
Source of opportunity
The ytd performance of Heritage has been very poor (-22%), driven largely by a disappointing production update
at the end of April which indicated that production at OML30 had dropped since the acquisition. Although we
understand that such an early disappointment in a production growth story is bound to impact sentiment
negatively, we believe that the asset quality and resource base remains sufficient to reverse this early negative
trend. Although we note that press reports suggest a worsening of the security environment in Nigeria, we
believe that projects with indigenous operators have more chance of operating effectively onshore than the
Majors. In our view the potential for disruption has diminished as a result of the MEND amnesty and the fact that
OML 30’s pipeline is buried should help mitigate any security issues. We see significant upside to our target
price and believe that the relatively simple nature of the work required to increase capacity to 55kbopd offers an
opportunity to buy production growth at the inflection point of production growth at an attractive entry point,
hence we upgrade our rating to Buy from Neutral.
Catalyst
We believe that production growth will be the main driver of the share price in the short term. Although early
levels of production since the asset acquisition have been disappointing, this is not uncommon when assets are
acquired by new operators, especially in Nigeria where relationships with the local communities must be
renegotiated. We also note that the work required to take production to 55kbopd appears relatively simple,
focused primarily on increasing field flow station expansion, improving gas lift compressor performance and
expansion of water separation capacity, rather than drilling. Any production uplift would encourage the market
to significantly de-risk the potential of the OML30 asset in our view.
Valuation
We reduce our 12-month SOTP-based target price to 333p (from 341p) to account for higher risking at OML30
which offsets the rolling forward of our valuation to 2013. Our target price is calculated using an oil price of
US$100/bl. Discoveries and exploration assets are valued using a risked NPV/bbl approach.
Key risks
A continued worsening of the security environment in Nigeria and further operational difficulties in ramping up
OML 30 remain the key risks in our view.
Source: Company data, Goldman Sachs Research estimates, FactSet.
Growth
Returns *
Multiple
Volatility Volatility
Multiple
Returns *
Growth
Investment Profile
Low High
Percentile 20th 40th 60th 80th 100th
* Returns = Return on Capital For a complete description of the investment
profile measures please refer to the
disclosure section of this document.
Heritage Oil (HOIL.L)
Europe Oil & Gas Peer Group Average
Key data Current
Price (p) 145
12 month price target (p) 333
Upside/(downside) (%) 130
Market cap (£ mn) 370.6
Enterprise value ($ mn) 4,494.5
12/12 12/13E 12/14E 12/15E
EBIT ($ mn) New (137.6) 329.8 681.3 848.8
EBIT revision (%) NM (29.1) (2.5) --
EPS ($) New (0.64) 0.39 0.88 1.17
EPS ($) Old 0.08 0.55 0.86 --
EV/DACF (X) NM 20.1 8.5 5.7
P/E (X) NM 5.7 2.5 1.9
Dividend yield (%) 0.0 0.0 0.0 0.0
FCF yield (%) 34.6 7.9 44.0 45.9
CROCI (%) (7.6) 3.8 7.9 10.2
CROCI/WACC (X) -- -- -- --
EV/GCI 1.5 1.4 1.3 1.2
300
330
360
390
420
450
480
100
120
140
160
180
200
220
May-12 Sep-12 Dec-12 Mar-13
Price performance chart
Heritage Oil (L) FTSE World Europe (GBP) (R)
Share price performance (%) 3 month 6 month 12 month
Absolute (24.4) (23.6) 19.8
Rel. to FTSE World Europe (GBP) (27.4) (34.2) (11.6)
Source: Company data, Goldman Sachs Research estimates, FactSet. Price as of 5/30/2013 close.

June 3, 2013 Europe: Energy: Oil & Gas - E&P
Goldman Sachs Global Investment Research 25
Bankers Petroleum (BNKq.L): Downgrade to Neutral – better opportunities elsewhere
What happened
We remove Bankers Petroleum from our Buy List following a period of good relative performance vs. our
smaller E&P universe. Year to date, the AIM listing of the stock is up 6.5% vs. our small cap E&P universe down
over 12% - outperformance of over 18%. As a result, we now see more upside and more re-rating potential in
other names and remove Bankers from the Buy List.
Since being added to the Buy List on November 5, 2010, the shares are down 57.5% vs. FTSE World Europe up
9.2%.
Current view
We believe that the recent 1Q13 update highlights the potential for further increases in production and that the
production issues experienced through parts of 2012 (i.e. issues with liner integrity and water intrusion) now
appear to be largely under control. We believe that reserve growth within the asset remains a key part of the
investment case, with activity on this front due to take place in the later part of 2013 through the water and
polymer flood campaigns and the thermal programmes. We currently assume 200mnbls of unrisked upside from
these campaigns in the short term, risked at 25% chance of success. We also believe that the balance sheet
remains robust with extensions to the company’s credit facilities having been agreed, production growing and
differentials vs. Brent narrowing for the company’s heavy crude. Despite the potential for both production and
reserves growth, however, we believe that as production rises, similar levels of incremental growth will prove
harder to come by and despite giving risked upside to the secondary and tertiary recovery techniques, we see
more attractive upside elsewhere in our universe.
We increase our valuation to account the potential of the secondary recovery programmes that we expect to be
undertaken in the coming months. We also make minor adjustments to production profiles, capex, costs and
differentials.
Our new 12-month SOTP-based target price of 390p (from 348p) is calculated using an oil price of US$100/bl
with exploration assets being valued on an NPV/bl basis. Our valuation increases as a result of including
additional value for enhanced recovery and as a result of FX movements and rolling forward our valuation to
2013.
Key downside risks include operational issues in ramping up production or failures with secondary and tertiary
recovery techniques. Upside risks include M&A activity involving the company or increases in the spot oil price.
Source: Company data, Goldman Sachs Research estimates, FactSet.
Growth
Returns *
Multiple
Volatility Volatility
Multiple
Returns *
Growth
Investment Profile
Low High
Percentile 20th 40th 60th 80th 100th
* Returns = Return on Capital For a complete description of the investment
profile measures please refer to the
disclosure section of this document.
Bankers Petroleum Ltd (BNKq.L)
Europe Oil & Gas Peer Group Average
Key data Current
Price (p) 195.5
12 month price target (p) 390
Upside/(downside) (%) 99
Market cap (£ mn) 483.2
Enterprise value ($ mn) 788.7
12/12 12/13E 12/14E 12/15E
EBIT ($ mn) New 119.0 236.8 266.4 269.4
EBIT revision (%) (56.1) (9.1) (0.8) --
EPS ($) New 0.14 0.62 0.84 0.75
EPS ($) Old 0.22 0.25 0.41 --
EV/DACF (X) 4.3 3.6 2.5 2.4
P/E (X) 23.6 4.8 3.5 3.9
Dividend yield (%) 0.0 0.0 0.0 0.0
FCF yield (%) (7.2) 1.6 13.2 9.6
CROCI (%) NM NM NM NM
CROCI/WACC (X) -- -- -- --
EV/GCI NM NM NM NM
300
320
340
360
380
400
420
440
80
100
120
140
160
180
200
220
May-12 Sep-12 Dec-12 Mar-13
Price performance chart
Bankers Petroleum Ltd (L) FTSE World Europe (GBP) (R)
Share price performance (%) 3 month 6 month 12 month
Absolute 2.9 23.0 53.3
Rel. to FTSE World Europe (GBP) (1.2) 6.0 13.2
Source: Company data, Goldman Sachs Research estimates, FactSet. Price as of 5/30/2013 close.

June 3, 2013 Europe: Energy: Oil & Gas - E&P
Goldman Sachs Global Investment Research 26
Exhibit 18: Share price performance of Bankers Petroleum Prices as per close May 30, 2013
Source: FactSet, Quantum database.
Company Ticker Primary analyst Price currency
Price as of May 30, 2013
Price performance since Nov 5, 2010
3 month price performance
6 month price performance
12 month price performance
Europe Oil & Gas Peer Group Bankers Petroleum Ltd BNKq.L Christophor Jost p 195.50 -57.5% 2.9% 23.0% 53.3%Afren Plc AFRE.L Christophor Jost p 137.00 4.7% -3.7% 0.4% 16.1%Africa Oil Corp AOIC.ST Ruth Brooker Skr 45.60 235.3% 1.3% -15.6% -38.0%Amerisur Resources Plc AMER.L Ruth Brooker p 46.50 264.7% -3.6% -2.1% 132.5%Bahamas Petroleum Company Plc BPCB.L Christophor Jost p 4.31 -31.2% -13.9% 5.3% -37.6%Borders & Southern BSTH.L Christophor Jost p 16.00 -75.8% -25.6% -4.5% -75.8%BowLeven Plc BLVN.L Christophor Jost p 71.25 -62.3% -7.5% 0.4% 13.1%Cairn Energy PLC CNE.L Christophor Jost p 277.80 -36.3% 2.2% 3.4% -3.7%Chariot Oil & Gas Ltd CHARC.L Ruth Brooker p 20.00 -88.8% -8.0% -27.3% -75.8%Coastal Energy Company CEO.L Christophor Jost p 1125.00 291.3% -12.8% -9.8% 22.3%Det Norske Oljeselskap ASA DETNOR.OL Christophor Jost Nkr 90.90 259.3% 0.8% 11.5% 15.1%DNO International ASA DNO.OL Christophor Jost Nkr 10.61 15.4% 2.7% 6.3% 30.0%Dragon Oil PLC DGO.L Christophor Jost p 633.00 40.7% 2.7% 14.1% 25.3%EnQuest Plc ENQ.L Christophor Jost p 128.00 -6.9% -3.8% 12.3% 7.1%Falkland Oil & Gas Ltd FOGL.L Christophor Jost p 25.25 -75.7% -15.8% -19.2% -71.5%Genel Energy GENL.L Christophor Jost p 937.50 NA 26.7% 15.9% 48.3%Great Eastern Energy Corporation Ltd GEECq.L Christophor Jost p 273.50 -37.8% 1.8% 3.2% -13.9%Green Dragon Gas Ltd GDG.L Christophor Jost p 195.75 -62.2% -3.3% -23.5% -60.3%Gulf Keystone Petroleum Ltd GKP.L Christophor Jost p 159.50 -16.7% -15.5% -17.8% -19.2%Heritage Oil HOIL.L Christophor Jost p 145.00 -59.8% -24.4% -23.6% 19.8%IGAS Energy Plc IGAS.L Christophor Jost p 88.00 37.5% -6.4% 30.4% 35.4%Lundin Petroleum LUPE.ST Christophor Jost Skr 140.20 102.9% -4.6% -10.8% 7.8%Maurel & Prom MAUP.PA Christophor Jost € 13.30 52.0% -5.0% 6.4% 22.8%Northern Petroleum Plc NOP.L Christophor Jost p 35.00 -64.1% -35.5% -45.3% -49.2%Ophir Energy OPHR.L Christophor Jost p 402.60 NA -2.8% -6.5% -18.5%Petroceltic International PCI.L Ruth Brooker p 6.25 -51.9% -12.2% -15.0% 5.9%Premier Oil PMO.L Christophor Jost p 369.70 -16.2% -3.3% 9.9% 10.5%Rockhopper Exploration Plc RKH.L Christophor Jost p 139.25 -55.5% -2.6% -5.4% -54.1%Salamander Energy PLC SMDR.L Christophor Jost p 172.50 -4.1% -14.4% -5.2% 6.0%San Leon Energy SLEN.L Christophor Jost p 7.39 -56.5% -12.6% -9.7% -9.3%Serica Energy Plc SQZ.L Christophor Jost p 23.63 -40.6% -15.6% -6.4% -4.5%Soco International Plc SIA.L Christophor Jost p 394.50 22.1% 6.8% 8.6% 41.7%Tower Resources Plc TOWR.L Ruth Brooker p 1.65 -60.0% -28.3% -38.3% -44.5%
FTSE World Europe (GBP) 418.94 9.2% 4.2% 16.0% 35.5%
Note: Prices as of most recent available close, which could vary from the price date indicated aboveThis table shows movement in absolute share price and not total shareholder return. Results presented should not and cannot be viewed as an indicator of future performance.

June 3, 2013 Europe: Energy: Oil & Gas - E&P
Goldman Sachs Global Investment Research 27
Maurel et Prom (MAUP.PA): M&A potential but more visible catalysts elsewhere; Neutral
What happened
We remove Maurel et Prom from our Buy List. Since being added to the Buy List on May 30, 2011, the stock is up
2.7% vs. FTSE World Europe up 7.8% and our E&P universe down 16.4%. While we continue to see upside in the
stock, we see relatively few operational catalysts to drive the share price in the short term, leaving the stock
reliant on M&A to outperform significantly. M&A remains a possibility given the quality and cash flow
generation of the company’s Gabonese assets, however we downgrade our rating to Neutral in favour of
companies with clearer visibility on operational catalysts.
Current view
We continue to see attractive value in the stock, with the shares trading at a 30% discount to the value of core +
discoveries and a discount to the valuation of production plus cash. We view the rising production at Gabon
positively and expect the asset to exceed 30kbopd in 2014 (at which point more pipeline capacity would need to
be negotiated). However, with below average exploration re-rating potential during 2013 vs. our larger E&P
universe (26% to end 2013 on our estimates) we believe that significant outperformance would have to be driven
mainly by M&A. We are unconvinced that the onshore assets in Gabon are of sufficient strategic importance to
command a price sufficiently high to convince shareholders of the merits of a sale.
We believe that growth potential exists outside Gabon from the company’s varied portfolio and that a
production permit in mid-2013 should allow the company to enlarge its water handling capacity at Sabanero
which could also result in increased production. The company’s positions in locations such as Peru,
Mozambique and Namibia could offer higher risk growth - we expect drilling in Mozambique and from Peru
towards the end of the year. Although Maurel et Prom is unlikely to drill its own acreage in Namibia in 2013,
sentiment could be impacted from drilling by HRT Participacoes em Petroleo in the near term. We note,
however, that potential re-rating from these areas remains relatively light compared with other names in our
universe.
Our new 12-month SOTP-based target price of €19.46 (from €21.04) is calculated using an oil price of US$100/bl
with exploration assets being valued on an NPV/bl basis. Our valuation reduces as a result of a reduction in our
strategic premium for the stock along with a remodelling of Gabon (we model a flatter profile, peaking at
35kbopd; we also account for lower than expected reserves at Sabanero). We include an 20% weighting for M&A
in our target price.
Key downside risks include operational issues at Gabon or in Columbia. The key upside risk is a bid for the
company or its Gabonese assets.
Source: Company data, Goldman Sachs Research estimates, FactSet.
Growth
Returns *
Multiple
Volatility Volatility
Multiple
Returns *
Growth
Investment Profile
Low High
Percentile 20th 40th 60th 80th 100th
* Returns = Return on Capital For a complete description of the investment
profile measures please refer to the
disclosure section of this document.
Maurel & Prom (MAUP.PA)
Europe Oil & Gas Peer Group Average
Key data Current
Price (€) 13.30
12 month price target (€) 19.46
Upside/(downside) (%) 46
Market cap (€ mn) 1,612.0
Enterprise value (€ mn) 2,010.8
12/12 12/13E 12/14E 12/15E
Revenue (€ mn) 472.1 478.1 404.4 220.4
EBIT (€ mn) 200.8 388.3 310.0 155.7
EPS (€) 0.37 1.75 0.92 0.98
EV/EBITDA (X) 9.4 5.2 6.2 11.4
P/E (X) 33.5 7.6 14.4 13.5
Dividend yield (%) 0.0 0.0 0.0 0.0
FCF yield (%) 1.8 0.5 5.5 8.8
CROCI (%) NM NM NM NM
CROCI/WACC (X) -- -- -- --
EV/GCI (X) NM NM NM NM
280
300
320
340
360
380
400
420
440
460
480
10.0
10.5
11.0
11.5
12.0
12.5
13.0
13.5
14.0
14.5
15.0
May-12 Sep-12 Dec-12 Mar-13
Price performance chart
Maurel & Prom (L) FTSE World Europe (EUR) (R)
Share price performance (%) 3 month 6 month 12 month
Absolute (5.0) 6.4 22.8
Rel. to FTSE World Europe (EUR) (9.1) (3.0) (2.5)
Source: Company data, Goldman Sachs Research estimates, FactSet. Price as of 5/30/2013 close.

June 3, 2013 Europe: Energy: Oil & Gas - E&P
Goldman Sachs Global Investment Research 28
Exhibit 19: Share price performance of Maurel et Prom Prices as per close May 30, 2013
Source: FactSet, Quantum database.
Company Ticker Primary analyst Price currency
Price as of May 30, 2013
Price performance since May 30, 2011
3 month price performance
6 month price performance
12 month price performance
Europe Oil & Gas Peer Group Maurel & Prom MAUP.PA Christophor Jost € 13.30 2.7% -5.0% 6.4% 22.8%Afren Plc AFRE.L Christophor Jost p 137.00 -16.4% -3.7% 0.4% 16.1%Africa Oil Corp AOIC.ST Ruth Brooker Skr 45.60 320.3% 1.3% -15.6% -38.0%Amerisur Resources Plc AMER.L Ruth Brooker p 46.50 66.1% -3.6% -2.1% 132.5%Bahamas Petroleum Company Plc BPCB.L Christophor Jost p 4.31 -73.9% -13.9% 5.3% -37.6%Bankers Petroleum Ltd BNKq.L Christophor Jost p 195.50 -60.3% 2.9% 23.0% 53.3%Borders & Southern BSTH.L Christophor Jost p 16.00 -70.9% -25.6% -4.5% -75.8%BowLeven Plc BLVN.L Christophor Jost p 71.25 -76.3% -7.5% 0.4% 13.1%Cairn Energy PLC CNE.L Christophor Jost p 277.80 -44.5% 2.2% 3.4% -3.7%Chariot Oil & Gas Ltd CHARC.L Ruth Brooker p 20.00 -91.2% -8.0% -27.3% -75.8%Coastal Energy Company CEO.L Christophor Jost p 1125.00 164.7% -12.8% -9.8% 22.3%Det Norske Oljeselskap ASA DETNOR.OL Christophor Jost Nkr 90.90 198.0% 0.8% 11.5% 15.1%DNO International ASA DNO.OL Christophor Jost Nkr 10.61 46.3% 2.7% 6.3% 30.0%Dragon Oil PLC DGO.L Christophor Jost p 633.00 20.1% 2.7% 14.1% 25.3%EnQuest Plc ENQ.L Christophor Jost p 128.00 -3.9% -3.8% 12.3% 7.1%Falkland Oil & Gas Ltd FOGL.L Christophor Jost p 25.25 -59.3% -15.8% -19.2% -71.5%Genel Energy GENL.L Christophor Jost p 937.50 NA 26.7% 15.9% 48.3%Great Eastern Energy Corporation Ltd GEECq.L Christophor Jost p 273.50 -34.5% 1.8% 3.2% -13.9%Green Dragon Gas Ltd GDG.L Christophor Jost p 195.75 -74.2% -3.3% -23.5% -60.3%Gulf Keystone Petroleum Ltd GKP.L Christophor Jost p 159.50 9.6% -15.5% -17.8% -19.2%Heritage Oil HOIL.L Christophor Jost p 145.00 -39.3% -24.4% -23.6% 19.8%IGAS Energy Plc IGAS.L Christophor Jost p 88.00 19.7% -6.4% 30.4% 35.4%Lundin Petroleum LUPE.ST Christophor Jost Skr 140.20 66.8% -4.6% -10.8% 7.8%Northern Petroleum Plc NOP.L Christophor Jost p 35.00 -52.1% -35.5% -45.3% -49.2%Ophir Energy OPHR.L Christophor Jost p 402.60 NA -2.8% -6.5% -18.5%Petroceltic International PCI.L Ruth Brooker p 6.25 -44.4% -12.2% -15.0% 5.9%Premier Oil PMO.L Christophor Jost p 369.70 -20.2% -3.3% 9.9% 10.5%Rockhopper Exploration Plc RKH.L Christophor Jost p 139.25 -31.2% -2.6% -5.4% -54.1%Salamander Energy PLC SMDR.L Christophor Jost p 172.50 -25.5% -14.4% -5.2% 6.0%San Leon Energy SLEN.L Christophor Jost p 7.39 -75.2% -12.6% -9.7% -9.3%Serica Energy Plc SQZ.L Christophor Jost p 23.63 -9.1% -15.6% -6.4% -4.5%Soco International Plc SIA.L Christophor Jost p 394.50 3.9% 6.8% 8.6% 41.7%Tower Resources Plc TOWR.L Ruth Brooker p 1.65 -71.8% -28.3% -38.3% -44.5%
FTSE World Europe (EUR) 379.27 7.8% 4.6% 9.7% 26.0%
Note: Prices as of most recent available close, which could vary from the price date indicated aboveThis table shows movement in absolute share price and not total shareholder return. Results presented should not and cannot be viewed as an indicator of future performance.

June 3, 2013 Europe: Energy: Oil & Gas - E&P
Goldman Sachs Global Investment Research 29
Disclosure Appendix
Reg AC
We, Christophor Jost and Ruth Brooker, hereby certify that all of the views expressed in this report accurately reflect our personal views about the subject company or companies and its or their
securities. We also certify that no part of our compensation was, is or will be, directly or indirectly, related to the specific recommendations or views expressed in this report.
Investment Profile The Goldman Sachs Investment Profile provides investment context for a security by comparing key attributes of that security to its peer group and market. The four key attributes depicted are: growth,
returns, multiple and volatility. Growth, returns and multiple are indexed based on composites of several methodologies to determine the stocks percentile ranking within the region's coverage
universe.
The precise calculation of each metric may vary depending on the fiscal year, industry and region but the standard approach is as follows:
Growth is a composite of next year's estimate over current year's estimate, e.g. EPS, EBITDA, Revenue. Return is a year one prospective aggregate of various return on capital measures, e.g. CROCI,
ROACE, and ROE. Multiple is a composite of one-year forward valuation ratios, e.g. P/E, dividend yield, EV/FCF, EV/EBITDA, EV/DACF, Price/Book. Volatility is measured as trailing twelve-month
volatility adjusted for dividends.
Quantum Quantum is Goldman Sachs' proprietary database providing access to detailed financial statement histories, forecasts and ratios. It can be used for in-depth analysis of a single company, or to make
comparisons between companies in different sectors and markets.
GS SUSTAIN GS SUSTAIN is a global investment strategy aimed at long-term, long-only performance with a low turnover of ideas. The GS SUSTAIN focus list includes leaders our analysis shows to be well
positioned to deliver long term outperformance through sustained competitive advantage and superior returns on capital relative to their global industry peers. Leaders are identified based on
quantifiable analysis of three aspects of corporate performance: cash return on cash invested, industry positioning and management quality (the effectiveness of companies' management of the
environmental, social and governance issues facing their industry).
Disclosures
Coverage group(s) of stocks by primary analyst(s)
Christophor Jost: Europe-Energy:Oil-E&P, Europe-Energy:Oil-Integrated. Ruth Brooker: Europe-Energy:Oil-E&P. Michele della Vigna, CFA: Europe-Energy:Oil-Integrated, Europe-Mining.
Europe-Energy:Oil-E&P: Afren Plc, Africa Oil Corp, Amerisur Resources Plc, Bahamas Petroleum Company Plc, Bankers Petroleum Ltd, Borders & Southern, BowLeven PLC, Cairn Energy PLC, Chariot
Oil & Gas Ltd, Coastal Energy Company, DNO International ASA, Det Norske Oljeselskap ASA, Dragon Oil PLC, EnQuest Plc, Falkland Oil & Gas Ltd, Genel Energy, Great Eastern Energy Corporation Ltd,
Green Dragon Gas Ltd, Gulf Keystone Petroleum Ltd, Heritage Oil, IGAS Energy Plc, Lundin Petroleum, Maurel & Prom, Northern Petroleum Plc, Ophir Energy, Petroceltic International, Premier Oil,
Rockhopper Exploration Plc, Salamander Energy Plc, San Leon Energy, Serica Energy Plc, Soco International Plc, Tower Resources Plc.
Europe-Energy:Oil-Integrated: BG Group, BP plc, BP plc (ADS), ENI, Essar Energy, Galp, OMV, Repsol, Royal Dutch Shell plc (A ADR), Royal Dutch Shell plc (A), Royal Dutch Shell plc (B ADR), Royal
Dutch Shell plc (B), Statoil, TOTAL SA, Tullow Oil Plc.
Europe-Mining: African Barrick Gold, African Minerals, Amara Mining, Anglo American plc, Antofagasta plc, Aquarius Platinum, Aureus Mining, BHP Billiton Plc, Banro Corporation, Boliden, Centamin
Plc, Eastern Platinum, Endeavour Mining, First Quantum Minerals, Fresnillo PLC, Gem Diamonds, Glencore Xstrata plc, Hochschild Mining Plc, Kazakhmys, Kumba Iron Ore, London Mining, Lonmin,
Lundin Mining Corporation, Norsk Hydro, Nyrstar, Petra Diamonds, Platinum Group Metals Ltd., Randgold Resources, Rio Tinto plc, Semafo, Inc., Talvivaara, Vedanta Resources.
Company-specific regulatory disclosures
Compendium report: please see disclosures at http://www.gs.com/research/hedge.html. Disclosures applicable to the companies included in this compendium can be found in the latest relevant
published research
Distribution of ratings/investment banking relationships
Goldman Sachs Investment Research global coverage universe
Rating Distribution Investment Banking Relationships

June 3, 2013 Europe: Energy: Oil & Gas - E&P
Goldman Sachs Global Investment Research 30
Buy Hold Sell Buy Hold Sell
Global 31% 54% 15% 49% 42% 36%
As of April 1, 2013, Goldman Sachs Global Investment Research had investment ratings on 3,492 equity securities. Goldman Sachs assigns stocks as Buys and Sells on various regional Investment
Lists; stocks not so assigned are deemed Neutral. Such assignments equate to Buy, Hold and Sell for the purposes of the above disclosure required by NASD/NYSE rules. See 'Ratings, Coverage
groups and views and related definitions' below.
Price target and rating history chart(s)
Compendium report: please see disclosures at http://www.gs.com/research/hedge.html. Disclosures applicable to the companies included in this compendium can be found in the latest relevant
published research
Regulatory disclosures
Disclosures required by United States laws and regulations
See company-specific regulatory disclosures above for any of the following disclosures required as to companies referred to in this report: manager or co-manager in a pending transaction; 1% or
other ownership; compensation for certain services; types of client relationships; managed/co-managed public offerings in prior periods; directorships; for equity securities, market making and/or
specialist role. Goldman Sachs usually makes a market in fixed income securities of issuers discussed in this report and usually deals as a principal in these securities.
The following are additional required disclosures: Ownership and material conflicts of interest: Goldman Sachs policy prohibits its analysts, professionals reporting to analysts and members of their
households from owning securities of any company in the analyst's area of coverage. Analyst compensation: Analysts are paid in part based on the profitability of Goldman Sachs, which includes
investment banking revenues. Analyst as officer or director: Goldman Sachs policy prohibits its analysts, persons reporting to analysts or members of their households from serving as an officer,
director, advisory board member or employee of any company in the analyst's area of coverage. Non-U.S. Analysts: Non-U.S. analysts may not be associated persons of Goldman, Sachs & Co. and
therefore may not be subject to NASD Rule 2711/NYSE Rules 472 restrictions on communications with subject company, public appearances and trading securities held by the analysts.
Distribution of ratings: See the distribution of ratings disclosure above. Price chart: See the price chart, with changes of ratings and price targets in prior periods, above, or, if electronic format or if
with respect to multiple companies which are the subject of this report, on the Goldman Sachs website at http://www.gs.com/research/hedge.html.
Additional disclosures required under the laws and regulations of jurisdictions other than the United States
The following disclosures are those required by the jurisdiction indicated, except to the extent already made above pursuant to United States laws and regulations. Australia: Goldman Sachs Australia
Pty Ltd and its affiliates are not authorised deposit-taking institutions (as that term is defined in the Banking Act 1959 (Cth)) in Australia and do not provide banking services, nor carry on a banking
business, in Australia. This research, and any access to it, is intended only for "wholesale clients" within the meaning of the Australian Corporations Act, unless otherwise agreed by Goldman
Sachs. Brazil: Disclosure information in relation to CVM Instruction 483 is available at http://www.gs.com/worldwide/brazil/area/gir/index.html. Where applicable, the Brazil-registered analyst primarily
responsible for the content of this research report, as defined in Article 16 of CVM Instruction 483, is the first author named at the beginning of this report, unless indicated otherwise at the end of the
text. Canada: Goldman, Sachs & Co. has approved of, and agreed to take responsibility for, this research in Canada if and to the extent it relates to equity securities of Canadian issuers. Analysts may
conduct site visits but are prohibited from accepting payment or reimbursement by the company of travel expenses for such visits. Hong Kong: Further information on the securities of covered
companies referred to in this research may be obtained on request from Goldman Sachs (Asia) L.L.C. India: Further information on the subject company or companies referred to in this research may
be obtained from Goldman Sachs (India) Securities Private Limited; Japan: See below. Korea: Further information on the subject company or companies referred to in this research may be obtained
from Goldman Sachs (Asia) L.L.C., Seoul Branch. New Zealand: Goldman Sachs New Zealand Limited and its affiliates are neither "registered banks" nor "deposit takers" (as defined in the Reserve
Bank of New Zealand Act 1989) in New Zealand. This research, and any access to it, is intended for "wholesale clients" (as defined in the Financial Advisers Act 2008) unless otherwise agreed by
Goldman Sachs. Russia: Research reports distributed in the Russian Federation are not advertising as defined in the Russian legislation, but are information and analysis not having product
promotion as their main purpose and do not provide appraisal within the meaning of the Russian legislation on appraisal activity. Singapore: Further information on the covered companies referred
to in this research may be obtained from Goldman Sachs (Singapore) Pte. (Company Number: 198602165W). Taiwan: This material is for reference only and must not be reprinted without permission.
Investors should carefully consider their own investment risk. Investment results are the responsibility of the individual investor. United Kingdom: Persons who would be categorized as retail clients
in the United Kingdom, as such term is defined in the rules of the Financial Services Authority, should read this research in conjunction with prior Goldman Sachs research on the covered companies
referred to herein and should refer to the risk warnings that have been sent to them by Goldman Sachs International. A copy of these risks warnings, and a glossary of certain financial terms used in
this report, are available from Goldman Sachs International on request.
European Union: Disclosure information in relation to Article 4 (1) (d) and Article 6 (2) of the European Commission Directive 2003/126/EC is available at
http://www.gs.com/disclosures/europeanpolicy.html which states the European Policy for Managing Conflicts of Interest in Connection with Investment Research.
Japan: Goldman Sachs Japan Co., Ltd. is a Financial Instrument Dealer registered with the Kanto Financial Bureau under registration number Kinsho 69, and a member of Japan Securities Dealers
Association, Financial Futures Association of Japan and Type II Financial Instruments Firms Association. Sales and purchase of equities are subject to commission pre-determined with clients plus
consumption tax. See company-specific disclosures as to any applicable disclosures required by Japanese stock exchanges, the Japanese Securities Dealers Association or the Japanese Securities
Finance Company.

June 3, 2013 Europe: Energy: Oil & Gas - E&P
Goldman Sachs Global Investment Research 31
Ratings, coverage groups and views and related definitions
Buy (B), Neutral (N), Sell (S) -Analysts recommend stocks as Buys or Sells for inclusion on various regional Investment Lists. Being assigned a Buy or Sell on an Investment List is determined by a
stock's return potential relative to its coverage group as described below. Any stock not assigned as a Buy or a Sell on an Investment List is deemed Neutral. Each regional Investment Review
Committee manages various regional Investment Lists to a global guideline of 25%-35% of stocks as Buy and 10%-15% of stocks as Sell; however, the distribution of Buys and Sells in any particular
coverage group may vary as determined by the regional Investment Review Committee. Regional Conviction Buy and Sell lists represent investment recommendations focused on either the size of the
potential return or the likelihood of the realization of the return.
Return potential represents the price differential between the current share price and the price target expected during the time horizon associated with the price target. Price targets are required for all
covered stocks. The return potential, price target and associated time horizon are stated in each report adding or reiterating an Investment List membership.
Coverage groups and views: A list of all stocks in each coverage group is available by primary analyst, stock and coverage group at http://www.gs.com/research/hedge.html. The analyst assigns one
of the following coverage views which represents the analyst's investment outlook on the coverage group relative to the group's historical fundamentals and/or valuation. Attractive (A). The
investment outlook over the following 12 months is favorable relative to the coverage group's historical fundamentals and/or valuation. Neutral (N). The investment outlook over the following 12
months is neutral relative to the coverage group's historical fundamentals and/or valuation. Cautious (C). The investment outlook over the following 12 months is unfavorable relative to the coverage
group's historical fundamentals and/or valuation.
Not Rated (NR). The investment rating and target price have been removed pursuant to Goldman Sachs policy when Goldman Sachs is acting in an advisory capacity in a merger or strategic
transaction involving this company and in certain other circumstances. Rating Suspended (RS). Goldman Sachs Research has suspended the investment rating and price target for this stock, because
there is not a sufficient fundamental basis for determining, or there are legal, regulatory or policy constraints around publishing, an investment rating or target. The previous investment rating and
price target, if any, are no longer in effect for this stock and should not be relied upon. Coverage Suspended (CS). Goldman Sachs has suspended coverage of this company. Not Covered (NC). Goldman Sachs does not cover this company. Not Available or Not Applicable (NA). The information is not available for display or is not applicable. Not Meaningful (NM). The
information is not meaningful and is therefore excluded.
Global product; distributing entities
The Global Investment Research Division of Goldman Sachs produces and distributes research products for clients of Goldman Sachs on a global basis. Analysts based in Goldman Sachs offices
around the world produce equity research on industries and companies, and research on macroeconomics, currencies, commodities and portfolio strategy. This research is disseminated in Australia
by Goldman Sachs Australia Pty Ltd (ABN 21 006 797 897); in Brazil by Goldman Sachs do Brasil Corretora de Títulos e Valores Mobiliários S.A.; in Canada by Goldman, Sachs & Co. regarding
Canadian equities and by Goldman, Sachs & Co. (all other research); in Hong Kong by Goldman Sachs (Asia) L.L.C.; in India by Goldman Sachs (India) Securities Private Ltd.; in Japan by Goldman
Sachs Japan Co., Ltd.; in the Republic of Korea by Goldman Sachs (Asia) L.L.C., Seoul Branch; in New Zealand by Goldman Sachs New Zealand Limited; in Russia by OOO Goldman Sachs; in
Singapore by Goldman Sachs (Singapore) Pte. (Company Number: 198602165W); and in the United States of America by Goldman, Sachs & Co. Goldman Sachs International has approved this
research in connection with its distribution in the United Kingdom and European Union.
European Union: Goldman Sachs International, authorized and regulated by the Financial Services Authority, has approved this research in connection with its distribution in the European Union and
United Kingdom; Goldman Sachs AG and Goldman Sachs International Zweigniederlassung Frankfurt, regulated by the Bundesanstalt für Finanzdienstleistungsaufsicht, may also distribute research in
Germany.
General disclosures
This research is for our clients only. Other than disclosures relating to Goldman Sachs, this research is based on current public information that we consider reliable, but we do not represent it is
accurate or complete, and it should not be relied on as such. We seek to update our research as appropriate, but various regulations may prevent us from doing so. Other than certain industry reports
published on a periodic basis, the large majority of reports are published at irregular intervals as appropriate in the analyst's judgment.
Goldman Sachs conducts a global full-service, integrated investment banking, investment management, and brokerage business. We have investment banking and other business relationships with a
substantial percentage of the companies covered by our Global Investment Research Division. Goldman, Sachs & Co., the United States broker dealer, is a member of SIPC (http://www.sipc.org).
Our salespeople, traders, and other professionals may provide oral or written market commentary or trading strategies to our clients and our proprietary trading desks that reflect opinions that are
contrary to the opinions expressed in this research. Our asset management area, our proprietary trading desks and investing businesses may make investment decisions that are inconsistent with the
recommendations or views expressed in this research.
The analysts named in this report may have from time to time discussed with our clients, including Goldman Sachs salespersons and traders, or may discuss in this report, trading strategies that
reference catalysts or events that may have a near-term impact on the market price of the equity securities discussed in this report, which impact may be directionally counter to the analysts' published
price target expectations for such stocks. Any such trading strategies are distinct from and do not affect the analysts' fundamental equity rating for such stocks, which rating reflects a stock's return
potential relative to its coverage group as described herein.
We and our affiliates, officers, directors, and employees, excluding equity and credit analysts, will from time to time have long or short positions in, act as principal in, and buy or sell, the securities or
derivatives, if any, referred to in this research.
This research is not an offer to sell or the solicitation of an offer to buy any security in any jurisdiction where such an offer or solicitation would be illegal. It does not constitute a personal
recommendation or take into account the particular investment objectives, financial situations, or needs of individual clients. Clients should consider whether any advice or recommendation in this
research is suitable for their particular circumstances and, if appropriate, seek professional advice, including tax advice. The price and value of investments referred to in this research and the income
from them may fluctuate. Past performance is not a guide to future performance, future returns are not guaranteed, and a loss of original capital may occur. Fluctuations in exchange rates could have
adverse effects on the value or price of, or income derived from, certain investments.

June 3, 2013 Europe: Energy: Oil & Gas - E&P
Goldman Sachs Global Investment Research 32
Certain transactions, including those involving futures, options, and other derivatives, give rise to substantial risk and are not suitable for all investors. Investors should review current options
disclosure documents which are available from Goldman Sachs sales representatives or at http://www.theocc.com/about/publications/character-risks.jsp. Transaction costs may be significant in option
strategies calling for multiple purchase and sales of options such as spreads. Supporting documentation will be supplied upon request.
In producing research reports, members of the Global Investment Research Division of Goldman Sachs Australia may attend site visits and other meetings hosted by the issuers the subject of its
research reports. In some instances the costs of such site visits or meetings may be met in part or in whole by the issuers concerned if Goldman Sachs Australia considers it is appropriate and
reasonable in the specific circumstances relating to the site visit or meeting.
All research reports are disseminated and available to all clients simultaneously through electronic publication to our internal client websites. Not all research content is redistributed to our clients or
available to third-party aggregators, nor is Goldman Sachs responsible for the redistribution of our research by third party aggregators. For all research available on a particular stock, please contact
your sales representative or go to http://360.gs.com.
Disclosure information is also available at http://www.gs.com/research/hedge.html or from Research Compliance, 200 West Street, New York, NY 10282.
© 2013 Goldman Sachs.
No part of this material may be (i) copied, photocopied or duplicated in any form by any means or (ii) redistributed without the prior written consent of The Goldman Sachs Group, Inc.