Goldman Sachs Industrials Conference 2014 - Eatonpub/@eaton/@corp/documents/... · © 2014 Eaton....
29
© 2014 Eaton. All Rights Reserved.. Goldman Sachs Industrials Conference 2014 Alexander M. Cutler – Chairman and Chief Executive Officer November 12, 2014
Transcript of Goldman Sachs Industrials Conference 2014 - Eatonpub/@eaton/@corp/documents/... · © 2014 Eaton....
© 2014 Eaton. All Rights Reserved..
Goldman Sachs Industrials Conference 2014
Alexander M. Cutler – Chairman and Chief Executive Officer
November 12, 2014
2 © 2014 Eaton. All Rights Reserved..
Forward-looking statements and non-GAAP financial information
This presentation or the comments we make today may contain forward-looking statements concerning the fourth quarter 2014 operating earnings per share, full-year 2014 operating earnings per share and net income per share, sales, bookings, margins, foreign exchange rates, cash flow, tax rate, acquisition synergies, divestitures, cost control measures and the performance of our worldwide markets. These statements should be used with caution and are subject to various risks and uncertainties, many of which are outside the company’s control. The following factors could cause actual results to differ materially from those in the forward-looking statements: unanticipated changes in the markets for the company’s business segments; unanticipated downturns in business relationships with customers or their purchases from us; competitive pressures on sales and pricing; increases in the cost of material and other production costs, or unexpected costs that cannot be recouped in product pricing; the introduction of competing technologies; unexpected technical or marketing difficulties; unexpected claims, charges, litigation or dispute resolutions; strikes or other labor unrest; the performance of recent acquisitions; unanticipated difficulties integrating acquisitions; new laws and governmental regulations; interest or tax rate changes; stock market and currency fluctuations; and unanticipated deterioration of economic and financial conditions in the United States and around the world. We do not assume any obligation to update these forward-looking statements. This presentation includes certain non-GAAP measures as defined by SEC rules. A reconciliation of those measures to the most directly comparable GAAP equivalent is provided in the investor relations section of our website at www.eaton.com.

3 © 2014 Eaton. All rights reserved.
Eaton – A Premier Power Management Company
• A balanced power management company
• Cooper acquisition creates a leading Electrical franchise
• Industrial businesses are well positioned for growth
• Summary and guidance

4 © 2014 Eaton. All rights reserved.
Eaton is a leading global power management company…
Uniquely positioned to provide safe, reliable, efficient and sustainable power management solutions for our global customers
Electrical Fluid Mechanical
Cities & Buildings
Industrial & Machinery
Information Technology
Energy & Utilities
Transportation Infrastructure

5 © 2014 Eaton. All rights reserved.
…consisting of premier power management franchises
• Among the four largest global Electrical companies, with the scale and scope to compete globally
• Comprehensive solutions from generation to the end user, with a portfolio of leading brands
• Serving key markets including oil & gas, industrial, utility, commercial & residential construction, machinery and data centers
• Hydraulics business that is among the three largest globally and serves a wide range of mobile and industrial customers
• Aerospace business serving global OEMs, airlines, and militaries with hydraulic power & motion control, fluid conveyance, fuel and engine solutions
• Vehicle business delivering solutions to the global commercial vehicle and passenger car markets focused on fuel efficiency, emissions and safety
ELECTRICAL INDUSTRIAL
2013 Sales: $13.5B 2013 Sales: $8.6B

6 © 2014 Eaton. All rights reserved.
We have created a portfolio capable of delivering stronger growth and more consistent earnings
61% 14%
8%
17%
2013 Segment Sales
Electrical Hydraulics
Aerospace Vehicle
50%
26%
24%
2013 Sales by Destination
U.S.Int'l DevelopedInt'l Emerging
29%
29%
31%
11%
2013 Cycle Sales
Early Mid Late No

7 © 2014 Eaton. All rights reserved.
Our results over the last decade reflect the successful execution of our transformation strategy
Sales
Elec / Hyd /Aero sales
Segmentmargins
Operatingcash flow
$22B
$8B
2013 2003
OperatingEPS
11% CAGR
$18B
$5B
$2.3B
$0.9B
$4.13
$1.36
12% CAGR
We are driving higher growth, profitability, and consistency
Internationalsales
Gro
wth
M
ix
Perf
orm
ance
3.7 times
2.6 times + 470 bps
3.6 times
14.9%
10.2%
$11B
$3B

8 © 2014 Eaton. All rights reserved.
Our dividend yield has been a major driver of our strong shareholder returns…
Total Shareholder Returns 2000 – Oct 31, 2014
3.7x
6.0x
2.3x
0x
1x
2x
3x
4x
5x
6x
7x
ShareAppreciation
Dividends TotalShareholder
Returns
0%
1%
1%
2%
2%
3%
3%
4%
4%
DB
:SIE
AB
B SU ETN
EMR LR U
TX
HO
N
ITW
RO
K
DO
V
PH IR
DH
R
Dividend Yield As of Oct 31, 2014*
* Eaton dividend yield reflects a quarterly dividend of $0.49/share
9 © 2014 Eaton. All rights reserved.
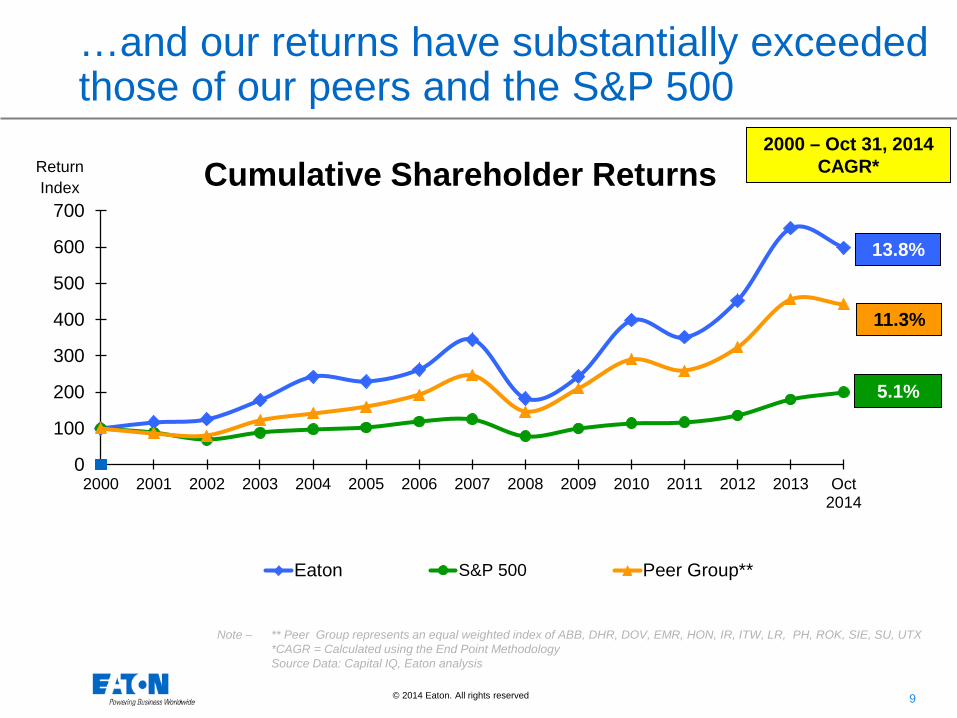
2000 – Oct 31, 2014 CAGR* Return
Index
13.8%
Note – ** Peer Group represents an equal weighted index of ABB, DHR, DOV, EMR, HON, IR, ITW, LR, PH, ROK, SIE, SU, UTX *CAGR = Calculated using the End Point Methodology Source Data: Capital IQ, Eaton analysis
0
100
200
300
400
500
600
700
2000 2001 2002 2003 2004 2005 2006 2007 2008 2009 2010 2011 2012 2013 Oct2014
Cumulative Shareholder Returns
Eaton S&P 500 Peer Group**
11.3%
5.1%
…and our returns have substantially exceeded those of our peers and the S&P 500

10 © 2014 Eaton. All rights reserved.
Eaton – A Premier Power Management Company
• A balanced power management company
• Cooper acquisition creates a leading Electrical franchise
• Industrial businesses are well positioned for growth
• Summary and guidance

11 © 2014 Eaton. All Rights Reserved.
The Cooper acquisition significantly expanded our electrical solutions
Legacy Eaton
Former Cooper
Data Centers Industrial Utility Commercial / Residential Machinery
12 © 2014 Eaton. All Rights Reserved.
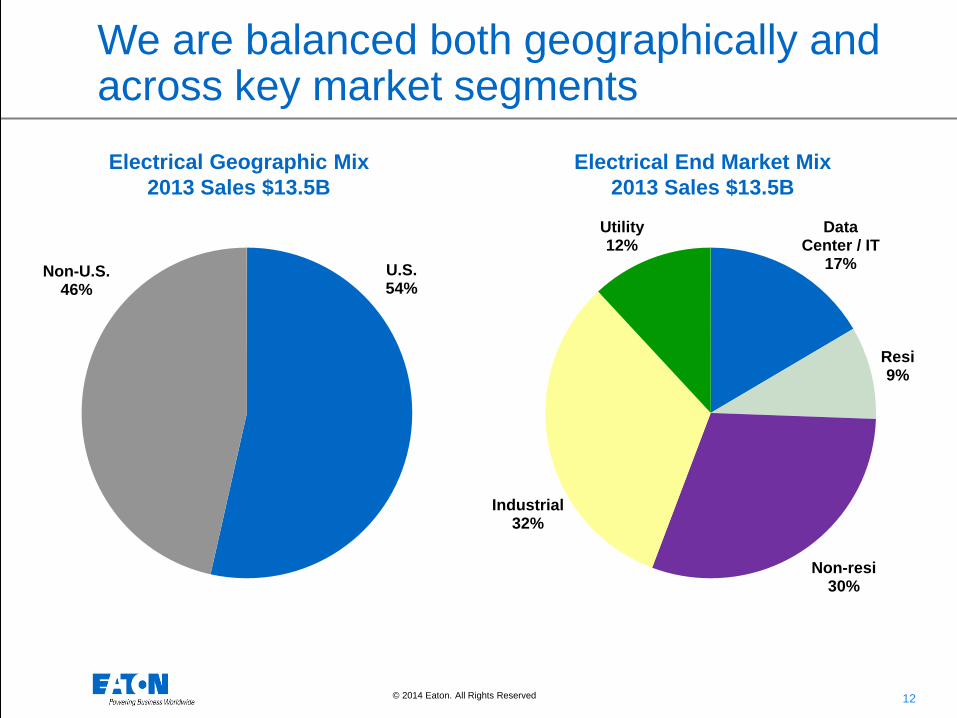
We are balanced both geographically and across key market segments Electrical Geographic Mix
2013 Sales $13.5B
U.S. 54%
Non-U.S. 46%
Electrical End Market Mix 2013 Sales $13.5B
Data Center / IT
17%
Resi 9%
Non-resi 30%
Industrial 32%
Utility 12%
13 © 2014 Eaton. All rights reserved.
0
100
200
300
400
500
2013 2014 2015 2016
Syne
rgy
Prof
it ($
M)
Current Plan Original Plan
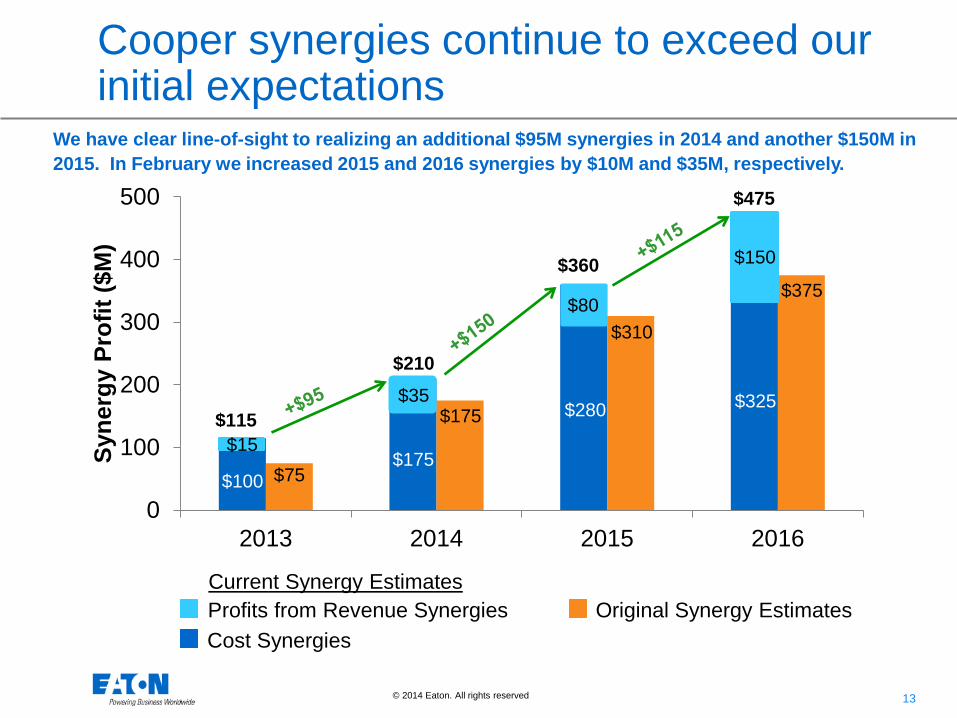
$115
$210
$360
Cooper synergies continue to exceed our initial expectations
We have clear line-of-sight to realizing an additional $95M synergies in 2014 and another $150M in 2015. In February we increased 2015 and 2016 synergies by $10M and $35M, respectively.
$475
$15
$35
$80
$150
$100 $175
$280 $325
$75
$175
$310
$375
Original Synergy Estimates Profits from Revenue Synergies Cost Synergies
Current Synergy Estimates
14 © 2014 Eaton. All Rights Reserved.
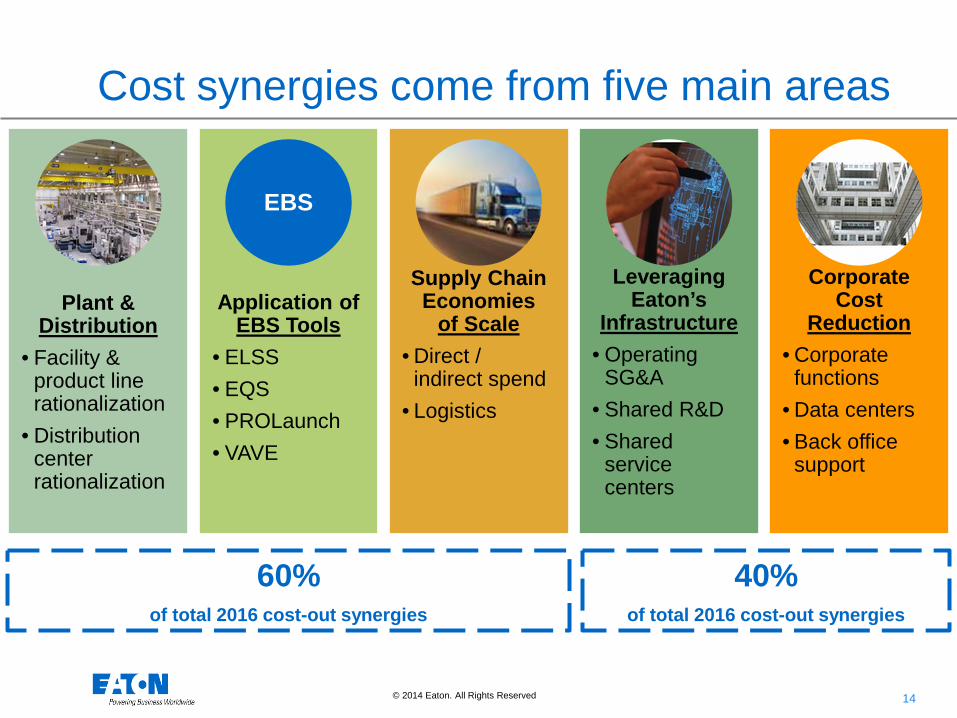
Corporate Cost
Reduction • Corporate
functions • Data centers • Back office
support
Plant & Distribution
• Facility & product line rationalization
• Distribution center rationalization
Application of EBS Tools
• ELSS • EQS • PROLaunch • VAVE
Supply Chain Economies
of Scale • Direct /
indirect spend • Logistics
Leveraging Eaton’s
Infrastructure • Operating
SG&A • Shared R&D • Shared
service centers
Cost synergies come from five main areas
EBS
60% of total 2016 cost-out synergies
40% of total 2016 cost-out synergies
15 © 2014 Eaton. All Rights Reserved.
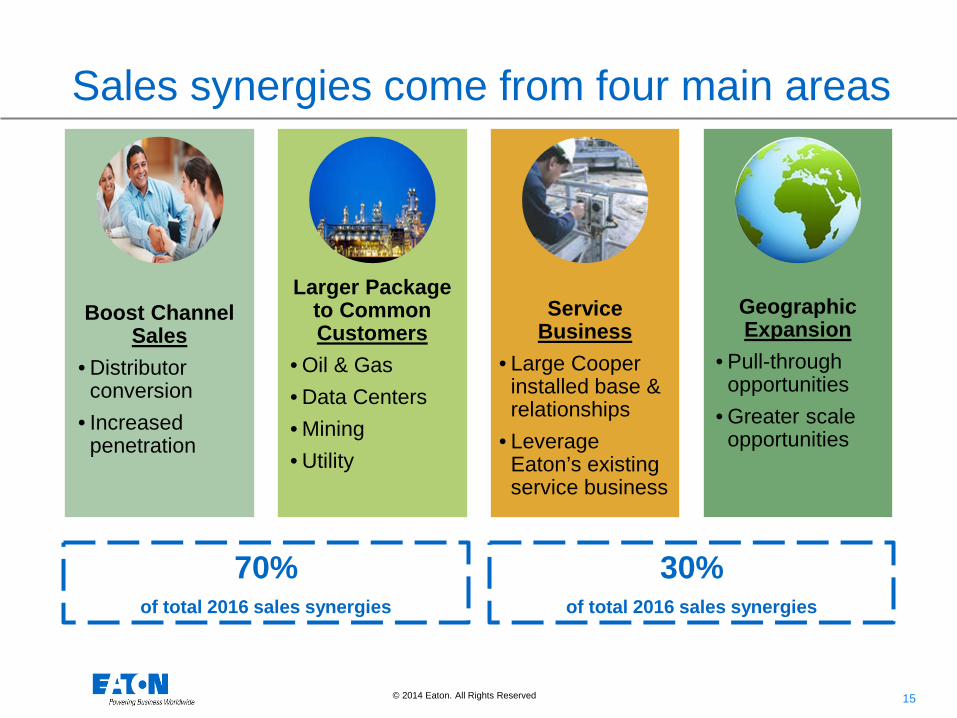
Sales synergies come from four main areas
Geographic Expansion
• Pull-through opportunities
• Greater scale opportunities
Boost Channel
Sales • Distributor
conversion • Increased
penetration
Larger Package to Common Customers
• Oil & Gas • Data Centers • Mining • Utility
Service
Business • Large Cooper
installed base & relationships
• Leverage Eaton’s existing service business
70% of total 2016 sales synergies
30% of total 2016 sales synergies

16 © 2014 Eaton. All rights reserved.
Eaton – A Premier Power Management Company
• A balanced power management company
• Cooper acquisition creates a leading Electrical franchise
• Industrial businesses are well positioned for growth
• Summary and guidance
17 17 © 2014 Eaton. All rights reserved.
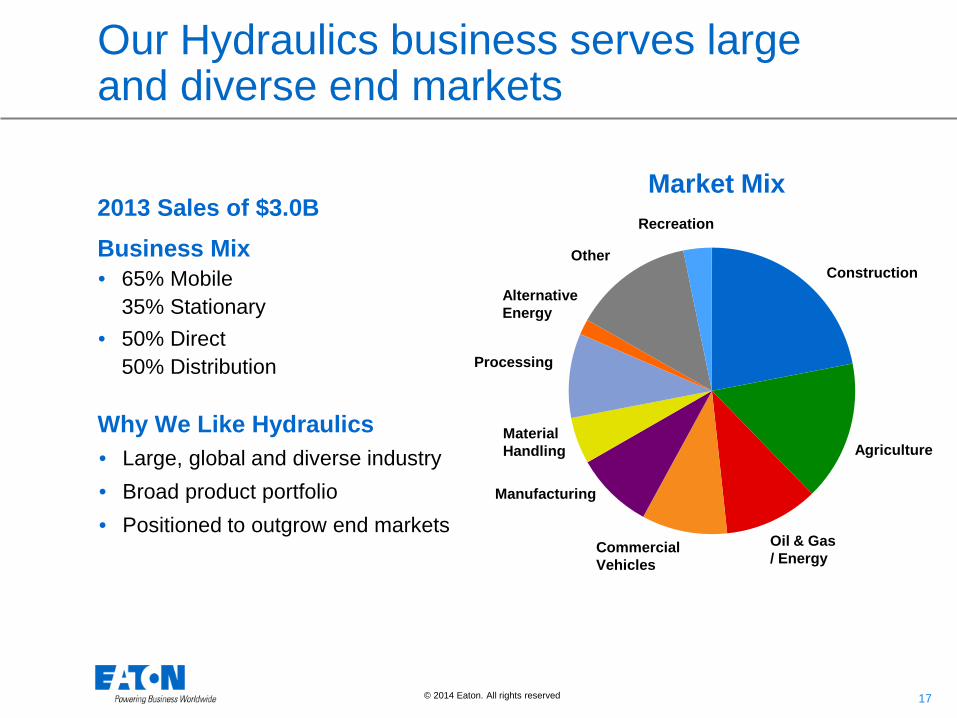
Our Hydraulics business serves large and diverse end markets
• 65% Mobile 35% Stationary
• 50% Direct 50% Distribution
2013 Sales of $3.0B Business Mix
Market Mix
• Large, global and diverse industry • Broad product portfolio • Positioned to outgrow end markets
Why We Like Hydraulics
Construction
Agriculture
Oil & Gas / Energy
Commercial Vehicles
Manufacturing
Material Handling
Processing
Other
Recreation
Alternative Energy

18 18 © 2013 Eaton. All rights reserved.
Aftermarket • $12B market opportunity, 4%
CAGR
• 1/3 of 2013 sales
• Business is both profitable and stable
• Key actions • Localizing products • Building service capabilities • Adding channel partners
Emerging Markets • Middle East & Africa
• $1.6B market, 10% CAGR • Focus on industrial
processing, oil & gas, mining
• Brazil • $1.2B market, 6% CAGR • Investing in front-end and
service
• China • $4B market, 5% CAGR • Localizing product design
capability
Key Technologies • Launching industry leading
technologies
• Providing high power density • Efficient & quiet piston
pumps
• Integrating electronic controls • Wired/wireless intelligent
hose • AxisProTM Smart Valve
Our Hydraulics business will outgrow its end markets through targeted strategies
Sophisticated Machine Control AxisProTM Valves
2013 2017
Emerging Markets Sales
CAGR 10%
Mining in Australia On-site 24/7 service

19 19 © 2014 Eaton. All rights reserved.
Our Aerospace business has breadth across many markets and platforms
• Commercial: 65% Military: 35%
• Original Equipment: 65% Aftermarket: 35%
2013 Sales of $1.8B
Business Mix
• Technology driven industry with large and profitable aftermarket
• Leadership position in core products • Positioned to outgrow end markets
Why We Like Aerospace
Market Mix Rotorcraft
Military Fighters
General Aviation Military
Transport
Military Rotorcraft
Large Transport
Regional Transport
Business Jet
Industrial
20 20 © 2013 Eaton. All rights reserved.
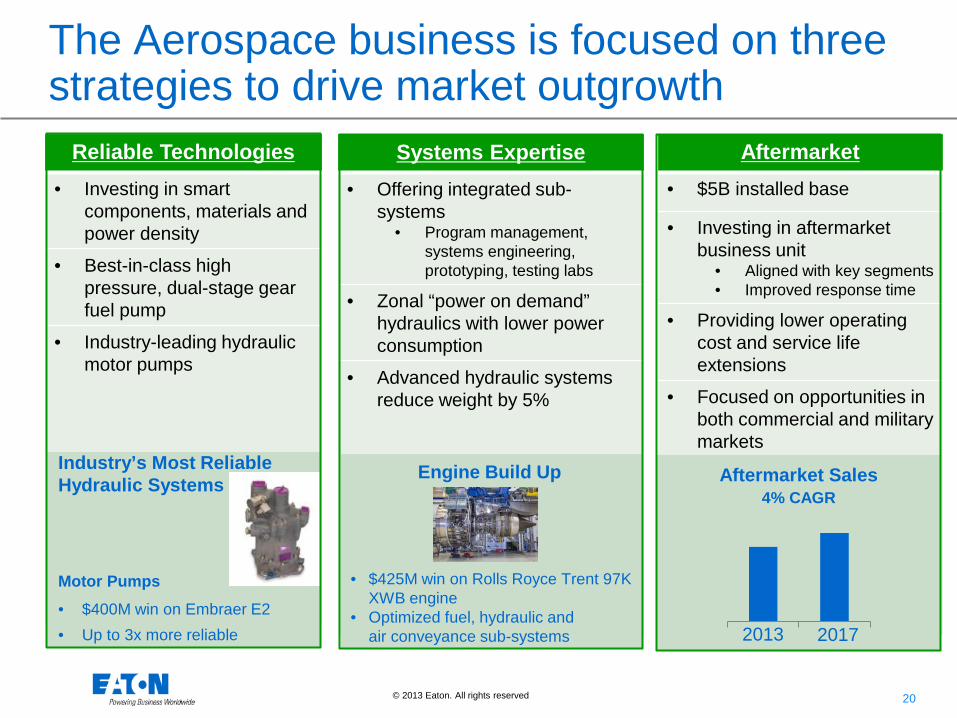
The Aerospace business is focused on three strategies to drive market outgrowth
Reliable Technologies • Investing in smart
components, materials and power density
• Best-in-class high pressure, dual-stage gear fuel pump
• Industry-leading hydraulic motor pumps
Systems Expertise • Offering integrated sub-
systems • Program management,
systems engineering, prototyping, testing labs
• Zonal “power on demand” hydraulics with lower power consumption
• Advanced hydraulic systems reduce weight by 5%
Aftermarket • $5B installed base
• Investing in aftermarket business unit
• Aligned with key segments • Improved response time
• Providing lower operating cost and service life extensions
• Focused on opportunities in both commercial and military markets
Industry’s Most Reliable Hydraulic Systems Motor Pumps
• $400M win on Embraer E2 • Up to 3x more reliable
Engine Build Up • $425M win on Rolls Royce Trent 97K
XWB engine • Optimized fuel, hydraulic and
air conveyance sub-systems
Aftermarket Sales 4% CAGR
2013 2017
21 21 © 2014 Eaton. All rights reserved.
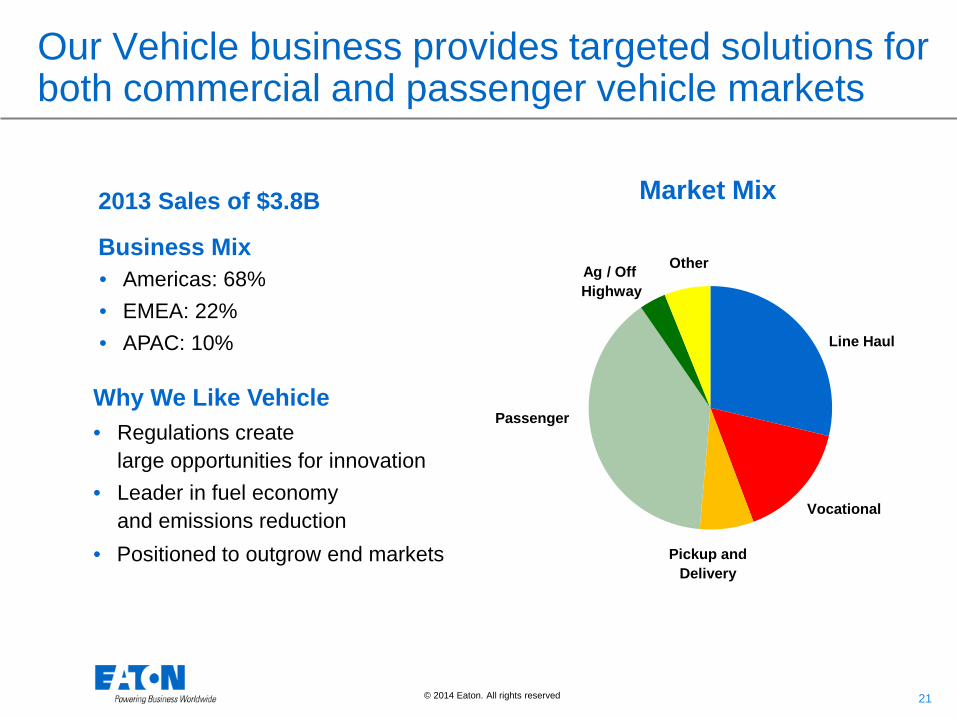
Our Vehicle business provides targeted solutions for both commercial and passenger vehicle markets
Pickup and Delivery
• Americas: 68% • EMEA: 22% • APAC: 10%
2013 Sales of $3.8B
Business Mix
Market Mix
• Regulations create large opportunities for innovation
• Leader in fuel economy and emissions reduction
• Positioned to outgrow end markets
Why We Like Vehicle
Line Haul
Vocational
Passenger
Ag / Off Highway
Other
22 22 © 2013 Eaton. All rights reserved.
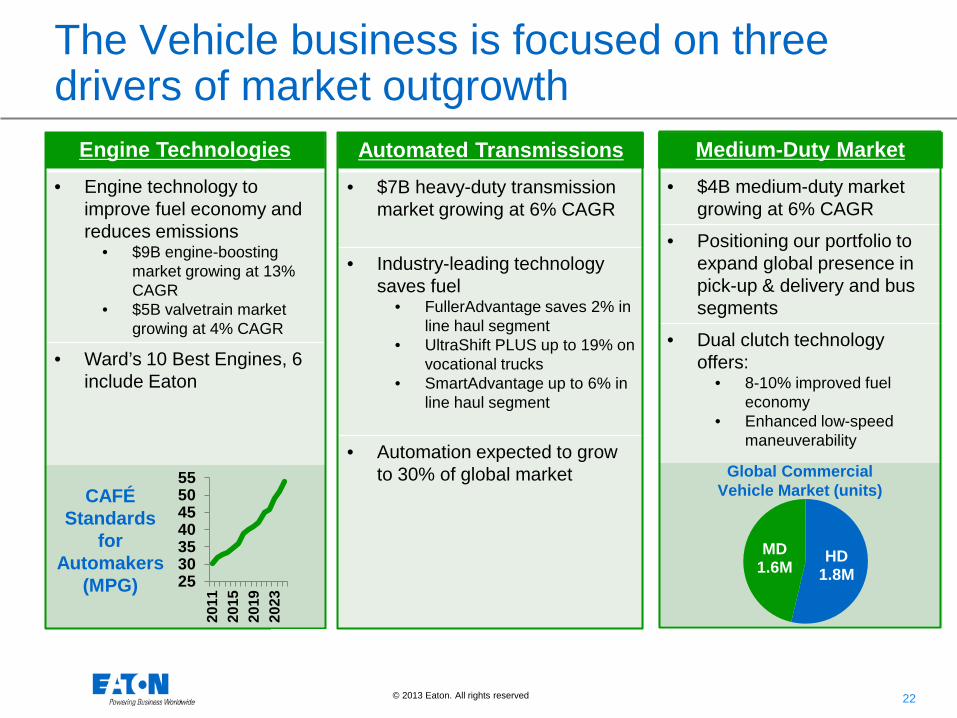
The Vehicle business is focused on three drivers of market outgrowth
Engine Technologies • Engine technology to
improve fuel economy and reduces emissions
• $9B engine-boosting market growing at 13% CAGR
• $5B valvetrain market growing at 4% CAGR
• Ward’s 10 Best Engines, 6 include Eaton
Automated Transmissions • $7B heavy-duty transmission
market growing at 6% CAGR
• Industry-leading technology saves fuel
• FullerAdvantage saves 2% in line haul segment
• UltraShift PLUS up to 19% on vocational trucks
• SmartAdvantage up to 6% in line haul segment
• Automation expected to grow to 30% of global market
Medium-Duty Market • $4B medium-duty market
growing at 6% CAGR
• Positioning our portfolio to expand global presence in pick-up & delivery and bus segments
• Dual clutch technology offers:
• 8-10% improved fuel economy
• Enhanced low-speed maneuverability
HD 1.8M
MD 1.6M
Global Commercial Vehicle Market (units)
25303540455055
2011
2015
2019
2023
CAFÉ Standards
for Automakers
(MPG)
23 © 2014 Eaton. All rights reserved.
Eaton – A Premier Power Management Company
• A balanced power management company
• Cooper acquisition creates a leading Electrical franchise
• Industrial businesses are well positioned for growth
• Summary and guidance
24 © 2014 Eaton. All rights reserved.
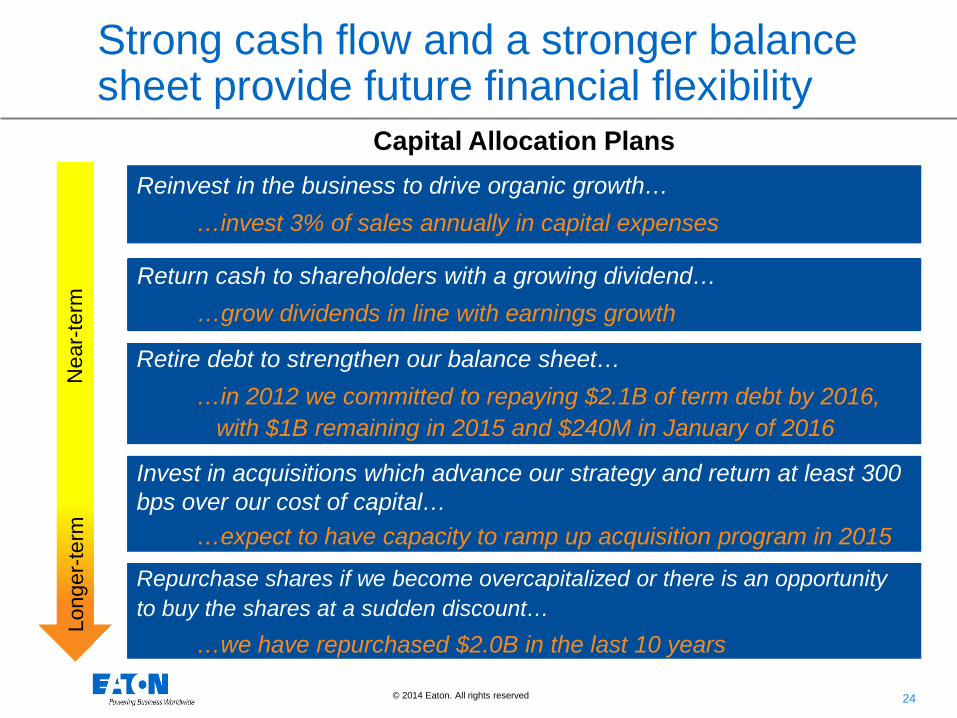
Strong cash flow and a stronger balance sheet provide future financial flexibility
Nea
r-ter
m
Long
er-te
rm
Capital Allocation Plans
Repurchase shares if we become overcapitalized or there is an opportunity to buy the shares at a sudden discount… …we have repurchased $2.0B in the last 10 years
Invest in acquisitions which advance our strategy and return at least 300 bps over our cost of capital… …expect to have capacity to ramp up acquisition program in 2015
Reinvest in the business to drive organic growth… …invest 3% of sales annually in capital expenses
Return cash to shareholders with a growing dividend… …grow dividends in line with earnings growth
Retire debt to strengthen our balance sheet… …in 2012 we committed to repaying $2.1B of term debt by 2016, with $1B remaining in 2015 and $240M in January of 2016

25 © 2014 Eaton. All Rights Reserved..
Summary of Q3 Results
• Record segment margins of 16% as productivity and effective cost control drove better-than-guidance performance in Q3
• Record free cash flow of $801M, adjusted for legal settlements, is 14% of sales
• Q4 market conditions are expected to be largely unchanged from Q3
• Full year 2014 operating EPS up 11% over 2013, in a year with modest 2% market growth

26 © 2014 Eaton. All Rights Reserved..
Q3 2014 Segment Results
Segment
Sales (M)
Core Sales Growth
Segment Operating Margin*
Electrical Products $1,875 4% 18.0%
Electrical S & S $1,655 2% 14.6%
Hydraulics $733 0% 11.7%
Aerospace $454 6% 15.9%
Vehicle $1,011 6% 17.4%
Total $5,728 3% 16.0%
* Excludes acquisition integration charges
27 © 2014 Eaton. All Rights Reserved..
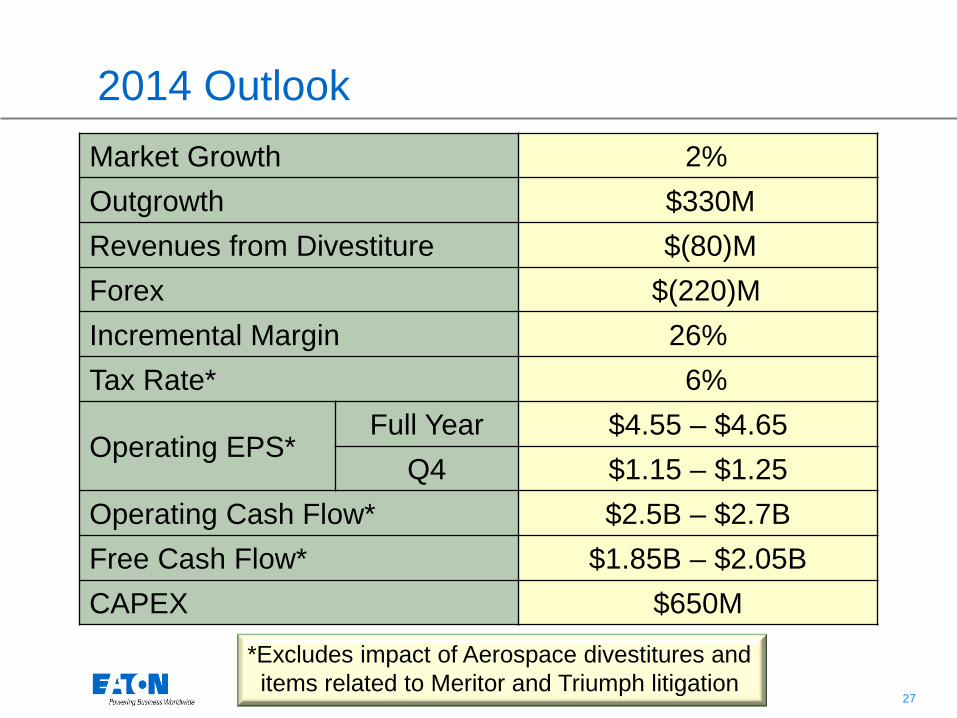
2014 Outlook Market Growth 2% Outgrowth $330M Revenues from Divestiture $(80)M Forex $(220)M Incremental Margin 26% Tax Rate* 6%
Operating EPS* Full Year $4.55 – $4.65
Q4 $1.15 – $1.25 Operating Cash Flow* $2.5B – $2.7B Free Cash Flow* $1.85B – $2.05B CAPEX $650M
*Excludes impact of Aerospace divestitures and items related to Meritor and Triumph litigation
28 © 2014 Eaton. All Rights Reserved..
Initial 2015 Outlook
• Market growth expected to be similar to 2014
• Incremental Cooper synergies of $150M
• Expected benefits of $35M in 2015 from Q2 2014 restructuring in Industrial Sector
• Tax rate expected to increase from 6% in 2014 to 9%-11% in 2015
• By mid-year 2015, expect to have significant and growing available cash to deploy

29 © 2014 Eaton. All rights reserved.