Goldman Sachs, 8th Annual Global Automotive Conference · December 8, 2016 8th Annual Global...
50
Goldman Sachs, 8 th Annual Global Automotive Conference London, December 8, 2016
Transcript of Goldman Sachs, 8th Annual Global Automotive Conference · December 8, 2016 8th Annual Global...

Goldman Sachs, 8th
Annual Global
Automotive Conference
London, December 8, 2016

A business model strongly linked to consumption
Breakdown of 2015 Net sales
49%
Consumers
Net sales by drivers
11%
Commodities Autos
11 %
29%
Manufacturing
PC RT
PC OE
2 London – Goldman Sachs – 8th Annual Global Automotive Conference – December 8, 2016
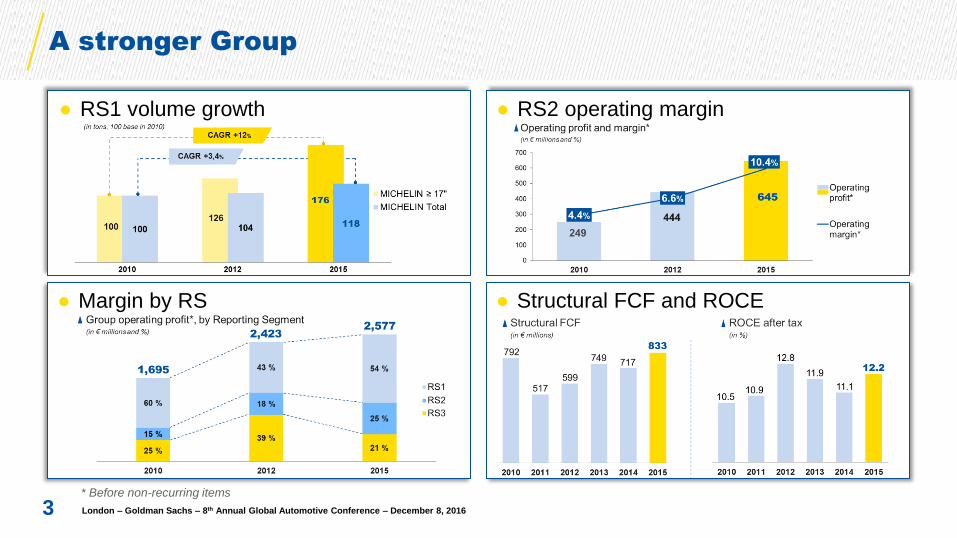
A stronger Group
3
● RS2 operating margin
● Margin by RS ● Structural FCF and ROCE
● RS1 volume growth
* Before non-recurring items
London – Goldman Sachs – 8th Annual Global Automotive Conference – December 8, 2016
December 8, 2016
8th
Annual Global Automotive Conference
Michelin’s Strategy
4 London – Goldman Sachs – 8th Annual Global Automotive Conference – December 8, 2016

● Provide our customers with tires that truly meet their needs
Increase by 20% our revenue from our tire business
● Develop tire-related services and solutions that further enhance mobility
Double revenue in our services and solutions business
● Strengthen all the activities that enable our customers to enjoy unique mobility experience
Triple the revenue generated by these mobility experience businesses
● Leverage our expertise in high-technology materials – in particular those involving elastomers
Be proactive and assert our technological leadership in the area of
high technology materials
Michelin’s value creation strategy
Four domains of growth for 2016-2020
5 London – Goldman Sachs – 8th Annual Global Automotive Conference – December 8, 2016

MICHELIN CrossClimate, “the ideal ‘all-season’ tire”
6
● Best ‘all-season’ tire ranked by
● MICHELIN summer tire with winter certification
“There is only
one candidate that meets
all the requirements
of an ideal, uncompromising
‘all-season’ tire,” says
MICHELIN CrossClimate.”
magazine, “and that’s the
London – Goldman Sachs – 8th Annual Global Automotive Conference – December 8, 2016

Innovation aimed at delivering total performance
Up to 32% more longevity vs Tier 1 Competitors in Europe (MICHELIN = base 100)
7
Source : Ranking based on the results of tests conducted on several times sizes by independant test centers (Dekra 2012-2013-2014,
TÜV SUD Product Service 2010-2011) and press tests (Autobild 2011-2014)
(1) Broadline on 14"/15"/16" – (2) High Performance on 16"/17" – (3) Sport on 18" – (4) Light truck on 16" – (5) Winter on 15"/16"/17"
– (6)Test conducted by TÜV SUD, in July and August 2016, on dimension 205/55R16 on VW Golf 7 vs Premium A/S Competitors
MICHELIN CrossClimate:
“Total cost of ownership champion”
according to
70 68 80 71 70 83
MICHELIN EnergyTM MICHELIN Primacy MICHELIN Agilis MICHELIN Alpin
100 Premium
competitors
average result
Broadline 1 High Performance 2 Sport 3 Light truck 4 Winter 5
MICHELIN Pilot Sport MICHELIN CrossClimate
All-Season 6
London – Goldman Sachs – 8th Annual Global Automotive Conference – December 8, 2016

● Since 1989 in the United States, Michelin and BFGoodrich have won 63 of the 76 awards
for OE Tire Satisfaction
● This highlights Michelin’s commitment to total performance throughout the life of the tire
5x more than the competition combined!
J.D. Power OE Tire Award History
8 London – Goldman Sachs – 8th Annual Global Automotive Conference – December 8, 2016

+ +
Outperforming new products allowing increased mining
productivity
* Ton Kilometer Per Hour
9
MICHELIN
XDR 250
50/80 R 57
3 MAJOR INNOVATIONS:
● The most productive tire with at least
25% more TKPH*
… with no trade-off on tire life A NEW TREAD PATTERN
NEW COMPOUNDS
CORROSION-PROOF
CABLES
MICHELIN
XDR 3
40.00 R 57
London – Goldman Sachs – 8th Annual Global Automotive Conference – December 8, 2016

Products, distribution and services matching customer
needs to capture growth opportunities
10
• Offering innovative services to improve mobility
• Reinforcing our market access through a vast worldwide dealer network and new distribution channels
• Developing profitable Tier 2 / Tier 3 brands to better serve Distribution
• Strengthening the MICHELIN brand technological leadership
Services
Distribution
Product
offer
Innovation
CROSSCLIMATE TWEEL
EFFITIRE™
London – Goldman Sachs – 8th Annual Global Automotive Conference – December 8, 2016

New materials play a dominant role in our innovation
11
Strong impact on the performances of our products
Aligned with sustainable development ambitions
Less industrial intrusiveness
For several reasons:
London – Goldman Sachs – 8th Annual Global Automotive Conference – December 8, 2016

● Above market growth in all divisions and positive product mix
● Increased Net Sales and EBIT contribution from service and solutions
● Acceleration in competitiveness ambition
● Capital expenditure in line with scenario already announced
● Initiatives to foster a new Group mindset
─ Putting our customers at the heart of our business
─ Leveraging the digital revolution
─ Simplifying our structures and processes
─ Empowering employees
2017-2020 levers
12 London – Goldman Sachs – 8th Annual Global Automotive Conference – December 8, 2016

December 8, 2016
8th
Annual Global Automotive Conference
2020 ambitious value creation
targets
13 London – Goldman Sachs – 8th Annual Global Automotive Conference – December 8, 2016

2015-2020 scenario: a growing worldwide demand
PC OE&RT market projection (in millions of units)
TB OE&RT market projection (Radial & Bias in millions of units)
14
1.495
1.690
2015 2020e
184
200
2015 2020e
o/w ≥17’
CAGR
~ 7%
CAGR
~ 1.5%
CAGR
~ 2.5%
London – Goldman Sachs – 8th Annual Global Automotive Conference – December 8, 2016

Agriculture: a slow worldwide growth assuming stable
grain prices
(base 100 in 2015, in tonnes)
* OE & RT in Europe and North America
15
100 ~100 ~100
2015 2016e 2017e 2020e
~104 / 108
London – Goldman Sachs – 8th Annual Global Automotive Conference – December 8, 2016

Mining: 2016 last year of destocking
16
100 109
121
134 138
121 111
~101
2009 2010 2011 2012 2013 2014 2015 2016e 2017e 2020e
~105 / 115
~115 / 125
(base 100 in 2009, in tonnes)
London – Goldman Sachs – 8th Annual Global Automotive Conference – December 8, 2016

New 2017 – 2020 Competitiveness Plan:
accelerating to ~€300m per annum
17
In €m Plan 2007-2010
achieved
Plan 2012-2016 Target: €1,200m
Plan 2017-2020 2012-2015
achieved 2016(e)
SG&A 251 421 500/550
Manufacturing
Costs 406 394 450/500
Materials 365 149 150/200
Total 1,022 964 ~250 ~1,200
London – Goldman Sachs – 8th Annual Global Automotive Conference – December 8, 2016
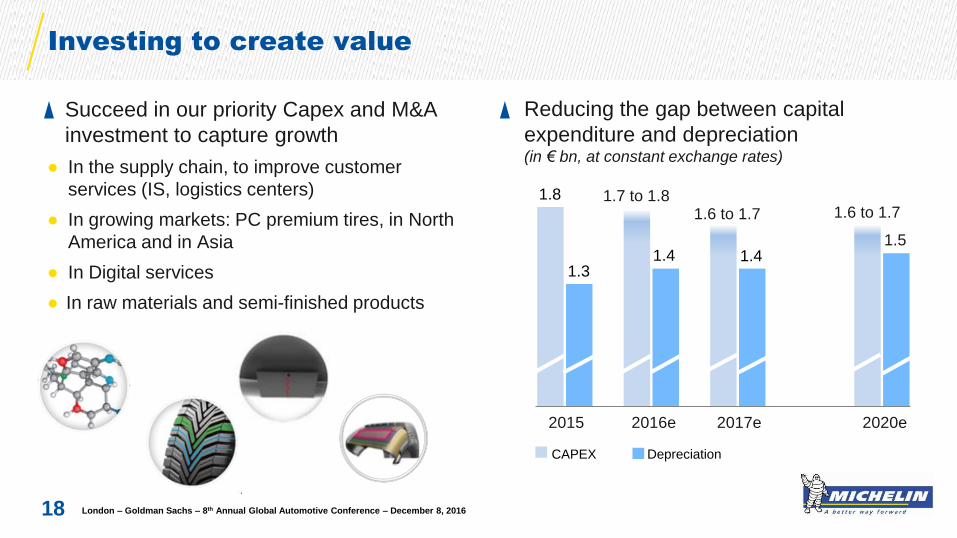
Investing to create value
Reducing the gap between capital
expenditure and depreciation (in € bn, at constant exchange rates)
● In the supply chain, to improve customer
services (IS, logistics centers)
● In growing markets: PC premium tires, in North
America and in Asia
● In Digital services
● In raw materials and semi-finished products
Succeed in our priority Capex and M&A
investment to capture growth
18
2015 2016e 2017e 2020e
1.8
1.3
1.7 to 1.8
1.4 1.4
1.6 to 1.7
1.5
CAPEX Depreciation
1.6 to 1.7
London – Goldman Sachs – 8th Annual Global Automotive Conference – December 8, 2016
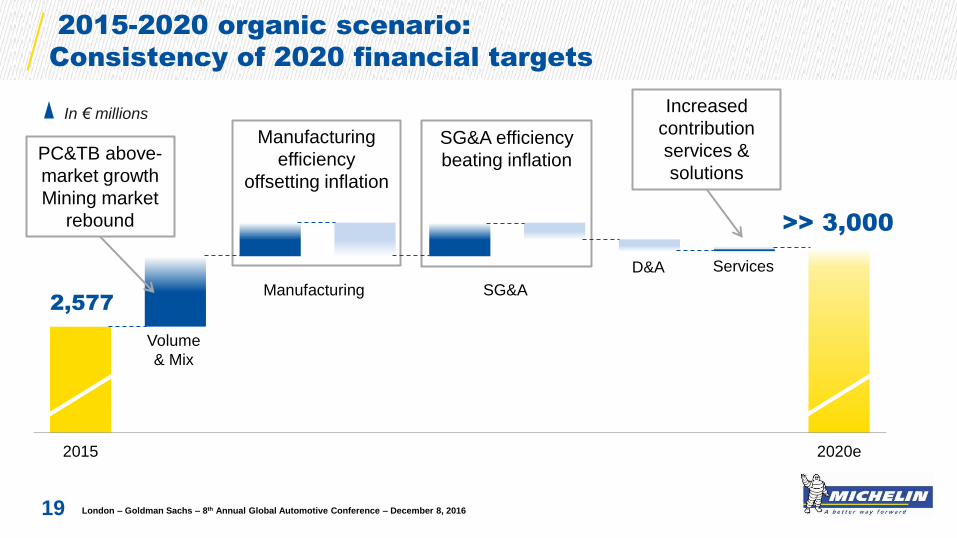
2015-2020 organic scenario:
Consistency of 2020 financial targets
19
In € millions
SG&A efficiency
beating inflation
Manufacturing
efficiency
offsetting inflation
2015 2020e
2,577
>> 3,000
PC&TB above-
market growth
Mining market
rebound
Increased
contribution
services &
solutions
Volume
& Mix
Manufacturing SG&A
D&A Services
London – Goldman Sachs – 8th Annual Global Automotive Conference – December 8, 2016

RS1 RS2 RS3
2016-2020
target ranges**
Between
11% and 15%
Between
9% and 13%
Between
17% and 24%
Reporting segment operating margin guidance* for 2016-2020
20
* From recurring activities
** At constant scope of consolidation and raw materials prices, and with markets expanding by a CAGR of 2.5% in PC tires
and of 1.5% in Truck tires
London – Goldman Sachs – 8th Annual Global Automotive Conference – December 8, 2016
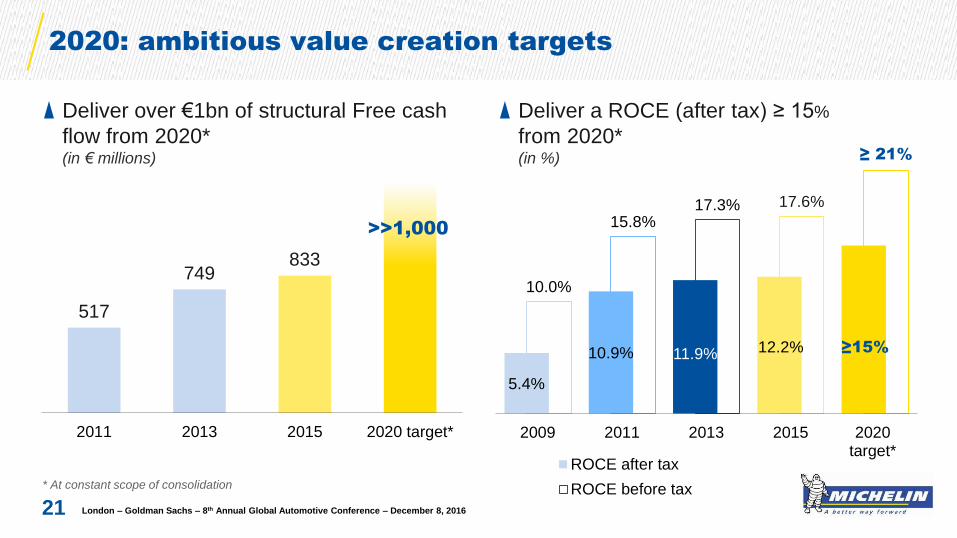
5.4%
10.9% 11.9% 12.2% ≥15%
10.0%
15.8% 17.3% 17.6%
≥ 21%
2009 2011 2013 2015 2020target*
ROCE after tax
ROCE before tax
Deliver a ROCE (after tax) ≥ 15%
from 2020* (in %)
2020: ambitious value creation targets
Deliver over €1bn of structural Free cash
flow from 2020* (in € millions)
* At constant scope of consolidation
21
517
749 833
2011 2013 2015 2020 target*
>>1,000
London – Goldman Sachs – 8th Annual Global Automotive Conference – December 8, 2016
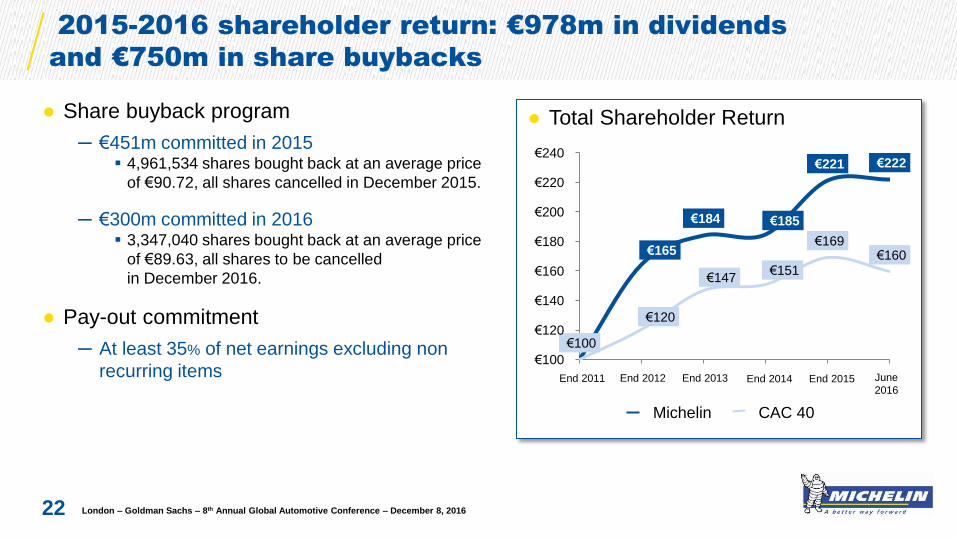
2015-2016 shareholder return: €978m in dividends
and €750m in share buybacks
● Total Shareholder Return
22
€165
€184 €185
€221 €222
€100
€120
€147 €151
€169 €160
€100
€120
€140
€160
€180
€200
€220
€240
Fin 2011 Fin 2012 Fin 2013 Fin 2014 Fin 2015 Juin2016
Michelin CAC 40
End 2011 End 2014 End 2015 June
2016 End 2012 End 2013
● Share buyback program
─ €451m committed in 2015 4,961,534 shares bought back at an average price
of €90.72, all shares cancelled in December 2015.
─ €300m committed in 2016 3,347,040 shares bought back at an average price
of €89.63, all shares to be cancelled
in December 2016.
● Pay-out commitment
─ At least 35% of net earnings excluding non
recurring items
London – Goldman Sachs – 8th Annual Global Automotive Conference – December 8, 2016

December 8, 2016
8th
Annual Global Automotive Conference
2 2016 guidance confirmed
23 London – Goldman Sachs – 8th Annual Global Automotive Conference – December 8, 2016
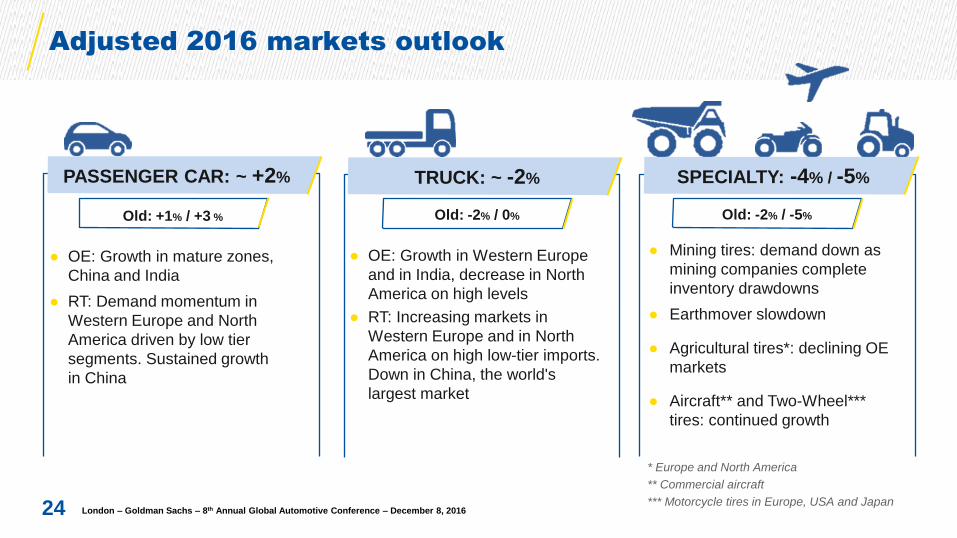
Adjusted 2016 markets outlook
24
● OE: Growth in Western Europe
and in India, decrease in North
America on high levels
● RT: Increasing markets in
Western Europe and in North
America on high low-tier imports.
Down in China, the world's
largest market
TRUCK: ~ -2% PASSENGER CAR: ~ +2% SPECIALTY: -4% / -5%
● OE: Growth in mature zones,
China and India
● RT: Demand momentum in
Western Europe and North
America driven by low tier
segments. Sustained growth
in China
Old: +1% / +3 % Old: -2% / 0% Old: -2% / -5%
● Mining tires: demand down as
mining companies complete
inventory drawdowns
● Earthmover slowdown
● Agricultural tires*: declining OE
markets
● Aircraft** and Two-Wheel***
tires: continued growth
* Europe and North America
** Commercial aircraft
*** Motorcycle tires in Europe, USA and Japan London – Goldman Sachs – 8th Annual Global Automotive Conference – December 8, 2016

2016
Volumes Above-market
growth
Operating income from recurring activities
at constant exchange rates > 2015*
Structural FCF > €800m
2016 guidance confirmed
25
* ≥ for H2
London – Goldman Sachs – 8th Annual Global Automotive Conference – December 8, 2016

Updated EBIT scenario based on the improved
Price-mix/Raw Materials and on September data
26
H1 2016 FY 2016
old new
Raw Materials +339 ~ +450 ~ +550
Net Price-mix /
Raw Materials +115 Positive
Positive
> +150
Competitiveness plan /
inflation +13 Neutral Neutral
Currency effect -98 ~ -200 ~ -160
(in € millions)
London – Goldman Sachs – 8th Annual Global Automotive Conference – December 8, 2016

27 27 London – Goldman Sachs – 8th Annual Global Automotive Conference – December 8, 2016
December 8, 2016
8th
Annual Global Automotive Conference
Appendices
28 London – Goldman Sachs – 8th Annual Global Automotive Conference – December 8, 2016

Passenger car Tire Market: October markets in line with 3rd quarter, stable in mature countries
and decreasing in the European winter segment. Still strong demand in China.
29 * Turkey included
October 2016/2015
% YoY change
in number of tires
Europe including
Russia & CIS*
Europe excluding
Russia & CIS* North America Brazil China
Original equipment +1% +2% -1% +4% +18%
Replacement -1% -1% +2% -7% +7%
YTD October 2016
% YoY change
in number of tires
Europe including
Russia & CIS*
Europe excluding
Russia & CIS* North America Brazil China
Original equipment +4% +5% +1% -15% +14%
Replacement +1% +3% +1% -5% +8%
London – Goldman Sachs – 8th Annual Global Automotive Conference – December 8, 2016
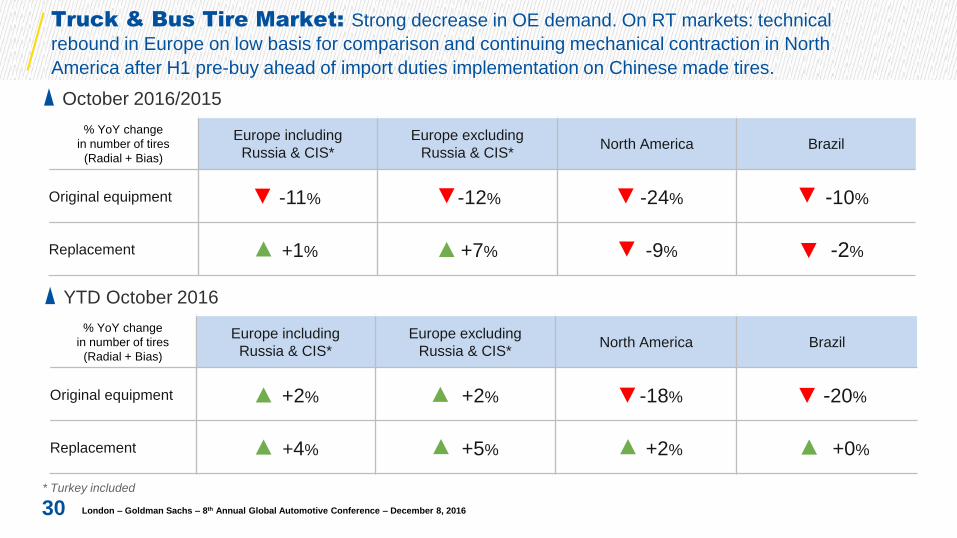
Truck & Bus Tire Market: Strong decrease in OE demand. On RT markets: technical
rebound in Europe on low basis for comparison and continuing mechanical contraction in North
America after H1 pre-buy ahead of import duties implementation on Chinese made tires.
30 * Turkey included
October 2016/2015
% YoY change
in number of tires
(Radial + Bias)
Europe including
Russia & CIS*
Europe excluding
Russia & CIS* North America Brazil
Original equipment -11% -12% -24% -10%
Replacement +1% +7% -9% -2%
YTD October 2016
% YoY change
in number of tires
(Radial + Bias)
Europe including
Russia & CIS*
Europe excluding
Russia & CIS* North America Brazil
Original equipment +2% +2% -18% -20%
Replacement +4% +5% +2% +0%
London – Goldman Sachs – 8th Annual Global Automotive Conference – December 8, 2016
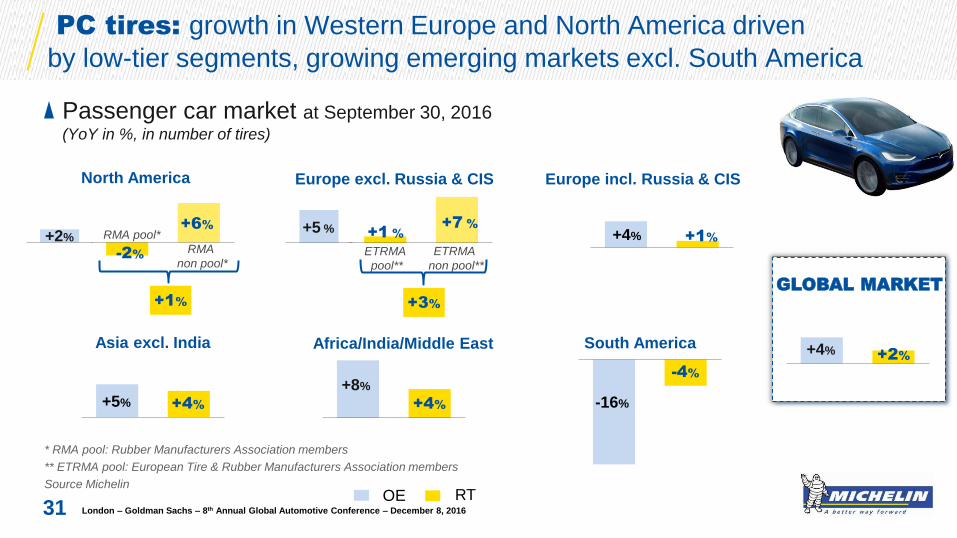
-2%
GLOBAL MARKET
PC tires: growth in Western Europe and North America driven
by low-tier segments, growing emerging markets excl. South America
31
North America
Africa/India/Middle East Asia excl. India
+4%
+8%
+4% +5%
+2% +4%
OE RT
Passenger car market at September 30, 2016 (YoY in %, in number of tires)
Europe incl. Russia & CIS
+1% +4% RMA pool*
RMA
non pool*
* RMA pool: Rubber Manufacturers Association members
** ETRMA pool: European Tire & Rubber Manufacturers Association members
Source Michelin
Europe excl. Russia & CIS
+5 %
ETRMA
pool**
ETRMA
non pool**
+7 %
+1 %
+6%
+2%
+1% +3%
-4%
-16%
South America
London – Goldman Sachs – 8th Annual Global Automotive Conference – December 8, 2016

Europe excl. Russia & CIS
GLOBAL MARKET
Truck tires: global market down driven by Americas OE
and China
32
North America
Asia excl. India
+14%
-2%
+4% +4%
-1%
+8%
-5%
+1%
-2% -1%
OE RT
Truck tires market at September 30, 2016 (YoY in %, in number of new tires)
Europe incl. Russia & CIS
+4% +4%
-16%
RMA pool*
RMA
non pool*
* RMA pool: Rubber Manufacturers Association members
Source Michelin
Africa/India/Middle East
+2%
-0%
-21%
South America
London – Goldman Sachs – 8th Annual Global Automotive Conference – December 8, 2016
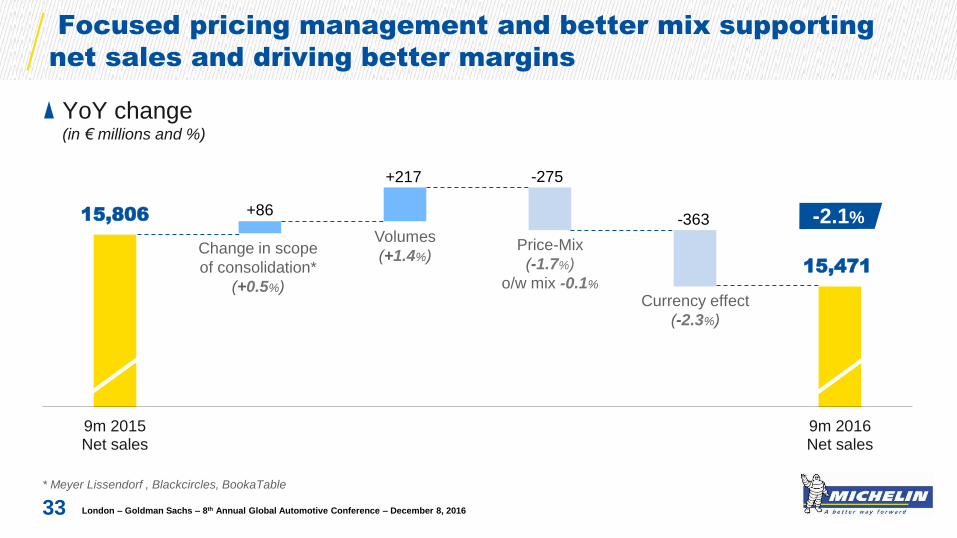
15,806
15,471
+217 -275
-363 +86
9m 2015Net sales
9m 2016Net sales
Focused pricing management and better mix supporting
net sales and driving better margins
YoY change (in € millions and %)
* Meyer Lissendorf , Blackcircles, BookaTable
33
-2.1% Volumes
(+1.4%) Price-Mix
(-1.7%)
o/w mix -0.1%
Change in scope
of consolidation*
(+0.5%) Currency effect
(-2.3%)
London – Goldman Sachs – 8th Annual Global Automotive Conference – December 8, 2016

Improvement in prices and the mix in a lackluster Q3
market environment
YoY quarterly change (in %)
34
-5.1 -3.6
-2.4 -2.5 -1.3
-2.7
-1.0
9.7 10.7
5.7
3.8
-1.9
-3.7
-1.3
Volumes Price-Mix Currency effect
1.5
3.4 3.5 4.2
3.7
1.4
-0.9
2015 2016
Q1 Q2 Q3 Q4 Q1 Q2 Q3
2015 2016
Q1 Q2 Q3 Q4 Q1 Q2 Q3
2015 2016
Q1 Q2 Q3 Q4 Q1 Q2 Q3
London – Goldman Sachs – 8th Annual Global Automotive Conference – December 8, 2016

● Capacity:
─ First tranche: 4 to 5 millions MICHELIN PC tires
─ Approx. 60,000 tonnes
─ 80% of tires produced are 18’ and more
● Investment:
─ €450m including semi-finished
● Target:
─ Automakers in Mexico
─ North American premium market
● First tire to roll off the production line at the
end of 2018
New plant in Léon, Mexico to produce premium Passenger
car and Light truck tires
35 London – Goldman Sachs – 8th Annual Global Automotive Conference – December 8, 2016

● After restructuring PC/LT operations, continuation in the truck division (closure of 10
PC/LT plants and 11 Trucks plants over 2005 - 2016)
● Competitiveness agreements in Europe (France, Germany, Spain, …)
36
Continuation of the initiatives underway for the past five
years: a rationalized industrial footprint
Plant Closures
2005 Truck tires, Poitiers (France)
Semi-finished products, Trento (Italy)
2006 Passenger car tires, Kitchener (Canada)
Passenger car tires, Bourges (France)
2007
Passenger car tires, Toul (France)
Truck & Passenger car tires, Port Harcourt (Nigeria)
Passenger car tires, Lasarte (Spain)
Passenger car tires, Mogadore, Ohio (USA)
Semi-finished products, Budapest (Hungary)
2008 Passsenger car tires, Turin (Italy)
2009
Passsenger car tires, Lille (France)
Passsenger car tires, Ota (Japan)
Retread operations, Queretaro (Mexico)
Passsenger car tires, Opelika (USA)
Plant Closures
2013 Truck tires, Hussein Bay (Algeria)
Truck & Passenger car tires, Cali, Bogota (Columbia)
Truck tires, Tours (France)
2014 Passenger car tires, Pictou (Canada)
Truck tires, Budapest (Hungary)
Announced Plant Closures
2015
Truck tires retread, Oranienburg (Germany) by 2016
Truck tires retread, Alessandria (Italy) by 2016
Semi-finished products, Fossano (Italy) by 2016
Truck tires, Ballymena (UK) by 2018
2016 Truck tires retread, La Combaude (Fance) by 2017
London – Goldman Sachs – 8th Annual Global Automotive Conference – December 8, 2016
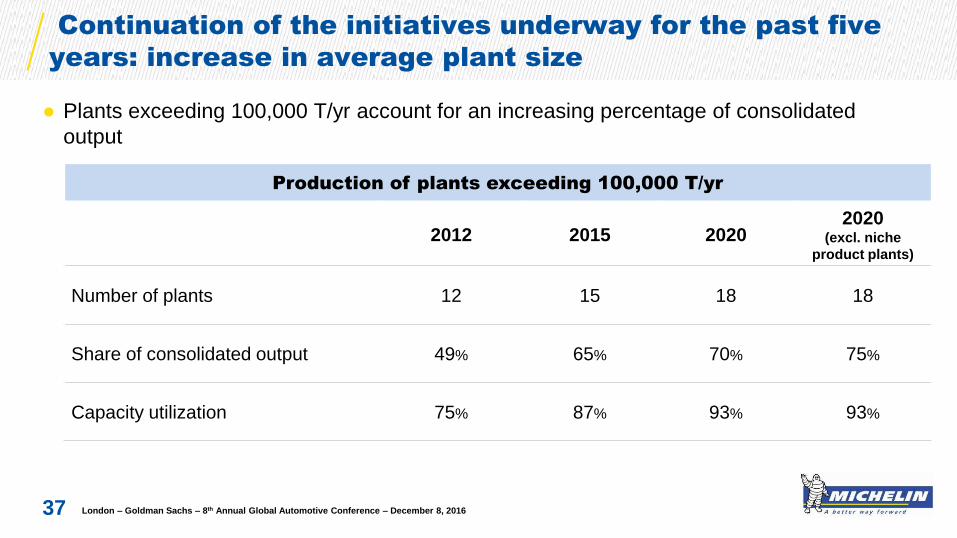
● Plants exceeding 100,000 T/yr account for an increasing percentage of consolidated
output
37
Continuation of the initiatives underway for the past five
years: increase in average plant size
Production of plants exceeding 100,000 T/yr
2012 2015 2020 2020
(excl. niche
product plants)
Number of plants 12 15 18 18
Share of consolidated output 49% 65% 70% 75%
Capacity utilization 75% 87% 93% 93%
London – Goldman Sachs – 8th Annual Global Automotive Conference – December 8, 2016

● Volumes up 2.5%, beating the market in every segment
● 13.7% operating margin from recurring activities, up 1.7 points
● Changes in the price mix / raw materials effect had a positive impact of €115m, thanks to
effective management and a favorable basis of comparison
● €155m in gains from the competitiveness plan offset inflation
● Positive free cash flow of €8m, representing a €108m improvement from first-half 2015
before acquisitions
H1 2016 Operating income of €1.4bn, up a sharp €241m
at constant exchange rates
38 London – Goldman Sachs – 8th Annual Global Automotive Conference – December 8, 2016

1,262
1,405 +159
+339 -224 +155 -142
-49 +3 -98
H1 2015 H1 2016
YoY change in operating income from recurring activities* (in € millions)
Operating income up €241m at constant exchange rates
* To make its operating performance easier to understand and analyze, Michelin now presents "Operating income before non-recurring
income and expenses" as "Operating income from recurring activities" and has refined its definition.
39
Volumes
Currency
Other
Inflation Competitiveness
Price-mix
o/w mix :
-61 Raw
materials
+13 +115
+€241m excluding forex
Depreciation
+11%
London – Goldman Sachs – 8th Annual Global Automotive Conference – December 8, 2016

Net effect of price mix / raw materials on operating income (in € millions )
-266
+264
+1,133
+103 +118
-93
+115
Improvement in unit margin due to effective pricing
management over time
40
2013 2014 2015 H1 2016 2012 2011 2010
● H1 2016: price mix / raw material effect was a negative €20m for indexed businesses
and a positive €135m for the non indexed businesses
London – Goldman Sachs – 8th Annual Global Automotive Conference – December 8, 2016
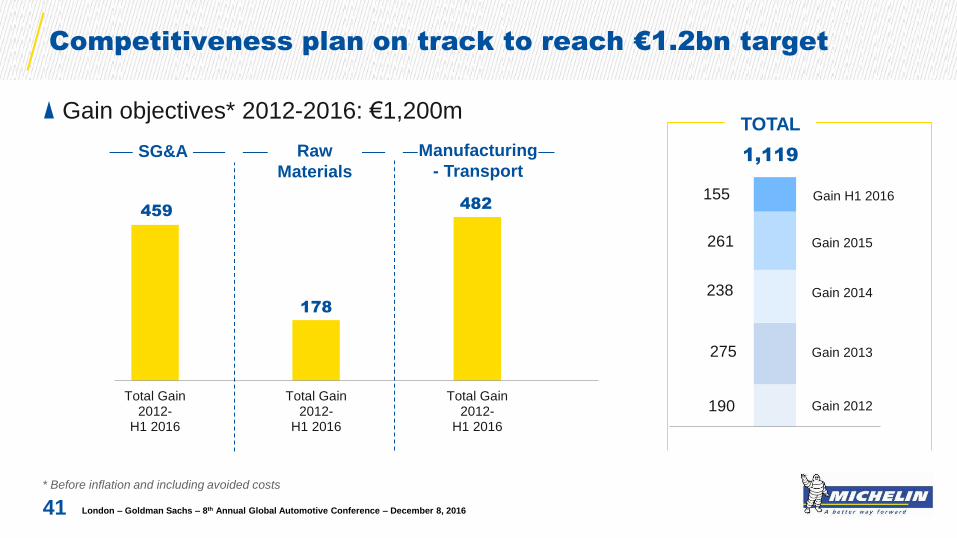
Competitiveness plan on track to reach €1.2bn target
* Before inflation and including avoided costs
41
Gain objectives* 2012-2016: €1,200m
Raw
Materials
Manufacturing
- Transport SG&A
190
275
238
261
155
1,119
Gain 2012
Gain 2013
Gain 2014
Gain 2015
TOTAL
Gain H1 2016
459
178
482
Total Gain2012-
H1 2016
Total Gain2012-
H1 2016
Total Gain2012-
H1 2016
London – Goldman Sachs – 8th Annual Global Automotive Conference – December 8, 2016
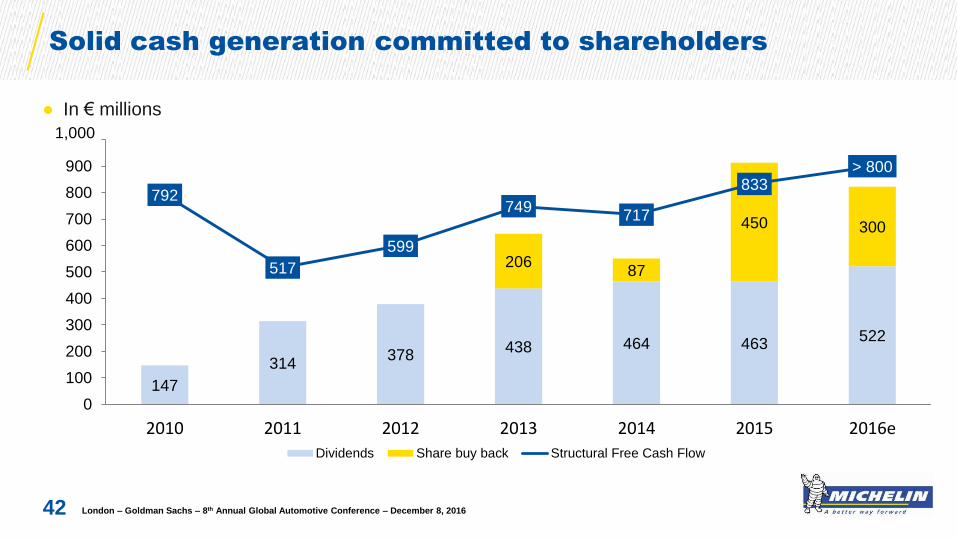
● In € millions
42
Solid cash generation committed to shareholders
147
314 378
438 464 463 522
206 87
450 300
792
517
599
749 717
833 > 800
0
100
200
300
400
500
600
700
800
900
1000
2010 2011 2012 2013 2014 2015 2016e
Dividends Share buy back Structural Free Cash Flow
1,000
London – Goldman Sachs – 8th Annual Global Automotive Conference – December 8, 2016

80
90
100
110
120
130
140
150
160
170
180
2010 2011 2012 2013 2014 2015 2020
Volume growth Operating margin from recurring activities Operating result from recurring activities
● Base 100 in 2010
43
Profitable growth ambition
Above
market growth
>> €3,000 bn
by 2020 +52%
+280bp
+4%
London – Goldman Sachs – 8th Annual Global Automotive Conference – December 8, 2016
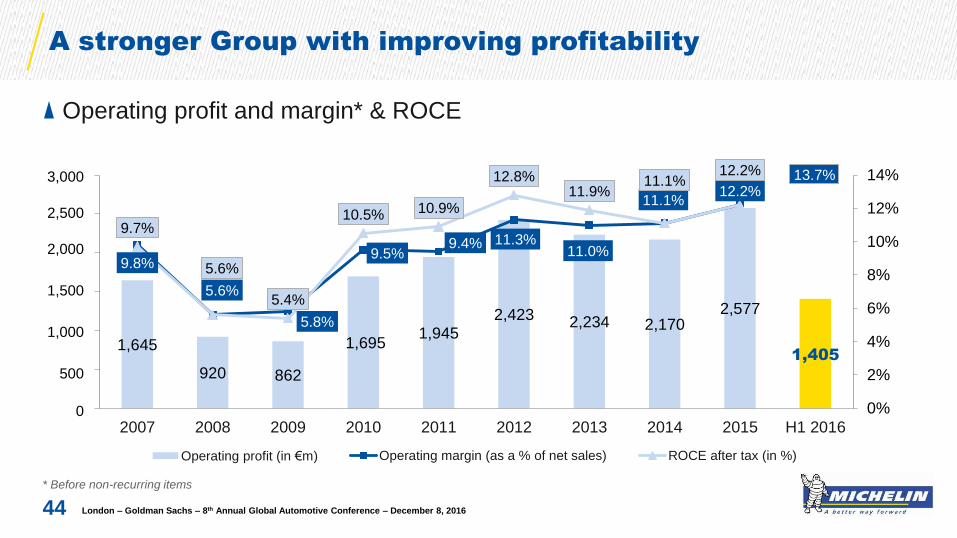
1,645
920 862
1,695 1,945
2,423 2,234 2,170 2,577
1,405
9.8%
5.6%
5.8%
9.5% 9.4% 11.3%
11.0%
11.1% 12.2%
9.7%
5.6%
5.4%
10.5% 10.9%
12.8% 11.9%
11.1% 12.2%
0%
2%
4%
6%
8%
10%
12%
14%
0
500
1,000
1,500
2,000
2,500
3,000
2007 2008 2009 2010 2011 2012 2013 2014 2015 H1 2016
Operating profit (in €m) Operating margin (as a % of net sales) ROCE after tax (in %)
A stronger Group with improving profitability
Operating profit and margin* & ROCE
* Before non-recurring items
44
3,000
2,500
2,000
1,500
1,000
500
0
13.7%
London – Goldman Sachs – 8th Annual Global Automotive Conference – December 8, 2016

830
370 661
1,014 1,018 1,033 1,090 1,010
1,384
814
9.2%
4.3%
8.0%
10.4%
9.4% 9.3%
10.2% 10.5%
11.5%
0
200
400
600
800
1,000
1,200
1,400
1,600
2007 2008 2009 2010 2011 2012 2013 2014 2015 H1 2016
Operating profit (in €m) Operating margin ( as a % of net sales)
Growing Passenger car margin through product innovation, mix
and improving customer service
Operating profit and margin*
* Before non-recurring items
** At constant scope of consolidation and raw materials prices, and with markets expanding (CAGR of 2.5%)
45
1,600
1,400
1,200
1,000
800
600
400
200
0
11%
New 2016-2020
target range**
15%
13.8%
London – Goldman Sachs – 8th Annual Global Automotive Conference – December 8, 2016
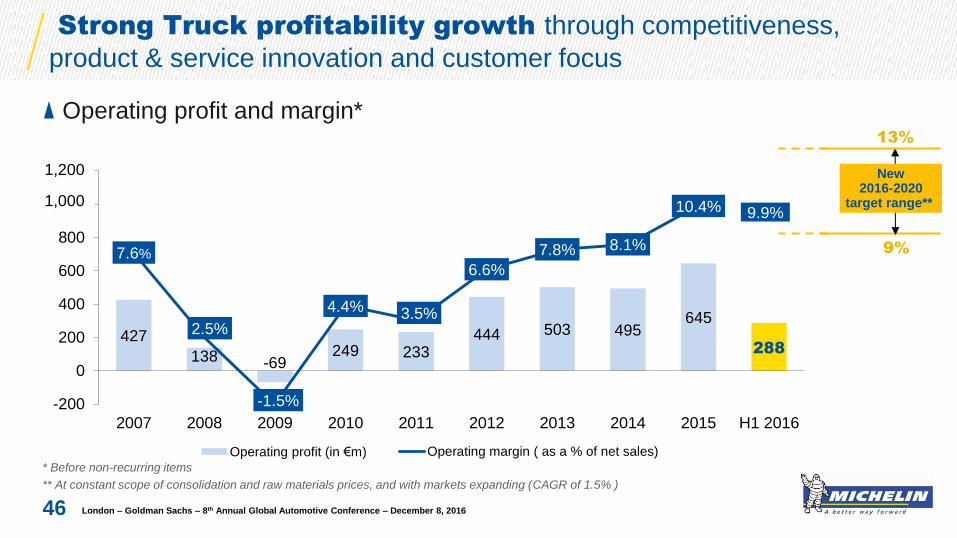
427
138 -69 249 233
444 503 495 645
288
7.6%
2.5%
-1.5%
4.4% 3.5%
6.6%
7.8% 8.1%
10.4%
-200
0
200
400
600
800
1,000
1,200
2007 2008 2009 2010 2011 2012 2013 2014 2015 H1 2016
Operating profit (in €m) Operating margin ( as a % of net sales)
Strong Truck profitability growth through competitiveness,
product & service innovation and customer focus
* Before non-recurring items
** At constant scope of consolidation and raw materials prices, and with markets expanding (CAGR of 1.5% )
46
Operating profit and margin*
1,200
1,000
13%
9%
New 2016-2020
target range** 9.9%
London – Goldman Sachs – 8th Annual Global Automotive Conference – December 8, 2016

Specialty: resilient profitability in a challenging environment
* Before non-recurring items
** At constant scope of consolidation and raw materials prices, and with markets expanding
47
Operating profit and margin*
388 412
270
432
694
946
645 574 548
303
17.8% 17.9%
13.3%
17.8%
21.5%
26.0%
20.6% 19.3%
18.6%
0
100
200
300
400
500
600
700
800
900
2007 2008 2009 2010 2011 2012 2013 2014 2015 H1 2016
Operating profit (in €m) Operating margin ( as a % of net sales)
24%
17%
New 2016-2020
target range** 20.6%
London – Goldman Sachs – 8th Annual Global Automotive Conference – December 8, 2016

25% 36%
39% 29% 26% 21%
22%
15%
12%
18%
23% 23% 25%
20%
60%
52%
43% 49% 51%
54%
58%
2010 2011 2012 2013 2014 2015 H1 2016
Strong operating profit growth through diversified and worldwide
footprint
Group operating profit*, by Reporting Segment (in € millions and %)
2,423
2,234 2,170
2,577
48
RS1 RS2 RS3
1,695
* Before non-recurring items
1,945
1,405
London – Goldman Sachs – 8th Annual Global Automotive Conference – December 8, 2016

"This presentation is not an offer to purchase or a solicitation to recommend the purchase
of Michelin shares. To obtain more detailed information on Michelin, please consult the
documentation published in France by Autorité des marchés financiers available from the
http://www.michelin.com/eng/ website.
This presentation may contain a number of forward-looking statements. Although the
Company believes that these statements are based on reasonable assumptions at the time
of the publication of this document, they are by nature subject to risks and contingencies
liable to translate into a difference between actual data and the forecasts made or induced
by these statements."
Disclaimer
49 London – Goldman Sachs – 8th Annual Global Automotive Conference – December 8, 2016

Contacts
50
Valérie MAGLOIRE
Matthieu DEWAVRIN
Humbert de FEYDEAU
+33 (0)1 78 76 45 36
27, cours de l’île Seguin
92100 Boulogne-Billancourt - France
London – Goldman Sachs – 8th Annual Global Automotive Conference – December 8, 2016