Going Places Phase I Summary
22
Summary of Phase I Existing Conditions Assessment Board of Directors May 7, 2009 Martin Kim, Director of Regional Planning
-
Upload
mvrpc -
Category
Technology
-
view
2.741 -
download
1
Transcript of Going Places Phase I Summary

Summary of Phase I
Existing Conditions Assessment
Board of Directors
May 7, 2009
Martin Kim, Director of Regional Planning

Urbanization Trends
Population:
346,864 Urbanized Area:
66.2 sq miles Population Density:
5,236 pop/sq mi

Urbanization Trends
Population:
723,955 Urbanized Area:
327.6 sq miles Population Density:
2,210 pop/sq mi

How do you envision the Region in 2040?
??
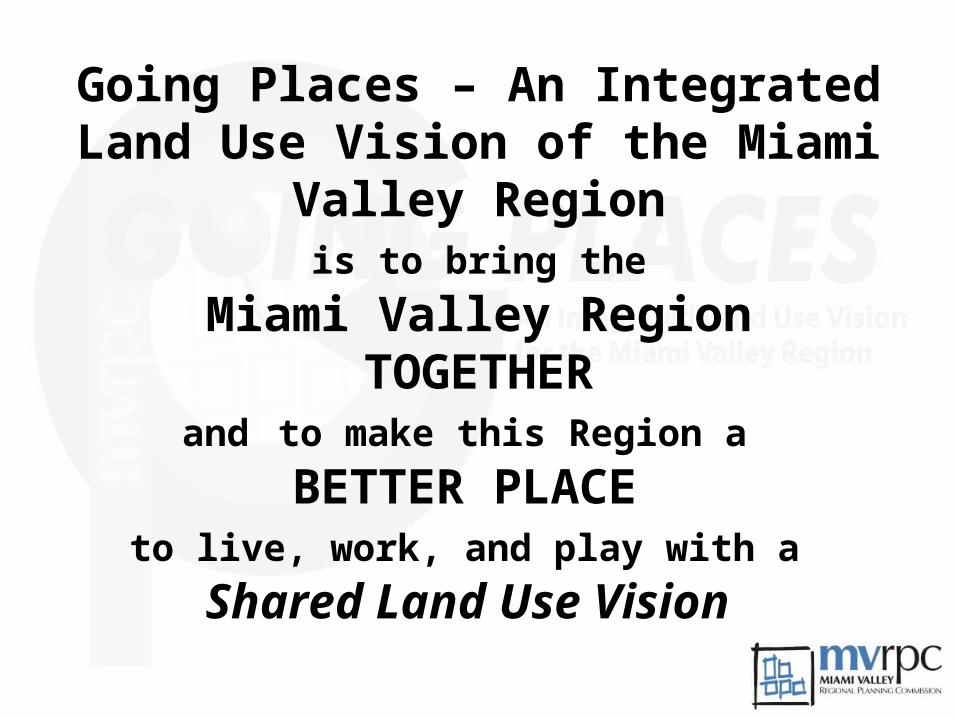
Going Places – An Integrated Land Use Vision of the Miami Valley Region
is to bring the Miami Valley Region
TOGETHER and to make this Region a BETTER PLACE
to live, work, and play with a Shared Land Use Vision

Planning Process
3 Phase process with an estimated timeline of 4 years Phase I – Existing Condition Assessment: Physical and Non-
Physical Condition Evaluation Phase II – Future Landscape Exploration: Future Land Use
Scenario Development and Assessment Phase III – Building a Clear and Shared Regional Growth
Framework

Phase I Structure
Physical Condition Evaluation – Land Supply Evaluate the Region’s land development suitability based on
both natural and built environment factors Examine the existing uses of land, including land use
intensities in the Region Identify developable land in the Region
Non-Physical Condition Evaluation – Land Demand Identify how much land is devoted to different types of land
uses Identify socio-economic trends and develop projections Translate these projections into future land demand
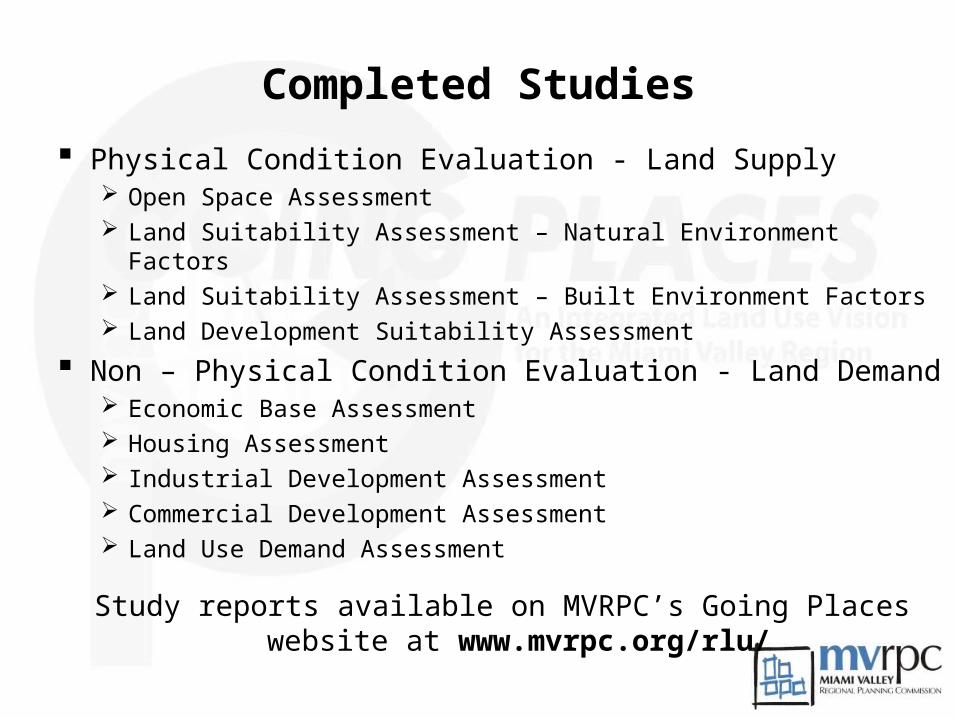
Completed Studies
Physical Condition Evaluation - Land Supply Open Space Assessment Land Suitability Assessment – Natural Environment Factors Land Suitability Assessment – Built Environment Factors Land Development Suitability Assessment
Non – Physical Condition Evaluation - Land Demand Economic Base Assessment Housing Assessment Industrial Development Assessment Commercial Development Assessment Land Use Demand Assessment
Study reports available on MVRPC’s Going Places website at www.mvrpc.org/rlu/

What have we found out?

Geographically, development has been uneven
Commercial GLA Concentration: 2007Housing Unit Change: 1990 - 2000

Development has been shifting among land use types
Land Use Percentage Change: 1975 - 2000
Residential Commercial IndustrialAgricultural/Open Space
Region 36.3% 148.1% 22.0% -9.3%
- Greene 30.2% 85.9% -10.7% -4.4%
- Miami 123.8% 183.3% 81.7% -5.9%
- Montgomery 25.6% 161.1% 20.3% -17.9%

The Region contains varying degrees of potential for future land development
Not all of our land is equal in terms of development potential – some areas are better suited for physical development than others
Assessment of Region’s landscape from natural and built environment perspectives provided a comprehensive overview of where developmental constraints and/or opportunities exist

Land Suitability Assessment – Natural Environment
Natural Environment Suitability Composite Map
Regional Land by Development Potential Classification

Land Suitability Assessment – Built Environment
Residential Suitability Composite Map Non-Residential Suitability Composite Map

Comprehensive Land Suitability Measure
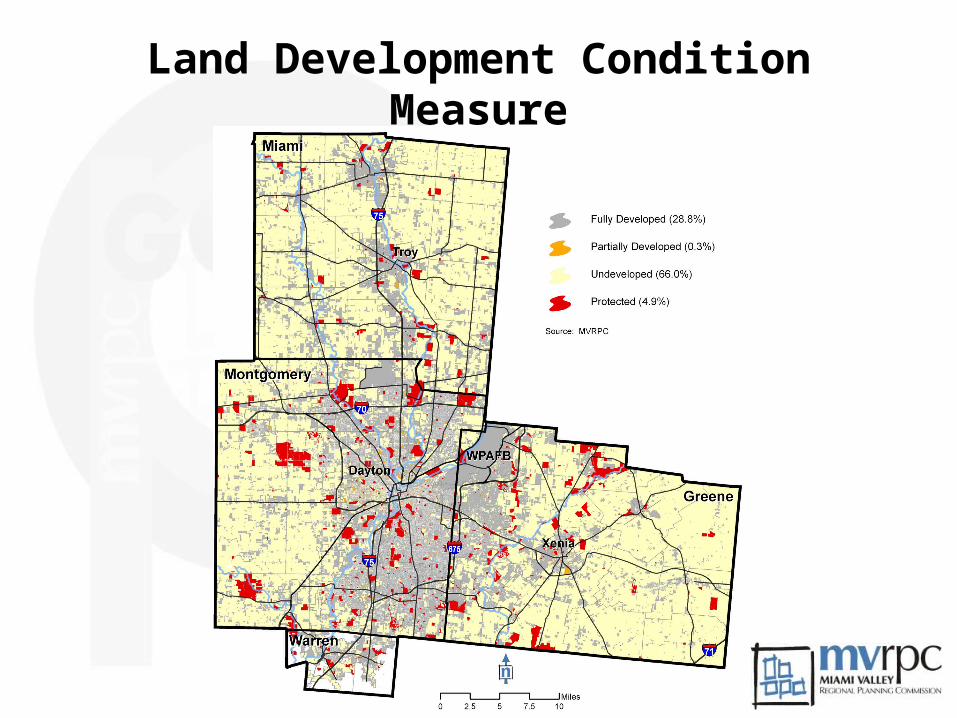
Land Development Condition Measure
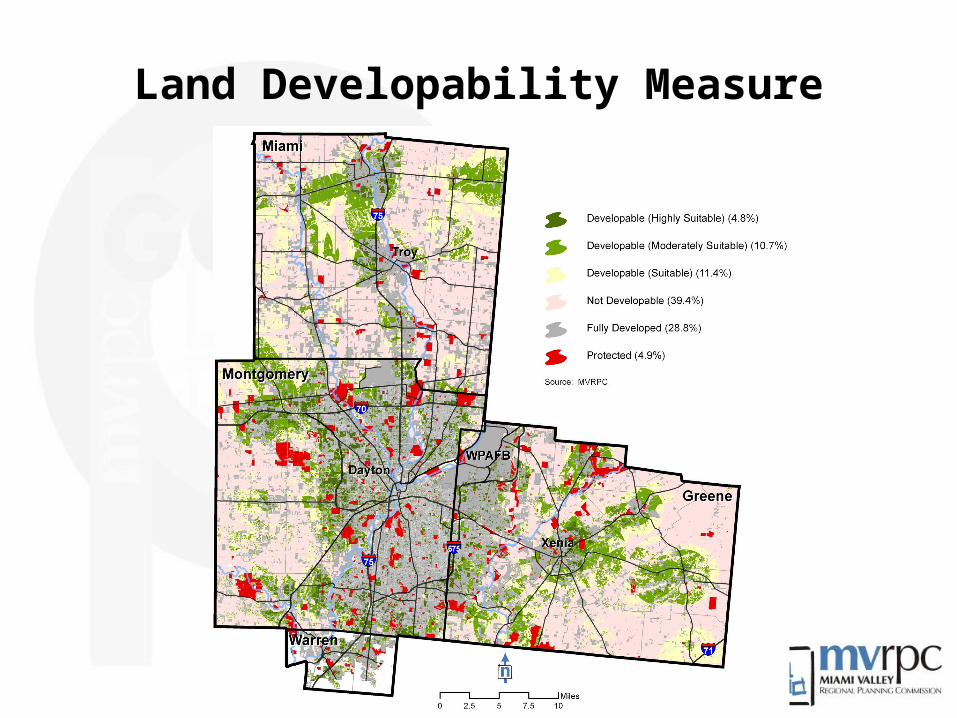
Land Developability Measure

The Region is in the process of a demographic and economic shift
Population is aging and household size has been decreasing
The Region is shifting from a production-based economy to a service-based economy
Household income has remained stagnant Number of households who pay more than 30% of their
income on housing-related cost has been increasing

Land development not tied to population change
Population in the Region remained relatively stable between 1970 and 2000
Between 1975 and 2000, total developed land (res/com/ind) in the Region increased by 44.6%
Vacancy Rates have increased Residential vacancy rate has risen from 6.34% in 1980 to
6.98% in 2000 14.6% of the Region’s commercial space is vacant* 19.3% of the Region’s industrial space is vacant*
* Estimates were calculated based on Gem Real Estate Group’s sample data from their Retail, Office, and Industrial studies

If current development trends continue, a moderate amount of additional developed land will be required
Regional Population Projections Regional Employment Projections

The Region has enough developable land to accommodate future needs
Supply Vs. Demand

The entire Region will benefit if..
Development is planned and executed in a manner that takes advantage of existing infrastructure before paying for new construction
Development takes advantage of the Region’s natural resources without threatening their quality