Going One Step Beyond in North Denver€“2035 PCL •Partial Cover Lowered •Address community...
25
Going One Step Beyond in North Denver Michael Ogletree Denver Environmental Health January 7, 2016 A Neighborhood Scale Air Pollution Modeling Assessment Part I : Predicted Mobile Emissions in 2035
Transcript of Going One Step Beyond in North Denver€“2035 PCL •Partial Cover Lowered •Address community...
Going One Step Beyond
in North Denver
Michael Ogletree
Denver Environmental Health
January 7, 2016
A Neighborhood Scale Air Pollution Modeling Assessment
Part I : Predicted Mobile Emissions in 2035
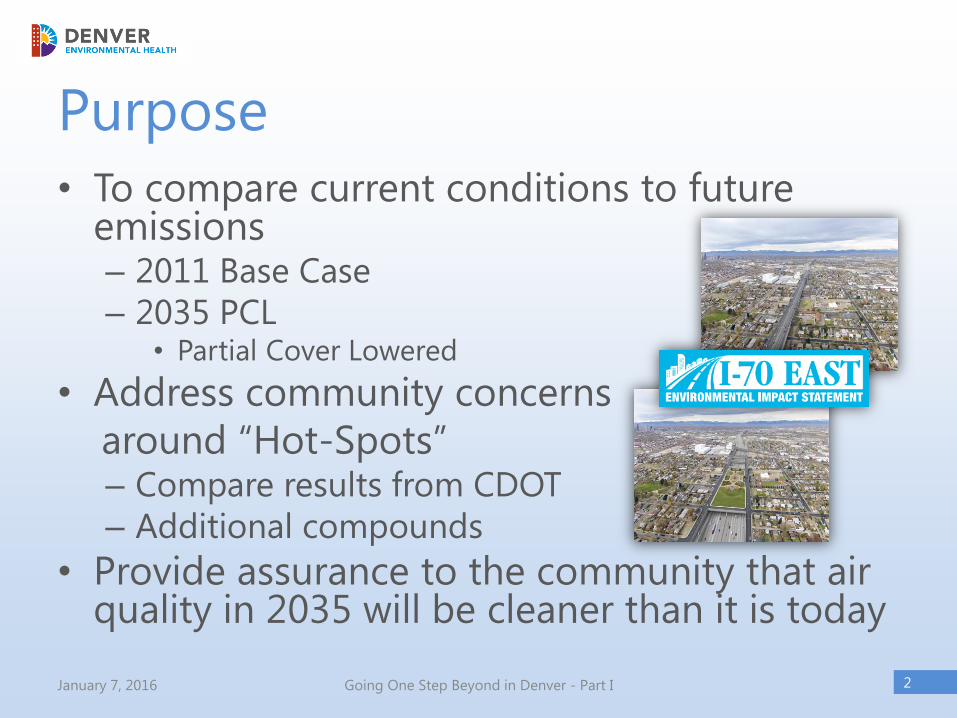
Purpose
• To compare current conditions to future emissions– 2011 Base Case
– 2035 PCL• Partial Cover Lowered
• Address community concerns
around “Hot-Spots”– Compare results from CDOT
– Additional compounds
• Provide assurance to the community that air quality in 2035 will be cleaner than it is today
2January 7, 2016 Going One Step Beyond in Denver - Part I

Motor Vehicles Emission Simulator (MOVES)
• Developed by the EPA and used by state agencies for State Implementation Plan (SIP) and transportation conformity
• Most recently updated in November 2015– MOVES2014a
– This update did not include significant changes to the criteria pollutant emissions results of MOVES2014 (EPA)
• MOVES2014 (released in October 2014) was used for our analysis– Different from CDOT & CDPHE
– MOVES2010b
3January 7, 2016 Going One Step Beyond in Denver - Part I

Emissions Modeling Procedure
4
Traffic DataMeteorological
Data
Fuel & Control
Program Data
Vehicle Fleet
Data
EPA MOVES2014
Emissions Factors by
Pollutants
Post-Processing
NOx EmissionsPM Emissions Benzene Emissions
January 7, 2016 Going One Step Beyond in Denver - Part I
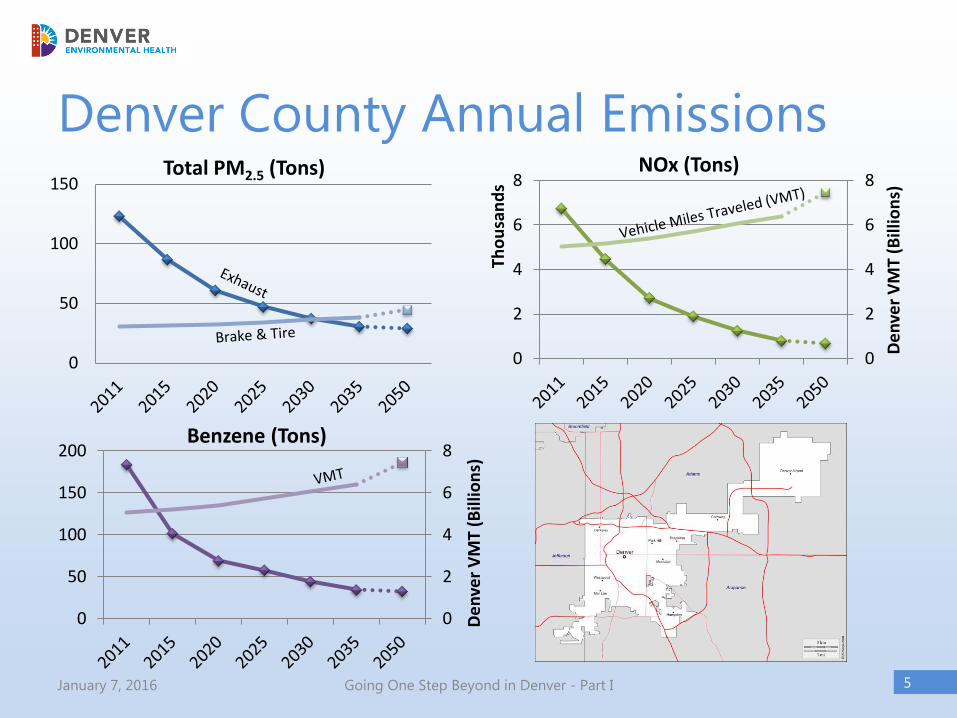
Denver County Annual Emissions
5January 7, 2016 Going One Step Beyond in Denver - Part I
0
2
4
6
8
0
2
4
6
8
De
nve
r V
MT
(Bill
ion
s)
Tho
usa
nd
s
NOx (Tons)
0
50
100
150Total PM2.5 (Tons)
0
2
4
6
8
0
50
100
150
200D
en
ver
VM
T (B
illio
ns)
Benzene (Tons)

Project Area of Primary Focus
6January 7, 2016 Going One Step Beyond in Denver - Part I
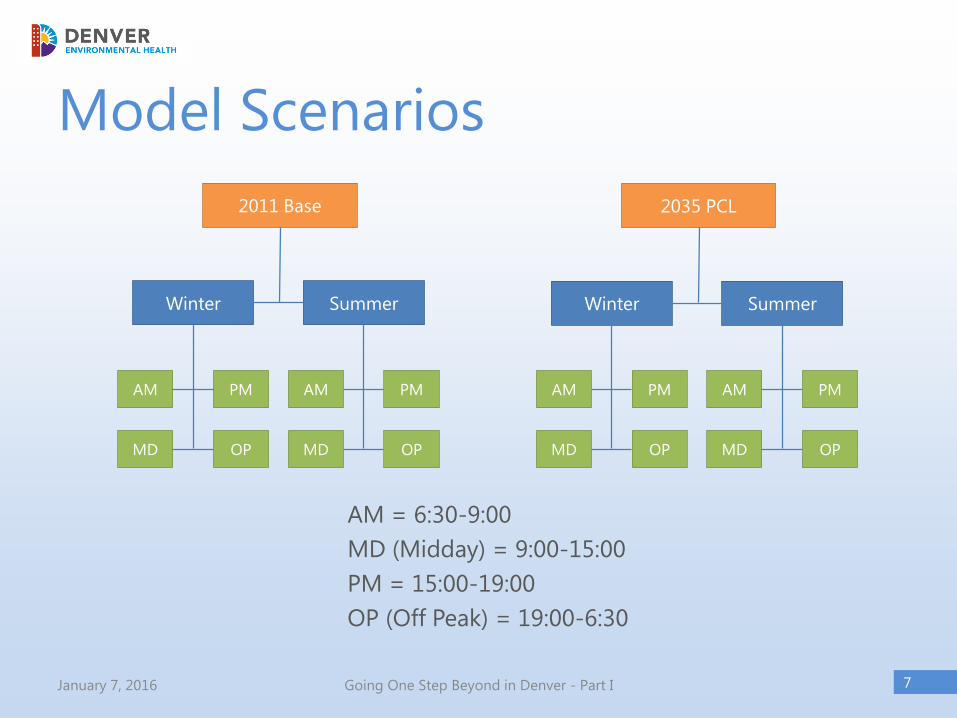
Model Scenarios
7January 7, 2016 Going One Step Beyond in Denver - Part I
Winter
2011 Base
AM PM
MD OP
Summer
AM PM
MD OP
Winter
2035 PCL
AM PM
MD OP
Summer
AM PM
MD OP
AM = 6:30-9:00
MD (Midday) = 9:00-15:00
PM = 15:00-19:00
OP (Off Peak) = 19:00-6:30

PM Modeling Components
• PM2.5 & PM10
• Exhaust emissions
– Emitted directly from tailpipe
– Elemental carbon, iron, organic carbon, etc.
– Tailpipe emissions also lead to secondary
particulate matter like nitrate and sulfate
• Brake and Tire wear
• Road Dust
9January 7, 2016 Going One Step Beyond in Denver - Part I

Road Dust - LimitationsFrom the South Coast (California) Air Quality Management District (SCAQMD) I-710 Environmental Impact Statement Air Quality Technical Report (February 2012):
• Road dust lofted (entrained) into the air by passing vehicles result in increased inhalable particulate matter levels in some areas very near to the highway compared to the baseline.– Brake and tire wear particulate matter is different and will grow with added vehicles and/or VMT
• The increases in dust may be an artifact of the U.S. Environmental Protection Agency (U.S. EPA) calculation method for entrained road dust and are inconsistent with the South Coast Air Quality Management District’s 2007 Air Quality Management Plan (AQMP) methodology and proposed 2012 AQMP method, which do not result in the growth of entrained dust seen in the U.S. EPA method.
• The EPA equation to calculate road dust assumes that roads have infinite amounts of dust (also known as silt reservoirs) to entrain. – Basically for each added vehicle or vehicle mile traveled (VMT), more and more silt is deposited onto the highway and
becomes available for resuspension. DEH contends there is a finite amount of dust that can be added to any roadway, and that is related mostly to meteorology (wind) and not the number of vehicles.
• If re-entrained road dust growth were excluded or assumed to not grow, all project alternatives reduce emissions from the baseline year.
• SCAQMD proposed a modified methodology for entrained PM emissions as part of their 2012 AQMP development. In SCAQMD’s proposed methodology, baseline year PM10 and PM2.5 estimates will be lower, particularly PM2.5 estimates.
• Most importantly, future year entrained PM will remain constant (unless the roadway is lengthened or widened).
• I-70 will be widened and would be expected to have some increase in resuspended road dust. However,the calculations used for this modeling result in what we consider to be a very conservative (highamount).
• DEH expects future year dust and the resulting total PM concentrations to be lower than predicted here.
10January 7, 2016 Going One Step Beyond in Denver - Part I

PM2.5
• PM2.5 is particulate matter that is ≤ 2.5µm (microns or micrometers {millionths of a meter})– 1/30th the width of a human hair
• Sources of PM2.5
– Fossil fuel combustion• Gas and diesel vehicles
• Wood burning
• Health effects– Irritation of the eyes, nose, and throat
– Reduced lung function
– Asthma attacks
– Those most at risk are those with heart or lung diseases, children and older adults.
11January 7, 2016 Going One Step Beyond in Denver - Part I
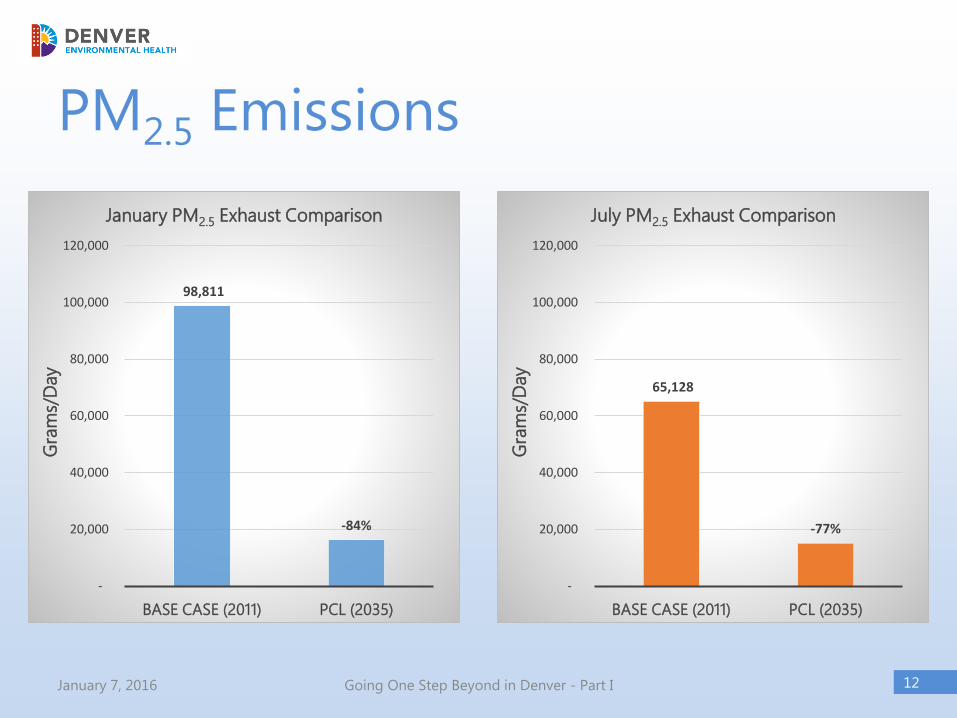
PM2.5 Emissions
12January 7, 2016 Going One Step Beyond in Denver - Part I
98,811
-84%
-
20,000
40,000
60,000
80,000
100,000
120,000
BASE CASE (2011) PCL (2035)
Gra
ms/
Day
January PM2.5 Exhaust Comparison
65,128
-77%
-
20,000
40,000
60,000
80,000
100,000
120,000
BASE CASE (2011) PCL (2035)
Gra
ms/
Day
July PM2.5 Exhaust Comparison

13January 7, 2016 Going One Step Beyond in Denver - Part I
-
20
40
60
80
100
120
140
160
180
Base Case (2011) PCL (2035)
GR
AM
S/D
AY
(X
10
00
)
January PM2.5
PM2.5 Exhaust PM2.5 B&T PM2.5 Road Dust
-
20
40
60
80
100
120
140
160
180
Base Case (2011) PCL (2035)
GR
AM
S/D
AY
(X
10
00
)
July PM2.5
PM2.5 Exhaust PM2.5 B&T PM2.5 Road Dust
PM2.5 Breakdown

14January 7, 2016 Going One Step Beyond in Denver - Part I
PM2.5 January Breakdown 2011 vs 2035
PM2.5 Exhaust
63.5%
PM2.5 B&T
2.3%
PM2.5 Road Dust
34.2%
January PM2.5 Base Case (2011)
PM2.5 Exhaust
18.6%
PM2.5 B&T
7.6%
PM2.5 Road Dust
73.7%
January PM2.5 PCL (2035)

15January 7, 2016 Going One Step Beyond in Denver - Part I
PM2.5 July Breakdown 2011 vs 2035
PM2.5 Exhaust
17.6%
PM2.5 B&T
7.7%
PM2.5 Road Dust
74.7%
July PM2.5 PCL (2035)
PM2.5 Exhaust
53.4%
PM2.5 B&T
2.9%
PM2.5 Road Dust
43.7%
July PM2.5 Base Case (2011)
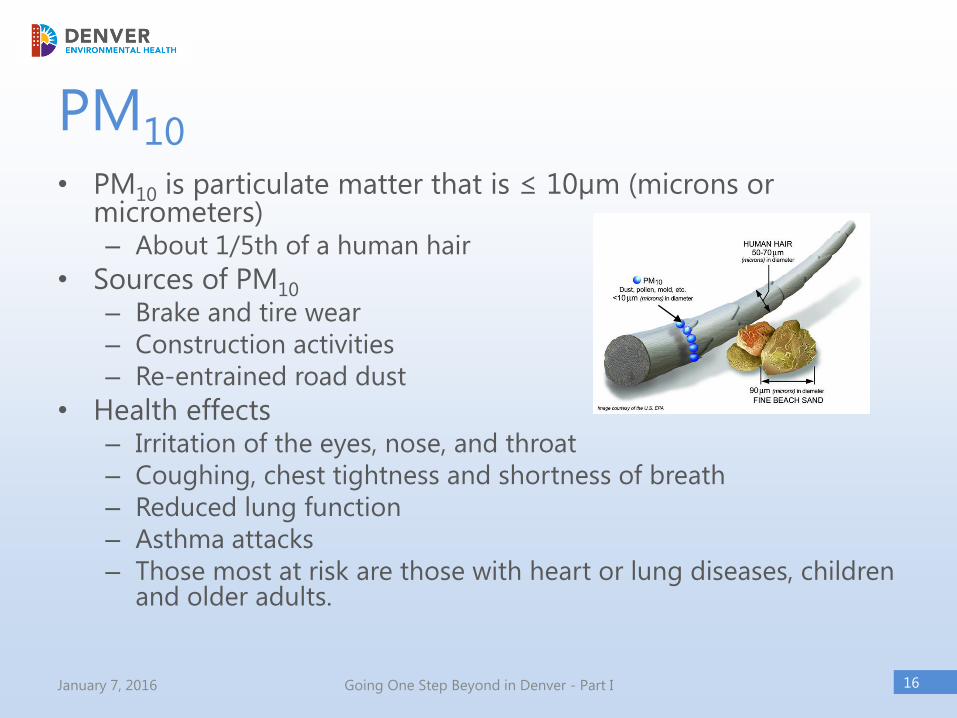
PM10
• PM10 is particulate matter that is ≤ 10µm (microns or micrometers)– About 1/5th of a human hair
• Sources of PM10
– Brake and tire wear
– Construction activities
– Re-entrained road dust
• Health effects– Irritation of the eyes, nose, and throat
– Coughing, chest tightness and shortness of breath
– Reduced lung function
– Asthma attacks
– Those most at risk are those with heart or lung diseases, children and older adults.
16January 7, 2016 Going One Step Beyond in Denver - Part I

PM10 Modeled Comparison
17January 7, 2016 Going One Step Beyond in Denver - Part I
85,172
-33%
-
10,000
20,000
30,000
40,000
50,000
60,000
70,000
80,000
90,000
BASE CASE (2011) PCL (2035)
Gra
ms/
Day
January PM10 Exhaust Comparison
63,521
-11%
-
10,000
20,000
30,000
40,000
50,000
60,000
70,000
80,000
90,000
BASE CASE (2011) PCL (2035)
Gra
ms/
Day
July PM10 Exhaust Comparison
18January 7, 2016 Going One Step Beyond in Denver - Part I
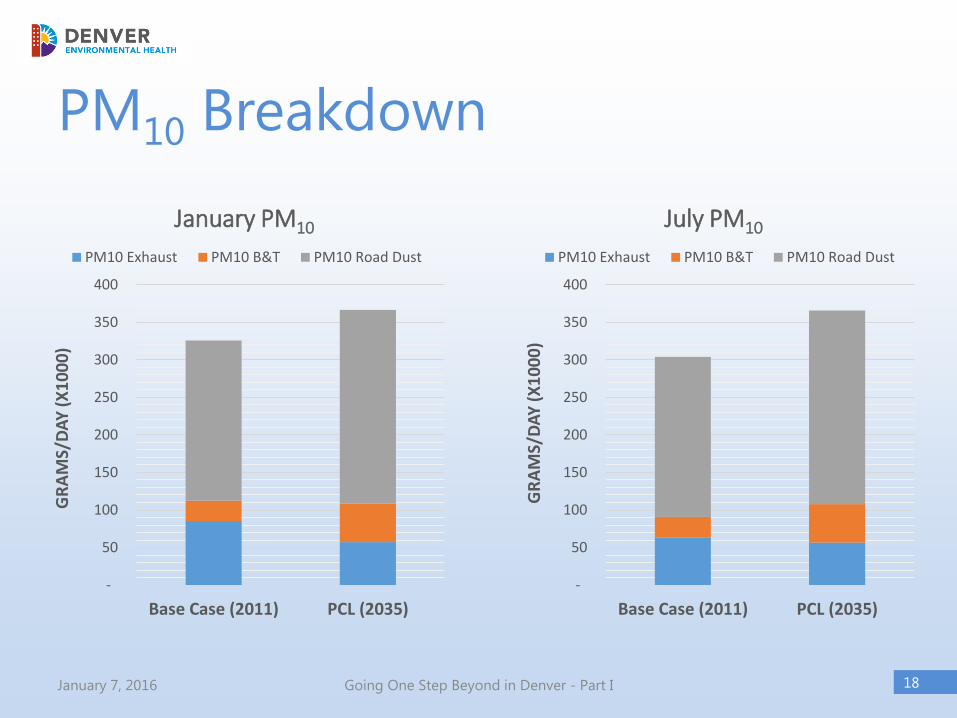
-
50
100
150
200
250
300
350
400
Base Case (2011) PCL (2035)
GR
AM
S/D
AY
(X
10
00
)
July PM10
PM10 Exhaust PM10 B&T PM10 Road Dust
-
50
100
150
200
250
300
350
400
Base Case (2011) PCL (2035)
GR
AM
S/D
AY
(X
10
00
)
January PM10
PM10 Exhaust PM10 B&T PM10 Road Dust
PM10 Breakdown

19January 7, 2016 Going One Step Beyond in Denver - Part I
PM10 January Breakdown 2011 vs 2035
PM10 Exhaust
26.2%
PM10 B&T
8.4%PM10 Road Dust
65.5%
January PM10 Base Case (2011)
PM10 Exhaust
15.6%
PM10 B&T
14.0%
PM10 Road Dust
70.4%
January PM10 PCL (2035)

20January 7, 2016 Going One Step Beyond in Denver - Part I
PM10 July Breakdown 2011 vs 2035
PM10
Exhaust
15.4%
PM10 B&T
14.0%
PM10 Road Dust
70.5%
July PM10 PCL (2035)
PM10 Exhaust
20.9%
PM10 B&T
9.0%
PM10 Road Dust
70.1%
July PM10 Base Case (2011)

NOx
• NOx consists of a group of highly reactive gases. Includes: nitric oxide (NO) and nitrogen dioxide (NO2) It contributes to secondary PM2.5 as well as the creation of ground level ozone.
• Sources– Vehicle emissions
• On-road and off-road vehicles
• Construction equipment
– Power plants
• Health effects– Airway inflammation in healthy people
– Increased respiratory symptoms in people with asthma
21January 7, 2016 Going One Step Beyond in Denver - Part I

NOx Modeled Comparison
22January 7, 2016 Going One Step Beyond in Denver - Part I
1,329,092
-87%
-
200,000
400,000
600,000
800,000
1,000,000
1,200,000
1,400,000
BASE CASE (2011) PCL (2035)
Gra
ms/
Day
January NOx Exhaust Comparison
1,246,912
-88%
-
200,000
400,000
600,000
800,000
1,000,000
1,200,000
1,400,000
BASE CASE (2011) PCL (2035)
Gra
ms/
Day
July NOx Exhaust Comparison

Benzene
• Benzene is an organic compound with high flammability and volatility used as a component in gasoline because of its high octane number.
• Sources– Vehicle exhaust
– Refineries and gasoline service stations
– Wood burning
• Health effects– Known to cause cancer
– Irritation of the eyes, skin, and respiratory system
23January 7, 2016 Going One Step Beyond in Denver - Part I

Benzene Modeled Comparison
24January 7, 2016 Going One Step Beyond in Denver - Part I
*Evaporative emissions could not be included in the model at the project level
9,823
-80%
-
2,000
4,000
6,000
8,000
10,000
12,000
BASE CASE (2011) PCL (2035)
Gra
ms/
Day
January Benzene Exhaust Comparison
8,355
-80%
-
2,000
4,000
6,000
8,000
10,000
12,000
BASE CASE (2011) PCL (2035)
Gra
ms/
Day
July Benzene Exhaust Comparison
What’s Next?
• Incorporate 2035 emissions data into AERMOD to generate predicted future year concentrations
• Compare to current health based standards
• The first step in a larger process– Air monitoring for PM10, PM2.5, CO, NOx, certain VOCs
like benzene, and soot begins @ Swansea Elem in 2016
– One year of pre-construction (baseline), 3 years during construction, one year post construction
– EPA grant to conduct two 4-6 week intensive sampling periods to determine near highway gradients to verify modeling
25January 7, 2016 Going One Step Beyond in Denver - Part I
Disclaimer: This work was performed by Denver Environmental Health (DEH) independently
from the Colorado Dept of Transportation (CDOT). CDOT did answer a few
technical questions along the way regarding some of the assumptions were
made. Similar modeling tools were used by both agencies (MOVES, AERMOD).
This project builds upon work that DEH completed in 2005 and was funded by
Federal Highway Administration (FHWA) and CDOT in 2004. FHWA/CDOT did not
provide funding for this phase of work. DEH did this work in response to citizen
and other interested stakeholders concerns regarding near highway gradients
and hot-spots. CDOT did review this presentation but otherwise has had not
formally reviewed the technical work products. The materials produced are wholly
owned by the City and County of Denver Dept. of Environmental Health.
For more information Contact Michael Ogletree, Gregg Thomas, or Lisa Clay with the Denver
Department of Environmental Health
26January 7, 2016 Going One Step Beyond in Denver - Part I