Integrating Renewable Energy...INTEGRATING RENEWABLE ENERGY - WIND INTEGRATION STUDIES REPORT

ChampioningRenewable Integration in Jing-Jin-JiBest practices from Germany and Texas
GOING FOR GOLD

© 2016 The Paulson Institute. All Right Reserved.Contact: [email protected] by Jonathan Tsao, Chinabeat Ltd.
About the Paulson Institute:The Paulson Institute is a non-partisan, non-profit “think and do” tank grounded in the principle that today’s most pressing economic and environmental challenges can be solved only if the United States and China work in complementary ways. Our mission is to strengthen U.S.-China relations and to advance sustainable economic growth and environmental protection in both countries. Our programs focus on advancing the transition to more sustainable, low-carbon economic models in China and the United States through industrial transformation, sustainable urbanization programs, and environmental conservation. We also promote bilateral cross-border investment that will help create jobs and strengthen U.S.-China relations. Our Think Tank publishes prescriptive and analytical papers from leading scholars and practitioners on the most important macroeconomic and structural reform issues facing China today. Founded in 2011 by Henry M. Paulson, Jr., the 74th Secretary of the Treasury and former Chief Executive Officer of Goldman Sachs, the Institute is based in Chicago and has offices in Washington, San Francisco, and Beijing. Learn more at www.paulsoninstitute.org
On the Grid: China has more renewable capacity than any other country, but integrating clean energy onto the power grid remains a challenge.
Going for Gold:Championing Renewable Integration
in Jing-Jin-Ji Best Practices from Germany and Texas
Authors
Anders Hove and Kevin Mo, Ph.D.
The Paulson Institute
External Reviewers
Hu Zhaoguang (胡兆光) China Energy Research Institute of State Grid Corporation
Fredrich (Fritz) Kahrl Regulatory Assistance Project (RAP)
Valerie Karplus Massachusetts Institute of Technology (MIT)
Lu Hong (芦红) Energy Foundation China
Sandra Retzer German Federal Enterprise for International Cooperation (GIZ)
David Sandalow Columbia University
Frederick Weston Regulatory Assistance Project (RAP)
Yuan Jiahai (袁家海) North China Electric Power University
External reviewers do not necessarily endorse the views expressed in the paper

The Paulson Institute
Executive Summary
IV
Green Olympics: Beijing and Zhangjiakou will co-host the 2022 Winter Games, and the Chinese government has pledged to integrate the Games with the Jing-Jin-Ji region’s existing goals for clean energy and improved air quality.

1
GoInG foR Gold:CHAMPIonIng ReneWAbLe InTegRATIon In JIng-JIn-JI
foREwoRd
Dear Reader,
Last summer, Beijing and neighboring city Zhangjiakou won their joint bid to host the 2022 Winter Olympics. The international attention focused on this region in the lead-up to the Games provides a strong incentive for the Jing-Jin-Ji region to reach its ambitious air quality and low-carbon energy goals, and to show leadership to China and the world on the critical question of how to embrace a sustainable, prosperous energy development model.
To this end, Zhangjiakou, accounting for more than half of renewable resources in Jing-Jin-Ji, has been named China’s first nationally-designated renewable energy demonstration zone. But Zhangjiakou is a small city, without significant energy demand. Partly as a result, the city faces high rates of “curtailment,” or wasted energy. Zhangjiakou’s current vision for how to reconcile its abundant renewable energy development with its small energy demand includes the idea of boosting local electricity consumption to absorb excess renewable energy, while constructing super high-voltage transmission lines to deliver renewable power to remote provinces. However, this first approach has the potential to work against China’s broader efforts to increase energy efficiency and cap total energy use by 2020; meanwhile the second approach will take huge capital investment and sacrifice transmission efficiency.
In this paper, we recommend a different solution: going beyond Zhangjiakou to establish the much larger region of Jing-Jin-Ji as a pilot renewable energy integration zone. Within the zone, we recommend making reducing curtailment a key goal, given that wasted renewable energy continues to be a severe obstacle to the transition to clean energy in Jing-Jin-Ji and across China. Other nations offer important examples to Jing-Jin-Ji on how to achieve these goals through a variety of policy and regulatory instruments. In this paper we highlight the case studies of Germany and Texas to show that with the right policy structures in place, Jing-Jin-Ji has the opportunity to be a national, and even global, model for renewable energy integration by the time the Olympic torch is lit in 2022.
Some might ask what Germany and Texas have in common with the large and diverse region of Jing-Jin-Ji. Despite their many differences, the three regions share similar geographic, population, and energy demand characteristics that make the German and Texas cases particularly useful for Jing-Jin-Ji to consider. The three also share a common goal of increasing renewable energy—in the Texas case, to diversify energy supply and take advantage of strong wind resources; in Germany, to meet broad European Union climate and energy goals. In both places, the transition hasn’t been easy: both regions made major policy changes on issues such as transmission planning for renewable energy, dispatch order, and spot power markets. These changes involved serious debate, and took time and money to implement. But the results speak for themselves: both Germany and Texas are now able to integrate large amounts of clean wind and solar energy into the grid with very little waste.
We hope this paper spurs a serious discussion about renewable energy integration. We look forward to engaging with policymakers, industry executives, and other experts to address these key issues as part of the Paulson Institute’s larger mission of supporting China and the U.S. in the transition to a more sustainable economic future.
Kate GordonVice Chair, Climate and Sustainable Urbanization

The Paulson Institute2
ConTEnTS
foreword 1
1 Executive Summary 3
2 overview of China’s renewable energy challenges 6
3 Jing-Jin-Ji’s opportunity to lead 11
4 Case studies from the U.S. and Europe 14
germany: Policy design and dispatch rules 16
Texas: Institutional changes and a new approach 24 to transmission investments
5 Recommended elements for Jing-Jin-Ji renewable 31 energy integration pilot region
About the Authors 34
Acknowledgements 35
References 36

3
GoInG foR Gold:CHAMPIonIng ReneWAbLe InTegRATIon In JIng-JIn-JI
China is shifting to an energy system based on increasing percentages of clean power. Although China now leads the world in installations of wind and solar power (with 129 GW of connected
wind capacity and 44 GW of solar PV as of 2015), the country has struggled to integrate the energy from wind and solar into power grids. But it can make progress by selectively adopting best practices from other countries and states facing the same challenges.
Specifically, we believe that China—in particular, the Beijing-Tianjin-Hebei region (known as “Jing-Jin-Ji”), where the 2022 Winter Olympics will be held—can pilot renewable integration policies similar to those adopted in Germany and Texas. Germany and Texas have each succeeded in reducing wasted, or “curtailed,” wind power by adding transmission and changing market rules and grid operations. These two locations are excellent case studies for Jing-Jin-Ji for several reasons: renewable energy production in Germany and Texas is roughly the same distance from densely populated
1. ExECUTIvE SUmmARy
PlAnnEd loCATIonS foR ThE 2022 wInTER olymPIC EvEnTS
Beijing- Ice events
yanqing- Alpine events
Zhangjiakouolympic village- nordic / Freestyle Skiing
The 2022 Winter Olympic events will be spread out across downtown Beijing, the county of Yanqing, and Zhangjiakou city in Hebei province.

The Paulson Institute
Executive Summary
4
urban areas as those in the Jing-Jin-Ji region. Jing-Jin-Ji’s population is similar to that of Germany and larger than that of Texas, and its electricity consumption is on par with that of both places. Finally, Germany and Texas both had to make difficult policy changes to enable renewable energy integration.
In this report, we recommend a pilot of renewable energy integration covering the entirety of Jing-Jin-Ji that incorporates the following features:
h Establishing clear timelines for reducing curtailment of renewable energy in the region. The examples of Germany and Texas suggest that 4-5 years is sufficient time for completing the investments and policy changes needed to reduce renewable energy curtailment to as low as 1%. Achieving such a target will require a clear plan and timeline for action.
h Improving coordination of transmission planning with renewable power additions within Jing-Jin-Ji, along with accelerating investments in transmission to ensure that the region can meet clean energy targets.
h Testing a regional spot market across the entire Jing-Jin-Ji region. The present design of China’s feed-in tariff policy and lack of a spot power market make renewable energy appear artificially expensive relative to other choices.
h Expanding dispatch to enable renewable energy to reach the entire Jing-Jin-Ji region whenever it is available, merging planning and control activities where needed. This change, which was essential in both Germany and Texas, will require a shift in the way the grid companies operate.
The 2022 Winter Olympics are an important catalyst for integrating renewable energy in Jing-Jin-Ji. As Beijing and Zhangjiakou prepare to co-host the Games, both are pursuing ambitious strategies to show progress on resolving air quality problems and showcase clean energy technology. Zhangjiakou is focusing on scaling up renewable energy, while nearby Beijing is promoting large-scale adoption of electric vehicles. What better way to promote clean energy than to link the two cities’ efforts explicitly, powering Beijing’s clean vehicle fleet with wind and solar from Zhangjiakou? Ensuring that clean energy from Zhangjiakou can reach all areas of Jing-Jin-Ji would also represent a tangible achievement of efforts to promote economic integration across this region. If Jing-Jin-Ji can resolve some of its biggest renewable energy challenges, these policies can be replicated nationally and even globally.
As Beijing and Zhangjiakou prepare to co-host the Games, both are pursuing ambitious strategies to show progress on resolving air quality problems and showcase clean energy technology.

5
GoInG foR Gold:CHAMPIonIng ReneWAbLe InTegRATIon In JIng-JIn-JI
DeFInITIonS
Balancing and balancing areas: Balancing refers to real-time or near-real-time actions taken by the grid operator to balance generation with consumption, to ensure reliable operation of the power system. Generation and consumption of electricity may be balanced over a specific area that may cross political or grid operator boundaries, as is the case in Germany.
Curtailment: A reduction in a specific generator’s energy output from what it could otherwise produce given available resources.1 Intermittent wind and solar generation in China often face curtailment by the grid operator.
demand response: Actions taken by utilities, system operators, or electricity customers to reduce energy demand at specific times in response to price signals and other incentives during periods of high demand, or to shift power use to times when more low-cost power is available.
Economic dispatch: The operation of generation facilities according to the merit order (see definition) to produce energy at the lowest cost to reliably serve consumers, recognizing any operational limits of generation and transmission facilities.2 Under economic dispatch, generators with the lowest marginal cost of production are the first ones to be brought online to meet demand, and the plants with the highest marginal costs are the last to be brought online. Dispatching generation in this way minimizes the cost of producing electricity.
Green dispatch (or environmental dispatch): A form of economic dispatch that accounts for the environmental costs of generation in addition to fuel and other marginal costs. Green dispatch can be implemented by taking into account the environmental cost to society of air and water emissions, for example, and including these costs in the merit order ranking of different power plants. In general, renewable energy such as wind and solar have priority in green dispatch.
marginal cost, variable cost, and total cost of production: In economics, marginal cost is the change in the total cost of producing one additional unit of a good. In the power sector, wind and solar plants generally have zero or near zero marginal costs of production, because the fuel for such facilities (wind and sun) are free and operation is very inexpensive. Marginal cost of production is distinct from the total cost of production, which includes all costs such as capital costs. Marginal cost of production is also distinct from the variable cost of production, which averages the fuel and other operating cost across all units produced by a facility, but excludes capital and other fixed costs.
merit order: Ranking available sources of electricity generation by ascending order of marginal cost of production. Ideally, this ranking also includes the cost of emissions; see also “green dispatch.” A merit order does not necessarily require a wholesale power market.
Spot markets, intra-day markets, and day-ahead markets: In general, a spot market is one in which financial instruments or commodities (such as electricity) are traded for immediate delivery, as opposed to delivery at another time or date. For electricity, however, the term “spot market” may also apply to day-ahead power markets—a market for electricity that closes at midnight the day prior to when the electricity will be delivered—as well as to intra-day markets, where buyers and sellers can contract for power purchases within the same day.3 Such markets are distinguished from long-term power contracts that may cover power purchases over a period of one or more months or one or more years.
variable renewable energy: Electricity production from wind and solar resources is both variable (fluctuating throughout the day) and uncertain; this variability and uncertainty pose challenges for grid operation and dispatch.

The Paulson Institute
overview of China’s renewable energy challenges
6
The seriousness of climate change is now recognized around the world, by developing and industrialized countries alike. The Paris climate accord of December 2015, in which nearly 200 nations committed for the first time to a universal agreement to reduce carbon emissions, is powerful evidence of this recognition. In China, leaders are taking steps to combat climate change, many of which are laid out in the country’s 13th Five-Year Plan, which included for the first time a national cap on overall energy consumption and increased targets for non-fossil fuel energy sources.
One of the most important questions is how to transition from traditional high-carbon energy sources like coal to low- or zero-carbon sources like wind, solar, geothermal, and wave power. The good news is that the falling costs of renewable energy technologies over the past few years—for example, the cost of solar photovoltaic modules has fallen 75% in the past five years, while wind turbine costs declined by 30%—have brought the vision of a global clean energy transition significantly closer. 4
2. ovERvIEw of ChInA’S REnEwABlE EnERGy ChAllEnGES
CHINA WIND CURTAILMENT RATES IN INTERNATIONAL COMPARISON
Over 20%10%-20%Under 10%N/A
% of power output curtailed in 2015
16%
14%
12%
10%
8%
6%
4%
2%
0%TexasGermanyHebeiChina (national)
Curtailment affects most regions with high wind capacity in China; in 2015 curtailment reached 15% at the national level.
Source: NEA, 2016

7
GoInG foR Gold:CHAMPIonIng ReneWAbLe InTegRATIon In JIng-JIn-JI
China leads on wind and solar capacity, lags on integration
No nation has invested more in renewable energy than China. China now has more wind capacity than any country in the world—129 GW of grid-connected wind as of year-end 20155—and is on track to surpass its 2020 target of 200 GW ahead of schedule.6 China is also investing heavily in solar PV generation capacity, reaching an estimated 44 GW by the end of 2015.7
China’s economy reaps many benefits from these investments, including clean energy, jobs related to making and installing wind and solar, and a leading position in global clean energy manufacturing. Given the long-term growth prospects in clean energy worldwide, as well as China’s targets for peaking carbon emissions before 2030 and producing 15% of primary energy from non-fossil fuels by 2020,8 the investments China has made in clean energy in recent years are likely to pay dividends for decades to come, especially if China can use the energy these sources produce more efficiently.
While China leads in terms of wind and solar capacity, its energy production from these sources lags behind other countries. In 2015, the U.S. produced more electricity from wind than China (190 TWh of output in the U.S. as compared to 185 TWh in China) with 75 GW of wind installed—just 58% of China’s total connected wind capacity.9 One reason is that much of the energy solar and wind can produce in China is “curtailed” or wasted. In 2015, China’s wind curtailment reached 15%,10 a sharp increase from 8% in 2014.11 Solar curtailment reached 11% in the first three quarters of 2015.12
wInd And SolAR CAPACITy (Gw) In ChInA And ThE woRld, 2015
Source: Irena, GWEC, and others; note China wind capacity represents grid-connected wind only
wind, Gw Solar Pv, Gw129
75
45
25 23
14 11 10 9 9 6
China
U.S.
germ
any
India
Spain U.K
.
Canad
a
Fran
ce Italy
brazil
Swed
en
44
40
34
26
19
97 5 5
China
germ
any
Japa
nU.S.
Italy
U,K.
Fran
ceSp
ain
Austra
liaInd
ia
5
In comparison with other countries, China ranks first in terms of both wind and solar capacity.

The Paulson Institute
overview of China’s renewable energy challenges
8
Resolving curtailment is critical to achieving China’s clean energy and emissions goals. Indeed, the joint statement that the U.S. and China announced in September 2015, ahead of the Paris climate change conference, declared that China will implement a new “green dispatch” that will prioritize power generation from renewable sources.13 China is in the midst of a power sector reform effort, ultimately aiming towards what President Xi Jinping has called an “energy revolution” in both the supply and demand of electricity. This transformation will reduce overall energy consumption as well as expand non-fossil sources of energy.14 Ultimately, renewable energy integration is critical not just to fixing renewable curtailment, but to achieving President Xi’s full vision of a true revolution in energy supply and demand.
Curtailment causes and consequences
Simply using more clean energy from installed capacity would represent a quick win for both the global climate and China’s economy. Wind and solar energy have zero cost of production, and so failing to use the energy they could produce once installed represents an economic loss. From 2011 to 2015, wind curtailment cost China’s energy sector RMB 51 billion and resulted in otherwise avoidable coal consumption of 430 million tons.15
Many factors contribute to China’s high renewable energy curtailment rates, as we discussed in greater detail in the Paulson Institute’s 2015 power sector report, Deepening Reform to Reduce Emissions, Improve Air Quality and Promote Economic Growth.16 These factors include:
ComPARISon of wInd CAPACITy And PRodUCTIon In ChInA And ThE U.S. In 2015
Capacity (gW) Production (TWh)
75
190
129
ChinaU.S. 185
Source: Windpower Monthly
In 2015, China produced less energy from wind despite much more wind capacity installed than the U.S.
Note: China capacity shown represents grid-connected capacity only.
BY THE NUMBERS
RmB 51 billion 200,000 new Evs
430 million tons of coal
42,500 Eiffel Towers
... and resulted in unneeded coal
consumption of 430 million tons
- a weight equal to 42,500 Eiffel Towers.
From 2011 to 2015, wind curtailment
cost China's energy sector RMB 51 billion - enough money to buy
200,000 new EVs

9
GoInG foR Gold:CHAMPIonIng ReneWAbLe InTegRATIon In JIng-JIn-JI
Remote location of most renewable energy in China: Wind and solar curtailment are most severe in sparsely populated regions such as Gansu, Xinjiang, and Inner Mongolia, which have high wind and solar capacity relative to local power demand, and are distant from densely populated coastal provinces. Wind and solar plants have developed overcapacity in these remote regions due to tariff design—namely, fixed feed-in tariffs that encourage development of wind and solar in regions with the best resources—as well as the speed of construction of renewable plants relative to that of transmission lines that could carry renewable energy to regions with greater electricity demand.
dispatch based on monthly and annual generation plans and lack of a spot market: Under China’s present generation planning approach, power generators are compensated based on hours of operation, which are set by monthly and annual generation contracts. With some exceptions for efficiency or emission levels, each coal plant operating in China is entitled to an approximately equal number of operating hours per year to recover its operating and capital costs.17 When renewable power plants come online, they are essentially treated as competitors to the coal plants, because the renewable plants reduce the coal plants’ operational hours and therefore revenue.18 The lack of a spot power market, in which generators could compete on the basis of the lowest marginal cost of production as opposed to prices set by feed-in tariffs or long-term contracts, puts renewable energy at a disadvantage.19 In China, wind and solar are currently granted regulated feed-in tariffs, set at high price levels to encourage construction of new capacity. The amount of money paid to renewable generators for each unit of energy they produce consists of a fixed on-grid tariff set by the government, plus a subsidy paid by the government from funds collected from electricity consumers through a surcharge. However, since the on-grid tariff for renewable energy is set higher than the power price of many coal plants, the wind and solar power price is uncompetitive with coal power prices in many regions. The structure of power markets in many countries avoids this problem by enabling wind and solar plants to bid into the intra-day market at their production cost, generally near zero.*
Uncoordinated planning and approvals for transmission and generation: In China, wind and solar development have concentrated in the country’s sunniest and windiest areas, designated and approved by the local government.20 Many Chinese regions also have an excess of coal power capacity, also approved by local government.21 Transmission planning and investment are not well coordinated with generation investments. As a result, there is often a mismatch between national energy policy goals and actual investments in transmission and generation at provincial
From 2011 to 2015, wind curtailment cost China’s energy sector RMB 51 billion and resulted in otherwise avoidable coal consumption of 430 million tons.
* In germany, many renewable plants receive feed-in tariffs, but these are distinct from the price at which wind and solar bid into the intra-day market. In areas of the U.S. with wholesale power markets, the price the wind and solar plants receive for the power they generate in an intra-day market is the average price, which is determined by the market clearing price for each period of the day. In addition, wind and solar may receive various subsidies, such as tax credits.

The Paulson Institute
overview of China’s renewable energy challenges
10
and regional levels.22 Partly to address this, China’s March 2015 power reform document, Deepening Reform of the Power Sector, stressed the importance of more comprehensive, integrated planning at each level.23
A related issue is that transmission planning is biased in favor of coal power. The dominant thinking has been that new transmission lines should be fully utilized;24 that presents a problem for renewable electricity, which is by nature intermittent. Transmission lines are expensive, so it’s understandable to look at each line in terms of its potential utilization. Indeed, that was also the predominant practice in U.S. and European transmission planning until recently. To enable a high penetration of renewable energy, it will likely be necessary for China to evaluate new transmission investments more systematically, in the context of making the entire power sector cleaner.
limited inter-regional power trading: Despite construction of new inter-provincial transmission in recent years, and despite high levels of renewable energy curtailment, the country has seen little change in the amount of electricity transferred between provinces.25 To maximize local tax revenue and help local coal power and coal mining companies, local officials prefer provincial self-sufficiency in terms of electricity supply and demand. Importing power, including clean energy, would reduce local tax revenues and potentially hurt local coal companies.26 Recent policy decisions promote cross-provincial power trading, including quotas for renewable energy transmission, and anticipate the development of tradable renewable energy certificates.27 Still, such policies may be insufficient to overcome local protectionism.
Currently, China has adopted a large number of pilot policies related to resolving curtailment and improving renewable integration, but a heavy focus of current pilot projects is on using renewable energy locally,28 often by attracting more high-energy businesses to the area in order to increase local demand.* China’s wind and solar curtailment are worst in a handful of provinces, such as Gansu, Inner Mongolia, and Jilin, which are distant from the country’s heavily populated coastal region. Similarly, Zhangjiakou’s renewable energy plan calls for a significant boost to local energy demand. Given that China has capped the country’s total energy use to 5 billion metric tons of coal equivalent by 2020, boosting local electricity demand by attracting new industry may actually work against national climate goals.** For this reason, in this report we suggest a different region for a renewable energy integration pilot—specifically the Jing-Jin-Ji region, which has a combination of characteristics that might make renewable energy integration feasible, provided the right policies are put in place.
* The explanation for this focus on local demand may be a combination of insufficient transmission, insufficient local authority over transmission planning or power sector reform, and the sense that in the short term it isn’t feasible to resolve curtailment with steps such as market reform or changes to transmission planning.
** Pilots of winter heating from wind energy could reduce coal-heating emissions locally, with potential benefits for air quality. However, as of 2016 these efforts are restricted to small-scale pilots, neither absorbing a significant fraction of renewable energy nor displacing a significant share of coal heating.
11
GoInG foR Gold:CHAMPIonIng ReneWAbLe InTegRATIon In JIng-JIn-JI
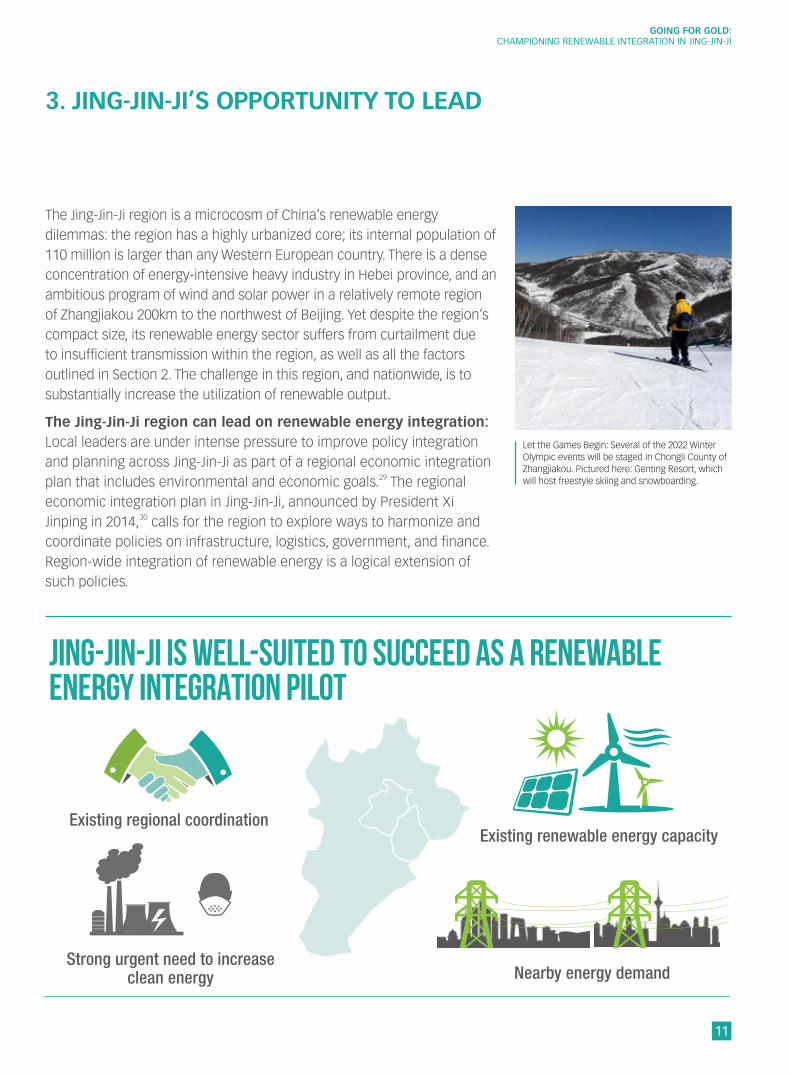
The Jing-Jin-Ji region is a microcosm of China’s renewable energy dilemmas: the region has a highly urbanized core; its internal population of 110 million is larger than any Western European country. There is a dense concentration of energy-intensive heavy industry in Hebei province, and an ambitious program of wind and solar power in a relatively remote region of Zhangjiakou 200km to the northwest of Beijing. Yet despite the region’s compact size, its renewable energy sector suffers from curtailment due to insufficient transmission within the region, as well as all the factors outlined in Section 2. The challenge in this region, and nationwide, is to substantially increase the utilization of renewable output.
The Jing-Jin-Ji region can lead on renewable energy integration: Local leaders are under intense pressure to improve policy integration and planning across Jing-Jin-Ji as part of a regional economic integration plan that includes environmental and economic goals.29 The regional economic integration plan in Jing-Jin-Ji, announced by President Xi Jinping in 2014,30 calls for the region to explore ways to harmonize and coordinate policies on infrastructure, logistics, government, and finance. Region-wide integration of renewable energy is a logical extension of such policies.
3. JInG-JIn-JI’S oPPoRTUnITy To lEAd
Let the Games Begin: Several of the 2022 Winter Olympic events will be staged in Chongli County of Zhangjiakou. Pictured here: Genting Resort, which will host freestyle skiing and snowboarding.
JING-JIN-JI IS WELL-SUITED TO SUCCEED AS A RENEWABLE ENERGY INTEGRATION PILOT
Existing regional coordination
Strong urgent need to increase clean energy
Existing renewable energy capacity
Nearby energy demand

The Paulson Institute
Jing-Jin-Ji’s opportunity to lead
12
The high-profile region also has plans to scale up clean energy in preparation for the 2022 Winter Olympics. In July 2015, in connection with the Olympics, Zhangjiakou was named as China’s first nationally designated Renewable Energy Zone.31 Beijing, meanwhile, is promoting new-energy vehicles—especially electric vehicles (EVs) and their charging stations—to reduce transportation emissions, setting a target of having an EV market of 600,000 vehicles in 2020, 75% of which are expected to be privately owned.32 The renewable zone-designated Zhangjiakou can and should be paired with Beijing to form a Jing-Jin-Ji renewable integration pilot region, with a specific timeline and maximum allowable curtailment rate of renewable energy.
The region is poised to benefit significantly from such an ambitious renewable integration plan. While Jing-Jin-Ji currently derives most of its energy from coal, the region ranks fourth in China for total wind capacity and seventh in solar PV.33 As of 2015, Hebei had 10 GW of grid-connected wind capacity and 2.4 GW of solar PV.34 The province’s wind power was curtailed roughly 10% of its operating hours,35 below the national average but still high by international standards. Zhangjiakou had 8 GW of wind and solar capacity at the end of 2015, and plans to grow this figure to 50 GW by 2030. That would be more than the capacity possessed by all but three countries in the world (China itself, Germany and the U.S.) today.36
Yet Zhangjiakou’s local electricity demand is only 1.85 GW, and transmission capacity to other areas within Jing-Jin-Ji is only 5.5 GW.37 As a result, Beijing–just 200 kilometers away–cannot benefit from the clean, renewable energy current produced in Zhangjiakou now, let alone what will be added in the next five years. In 2014, Zhangjiakou’s curtailment rate reportedly reached 30%.38 Zhangjiakou curtailment could worsen unless there are significant new transmission investments designed specifically for absorbing renewable energy and sending it to other regions.
The renewable zone-designated Zhangjiakou can and should be paired with Beijing to form a Jing-Jin-Ji renewable integration pilot region, with a specific timeline and maximum allowable curtailment rate of renewable energy.
Smoggy Days: The Jing-Jin-Ji region has made international news over the past several years for its chronic air quality problems and has strong political will to ramp up clean energy use.

13
GoInG foR Gold:CHAMPIonIng ReneWAbLe InTegRATIon In JIng-JIn-JI
ZHANGJIAKOU’S STRATEGIES FOR RENEWABLE INTEGRATION
Zhangjiakou is focused on a variety of strategies for improving renewable integration: as part of the framework for establishing the city as a national renewable energy demonstration zone, leaders of the future Olympic co-host foresee seven ways that it can work to improve renewable integration in the city, most of which focus on changes to electricity demand39:
1. Growing electricity demand from service sectors that will benefit from the Olympics, such as tourism, the food and beverages industry, and logistics
2. Strategically increasing electricity demand from new economy sectors such as data centers
3. Increasing rural electricity demand
4. Promoting electric transportation, including EVs for public vehicles, taxis, and tourism
5. Expanding electric heating for new buildings, reaching 16 million square meters in 2020 and 90 million square meters in 2030
6. Generating hydrogen from wind power, starting with a 10 MW wind electrolysis station
7. Encouraging local industries, such as big data centers, to preferentially consume renewable energy locally, such as by purchasing otherwise curtailed energy
While these strategies all have merit, the city’s overall focus on boosting local electricity demand has the potential to work against the government’s efforts to cap total energy use by 2020. Expanding the Zhangjiakou pilot to cover the entire region of Jing-Jin-Ji, and shift its focus from renewable capacity to renewable integration, could reduce the curtailment rate as well as lead to more efficient overall use of energy.
Solar Pv, Gw wind, Gw
hEBEI REnEwABlE EnERGy InSTAllEd CAPACITy In RElATIon To oThER PRovInCES (AS of 2015 yEAR End)
Source: Paulson Institute, based on NEA data, 2015
China’s Hebei province ranks seventh nationally in terms of installed solar PV capacity and fourth in terms of wind capacity.
6.15.7 5.6
4.94.2
3.12.4
1.6 1.3 1.2
16.9
12.5
8.26.7 6.4 5.0 4.4
24.3
10.2
7.2

The Paulson Institute
Case studies from the U.S. and Europe
14
While no international case study can serve as the perfect model for renewable integration in Jing-Jin-Ji, Texas and Germany are sufficiently similar—in both geographic distances, and in terms of their ratio of renewable energy to demand—to serve as models. Both cases clearly illustrate that with the right regional pilot size and the right policies, it is possible to reduce renewable curtailment rates to as low as 1%.
Both Germany (population 82 million) and Texas (population 28 million) are comparable with Jing-Jin-Ji in key respects. Both have large land areas and, like Jing-Jin-Ji, their renewable energy capacity is located far from the centers of greatest regional electricity demand. In both cases, significant changes to transmission and distribution planning and investment policies were needed to reach higher penetrations of renewable energy. Both have achieved very low levels of curtailment (at or below 1% on an annual basis for wind generation), and in both cases, significant changes to dispatch and market rules were required before this could be accomplished. Notably, both Texas and Germany are still perfecting policies to integrate even larger amounts of renewable energy. Germany plans to reach 80%
4. CASE STUdIES fRom ThE U.S. And EURoPE Show REnEwABlE EnERGy InTEGRATIon IS ChAllEnGInG BUT AChIEvABlE wITh ThE RIGhT PolICIES
Source: Paulson Institute
ComPARISon of REnEwABlE PEnETRATIon In GERmAny, TExAS And JInG-JIn-JI
Wind+solar generation as % of demand
25%
20%
15%
10%
5%
0%
Jing-Jin-JiTexasGermany
Germany and Texas have higher renewable penetration rates (GW of wind and solar generation as percentage of overall demand) with far lower rates of curtailment than Jing-Jin-Ji.

15
GoInG foR Gold:CHAMPIonIng ReneWAbLe InTegRATIon In JIng-JIn-JI
renewable electricity by 2050, while Texas (which has no percentage target for renewable electricity) anticipates almost doubling solar and wind capacity between 2015 and 2017.40
Ultimately, the German and Texas cases show that a region the size of Jing-Jin-Ji could achieve a high degree of renewable energy integration through accelerated regional transmission planning for renewable energy, integrating dispatch over a wider region, and introducing spot markets with short trading intervals to match the variability of wind and solar resources.
GERmAny, TExAS And JInG-JIn-JI:ComPARISon of REGIonAl ChARACTERISTICS
Population (millions)
82
28
110
58
4050
gW avg power demand gW wind and solar
83
1713
Wind curtailment
1.1%0.5%
10.0%
germany Texas Jing-Jin-Ji
Source: Paulson Institute
Texas and Germany are sufficiently similar to Jing-Jin-Ji—in both geographic distances, and in terms of their ratio of renewable energy to demand—to serve as models.
Germany Texas Jing-Jin-Ji
200 km 400 km
200 km
Urban AreaUrban Area
Urban Area

The Paulson Institute
Case studies from the U.S. and Europe
16
Germany: Policy design and dispatch rulesoverview: Germany is a world leader in integrating variable renewable energy. Wind and solar made up about 25% of net electricity supply in 2015.41 In one day of May 2016, renewable energy supplied almost 90% of the nation’s power, albeit for a short time in midday.42 Looking at capacity, at the end of 2015, Germany had installed approximately 43.8 GW of wind and 39.6 GW of solar PV.43 Germany’s combined wind and solar capacity is far higher than the country’s average peak power demand in 2015 of around 50 GW.44 Today, Germany has achieved a low level of renewable energy curtailment at approximately 1%. Thus, while China has surpassed Germany as the leading country in terms of absolute installed wind or solar capacity, Germany still has the highest penetration of variable renewable energy—arguably a better measure of clean energy progress than capacity alone.
The role of distributed energy: Distributed solar PV energy in particular has played a key role in enabling the country to absorb large amounts of renewable energy on the distribution grid level, avoiding large investments that might have been needed if solar policies had focused mainly on utility-scale plants. The majority of solar PV capacity in Germany is in distributed rooftop systems,45 which came about through the country’s former policy of offering homeowners that installed PV generous 20-year feed-in tariffs at subsidized levels. The prevalence of distributed solar, especially rooftop solar, means that energy production is located close to electricity demand. This didn’t eliminate the need for new large-scale transmission and distribution investments for distributed energy integration. Rather, in Germany, grid investments have tended to emphasize installations of equipment to strengthen the flexibility of the distribution grid, as opposed to high-voltage transmission.46
Source: Agora-Energiewende
GRowTh In GERmAny wInd And SolAR Pv CAPACITy And PERCEnTAGE of ElECTRICITy ThEy SUPPly
In Germany, the percentage of electricity supplied from wind and solar has risen in tandem with capacity.

17
GoInG foR Gold:CHAMPIonIng ReneWAbLe InTegRATIon In JIng-JIn-JI
TIMELINE OF GERMANY RENEWABLE ENERGY INTEGRATION
1994
- Renewable Energy Law establishing 20-year fixed Feed-In-Tariffs for wind and solar is passed
1998
- Germany orders formerly vertically integrated utilities to separate transmission and generation companies
2000
- Changes to Renewable Energy Law sets target of obtaining 12.5% of electricity from renewable energy by 2010, increases feed-in tariffs for wind and solar
- Spot power trading market established
2005
- Germany’s Federal Network Agency starts overseeing the power grid and gas market
- Federal Network Agency study suggests major new transmission and distribution investments needed to integrate wind and solar energy
2009
- Federal Network Agency approves 1,876 km of new transmission
- Germany's Transmission System Operators (TSOs) integrate their balancing markets to dispatch renewable energy across boundaries of four transmission systems
2011
- Hourly intra-day power market switches to 15-minute intra-day power market to facilitate dispatch of renewable energy
- Together with several neighboring countries, Germany forms the International Grid Control Cooperation
- Parliament passes transmission planning law, making the Federal Network Agency responsible for planning and approval of transmission lines that cross state boundaries
2014
- Changes to the Renewable Energy Law require Germany to get 40-45% of electricity from renewable energy by 2025, 55-60% by 2035, and 90% by 2050
2015
- European Transparency Platform for electricity, hosted by the European Network Transmission System Operators for Electricity (ENTSO-E), goes live
2016
- U.K. integrated into Central European balancing market
- Germany wind and solar reach a new record of meeting 90% of the country's electricity demand for a short period; wind and solar to provide over 25% of electricity for the full year
The Paulson Institute
Case studies from the U.S. and Europe
18
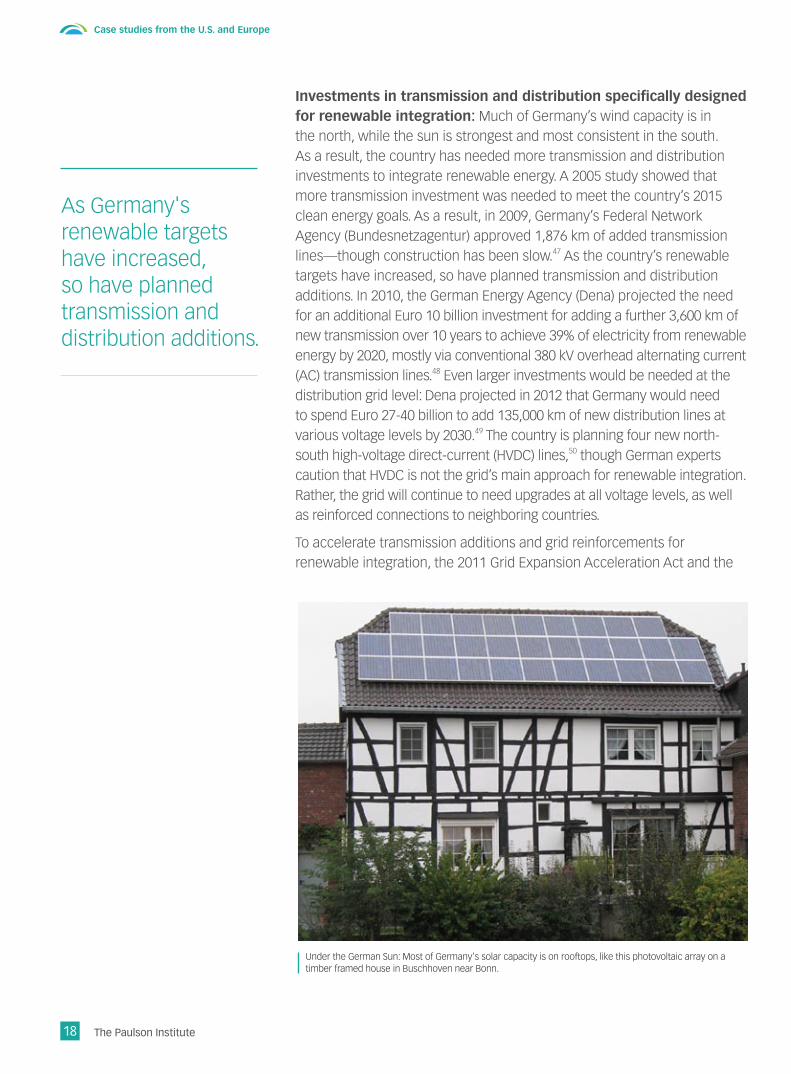
Investments in transmission and distribution specifically designed for renewable integration: Much of Germany’s wind capacity is in the north, while the sun is strongest and most consistent in the south. As a result, the country has needed more transmission and distribution investments to integrate renewable energy. A 2005 study showed that more transmission investment was needed to meet the country’s 2015 clean energy goals. As a result, in 2009, Germany’s Federal Network Agency (Bundesnetzagentur) approved 1,876 km of added transmission lines—though construction has been slow.47 As the country’s renewable targets have increased, so have planned transmission and distribution additions. In 2010, the German Energy Agency (Dena) projected the need for an additional Euro 10 billion investment for adding a further 3,600 km of new transmission over 10 years to achieve 39% of electricity from renewable energy by 2020, mostly via conventional 380 kV overhead alternating current (AC) transmission lines.48 Even larger investments would be needed at the distribution grid level: Dena projected in 2012 that Germany would need to spend Euro 27-40 billion to add 135,000 km of new distribution lines at various voltage levels by 2030.49 The country is planning four new north-south high-voltage direct-current (HVDC) lines,50 though German experts caution that HVDC is not the grid’s main approach for renewable integration. Rather, the grid will continue to need upgrades at all voltage levels, as well as reinforced connections to neighboring countries.
To accelerate transmission additions and grid reinforcements for renewable integration, the 2011 Grid Expansion Acceleration Act and the
Under the German Sun: Most of Germany's solar capacity is on rooftops, like this photovoltaic array on a timber framed house in Buschhoven near Bonn.
As Germany's renewable targets have increased, so have planned transmission and distribution additions.

19
GoInG foR Gold:CHAMPIonIng ReneWAbLe InTegRATIon In JIng-JIn-JI
Energy Act gave additional authority to the Federal Network Agency to conduct grid planning.51 Essentially, the law required grid planners and grid companies to work together to ensure sufficient transmission and distribution to enable all renewable energy to reach end customers. As of 2015, Germany’s grid companies, called Transmission System Operators (TSOs), are required to publish Network Development Plans every two years to describe how they will reinforce the grid to meet future changes in demand and supply—including renewable energy.52 The Federal Network Agency is responsible for planning and approving the plans, while the TSOs are responsible for construction.53 The cost of transmission and distribution system reinforcements are shared across electricity customers in Germany, depending on the location and voltage of the upgrades.
Germany’s renewable energy policies have raised some questions about cost.54 Studies have shown that introducing a maximum permissible threshold for renewable curtailment, instead of requiring full use of renewable energy, could reduce the cost of transmission and distribution investment needed over the next 10 years.55 The question is, what is the optimal level of renewable curtailment? Based on modeling of costs and benefits, Germany is currently considering legislation that would set a transmission planning threshold for maximum permissible annual curtailment of 3% across each TSO’s service territory.56 Previously, TSOs have been obligated to build sufficient transmission to ensure that all renewable energy can be fully utilized.
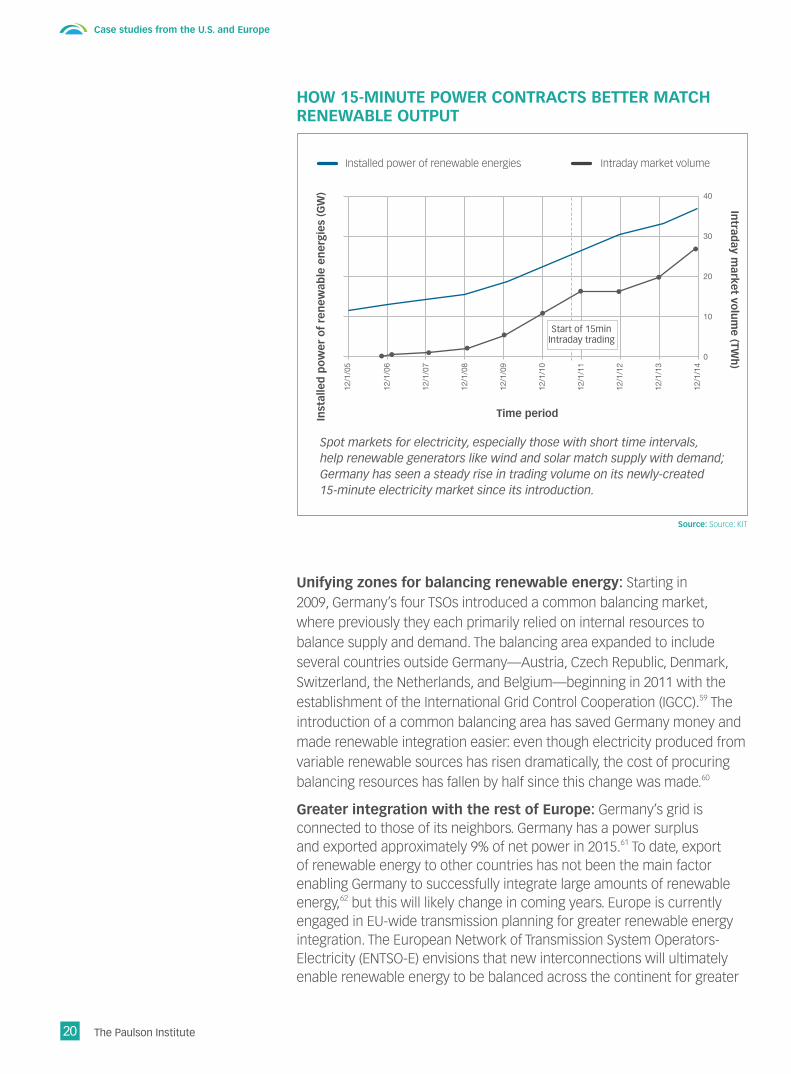
Establishing a strong and transparent intra-day power market: Under Germany’s Renewable Energy Law, renewable energy—such as wind, solar, wave, and hydro—is given dispatch priority. In the country’s electricity market, wind and solar occupy the least-cost position in the generation merit order. Wind and solar enjoy this position because Germany has an efficient intra-day market; when power is traded the same day as it is needed, dispatch is not based solely on daily, monthly, or annual plans or contracts. Germany’s intra-day power market began trading in 2006, and volumes have grown as the country has added more renewable energy. The country switched from an hourly market to 15-minute intra-day trading in 2011, and since then the intra-day power market volume has almost doubled.57
Germany is also boosting transparency to enable customers, generators, and other market participants to have far greater awareness of power supply, demand, and generation on every country’s power grid. These data are available through a European electricity transparency platform, which went live in January 2015.58 Transparency strengthens energy markets by both encouraging greater flexibility of supply and demand in the short term, and improving the efficiency of long-term investment decisions for both transmission and generation.
Under Germany’s Renewable Energy Law, renewable energy is given dispatch priority. In the country’s electricity market, wind and solar occupy the least-cost position in the generation merit order.
The Paulson Institute
Case studies from the U.S. and Europe
20
Unifying zones for balancing renewable energy: Starting in 2009, Germany’s four TSOs introduced a common balancing market, where previously they each primarily relied on internal resources to balance supply and demand. The balancing area expanded to include several countries outside Germany—Austria, Czech Republic, Denmark, Switzerland, the Netherlands, and Belgium—beginning in 2011 with the establishment of the International Grid Control Cooperation (IGCC).59 The introduction of a common balancing area has saved Germany money and made renewable integration easier: even though electricity produced from variable renewable sources has risen dramatically, the cost of procuring balancing resources has fallen by half since this change was made.60
Greater integration with the rest of Europe: Germany’s grid is connected to those of its neighbors. Germany has a power surplus and exported approximately 9% of net power in 2015.61 To date, export of renewable energy to other countries has not been the main factor enabling Germany to successfully integrate large amounts of renewable energy,62 but this will likely change in coming years. Europe is currently engaged in EU-wide transmission planning for greater renewable energy integration. The European Network of Transmission System Operators-Electricity (ENTSO-E) envisions that new interconnections will ultimately enable renewable energy to be balanced across the continent for greater
Source: Source: KIT
Spot markets for electricity, especially those with short time intervals, help renewable generators like wind and solar match supply with demand; Germany has seen a steady rise in trading volume on its newly-created 15-minute electricity market since its introduction.
how 15-mInUTE PowER ConTRACTS BETTER mATCh REnEwABlE oUTPUT
Installed power of renewable energies
Inst
alle
d p
ow
er o
f re
new
able
en
ergi
es (
Gw
)
Intrad
ay market vo
lum
e (Twh
)
Time period
Intraday market volume
Start of 15minIntraday trading
40
30
20
10
012
/1/0
5
12/1
/06
12/1
/07
12/1
/08
12/1
/09
12/1
/10
12/1
/11
12/1
/12
12/1
/13
12/1
/14

21
GoInG foR Gold:CHAMPIonIng ReneWAbLe InTegRATIon In JIng-JIn-JI
Source: 50Hertz
GERmAny’S foUR TSoS And ThE InTERnATIonAl GRId ConTRol CooPERATIon AREA
Balancing electricity dispatch across historic political boundaries (within Germany and near Germany) has been key to reducing the cost of integrating renewable energy.
SWITZERLAND
BELGIUM
NETHERLANDS
DENMARK
GERmAny
CZECH REPUBLIC
AUSTRIA
LUXEMBOURG
Tennet
Amprion
Transnet bW
5ohertz Tennet
elia
Swissgrid
APg
CePS
energinet DK
efficiency and flexibility.63
Policies to integrate renewable energy by increasing flexibility of supply and demand: To date, Germany has not relied heavily on demand-side policies to enable greater integration of renewable energy,64 but this is changing. Electric vehicle charging and electric heating and cooling are being considered both to reduce carbon emissions from transport and heating while also utilizing locally-available renewable energy.65 Starting in 2009, Germany required new buildings to obtain a share of heating from renewable sources.66 Compared to neighboring Denmark, Germany has relatively fewer cities that rely on district heating, but, like Denmark, the country’s district heating plants are designed to cycle flexibly, which helps combined-heat-and-power plants respond to changes in renewable energy output.67 Today, policymakers are prioritizing initiatives that can increase the flexibility of demand through greater use of demand-response technologies as well as market mechanisms such as demand-response aggregation services.68

The Paulson Institute
Case studies from the U.S. and Europe
22
Key takeaways from Germany:
h focusing on distributed solar enabled Germany to reduce the cost of transmission investments needed for its transition to clean energy. Most of Germany’s solar capacity is on rooftops, and therefore is already located near electricity demand. While the country needed to strengthen its transmission and distribution system, the level of investment was far smaller than if the country had focused exclusively on utility-scale renewable energy.
h Germany expanded investments in transmission and distribution to enable renewable energy, with the costs paid for by utility customers. Notably, German law required its grid planning agency and four transmission system operators to plan and build the grid to enable all renewable energy to reach customers.
h Germany established a strong and transparent intra-day power market to ensure that renewable energy takes priority and that customers benefit from the low marginal costs of energy provided by wind and solar.
h Germany linked balancing markets within the country as well as with several neighboring countries. The result is that Germany is able to integrate more renewable energy at lower cost.
h To date, Germany has not relied on boosting local demand to integrate high levels of renewable energy. Boosting demand and, more importantly, increasing the flexibility of demand are being considered as a strategy for renewable integration only after taking other steps to reform dispatch, markets, and transmission planning.
23
GoInG foR Gold:CHAMPIonIng ReneWAbLe InTegRATIon In JIng-JIn-JI
expert Voices: germany
Andreas Kuhlmann, Chief Executive, German Energy Agency (Deutsche Energie-Agentur, DENA)
what are the most important changes made by Germany to enable high utilization of renewable energy on the grid? what can China learn from this case?
I visited Zhangjiakou in March 2016, and as I understand it, one of the main questions in that region is how to integrate renewable energy into the grid. I hear a lot about China and State Grid working on connecting grids globally, an interesting debate. We should not neglect though to discuss possibilities and necessities on the regional distribution grid level. So the current issue that I see is more with the national transmission and regional distribution grids.
That’s what we see in Germany as well, where we have had to scale up the distribution system rapidly. In those regions with a strong existing distribution grid, there is less pressure for new investment, and good distribution grids can also become smart distribution grids by implementing the latest technology, which enables us to integrate more renewable energy while avoiding some costly transmission investments. The direction in Germany is towards intelligent and flexible grid management as a means to absorb variable energy. At the same time, Germany expects to make significant transmission and distribution grid investments over the next 10 years with the intent of integrating even more renewable energy—the latest estimate is over US$ 45.2 billion (RMB 293 billion) combined for both transmission and distribution investment.
how do you plan new transmission capacity—should transmission additions rise in tandem with new renewable generation?
Basically, the grid expansion and renewable energy expansion should have the same pace, but not necessarily with the intent of absorbing every last kWh from renewable energy—our studies show that this would result in excessive cost for the ratepayer. Therefore, current draft legislation limits the grid extension obligations of the system operators according to the principle that curtailment of 3% of annual renewable energy production is acceptable for grid planning. Renewable energy will still have priority dispatch and be compensated at 95% for any curtailment. In those regions where you have a very strong existing distribution grid, there may be less need to extend the transmission grid. The other point is that if you strengthen distribution grids, you can make them smart distribution grids with newer technology. That is helpful for integrating renewable energy into the system.

The Paulson Institute
Case studies from the U.S. and Europe
24
Texas: Institutional changes and a new approach to transmission investmentsoverview: Texas is one of the largest U.S. states by population and land area, and today is also the nation’s leading producer of wind energy. The state’s success at clean energy generation would have been impossible without changes to state law, such as accelerated transmission approvals and dispatch of renewable energy over a wider area. Thanks to difficult policy decisions made by the Texas government, the state not only met its goals for renewable capacity, but reduced wind curtailment from 17% to 0.5% in five years. While Texas spent US$ 7 billion on new transmission designed specifically to connect wind plants, paid for by the state’s electricity customers, the investments are paying for themselves by producing savings as high as US$ 3.3 billion per year.69
Texas is unique among the contiguous 48 U.S. states in that its grid functions in some respects as an island. The Electric Reliability Council of Texas (ERCOT) is the grid operator for the state of Texas and is managed separately from the rest of the U.S. power grid; ERCOT is therefore dependent upon its own resources to meet its electricity needs.70 In 1996, in response to federal regulations, ERCOT became the first Independent System Operator (ISO) established in the U.S.71 Given the state’s characteristics as an “electricity island,” it is impressive that ERCOT has managed to integrate a fairly high amount of variable renewable energy in the span of just a few years. Wind supplied 12% of total electricity demand
GRowTh In TExAS (ERCoT) wInd And SolAR Pv CAPACITy And PERCEnTAGE of ElECTRICITy ThEy SUPPly
In Texas, the percentage of electricity supplied from wind has risen in tandem with capacity.
Note: solar PV capacity while currently small, is projected to rise rapidly in 2016 and 2017.
Source: Electric Reliability Council of Texas (ERCOT)

25
GoInG foR Gold:CHAMPIonIng ReneWAbLe InTegRATIon In JIng-JIn-JI
After investing US$ 7 billion to add 5,790 circuit-km of new transmission specifically for integrating wind, curtailment in Texas dropped dramatically.
TExAS TRAnSmISSIon InvESTmEnTS And CURTAIlmEnT
Source: Paulson Institute and electric Reliability Council of Texas (eRCoT)
2009
18.0%
16.0%
14.0%
12.0%
10.0%
8.0%
6.0%
4.0%
2.0%
0.0%
17.0%
0.5%
2014
in ERCOT in 2015, up from around 6% in 2009,72 and with recent additions the proportion is rising quickly. In the months of November and December 2015, wind supplied 18% of total electricity demand.73 On several days in late 2015, wind supplied over 43% of power demand in the state.74 ERCOT had about 16 GW of wind capacity and 300 MW of solar PV as of late 2015,75 as compared to average power demand of 40 GW.
Texas’s path to a high penetration of variable renewable energy was not straightforward. In 2002, Texas established a renewable portfolio standard requiring its utilities to procure a rising percentage of wind energy, but conventional transmission planning processes were insufficient to integrate large amounts of wind generated in remote areas.76 Specifically, in the area of McCamey, Texas, 760 MW of wind were installed in a region with just 400 MW of transmission capacity, leading to wind curtailment of about 32% in 2002.77
Changes to state laws on transmission planning and investment: Previously, grid planning in Texas required a firm commitment from generation companies to use the transmission lines that would be built—and to make a legally-binding financial commitment to use the lines equal to the total cost of the transmission additions.* Wind generation companies were unwilling to do so.78 Adding new transmission for wind therefore became a “chicken-and-egg” dilemma: wind developers wouldn’t add new capacity without more transmission, but transmission couldn’t be added without commitments that wind developers were unable to make.
* In other words, the wind developer would be required to deposit funds in a bank equal to the cost of the lines, as a guarantee against its commitment to use the lines as stipulated.
BY THE NUMBERS
In 2014, the American Wind energy Association estimated the economic benefits to Texas of wind energy
at US$ 3.3 billion per year
$3.3 BIl

The Paulson Institute
Case studies from the U.S. and Europe
26
In 2005, the Texas legislature addressed the problem with legislation requiring the state’s power sector regulator, the Public Utilities Commission of Texas (PUCT), to increase renewable energy generation in West Texas. The law required the PUCT to establish Competitive Renewable Energy Zones (CREZ)79 and gave PUCT additional authority to approve transmission projects for CREZ based on anticipated future growth in renewable energy production.80 Instead of assuming that new transmission lines should be fully utilized by newly-added generation (as had been the case previously), planners began to evaluate new transmission investments based on how they contributed to the overall ability of the system to integrate larger amounts of remotely-sited renewable energy.
The transmission investments needed for renewable energy in Texas have been significant: the CREZ transmission line additions cost an estimated US$ 7 billion and added 3,600 circuit-miles (5790 circuit-km) of lines—mostly 345 kV lines—to carry roughly 18.5 GW of wind and solar energy.81 This works out to roughly US$ 2 million per mile (US$ 1.25 million per km). The transmission capacity added for the purposes of CREZ are paid through the rate base of the utilities.82 In other words, the total cost of transmission is added to the electricity bills of all customers.
TExAS TRAnSmISSIon AddITIonS UndER CREZ
Source: electric Reliability Council of Texas (eRCoT)
Transmission additions in Texas’ Competitive Renewable Energy Zones (CREZ), depicted by the green lines, led to a dramatic reduction in wind curtailment.

27
GoInG foR Gold:CHAMPIonIng ReneWAbLe InTegRATIon In JIng-JIn-JI
TIMELINE OF MAJOR POWER MARKET POLICY CHANGES IN TEXAS
1995
- Texas passes legislation deregulating wholesale generation market and giving ERCOT authority for ensuring fair access to the power grid for all market participants
1996
- ERCOT becomes the first Independent System Operator in the U.S., responsible for managing grid planning and dispatch
1999
- Texas passes legislation requiring utilities to separate transmission, generation, and power delivery businesses
2001
- Nine previously separate control areas are unified into a single control area to facilitate sending power throughout the state
2002
- Retail competition begins
- Renewable Portfolio Standard requires addition of 2 GW wind power (target later raised)
2010
- ERCOT begins operation of statewide nodal electricity market and abolishes four separate wholesale price zones
2005
- Texas passes legislation requiring Public Utilities Commission to identify Competitive Renewable Energy Zones (CREZ) with up to 18 GW of wind power, and accelerates approval process for transmission lines to connect wind in these zones
- Renewable Portfolio Standard requirement to is raised 5.8 GW of wind capacity by 2015 and cumulative 10 GW of wind by 2025
2009
- CREZ transmission proposal is approved and lines begin construction, prior to which full-year wind curtailment reaches 17%
2007
- Texas Public Utilities Commission completes study of CREZ transmission line options
2013
- CREZ transmission lines mainly completed in December
2015
- ERCOT reaches nearly 16 GW of wind installed, well beyond the state's mandate of 10 GW by 2025
2014
- Full-year wind curtailment rate falls to 0.5%
2016
- Texas achieves new record of 45% of electricity from wind on one day in March

The Paulson Institute
Jing-Jin-Ji’s opportunity to lead
28
ERCOT analysis showed that new transmission capacity would need to rise approximately in tandem with newly added wind capacity, but that wind output would hit maximum levels statewide on only a small number of hours during the year.83 To achieve a fair balance between the costs and benefits of new transmission, planners set a 3% maximum allowable curtailment threshold across all wind plants state-wide.84 The 3% maximum planning threshold was vetted via an open stakeholder process, but in setting this threshold ERCOT did not rely on extensive cost estimates using simulations of multiple scenarios. Grid planners simply lacked the time for such analysis, given that the 2005 CREZ law specified that planners at ERCOT had just six months to formulate the CREZ transmission plan.85 This is relevant for grid planning in China: grid planners and regulators rarely have the luxury of time for exhaustive scenario planning, and must rely on reasonable assumptions about where new variable renewable capacity is likely to be added given regional and national policy goals.
Largely as a result of the new transmission line additions, which were completed gradually between 2011 and the end of 2013, wind curtailment in Texas fell from 17% in 2009 to under 0.5% in 2014.86 During this period, ERCOT wind capacity rose from 9 GW to 16 GW.87 While the transmission lines built under CREZ still have excess capacity for new wind additions, Texas is now debating whether to extend the project to allow the state to expand wind and solar investments still further.88
Changes to power markets: the story of CREZ in Texas shows how mechanisms to fund new transmission investments, and plan such investments to match the course of development of new renewable energy, can help solve the curtailment problem in a single region. However, the success of CREZ must be understood within the larger U.S. regulatory context. Texas benefitted from the existence of real-time wholesale power
Lone Star Wind: Texas is one of the largest U.S. states by population and land area, and also the nation’s leading producer of wind energy.

29
GoInG foR Gold:CHAMPIonIng ReneWAbLe InTegRATIon In JIng-JIn-JI
markets that favor lowest-marginal-cost generation (such as wind and solar), and an independent transmission operator that dispatches plants according to a least cost methodology (also called economic dispatch). These market and regulatory institutions are widespread in the U.S. today, but Texas was an early pioneer—and had to overcome some difficult challenges in the early years, such as unexpected price spikes.
Texas deregulated its wholesale power market in the 1990s and in 2000 introduced an intra-day power market, in which dispatch automatically favors least-marginal cost production from wind and solar. Thus, one key market element was already in place when the state began adding wind capacity. However, several additional changes were needed to enable a smooth transition to a renewable future. Similar to Germany, Texas changed dispatch to ensure the grid could respond better to rapid changes in renewable output. The intra-day power market in Texas shifted from 15-minute intervals—already shorter than in many countries or states—to a 5-minute interval better suited to high penetration of variable renewable energy.89
Changes to dispatch: related to changes in policies around power markets, the state also needed to make changes to historic dispatch practices, especially to enable renewable energy to flow more easily around the state. In 2001-2002, the state merged nine separate control areas into a single control area covering all of ERCOT, to reduce the cost of transmission congestion and balancing load.90 Then, in 2010, the state shifted from a market based on four separate balancing zones to full locational marginal pricing across the state,91 effectively improving the efficiency of the market statewide while also providing market signals that can enable long-term investments in transmission or generation to ease congestion. Thus, Texas had to transform itself from a patchwork of dispatch areas and pricing zones to a single, unified state market for electricity. State grid planners describe these changes as just as essential to renewable integration as the transmission investments under CREZ.
Key takeaways from the Texas case:
h The state changed its laws to accelerate transmission investment specifically designed for renewable energy integration. Note that Texas transitioned from assuming new transmission lines should have high utilization to building transmission specifically for achieving renewable energy targets, without requiring new lines be utilized at a specific level. The state planned its transmission system using a 3% maximum acceptable curtailment level for renewable energy.
h Texas established a strong and transparent intra-day power market to incentivize renewable energy. The state’s power markets now enable generators to bid power into 5-minute electricity markets, a time interval more suitable to intermittent output from wind and solar farms. The existence of such markets lowers the cost of integrating renewable energy.
Largely as a result of the new transmission line additions, which were completed gradually between 2011 and the end of 2013, wind curtailment in Texas fell from 17% in 2009 to under 0.5% in 2014.

The Paulson Institute
Case studies from the U.S. and Europe
30
expert Voices: Texas
warren lasher, Director of System Planning at ERCOT
what are the most important changes made by Texas to enable high utilization of renewable energy on the grid?
The transmission investments made under CREZ have clearly enabled the successful integration of large amounts of wind that we have seen today. I would consider CREZ to be a major success.
I would add that changes to the wholesale power market in Texas were also very important. Texas shifted from a wholesale power market that had four zones to one with full locational marginal pricing, with different real-time prices at each of the various nodes in the Texas grid. We also moved from 15-minute dispatch to 5-minute dispatch. Without these changes, I don’t think we would be able to integrate the wind power that we have.
Currently, Texas is looking at demand response, electrification of transportation, and desalination as ways to make electricity demand more responsive to the supply of renewable energy. But up until the present, the transmission investments and changes to wholesale power markets have played a larger role by far than these new directions.
how do you plan new transmission capacity—should transmission additions rise in tandem with new renewable generation?
In Texas, we found that transmission capacity should rise at a certain proportion of the amount of renewable energy capacity coming online. Wind farms don’t all produce power at the same time, and in ERCOT today, we have over 15 GW of wind capacity in West Texas, but this capacity only produces more than 11 GW of output around 4.5% of the year. We designed the CREZ transmission additions with a goal of having no more than 3% overall wind curtailment in ERCOT. To arrive at that threshold, we relied mainly on stakeholder discussions rather than conducting costly and time-consuming simulations of multiple transmission scenarios.
h To ensure clean power reaches customers at the lowest cost, Texas unified dispatch and balancing zones to balance electricity supply and demand across the entire state. This facilitates the priority use of renewable energy while also providing market signals to encourage future transmission and generation investment.
h Despite having larger wind capacity located in sparsely populated areas far away from demand centers, the state did not try to boost local demand in areas with high wind. Texas is now considering measures to increase the flexibility of electricity demand, but only as a supplemental strategy after having fully implemented reforms to markets, dispatch, and transmission planning.

31
GoInG foR Gold:CHAMPIonIng ReneWAbLe InTegRATIon In JIng-JIn-JI
The international examples of Germany and Texas show that a region with the same approximate distance between areas of renewable energy production and electricity demand as in Jing-Jin-Ji, with a similar ratio of renewable energy production to regional electricity demand, and facing some of the same challenges of rapid growth of renewable energy, can achieve high levels of renewable penetration with very low levels of curtailment. However, achieving these goals would require adopting policies that require substantial changes in grid operations and transmission planning.
In this section we propose an overall framework and strategies for a new type of renewable energy integration pilot that incorporates the entire Jing-Jin-Ji region, and suggest basic elements to distinguish this pilot from existing ones.
Policy recommendations
We recommend establishing Jing-Jin-Ji as a regional renewable energy integration pilot, explicitly linking renewable energy produced in Zhangjiakou with centers of high electricity demand, such as Beijing and Tianjin. A pilot would include the following features:
The right capacity and curtailment goals: China and Jing-Jin-Ji already have a variety of targets related to renewable capacity and utilization, but the National Energy Administration (NEA), in collaboration with State Grid and provincial officials, should add targets and timelines for reducing curtailment and adding renewables-specific transmission capacity. As the Texas and Germany cases clearly show, policy decisions are essential to incentivize tight coordination between grid planning and investment on one hand with policy goals for non-fossil energy on the other. A Jing-Jin-Ji pilot focused on renewable integration would include quantified targets and clear timelines for (1) increasing transmission capacity specifically designed to improve integration of renewable energy across the region from high wind and solar energy producing parts of Jing-Jin-Ji; (2) resolving transmission bottlenecks within the region, particularly between Zhangjiakou and the large cities of Beijing and Tianjin; and (3) reducing curtailment below a reasonable technical threshold, to be determined
5. RECommEndEd ElEmEnTS foR A JInG-JIn-JI REnEwABlE EnERGy InTEGRATIon PIloT REGIon
We recommend establishing Jing-Jin-Ji as a regional renewable energy integration pilot, explicitly linking renewable energy produced in Zhangjiakou with centers of high electricity demand, such as Beijing and Tianjin.

The Paulson Institute
Recommended elements for a Jing-Jin-Ji renewable energy integration pilot region
32
through additional analysis. Based on the cases of Germany and Texas, it should be feasible for Jing-Jin-Ji to achieve a maximum curtailment threshold of 3% by 2022.
The right transmission and distribution design: Based on experiences in other regions with rapidly rising renewable capacity, internal Jing-Jin-Ji transmission and distribution need to be expanded to ensure that renewable capacity can be used over a wide geographical area—as opposed to focusing on boosting local demand. In principle, regional transmission should rise in tandem with renewable capacity, with cost recovery through electricity tariffs. While policies encouraging electric vehicles, hydrogen production, and heating from renewable electricity have merit, to date such policies have not been major factors in enabling international leaders like Texas and Germany to achieve high renewable penetration rates with far lower rates of curtailed energy. Taken too far, encouraging demand could also contradict efforts to improve energy efficiency and increase the overall share of clean energy in the energy mix.
The right pricing and dispatch structures: Various studies have shown that coal power prices in China do not capture the full societal cost of coal use.92 At the same time, the design of China’s feed-in tariff policy and lack of a spot power market make renewable energy appear artificially expensive relative to other choices. In contrast, in the U.S. and Germany, renewable energy is typically viewed as having the lowest marginal cost—at least, from the perspective of dispatch—due to its position on the merit order dispatch curve. An intra-day or day-ahead power market and balancing area that cover a wide geographical region, such as all of Jing-Jin-Ji, would help reflect the economic benefits to consumers and the economy of prioritizing wind and solar dispatch.
Olympic Blue: The 2022 Games present an opportunity for China to accelerate the Jing-Jin-Ji region’s existing goals for clean energy and air quality.
33
GoInG foR Gold:CHAMPIonIng ReneWAbLe InTegRATIon In JIng-JIn-JI
Conclusion
The Jing-Jin-Ji region includes the high-tech cities of Beijing and Tianjin, scenic mountains, rural farm villages, and energy-guzzling industrial centers. Due to a combination of geographical factors and a high concentration of energy-intensive industry, the region suffers from chronic air quality problems. This already high-profile region, which will host the Winter Olympics in 2022, presents a compelling opportunity to test out a renewable energy integration pilot area, precisely because its high energy consumption could potentially allow the region to absorb a large amount of energy from renewable sources such as wind and solar.
Based on the examples of Germany and Texas, Jing-Jin-Ji has the potential to improve region-wide renewable energy integration in order to improve air quality and raise the region’s share of non-fossil electricity. For this reason, we suggest that instead of focusing on the relatively small area of Zhangjiakou as a demonstration zone for renewable energy, China’s government should expand the concept into a larger pilot project for renewable energy integration covering the entire region of Jing-Jin-Ji—thereby linking high renewable supply in one area of Hebei to the centers of demand in the rest of this larger, highly-populated area. Such a pilot would include three key elements: (1) improving regional transmission planning, (2) expanding dispatch to cover the whole region, and (3) piloting a regional spot market. While implementing these policy suggestions is by no means straightforward, we believe such major policy changes are necessary to achieving a true revolution in energy production and consumption. Resolving the immense challenge of renewable integration in Jing-Jin-Ji would allow the region to become a model for replication nationally and even globally.
Based on the examples of Germany and Texas, Jing-Jin-Ji has the potential to improve region-wide renewable energy integration in order to improve air quality and raise the region’s share of non-fossil electricity.

The Paulson Institute34
Anders hove
Anders Hove is Associate Director for China Research at the Paulson Institute. He guides the Institute’s research work related to China air quality and climate change, developing insights related to policy, market and technology solutions. He also provides research support for other Institute programs. Hove has more than 15 years of public and private sector experience related to energy policy and markets, including nine years on Wall Street and six years in China. He began his career as an energy policy analyst with the Rand Corporation in Washington, DC, then performed equity research in the electric utilities and oil services sectors with Deutsche Bank AG and Jefferies and Co. In 2007, at the initial stages of the solar boom, Anders worked for a hedge fund making private equity investments in clean energy technologies and projects, particularly solar. In 2010, Anders relocated to Beijing, where he became director of research analytics at the China Greentech Initiative. In 2012, Anders went to Azure International where he managed the Cleantech Advisory team, working on advisory projects focused on energy storage, solar, wind and smart grid technologies.
Hove has both a Master of Science and a Bachelor of Science in Political Science from MIT, and he is a Chartered Financial Analyst. He is the author of numerous reports and studies related to the energy sector in China.
Kevin mo, Ph.d.
Dr. Kevin Mo is the Managing Director of the Paulson Institute Representative Office, in charge of climate and sustainable urbanization. He has more than 20 years of experience in strategizing and implementing climate and energy policies in both the U.S. and China, with an extensive international network of central and local governments, think tanks, NGOs, research institutes, state-owned enterprises, multinational companies, as well as small and medium-sized enterprises. He is a frequent speaker on energy policies and sustainable development at international conferences and workshops.
Prior to joining the Paulson Institute, Dr. Mo was the director of the China Buildings Program with the Energy Foundation for over five years, managing a grant portfolio of building energy efficiency, green buildings, appliance energy efficiency, and non-CO2 emissions abatement. He funded policy research projects that led to the Green Building National Action Plan, revision of national residential and commercial building energy standards, revision of national green building standards, and over 40 national mandatory appliance energy efficiency standards and labels. He also supported many initiatives, including energy big-data analytics, smart energy, zero net energy buildings, low-carbon supply chain, and digital energy label enforcement.
Dr. Mo has served as a technical advisor to the U.S. team in the U.S.-China Clean Energy Research Center’s Building Energy Efficiency Consortium and a senior advisor to the MOHURD building energy standard committee. Prior to that, he also served as director of international sustainable buildings projects and a senior specialist at the Natural Resources Defense Council (NRDC), first in the Washington, D.C. office and then in the Beijing office. He also worked for six years as a research engineer with the NAHB Research Center in Maryland, conducting research in advanced building energy efficiency technologies and materials funded by the U.S. DOE, EPA, and HUD as well as the private sector. He managed a U.S. national energy efficiency housing award program and won the EEBA 25th Anniversary Legacy Award in 2007. He taught at Tsinghua University for three years and won the 2nd Science and Technology Progress Award from China’s Ministry of Culture in 1995 for a feasibility study on the National Center for the Performing Arts.
Dr. Mo holds a Ph.D. from Carnegie Mellon University, a master’s degree from Tsinghua University, and a bachelor’s degree from Zhejiang University.
ABoUT ThE AUThoRS
About the authors

35
GoInG foR Gold:CHAMPIonIng ReneWAbLe InTegRATIon In JIng-JIn-JI
ACKnowlEdGEmEnTS
The Paulson Institute is grateful for the support of many esteemed individuals and organizations for their insights and contributions to this paper. We express our sincere gratitude to the individuals and organizations listed below for their contributions:
U.S. and European power sector expertsLars bregnbæk, Chief Modelling Expert, China National Renewable Energy Centre (CNREC)
Max Dupuy, China Program Director, Regulatory Assistance Project
Andreas Kuhlmann, Chief Executive, German Energy Agency (DENA)
nanna Foller Larsen, Economist – Market Development and International Cooperation at Energinet.dk
Warren Lasher, Director of System Planning at ERCOT
grant Mack, Energy Policy Advisor to the Commissioner, California Energy Commission (CEC)
Stephanie Ropenus, Senior Associate, European Energy Cooperation, Agora Energiewende
Production
We would also like to thank the Paulson Institute team for their invaluable support throughout various stages of paper development, in particular: Chelsea Eakin, Dinda Elliott, Kate Gordon, Hortense Halle-Yang, Cindy Jiang (姜新燕), Tina Ren (任婷婷), Lily Lou (娄雪莲) and Amy Wan (万婧)
Photos
Credit is due to Flickr’s D J Clark, as well as Thomas Tillotson, and Shutterstock's Anton_Ivanov and Dallas Events.

The Paulson Institute36
References
REfEREnCES
1. Lori Bird, Jaquelin Cochran, and Xi Wang, “Wind and Solar Energy Curtailment: Experience and Practices in the United States,” U.S. National Renewable Energy Laboratory, NREL/TP-6A20-60983, 2014, http://www.nrel.gov/docs/fy14osti/60983.pdf.
2. “Economic Dispatch: Concepts, Practices and Issues,” U.S. Federal Energy Regulatory Commission, November 13, 2005, accessed at http://www.ferc.gov/eventcalendar/Files/20051110172953-FERC%20Staff%20Presentation.pdf.
3. “Power Markets,” accessed June 11, 2016 at www.wind-energy-the-facts.org/power-markets.html; “Spot Electricity Market (MPE),” Gestore Mercati Energetici, accessed June 11, 2016, at www.mercatoelttrico.org/en/meercati/mercatoelettrico/mpe.aspx.
4. Michael Taylor et al, “Renewable Power Generation Costs in 2014,” International Renewable Energy Agency (IRENA), January 2015, accessed at http://www.irena.org/documentdownloads/publications/irena_re_power_costs_2014_report.pdf.
5. “国家能源局发布2015年风电产业发展情况,” BJX, February 2, 2016, accessed at http://www.china5e.com/news/news-931782-1.html.
6. “2020年风电2亿千瓦装机目标或提前完成,” Cable ABC, December 9, 2012, http://news.cableabc.com/commentary/20151209026757.html.
7. “2015年光伏发电相关统计数据,” China National Energy Agency, February 5, 2016, accessed at http://guangfu.bjx.com.cn/news/20160205/707267.shtml.
8. Alvin Lin, “How China's 13th Five Year Plan Climate and Energy Targets Accelerate its Transition to Clean Energy,” Natural Resources Defense Council, March 26, 2016, accessed at https://www.nrdc.org/experts/alvin-lin/how-chinas-13th-five-year-plan-climate-and-energy-targets-accelerate-its.
9. Ros Davidson, “US leads global production in 2015,” Windpower Monthly, March 7, 2016, accessed at http://www.windpowermonthly.com/article/1386391/us-leads-global-production-2015.
10. “2014年风电产业监测情况,” National Energy Agency, February 12, 2015, accessed at http://www.nea.gov.cn/2015-02/12/c_133989991.htm.
11. “能源局:2015年全国风电产业继续保持强劲增长势头,” National Energy Agency, February 4, 2016, accessed at http://www.nea.gov.cn/2016-02/04/c_135073627.htm.
12. “能源局公布2015年光伏发电数据 甘肃弃光最严重,” National Energy Administration, February 5, 2016, accessed at http://www.mcshe.com/zcny/252636.html. In 2015, Gansu had solar curtailment of 32% and Xinjiang 25%. John Parnell, “China has installed 9.9GW of solar in 2015 but curtailment issues continue,” PV Tech, October 21, 2015, accessed at http://www.pv-tech.org/news/china_has_installed_9.9gw_of_solar_in_2015_but_curtailment_issues_continue.
13. “The United States and China Issue Joint Presidential Statement on Climate Change with New Domestic Policy Commitments and a Common Vision for an Ambitious Global Climate Agreement in Paris,” U.S. White House, Office of the Press Secretary, September 25, 2015, accessed at https://www.whitehouse.gov/the-press-office/2015/09/25/fact-sheet-united-states-and-china-issue-joint-presidential-statement.
14. “习近平:积极推动我国能源生产和消费革命,” Xinhua, June 13, 2014, accessed at http://news.xinhuanet.com/politics/2014-06/13/c_1111139161.htm.
15. “2011-2015年中国弃风数据统计,” China Wind Energy Net, April 8, 2016, accessed at http://www.fenglifadian.com/news/201604/20732.html.
16. Max Dupuy, Frederick Weston, and Anders Hove, “Power Sector: Deepening reform to Reduce Emissions, Improve Air Quality, and Promote Economic Growth,” Paulson Institute, 2015, accessed at http://www.paulsoninstitute.org/economics-environment/climate-sustainable-urbanization/research/power-sector/.
17. “重点区域风电消纳监管报告 [Report on Wind Absorption in Key Areas],” State Electricity Regulatory Commission (SERC), 2012, accessed at http://www.eeechina.cn/upload/file/电监会重点区域风电消纳监管报告.pdf.
18. “重点区域风电消纳监管报告 [Report on Wind Absorption in Key Areas],” State Electricity Regulatory Commission (SERC), 2012, accessed at http://www.eeechina.cn/upload/file/电监会重点区域风电消纳监管报告.pdf.
19. “能源局下发关于征求做好电力市场建设有关工作的通知(征求意见稿),” China National Energy Administration, March 24, 2016, accessed at http://news.bjx.com.cn/html/20160325/719393.shtml.
20. “发改委叫停风电光伏指标发放 甘肃等试点就近消化,” BJX, April 13, 2016, accessed at http://guangfu.bjx.com.cn/news/20160412/723951.shtml.
21. Lauri Myllyvirta et al., “Is China doubling down on its coal power bubble?” Greenpeace, February 2016, accessed at http://www.greenpeace.org/eastasia/Global/eastasia/publications/reports/climate-energy/2016/Greenpeace_Doubling%20Down%20on%20Coal%20Power%202015%20(update).pdf. See also Yuan Jiahai, “Coal Power Bubble 2,” Greenpeace East Asia, 2016, accessed at http://www.greenpeace.org/eastasia/publications/reports/climate-energy/2016/Coal-Power-Bubble-2/.
22. Fredrich Kahrl and Wang Xuan, “Integrating Renewable Energy Into Power Systems in China: A Technical Primer Electricity Planning,” Regulatory Assistance Project, 2015, accessed at http://www.raponline.org/document/download/id/7823.
23. “中共中央国务院关于进一步深化电力体制改革的若干意见,” National Development and Reform Commission, March 15, 2015, accessed at http://tgs.ndrc.gov.cn/zywj/201601/t20160129_773852.html; “国家能源局关于推进简政放,” China National Energy Agency, June 5, 2016, accessed at http://zfxxgk.nea.gov.cn/auto81/201506/t20150610_1936.htm.
24. Based on discussions with grid officials and experts. For a discussion of the need that policymakers in China see for transmission lines to have high utilization, see “德宝直流等10项典型电网工程投资成效监管报告” National Energy Administration, April 2015, accessed at http://www.cnea.gov.cn/new/2015-5/2015520161250.htm.
25. “国家电力市场2015年完成交易电量7221.4亿千瓦时 比降0.34%,” State Grid Corporation of China, accessed at BJX on April 8, 2016 at http://news.bjx.com.cn/html/20160408/722997-7.shtml.
26. Michael R. Davidson et al., “Towards a political economy framework for wind power: Does China break the mould?” United Nations University, UNU-WIDER, WIDER Working Paper 32/2016, 2016, accessed at https://www.wider.unu.edu/publication/towards-political-economy-framework-wind-power.
27. Renewable energy quotas are included in the Yindong AC power line plan: “国家发展改革委关于放开银东直流,跨区部分送受电计划的复函,” National Development and Reform Commission, March 9, 2016, accessed at http://www.sdpc.gov.cn/zcfb/zcfbtz/201603/t20160309_792337.html. Joint planning of renewable capacity and power lines is discussed in NEA’s work plan for wind interconnection: “能源局发文要求做好2016年度风电并网消纳工作,” Hexun Securities, March 7, 2016, accessed at http://futures.hexun.com/2016-03-17/182818763.html.
28. For summaries of China’s existing pilots, see “国家发展改革委办公厅关于同意甘肃省、内蒙古自治区、吉林省开展可再生能源 就近消纳试点方案的复函,” China National Development and Reform Commission, April 2016, accessed at http://www.ndrc.gov.cn/zcfb/zcfbtz/201604/t20160411_797827.html.
29. “中国提速京津冀一体化发展,” Xinhua, March 6, 2014, accessed at http://news.xinhuanet.com/politics/2014-03/06/c_119638994.htm; “京津冀一体化上升为国家战略,” ifeng, April 9, 2014, accessed at http://finance.ifeng.com/a/20140409/12081267_0.shtml.
30. “中国提速京津冀一体化发展,” Xinhua, March 6, 2014, accessed at http://news.xinhuanet.com/politics/2014-03/06/c_119638994.htm; “京津冀一体化上升为国家战略,” ifeng, April 9, 2014, accessed at http://finance.ifeng.com/a/20140409/12081267_0.shtml.
31. “国家发展改革委关于印发《河北省张家口市可再生能源示范区发展规划》的通知,” National Development and Reform Commission, July 28, 2015, accessed at http://www.sdpc.gov.cn/zcfb/zcfbtz/201507/t20150729_743278.html.
32. “北京市电动汽车充电基础设施专项规划(2016-2020) ,” Beijing City Development and Reform Commission, April 22, 2016, accessed at http://www.d1ev.com/statics/js/kindeditor-4.1.10/attached/file/20160422/20160422124422_31804.pdf.
33. “国家能源局发布2015年风电产业发展情况,” BJX, February 2, 2016, accessed at http://www.china5e.com/news/news-931782-1.html; “国家能源局发布2015年光伏发电相关统计数据,” China National Energ y Agency, February 5, 2016, accessed at http://guangfu.bjx.com.cn/news/20160205/707267.shtml.
34. “国家能源局发布2015年风电产业发展情况,” BJX, February 2, 2016, accessed at http://www.china5e.com/news/news-931782-1.html; “国家能源局发布2015年光伏发电相关统计数据,” China National Energ y Agency, February 5, 2016, accessed at http://guangfu.bjx.com.cn/news/20160205/707267.shtml.

37
GoInG foR Gold:CHAMPIonIng ReneWAbLe InTegRATIon In JIng-JIn-JI
35. “能源局:2015年全国风电产业继续保持强劲增长势头,” National Energy Agency, February 4, 2016, accessed at http://www.nea.gov.cn/2016-02/04/c_135073627.htm.
36. “关于河北省张家口市可再生能源示范区有关情况的汇报,” Zhangjiakou People’s Government, February 2016.
37. “关于河北省张家口市可再生能源示范区有关情况的汇报,” Zhangjiakou People’s Government, February 2016.
38. “每日财经新闻,河北张北弃风率已达30%,网易财经,” Economic News Daily, October 28, 2014, accessed at http://money.163.com/14/1028/00/A9JSTBH600253B0H.html.
39. “关于河北省张家口市可再生能源示范区有关情况的汇报,” Zhangjiakou People’s Government, February 2016.
40. Robert Fares, “Texas Poised to Integrate More Wind, Solar Energy,” Scientific American, March 17, 2016, accessed at blogs.scientificamerican.com/plugged-in/texas-poised-to-integrate-more-wind-solar-energy/.
41. “Annual electricity generation in Germany in 2015,” Fraunhofer Institute, accessed March 21, 2016, at https://www.energy-charts.de/power_inst.htm. Solar is shown at 35 TWh, wind at 85 TWh, and net electricity generation at 479 TWh.
42. Sophie Vorrath, “Renewables Supplied 90% Of Germany’s Electricity On Sunday,” Cleantechnica, May 11, 2016, accessed at http://cleantechnica.com/2016/05/11/renewables-supplied-90-germanys-electricity-sunday/.
43. “Net installed electricity generation capacity in Germany,” Fraunhofer Institute, accessed March 21, 2016, at https://www.energy-charts.de/power_inst.htm. Bruno Burger, “Power Generation from Renewable Energy in Germany – Assessment of 2015,” Fraunhofer Institute for Solar Energy Systems ISE, January 16, 2016, accessed at https://www.ise.fraunhofer.de/en/downloads-englisch/pdf-files-englisch/power-generation-from-renewable-energy-in-germany-assessment-of-2015.pdf.
44. “Revenge of the renewables: How wind and solar play in Germany and Texas,” Plat ts, April 1, 2015, accessed at ht tp://blogs.plat ts.com/2015/04/02/revenge-of-the-renewables-how-wind-and-solar-play-in-germany-and-texas/.
45. Jakob Peter et al., “Germany’s Wind and Solar Deployment 1991-2015 Facts and Lessons Learnt,” Institute of Energy Economics at the University of Cologne (EWI), October 2015, accessed at http://www.ewi.uni-koeln.de/fileadmin/user_upload/Publikationen/Studien/Politik_und_Gesellschaft/2015/2015-10_Germanys_Wind_and_Solar_Deployment_1991-2015_Case_Study.pdf.
46. Hans Poser et al, “Development And Integration Of Renewable Energy: Lessons Learned From Germany,” FinAdvice, July 2014, accessed at http://www.finadvice.ch/files/germany_lessonslearned_final_071014.pdf.
47. Interview with Stephanie Ropenus of Agora-Energiewende, April 8, 2016. See also, “Energie der Zukunf t: Vier ter Monitoring-Bericht zur Energiewende,” Bundesministerium fur Wirstchaft und Energie, 2015, accessed at ht tp://w w w.bmwi.de/DE/Mediathek /publikationen,did=739122.html.
48. “Dena Grid Study II – Integration of Renewable Energy Sources in the German Power Supply System from 2015 – 2020 with an Outlook to 2025,” Dena, 2010, accessed at http://www.uwig.org/Summary_dena_Grid_Study_II.pdf.
49. “Electricity distribution grids require significant expansion for the energy turnaround,” Dena, December 11, 2012, accessed at http://www.dena.de/en/press-releases/pressemitteilungen/electricity-distribution-grids-require-significant-expansion-for-the-energy-turnaround.html.
50. Peter Fairley, “Germany Takes the Lead in HVDC, IEEE Spectrum, April 29, 2013, accessed at http://spectrum.ieee.org/energy/renewables/germany-takes-the-lead-in-hvdc.
51. “ E x p a n s i o n o f t h e e l e c t r i c i t y t r a n s m i s s i o n n e t w o r k s ,” Bundesnet z agentur, acces sed A pr i l 11, 2 016 , a t h t tp: // w w w.bundesnet zagentur.de/c ln _1422 /EN/Areas/Energ y/Companies/ElectricityGridExpansion/ElectricityGridExpansion-node.html.
52. “Federal Cabinet Adopts Bill Amending Laws Regulating Power Line Expansion,” German Energy Blog, March 26, 2015, accessed at http://www.germanenergyblog.de/?p=18278#more-18278.
53. Jakob Peter et al., “Germany’s Wind and Solar Deployment 1991-2015 Facts and Lessons Learnt,” Institute of Energy Economics at the University of Cologne (EWI), October 2015, accessed at http://www.ewi.uni-koeln.de/fileadmin/user_upload/Publikationen/Studien/Politik_und_Gesellschaft/2015/2015-10_Germanys_Wind_and_Solar_Deployment_1991-2015_Case_Study.pdf.
54. Hans Poser et al, “Development And Integration Of Renewable Energy: Lessons Learned From Germany,” FinAdvice, July 2014, accessed at http://www.finadvice.ch/files/germany_lessonslearned_final_071014.pdf.
55. Daniel Fürstenwerth et al, “The Integration Cost of Wind and Solar Power. An Overview of the Debate on the Effects of Adding Wind and Solar Photovoltaic into Power Systems,” Agora Energiewende, December 2015, accessed at https://www.agora-energiewende.de/fileadmin/Projekte/2014/integrationskosten-wind-pv/Agora_Integration_Cost_Wind_PV_web.pdf. See page 39.
56. “The integration of wind energy when paving the way for renewables in Germany,” Agora-Energiewende, November 6, 2015, accessed at https://www.agora-energiewende.de/fileadmin/Projekte/2015/integration-variabler-erneuerbarer-energien-daenemark/EER-Academic_Seminar_No_6-DTU_-_Wind_Integration_in_Germany-Nov2015-SR.pdf; interview with Stephanie Ropenus of Agora-Energiewende, April 8, 2016.
57. Fabian Ocker and Karl-Martin Ehrhart, “The “German paradox” in the balancing power markets,” Institute for Economics, Karlsruhe Institute of Technology (KIT), September 24, 2015, accessed at http://games.econ.kit.edu/img/RSER_final.pdf.
58. “Security of Supply in 2015: Looking Ahead; ENTSO-E Annual Report 2014,” European Network of Transmission System Operators for Electricity (ENTSO-E), 2014, accessed at ht tps://www.entsoe.eu/Documents/Publications/ENTSO-E%20general%20publications/ENTSO-E%20AR%202014.pdf.
59. Fabian Ocker and Karl-Martin Ehrhart, “The “German paradox” in the balancing power markets,” Institute for Economics, Karlsruhe Institute of Technology (KIT), September 24, 2015, accessed at http://games.econ.kit.edu/img/RSER_final.pdf.
60. Fabian Ocker and Karl-Martin Ehrhart, “The “German paradox” in the balancing power markets,” Institute for Economics, Karlsruhe Institute of Technology (KIT), September 24, 2015, accessed at http://games.econ.kit.edu/img/RSER_final.pdf.
61. Calculation based on figures provided by Bruno Burger, “Power Generation from Renewable Energy in Germany – Assessment of 2015,” Fraunhofer Institute for Solar Energy Systems ISE, January 16, 2016, accessed at https://www.ise.fraunhofer.de/en/downloads-englisch/pdf-files-englisch/power-generation-from-renewable-energy-in-germany-assessment-of-2015.pdf. Based on electricity generation of 540 TWh in 2015 (see chart on page 6); 48 TWh was exported, or 9% of electricity generated.
62. Eric Martinot, “How is Germany Integrating and Balancing Renewable Energy Today?” Renewable Energy Futures to 2050, January 2015, accessed at http://www.martinot.info/renewables2050/how-is-germany-integrating-and-balancing-renewable-energy-today.
63. “Security of Supply in 2015: Looking Ahead; ENTSO-E Annual Report 2014,” European Network of Transmission System Operators for Electricity (ENTSO-E), 2014, accessed at ht tps://www.entsoe.eu/Documents/Publications/ENTSO-E%20general%20publications/ENTSO-E%20AR%202014.pdf.
64. Germany had only about 1 GW of demand-response bid into the monthly market as of 2015. See Mackay Miller et al, “Status Report on Power System Transformation: A 21st Century Power Partnership Report, U.S. National Renewable Energy Laboratory, NREL/TP-6A20-63366, May 2015, accessed at http://www.nrel.gov/docs/fy15osti/63366.pdf.
65. Interview with Stephanie Ropenus of Agora-Energiewende, April 8, 2016.
66. Baerbel Epp, “Germany: Renewable Heating Law Pushes Solar Thermal in New Buildings,” Global Solar Thermal Energy Council, February 19, 2013, accessed at http://www.solarthermalworld.org/content/germany-renewable-heating-law-pushes-solar-thermal-new-buildings.
67. Eric Martinot, “Grid Integration of Renewable Energy: Flexibility, Innovation, Experience,” Prepublication Version, Annual Review of Environment and Resources, February 2016, accessed at http://martinot.info/Martinot_AR2016_grid_integration_prepub.pdf.
68. Germany had only about 1 GW of demand-response bid into the monthly market as of 2015. See Mackay Miller et al, “Status Report on Power System Transformation: A 21st Century Power Partnership Report, U.S. National Renewable Energy Laboratory, NREL/TP-6A20-63366, May 2015, accessed at http://www.nrel.gov/docs/fy15osti/63366.pdf.
69. Peter Kelly-Detwiler, “Benefits of Texas Wind Energy Estimated to Exceed $3.3 Billion Annually,” Forbes, November 10, 2014, accessed at http://www.forbes.com/sites/peterdetwiler/2014/11/10/benefits-of-texas-wind-energy-estimated-to-exceed-3-3-annually/#7e5d43414eb2.
70. “Deregulated Electricity in Texas: A History of Retail Competition,

The Paulson Institute38 The Paulson Institue38
References
Appendix E, Electric Reliability Council of Texas,” Texas Coalition for Affordable Power, 2012, accessed at http://historyofderegulation.tcaptx.com/chapter/appendix-e-electric-reliability-council-of-texas/.
71. “History,” Electric Reliability Council of Texas, accessed March 21, 2016, at http://www.ercot.com/about/profile/history/.
72. “Energy use in ERCOT region grows 2.2 percent in 2015,” Electric Reliability Council of Texas (ERCOT), January 15, 2016, accessed at http://ercot.com/news/press_releases/show/86617. For 2009 wind percentage, see “2014 total energy use in ERCOT region up by 2.5 percent from 2013,” Electric Reliability Council of Texas (ERCOT), January 22, 2015, accessed at http://ercot.com/news/press_releases/show/51654.
73. See “Energy by Fuel Type, 2015,” in spreadsheet ERCOT2015DE, accessed at http://ercot.com/news/press_releases/show/86617.
74. Karl Cates and Seth Feaster, “Data Bite: A Wind-Generation Record in the Lone Star State,” Institute for Energy Economics and Financial Analysis (IEEFA), December 16, 2015, accessed at http://ieefa.org/data-bite-a-wind-generation-record-in-the-lone-star-state/.
75. Karl Cates and Seth Feaster, “Data Bite: A Wind-Generation Record in the Lone Star State,” Institute for Energy Economics and Financial Analysis (IEEFA), December 16, 2015, accessed at http://ieefa.org/data-bite-a-wind-generation-record-in-the-lone-star-state/. “Texas Solar,” Solar Energy Industry Association, accessed March 21, 2016, at http://www.seia.org/state-solar-policy/texas.
76. David Harlbut, “Competitive Renewable Energy Zones in Texas,” National Renewable Energy Laboratory (NREL), presentation at National Governors Association Center for Best Practices Clean Energy States Grant Program Workshop, November 18, 2008, accessed at https://www.michigan.gov/documents/mpsc/tx-crez-background_258398_7.pdf.
77. David Harlbut, “Competitive Renewable Energy Zones in Texas,” National Renewable Energy Laboratory (NREL), presentation at National Governors Association Center for Best Practices Clean Energy States Grant Program Workshop, November 18, 2008, accessed at https://www.michigan.gov/documents/mpsc/tx-crez-background_258398_7.pdf.
78. David Harlbut, “Competitive Renewable Energy Zones in Texas,” National Renewable Energy Laboratory (NREL), presentation at National Governors Association Center for Best Practices Clean Energy States Grant Program Workshop, November 18, 2008, accessed at https://www.michigan.gov/documents/mpsc/tx-crez-background_258398_7.pdf.
79. “Our History,” Wind Energy Transmission Texas, LLC, accessed March 21, 2016, at http://www.windenergyoftexas.com/history/.
80. David Harlbut, “Competitive Renewable Energy Zones in Texas,” National Renewable Energy Laboratory (NREL), presentation at National Governors Association Center for Best Practices Clean Energy States Grant Program Workshop, November 18, 2008, accessed at https://www.michigan.gov/documents/mpsc/tx-crez-background_258398_7.pdf.
81. Ryan Wiser and Mark Bolinger, “2014 Wind Technologies Market Report,” U.S. Department of Energy, August 2015, accessed at http://www.energy.gov/sites/prod/files/2015/08/f25/2014-Wind-Technologies-Market-Report-8.7.pdf.
82. David Harlbut, “Competitive Renewable Energy Zones in Texas,” National Renewable Energy Laboratory (NREL), presentation at National Governors Association Center for Best Practices Clean Energy States Grant Program Workshop, November 18, 2008, accessed at https://www.michigan.gov/documents/mpsc/tx-crez-background_258398_7.pdf.
83. Paulson Institute interview with Warren Lasher, Director of Grid Planning, ERCOT, April 13, 2016.
84. Paulson Institute interview with Warren Lasher, Director of Grid Planning, ERCOT, April 13, 2016.
85. Paulson Institute interview with Warren Lasher, Director of Grid Planning, ERCOT, April 13, 2016.
86. Ryan Wiser and Mark Bolinger, “2014 Wind Technologies Market Report,” U.S. Department of Energy, August 2015, accessed at http://www.energy.gov/sites/prod/files/2015/08/f25/2014-Wind-Technologies-Market-Report-8.7.pdf. For 2009 wind capacity, see April Lee, “Wind generates more than 10% of Texas electricity in 2014,” U.S. Department of Energy, Energy Information Administration, February 19, 2015, accessed at https://www.eia.gov/todayinenergy/detail.cfm?id=20051. For 2015 wind capacity, see Karl Cates and Seth Feaster, “Data Bite: A Wind-Generation Record in the Lone Star State,” Institute for Energy Economics and Financial Analysis (IEEFA), December 16, 2015, accessed at http://ieefa.org/data-bite-a-wind-generation-record-in-the-lone-star-state/.
87. Ryan Wiser and Mark Bolinger, “2014 Wind Technologies Market
Report,” U.S. Department of Energy, August 2015, accessed at http://www.energy.gov/sites/prod/files/2015/08/f25/2014-Wind-Technologies-Market-Report-8.7.pdf. For 2009 wind capacity, see April Lee, “Wind generates more than 10% of Texas electricity in 2014,” U.S. Department of Energy, Energy Information Administration, February 19, 2015, accessed at https://www.eia.gov/todayinenergy/detail.cfm?id=20051. For 2015 wind capacity, see Karl Cates and Seth Feaster, “Data Bite: A Wind-Generation Record in the Lone Star State,” Institute for Energy Economics and Financial Analysis (IEEFA), December 16, 2015, accessed at http://ieefa.org/data-bite-a-wind-generation-record-in-the-lone-star-state/.
88. Paulson Institute interview with Warren Lasher, Director of Grid Planning, ERCOT, April 13, 2016.
89. Paulson Institute interview with Warren Lasher, Director of Grid Planning, ERCOT, April 13, 2016.
90. “Investigations of Bulk Power Markets: ERCOT,” U.S. Federal Energy Regulatory Commission, November 1, 2000, accessed at http://www.ferc.gov/legal/maj-ord-reg/land-docs/ercot.PDF. “The Story of ERCOT,” The Steering Committee of Cities Served by Oncor and The Texas Coalition for Affordable Power, February 2011, accessed at http://tcaptx.com/downloads/THE-STORY-OF-ERCOT.pdf.
91. Paulson Institute interview with Warren Lasher, Director of Grid Planning, ERCOT, April 13, 2016.
92. Teng Fei, “煤炭的真实成本,” Tsinghua University and Natural Resources Defense Council, 2012, accessed at http://www.nrdc.cn/coalcap/console/Public/Uploads/2014/11/06/%E6%8A%A5%E5%91%8A%EF%BC%9A2012%E7%85%A4%E7%82%AD%E7%9A%84%E7%9C%9F%E5%AE%9E%E6%88%90%E6%9C%AC.pdf, or at http://www.nrdc.cn/coalcap/index.php/English/project_content/id/508.

39
GoInG foR Gold:CHAMPIonIng ReneWAbLe InTegRATIon In JIng-JIn-JI