Goetzmann
26
History and the Equity Risk Premium 1 William N. Goetzmann and Roger G. Ibbotson Yale School of Management First Draft: February 26, 2005 Current Draft: October 18, 2005 Abstract: We summarize some of our own past findings and place them in the context of the historical development of the idea of the equity risk premium and its empirical measurement by financial economists. In particular, we focus on how the theory of compensation for investment risk developed in the 20 th century in tandem with the empirical analysis of historical investment performance. Finally, we update our study of the historical performance of the New York Stock Exchange over the period 1792 to the present, and include a measure of the U.S. equity risk premium over more than two centuries. This last section is based upon indices constructed from individual stock and dividend data collected over a decade of research at the Yale School of Management, and contributions of other scholars. JEL: N2, G11 1 This is a draft of a chapter intended for a collection of essays on the equity risk premium edited by Rajnish Mehra . It summarizes our past research related to the equity premium, and places it in historical context. We thank Mehra for the opportunity to contribute, and for his feedback on the research. Please direct all correspondence to about the paper to [email protected].
-
Upload
omar-campbell -
Category
Documents
-
view
217 -
download
0
Transcript of Goetzmann

8/6/2019 Goetzmann
http://slidepdf.com/reader/full/goetzmann 1/26
History and the Equity Risk Premium1
William N. Goetzmann and Roger G. Ibbotson
Yale School of Management
First Draft: February 26, 2005
Current Draft: October 18, 2005
Abstract: We summarize some of our own past findings and place them in the context of
the historical development of the idea of the equity risk premium and its empirical
measurement by financial economists. In particular, we focus on how the theory of
compensation for investment risk developed in the 20th
century in tandem with the
empirical analysis of historical investment performance. Finally, we update our study of
the historical performance of the New York Stock Exchange over the period 1792 to the
present, and include a measure of the U.S. equity risk premium over more than two
centuries. This last section is based upon indices constructed from individual stock and
dividend data collected over a decade of research at the Yale School of Management, and
contributions of other scholars.
JEL: N2, G11
1 This is a draft of a chapter intended for a collection of essays on the equity risk
premium edited by Rajnish Mehra . It summarizes our past research related to the equitypremium, and places it in historical context. We thank Mehra for the opportunity to
contribute, and for his feedback on the research. Please direct all correspondence to aboutthe paper to [email protected].

8/6/2019 Goetzmann
http://slidepdf.com/reader/full/goetzmann 2/26
I. Introduction
The equity premium puzzle posed in Mehra and Prescott (1985) was, in part, motivated
by historical evidence on the return of U.S. stocks in excess of the riskless rate. Much of
our own research has focused on estimating the equity risk premium using long-term
historical data, and examining how historical accident may relate to the classic puzzle.
While the equity premium is a fascinating topic for scholarship it is also one of the most
important economic topics in modern finance. The equity risk premium is widely used to
forecast the growth of investment portfolios over the long term. It is also used as an input
to the cost of capital in project choice, and employed as a factor in the expected rate of
return to stocks. Given its prevalence in practice and its importance to academic thought,
it is interesting to discover that the calculation of the equity risk premium is a fairly new
phenomenon. Reliable data to estimate the historical premium of stocks over bonds were
only collected in the mid 20th
Century, and precise econometric estimates of the equity
premium only came after the development of the theory that uses it as a central input –
the Capital Asset Pricing Model, or CAPM.
The chapter in part is intended to review our own contributions to the literature on the
equity risk premium. Working both separately and together on a series of empirical
research studies conducted with colleagues through the years, we have looked at the
equity risk premium from a few different perspectives. First, research by Roger
Ibbotson and Rex Sinquefield provided some of the first accurate calculations of the
annual rate of return on U.S. asset classes over long investment horizons with specific
measures of the equity and other risk premiums. These calculations have come into
widespread academic and industrial use as inputs to research and investment decision-
making through numerous works that Ibbotson has produced. Second, Will Goetzmann
and co-authors Stephen Brown and Stephen Ross proposed and examined the hypothesis
that the equity premium estimated from U.S. financial data alone is subject to a bias due
to analysis of a winning market rather than losing ones. Third, both of us together with
our co-author Liang Peng have constructed one of the most complete long-term databases
of U.S. financial returns yet developed and have used it to study the variations in the
1

8/6/2019 Goetzmann
http://slidepdf.com/reader/full/goetzmann 3/26
equity risk premium through nearly 200 years. Finally, both of us have them contributed
to the literature on other ways of measuring the equity risk premium and on various ways
of applying the concept. This chapter will summarize this past work and place it the
historical context of the evolution of the concept of the equity premium.
The chapter is structured as follows. We first review the historical development of the
idea of the equity risk premium in financial economics as the theory of compensation for
investment risk developed in tandem with the empirical analysis of historical investment
performance. Next we summarize some of our past findings about the historical equity
risk premium and present further analysis on potential survival biases. Finally, we update
our analysis of the historical performance of the New York Stock Exchange over the
period 1792 to the present, and include a measure of the U.S. equity risk premium over
more than two centuries. This last section is based upon indices constructed from
individual stock and dividend data collected over a decade of research at the Yale School
of Management.
II. Historical Conception and Measurement of the Equity Risk Premium
One of the earliest and must succinct expressions of the concept of the equity risk
premium came from John Stuart Mill in his 1848 classic Principles of Political Economy.
Writing about a farmer considering investment in the land, Mill argues that:
…he will probably be willing to expend capital on it (for an immediate
return) in any manner which will afford him a surplus profit, however
small, beyond the value of the risk, and the interest which he must pay for
the capital if borrowed, or can get for it elsewhere if it is his own.2
2 Book 2, Chapter 16, The Principles of Political Economy, 1848. See also J. S. Mill,
Essays on Some Unsettled Questions of Political Economy Essay IV: On Profits, And
Interest. “ The profits of stock are the surplus which remains to the capitalist afterreplacing his capital: and the ratio which that surplus bears to the capital itself, is the rate
of profit. The gross profits from capital, the gains returned to those who supply the fundsfor production, must suffice for these three purposes. They must afford a sufficient
2

8/6/2019 Goetzmann
http://slidepdf.com/reader/full/goetzmann 4/26
Mill thus separates profit into three parts: first, the interest that must be paid for the
capital borrowed, determined in terms of alternative opportunity cost of money. This is
equivalent to the riskless rate. The second component is the “value of the risk”
associated with the investment. This is equivalent to the equity risk premium. Mill’s
third component is a surplus profit, no matter how small. In modern parlance, the
“alpha” – a portion of compensation expected to be small in a competitive market.
Despite Mill’s early formulation of the idea, the concept of equity profit as compensation
for risk did not develop quickly. Economists at the turn of the century tended to focus
instead on the apparent paradox of profit and perfect competition rather than risk and
return. Columbia University professor John Bates Clark, for example, asserted that
returns in excess of the riskless rate were due to monopolistic advantage, rather than
compensation for insurable risk. In his view, innovation led to a comparative advantage
which was in turn rewarded by excess return.3
Chicago economist Frank Knight responded to Clark’s formulation by asserting the
importance of risk. In his famous 1921 work Risk, Uncertainty and Profit , he noted the
lack of useful models of risk and return in economic research. Knight reviewed the role
of risk in the economic theory of profit up to the 1920’s and took exception to the lack of
distinction in previous analyses between quantifiable and unquantifiable risk – the latter
he termed uncertainty, but both of which he asserted should command an investment
premium. Knight’s philosophical treatise did little, however, to clarify how the different
roles of risk and uncertainty would affect prices and business ventures in a practical
equivalent for abstinence, indemnity for risk, and remuneration for the labour and skillrequired for superintendence.” It is somewhat unclear whether he is referring only to a
return that covers a probability of expected loss instead of the equity risk premium's
increase of expected return to cover systematic risk.
3 Clark, J. B., 1892, “Insurance and Business Profit,” The Quarterly Journal of
Economics, 7(1) 40-54. See a response to Clark by Fredrick B. Hawley, 1893, “TheRisk Theory of Profit,” The Quarterly Journal of Economics, 7(4) 459-479.
3

8/6/2019 Goetzmann
http://slidepdf.com/reader/full/goetzmann 5/26
manner, and he was completely silent on the issue of how one might quantify the equity
risk premium.
As theorists debated the role of risk in the expected return to investment, empirical
researchers in the early 20th
century began to collect historical performance data from the
markets. The earliest attempts to construct stock price indices were motivated by the
need for a “barometer” of current market trends, or as an indicator of fluctuating
macroeconomic conditions. Charles Henry Dow’s famous index of 30 stocks was not
originally intended as a measure of long term investment performance, but rather as a
daily measure of the market. A number of macroeconomists began to create stock price
indexes in the early 20th Century. Mitchell (1910, 1916), Persons (1916, 1919), Cole and
Frickey (1928) are among the number of scholars who collected U.S equity prices and
constructed indices as a means to study the interaction between economic cycles and the
financial markets. Likewise, Smith and Horne (1934) and Bowley, Schwartz and Smith
(1931) built similar indices for Great Britain. None of them addressed the obvious
question – at least from our modern perspective -- of long-term investment returns.4
Edgar Lawrence Smith’s 1924 book Common Stocks as Long Term Investments is the
first significant attempt to advocate equity investing as a means to achieve higher
investment returns. Smith collected historical price and dividend data for stocks and
corporate bonds over the period 1866 through 1923 from the Boston and New York Stock
Exchanges. He formed stock and bond investment portfolios of ten securities each as the
basis for simulating investor performance over four different time periods. He studied
the relative appreciation returns and income returns from both asset classes and
documented fairly convincingly that over a variety of sub-periods equities yielded higher
income than bonds and also provided significant capital appreciation.
4 For an excellent discussion of the development of early equity indices, see Hautcoeur,
Pierre-Cyrille and Muriel Petit-Koñczyk (2005). For a complete list of indices developedbefore Cowles (1938), see Cowles own discussion and notes in his volume.
4
8/6/2019 Goetzmann
http://slidepdf.com/reader/full/goetzmann 6/26
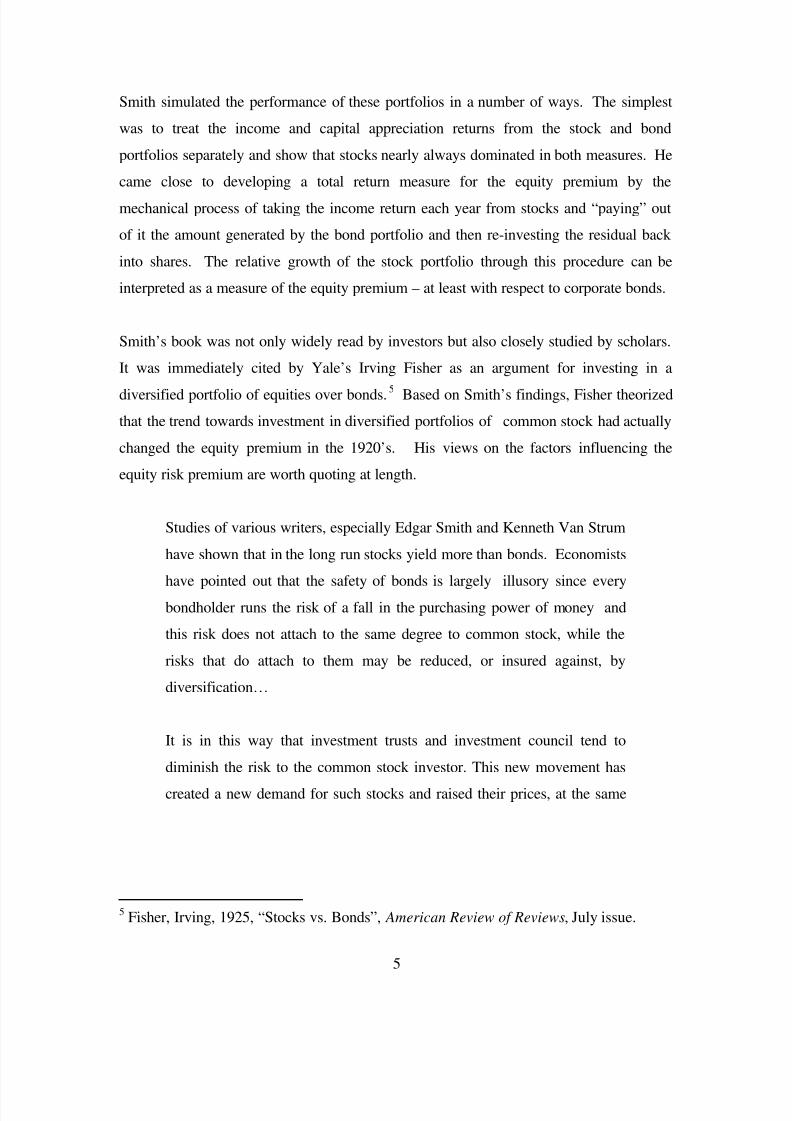
Smith simulated the performance of these portfolios in a number of ways. The simplest
was to treat the income and capital appreciation returns from the stock and bond
portfolios separately and show that stocks nearly always dominated in both measures. He
came close to developing a total return measure for the equity premium by the
mechanical process of taking the income return each year from stocks and “paying” out
of it the amount generated by the bond portfolio and then re-investing the residual back
into shares. The relative growth of the stock portfolio through this procedure can be
interpreted as a measure of the equity premium – at least with respect to corporate bonds.
Smith’s book was not only widely read by investors but also closely studied by scholars.
It was immediately cited by Yale’s Irving Fisher as an argument for investing in a
diversified portfolio of equities over bonds.5 Based on Smith’s findings, Fisher theorized
that the trend towards investment in diversified portfolios of common stock had actually
changed the equity premium in the 1920’s. His views on the factors influencing the
equity risk premium are worth quoting at length.
Studies of various writers, especially Edgar Smith and Kenneth Van Strum
have shown that in the long run stocks yield more than bonds. Economists
have pointed out that the safety of bonds is largely illusory since every
bondholder runs the risk of a fall in the purchasing power of money and
this risk does not attach to the same degree to common stock, while the
risks that do attach to them may be reduced, or insured against, by
diversification…
It is in this way that investment trusts and investment council tend to
diminish the risk to the common stock investor. This new movement has
created a new demand for such stocks and raised their prices, at the same
5 Fisher, Irving, 1925, “Stocks vs. Bonds”, American Review of Reviews, July issue.
5

8/6/2019 Goetzmann
http://slidepdf.com/reader/full/goetzmann 7/26
time it has tended to decrease the demand for, and to lower the price of,
bonds.6
Smith’s empirical approach to measuring the relative performance of the two asset
classes was widely imitated in later studies. In 1937, Brown University Professor
Chelcie Bowland published a synthesis of research following Smith’s book and showed
how the common stock investment strategy performed through the worst years of the
depression.7 Bowland concluded on considerable empirical evidence that the theory of
common stock investment survived the crash. An interesting feature of the studies cited
in Bowland’s book is that none of them produced what we now think of as a measure of
the equity premium – that is, the difference in total return between a portfolio of equities
and the riskless rate over the same period.
The most carefully crafted early empirical analysis of the long term performance of the
stock market was Common Stock Indices, by Alfred Cowles III, published in 1938. This
ambitious study, undertaken before the advent of computers, but assisted by the invention
of Holerith cards, collected individual stock prices (actually monthly highs and lows by
stock) and dividends from 1872 to 1937 for stocks on the NYSE. Its stated goal was to
“portray the average experience of those investing in this class of security in the United
States from 1871 to 1937”8
Cowles improved upon Smith’s work by developing a methodology which reinvested the
dividend proceeds from stocks into the purchase of shares, thus avoiding the complexities
of comparing income and capital appreciation returns separately. Two other important
features of the Cowles study were that he collected data on virtually all of the stocks on
the New York Stock Exchange, and that he capital-weighted them, a procedure that
6 Fisher, Irving, 1930, The Theory of Interest , The Macmillan Company, New York, pp.
220-221.7
Bowland, Chelcie, 1937, The Common Stock Theory of Investment , The Ronald PressCompany, New York.8
Cowles, Alfred, 1938, Common Stock Indices, Cowles Commission for Research inEconomics, Monograph number 3, Principia Press, Bloomington, p. 2.
6

8/6/2019 Goetzmann
http://slidepdf.com/reader/full/goetzmann 8/26
allowed the index to simulate a passive buy and hold investment strategy. The one
serious limitation of the Cowles study is that it relied on the average of high and low
prices during the month as a proxy for end-of-month stock prices. This had a smoothing
effect on the returns, downward biasing the volatility and muddying up any econometric
analysis of the data.9
Oddly enough, given such widespread interest in Edgar Smith’s
earlier study, the Cowles analysis was silent on the relative performance of stocks and
bonds.
The first book to explicitly define, model and estimate an equity risk premium was John
Burr Williams’ The Theory of Investment Value, also published in 1938. According to
Williams “The customary way to find the value of a risky security has always been to add
a ‘premium for risk’”.10 He provides a table of “Interest Rates, Past Present and Future”
which takes the riskless rate as the long-term government bond rate of 4% and the
expected return to “Good stocks” as 5 1/2%.11 Williams’ estimated the forward equity
premium from a dividend discount model, and he was careful to explain that historical
(i.e. past) estimates provide a good forecast of the future, even when they deviate from
present conditions.
In sum, by the end of the 1930’s, economists had developed a clear conception of the
equity risk premium, a means to measure rates of return on investments, and had
collected historical data extending back through American financial history for several
decades. The first empirical estimate of the equity premium by Smith is generally
regarded as a major factor in the rush by retail investors into the stock market in the
1920’s, and Irving Fisher is often taken to task for his theory that stock prices increased
9Cowles, Alfred, 1960, “A Revision of Previous Conclusions Regarding Stock Price
Behavior,” Econometrica, Vol. 28, No. 4. pp. 909-915.10 Williams, John Burr, 1938, The Theory of Investment Value, Harvard University Press,
Cambridge, page 67. Of interest to those interested in financial history is that Williams
solves algebraically for the discount rate on the common stock of a firm as a function of
the discount rate for the all-equity firm and the firm debt – preceding Modigliani andMiller in arguing that “The investment value of an enterprise … in no way depends
upon what the company’s capitalization is.” (p.72).11 Ibid. p. 387.
7

8/6/2019 Goetzmann
http://slidepdf.com/reader/full/goetzmann 9/26
to new levels in the 1920’s as a result of a decreasing equity risk premium. Alfred
Cowles created the first relatively accurate long-term index of total return to investing in
common stocks, and J.B. Williams provided the first numeric estimate of the forward-
looking equity risk premium. Their work provided a valuable foundation for the next
generation of financial research.
The next major attempt to empirically quantify the equity returns was undertaken at the
University of Chicago. Beginning in 1960, CRSP, the Chicago Center for Research on
Security Prices, headed by economists Lawrence Fisher and James H. Lorie,
systematically began to collect stock prices and dividends from U.S. capital market
history. Fisher and Lorie published the results of their study of returns to U.S. stocks in
1964, as “Rates of Return on Investments in Common Stocks”12 and in 1977 as a volume
including returns to U.S. government securities as well. 13 Like Cowles, they based their
analysis of individual share prices and re-investment of dividends of U.S. stocks.
The theoretical developments in financial economics in the 1950’s and 1960’s made these
empirical estimates of rates of return particularly interesting. In 1952, Harry Markowitz
published his famous model of portfolio selection which explicitly linked investment
return and risk. Markowitz proposed taking as inputs to his model the historical means,
variances and covariances of individual securities, although he regarded this as a method
which could be improved upon with better forecasting tools.
The Markowitz model, as it is now applied, identifies an optimal portfolio of assets in
expected return and standard deviation space by the point of tangency formed by a ray
extending from the expected return of the riskless (zero standard deviation) asset to the
continuous frontier of portfolios providing the highest return for each level of standard
deviation. The difference between the return of the riskless asset and the expected return
12 Fisher, Lawrence and James H. Lorie, 1964, “Rates of Return on Investments in
Common Stocks,” Journal of Business 37, 1-21, covered the period 1926-60 which in1968 they updated through 1965.13
Fisher and Lorie, 1977, “ A Half Century of Returns on Stocks and Bonds,” Universityof Chicago Graduate School of Business.
8

8/6/2019 Goetzmann
http://slidepdf.com/reader/full/goetzmann 10/26
of the tangency portfolio in this model is the equity risk premium.14
In the Markowitz
framework, the size of the equity risk premium is an empirical question. Later scholars
took a theoretical approach to its estimation.
The Sharpe-Lintner-Mossin Capital Asset Pricing Model [CAPM] was independently
developed in the 1960’s in part as a means to identify the optimal portfolio of risky assets
in the Markowitz framework. As such, the CAPM takes an analytical approach to the
equity risk premium. The theory endogenizes asset prices as a function of the risk
aversion of the representative investor and the variance-covariance structure of the
universe of assets. The shape of the representative investor’s utility function,
parameterized by a coefficient of risk aversion for the market as a whole is central to
identification of the equity premium.
In the framework of the CAPM, if the form of the utility function and the coefficient of
risk aversion are both known, then knowledge of the variance-covariance of the universe
of assets (or the variance of the portfolio of risky assets) is sufficient to identify the
spread between risky and riskless asset portfolios.
An important feature of the Markowitz model and the CAPM is that they provide a
theoretical foundation for estimating the magnitude of the equity risk premium directly
from investor preferences. It was not until Mehra and Prescott (1985), however that
anyone attempted to compare the equity premium implied by preferences with the
empirical measures provided by historical returns.
III. Stocks, Bonds, Bills and Inflation
In 1976, Ibbotson and Sinquefield published “Stocks, Bonds, Bills and Inflation: Year-
by Year Historical Returns (1926-1974).” The stock market returns were calculated as
14 The Markowitz framework is a single-period model. As such, the arithmetic return and
the geometric return are the same.
9

8/6/2019 Goetzmann
http://slidepdf.com/reader/full/goetzmann 11/26
total returns from the S&P 500 index, which up to this time did not include dividends.
The authors also used CRSP government bond data to include U.S. Treasury bond and
bill indexes. They also included a corporate bond index constructed from bond yields, as
well as an inflation rates. Besides displaying total returns across all yearly hold periods,
the paper was unique in that it explicitly measured historical risk premiums, not only for
equities, but also including the horizon (maturity) premium, the default premium, and
real interest rate. Results were presented in real (inflation adjusted) terms as well. In
Ibbotson Associates Yearbooks, they later added the small stock premium, the value
premium, as well as various other data. These historical premiums came to be used in
practice and theory as the risk premium input into the CAPM model, as well as for other
models.
Later in 1976, Ibbotson and Sinquefield showed how historical data could be used to
simulate probability distributions of future returns. They started with the then current
yield curve with its implicit forward interest rate structure. They added the various
historical premiums using bootstrapping methods that retained the correlation structure
among the asset classes. They used a historical equity risk premium which was measured
during the previous half century to be 6.3% geometrically relative to U.S. Treasury Bills,
but a lesser number relative to longer-term bonds which contained horizon risk
premiums.
Interestingly, 1976 was also the year that Vanguard launched its market index trust, a
passive, value-weighted portfolio of large-cap U.S. stocks designed to match the
performance of the S&P 500. The excellent excess performance of stocks from 1926 to
1974 reported in Ibbotson and Sinquefield may have helped build demand for a passive
portfolio that sought to capture these historical returns. Just as the empirical study by
Edgar Lawrence Smith demonstrated to investors in the 1920’s the superiority of stocks
over bonds and motivated a move towards equities, indexation made a lot of sense to
investors in the 1970’s when they had five decades of historical performance upon which
to base their expectations for the future.
10

8/6/2019 Goetzmann
http://slidepdf.com/reader/full/goetzmann 12/26
An important historical note is that the decade of the 1970’s was one of the worst periods
in U.S. capital market history for stocks. The crash of 1973-74, the experience of double
digit inflation and the erosion of capital was fresh in the public imagination in 1976.
Equity returns had not exceeded debt returns over nearly the preceding decade. Thus the
historical equity premium appeared to most as a wildly optimistic forecast of the future
expected return of stocks over T-bills. In fact it was not – the equity risk premium since
1976 has nearly matched the estimate made at the time.
There are several ways one might estimate an expected risk premium used for
forecasting. One way is to extrapolate historical risk premiums as Ibbotson and
Sinquefield did. Another is to use investor demand models based upon investor risk
aversion, as Mehra and Precott did. In Ibbotson, Siegel, and Diermeier (1984), demand is
shown to be impacted not only by systematic risk, but also by liquidity, taxation, and
idiosyncratic risk. A third way is to look at the type of returns that the corporate sector
supplies. Diermeier, Ibbotson, and Siegel (1984) and then later Ibbotson and Chen
(2003) use this supply approach. They extrapolate the cash flows and earnings growth
generated by companies themselves. These forecasts tend to give somewhat lower
forecasts than historical risk premiums, primarily because part of the total returns of the
stock market have come from price-earnings ratio expansion. This expansion is not
predicated to continue on indefinitely, and should logically be removed from the
expected risk premium.
IV. History as Written by the Winners?
A major conceptual problem with equating the ex post historical realization of the equity
premium with its ex ante expectation is that history could simply have turned out better
than people expected. Recall that in 1938, J.B. Williams calculated the market forecast
of the equity risk premium as a mere 1 1/2 percent. He might have been shocked to see
the realized premium over the following five decades exceed his forecast by a multiple of
four. A more subtle problem is that historical records of successful markets tend to get
preserved, but it is difficult to dig up the records of failed markets. To study these issues,
11

8/6/2019 Goetzmann
http://slidepdf.com/reader/full/goetzmann 13/26
Brown, Goetzmann and Ross (1997) built a model of stock market performance which
examined the ex post historical return conditional upon survival. Their analytical results
showed that when a market is confronted with the continuous possibility of failure
(modeled statistically as an absorbing lower bound) the ex post realized growth can be
substantially higher than the unconditional mean. The fact that the U.S. survived two
world wars and periods of global political unrest that caused other major markets to fail
would suggest that the historical mean return of the U.S. market is an overestimate of its
expectation.
It is important to point out that this view of the equity risk premium is quite different than
the critique of the equity premium puzzle posed by economist Thomas Reitz. Reitz
(1988) theorized that a high ex ante equity premium could be justified by a fear of a huge
crash. An equity premium of 6% would thus reflect the potential for an event which may
not have been realized in America’s financial history but which nevertheless was a
possibility in people’s minds. One limitation of the Reitz critique is that it conflicts with
historical expectations of stock returns – most notably the J.B. William’s forward-
looking premium in 1938 of 1 1/2 percent. The survivorship story, on the other hand, is
entirely consistent with low historical expectations of the future, although it would be
unlikely to reduce the equity risk premium to such a low number.
In order to estimate the potential scale of the survival bias, and to look for empirical
evidence that the U.S. market was an unusual performer in the global economy, Jorion
and Goetzmann (1999) collected capital appreciation and inflation data for a large sample
of the world’s equity markets from 1921 forward. They found that the U.S. was the top
performer out of 39 markets, in terms of real capital appreciation of stocks. Studying this
effect subsequently with a smaller but richer sample, Dimson, Marsh and Staunton (2002)
collect total real returns for twelve countries over the entire century and found that the
U.S. was in the top quartile of performers in real terms – inched out by Sweden and
Australia over the first couple of decades of the century.15 The Jorion and Goetzmann
15Dimson, Elroy, Paul Marsh and Mike Staunton, 2000, The Millenium Book: A Century
of Investment Returns, ABN-AMRO and London Business School, p. 55.
12

8/6/2019 Goetzmann
http://slidepdf.com/reader/full/goetzmann 14/26
GDP-weighted index of the 44 non-U.S. equity markets had an arithmetic real return of
3.84% per year compared to the U.S. value of 5.48%, suggesting a survival bias on the
order of 1.5% per annum. The geometric return values were closer (roughly 90 basis
points) because the world market index was less volatile over the period due to
diversification. Thus the work found evidence that the equity premium estimate is
affected by survival issues, however the magnitude is insufficient to explain away the
equity premium puzzle.
V. The Equity Premium Over the Very Long Term
One of the major issues with statistical estimation of the realized equity risk premium is
that a very long time series of stationary returns is required to achieve a high degree of
confidence in the estimate. The longer the data series, the more accurate the equity risk
premium calculation, as long as the fundamental expectations have remained the same.
In order to estimate the U.S. equity premium using total returns over the longest possible
time period we have collected the most complete dataset of U.S. stock prices and
dividends assembled to date.16 Working with University of Cincinnati economist Liang
Peng, we gathered individual security data from U.S. financial periodicals on a monthly
basis, beginning with the official list of the New York Stock Exchange in 1815, and
collected available dividends from 1825 to 1872. Among other things, this direct data
collection enabled us to collect month ending prices, avoiding the Cowles data problem
of averaging high and low prices for the month. It also allowed us to avoid the
heterogeneity problems of Ibbotson and Brinson (1987), Schwert (1990), Goetzmann
(1993), and Siegel (1998) all of whom had to rely upon chained indices constructed by
earlier researchers.17
16 Goetzmann, William, Roger G. Ibbotson and Liang Peng, 2000, “A New Historical
Database for the NYSE 1815 to 1925: Performance and Predictability”, The Journal of
Financial Markets 4(1), 1-32,17
The NYSE database is available for download on the website of the InternationalCenter for Finance at the Yale School of Management. www.icf.yale.edu.
13

8/6/2019 Goetzmann
http://slidepdf.com/reader/full/goetzmann 15/26
Recently, Richard Sylla of NYU completed the collection of weekly NYSE stock prices
over the late 18th and early 19th centuries. He generously shared this data with us, and
from it we are able to construct a complete index of capital appreciation returns for the
New York Stock Exchange from 1792 (its inception) to the present. In this chapter, using
the combined databases of Sylla, and Goetzmann, Ibbotson and Peng (2000), as well as
annual bond yield data from Homer and Sylla’s The History of Interest Rates, we are able
to estimate an equity premium for the New York Stock Exchange over its pre-1925
history.
Capital appreciation returns in this study are based on a price-weighted index of all stocks
trading in the year, using the last price observation in the year. Income returns from 1825
to 1871 are constructed in two ways and then averaged. The first method is to sum all the
dividends paid in that year and divide by the prices of all firms from the previous year.
This probably underestimates the income return because some actual dividend payments
may not be in the data set. The second method focuses solely on the income return of
firms that paid regular dividends and for which prices were collected – this likely
overestimates returns because some stocks may not have paid any dividends. It is
important to note that no previous researchers collected actual dividend data on U.S.
stocks before 1872. All analyses before our own was based upon econometric methods
to fill in income returns. Thus, although our two methodologies sometimes diverge, they
are at least based upon empirical observation. However, like previous analysts, in order
to estimate the pre-1825 dividends, we employ a linear forecasting model using next
year’s dividend and this year’s capital appreciation as forecasting variables.18 Our
dividend returns from 1872 to 1925 were taken from Cowles (1938).
The most problematic variable in our study is the riskless rate. In 1792, the United States
was an emerging market and U.S. securities were considered far from riskless. Homer
and Sylla report yields on U.S. government and U.S. municipal debt in the 18 th and 19th
centuries. For long stretches of time the yields on municipals were less than yields of
treasuries, and this difference was not due to tax treatment. We took the minimum yield
18 The R-square of this model was .17, suggesting it has some power.
14

8/6/2019 Goetzmann
http://slidepdf.com/reader/full/goetzmann 16/26

8/6/2019 Goetzmann
http://slidepdf.com/reader/full/goetzmann 17/26

8/6/2019 Goetzmann
http://slidepdf.com/reader/full/goetzmann 18/26
Table I
Summary Statistics for New York Stock Exchange Total
Returns, U.S. Bond Yields, Call Money Rates and
Inflation,
1792 – 1925
Arithmetic
Return
Geometric
Return
Standard
Deviation
Stocks TR 7.93% 6.99% 14.64%
Cap Ap 1.91%
Income 6.01%
Bonds 4.17% 4.16% 4.17%
Comm. Paper 7.62% 7.57% 3.22%
Inflation 0.85% 0.61% 7.11%
Table II presents summary statistics for the major U.S. asset classes over the period 1926
through 2004. The arithmetic average return to common stocks over the second period is
400 basis point per year higher than in the first. In real terms, however, this differential is
slightly less dramatic: 7.08% to 9.27%.
Table II
Summary Statistics for Total Returns in U.S. Stocks,
Bonds, Bills and Inflation
1926 - 2004
Arithmetic
Return
Geometric
Return
Standard
Deviation
17

8/6/2019 Goetzmann
http://slidepdf.com/reader/full/goetzmann 19/26
Stocks TR 12.39% 10.43% 20.31%
Cap Ap 7.85%
Income 4.27%
LT Govt. Bonds 5.82% 5.44% 9.30%
T-Bills 3.76% 3.72% 3.14%
Inflation 3.12% 3.04% 4.32%
Source: Stocks, Bonds, Bills and Inflation, 2005 Yearbook , Ibbotson Associates,
Chicago.
VI. Conclusion
The concept of the equity risk premium is fundamental to modern financial theory and a
basic building block in most forecasting models of long term expected investment
returns. A review of the economic literature after the turn of the 19th century suggests
that the concept of the equity risk premium was not clearly formulated until the late
1930’s. While the notion of return as a premium for risk above and beyond the pure
time value of money dates at least to the work of John Stuart Mill, the basic technique of
calculating the total return to investing in equities vs. debt developed relatively slowly,
with the key insight provided by Alfred Cowles – a calculation of investment return in
equities requires regular re-investment of income through the purchase of shares.
The historical development of the concept and measurement of the equity risk premium
provides the context for our own research contributions. The first Ibbotson and
Sinquefield study represented a culmination of research on the basic building blocks of
expected returns for different asset classes. The notion of building up expected returns
from blocks of risk premia was viewed by J. B. Williams as a natural approach, however
it is surprising how long to took for the basic empirical calculus of risk and return to
come into use. The Ibbotson and Sinquefield numbers as reported in 1976 were striking
evidence that common stock investment, so avidly proposed by Smith and Fisher five
decades earlier, was in fact a wise course of action to take. A new generation of
investors in the 1970’s used these numbers as a guide to expectations of future returns to
18

8/6/2019 Goetzmann
http://slidepdf.com/reader/full/goetzmann 20/26
equity investment, and twenty-five years later they were not disappointed. History
proved an accurate forecast.
The sheer magnitude of the equity premium in U.S. capital markets over the 20 th Century
has caused both scholars and practitioners to ask whether these returns were simply an
accident of history or evidence of a different kind of attitude towards risk than seems
justified by theoretical models. The importance of Mehra and Prescott (1985) is that it
pointed out the apparent contradiction between the U.S. market experience and academic
models of human behavior.
A part of our own inquiry into the equity premium puzzle has been the question of
whether the history we examine is an unusual path – one unlikely to be realized in the
future. Most Americans who lived through a significant portion of the 20th Century count
themselves fortunate compared to large sectors of the global populace who suffered
catastrophic loss of savings as a result of the political tumult of two world wars and
widespread redistribution of wealth. In light of America’s political and economic success
in the 20th Century, it is not surprising to find that its markets dominated as well. A test
of this “survivor” story in our research finds some empirical support, but does not fully
explain the high equity risk premium enjoyed through U.S. capital market history.
The survival hypothesis suggests that the American experience may not be the best
example on which to base future expectations – then again, maybe it is for those who
plan to continue investing in the U.S. capital markets. Perhaps the positive American
experience was actually due to our particular configuration of laws, political system,
cultural mixture and practical orientation.
A longer look at the American financial experience affords a chance to test this
proposition. Although the 20th century may be the American Century, the 19 th century
was not. Europe’s financial markets were dominant through the First World War.
American finance was parochial and limited. One important qualification to this,
however, was the comparative freedom of American equity markets. Britain severely
19

8/6/2019 Goetzmann
http://slidepdf.com/reader/full/goetzmann 21/26
limited the issuance of corporate shares until the mid-19th
Century, and full corporate
access to the capital markets did not exist until the British Companies Acts of the 1860’s.
By that time, American equity markets had been operating in New York, Philadelphia
and Boston for many decades. Indeed the U.S. might have been the best market to study
the early development of unfettered capitalism in the early 19th
Century.
What do we find when we look at the 19 th century numbers? First, the measurement of
the equity risk premium in the U.S. before 1925 is nearly impossible due to largely to the
fact that there was no meaningful riskless rate as a benchmark. Had the Capital Asset
Pricing Model been transported back from the 1960’s to the 1860’s, the challenge would
have been to determine Rf, not Rm. When we look at the premium of stocks over
inflation, however, we find that the real rate of equity returns in the first 125 years of its
history pretty nearly resembles the real rate of equity returns in the last eighty years.
Through that trajectory of time, the U.S. went from being an emerging market to a capital
importer to a capital exporter. Given what would seem to be major regime changes in the
U.S. economy, it is extraordinary to find such stability in the rate of return on investment
capital. Is that stability due to a “country factor” in modern asset pricing terminology?
This will have to await further tests using data from global capital market history.
Our research together and separately has focused to a large degree on measurement and
interpretation of history. Despite decades of research on early capital markets, however,
much remains to be done. Our understanding of the historical experience of investors is
relatively limited once we step beyond a few well-studied markets. Basic information
about investor returns is lacking and may never be recovered. Nevertheless, efforts to
quantify the equity risk premium are well rewarded by insights into both the stability and
dynamics of long term investment performance.
20

8/6/2019 Goetzmann
http://slidepdf.com/reader/full/goetzmann 22/26
References
Bowland, Chelcie, 1937, The Common Stock Theory of Investment , The Ronald Press
Company, New York.
Bowley, A.L., Schwartz, G.L. and Smith, K.C., 1931, A New Index of Securities, London
and Cambridge Economic Service, London.
Clark, J. B., 1892, “Insurance and Business Profit,” The Quarterly Journal of Economics,
7(1) 40-54.
Cole, A.C. and E. Frickey, 1928, “The course of stock prices, 1825-66”, Review of
Economic Statistics, X n°3, August, pp. 117-39.
Diermeier, Jeffrey, Ibbotson, Roger, and Siegel, Lawrence B., 1984, "The Supply for
Capital Market Returns," Financial Analysts Journal, Vol. 40, No 2.
Dimson, Elroy, Paul Marsh and Mike Staunton, 2002, Triumph of the Optimists: 101
Years of Global Investment Returns, Princeton University Press.
Cowles, Alfred, 1938, Common Stock Indices, Cowles Commission for Research in
Economics, Monograph number 3, Principia Press, Bloomington.
Cowles, Alfred, 1960, “A Revision of Previous Conclusions Regarding Stock Price
Behavior,” Econometrica, Vol. 28, No. 4. pp. 909-915.
Fisher, Irving, “Stocks vs. Bonds”, American Review of Reviews, July 1925.
Fisher, Irving, 1930, The Theory of Interest , The Macmillan Company, New York, pp.
220-221.
21

8/6/2019 Goetzmann
http://slidepdf.com/reader/full/goetzmann 23/26
Fisher, Lawrence and James Fisher, 1964, “Rates of Return on Investments in Common
Stocks,” Journal of Business 37, 1-21.
Frickey 1919, “An index of industrial stock prices”, Review of economics statistics, III
n°8, Aug.1921, 264-277.
Goetzmann, William, 1993, “Patterns in 3 Centuries of Stock-Market Prices”, Journal of
Business, Vol. 66, No. 2, 249-270.
Goetzmann, William, Roger G. Ibbotson and Liang Peng, 2000, “A New Historical
Database for the NYSE 1815 to 1925: Performance and Predictability”, The Journal of
Financial Markets 4(1), 1-32
Hawley, Fredrick B. ,1893, “The Risk Theory of Profit,” The Quarterly Journal of
Economics, 7(4) 459-479.
Hautcoeur, Pierre-Cyrille and Muriel Petit-Koñczyk, 2005, “The development of the
Paris Bourse in the interwar period” Working Paper, Université Paris I (Matisse) and
DELTA.
Homer, Sidney, 1963, A History of Interest Rates, New Brunswick, NJ: Rutgers
University.
Homer, Sidney and Richard Sylla, 1991, A History of Interest Rates, New Brunswick, NJ:
Rutgers University, Third Edition.
Ibbotson, Roger G. and Brinson Gary P., 1987, Investment Markets, McGraw-Hill.
Ibbotson, Roger G. and Chen, Peng, 2003, "Long-Run Stock Returns: Participating in
the Real Economy," Financial Analysts Journal, Vol. 59, No. 1.
22

8/6/2019 Goetzmann
http://slidepdf.com/reader/full/goetzmann 24/26
Ibbotson, Roger G., Diermeier, Jeffrey and Siegel Laurence B., 1984, "The Demand for
Capital Market Returns: A New Equilibrium Theory," Financial Analysts Journal,
Vol. 59, No. 1.
Ibbotson, Roger G & Sinquefield, Rex A, 1976, "Stocks, Bonds, Bills, and Inflation:
Year-by-Year Historical Returns (1926-1974)," Journal of Business, University of
Chicago Press, vol. 49(1), pages 11-47.
Ibbotson, Roger G & Sinquefield Rex A, 1976 "Stocks, Bonds, Bills and Inflation:
Simulations of the Future 1976-2000," Journal of Business, University of Chicago
Vol.49(3)
Jorion, Philippe and William N. Goetzmann, 1999, "Global Stock Markets in the
Twentieth Century," Journal of Finance, 54(3), 953-980.
Knight, Frank, 1921, Risk, Uncertainty and Profit , Hart, Shaftner and Marx, New York.
Mill, John Stuart, 1848, The Principles of Political Economy. London: Longmans, Green
and Co.
Markowitz, Harry, 1952, "Portfolio Selection," The Journal of Finance Vol.7 No. 1.
Mehra, Rajnish and Prescott, Edward, 1985 "The Equity Premium Puzzle," Journal of
Monetary Economics, Vol. 34. No. 4.
Mill, John Stuart, 1874, "Essays on Some Unsettled Questions of Political Economy,"
History of Economic Thought Books, McMaster University Archive for the History of
Economic Thought, edition 2, number mill1874.
23
8/6/2019 Goetzmann
http://slidepdf.com/reader/full/goetzmann 25/26
Mitchell, W.C. “The Prices of American Stocks: 1890-1909”, Journal of political
economy, XVIII, n°5 may 1910, 345-380.
Mitchell, W.C. The Making and Using of Index Numbers, Bulletin of the US Bureau of
Labor Statistics, n°173, 1915 ; 2e édition Bulletin 284, 1921
Mitchell, W.C. “A critique of index numbers of the price of stocks”, Journal of Political
Economy, XXIV n°7, July 1916, pp. 625-93.
Persons, W.M. 1916, “Construction of a barometer based upon annual data”, American
Economic Review, VI n°4, 1916 739-769.
Reitz, Thomas, 1988, "The Equity Premium: A Solution?" Journal of Monetary
Economics, vol. 22, no. 1 (July):133–136.
Schwert, W., 1990, "Indexes of US Stock Prices from 1802 to 1987," Journal of Business
63, 399-426
Siegel, Jeremy J., 1998, Stocks for the Long Run, McGraw-Hill, 2nd Edition.
Smith, Edgar Lawrence, 1924 Common Stocks as Long Term Investments,
Smith, K.C. and Horne G.F., 1934, An Index Number of Securities, London and
Cambridge Economic Service, London.
Williams, John Burr, 1938, The Theory of Investment Value, Harvard University Press,
Cambridge.
Wilson, Jack and Jones, Charles P. 2002, "An Analysis of the S&P 500 Index and
Cowles's Extensions: Price Indexes and Stock Returns 1870 - 1999," Journal of
Business, Vol.75, No.3.
24

8/6/2019 Goetzmann
http://slidepdf.com/reader/full/goetzmann 26/26