GOAL 4: DEVELOP COMPLETE COMMUNITIES
20
96 Progress toward Shaping our Future GOAL 4: DEVELOP COMPLETE COMMUNITIES The challenge Complete and healthy communities have diverse housing options and access to a wide range of goods, services and community amenities - shops, recreation and cultural activities, employment opportunities, and a safe and attractive public realm Providing affordable and appropriate housing for the region’s population at various stages of their lives is an ongoing challenge and requires careful planning at the local scale, supported by sustainable regional land use and transportation planning The Metro 2040 vision The region in 2040 will be comprised of ‘complete communities’ supported by regional employment distribution and good access to services and amenities These communities will incorporate a range of housing choices suitable for residents at all stages of their lives and designed to support walking, cycling, and transit, and will foster healthy lifestyles Are we achieving the intent of Goal 4? Although housing supply in the region continues to grow, affordability remains a significant challenge because of high housing costs and comparably lower incomes than other metropolitan regions in Canada A third of households in the region spend more than 30% of household income on shelter The region’s housing stock remains about 60% ground-oriented and 40% apartment based, although apartment units comprised 50% of recent growth The tenure of recent housing growth was consistent with existing baselines with about two-thirds of housing units owner-occupied and one-third renter-occupied Several municipalities have developed Housing Action Plans for the first time; others are underway or being updated. Tools and measures to address housing affordability and diversity are being explored across the region Good employment distribution and diverse transportation options contribute to ‘complete communities’ (see Goals 2 and 5), but other measures for the health and livability of the region’s communities need to be considered Dwelling Units by type, tenure and price Affordable and supportive housing development and availability Incidence of core housing need Access to amenities and services How do we measure performance?
Transcript of GOAL 4: DEVELOP COMPLETE COMMUNITIES
96 Progress toward Shaping our Future
GOAL 4: DEVELOP COMPLETE COMMUNITIES
The challenge
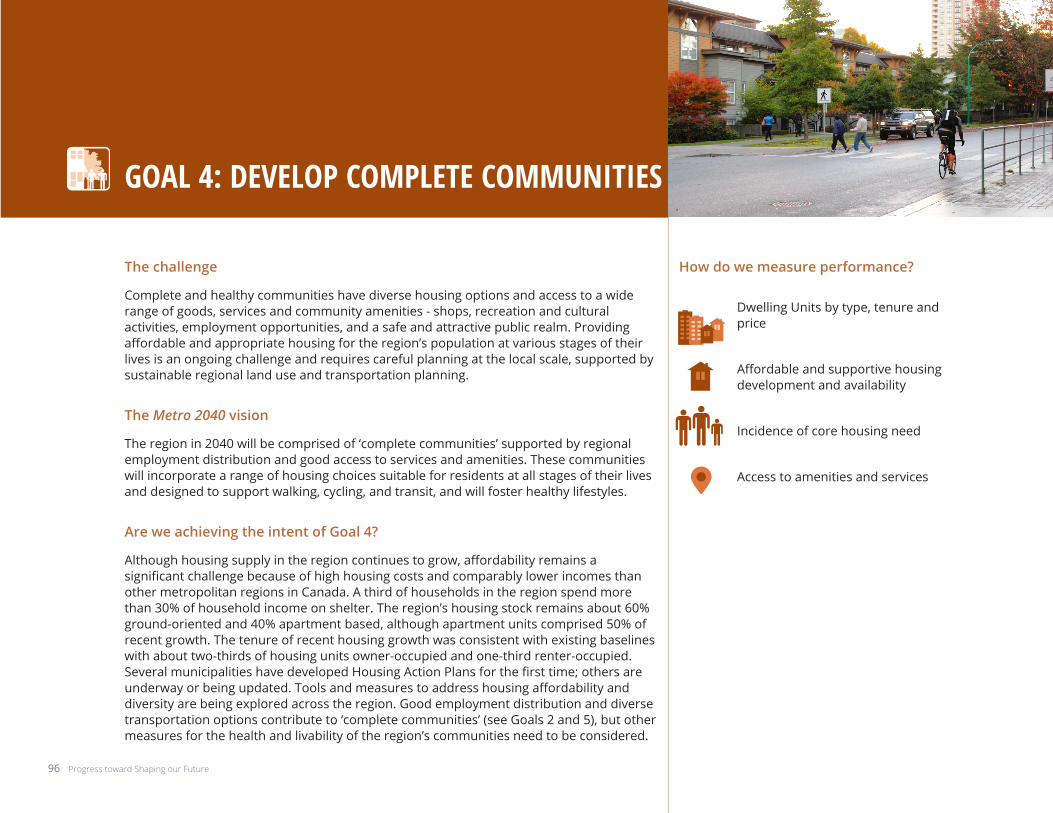
Complete and healthy communities have diverse housing options and access to a wide range of goods, services and community amenities - shops, recreation and cultural activities, employment opportunities, and a safe and attractive public realm . Providing affordable and appropriate housing for the region’s population at various stages of their lives is an ongoing challenge and requires careful planning at the local scale, supported by sustainable regional land use and transportation planning .
The Metro 2040 vision
The region in 2040 will be comprised of ‘complete communities’ supported by regional employment distribution and good access to services and amenities . These communities will incorporate a range of housing choices suitable for residents at all stages of their lives and designed to support walking, cycling, and transit, and will foster healthy lifestyles .
Are we achieving the intent of Goal 4?
Although housing supply in the region continues to grow, affordability remains a significant challenge because of high housing costs and comparably lower incomes than other metropolitan regions in Canada . A third of households in the region spend more than 30% of household income on shelter . The region’s housing stock remains about 60% ground-oriented and 40% apartment based, although apartment units comprised 50% of recent growth . The tenure of recent housing growth was consistent with existing baselines with about two-thirds of housing units owner-occupied and one-third renter-occupied . Several municipalities have developed Housing Action Plans for the first time; others are underway or being updated. Tools and measures to address housing affordability and diversity are being explored across the region . Good employment distribution and diverse transportation options contribute to ‘complete communities’ (see Goals 2 and 5), but other measures for the health and livability of the region’s communities need to be considered .
Dwelling Units by type, tenure and price
Affordable and supportive housing development and availability
Incidence of core housing need
Access to amenities and services
How do we measure performance?

STRATEGY 4.1 PROVIDE DIVERSE AND AFFORDABLE HOUSING CHOICES
Supporting the strategies and actions in the Metro Vancouver Affordable Housing Strategy to ensure there is an adequate supply of housing to meet future demand .
STRATEGY 4.2 DEVELOP HEALTHY AND COMPLETE COMMUNITIES WITH ACCESS TO A RANGE OF SERVICES AND AMENITIES
Designing communities to include a range of facilities, services and amenities, with emphasis on a healthy environment and mobility .
STRATEGIES
Metro Vancouver municipalities Metro Vancouver local centresMetro 2040 Baseline Annual Report 97

98 Progress toward Shaping our Future
Housing affordability in Metro VancouverThe following data and information is important to understanding housing affordability in the region and provides context for the subsequent performance measures .
Measuring Affordability
Housing is considered to be affordable if shelter costs comprise 30% or less of total gross household income. Affordability varies by tenure, with more renter households paying in excess of 30% of their income on shelter .
33% of households in the region spent more than 30% of their household income on shelter in 2011
160,000 of the 583,000 Metro Vancouver owner-occupied households spent more than 30% of their income on shelter
138,000 of the 308,000 Metro Vancouver renter-occupied households spent more than 30% of their income on shelter
of owners28%
of renters45%
PERCENT OF OWNER AND RENTER HOUSEHOLDS SPENDING MORE THAN 30% OF INCOME ON SHELTER BY MUNICIPALITY (2011)
% Owner-occupied % Renter-occupied
Anmore 27% 0%
Belcarra 26% 0%
Burnaby 29% 46%
Coquitlam 28% 48%
Delta 20% 37%
Electoral Area A 41% 69%
Langley Township 25% 41%
Langley City 27% 49%
Lions Bay 22% 23%
Maple Ridge 27% 45%
New Westminster 27% 44%
North Vancouver District 25% 42%
North Vancouver City 27% 43%
Pitt Meadows 28% 35%
Port Coquitlam 26% 44%
Port Moody 25% 41%
Richmond 32% 48%
Surrey 27% 38%
Vancouver 29% 46%
West Vancouver 26% 55%
White Rock 25% 45%
Metro Vancouver 28% 45%
OWNER AND RENTER HOUSEHOLDS IN METRO VANCOUVER SPENDING MORE THAN 30% OF INCOME ON SHELTER (2011)
Source: Statistics Canada 2011 National Household Survey

Source: Statistics Canada 2011 National Household Survey
COMPARISON OF CANADIAN METROPOLITAN AREAS (2011)
Comparing Other Metro Areas
In 2011, Metro Vancouver had average shelter costs comparable to other major Canadian metropolitan areas . However, Metro Vancouver households had lower median incomes than households in the other metropolitan areas, resulting in a larger share of Metro Vancouver households spending more than 30% of their income on shelter .
Canada Metro Vancouver Toronto Calgary
Household Shelter Costs
avg . shelter cost
% paying over 30%
avg . shelter cost
% paying over 30%
avg . shelter cost
% paying over 30%
avg . shelter cost
% paying over 30%
Total $1,050 25% $1,294 33% $1,366 32% $1,339 25%
Owners $1,141 19% $1,420 28% $1,516 27% $1,412 20%
Renters $848 40% $1,054 45% $1,043 43% $1,130 39%
% of renters in subsidized housing
13 .7% 13 .8% 15 .9% 11 .0%
$20
$40
$60
$80
$100 Median Household Income (thousands)
$61 $63$70
$83$76 $78$89
$98
$36$41 $41
$50
Also see...
Metro 2040 supports the strategies and actions in the Metro Vancouver Affordable Housing Strategy (2007) . The key goals of the strategy are to: 1) Increase the supply and diversity of modest cost housing; 2) Eliminate homelessness across the region; and, 3) Meet the needs of low income renters . The strategy and information about the update that is underway is available online at www .metrovancouver .org .
Baseline Annual Report 99

100 Progress toward Shaping our Future
STRATEGY 4.1: PROVIDE DIVERSE AND AFFORDABLE HOUSING CHOICES
Number of net new housing units by type
Provide diverse and affordable housing choices
Metro 2040 aims to ensure new housing stock is diverse in type and tenure
GOAL 4
STRATEGY 4 .1
TM 1
TM 2, 3 & 4
TM 5
TM 6
TM 7
STRATEGY 4 .2
2011 BASELINE SHARE OF HOUSING TYPE (2011)
2040 INTENT
In 2011, there were 889,900 private, occupied dwellings in Metro Vancouver
51% Ground-oriented
(approximately 451,500 units)
9% Row Housing
(approximately 80,500 units)
40% Apartment
(approximately 357,900 units)
Vancouver 264,600
Surrey 152,900
Burnaby 86,850
Richmond 68,000
Coquitlam 45,550
Langley Township* 37,250
Delta 34,800
New Westminster 30,600
North Vancouver District 30,600
Maple Ridge 28,000
North Vancouver City 23,000
Port Coquitlam 20,650
West Vancouver 18,400
Port Moody 12,600
Langley City 11,300
White Rock 9,900
Pitt Meadows 6,800
UBC UEL, Electoral Area A 5,000
Anmore 600
Lions Bay 500
Tsawwassen First Nation 300
Belcarra 300
*Partially suppressed for confidentiality
Ground Row Apartment
0% 20% 40% 60% 80% 100%
Total Units
Source: Published counts from the 2011 Census and 2011 National Household Survey, not including estimated census undercount
Note: Ground-oriented units include single family homes and duplexes .

Baseline Annual Report 101
TRACKING MEASURE
This measure monitors housing supply and type throughout the region as an indicator of how we are performing in terms of housing diversity . Having a diverse mix of housing type helps to ensure there is affordable and appropriate housing for residents at various stages of their lives .
HOW ARE WE DOING?
Between 2011 and 2013, approximately 29,000 new housing units were added across the region . The housing stock continues to diversify, with most areas showing larger shares of new housing in the form of apartments (50% of the new regional stock) and row housing (18% of the new regional stock), though this ranges across municipalities .
2011-2013 growth (# of units)
2011-2013 % of growth
Ground-oriented +9,200 32%
Row +5,100 18%
Apartment +14,700 50%
Total +29,000 100%
DWELLING UNIT GROWTH 2011 - 20132013 REPORT
In 2013, there were 918,900 private, occupied dwellings in Metro Vancouver
50% Ground-oriented
(approximately 460,700 units)
10% Row Housing
(approximately 85,600 units)
40% Apartment
(approximately 372,600 units)
1 2 3 4 5 6 7 8thousands
Ground Row ApartmentTotal Units
Note: Report is to mid-year 2013. Ground-oriented units include single family homes and duplexes .
+ 7,000 Surrey
+ 6,600 Vancouver
+ 3,400 Richmond
+ 2,800 Coquitlam
+ 2,200 Burnaby
+ 2,200 Langley Township
+ 700 Maple Ridge
+ 600 Port Coquitlam
+ 600 North Vancouver District
+ 550 North Vancouver City
+ 500 Delta
+ 500 UBC UEL
+ 440 New Westminster
+ 300 Langley City
+ 270 Port Moody
+ 260 White Rock
+ 90 Pitt Meadows
+ 70 West Vancouver
+ 25 Anmore
+ 3 Lions Bay
+ 2 Belcarra
- Tsawwassen First Nation
HOUSING GROWTH BY TYPE (2011-2013)

102 Progress toward Shaping our Future
STRATEGY 4.1: PROVIDE DIVERSE AND AFFORDABLE HOUSING CHOICES
Number of net new housing units by tenure
Provide diverse and affordable housing choices
Metro 2040 aims to ensure new housing stock is diverse in type and tenure
GOAL 4
STRATEGY 4 .1
TM 1
TM 2, 3 & 4
TM 5
TM 6
TM 7
STRATEGY 4 .2
2040 INTENT
In 2011, there were 889,900 private, occupied dwellings Metro Vancouver
65% Owner-occupied
(approximately 582,400 units)
35% Renter-occupied
(approximately 307,200 units)
<1% Band housing
(approximately 300 units)
2011 BASELINE SHARE OF HOUSING TENURE (2011) Owner Renter Total Units
Source: Published counts from the 2011 Census and 2011 National Household Survey, not including estimated census undercount
0% 20% 40% 60% 80% 100%
Vancouver 264,600
Surrey 152,900
Burnaby 86,800
Richmond 68,000
Coquitlam 45,550
Langley Township 37,500
Delta 34,800
New Westminster 30,600
North Vancouver District 30,600
Maple Ridge 28,000
North Vancouver City 23,000
Port Coquitlam 20,650
West Vancouver 18,400
Port Moody 12,600
Langley City 11,300
White Rock 9,900
Pitt Meadows 6,800
UBC UEL, Electoral Area A 5,000
Anmore 600
Lions Bay 500
Tsawwassen First Nation 300
Belcarra 300

Baseline Annual Report 103
TRACKING MEASURE
This measure monitors housing tenure throughout the region as an indicator of how we are performing in terms of housing diversity . A mix of rental and owner occupied housing is one indication that there is affordable and appropriate housing options for residents at various stages of their lives .
HOW ARE WE DOING?
Between 2011 and 2013, there was a modest increase in total rental housing supply . Roughly 36% of new housing supply was rental, on par with 2011 tenure . 2013 data for some types of rental stock, including row and single detached houses, is not yet available and may affect the overall share .
2013 REPORT
What’s missing?
Change in housing tenure between 2011 and 2013 by municipality is not available .
CHANGES IN RENTAL STOCK - METRO VANCOUVER 2011-2013
2011 2013 Change
2011-2013Share of Growth
Purpose Built 107,800 108,700 +900 9%
Private Condo 44,800 51,200 +6,400 66%
Secondary Suites* n/a n/a +2,370 25%
Social Housing** 50,920 51,750 +830 8%
Row / Duplex 20,640 n/a n/a n/a
Single Detached 30,870 n/a n/a n/a
Total +10,500
*New between December 2011 and December 2013.
** Social housing refers to non-profit affordable housing, usually receiving some kind of ongoing senior government subsidy . The social housing built in this time period was supportive and transitional housing for persons who are homeless or at risk of homelessness .
2011-2013 growth (# of units)
2011-2013 % of growth
Owner-occupied +18,500 64%
Renter-occupied +10,500 36%
Total +29,000 100%
In 2013, there were 918,900 private, occupied dwellings Metro Vancouver
65% Owner-occupied
(approximately 600,900 units)
35% Renter-occupied
(approximately 317,000 units)
<1% Band housing
(approximately 330 units)
HOUSING GROWTH BY TENURE (2011-2013)
Source: CMHC Rental Market Report 2011, 2013 and custom data
Note: Report is to mid-year 2013.
Also see...
Metro Vancouver provides an inventory of the purpose built rental housing stock for six municipalities as well as an assessment of risk of demolition and redevelopment in Metro Vancouver Purpose Built Rental Housing Inventory and Risk Analysis (2012), available online at www .metrovancouver .org .
Baseline Annual Report 103

104 Progress toward Shaping our Future
STRATEGY 4.1: PROVIDE DIVERSE AND AFFORDABLE HOUSING CHOICES
Number of net new housing units by average cost
GOAL 4
STRATEGY 4 .1
TM 1
TM 2, 3 & 4
TM 5
TM 6
TM 7
STRATEGY 4 .2
2011 BASELINE
HOUSING PRICE INDEX (HPI) (2011) BY MLS HPI MARKET AREA (MID-YEAR, 3 MONTH AVERAGE)
AVERAGE RENT (PURPOSE BUILT APARTMENTS) (2011)BY CMHC MARKET AREA
Municipality Detached Row Semi-Detached
Apartment
Vancouver West $2,135,400 $680,400 $477,300
West Vancouver $1,770,700 n/a $630,300
Richmond $1,026,000 $509,800 $349,100
North Vancouver $914,800 $579,900 $344,000
Burnaby $859,300 $423,600 $368,700
Port Moody $821,400 $419,600 $300,500
S . Surrey White Rock $815,398 $472,458 $323,094
Vancouver East $807,400 $495,300 $304,500
Coquitlam $686,100 $386,600 $263,800
New Westminster $659,500 $394,500 $270,300
Delta South $618,300 $459,600 $315,800
Port Coquitlam $551,500 $375,400 $239,500
Delta North $548,817 n/a n/a
North Surrey $546,694 $335,567 $246,632
Langley $523,618 $324,844 $239,684
Pitt Meadows $506,300 $336,700 $226,600
Maple Ridge $470,400 $285,500 $187,600
Municipality Bachelor 1
bedroom 2
bedroom 3+
bedroom All
West Vancouver $940 $1,208 $1,970 $2,866 $1,478
UEL n/a $1,345 $1,873 $2,245 $1,633
Vancouver $881 $1,045 $1,493 $1,859 $1,102
North Vancouver District
$855 $986 $1,257 $1,360 $1,089
North Vancouver City
$828 $943 $1,173 $1,343 $1,003
Richmond $736 $905 $1,115 $1,351 $1,007
Burnaby $733 $870 $1,103 $1,283 $936
White Rock $704 $816 $1,013 $1,395 $865
New Westminster $658 $794 $1,026 $1,355 $848
Tri-Cities $675 $785 $978 $1,209 $810
Langley City and Township
$631 $764 $910 $1,073 $828
Delta $604 $759 $956 $1,014 $838
Ridge Meadows $601 $697 $890 $1,059 $777
Surrey $610 $718 $897 $982 $814
Source: Multiple Listing Service (MLS) Housing Price Index – Greater Vancouver Real Estate Board, Fraser Valley Real Estate Board
Source: CMHC Rental Market Activity October 2011

Baseline Annual Report 105
TRACKING MEASURE
This measure tracks housing prices and rents throughout the region to help us understand how the region is performing in terms of overall housing affordability.
HOW ARE WE DOING?
The price of a typical housing unit in the region remained relatively stable between 2011 and 2013 . There is considerable variation in sale prices among housing types and municipalities . Purpose built apartment rental prices increased by about 2% per year, with smaller units seeing the highest increases .
Metro Vancouver 2011 2013 Change 2011-2013 % Change
Detached $931,300 $919,200 - $12,100 -1 .3%
Row Semi-Detached $468,700 $456,200 - $12,500 -2 .7%
Apartment $375,000 $367,700 - $7,300 -1 .9%
Source: MLS Housing Price Index – Greater Vancouver Real Estate Board, Fraser Valley Real Estate Board, Typical unit
2013 REPORT
CHANGE IN AVERAGE HOUSING PRICES (2011-2013) - HOUSING PRICE INDEX
Metro Vancouver 2011 2013 Change 2011-2013 % Change
All Units $1,027 $1,067 + $40 +3 .9%
Bachelor $839 $876 + $37 +4 .4%
1 Bedroom $964 $1,005 + $41 +4 .3%
2 Bedroom $1,237 $1,281 + $44 +3 .6%
3+ Bedroom $1,463 $1,498 + $35 +2 .4%
Source: CMHC Rental Market Report October 2011 and 2013
CHANGE IN AVERAGE RENT (2011-2013) - PURPOSE BUILT APARTMENTS
PERCENT CHANGE (2011-2013)
-1.3%
-2.7%-1.9%
+4.4% +4.3%+3.6%
+2.4%
Det
ache
d
Row
Sem
i-Det
ache
d
Apar
tmen
t
Bach
elor
1 Be
droo
m
2 Be
droo
m
3 Be
droo
m
Average Apartment Rent(purpose built rentals)
MLS Housing Price Index
Note: Purpose built apartment rental units are used as a benchmark. Private condominium rental rates are generally higher, while other secondary unit rentals are generally lower .
2040 INTENT
Provide diverse and affordable housing choices
Metro 2040 supports the strategies and actions in the Metro Vancouver Affordable Housing Strategy, a key goal of which is to increase the supply and diversity of modest cost housing .
Future measure
This measure does not reflect the cost of new units, but rather all units . Work is underway to explore alternative data sources .
Housing diversity indices are being increasingly explored and refined, adding value to singular, distinct measures like type, tenure, and cost . Metro Vancouver will explore the possibility of using a diversity index as a performance measure in the future .

106 Progress toward Shaping our Future
Vanc
ouve
r, U
BC, U
EL
$80
$70
$60
$50
$40
$30
$20
$10
$0
Met
ro V
anco
uver
Burn
aby,
New
Wes
t
Lang
ley
City
& T
owns
hip
Ridg
e M
eado
ws
Nor
thea
st S
ecto
r
Nor
th S
hore
Rich
mon
d, D
elta
, TFN
Surr
ey, W
hite
Roc
k
$63,347Regional Median
thou
sand
s
STRATEGY 4.1: PROVIDE DIVERSE AND AFFORDABLE HOUSING CHOICES
Rental units affordable to households in various income thresholds
GOAL 4
STRATEGY 4 .1
TM 1
TM 2, 3 & 4
TM 5
TM 6
TM 7
STRATEGY 4 .2
2011 BASELINE
Median household income: $63,347 Purpose built rentals: 109,000
Sources: CMHC custom analysis of Rental Market Survey data, Metro Vancouver
* Purpose built rentals only . In addition, there were 51,000 social housing units and 75-80,000 secondary units in single detached dwellings, some of which may have met these thresholds .
** There are about 45,000 condo rentals and 20,000 single detached and duplex rentals which rent at higher rates, and could be accessed by these households .
MEDIAN HOUSEHOLD INCOME BY SUBREGION
AFFORDABLE HOUSING THRESHOLDS AND AVAILABILITY OF PURPOSE BUILT RENTALS
120% of median regional household income ($76,016):
163,000 households have incomes that are between 80-120% of the regional median household income $1,900/month is their rental affordability threshold 31,000 units* (28% of the stock) rented at this rate**
80% of median regional household income ($50,678):
140,000 households have incomes that are between 50-80% of the regional median household income $1,267/month is their rental affordability threshold 63,000 units* (58% of the stock) rented at this rate
50% of median regional household income ($31,674):
217,000 households have incomes that are 50% or less than the regional median household income $792/month is their rental affordability threshold 15,000 units* (14% of the stock) rented at this rate

Baseline Annual Report 107
TRACKING MEASURE
Rental housing is generally the most affordable housing tenure. Monitoring the supply of rental housing at different affordability thresholds indicates the accessibility of affordable rental units.
HOW ARE WE DOING?
A 2011 baseline has been established for the number of purpose built rentals affordable to each income bracket. The baseline reveals that about 60% of the rental stock was affordable to households earning between 50% and 80% of the regional median income . More information is needed to fully measure rental housing affordability and supply.
Provide diverse and affordable housing choices
Metro 2040 supports the strategies and actions in the Metro Vancouver Affordable Housing Strategy, a key goal of which is to increase the supply and diversity of modest cost housing .
What’s missing?
Affordable housing availability figures are not available for 2013.
Baseline (2011) rental prices are only available for purpose built rentals . More data is needed to establish an appropriate baseline and for future tracking .
Future measure
Municipal Housing Action Plans play an important role in meeting estimated regional housing demand . Metro 2040 committed to monitoring and reporting on the success in meeting this demand and a suitable measure may be developed .
2040 INTENT
NO DATA
2013 REPORT
Also see...
Metro Vancouver helps to improve the supply of affordable housing by conducting research, including What Works: Affordable Housing Initiatives in Metro Vancouver Municipalities (2012), available online at www .metrovancouver .org .
Purpose built rentals
Housing built for the specific purpose of renting is the most secure form of rental housing supply available in the region . Other forms of rental housing such as secondary suites and condominiums form an important source of rental housing, but offer less security over the long term .
To provide an indicator of affordability, a 2011 baseline has been established for the share of purpose built rental stock that is available to households at different income levels. However, there are other types of rental units that contribute to the supply .

108 Progress toward Shaping our Future
STRATEGY 4.1: PROVIDE DIVERSE AND AFFORDABLE HOUSING CHOICES
New supportive housing
GOAL 4
STRATEGY 4 .1
TM 1
TM 2, 3 & 4
TM 5
TM 6
TM 7
STRATEGY 4 .2
2011 BASELINE
Provide diverse and affordable housing choices
Metro 2040 supports the strategies and actions in the Metro Vancouver Affordable Housing Strategy, which calls for 500 new homeless supportive / transitional housing units per year throughout the region, with the aim of creating 5,000 new units by 2017 . The Regional Steering Committee on Homelessness, a coalition of community organizations and governments working to end homelessness in Metro Vancouver, is currently updating estimates of supportive housing need as part of the update to the Regional Homelessness Plan .
2040 INTENT
Supportive housing is permanent housing with on going support services provided as needed to assist those who cannot live independently .
Transitional housing is time limited housing (usually 18 months to 2 years) with support services that help individuals move along the housing continuum (shown below) .
4,431 homeless supportive and transitional units
Market and Low-end of Market Rental
Social and Supportive Rental
Home Ownership
TransitionalEmergency Shelter
Non-market TemporaryNon-market Permanent
Market Permanent
Housing Continuum

TRACKING MEASURE
This measure tracks the supply of supportive and transitional housing for homeless persons throughout the region as an indication of how the region is performing in providing a diverse housing supply . These units provide are important elements of the housing continuum in the Metro Vancouver Affordable Housing Strategy .
HOW ARE WE DOING?
Between 2011 and 2013, 833 homeless supportive/transitional units were added in the region . Adding 833 units represents good progress towards the Metro Vancouver Affordable Housing Strategy goal of 500 units per year, although growth was not evenly distributed across the region .
HOMELESS SUPPORTIVE AND TRANSITIONAL UNITS BY SUBREGION
2013 REPORT
2011 2013 2011-2013 growth
Vancouver, UBC, UEL 3,862 4,458 596
Surrey, White Rock 231 379 148
Ridge Meadows 25 88 63
Northeast Sector 38 78 40
Langley City and Township 45 59 14
Burnaby, New Westminster 187 177 -10
North Shore 43 25 -18
Richmond, Delta, Tsawwassen FN 0 0 -
Metro Vancouver 4,431 5,264 833
Source: BC Housing, includes only facilities with financial relationship to BC Housing
Also see...
The Metro Vancouver Regional Homelessness Plan (2003) addresses the needs of people who do not have a place to call home . An update to the plan is underway and more information is available at www .metrovancouver .org .
More information about the performance measures for Strategy 4 .1 can be found in the Metro Vancouver Housing Data Book, available online at www .metrovancouver .org .
5,264 homeless supportive and transitional units
(833 units added)
Baseline Annual Report 109
Note: Through public and private partnerships, BC Housing develops, manages and administers a wide range of subsidized housing options across the province . The data presented for supportive and transitional housing for homeless persons includes only facilities in Metro Vancouver with a financial relationship to BC Housing . Learn more about BC Housing at www .bchousing .org .

110 Progress toward Shaping our Future
STRATEGY 4.1: PROVIDE DIVERSE AND AFFORDABLE HOUSING CHOICES
Number of households in Core Housing Need
GOAL 4
STRATEGY 4 .1
TM 1
TM 2, 3 & 4
TM 5
TM 6
TM 7
STRATEGY 4 .2
TRENDS IN INCIDENCE OF CORE HOUSING NEED COMPARISON OF CANADIAN METROPOLITAN AREAS (2002- 2010)
2011 BASELINE
20% of households in Metro Vancouver were in Core Housing Need in 2010
5% of individuals in Metro Vancouver were persistently in Core Housing Need between 2008 and 2010
0%
5%
10%
15%
20%
25%
2002 2003 2004 2005 2006 2007 2008 2009 2010
Canada
Calgary
Toronto
Vancouver
Source: CMHC 2013 Canadian Housing Observer (SLID based housing data)
Note: 2010 data has been used as a substitute baseline and will be updated in future reports .

TRACKING MEASURE
Core Housing Need indicates the share of households in Metro Vancouver that may have difficulty obtaining or maintaining adequate housing in the private market .
HOW ARE WE DOING?
Core Housing Need data is not available for 2011 to 2013; historic trends are provided as a substitute baseline . Metro Vancouver has had a consistently higher incidence of Core Housing Need than the Canadian urban average, and most recently has had the highest incidence of any major Canadian metropolitan area .
What’s missing?
Core Housing Need data is not available for 2011 or 2013; historic trends are provided as a substitute baseline . The substitute baseline will be updated in future reports .
Provide diverse and affordable housing choices
Recognizing that all levels of government have a role to play in creating opportunities for diverse housing options, Metro 2040 encourages municipalities to anticipate future housing needs, particularly the needs of low and moderate income households, in their land use and development policies and to partner with senior levels of government to facilitate housing for low income households .
2040 INTENT
Measuring Core Need
Core Housing Need is a measure that was developed by Canada Mortgage and Housing Corporation (CMHC) in 1986 to allocate scarce social housing units across the country to those most in need .
A household is considered to be in Core Housing Need if the resident(s) cannot afford to pay the average market rent for the area and if their current shelter is:
• unaffordable (costs more than 30% of the household’s before-tax income); or,
• inadequate (in need of major repair, as reported by the resident); or,
• unsuitable (does not meet National Occupancy Standards for the size and make-up of the household) .
NO DATA
2013 REPORT
Baseline Annual Report 111

112 Progress toward Shaping our Future
STRATEGY 4.1: PROVIDE DIVERSE AND AFFORDABLE HOUSING CHOICES
Number of municipalities that have adopted and begun to implement Housing Action Plans
GOAL 4
STRATEGY 4 .1
TM 1
TM 2, 3 & 4
TM 5
TM 6
TM 7
STRATEGY 4 .2
2011 BASELINE
Provide diverse and affordable housing choices
Metro 2040 supports the strategies and actions in the Metro Vancouver Affordable Housing Strategy and assists municipalities in developing housing action plans .
Housing action plans (HAPs):
• assess local market conditions;
• identify housing priorities;
• identify implementation measures which may encourage new rental housing;
• where appropriate, mitigate the loss of existing rental housing; and,
• identify opportunities to participate with other levels of government to secure additional rental units .
2040 INTENT
9 Metro Vancouver municipalities had adopted housing action plans
257 tools and measures had been adopted in Metro Vancouver municipalities to promote housing affordability and diversity
Also see...
A Summary of the Municipal Strategies and Actions to Address Housing Affordability in Metro Vancouver was updated in December 2013 and is available online at www .metrovancouver .org .

Baseline Annual Report 113
TRACKING MEASURE
This measure monitors adoption and implementation of housing action plans . Adopting a housing action plan indicates the commitment of a municipality to facilitating housing diversity and affordability. In addition, there are a range of municipal tools that may be implemented to achieve housing affordability and diversity objectives.
HOW ARE WE DOING?
Between 2011 and 2013, three municipalities adopted housing action plans . The remaining municipal plans are pending . In addition, some municipalities are updating older housing action plans . Municipalities have adopted a number of new measures to implement these plans; many were zoning and regulatory actions .
Note: Most municipalities have committed through the RCS process to prepare a HAP within the next few years, however, the timing will vary depending on the extent of local housing affordability concerns and competing municipal priorities.
12 Metro Vancouver municipalities had adopted housing action plans
321 tools and measures had been adopted in Metro Vancouver municipalities to promote housing affordability and diversity
2013 REPORT
Municipality Status Adopted Update
Coquitlam Adopted 2007 Pending
Langley City Adopted 2009
Langley Township Adopted 2013
Maple Ridge Adopted 2003 Pending
New Westminster Adopted 2010
North Vancouver City
Adopted 2006 Pending
North Vancouver District
Adopted 1992 Pending
Pitt Meadows Adopted 2013
Port Moody Adopted 2009
Richmond Adopted 2007 Pending
Vancouver Adopted 2011
West Vancouver Adopted 2013
Delta Pending
Port Coquitlam Pending
White Rock Pending
Surrey Pending
Burnaby Pending
Type of measure Measures adopted
New measures
Pending or exploring
2011 2013 2011-2013 2011-2013
Fiscal measures 43 53 +10 1
Planning policies 43 52 +9 2
Zoning/regulatory actions
119 142 +23 10
Approval process 16 19 +3 0
Rental housing loss prevention
25 34 +9 2
Education and advocacy 11 21 +10 2
Total 257 321 +64 17
STATUS OF MUNICIPAL HOUSING ACTION PLANS (AS OF YEAR-END 2013)
MUNICIPAL MEASURES FOR HOUSING AFFORDABILITY AND DIVERSITY (AS OF YEAR-END 2013)

114 Progress toward Shaping our Future
STRATEGY 4.2: DEVELOP HEALTHY AND COMPLETE COMMUNITIES WITH ACCESS TO A RANGE OF SERVICES AND AMENITIES
Access to parks, community / recreation centres and grocery stores
GOAL 4
STRATEGY 4 .1
STRATEGY 4 .2
TM 1, 2, 3, & 4
2011 BASELINE
Develop healthy and complete communities
Metro 2040 encourages municipalities to design communities that have walkable access to amenities and services, and that encourage a healthy lifestyle .
2040 INTENT
Measuring accessibility
A healthy, complete community is one with good access to a range of amenities and services . These include public spaces, parks and recreational facilities, art and cultural facilities, and important services such as healthy and affordable food stores, and medical and educational institutions .
Although the region does have a substantial amount of park space and an estimated 90% or more of residents have access to local parks, a comprehensive index of park and recreational demand, use, and accessibility is not currently available .
While an estimated three-quarters of the population lives within roughly a 10-minute walk of a grocery store, this does not necessarily indicate good access to fresh affordable food across the region .

TRACKING MEASURE
Measures for this strategy need to provide an indication of the extent to which urban communities are designed to facilitate access to amenities and services . Tracking the measures provided in Metro 2040 for complete communities has proved to be a challenge. Sufficient data is not currently available to report out on existing measures, future measures are being explored .
HOW ARE WE DOING?
The Metro Vancouver region has a reputation for livability . Large recreation areas and parks are found across the region and smaller pockets of greenspace exist throughout the urban fabric . Compact communities provide opportunities for diverse community amenities . Ways to measure elements such as these, which contribute to a livable region, will be further explored the future .
Future measure
These measures will be further evaluated in the future to ensure they are capturing the success in implementing the strategy .
Also see...
The Metro Vancouver Regional Parks Plan (2011) promotes the health and well being of residents through strategies that improve access to a wide range of outdoor recreation services and amenities close to home . For more information, visit the Regional Parks Planning page online at www .metrovancouver .org .
The Experience the Fraser Project will connect residents and visitors with communities, nature and the river by creating an opportunity for over 300 kilometres of multi-use trail and related amenities along the Fraser River . For more information, visit the Experience the Fraser page online at www .metrovancouver .org .
NO DATA
2013 REPORT
Baseline Annual Report 115