Go for Profit and Growth!...Dividend (comparable) 1.10(2) 1.00 The Siemens share As of September 30,...
202
Go for Profit and Growth! s Annual Report 2003
Transcript of Go for Profit and Growth!...Dividend (comparable) 1.10(2) 1.00 The Siemens share As of September 30,...

Go for Profit and Growth! sAnnual Report 2003

2
4 Letter to our shareholders
9 At a glance
14 Innovation, Customer focus,
Global competitiveness
20 Business areas
40 Report of the Supervisory Board
48 Corporate Governance Report
54 Compensation Report
60 Information for shareholders*
62 Management’s discussion and analysis
110 Consolidated financial statements
186 Statement of the Managing Board
187 Independent auditors’ report
190 Supervisory Board
192 Managing Board
198 Financial calendar
Corporate structure**
* With separate table of contents ** See fold-out inside back cover.

Siemens stands for innovation, customer focus and global com-
petitiveness – all around the world. Generating synergies for a
unique array of products, services and solutions, our broad port-
folio gives us a competitive edge, particularly in tough times.
We continue to pursue the timeless vision of our founder,
Werner von Siemens: to develop cutting-edge technologies for
a better world. Siemens embodies sustainable success on a
global scale. Today, our global network of innovation com-
prises more than 400,000 employees, millions of customers
and hundreds of thousands of partners and suppliers in over
190 countries.
3
financial highlights
in millions of euros 2003(1) 2002(1)
New orders 75,056 86,214
Sales 74,233 84,016
Net income Excluding a gain on sales of shares of Infineon 2,445 1,661Gain on sales of shares of Infineon – 936Total net income 2,445 2,597
Net cash provided by operating activities 5,712 5,564
Net cash used in investing activities (3,939) (810)
Research and development expenses 5,067 5,819
Shareholders’ equity (September 30) 23,715 23,521
Employees (September 30, in thousands) 417 426
(1) Fiscal year: October 1 – September 30

4 letter to our shareholders

letter to our shareholders 5
Dear shareholder,
Siemens’ net income in fiscal 2003 was nearly 50 percent higher than the
comparable figure a year earlier. In light of the generally unfavorable con-
ditions on our markets, this is a major success. Most of our Groups have
shown that they can hold their own – even in a difficult business environ-
ment. We have established a strong performance-oriented culture with
clear goals, concrete measures and rigorous consequences.
Once again, cash flow development was especially gratifying. Net cash
provided by operating activities, less net cash used in investing and
financing activities, totaled €1.8 billion – despite supplemental contribu-
tions to our pension funds. The managers at our Groups have embraced
the philosophy that “cash is king,” having recognized that consistently
positive cash flow gives our businesses the entrepreneurial leeway they
need to secure competitive advantages, particularly when times are tough.
The capital markets have rewarded our success. Following declines in
early October 2002 and in March 2003 – when the Siemens share price
dropped to nearly €30 in a generally weak equity market – our stock
rebounded sharply, to more than €50 a share at the end of the fiscal year.
For fiscal 2003, we will propose a dividend of €1.10 per share. Your confi-
dence in the Siemens share has paid off. And we will continue doing every-
thing in our power to prove to you – and the capital markets – that
Siemens is on course and making continous headway.
At the end of 2000, as we neared completion of our Ten-Point Program,
we negotiated medium-term margin targets with our Groups. These tar-
gets were partly based on market conditions at that time. In the spring of
2001, however, the information and communications market, in particu-
lar, showed first signs of major structural difficulties. In response, we
launched our Operation 2003, which defined the key areas where counter-
measures were necessary. The results are now in:
“We have establisheda strong performance-oriented culture withclear goals, concretemeasures and rigorousconsequences.”

6 letter to our shareholders
“Eight of our nine Groupswith margin targets forfiscal 2003 came throughwith flying colors.”
■ Eight of our nine Groups with margin targets set for fiscal 2003 came
through with flying colors. These Groups – Power Generation, Medical
Solutions, Automation and Drives, Osram, Power Transmission and
Distribution, Transportation Systems, Siemens VDO Automotive and
Siemens Financial Services – achieved earnings that rank with the best
in their industries. At Siemens Building Technologies, the only Group
to clearly miss its target, we have taken appropriate action.
■ We gave some Groups – primarily those in our I&C business area –
more time to reach their margin targets because of the structural
weaknesses in their markets. These Groups have also made solid
progress. IC Mobile and Siemens Business Services were in the black
in fiscal 2002 and again in 2003. IC Networks returned to profitability
in the fourth quarter of fiscal 2003 after extensive restructuring.
■ In asset management, our third action area, we exceeded our targets –
as our cash flow figures clearly confirm.
■ We also increased the profitability of our U.S. activities on a sustain-
able basis – another focus of Operation 2003. Only one of our
U.S. Operating Companies posted a loss in 2003 – a situation we will
correct in the current fiscal year.
■ Our last action area involved cutting central costs. Here, too, we have
been successful, slashing costs at our Corporate, Group and Regional
headquarters by €1 billion within three years.
The Managing Board has decided not to change the Group margin
targets. The Groups that have already reached their targets are making
further progress. The others are intensifying their efforts to reach their
targets as soon as possible.

letter to our shareholders 7
“In the future, we willconcentrate on threecompany-wideprograms – Innovation, Customer focus andGlobal competitiveness.”
Besides implementing Operation 2003, we also conducted a thorough
review of our management system, which we wanted to make even more
transparent and easier to understand. That’s why we expanded our top+
business excellence program at the start of fiscal 2004, integrating it into a
reorganized Siemens Management System.
In the future, we will concentrate on three Company-wide programs –
Innovation, Customer focus and Global competitiveness – into which we are
incorporating all our existing initiatives and projects. We are gearing our
management development and employee learning measures to support
and complement these programs.
At the end of October 2003, our Company’s top managers committed
themselves to our directive for fiscal 2004 – “Go for profit and growth” –
and familiarized themselves with the three Company programs:
■ As part of our Innovation program, we will focus more strongly on
developing trendsetting technologies and cross-Group technology
platforms. We have already scored initial successes in this area – for
example, at Medical Solutions and at Automation and Drives. This pro-
gram will enable us to leverage the Company’s synergies even more
effectively in the future.
■ By implementing our Customer focus program, we intend to substan-
tially boost growth – but not at the expense of earnings. Our regional
strategies will continue to concentrate on Europe and the United States.
In China, we are redoubling our efforts with a fresh initiative. We also
foresee major potential in India and Russia.
■ Under our Global competitiveness program, we plan to expand our
presence at lower-cost locations. This applies to purchasing as well as
to manufacturing, software development and administrative services.

We see a good chance to increase sales and earnings once again by
implementing these Company-wide programs. If the overall economic
situation allows, we could even achieve a double-digit percentage
increase in net income in fiscal 2004.
Siemens is renowned for its sound financial management. We have
established a highly transparent internal and external reporting system.
The Company is firmly committed to good corporate governance – and
we practice what we preach. We welcome the discussion that is leading to
more stringent accounting rules and regulations in the U.S. and Europe.
Our aim is to continually increase the value of the Company – your
Company. At the same time, we subscribe to the principles of good corpo-
rate citizenship. As our Corporate Principles state: “Our ideas, technolo-
gies and activities help create a better world. Integrity guides our conduct
toward our employees, business partners and shareholders.” Ultimately,
these values are the best prerequisite for sustainable success.
8 letter to our shareholders
Dr. Heinrich v. Pierer
President and Chief Executive Officer
Siemens AG
“We have established ahighly transparent internaland external reportingsystem.”

at a glance 9
Managing Board of Siemens AG*
* As of January 1, 2004For further information, see the fold-out inside the back cover.
At a glance
Heinrich v. Pierer, Dr. jur. Dr.-Ing.E.h.,President and ChiefExecutive Officer
Jürgen Radomski
Rudi Lamprecht
Edward G. Krubasik,Prof. Dr. rer.nat.
Uriel J. Sharef,Dr. rer.pol.
Johannes Feldmayer
Thomas Ganswindt
Klaus Kleinfeld,Dr. rer.pol.
Heinz-Joachim Neubürger
Erich R. Reinhardt,Prof. Dr.-Ing.
Claus Weyrich, Prof. Dr.phil. Dr.-Ing.E.h.
Klaus Wucherer, Prof. Dr.-Ing.

10 at a glance
Stock market information
in euros 2003(1) 2002(1)
Stock price range (XETRA closing prices, Frankfurt)
High 58.32 78.52
Low 32.05 34.00
Year-end 51.14 34.00
Number of shares (year-end, in millions) 891 890
Market capitalization (year-end, in millions of euros) 45,559 30,273
Per-share data
Earnings per share 2.75 2.92
Earnings per share (fully diluted) 2.75 2.92
Dividend (comparable) 1.10(2) 1.00
The Siemens share
As of September 30, 2003, the capital stock of Siemens AG totaled approximately €2.7 billion,
representing some 891 million no-par value shares in registered form. Each share has one vote.
In fiscal 2003, the Siemens share was traded on all German stock exchanges, the Swiss stock
exchange, and stock exchanges in London, Paris and New York. On the New York Stock Exchange,
Siemens shares are traded in the form of ADRs (American Depositary Receipts), with one ADR
corresponding to one Siemens share.
Sales by region
Adjusted for currency effects and portfolio activities, sales declined 4% in fiscal 2003 to €74.2 bil-
lion. They totaled €17.1 billion in Germany, €15.4 billion in the U.S. and €8.7 billion in Asia-Pacific.
At €2.8 billion, sales in China were below the prior-year figure of €3.2 billion, primarily as a result
of currency effects.
Figures reflect the stock split of April 30, 2001
(one additional share for every two shares held).(1) Fiscal year: October 1 to September 30(2) To be proposed at the Annual Shareholders’
Meeting
180
160
140
120
100
8010/1/02 9/30/03
Siemens Dow Jones STOXX® DAX®
indexed
Germany
Europe(excluding Germany)
The Americas
Asia-Pacific
Other
5%
13%
30%
30%
22%
6%
12%
29%
32%
21%
87.
0
84
.0
6%
12%
25%
34%
23%
74.2
20
03
20
02
20
01
in billions of euros

at a glance 11
Investments in research and development
In fiscal 2003, Siemens invested €5.1 billion in research and development, or more than €23.2 mil-
lion every workday. We have nearly 50,000 R&D employees worldwide. Their activities focus on all
major markets that are undergoing dynamic economic and technological development.
Most of our R&D outlays flow into information, communications and automation technologies.
Embedded software is playing an increasingly vital role in our products and systems, performing
a growing range of functions in everything from communications networks, mobile phones, vehi-
cle navigation systems and railway automation solutions to computed tomography systems for the
healthcare community and control technology for power plants and power grids. Siemens has
more than 30,000 software engineers around the globe.
Our R&D activities generate customer value by serving as a springboard for innovative prod-
ucts, systems and services. We aim to set the pace in as many sectors as possible. Critical success
factors include systematic innovation planning, leadership in key strategic technologies, a strong
patent portfolio and optimized innovation processes. We leverage technology synergies across the
entire company, reaping the benefit of systematic best practice sharing and cross-Group technolo-
gies – such as software architecture and sensor systems, shared platforms like SIMATIC for automa-
tion applications and syngo® for diagnostic imaging.
Our innovative strength derives from the creativity, commitment and knowledge of our
researchers around the world, who are the backbone of our GLOBAL NETWORK OF INNOVATION.
www.siemens.com/research_and_development
Patents
In fiscal 2003, our innovative solutions yielded more than 7,000 inventions, and we filed patent
applications for over two-thirds of these. Siemens is a leader in international patent statistics. In
Germany, we were the largest applicant, while in Europe we held the No. 2 spot. We also ranked
among the top ten patent holders in the United States. More than 45,000 patents worldwide are a
testimony to our power of innovation.
Our competitive position in the patent field also depends on the strategic management of our
patent portfolio. Rigorous patent management entails focusing on trendsetting technologies,
eliminating any gaps in our patent portfolio, optimizing our portfolio for each region, and exchang-
ing and granting licenses.
www.siemens.com/intellectual_property
Information andCommunications
Automationand Control
Power
Transportation
Medical
Lighting
Other
6%
4%
11%
16%
7%
15%
41%
5.8
2
3%4%
13%
17%
7%
17%
39%
5.0
72
00
3
20
02
in billions of euros

12 at a glance
Employees worldwide
At the end of fiscal 2003, Siemens had 417,000 employees worldwide. Germany accounted for
41% (170,000) of this total, followed by the other European countries, with 26% (108,000). North
America was home to roughly 16% (69,000) of our workforce, while Asia-Pacific contributed about
11% (44,000), and Latin America 4% (18,000). Approximately 2% (8,000) of our employees
worked in other regions (Africa, the Middle East, the C.I.S. countries).
Women at Siemens
Women comprise 27% (112,000) of our global workforce. Twenty percent of the women employed
at Siemens (23,000) hold university degrees, of which 10,000 are in technical or scientific fields. In
fiscal 2003, roughly 34% (10,900) of all new hires worldwide were women. At the end of the fiscal
year, women occupied 9% (around 5,250) of our 58,400 managerial positions.
Developing our people’s competencies
Our commitment to vocational training and continuing education is unwavering. About 40% of
the roughly €500 million we invested in this area in fiscal 2003 flowed into vocational training and
60% into business-oriented continuing education. Our vocational training programs span 35 pro-
fessions and courses of study. Some 12,000 young people are currently enrolled in apprenticeship
and work-study programs.
Employee qualifications
More than two-thirds (68% or some 284,000) of our 417,000 employees have professional qualifi-
cations. Thirty-four percent (141,000) hold university degrees, of which 25% (104,000) are in engi-
neering or the sciences. Another thirty-four percent (143,000) have earned a vocational school
diploma or completed an apprenticeship. Slightly less than one-third (133,000) have qualifications
in fields unrelated to their work or are without any prior professional training.
New hires
Last fiscal year, we hired 32,200 employees worldwide, 30% (9,700) of whom hold university
degrees. Roughly two-thirds (6,400) of our university-trained new hires are engineers or scien-
tists. As these figures attest, we continue to boast a highly-qualified workforce.
Europe(excluding Germany)
108,000 = 26%
The Americas
87,000 = 20%
Other
8,000 = 2%
Germany
170,000 = 41%
Asia-Pacific
44,000 = 11%
Unrelatedqualifications orno prior training
133,000 = 32%
University degrees
141,000 = 34%of which104,000 = 25%are in engineeringor the sciences
Vocational trainingor apprenticeship
143,000 = 34%

at a glance 13
Group Presidents*
* As of January 1, 2004For further information, see the fold-out inside the back cover.
Helmut GierseA&D
Joergen Ole Haslestad I&S
Udo Niehage, Dr.-Ing.PTD
Wolfgang Dehen SV
Heinrich Hiesinger,Dr.-Ing.SBT
Wolf-Dieter Bopst,Dr.oec.publ.Osram
Johann LöttnerSD
Hans M. SchabertTS
Rudi LamprechtICM
Thomas GanswindtICN
Paul A. StoddenSBS
Klaus Voges PG
Erich R. Reinhardt,Prof. Dr.-Ing.Med
Herbert Lohneiß,Dr. rer.nat. SFS

“Although our piezo-injection technology has
been on the market just a short time,
it’s already built into more than a million cars.” Wendelin Klügl, Head of Common Rail, Siemens VDO Automotive, Regensburg, Germany
14 innovation

innovation 15
Our researchers and developers are constantly setting new
standards in basic technologies and generating a steady stream
of inventions and patents. Bottom-line success depends on
leveraging the innovative strength of every R&D unit across the
entire company. A single invention can lead to trailblazing appli-
cations in very diverse fields. Take our piezo-electric actuators,
for instance. They’re already a success in Siemens VDO’s high-
speed fuel-injection valves, which are making today’s common-
rail and pumped-jet diesel engines run more quietly, smoothly,
cleanly and efficiently. In the future, these actuators will also be
used in gasoline engines, in motors for power windows and to
dampen vibrations in cars and other products. Synergies
between R&D and production are just one outstanding strength
of Siemens’ global network of innovation.

“The One Siemens formula for success is simple:
We bundle our technological strengths and offer
our customers tailored solutions from a single source.”Mindy Kantor, Marketing Director, Siemens One, Iselin, New Jersey, USA
16 customer focus
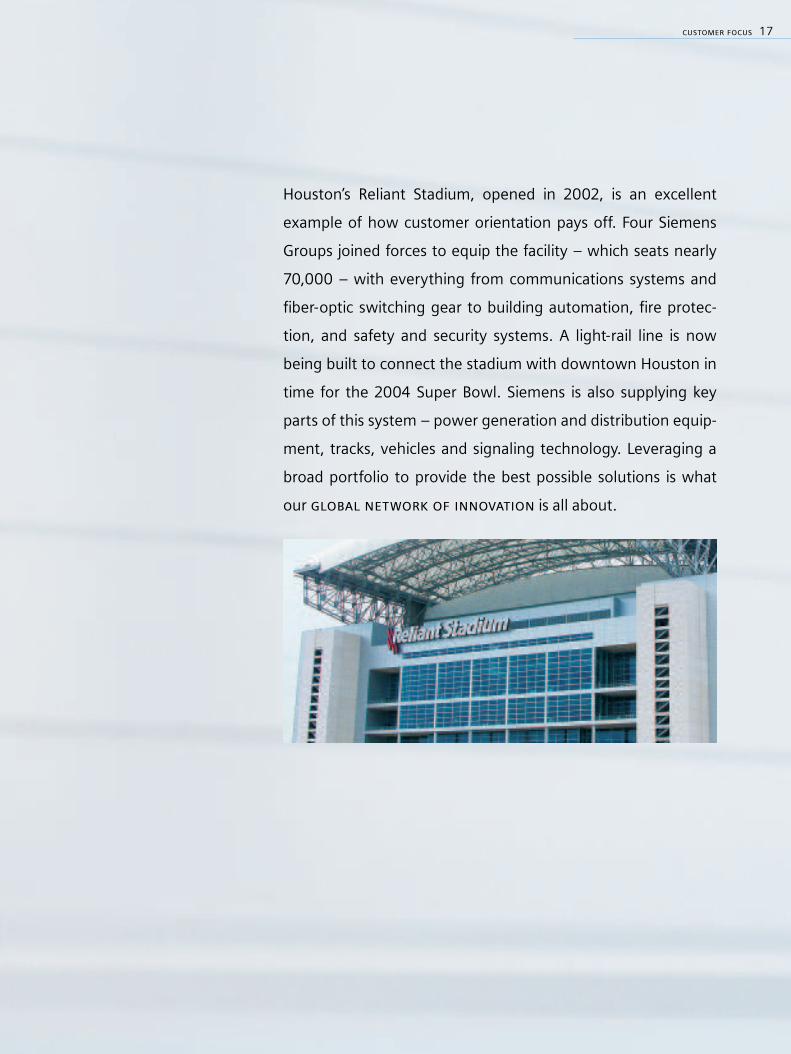
Houston’s Reliant Stadium, opened in 2002, is an excellent
example of how customer orientation pays off. Four Siemens
Groups joined forces to equip the facility – which seats nearly
70,000 – with everything from communications systems and
fiber-optic switching gear to building automation, fire protec-
tion, and safety and security systems. A light-rail line is now
being built to connect the stadium with downtown Houston in
time for the 2004 Super Bowl. Siemens is also supplying key
parts of this system – power generation and distribution equip-
ment, tracks, vehicles and signaling technology. Leveraging a
broad portfolio to provide the best possible solutions is what
our global network of innovation is all about.
customer focus 17

“Developing the syngo software platform means
cooperating across continents.”Miroslav Kliment, syngo Project Head, Program and System Engineering, Kosice, Slovakia
18 global competitiveness

Best practice sharing – that’s what we call knowledge exchange
across Siemens’ global network. We have 30,000 software engi-
neers all around the world, and 60 percent of our sales depend
on the solutions they develop. Synergies in software often give
us a decisive competitive edge. Our syngo® platform, which is
now incorporated into more than 40 of our products, is a per-
fect example. It provides doctors with a uniform graphic inter-
face for everything from ultrasound devices to MRI systems –
for applications ranging from image generation and processing
to data archiving and patient monitoring. Key syngo® compo-
nents are developed by international teams at Program and
System Engineering, a Siemens-owned software and electron-
ics company with 5,000 employees in Austria, Germany, East-
ern Europe, Turkey and, soon, China. At the forefront of global
competition – that’s Siemens’ global network of innovation.
global competitiveness 19

20 business areas
Business areas
21 Information and Communication Mobile
22 Information and Communication Networks
23 Siemens Business Services
24 Automation and Drives
25 Industrial Solutions and Services
26 Siemens Dematic
27 Siemens Building Technologies
28 Power Generation
29 Power Transmission and Distribution
30 Transportation Systems
31 Siemens VDO Automotive
32 Medical Solutions
33 Osram
34 Siemens Financial Services
35 Siemens Real Estate
36 BSH Bosch und Siemens Hausgeräte GmbH
37 Fujitsu Siemens Computers (Holding) BV

business areas 21
As a full-line supplier and systems integrator, we ensure smooth interaction among all mobile
communications components: infrastructure technologies, mobile handsets, wireless modules,
multi-vendor applications and products for wireless voice and data communications. Cooperating
with customers and partners throughout the world, we leverage our expertise to develop innova-
tive products, solutions and services. Together, we are exploiting new opportunities and driving
market growth.
We supply mobile infrastructure for 180 customers in more than 90 countries, making us one
of the top three providers worldwide. With our partner NEC, we have set up the first commercial
networks in the UK, Italy, Austria and Hong Kong to employ the Universal Mobile Telephone Stand-
ard (UMTS). With more than two dozen UMTS orders, we are a market leader in next-generation
wireless technology. We also stand for quality and reliability in GSM, GPRS and EDGE systems.
Last year, we launched 26 new cell phones – including the U10 and U15 phones for UMTS,
the SL55 Slider Phone and eleven cellular camera phones such as the SX1 Smart Phone. We are
the world leader in phones based on Digital Enhanced Cordless Technology (DECT). Our award-
winning products prove that we deliver more than technology. Our Xelibri line features the first
cell phones to be marketed as fashion accessories. We have redefined the cordless phone market
with our exclusive designs. Last year, in cooperation with the Italian designer Alessi, we unveiled
the first designer cordless telephone.
We are also an innovation leader in the fast-growing market for wireless modules. As a top-
tier supplier in such key sectors as automobiles, machine-to-machine communication and con-
sumer goods, we are generating high growth. And with our international network of developers
and manufacturing locations – including cell phone production facilities in Germany, China and
Brazil – we’re poised to exploit high-growth opportunities worldwide.
Information and Communications
Information and Communication Mobile (ICM)
Siemens’ Information and Communications business area comprises three Groups:
Information and Communication Mobile, Information and Communication Networks,
and Siemens Business Services. Our range of complex I&C solutions makes us a world
leader in our industry. We provide key technologies, applications and services: Next
Generation Network, mobile communications, e-business solutions and a wide array
of IT services.
€10.0
€180
billion in sales
million in group profit

€7.1
€(366)
22 business areas
Information and Communication Networks (ICN)
We offer innovative communications technologies to equip our customers for the future and
enhance their competitive advantages. Our solutions are based on the Next Generation Network,
which connects people and organizations quickly and effectively via open, flexible infrastructures.
With our HiPath IP convergence product family, we enrich enterprise data networks with voice
applications and integrate communications into business processes, significantly boosting our cus-
tomers’ productivity.
For network operators, our complete SURPASS solutions and comprehensive support open
up new business opportunities in innovative services.
Our novel LifeWorks concept helps customers generate sustainable growth. LifeWorks links
enterprise networks with public telecommunications systems, making the applications hosted by
these systems accessible to any network and any end user. By creating a shared communications
environment, LifeWorks provides uniform access to data, applications and services – in the office,
at home and on the road.
We are focusing on innovations that drive the Next Generation Network and leverage its
potential. Our R&D activities concentrate primarily on technologies that merge voice and data net-
works, provide access to broadband applications and advance optical networks.
billion in sales
million in group profit

business areas 23
Siemens Business Services (SBS)
We are an international IT service company, benefiting more than 10,000 customers around the
world with our industry knowledge, systems expertise and coordinated portfolio of multi-vendor
services. We focus on providing manufacturers, financial service providers and public-sector clients
with consulting, systems integration and solutions, as well as operating and maintaining their
complex IT infrastructures.
Our customers trust us to analyze their business processes and manage their mission-critical
projects. When it comes to vital IT applications, our expertise generates added value – whether it’s
a rapid return on investment or sustainable business growth.
Our IT solutions optimize customers’ business procedures by integrating standard applica-
tions. For example, we are Europe’s leading provider of innovative e-government solutions, serv-
ing public-sector clients such as the German city of Cologne, Italy’s Carabinieri police force and the
Norwegian army.
Outsourcing projects already account for about half our sales. As more and more companies
see the advantages of turning their IT infrastructures and IT-based business processes over to
experts, our outsourcing business is sure to grow.
Meanwhile, we’re driving our IT maintenance business – already the world’s largest provider
of multi-vendor services – with innovative service concepts.
We generate some 50 percent of our total sales outside Germany. We’re particularly intent on
continuing our expansion in North America, where we already do business with half of the coun-
try’s 100 largest companies.
€5.2
€13
billion in sales
million in group profit

24 business areas
Automation and Drives (A&D)
Our advanced automation, drives, switchgear and installation technologies are renowned world-
wide – and have kept our business growing in a difficult economic environment. We are consoli-
dating our position as world market leader and boosting our earnings to new levels.
Step-by-step, we are expanding the array of innovative products and systems based on our
Totally Integrated Automation and Totally Integrated Power platforms – thus enabling customers
to increase their profitability while safeguarding their investments. Recent successful launches
include the Simotion motion control system for production machinery and Sinamics, a new gener-
ation of drives.
Working with partners from Siemens’ Power Groups and Automation and Control Groups, we
have bundled process know-how with offerings for automation and power distribution. That’s how
we created Siemens Industry Suites – a unique sector-oriented range of products and services that
substantially enhances customer productivity by pulling together all the steps in the production
process.
Cooperating with external partners as well, we will continue to expand our presence in the
world’s key markets for automation and drives.
To improve our processes and cost positions, we are using top+ tools like asset management
and quality assurance, and exploiting e-business applications, which we are continually optimizing
and expanding.
Siemens’ Automation and Control business area is the world’s largest supplier of prod-
ucts, systems, solutions and services for industrial and building automation. We help
our customers optimize their business and production processes, enabling them to
improve their efficiency and profitability. Using the latest information technology, our
Automation and Control Groups cooperate closely to exploit development synergies in
the four main fields of automation: manufacturing, process, building and logistics.
Automation and Control
€8.4
€806
billion in sales
million in group profit

business areas 25
Industrial Solutions and Services (I&S)
We are experts in building and operating systems for the process and manufacturing industries. In
fiscal 2003, we sharpened our focus on our two major strengths: industry solutions and traffic con-
trol systems.
In the industry sector, our innovative solutions and services help customers boost productivity
at their existing facilities. In concert with our partners at other Siemens Groups, we are developing
product families for the Siemens Industry Suites. These complete, integrated solutions extend
from the automation level to the management level, spanning the entire production process, from
receiving raw materials to shipping finished products. Tight integration of all process steps and
plant systems provides our customers with innovative ways to control production processes and
enhance productivity. It also guarantees a high degree of operational security, while cutting invest-
ment risks and costs. We are currently focusing our new product families primarily on the paper,
mining and metals, oil and gas, and potable and waste water sectors.
In other industry segments and in the infrastructure business, our IT solutions optimize cus-
tomer processes, and our advanced maintenance management tools minimize downtime. In
marine engineering, we are a leading provider of electrotechnical equipment.
In the traffic control sector, we are well-positioned in conventional traffic control and guid-
ance systems. We are strengthening our traffic telematics business by expanding our mobility
management activities. Our telematics solutions will enable us to exploit the expected growth in
demand for traffic management systems.
€4.0
€(41)
billion in sales
million in group profit

26 business areas
Siemens Dematic (SD)
We automate logistics, materials flow and production processes. As an innovative partner, we
develop everything from products and modular components to IT solutions and entire systems.
Our particular strengths are distribution, industrial and airport logistics, the automation of postal
and freight centers, and electronics assembly. We generate more than half our sales in the
Americas.
Our activities focus on specific sectors – including chemicals and pharmaceuticals, food and
beverages, electronics, wholesalers and retailers, automobiles, airports, and postal, courier, pack-
age and express services.
To implement our sector strategy, we are rigorously synergizing activities both within our
Group and across the entire Siemens organization. Our goal is to offer customers fully integrated,
high-performance automation solutions by exploiting innovative ideas and standardizing architec-
tures for software, controls and mechatronic systems. Recent innovations include our Siplace X
series, a new benchmark for electronics pick-and-place machines, our iSort system for sorting a
broad range of mail types, and our new High Speed Diverter for baggage handling.
Our acquisition of Automation Technologies Industries in the U.S. has rounded out our range
of products and services in the area of electronics production. Alliances with SAP and Manhattan
Associates in the U.S. have augmented our offerings in logistics IT. A cooperative venture with the
Japanese vendor TKK is helping us further expand our activities in Asia.
€2.6
€(218)
billion in sales
million in group profit

business areas 27
Siemens Building Technologies (SBT)
We are a world leader in building automation – offering a comprehensive range of products, sys-
tems and services for building security, fire protection and comfort control. To meet the growing
demand for integrated solutions that can be implemented worldwide, we have developed global
platforms. We continue to expand our range of Web-based services for optimizing energy use. Our
portfolio gives customers the best of both worlds: complete systems and comprehensive services,
coupled with tailored components and solutions integrated into their business processes.
To further broaden our offerings, we are continuously developing new sector-oriented solu-
tions and intensifying cross-selling between our divisions and other Siemens Groups.
Our strategy is to exploit company-wide synergies to the greatest possible extent. Using top+
tools, we have increased productivity by further streamlining our production processes and out-
sourcing sales activities in smaller markets.
€5.0
€101
billion in sales
million in group profit

28 business areas
Power Generation (PG)
Faced with a weaker market for new power plants, we maintained our strong and profitable com-
petitive position by introducing timely countermeasures.
Our first priorities were to optimize our portfolio and boost overall sales. A key move was the
purchase of Alstom’s industrial turbine activities, which has augmented our product lines for small
and medium-sized gas turbines and for steam turbines with outputs of up to 100 megawatts. This
acquisition has also advanced our Industrial Applications Division to a world-leading position in the
market for industrial power solutions while improving our prospects for continued growth in the
oil and gas sector. In the power plant business, we are poised to expand our activities – particularly
in Asia and some parts of Europe – as demand accelerates again in the medium to long term.
Building our service business is another top priority. To exploit new opportunities in the bur-
geoning service market, we have set up Turbo Service Networks (TSN), the world’s largest network
of independent service companies. By servicing older Siemens turbines not previously covered by
PG maintenance contracts, TSN is opening up a new market for us. We are also leveraging syner-
gies between our Industrial Applications Division and our fossil-fueled power plant business to
generate additional growth, particularly in services.
Siemens’ Power business area comprises Power Generation (PG) and Power Transmis-
sion and Distribution (PTD). PG offers efficient, environmentally compatible power
generation systems as well as solutions for industrial applications, including services
for power plants and industrial power systems. PTD – a product and turnkey systems
supplier, systems integrator and service provider – enables customers to transport
electrical energy safely and efficiently from power plant to consumer.
Power
€7.0
€1.171
billion in sales
billion in group profit

business areas 29
Power Transmission and Distribution (PTD)
By keeping our strategy sharply focused on our customers’ needs, we have consolidated our No. 2
position worldwide and reinforced our status as a market leader and preferred partner in power
transmission and distribution.
We are continuously innovating and optimizing our product portfolio to drive growth and
enhance our competitive advantages. More and more of our products and systems are based on
integrated communications technologies and advanced software solutions. Recent innovations
include a new power control system for municipal utilities and grid operators as well as cutting-
edge controls for high-voltage direct-current transmission systems.
We have again gained market share in key world markets like the Middle East and Southeast
Asia. Eighty-six percent of our sales are generated outside Germany and about half that figure out-
side Europe. The expansion of our service business, which yields high local value added, is a key
contributor to our international success. Our service offerings include the maintenance of com-
plete national grids in Estonia and New Zealand. In the UK, we are a leading provider of metering
services. In the area of high-voltage direct-current transmission, another major order in Australia
has fortified our position as a leading supplier to the world market.
Via our e-business portal, customers can access our products and solutions anytime, any-
where. E-business is also helping our partners and our Group improve process efficiency.
€3.4
€207
billion in sales
million in group profit

30 business areas
Transportation Systems (TS)
We have consolidated our leading positions in rail automation and turnkey projects while
strengthening our rolling stock and services businesses. Rigorous asset, cash, project and risk man-
agement programs have been the key to our success. From our current strong base, we intend to
generate additional growth by extending our technological leadership and further internationaliz-
ing and regionalizing our business.
Orders for a new fully automated subway line in Barcelona – the first of its kind in Spain –
and for signaling and control systems in the Chinese cities of Nanjing and Shenzhen highlight our
strengths in urban rail automation. The successful launch of the Transrapid project in Shanghai and
the sale of rapid-transit trains to Guangzhou and other metropolitan areas have further reinforced
our position in China’s high-growth market. We continue to enjoy an outstanding reputation as a
highly reliable service provider and manufacturer of rail vehicles. We are supplying double-decker
train units for Switzerland’s national railway, Desiro trains for express routes operated by First and
Keolis in Northern England and, in a first-time order, metro cars for Oslo’s subway system. In addi-
tion, we have won maintenance contracts for London’s new Heathrow Express trains and for trains
operated by the British rail companies Stagecoach and First. We have also opened a Desiro service
facility in Southampton, on England’s south coast.
Our focus on innovation, automation, modular systems and platform concepts, coupled with
a renewed emphasis on productivity and quality, will ensure our long-term market success and
continued profitable growth.
Siemens’ Transportation business area comprises two Groups: Transportation Systems
(rail systems) and Siemens VDO Automotive (automotive systems). Both Groups’ prod-
ucts and solutions are designed to provide mobility for a world on the go and to meet
growing demands for environmental compatibility and improved performance. We
are innovation drivers in our industry.
Transportation
€4.7
€284
billion in sales
million in group profit

business areas 31
Siemens VDO Automotive (SV)
We have continued to make solid progress despite the prolonged economic downturn. Our top+
WIP restructuring program – a key factor in our success – gained further momentum with four
new initiatives. The centerpiece, our Zero Fault quality initiative, is enabling us to increase cus-
tomer satisfaction and significantly reduce costs. We have improved our cost position by rigorously
leveraging synergies in production and purchasing. In a drive to further optimize our portfolio, we
have shed non-core activities like customized cockpit production.
At the same time, we are strengthening our activities in promising new fields. For example,
we are now producing advanced piezo diesel injection systems in an alliance with Volkswagen.
Development of piezo technologies for use in gasoline-powered engines will help make us a top
innovator and world market leader in gasoline injection systems.
We are expanding our portfolio in the NAFTA countries and in Asia. Through acquisitions,
we intend to considerably increase our U.S. market share in engine and driver information systems
and infotainment. We are also growing our business in Asia. In China, for example, we have
restructured our Commercial Vehicles Division to profit from an expected boom in this sector.
Our strategy of developing products with high end-user value has been rewarded with a spate
of new orders. Successful innovations include head-up displays that supplement conventional
instrumentation, and sensors for adaptive airbag triggering that enhance passenger safety.
Our intelligent, customer-oriented solutions enable car makers to differentiate themselves in
a fiercely competitive world market. As more and more high-tech features are incorporated into
vehicles, we will expand our leading position in automotive electronics and mechatronics.
€8.4
€418
billion in sales
million in group profit

32 business areas
Medical Solutions (Med)
Through a unique combination of innovation, partnership and market-oriented solutions, we help
our customers deliver high-quality, patient-centric healthcare. Our coordinated approach to
increasing healthcare efficiency by cutting costs and boosting quality is summed up in the formula:
“People, Processes, and Products.” The advanced picture archiving and communication system
(PACS) that we installed at Bethesda Memorial Hospital in Boynton Beach, Florida is a prime exam-
ple. The system has slashed diagnosis time from 16 hours to four.
Our market was again characterized by aggressive competition, increasing price pressure and,
since 2001, a weakening dollar. In addition, capital investment in major European markets
remained restrained. Nevertheless, we have continued to generate profitable growth.
World-class innovation remains the key to our success. With more than 500 installed systems,
the Somatom Sensation 16 is the most popular computed tomography system on the market. Our
syngo® software platform, now incorporated into more than 40 of our products, has been licensed
to more than 15,000 customers. We are now testing our new Soarian workflow management sys-
tem in hospitals around the world – and have already received more than 80 orders. Soarian auto-
matically synchronizes processes across the healthcare enterprise, enabling faster access to all rel-
evant patient data and continuous monitoring of treatment processes.
We have high expectations in the emerging field of molecular imaging, where we are cooper-
ating with one of the world’s foremost research institutes: the Harvard University School of Medi-
cine.
On July 1, 2003, we transferred our electromedical activities into a joint venture with
Draegerwerk AG in Germany. To win regulatory approval for this move, we sold our life support
systems business to Getinge AB in Sweden. Our purchase of the radiation therapy activities of MRC
Systems GmbH in Heidelberg, Germany has reinforced our position in the field of oncology.
Siemens’ Medical area is renowned for its innovative products, complete solutions and
wide range of services for the healthcare community. Our portfolio features a full
array of imaging systems for diagnostics and therapeutics, as well as audiology sys-
tems and IT solutions for our industry. Our innovations optimize processes and
improve efficiency across the healthcare continuum.
Medical
€7.4
€1.118
billion in sales
billion in group profit

business areas 33
Osram
With our lamps, electronic control gear and opto-semiconductors, we intend to consolidate our
leading position on the global lighting market. Already a premier supplier in every region of the
world, we are aggressively expanding our businesses in Asia-Pacific and Eastern Europe, where we
expect the fastest market growth.
We have successfully transformed ourselves from a conventional light bulb manufacturer into
a cutting-edge high-tech company. Innovative lighting sources and systems are increasing our
sales volume and generating above-average earnings – even in a difficult economic environment.
We anticipate continued strong growth in the areas of opto-semiconductors, electronic control
gear and electronically controlled lamps.
In April 2003, we opened the most advanced optoelectronics chip factory in the world. Locat-
ed in Regensburg, Germany, the new facility will enable us to significantly boost our production of
semiconductor lighting sources such as light-emitting diodes (LEDs). LEDs are being used more
and more in automotive and general lighting applications – particularly in fields where miniaturiza-
tion, long product life and color saturation are key factors. New organic LEDs also have a bright
future: They are not only extremely thin and highly luminous but also allow for wide-angle viewing.
Siemens’ Lighting business area, comprising Osram, specializes in lighting sources
and related electronic control gear. We focus on general lighting solutions, automotive
lighting, special photo-optic lamps and display lighting. Osram is a truly international
company, generating nearly 90% of its sales outside Germany.
Lighting
€4.2
€410
billion in sales
million in group profit

34 business areas
Siemens Financial Services (SFS)
We provide Siemens and other industrial companies with a broad range of financial services – from
sales and investment financing and equity investments in infrastructure projects to risk and liquidi-
ty management, insurance risk transfers and fund management.
In fiscal 2003, a cyclical downturn in equipment purchases by customers in the U.S. and
Europe hampered growth in the leasing business of our Equipment & Sales Financing Division. A
weakening currency in the U.S., where much of our business is generated, exacerbated this situa-
tion. Nonetheless, we kept credit-related losses within the normal range and increased purchases
of receivables from third parties year-over-year.
Developments at our Equity Division were particularly gratifying. Returns on an investment in
a power plant operated by Indonesia’s Java Power have stabilized following successful negotiations
with customers and the banks providing financing. Our Treasury and Financing Services Division
has benefited from currency and interest rate developments in the capital markets, with financing
activities generating strong earnings for our customers within the Company. As stipulated by
incentive agreements, SFS receives a share of these profits.
Our Insurance and Investment Management divisions held their own in a difficult market, with
rigorous cost management contributing strongly to their performance. The consulting business of
our Project and Export Financing Subdivision continued its steady progress of the past few years.
We intend to maintain our status as a provider of competitive financial solutions for Siemens,
and to exploit the advantages that arise from bundling the Company’s financial activities. We also
plan to grow our external business in markets where demand for our competencies is particularly
strong. Our expertise in financial and risk management is a critical success factor that is fundamen-
tal to our growth strategy.
Financing and Real Estate
€8.445
€269
billion in total assets
before income taxesmillion in income

business areas 35
Siemens Real Estate (SRE)
As expected, the ongoing economic slump impacted the real estate business in fiscal 2003. Our
market experienced lower prices, rising vacancies and declining utilization rates. Nevertheless, we
held our own by taking proactive countermeasures. In fiscal 2002, we had already begun aligning
capacities with the Siemens Groups’ declining needs and withdrawing floor space from the market.
We intensified these measures in fiscal 2003, launching an international initiative focused on fur-
ther pruning our portfolio and more aggressively managing idle real estate. We sold properties,
leased more Siemens-owned floor space to third parties and reduced the amount we ourselves
rent.
To optimize floor space utilization and cut costs even further, we have implemented new
office concepts. The Siemens Real Estate Office Center is a prime example. It offers offices and con-
ference rooms for rent on a daily, weekly or monthly basis, along with a broad range of on-site
services. We have also scored a success with our Flexible Office concept. Flexible offices promote
worker mobility via individual work stations that can be reallocated as needed, multi-purpose work
zones and modular furnishings.
A further focus is the conversion of selected Siemens locations into mixed-use urban areas.
Municipal development projects of this kind are underway in Munich and Frankfurt. In 2003, we
began construction of a new R&D campus in Erlangen, Germany. And at the end of the fiscal year,
we laid the cornerstone for yet another major urban development project – the Siemens Head-
quarters Russia complex in Moscow.
Financing and Real Estate
€1.6
€206
billion in sales
income before income taxesmillion in

36 business areas
BSH Bosch und Siemens Hausgeräte GmbH
With over 35,000 employees, 42 production facilities and sales offices in more than 100 countries,
we are a world-leading manufacturer of household appliances, and we aim to further expand our
market position.
We boast a comprehensive portfolio of premium products based on market-oriented innova-
tions that generate added value for distributors and provide concrete benefits for users. With our
innovations and high quality, we set technology standards and define market trends in our indus-
try. Our brands are world-famous.
We are present in every major market, generating more than 70% of our sales outside Ger-
many. Our global setup enables us to offset weaknesses in one market with strengths in another.
Productivity programs are bolstering our international competitiveness, while rigorous innova-
tion management and creative marketing of new products are driving expansion. To tap new mar-
kets, we have developed regional growth strategies that focus especially on the United States,
China and Eastern Europe. These regions are already making significant contributions to our prof-
itable growth.
Affiliates

business areas 37
Affiliates
Fujitsu Siemens Computers (Holding) BV
We are the leading IT manufacturer both in Germany and in Europe as a whole.
With our unique array of information technologies and IT infrastructure solutions – ranging
from hand-held computers, notebooks and desktops to servers and memory solutions – we
address the needs of large enterprises, small to medium-sized companies and millions of private
individuals.
We are active in every major market in Europe, Africa and the Middle East. Working hand-in-
hand with our two parent companies, we also support customers in global projects.
Since our founding, we have focused on mobility and business-critical computing. Mobility
delivers important advantages in cost and competitiveness, while business-critical computing
meets the demand for scalable high-performance IT infrastructures with 24-hour availability.
Convenient, rapid and reliable access to data and applications – anytime, anywhere – increases
employee flexibility and efficiency. In fiscal 2003, our mobility portfolio included a wide range of
innovations like Pen tablets, wireless LAN access technologies and mobility solutions for a variety
of sectors. In business-critical computing, we focused on IT consolidation and innovative automa-
tion concepts.
Our cutting-edge offerings helped us outperform the majority of our competitors in the unfa-
vorable market conditions of fiscal 2003.

Report of the Supervisory BoardCorporate Governance ReportCompensation Report
40 Report of the Supervisory Board
48 Corporate Governance Report48 – The German framework48 – U.S. capital market rules48 – Management and control structure –
The Supervisory Board49 – Committees of the Supervisory Board50 – The Managing Board50 – Shareholder relations51 – Risk management51 – Financial accounting52 – Business Conduct Guidelines52 – Suggestions of the German Corporate
Governance Code53 – Declaration of Conformity with the
German Corporate Governance Code
54 Compensation Report 54 – I. Managing Board remuneration58 – II. Supervisory Board remuneration59 – III. Stock ownership by members
of the Managing and Supervisory Boards
38

39

40 report of the supervisory board

report of the supervisory board 41
Dear shareholder,
The Supervisory Board of Siemens AG focused intensively on the Company’s
situation throughout fiscal 2003. We advised the Managing Board, monitored
Company management and were involved in major Company decisions. The
Managing Board provided us with regular, timely and comprehensive informa-
tion on all relevant topics.
Advisory focal points
At five meetings during the course of the year, the Managing Board reported to
us on business and financial developments at the Company, key business events
and general strategies and planning. Between these meetings, the Managing
Board informed us in writing about important developments. As Chairman of
the Supervisory Board, I was also kept up-to-date on major issues and upcoming
management decisions.
The Supervisory Board, or its committees, approved important business deci-
sions requiring Board approval.
In its deliberations, the Supervisory Board focused on the effects of the diffi-
cult economic and geopolitical environment, the far-reaching structural changes
currently taking place in the information and communications market, the meas-
ures which have been introduced to further optimize our business portfolio,
and Siemens’ corporate governance system.
The challenge at Information and Communications
Since early 2001, the Company’s largest business area – Information and Com-
munications – has been adversely affected by a sharp and prolonged downturn in
market demand. Since then, we have regularly reviewed the steps being taken to
restore the profitability of the three I&C Groups. The Presidents of IC Networks
(ICN) and IC Mobile (ICM) reported to us in fiscal 2002, and the President of
Siemens Business Services (SBS) reported to us in December 2002.
I am happy to report that ICM and SBS were profitable again in fiscal 2003,
despite the difficult business environment. After two years in the red, ICN
returned to profitability in the fourth quarter of fiscal 2003.

42 report of the supervisory board
The I&C Groups must now make every effort to generate satisfactory, stable
and sustainable earnings and to adjust to the changed strategic challenges of
their industry. The groundwork has been laid.
TS, SV, PG and Med continue successes
In December 2002, the President of Transportation Systems (TS) reported on the
successful developments at his Group. Siemens’ rail business has done well in
worldwide competition and reached its margin target for fiscal 2003.
The same is true for Siemens VDO Automotive (SV). In April 2003, we deter-
mined to our satisfaction that SV had completed its integration of VDO and had
made solid progress following the takeover of Atecs Mannesman. In fiscal 2003,
the Group established a 50/50 joint venture with Volkswagen AG to manufacture
pumped-jet diesel injection valves. The new company is headquartered in Stoll-
berg, Germany.
In July 2003, the President of Medical Solutions (Med) reported on his Group’s
current situation and strategy. Med has developed into one of the Company’s top
earners. Nearly half of its business is generated in the North American market. In
a move to expand its activities in China, Med founded the joint venture Siemens
Mindit Magnetic Resonance Ltd. (Shenzhen), in which Siemens holds a majority
stake. Med transferred most of its Electromedical Division into a joint venture
with Draegerwerk AG. Siemens holds a minority stake in the new company.
At the July meeting, we also heard a presentation on the situation and outlook
at Power Generation (PG). PG substantially exceeded its margin target for the
year. Now, following the end of the gas turbine boom in the U.S., the Group is
entering a somewhat quieter business phase at a high margin level. In recent
years, PG has concentrated its business portfolio on fossil-fuel power generation.
It folded both its nuclear and hydroelectric power activities into joint ventures in
which Siemens holds minority stakes. The Group’s acquisitions of
Westinghouse’s conventional power business and Demag Delaval considerably
strengthened PG’s market position. The purchase of Alstom’s industrial turbine
business was a further key step in the Group’s strategy to round out its business
portfolio.

report of the supervisory board 43
Technology and innovation
Technology and innovation are fundamental success factors at Siemens. At our
April meeting, the head of Corporate Technology reported to us on the principles
that drive and safeguard the Company’s power of innovation. The most impor-
tant strategic innovation fields are described in so-called “pictures of the future.”
Innovation benchmarking is conducted on an ongoing basis and rigorous inno-
vation strategies are developed and implemented. This process ensures the
efficient implementation of necessary R&D projects and the timely consideration
of promising new ideas.
Corporate Technology conducts its own research and development, supports
the R&D activities of the Groups worldwide and ensures a uniform Company-
wide patent strategy. Siemens currently spends over five billion euros a year on
research and development.
Corporate governance
At a number of meetings, we discussed the impact of the German Corporate
Governance Code and the U.S. Sarbanes-Oxley Act of July 2002 on the work of the
Supervisory Board and its committees. We had made important fundamental
decisions regarding this subject in the previous year. At our meeting in Novem-
ber 2002, we decided to issue a Declaration of Conformity with the Code. We
updated this Declaration in April 2003. At our November 2003 meeting, we
approved a Declaration of Conformity based on the Code as revised in July 2003.
This Declaration states that, with two exceptions, we fully comply with the Code’s
recommendations.
The Supervisory Board met in July 2003 without the Managing Board in attend-
ance. In the future, we will conduct such executive sessions on a regular basis.
At this meeting, we discussed the results of a review of our Board’s efficiency and
approved a number of changes.
Details of our corporate governance system are presented on the Internet and
on pages 48 to 53 of this Report.

44 report of the supervisory board
Committee meetings
Our Chairman’s Committee maintained close contact with the Managing
Board between the five regular Supervisory Board meetings held during
fiscal 2003. As one of our Board’s four committees, the Chairman’s Com-
mittee met seven times to address personnel matters relating primarily to
the Managing Board and to the Group executive managements, the struc-
ture and level of Managing Board remuneration, and the determination of
variable and stock-based remuneration components. The Chairman’s
Committee also dealt with matters relating to corporate governance and
the Company’s strategy and performance.
Together with the independent auditors and the Managing Board, the
Audit Committee discussed the annual financial statements of Siemens AG
and the consolidated financial statements of Siemens worldwide, the
appropriation of net income, and the annual report on Form 20-F, which
Siemens submits to the SEC. During the year, the Committee also dis-
cussed in detail the Company’s quarterly reports, the appointment of the
independent auditors, oversight of the auditors’ independence and effi-
ciency as well as their fee. In addition, the Committee dealt intensively
with the Company’s risk management system and the reports of Siemens’
Financial Audit Department. The Audit Committee also discussed the
alignment of its organization and procedures with the requirements of the
Sarbanes-Oxley Act. The Audit Committee met five times during the year,
in part without the Managing Board in attendance.
The Mediation Committee, formed pursuant to § 27 (3) of the German
Codetermination Act, had no occasion to meet during the year. The Invest-
ment Committee, defined in § 32 of the Act, voted on resolutions using a
notational, or written, voting process and notified the Board of the out-
come at subsequent meetings.
All committees regularly reported to the Supervisory Board on their
work.

report of the supervisory board 45
Financial statements
Our independent auditors, KPMG Deutsche Treuhand-Gesellschaft AG
Wirtschaftsprüfungsgesellschaft, Berlin and Frankfurt/Main (KPMG),
audited the annual financial statements of Siemens AG and the consolidat-
ed financial statements as well as the related Management’s Discussion
and Analysis (MD&A) for fiscal 2003 in accordance with the requirements
of the German Commercial Code (HGB), and approved them without quali-
fication. Our consolidated financial statements, prepared in accordance
with U.S. GAAP, were also audited by KPMG, in accordance with U.S. Gen-
erally Accepted Auditing Standards, and approved without qualification.
KPMG further confirmed that the consolidated financial statements and
MD&A fulfill the conditions for exemption from compliance with report-
ing rules under German law, and that the Managing Board has implement-
ed an effective risk management system that meets legal requirements.
We received the above-mentioned documents and the Managing
Board’s proposal for the appropriation of net income. The Audit Commit-
tee thoroughly examined these documents, and the Supervisory Board
also reviewed them. The KPMG audit reports were presented to all mem-
bers of the Supervisory Board, and we – together with the auditors, who
reported on key results of the audit – examined them thoroughly. The
Managing Board explained the annual and consolidated financial state-
ments as well as the risk management system. It also provided a detailed
report on the scope, focal points and costs of the audit. Following reviews
by the Audit Committee and the full Supervisory Board, we approved the
results of the audit. In view of our approval, the financial statements are
accepted as submitted.
We endorse the Managing Board’s proposal that the net income avail-
able for distribution be used to pay a dividend of €1.10 per share. In addi-
tion, we approve the proposals that the amount attributable to treasury
stock be carried forward and the remainder be transferred to other
retained earnings.

46 report of the supervisory board
Changes in the Supervisory Board and the Managing Board
The five-year term of the Supervisory Board elected at the Annual Share-
holders’ Meeting in 1998 expired at the Annual Shareholders’ Meeting on
January 23, 2003. Six members representing shareholders and four mem-
bers representing employees retired from the Board. I would like to thank
these members for their commitment and constructive contributions to
our Board throughout the past term.
A new Supervisory Board was elected for the term 2003 to 2008. At the
constituent meeting of the new Board in January 2003, the Board’s Chair-
man and First Deputy Chairman were confirmed in their offices. Josef
Ackermann was elected Second Deputy Chairman.
By approval of the Berlin and Munich Registry Courts, Jerry I. Speyer
was confirmed as a member of the Board in July 2003, following the
resignation of Hans-Dieter Wiedig. I would like to thank Mr. Wiedig for his
contributions to the Board.
At our meeting on April 23, 2003, Johannes Feldmayer was appointed
to the Managing Board of Siemens AG. At our meeting on July 23, 2003, the
Board approved his appointment to the Corporate Executive Committee
effective August 1, 2003. At the same meeting, Jürgen Radomski was
appointed Labor Director and head of Corporate Personnel effective
August 1, 2003. Some of the responsibilities in the Managing Board were
also reassigned at that time.
Peter Pribilla died at the age of 62 on August 9, 2003, following a long
illness. He had served our Company for 35 years in and outside Germany
as, among other things, President of the Private Communication Systems
Group, President of the Public Communication Networks Group and, as of
1998, Labor Director and head of Corporate Personnel. Professor Pribilla
made a major contribution to the success of our Company over a period of
many years, and we will always have fond memories of him.

Volker Jung retired on September 30, 2003, after 39 years with the
Company. As a member of the Corporate Executive Committee, he had spe-
cial responsibility for the Information and Communications business area
and Siemens activities in Africa, the Middle East and the C.I.S. countries.
We thanked him for his outstanding commitment to the Company.
Berlin and Munich, November 26, 2003
For the Supervisory Board
report of the supervisory board 47
Dr. Karl-Hermann Baumann
Chairman

48 corporate governance report
Good corporate governance has traditionally been a high priority at Siemens. We welcome
the recent corporate governance initiatives in and outside Germany.
The German framework
In 2002, an independent commission established by the German government issued the
first German Corporate Governance Code. The Code was expanded in July 2003. Siemens
complies with this expanded version in all but two respects: We do not publish the individ-
ual compensation of our Managing Board members, and our directors and officers liability
(D&O) insurance policy does not include a deductible (see the Declaration of Conformity on
page 53 of this Report). Our Declaration of Conformity is published on our website, where
it will be updated as necessary. With the publication of our first Declaration of Conformity,
as required by § 161 of the German Stock Corporation Act, in November 2002, we approved
and adopted the recommendations of the German Corporate Governance Code, with two
exceptions, which we noted in the Declaration: our D&O insurance policy did not include a
deductible, and the chairmen of Supervisory Board committees received no additional
remuneration. On January 23, 2003, the Annual Shareholders’ Meeting approved an
amendment to the provision in the Company’s Articles of Association dealing with Supervi-
sory Board remuneration. This amendment eliminated the second exception mentioned
above. Since then, Siemens has also fulfilled the Code’s requirements regarding Supervi-
sory Board remuneration.
U.S. capital market rules
Due to our listing on the New York Stock Exchange (NYSE), we are subject to U.S. capital
market legislation and the rules of the U.S. Securities and Exchange Commission (SEC). In
July 2002, the U.S. Congress passed the Sarbanes-Oxley Act (SOA), which aims to strengthen
investor protection and restore confidence in the capital markets. The SOA – together with
the associated SEC rules – introduced numerous changes in corporate governance regula-
tions for all companies listed on U.S. stock exchanges. Some of these regulations have not
yet come into effect.
In implementing the provisions of the SOA, we have, among other things, established
a Disclosure Committee that is responsible for reviewing and approving all financial and
related non-financial information before we make it public. We have also introduced a
procedure that enables the managements of our Groups and subsidiaries to certify their
compliance with our internal control system (ICS), the completeness and correctness of the
financial figures they submit as well as the efficiency of their own internal financial control
systems. On the basis of this procedure, the Chief Executive Officer (CEO) and the Chief
Financial Officer (CFO) of Siemens AG certify the appropriateness of our financial statements
to the SEC, as required by the SOA. Siemens has aligned the rules for the Audit Committee
of its Supervisory Board as well as for its relationship to the Company’s independent audi-
tors with the requirements of the SOA and introduced a Code of Ethics for financial matters.
Management and control structure – The Supervisory Board
Because its registered offices are located in Berlin and Munich, Siemens is subject to Ger-
man corporate law. Consequently, the Company has a two-part management and oversight
structure comprising a Managing Board and a Supervisory Board. The Supervisory Board
has twenty members. As stipulated by the German Codetermination Act, half of the Board’s
members represent Company shareholders, and half represent Company employees.
The shareholder representatives are elected by the Annual Shareholders’ Meeting. The
employee representatives are elected by an assembly representing Siemens employees in
Corporate Governance Report
www.siemens.com/corporate_governance
Man
agin
gBo
ard
Management andcontrol structure
Riskmanagement
Business ConductGuidelines
Financialaccounting
Supervisory
Board
AnnualShareholders’
Meeting

corporate governance report 49
Germany. Seven of the employee representatives must be Siemens employees, and three
must be external representatives nominated by the unions. As stipulated in the Bylaws for
the Supervisory Board, the shareholder representatives are independent. Some Supervisory
Board members hold or held, in the past year, high-ranking positions at other companies.
Siemens maintains normal business relationships with almost all of these companies. How-
ever, our sales of products and services to them are treated as arm’s length transactions. Fur-
thermore, the volume of these sales is very small in relation to the companies’ total sales.
Consequently, these dealings do not affect the independence of Supervisory Board members.
(Further information regarding the composition of the Supervisory Board is available on
pages 190-91 of this Report.)
The Supervisory Board is elected for five years. It normally meets five times a year and
periodically convenes in executive session without the Managing Board in attendance. The
duties, procedures and committees of the Supervisory Board are specified in bylaws. These
bylaws, which are posted on the Internet, contain rules regarding, among other things, the
independence, experience and knowledge required of Supervisory Board members and
regarding conflicts of interest and insider trading.
The Supervisory Board oversees and advises the Managing Board in its management of
Company business. At regular intervals, it discusses business development, planning, strat-
egy and implementation. It also reviews Siemens’ quarterly reports and approves the annual
financial statements of Siemens AG as well as the consolidated financial statements of
Siemens worldwide, taking into account both the audit reports provided by the independent
auditors and the results of the review conducted by the Audit Committee. In addition, the
Supervisory Board appoints the members of the Managing Board, determines their remuner-
ation and allocates their responsibilities. Important Managing Board decisions – such as
major acquisitions, divestments and financial measures – require Supervisory Board
approval.
Committees of the Supervisory Board
The Supervisory Board has established four committees, whose duties, responsibilities and
processes are set out in separate bylaws, fulfill the requirements of the German Corporate
Governance Code, and take into account SOA requirements and, to the greatest extent possi-
ble, the rules of the NYSE. (Further information regarding the composition of the Supervi-
sory Board committees is available on page 191 of this Report.) The committee bylaws are
posted on our website.
The Chairman’s Committee, comprising two shareholder representatives and one
employee representative, performs the tasks of a nominating, compensation and corporate
governance committee. It meets at least four times a year without the Managing Board in
attendance. The Chairman’s Committee determines the conditions of employment of Manag-
ing Board members and the level and structure of their remuneration. It also decides – on an
annual basis – which portion of the Managing Board’s compensation will be variable and
how much of this variable portion will take the form of stock-based compensation. In addi-
tion, the Chairman’s Committee makes proposals regarding the appointment of Managing
Board members. Finally, it reviews and ensures the further development of Siemens’ corpo-
rate governance principles.
The Audit Committee, comprising three shareholder representatives and two employee
representatives, meets at least five times a year. The SOA requires that all members of the
Audit Committee be independent. The shareholder representatives fulfill this requirement.
The SEC now permits the employee representatives – who have been elected in accordance
with the German Codetermination Act and who, due to their employment by the Company,

are not independent – to serve on the Audit Committee. The Audit Committee oversees the
Company’s external and internal accounting processes, and meets at least five times a year.
On the basis of the reports provided by the independent auditors, it reviews the Company’s
quarterly and annual financial statements, and prepares the Supervisory Board’s decision
whether to approve the annual financial statements. In addition, the Committee oversees the
Company’s internal control system and the procedures for assessing, monitoring and man-
aging risk. It also receives reports regarding compliance with all relevant statutory and regu-
latory requirements. The Company’s Financial Audit Department reports regularly to the
Audit Committee, which determines the scope and focal points of its audit. The Audit Com-
mittee is responsible for liaising between the Company and the independent auditors. In
particular, it awards the audit contract to the independent auditors appointed at the Annual
Shareholders’ Meeting and determines the focal points of their audit as well as their fee. In
addition, the Audit Committee monitors the auditors’ independence.
In accordance with the requirements of the SOA, the Supervisory Board has determined
that Dr. Josef Ackermann, Dr. Karl-Hermann Baumann and Dr. Henning Schulte-Noelle qual-
ify to serve as Audit Committee financial experts.
The Mediation Committee comprises two shareholder representatives and two employee
representatives. In the event that the Supervisory Board cannot reach the two-thirds majority
required to appoint a Managing Board member, the Mediation Committee submits proposals
for resolution to the Supervisory Board.
The Investment Committee, comprising three shareholder representatives, is responsi-
ble for decisions regarding the exercise of Siemens’ shareholder rights in other companies.
The Managing Board
The Managing Board of Siemens AG, which currently has twelve members, is the Company’s
top management body. It is obligated to promote the interests of the Company at all times
and to drive sustainable growth in company value. As of December 2003, the Managing
Board’s executive committee, the Corporate Executive Committee, will have seven members.
The Chairman of the Managing Board defines overall Company policies in cooperation with
the Corporate Executive Committee. The Managing Board’s responsibilities include deter-
mining the Company’s strategic orientation, planning and finalizing the Company budget,
allocating resources, and monitoring the executive management of each Group. Further-
more, the Managing Board directs the preparation of the Company’s quarterly reports, the
annual financial statements of Siemens AG and the consolidated financial statements of
Siemens worldwide. It also selects personnel to fill key Company positions.
The Managing Board cooperates closely with the Supervisory Board. It informs the Super-
visory Board regularly, promptly and comprehensively regarding all issues related to Com-
pany strategy and strategy implementation, planning, business development, financial
position, earnings and emerging risks. Major decisions of the Managing Board require
Supervisory Board approval. (Further information regarding the composition of the Manag-
ing Board as well as the composition and responsibilities of Managing Board committees is
available on pages 192-93 of this Report.)
Shareholder relations
Four times a year – at dates specified in a financial calendar – Siemens reports to its share-
holders regarding its business development, financial position and earnings. The CEO and
the CFO report regularly to investors, analysts and the press regarding the full-year and
quarterly results. Information which may materially affect Siemens’ share price is published
in press releases throughout the year.
50 corporate governance report

corporate governance report 51
An ordinary Annual Shareholders’ Meeting normally takes place within the first four
months of each fiscal year. Each share carries one vote. All shareholders listed in the stock
register and from whom notification of attendance has been received by a specified date are
entitled to take part. The Managing Board facilitates shareholder participation in the meet-
ing through the use of electronic means of communication – in particular the Internet – and
enables shareholders who are unable to attend to exercise their voting rights by communi-
cating instructions directly to their representatives. The meeting is directed by the Chairman
of the Supervisory Board.
The Annual Shareholders’ Meeting decides on all matters assigned to it by law. Its deci-
sions are binding on all shareholders and on the Company. They include, in particular, vot-
ing on the appropriation of net income, ratification of the acts of the Managing and Super-
visory Boards, and the appointment of the independent auditors. Amendments to the Articles
of Association and measures which change the Company’s capital stock are approved exclu-
sively at the Annual Shareholders’ Meeting and implemented by the Managing Board with
the approval of the Supervisory Board. Shareholders may submit counterproposals to the
proposals of the Managing and Supervisory Boards and contest decisions of the Annual
Shareholders’ Meeting. Shareholders owning Siemens stock with a market value of €1 million
or more may also demand a special judicial review of a particular decision.
As part of our investor relations activities, the CEO, the CFO and individual members of
the Group executive managements meet regularly with analysts and institutional investors.
We hold a conference for analysts once a year as well as telephone conferences with analysts
upon the publication of our quarterly results. Our website provides access to financial data
and other business-related information regarding Siemens worldwide.
Risk management
The Company has a system for assessing and monitoring its potential business and financial
risks. The components of this risk management system are designed to enable us to antici-
pate risks and manage them carefully in the pursuit of our business goals. The principles,
guidelines, processes and responsibilities of our internal control system have been defined
and established to guarantee prompt and accurate accounting of all business transactions
and to continuously provide reliable information about the Company’s financial position for
internal and external use.
However, the components of the internal control and risk management system do not
eliminate risk entirely and, thus, cannot prevent loss or fraud in all cases. We intend to rap-
idly adjust the risk management and monitoring procedures of all businesses acquired dur-
ing the fiscal year, so that they conform to Siemens’ standards.
Financial accounting
The consolidated financial statements of Siemens worldwide are prepared in accordance with
the United States Generally Accepted Accounting Principles (U.S. GAAP). The annual financial
statements of Siemens AG are prepared in accordance with the accounting rules set out in
the German Commercial Code. The Managing Board directs the preparation of the financial
statements. The existing internal control system and the Company-wide use of uniform
guidelines guarantee the accuracy of our financial statements. In addition, we have estab-
lished a system of internal certification in which the executive managements of our Groups
and subsidiaries certify the correctness and completeness of the financial data they submit
and the efficiency of their own internal financial control processes. This system is the basis
for the statement of certification, which must be signed by the CEO and the CFO and submit-
ted to the SEC with the annual report on Form 20-F, in accordance with SOA requirements.

In this statement, the CEO and the CFO certify that the annual report submitted to the SEC
is accurate, that an effective system of internal controls is in place, and that the Managing
Board has reviewed this system before the publication of the annual report.
Additional SOA requirements, which will come into effect in fiscal 2005, stipulate that
the CEO and the CFO must explicitly affirm that they have reviewed the effectiveness of all
internal processes relevant to the quality of financial reporting. They also stipulate that the
independent auditors must confirm the results of this review. In anticipation of these addi-
tional requirements, we further developed our internal control system (ICS) for financial
reporting in the past year with the goal to potentially request such confirmation from our
independent auditors, already in 2004.
Business Conduct Guidelines
Siemens aims to conduct its business responsibly and in compliance with all relevant statu-
tory and regulatory requirements. The Managing Board has established guidelines to
ensure that this goal is achieved. The Business Conduct Guidelines comprise rules regard-
ing compliance with applicable laws, conflicts of interest, the use of Company facilities, and
insider trading. These rules are binding for all Siemens employees, the Managing Board
and the Supervisory Board. The Guidelines also specify a procedure for dealing with com-
plaints. A Compliance Officer, who reports to the Audit Committee, has been appointed to
process all complaints, including those submitted anonymously. In addition, the Managing
Board and the Supervisory Board have approved a Code of Ethics for financial matters, as
required by SOA rules. Both the Business Conduct Guidelines and the Code of Ethics are
available on our website.
Suggestions of the German Corporate Governance Code
Siemens voluntarily complies with the Code’s non-obligatory suggestions, with the follow-
ing exceptions:
■ Given the length of our Annual Shareholders’ Meeting, complete Internet coverage
seems unwarranted. Therefore, we depart somewhat from the Code’s suggestion in this
regard and broadcast the proceedings of the Meeting via the Internet until the general
debate begins. Representatives exercising shareholders’ voting rights can be reached via
the Internet until that time.
■ The Code suggests that first-time appointments to a managing board should not, as
a rule, extend for an entire five-year term of office. While we have not followed this sug-
gestion in the past, we do not wish to rule out the possibility of compliance at some
future date.
■ The Code suggests that supervisory board members be elected or reelected at different
dates and for different terms of office. We consider this suggestion to be inappropriate
for a supervisory board established under the German Codetermination Act. Because
the employee representatives on such a supervisory board are elected for five-year
terms, this suggestion could only apply to the shareholder representatives. Following
it would therefore result in non-uniform treatment of board members.
■ Finally, the Code suggests that the chairman of an audit committee should not be the
chairman of the supervisory board or a former managing board member. We have not
followed this suggestion, because we regard financial expertise alone as the decisive
qualification for the chairman of an audit committee.
52 corporate governance report

Declaration of Conformity with the German Corporate Governance Code
At their meetings on November 11 and 12, 2003, respectively, the Managing Board and the
Supervisory Board approved the following Declaration of Conformity pursuant to § 161 of
the German Stock Corporation Act:
Siemens AG complies with the recommendations of the German Corporate Governance
Code – in the version of July 4, 2003 – with the following exceptions:
■ Managing Board compensation (Code Section 4.2.4, sentence 2) is not reported on an
individualized basis. It is broken down in our Annual Report into fixed, performance-
related and long-term incentive components.
■ Our D&O (directors and officers liability) insurance policy includes no deductible for
Managing Board and Supervisory Board members (Code Section 3.8, paragraph 2). Our
senior managers, both in and outside Germany, are covered by a group insurance policy.
It is not considered appropriate to differentiate between board members and other high-
level personnel. Furthermore, such a deductible is not common outside Germany.
Subsequent to the Declaration of Conformity of December 2002, Siemens AG complied with
the recommendations of the November 26, 2002 version of the German Corporate Govern-
ance Code, with the following exceptions:
■ Our D&O insurance policy included no deductible for Managing and Supervisory Board
members (Code Section 3.8, paragraph 2).
■ The reported exception to the provision of Code Section 5.4.5, paragraph 1, sentence 3,
regarding the remuneration of committee chairmen was eliminated by an amendment
to Siemens’ Articles of Association approved at the Annual Shareholders’ Meeting of Jan-
uary 23, 2003. For this reason, the Declaration of Conformity of December 2002 was
amended in March 2003.
Consequently, Siemens AG complied with all but one of the recommendations of the
November 26, 2002 version of the German Corporate Governance Code.
Berlin and Munich, November 12, 2003
Siemens AG
The Managing Board The Supervisory Board
corporate governance report 53

54 compensation report
This report outlines the principles used for determining the compensation of the Managing
Board of Siemens AG, sets out the level and structure of Managing Board remuneration,
and describes the stock option plan of Siemens AG.
In addition, the report describes the policies and levels of compensation paid to Super-
visory Board members and gives details of stock ownership by members of the Managing
and Supervisory Boards.
I. Managing Board remuneration
1. The Chairman’s Committee of the Supervisory Board is responsible for determining the
remuneration of members of the Managing Board. The Committee comprises Dr. Karl-
Hermann Baumann (Chairman of the Supervisory Board), and Dr. Josef Ackermann and
Ralf Heckmann (both Deputy Chairmen of the Supervisory Board). Dr. Ackermann has
been a member of the Chairman’s Committee since January 23, 2003.
2. Structure of Managing Board remuneration
The remuneration of members of the Managing Board of Siemens AG is based on the
Company’s size and global presence, its economic and financial position, and the level
and structure of managing board compensation at comparable companies in and out-
side Germany. In addition, the compensation for each Board member reflects his or her
responsibilities and performance. The level of compensation is designed to be interna-
tionally competitive in order to attract, retain and motivate high-quality executives who
have a passion for success and thrive in a high-performance culture.
Managing Board remuneration is performance-related and has three components:
a fixed salary, a variable bonus, and stock-based compensation. The fixed compensation
and the bonus are based on a “target compensation” that is reviewed regularly every two
to three years on the basis of an analysis of the compensation paid by international peer
companies to their top managers. The last review was conducted on April 1, 2003.
In fiscal 2003, the target compensation was divided into a fixed compensation com-
ponent of 40 percent and a variable component of 60 percent.
Base salary: The fixed compensation is paid as a monthly salary.
Bonus: Members of the Corporate Executive Committee receive a bonus based on the
Company’s attainment of certain financial goals that are set at the start of the fiscal year.
These goals are primarily oriented on performance as measured by economic value
added (EVA). In fiscal 2003, the goals also included the achievement of an ambitious
target for net cash from operating and investing activities. One-half of the bonus is paid
as an annual bonus, which is contingent upon achieving the Company-wide EVA target
established for the fiscal year. The other half is granted as a long-term bonus whose
amount depends on the average attainment of EVA targets over a three-year period.
One-third of the long-term bonus is granted as deferred income in the form of
restricted stock. The bonus, which cannot exceed 250 percent of the member’s base
salary, has a guaranteed minimum.
Compensation Report

compensation report 55
As of October 1, 2003, minor changes were made in the structure of Managing Board
compensation. In the future, the target compensation will comprise 50 percent fixed
and 50 percent variable compensation. The guaranteed minimum for the variable com-
ponent has been dropped.
The same principles apply to Managing Board members who are not members of the
Corporate Executive Committee. Their financial goals, however, depend primarily on
the performance of the corporate units they lead.
Stock-based compensation: The third component of Managing Board remuneration
is stock-based compensation. In fiscal 2003 and in the preceding three years, members
of the Managing Board received stock options on shares of Siemens AG with a value of
approximately 20 percent of the target compensation. Beginning in fiscal 2004, stock-
based compensation will comprise stock options and restricted stock.
3. Stock option plans
The current 2001 Siemens Stock Option Plan (“2001 Plan”) was authorized by sharehold-
ers at the Annual Shareholders’ Meeting on February 22, 2001. This plan replaced the
1999 Siemens Stock Option Plan.
Under the 2001 Plan, the following provisions apply:
■ The number of stock options granted must not exceed 55 million options, or 6.2 per-
cent of the capital stock of Siemens AG. Stock option grants to members of the Man-
aging Board are limited to 3.3 million options, or 6.0 percent of the total volume
authorized for issuance under the plan.
■ Managing Board members and other key executives in and outside Germany are eli-
gible to receive stock options.
■ The stock options are exercisable after a two-year holding period. They may be exer-
cised at any time within the three years following the holding period.
■ The exercise price is equal to 120 percent of the reference price, which corresponds to
the average opening market price of the Siemens share during the five trading days
preceding the date of the stock option grant.
Following a resolution on November 14, 2002 by the Managing and Supervisory Boards,
9,397,005 stock options with an estimated fair value of €92.1 million, or €9.80 per
option, were awarded to 5,814 key executives in the fiscal year just ended. The exercise
price amounts to €53.70. Of the total, members of the Managing Board received 345,000
stock options with an estimated value of €3.4 million.

Under the two plans (1999 Plan and 2001 Plan), the following numbers of stock
options were issued through September 30, 2003:
Options granted Exercise price Grant date granted price fair value
November 1999* 1,847,895 €57.73 €27.7 million
November 2000* 3,260,391 €86.23 €82.8 million
December 2001 7,357,139 €87.19 €171.9 million
November 2002 9,397,005 €53.70 €92.1 million
Options exercised or forfeited 1,451,554
Outstanding at September 30, 2003 20,410,876
* restated to reflect stock split
Of the total outstanding at year-end, 762,500 stock options or 3.7 percent were held by
members of the Managing Board of Siemens AG.
The following table summarizes tranches of stock options outstanding and exercisable
at September 30, 2003:
Options Remaining life Exercise price
November 1999* 1,583,674 3 years €57.73
November 2000* 2,989,384 4 years €86.23
* restated to reflect stock split
The fair value of each stock option is estimated on the grant date using the Black-
Scholes option pricing model. In accordance with U.S. GAAP (Accounting Principles
Board Opinion No. 25), no compensation cost is reflected in net income (loss) for stock
options granted under the 2001 Plan. Effective with fiscal 2004, however, the Company
has elected to recognize the cost of newly issued stock options as prescribed by State-
ment of Financial Accounting Standards (SFAS) No.123, Accounting for Stock-Based
Compensation, as amended by SFAS No. 148, Accounting for Stock-Based Compensation –
Transition and Disclosure.
The issue of stock options to members of the Managing Board on or after October 1,
2003 is subject to the proviso that the Supervisory Board may restrict the stock option
exercise in the event of extraordinary, unforeseen changes in the market price of the
Siemens share.
56 compensation report

compensation report 57
4. Managing Board remuneration in fiscal 2003
Managing Board members’ compensation and other benefits for the fiscal year ended
September 30, 2003 amounted to €28.2 million, compared with €18.5 million in the
prior year, and comprised the following:
(in millions of €) 2003 2002
Base salary 6.5 4.9
Annual bonus 12.6 9.8
Long-term bonus 7.9 3.0
Other 1.2 0.8
Total cash compensation 28.2 18.5
per capita 2.2 1.7
In addition, the members of the Managing Board received a total of 345,000 stock
options on shares of Siemens AG in fiscal 2003 (151,000 in fiscal 2002). Based on an esti-
mated fair value at grant date of €9.80 per option (€23.36 in fiscal 2002), the total value
of stock options issued to members of the Managing Board amounted to €3.4 million in
fiscal 2003 (€3.5 in fiscal 2002). The options are exercisable within the three years fol-
lowing a holding period of two years. In accordance with the terms and conditions of the
2001 Plan, the exercise price is equal to €53.70, which corresponds to 120 percent of the
average opening market price of the Siemens share during the five trading days preced-
ing the date of stock option issue.
Total remuneration paid to Managing Board members was as follows:
(in millions of €) 2003 2002
Cash compensation 28.2 18.5
Stock-based compensation 3.4 3.5
Total remuneration 31.6 22.0
per capita 2.4 2.0
No loans from the Company are provided to members of the Managing Board.

II. Supervisory Board remuneration
The remuneration of members of the Supervisory Board was set at the Annual Sharehold-
ers’ Meeting through shareholder approval of a proposal by the Managing and Supervisory
Boards. Details of this decision are set forth in the Articles of Association of Siemens AG.
The remuneration of members of the Supervisory Board is based on the Company’s size,
the assignments and responsibilities of Supervisory Board members, and the Company’s
overall business position and performance. The remuneration includes a large earnings-
or dividend-related component which is contingent on the Company’s progress. The Chair-
man, the Deputy Chairmen as well as the Chairman and members of the Audit Committee
receive additional compensation.
The current remuneration policies for the Supervisory Board were authorized at the
Annual Shareholders’ Meeting of February 18, 1999. Compensation policies for service on a
committee were set at the Annual Shareholders’ Meeting of January 23, 2003. Details are set
out in § 17 of the Articles of Association of Siemens AG.
The compensation of Supervisory Board members incorporates three components:
■ a fixed component
■ a variable component depending on the annual dividend
■ a long-term component based on the development of the stock market price.
In accordance with these remuneration policies, the fixed compensation of each Supervi-
sory Board member is €6,000. As dividend-dependent compensation, each member of the
Supervisory Board receives €3,500 for each €0.05 dividend per share in excess of €0.20. The
Chairman of the Supervisory Board receives twice the standard compensation rate of a sim-
ple member and each Deputy Chairman receives 1.5 times the standard compensation rate.
The Chairman of the Audit Committee receives an additional 100 percent and each remain-
ing member of the Audit Committee receives an additional 50 percent of the standard
compensation rate. The members of the Supervisory Board are reimbursed for any out-of-
pocket expenses incurred in connection with their duties and for any sales taxes paid.
In addition, each member of the Supervisory Board receives annually 1,500 stock appre-
ciation rights (SARs) granted and exercisable on the same terms as options issued under
the Siemens stock option plan in effect at the time.
58 compensation report

Based on a dividend rate of €1.10 per share, the Supervisory Board’s total cash compensa-
tion for the fiscal year just ended (including reimbursement of out-of-pocket expenses)
amounted to €1.9 million.
For the fiscal year just ended, the following cash compensation was paid:
■ €207thousandtotheChairmanofthe Supervisory Board,who also chairs the Audit Com-
mittee;
■ €138 thousand to each of the Deputy Chairmen, who are also members of the Audit
Committee, whereby €104 thousand was paid to the Deputy Chairman elected to the
Supervisory Board on January 23, 2003;
■ €104 thousand to each of the remaining members of the Audit Committee;
■ €69 thousand to each of the remaining members of the Supervisory Board, whereby €52
thousand was paid on a pro rata basis to each of the members elected on January 23,
2003 and €17 thousand to the member whose appointment was approved by the registry
courts on July 14, 2003;
■ €23 thousand on average to each of the members who left the Supervisory Board on
January 23, 2003.
In addition, each member of the Supervisory Board received 1,500 SARs which had a fair
value of €14 thousand on the date of grant. The newly elected members of the Supervisory
Board received 1,125 SARs, and the members who left the Board received 500 SARs. The total
value of SARs issued to members of the Supervisory Board for the fiscal year ended Septem-
ber 30, 2003 was €302 thousand.
No loans from the Company are provided to members of the Supervisory Board.
III. Stock ownership by members of the Managing and Supervisory Boards
At October 25, 2003, members of the Managing Board during the fiscal year held 690,229
shares and stock options representing 0.077 percent of the capital stock of Siemens AG.
Members of the Supervisory Board held 13,998 shares and stock options. This figure
does not include 16,736,966 shares, or two percent of the capital stock, that are held by the
von Siemens-Vermögensverwaltung GmbH (vSV), a German limited liability entity that func-
tions much like a trust. In addition, the vSV has voting control over 38,877,285 shares, or
some four percent of the capital stock, under a power of attorney. Mr. Peter von Siemens is
authorized to vote these shares as a representative of the founder’s family.
Pursuant to § 15a of the German Securities Trading Act, members of the Managing and
Supervisory Boards are legally required to disclose significant purchases or sales of shares
of Siemens AG. In the fiscal year just ended, no such transactions were reported.
compensation report 59

60 information for shareholders
Information for shareholders
110 Consolidated Statements of Income 112 Consolidated Balance Sheets 114 Consolidated Statements of Cash Flow 116 Consolidated Statements of Changes in
Shareholders’ Equity
62 Management’s discussion and analysis62 – Basis of Presentation65 – Highlights – fiscal 2003 compared to fiscal 200266 – Acquisitions and dispositions 67 – Segment information analysis 67 – Operations67 – Information and Communications70 – Automation and Control74 – Power76 – Transportation78 – Medical79 – Lighting80 – Other Operations and Reconciliation to
Financial Statements81 – Financing and Real Estate82 – Eliminations, reclassifications and
Corporate Treasury
83 – Component information – statements of income83 – Operations85 – Financing and Real Estate85 – Eliminations, reclassifications and
Corporate Treasury86 – Siemens worldwide
88 – EVA Performance
90 – Dividend
90 – Liquidity and capital resources 90 – Cash flow – fiscal 2003 compared to fiscal 200292 – Capital resources and capital requirements
100 – Critical accounting estimates
103 – Risk Management
108 – Outlook
109 – Subsequent events

information for shareholders 61
186 Statement of the Managing Board187 Independent auditors’ report188 Five-year summary 190 Positions held by Supervisory Board members 192 Positions held by Managing Board members 194 Glossary 196 Index 198 Financial calendar
118 Segment Information 120 Notes

62 management’s discussion and analysis
Basis of Presentation
To help shareholders understand and follow our progress, we present our results both in
aggregate and in three separate components that match the structure of our business. The
sum of results for the three components equals the result for Siemens worldwide.
Operations: The majority of our business is devoted to providing products and services
to customers based on Siemens’ historical expertise in innovative electrical engineering
and electronics. We call this component of our business Operations, which is divided into
the 13 operating Groups. These Groups typically design, manufacture, market, sell, and
service products and systems, or help customers use and manage those products and sys-
tems. A Group is equivalent to a reportable segment as defined by U.S. GAAP.
Financing and Real Estate: Another component of our Company is made up of two
Groups, involved in non-manufacturing activities such as financing, leasing, and real
estate.
Eliminations, reclassifications and Corporate Treasury: Our Corporate Treasury
department provides various financial services to the Operations and Financing and Real
Estate components of our business, and businesses in those two components also conduct
business with each other. To give shareholders a clear view of our external performance as a
company, we separate out these internal transactions when presenting our results for
Siemens as a whole. These eliminations, reclassifications, and treasury activities comprise
a third component called Eliminations, reclassifications and Corporate Treasury. This
third component is designed primarily to ensure that results for the Company as a whole
and for its two main components are both transparent and meaningful for investors.
In our consolidated statements of income and cash flows, and on our consolidated bal-
ance sheets, we show aggregate results for the whole Company, reported as Siemens world-
wide. Then we break out the results for each of the three components described above. We
follow a similar approach in our narrative analysis of the year’s results.
Management’s discussion and analysis
Siemens worldwide (Consists of the following three components which include the thirteen operating Groups and two Financing and Real Estate Groups)
Operations
■ Information and Communication Networks (ICN)■ Information and Communication Mobile (ICM)■ Siemens Business Services (SBS)
■ Automation and Drives (A&D)■ Industrial Solutions and Services (I&S)■ Siemens Dematic (SD)■ Siemens Building Technologies (SBT)
■ Power Generation (PG)■ Power Transmission and Distribution (PTD)
■ Transportation Systems (TS)■ Siemens VDO Automotive (SV)
■ Medical Solutions (Med)
■ Osram
Other operations; Corporate items, pensions andeliminations
Financing and Real Estate
■ Siemens Financial Services (SFS)■ Siemens Real Estate (SRE)
Eliminations, reclassifications and Corporate Treasury

Man
agem
ent’s
dis
cuss
ion
and
anal
ysis
management’s discussion and analysis 63
The Management’s Discussion and Analysis that follows first sets the context for fiscal
2003 with a summary of highlights for the year, including acquisitions and dispositions.
We then discuss results for the Groups comprising the Operations and Financing and
Real Estate components for fiscal 2003 and compare them with results from fiscal 2002.
Thereafter we provide an analysis of the consolidated income statement, performance
under economic value added (EVA), and discuss topics including liquidity and capital
resources, critical accounting estimates and risk management. The discussion concludes
with our outlook for the fiscal year ahead and a summary of material events that occurred
subsequent to the close of the fiscal year.
Effective December 2001, we no longer consolidate Infineon in our financial results.
Instead we account for Infineon as an investment using the equity method. Accordingly,
our net investment in Infineon is included in our consolidated balance sheet under Long-
term investments, and we report our share of Infineon’s net income or loss in our consoli-
dated income statement as part of investment income (for further information see Notes to
the Consolidated Financial Statements). The consolidated statements of income and cash
flows of Infineon for the first two months of fiscal 2002, (before this change occurred) are
included in Eliminations, reclassifications and Corporate Treasury.
We measure the profitability of our Operations Groups by Group profit. Group profit is
the measure used by our Managing Board as the chief operating decision maker for the
Company in assessing performance. Group profit is also the basis for calculating EVA for
Operations which in turn is part of the determination of the amount of executive incentive
compensation in accordance with our Company-wide bonus program.
Our Managing Board uses Group profit because it measures operating profit before cer-
tain centrally managed items, such as tax, financing and certain pension costs. Financing
interest is any interest income other than interest income related to receivables from cus-
tomers, from cash allocated to the Groups and interest expense on payables. We believe the
exclusion of tax and financing expense from Group profit is particularly appropriate for
two reasons. First, because the majority of our Groups are not organized as single legal
units but rather are made up of local operations in numerous countries whose taxation is
dependent on that of Siemens’ operations in those countries as a whole, the Company’s tax
expense is not directly attributable to particular Groups. Likewise, the financing income or
expenses of the Company depend on its overall credit rating and cost of capital and not on
that of its individual Groups or components. Second, tax planning and financing manage-
ment are performed centrally and regionally for the entire Company rather than by Group
management. We further believe that the exclusion of certain pension costs is appropriate
for Group profit to the extent Group management is not involved in the funding or alloca-
tion of pension plan assets.
64 management’s discussion and analysis
We therefore believe that by excluding the effect of the items mentioned above, Group
profit allows investors to compare operating profitability among our Groups which operate
across jurisdictions with varying levels of taxation and in businesses with different capital
investment needs. We also believe that Group profit further enhances investors’ under-
standing of our Group performance because it allows them to see our results through the
eyes of our management. Other companies that use Group profit may calculate it differ-
ently, and their figures may not be comparable to ours.
In contrast, we assess the profitability of our Financing and Real Estate Groups by
income before income taxes since interest income and expense is an important source of
revenue and expense for these Groups.
Our Managing Board also determined Net capital employed as the asset measure used to
assess the capital intensity of the Operations Groups. Its definition corresponds with the
Group profit measure. Net capital employed is based on total assets excluding intracom-
pany financing receivables and intracompany investments as well as tax-related assets. The
remaining assets are reduced by non-interest bearing liabilities other than tax-related lia-
bilities (i.e. accounts payable) and certain accruals to derive Net capital employed. Our Man-
aging Board also determined Total assets as the asset measure used to assess the capital
intensity of the Financing and Real Estate Groups. For further information regarding Net
capital employed, see the Notes to the Consolidated Financial Statements.

Man
agem
ent’s
dis
cuss
ion
and
anal
ysis
management’s discussion and analysis 65
Highlights – fiscal 2003 compared to fiscal 2002
■ Net income for fiscal 2003 was €2.445 billion, representing a 47% increase from €1.661
billion a year earlier excluding a tax-free gain of €936 million from sales of Infineon
shares.
■ Group profit from Operations increased to €4.295 billion in fiscal 2003 from €3.756
billion in fiscal 2002. The majority of Siemens Groups reported higher earnings and
margins year-over-year.
■ Net cash from operating and investing activities was €1.773 billion, including €5.712
billion in net cash from operating activities. Net cash provided by operating activities
included cash outflows of €1.192 billion in supplemental cash contributions to Siemens
pension trusts. Net cash used in investing activities of €3.939 billion included increases
in investments and marketable securities of €957 million, and €929 million for a strate-
gic acquisition at Power Generation.
■ Sales were €74.233 billion and orders were €75.056 billion, down 12% and 13%, respec-
tively from the prior year. Adjusting for currency effects and portfolio activities, sales
and orders were 4% and 5% lower, respectively, than a year earlier.
■ Siemens’ Managing and Supervisory Boards propose a dividend of €1.10 per share.
For the fiscal year ended September 30, 2003, Siemens reported net income of €2.445
billion and earnings per share of €2.75. Fiscal 2002 included a tax-free gain of €936 million
on sales of shares in Infineon Technologies AG, which boosted net income in that period to
€2.597 billion and earnings per share to €2.92. Excluding the Infineon gain, net income
rose 47% year-over-year from €1.661 billion. The major component of this improvement
was growth in Group profit from Operations, which climbed 14% to €4.295 billion for the
year. Group profit margins rose at 10 of the 13 Groups in Operations and at Siemens Finan-
cial Services (SFS). Losses related to Siemens’ ownership of Infineon decreased and positive
effects from Corporate Treasury also contributed to net income growth for the year.
Net cash from operating and investing activities was €1.773 billion in fiscal 2003 com-
pared to €4.754 billion a year earlier, a period which included significant net proceeds from
portfolio activities. Within Operations, net cash provided by operating activities was €4.123
billion compared to €4.277 billion in the prior year. Both periods included supplemental
cash contributions to Siemens pension plans, totalling €1.192 billion and €1.782 billion in
fiscal 2003 and 2002, respectively. In fiscal 2003, net cash used in investing activities of
€3.939 billion included €929 million to acquire the industrial turbine businesses of Alstom
S.A., Paris (Alstom) and €957 million in increases in investments and marketable securi-
ties.
Sales of €74.233 billion and orders of €75.056 billion reflected macroeconomic condi-
tions, the strong decline in the value of the U.S. dollar relative to the euro during the fiscal
year, and the net effects of acquisitions and dispositions compared to fiscal 2002. Excluding
currency and portfolio effects (i.e., on a comparable basis), sales and orders were within
4% and 5%, respectively, of prior-year levels. Against this backdrop, a number of Siemens’
earnings leaders increased both sales and orders year-over-year on a comparable basis,
including Medical Solutions (Med), Automation and Drives (A&D), Siemens VDO Automo-
tive (SV), and Osram.

66 management’s discussion and analysis
Acquisitions and dispositions
Alstom
In July 2003, Siemens completed the acquisition of the industrial turbine business of
Alstom, which was structured in two transactions. In the first transaction in April 2003,
effective April 30, PG acquired the small gas turbine business of Alstom. In the second
transaction in July 2003, PG acquired Alstom’s medium-sized gas and steam turbine busi-
nesses. The two transactions resulted in an aggregate net purchase price of €929 million,
net of cash acquired. The Company has not finalized the purchase price allocation for these
acquisitions. Based on the preliminary purchase price allocation, approximately €195 mil-
lion was allocated to intellectual property rights, €129 million to customer relationships,
and €393 million to goodwill.
Draeger Medical
In June 2003, Med contributed its Patient Care System and Electro Cardiography System
businesses into a joint venture with Draegerwerk AG in exchange for a 35 percent interest in
a joint venture Draeger Medical AG & Co. KGaA (Draeger Medical). In connection with the
contribution, Siemens realized a pretax gain of €63 million. The contribution agreement
also obligates Siemens to contribute to Draeger Medical the net proceeds from the sale of its
Life Support Systems business. By consenting to this sale, Siemens and Draegerwerk AG
received approval for the joint venture by antitrust authorities. In August 2003, Siemens
signed a contract toward the sale of its Life Support Systems business to Getinge AB, Swe-
den. This sale closed in October 2003. Med’s interest in Draeger Medical is accounted for
using the equity method.

Man
agem
ent’s
dis
cuss
ion
and
anal
ysis
management’s discussion and analysis 67
Segment information analysis
Operations
Information and Communications
Information and Communication Networks (ICN)
ICN improved its performance despite ongoing market challenges, narrowing its loss
quarter-by-quarter throughout the year and posting a profit in the fourth quarter. The mar-
ket for telecommunications and networking equipment remained challenging, as cus-
tomers held capital expenditures down while absorbing and integrating past investments.
However, for the year as a whole, ICN cut its loss to €366 million from €691 million a year
earlier, a period which benefited from €634 million in gains primarily related to the sale of
businesses, including Unisphere Networks, partially offset by an asset impairment of €378
million at Efficient Networks and charges for asset write-downs of €225 million. As ICN
made significant progress in its Profitability and Cash Turnaround (PACT) program, sever-
ance charges in fiscal 2003 were €119 million compared to €352 million in the prior fiscal
year. Fiscal 2003 sales of €7.122 billion were 26% lower than in fiscal 2002, and orders of
€7.070 billion were 19% lower than a year earlier. While market forces accounted for much of
these decreases, five percentage points of the declines in sales and orders were due to
effects from currency translation.
At the division level, the Carrier Networks and Services business recorded a loss of €439
million in fiscal 2003. Sales were lower at €3.455 billion in fiscal 2003. Enterprise Networks
reported progressively higher profits in all four quarters, and more than doubled its profit
year-over-year, with earnings totaling €220 million on sales of €3.684 billion. The division
benefited primarily from a streamlined cost structure, and also from higher market
demand for lease sales.
Net capital employed as of September 30, 2003 decreased to €722 million from €1.100
billion at the end of the prior fiscal year, due to lower expenditures for property, plant and
equipment and improved asset management. Cash flow from operating and investing
activities in fiscal 2003 was again positive, totaling €106 million. Net cash in fiscal 2002
benefited from proceeds from the sales of businesses. Payments for severance and capacity
adjustments of €218 million in fiscal 2003 were significantly lower than in the prior year.
Lower Net capital employed, combined with a substantially better Group profit performance
compared to fiscal 2002, significantly improved ICN’s negative EVA.
Year endedSeptember 30,
(€ in millions) Change 2003 2002
Group profit 47% (366) (691)
Group profit margin (5.1)% (7.2)%
Total sales (26)% 7,122 9,647
New orders (19)% 7,070 8,697
Net cash from operating and investing activities 106 711
September 30,
2003 2002
Net capital employed 722 1,100
Employees (in thousands) 33 39

68 management’s discussion and analysis
Information and Communication Mobile (ICM)
Group profit at ICM rose to €180 million from €96 million in fiscal 2002. Sales of €9.964
billion for fiscal 2003 compared to €11.045 billion in fiscal 2002, and orders were €9.960
billion compared to €11.538 billion a year earlier, reflecting particularly the continuing
decline in the wireless infrastructure market. Both years included charges for severance,
totaling €86 million in fiscal 2003 and €105 million in fiscal 2002, primarily related to
Mobile Networks. Continuing its Group wide productivity programs, which were initiated
in fiscal 2001, ICM announced in July plans for further cost reductions, including an addi-
tional targeted headcount reduction of 2,300 positions through fiscal 2004. The Group
began implementing the new reductions and taking associated charges in the fourth quar-
ter, which will continue into fiscal 2004.
Handset sales at ICM’s Mobile Phones Division surged to 39.1 million units from 33.3
million units a year earlier, on strong demand for new products, and sales rose 5% to
€4.474 billion for the year. Increased competition continued to drive down average selling
price per unit. In addition, a separately branded mobile handset line introduced in fiscal
2003 incurred operating losses and charges to inventory. As a result, Mobile Phones con-
tributed €27 million to Group profit for the year, down from €82 million a year earlier. The
Cordless Products business again made a significant contribution to ICM’s Group profit for
the year. Mobile Networks continued to streamline operations in line with market condi-
tions, which were reflected in the division’s sales of €4.311 billion, 20% lower than a year
earlier. Charges for severance of €72 million were more than offset by positive resolutions
of customer financing risks, and the division contributed €116 million to Group profit com-
pared to €5 million a year earlier.
Net capital employed at September 30, 2003 was €1.367 billion, compared to €1.973
billion at the end of the prior fiscal year. Continuing asset management improvements
resulted in net cash from operating and investing activities of €692 million, and included
payments for severance of €58 million in fiscal 2003. Cash flow will be impacted in future
periods due to payments related to anticipated headcount reduction activities. EVA im-
proved substantially year-over-year, but remained negative.
Year endedSeptember 30,
(€ in millions) Change 2003 2002
Group profit 88% 180 96
Group profit margin 1.8% 0.9%
Total sales (10)% 9,964 11,045
New orders (14)% 9,960 11,538
Net cash from operating and investing activities 692 594
September 30,
2003 2002
Net capital employed 1,367 1,973
Employees (in thousands) 27 29

Man
agem
ent’s
dis
cuss
ion
and
anal
ysis
management’s discussion and analysis 69
Siemens Business Services (SBS)
SBS posted a Group profit of €13 million for the fiscal year compared to €101 million in
fiscal 2002. The decline predominately reflects €77 million in charges for risks associated
with a long-term business process outsourcing contract in the U.K. Sales of €5.205 billion
and orders of €5.226 billion were lower than in the previous year, driven in part by weak-
ness in the IT consulting market and intense pricing pressure in the IT maintenance and
outsourcing markets.
Net capital employed at September 30, 2003 was €294 million compared to €264 million
at the end of the prior fiscal year. Net cash from operating and investing activities was a
negative €62 million compared to a positive €173 million a year earlier, due largely to a
decrease in accounts payable. This development, combined with lower Group profit, turned
EVA negative for SBS.
Year endedSeptember 30,
(€ in millions) Change 2003 2002
Group profit (87)% 13 101
Group profit margin 0.2% 1.7%
Total sales (10)% 5,205 5,773
New orders (16)% 5,226 6,256
Net cash from operating and investing activities (62) 173
September 30,
2003 2002
Net capital employed 294 264
Employees (in thousands) 35 34

70 management’s discussion and analysis
Automation and Control
Automation and Drives (A&D)
A&D was again a standout among Siemens Groups, increasing Group profit 11% year-
over-year to €806 million, further improving its Group profit margin to 9.6%, and strength-
ening its market position. Both periods included charges for severance programs, particu-
larly in the U.S., totaling €50 million in fiscal 2003 and €26 million in fiscal 2002. Sales of
€8.375 billion and orders of €8.476 billion for the year were both 3% lower than A&D
reported in fiscal 2002. Excluding currency exchange effects, sales and orders both rose
2% year-over-year, as A&D continued to balance its business base with growth in the Asia-
Pacific region while gaining market share in Europe.
Net capital employed at September 30, 2003 decreased to €1.925 billion, down from
€2.197 billion at the end of the prior fiscal year. Net cash from operating and investing activ-
ities increased to €1.060 billion. Together with increased Group profit, these developments
combined to produce a substantial increase in EVA.
Year endedSeptember 30,
(€ in millions) Change 2003 2002
Group profit 11% 806 723
Group profit margin 9.6% 8.4%
Total sales (3)% 8,375 8,635
New orders (3)% 8,476 8,728
Net cash from operating and investing activities 1,060 1,019
September 30,
2003 2002
Net capital employed 1,925 2,197
Employees (in thousands) 50 51

Man
agem
ent’s
dis
cuss
ion
and
anal
ysis
management’s discussion and analysis 71
Industrial Solutions and Services (I&S)
I&S significantly improved its bottom line, posting a Group profit of negative €41 mil-
lion compared to a negative €198 million a year earlier, in part due to lower charges for sev-
erance of €24 million in fiscal 2003 compared to €118 million in fiscal 2002. A continuing
contraction in the market for industrial solutions led to orders of €3.955 billion compared
to €4.120 billion a year earlier, and sales of €4.012 billion compared to €4.480 billion in the
prior year. Five percentage points of the decrease in orders resulted from the effects of cur-
rency translation and acquisitions and dispositions.
Net capital employed at September 30, 2003 decreased to €167 million from €315 million
at the end of the prior fiscal year, due to reductions in accounts receivable and inventories.
Net cash from operating and investing activities improved significantly, turning positive at
€54 million compared to a negative €107 million a year earlier, despite cash outlays of €77
million for severance, up from €35 million a year earlier. While EVA at I&S remained nega-
tive, these developments combined with better earnings performance improved EVA signif-
icantly year-over-year.
Year endedSeptember 30,
(€ in millions) Change 2003 2002
Group profit 79% (41) (198)
Group profit margin (1.0)% (4.4)%
Total sales (10)% 4,012 4,480
New orders (4)% 3,955 4,120
Net cash from operating and investing activities 54 (107)
September 30,
2003 2002
Net capital employed 167 315
Employees (in thousands) 26 29

72 management’s discussion and analysis
Siemens Dematic (SD)
SD posted a Group loss of €218 million for the year, compared to Group profit of €45 mil-
lion in fiscal 2002. A substantial increase in loss provisions and charges, in an aggregate
of €209 million related to two large contracts in Europe was the key factor in this result,
together with other charges. The majority of the loss provisions occurred at the Material
Handling Automation division. The charges are related primarily to a contract for the
design and installation of a complete logistical infrastructure for a postal sorting center in
the U.K. The Postal Automation Division increased its profit and earnings margin and won
large orders from the U.S. Postal Service, while the Electronics Assembly Systems Division
narrowed its loss year-over-year and restored sales growth in its large pick-and-place
equipment business on a breakeven basis.
For SD as whole, sales were €2.600 billion compared to €2.995 billion in fiscal 2002, and
orders were €2.599 billion compared to €2.810 billion a year earlier. Excluding the effects of
currency translation and portfolio activities, sales were down 4% and orders rose 2% for the
year.
Net capital employed at September 30, 2003 was €877 million, down from €975 million
at the end of the prior fiscal year. Net cash from operating and investing activities was a
negative €170 million compared to a negative €70 million a year earlier, reflecting in part
reduced earnings. Cash flow will be negatively affected in future periods due to the contract
losses noted above. The Group’s EVA decreased and remained negative.
Year endedSeptember 30,
(€ in millions) Change 2003 2002
Group profit (218) 45
Group profit margin (8.4)% 1.5%
Total sales (13)% 2,600 2,995
New orders (8)% 2,599 2,810
Net cash from operating and investing activities (170) (70)
September 30,
2003 2002
Net capital employed 877 975
Employees (in thousands) 10 12

Man
agem
ent’s
dis
cuss
ion
and
anal
ysis
management’s discussion and analysis 73
Siemens Building Technologies (SBT)
Group profit at SBT was €101 million for the fiscal year, which included €80 million in
severance charges taken to realign the Group’s workforce with market conditions. Group
profit a year earlier was €195 million. Sales were €4.990 billion compared to €5.619 billion
in fiscal 2002, and orders were €4.775 billion compared to €5.601 billion a year earlier.
Excluding the effects of currency translation, sales were down 5% and orders were down 9%
year-over-year.
Net capital employed at September 30, 2003 was €1.447 billion, down from €1.778 billion
at the end of the prior fiscal year, as lower inventories and accounts receivable improved
Net working capital. Net cash from operating and investing activities improved year-over-
year to €375 million from €295 million a year earlier, primarily due to lower investments in
property, plant and equipment and the working capital improvements noted above. Pay-
ments for severance in fiscal 2003 were €72 million. Due to lower earnings for the year, the
Group’s EVA decreased and remained negative.
Year endedSeptember 30,
(€ in millions) Change 2003 2002
Group profit (48)% 101 195
Group profit margin 2.0% 3.5%
Total sales (11)% 4,990 5,619
New orders (15)% 4,775 5,601
Net cash from operating and investing activities 375 295
September 30,
2003 2002
Net capital employed 1,447 1,778
Employees (in thousands) 33 36

74 management’s discussion and analysis
Power
Power Generation (PG)
PG led all Siemens Groups with €1.171 billion in Group profit and a Group profit margin
of 16.8%. In fiscal 2003, PG increased the percentage of its revenues and profits coming
from services, acquired the industrial turbine businesses of Alstom to complement its exist-
ing large turbine business, and further diversified its business base with significant orders
in Asia, Europe and the Middle East. The negative demand trend in the U.S. market contin-
ues to affect comparison of PG’s sales and orders with prior periods, resulting in 26% lower
sales for PG overall, or €6.967 billion in fiscal 2003 compared to €9.446 billion in fiscal
2002, and orders of €7.302 billion, down from €10.586 billion. Currency translation effects
accounted for seven and four percentage points of the decline in sales and orders, respec-
tively.
The reduction in sales was the primary reason for PG’s lower Group profit year-over-
year. However, PG maintained its Group profit margin at the same level as a year earlier,
including net gains of €359 million related to cancellation of orders, partly offset by €92
million in allowances on inventories associated with the cancellations. Charges for sever-
ance were lower compared to the prior year.
The acquisition of Alstom’s industrial turbine business added €1.2 billion to the Group’s
order backlog, which totaled €14.3 billion at the end of fiscal 2003. These additions were off-
set in large part due to the negative currency effects during the year. For comparison, PG’s
backlog at the end of the prior year was €14.7 billion. Both totals exclude reservations.
Net capital employed at September 30, 2003 increased to €1.712 billion, compared to a
negative €144 million at the end of the prior fiscal year, as PG acquired the industrial tur-
bine business of Alstom and used advance payments for project inventories. This is also
reflected in net cash from operating and investing activities, which was a negative €448
million compared to a positive €662 million a year earlier. These developments and lower
Group profit resulted in a decrease in PG’s EVA, which nevertheless remained strong and
led all Groups.
Year endedSeptember 30,
(€ in millions) Change 2003 2002
Group profit (26)% 1,171 1,582
Group profit margin 16.8% 16.7%
Total sales (26)% 6,967 9,446
New orders (31)% 7,302 10,586
Net cash from operating and investing activities (448) 662
September 30,
2003 2002
Net capital employed 1,712 (144)
Employees (in thousands) 30 26

Man
agem
ent’s
dis
cuss
ion
and
anal
ysis
management’s discussion and analysis 75
Power Transmission and Distribution (PTD)
PTD delivered €207 million in Group profit generated particularly at its High Voltage
and Medium Voltage divisions. Group profit of €109 million in the prior year included a €54
million loss on the sale of PTD’s Metering division. Fiscal 2002 also included charges of €34
million primarily for a severance program. Sales of €3.399 billion and orders of €3.586 bil-
lion both decreased 19%, impacted by the divestment of Metering and currency translation
effects. Excluding the effects of currency translation and portfolio activities, both sales and
orders were 2% and 3% lower, respectively, compared to the prior fiscal year.
Net capital employed decreased to €798 million from €928 million due to improvements
in Net working capital driven by higher customer prepayments. Net working capital
improvements also positively impacted net cash from operating and investing activities,
which increased by €238 million to €387 million. These factors contributed to PTD’s EVA
turning positive in fiscal 2003.
Year endedSeptember 30,
(€ in millions) Change 2003 2002
Group profit 90% 207 109
Group profit margin 6.1% 2.6%
Total sales (19)% 3,399 4,199
New orders (19)% 3,586 4,429
Net cash from operating and investing activities 387 149
September 30,
2003 2002
Net capital employed 798 928
Employees (in thousands) 16 17

76 management’s discussion and analysis
Transportation
Transportation Systems (TS)
TS increased its Group profit 15%, to €284 million, despite having to take higher war-
ranty provisions, particularly in the fourth quarter. The Group-wide productivity program
also continued to yield results. Sales for the year rose to €4.697 billion, as TS converted
large orders from prior years into current business. Orders for the year of €4.674 billion
included large new rolling stock contracts in China, England, Norway, and Switzerland as
well as major new maintenance contracts in the U.K. The Group’s order backlog remained at
€11.2 billion, the same level as at the end of fiscal 2002.
Net capital employed increased from a negative €741 million to a negative €252 million
as TS used advance payments for project inventories. Higher inventories were also reflected
in net cash from operating and investing activities, which decreased from €95 million a
year ago to negative €217 million in fiscal 2003. The rate at which TS receives advance pay-
ments for customer projects will have an impact on its cash flow in the future. Despite
higher earnings, the effects of increased Net capital employed led to a decrease in EVA.
Year endedSeptember 30,
(€ in millions) Change 2003 2002
Group profit 15% 284 247
Group profit margin 6.0% 5.7%
Total sales 8% 4,697 4,367
New orders (11)% 4,674 5,247
Net cash from operating and investing activities (217) 95
September 30,
2003 2002
Net capital employed (252) (741)
Employees (in thousands) 18 17

Man
agem
ent’s
dis
cuss
ion
and
anal
ysis
management’s discussion and analysis 77
Siemens VDO Automotive (SV)
SV increased Group profit to €418 million for the year compared to €65 million a year
earlier, which included a €56 million gain from the sale of the Hydraulik-Ring business,
partly offset by write-downs of certain intangible assets. The Group’s innovative diesel
injection and onboard infotainment systems were major factors in the earnings improve-
ment. SV’s profitability improvement program also contributed to earnings growth, as the
Group cut material costs, streamlined its R&D and production processes, and tightened
administrative and IT spending. As a result, SV increased its Group profit margin from
0.8% in fiscal 2002 to 5.0% in fiscal 2003, though it still fell short of earning its cost of capi-
tal. Earnings improved primarily at the Group’s Powertrain, Chassis & Carbody, and Inte-
rior & Infotainment divisions after multi-year investments in innovative technologies.
Sales and orders of €8.375 billion were down 2% year-over-year, partly due to SV’s third-
quarter transfer of its automotive cockpit module business, with annual revenues of
approximately €800 million, to an existing joint venture with Faurecia S.A. Excluding this
transaction and currency translation effects, both sales and orders at SV rose 8% for the
year.
Net capital employed in fiscal 2003 increased from €3.746 billion to €3.949 billion. Net
cash from operating and investing activities was lower than in fiscal 2002, which included
proceeds from the sale of Hydraulik-Ring. EVA improved significantly on higher Group
profit, but remained negative.
Year endedSeptember 30,
(€ in millions) Change 2003 2002
Group profit 418 65
Group profit margin 5.0% 0.8%
Total sales (2)% 8,375 8,515
New orders (2)% 8,375 8,515
Net cash from operating and investing activities 184 224
September 30,
2003 2002
Net capital employed 3,949 3,746
Employees (in thousands) 44 43

78 management’s discussion and analysis
Medical
Medical Solutions (Med)
Med increased its Group profit 10%, to €1.118 billion, and its Group profit margin
climbed above 15% for the fiscal year. Innovative new products, particularly for diagnostic
imaging applications, again led the way. Group profit benefited also from a €63 million
gain related to the contribution of a portion of Med’s electromedical systems business to a
new joint venture, Draeger Medical, in return for a 35% equity stake. The divestment of the
remaining portion of the electromedical systems business, announced in the fourth quar-
ter, did not close until after the close of the fiscal year. Med’s sales for the year were €7.422
billion compared to €7.623 billion in fiscal 2002, and orders were €7.835 billion compared to
€8.425 billion a year earlier. Excluding currency translation effects, sales rose 7% and
orders increased 3% year-over-year, in part due to continued growth in the highly competi-
tive U.S. market.
Net capital employed decreased to €3.128 billion from €3.414 billion primarily due to
currency translation effects relating to Med’s large U.S. business. Net cash from operating
and investing activities was €845 million in fiscal 2003 compared to €1.124 billion a year
earlier, in part due to by higher accounts receivable in the current year. The combination of
higher Group profit and lower Net capital employed increased Med’s positive EVA.
Year endedSeptember 30,
(€ in millions) Change 2003 2002
Group profit 10% 1,118 1,018
Group profit margin 15.1% 13.4%
Total sales (3)% 7,422 7,623
New orders (7)% 7,835 8,425
Net cash from operating and investing activities 845 1,124
September 30,
2003 2002
Net capital employed 3,128 3,414
Employees (in thousands) 31 31

Man
agem
ent’s
dis
cuss
ion
and
anal
ysis
management’s discussion and analysis 79
Lighting
Osram
Osram generated €410 million in Group profit, a 12% increase over €365 million in the
prior year, and improved its Group profit margin still further, to 9.8%. The Opto Semicon-
ductors Division improved sales and earnings year over year and stringent cost contain-
ment Group-wide helped offset intense pricing pressure. Sales and orders for the year were
€4.172 billion compared to €4.363 billion a year earlier, as the General Lighting Division
strengthened its market position in the U.S. and the Group expanded its business in the
Asia-Pacific region and eastern Europe. Excluding strong currency translation effects, sales
and orders increased 6% year-over-year.
Net capital employed in fiscal 2003 decreased to €2.074 billion compared to €2.436 bil-
lion due to an improvement in Net working capital, particularly accounts receivable and
due to negative currency translation effects. Net cash from operating and investing activi-
ties increased from €284 million to €528 million, primarily due to higher Group profit,
reduced accounts receivable and lower capital spending. Higher Group profit on lower Net
capital employed significantly improved Osram’s positive EVA.
Year endedSeptember 30,
(€ in millions) Change 2003 2002
Group profit 12% 410 365
Group profit margin 9.8% 8.4%
Total sales (4)% 4,172 4,363
New orders (4)% 4,172 4,363
Net cash from operating and investing activities 528 284
September 30,
2003 2002
Net capital employed 2,074 2,436
Employees (in thousands) 36 35

80 management’s discussion and analysis
Other Operations and Reconciliation to Financial Statements
Other Operations and Reconciliation to financial statements include various categories of
items which are not allocated to the Groups, because the Managing Board has determined
that such items are not indicative of Group performance. These include results from cen-
trally managed projects. Reconciliation to financial statements includes various items
excluded by definition from Group profit.
Other Operations
Other Operations includes certain centrally held equity investments such as BSH Bosch
und Siemens Hausgeräte GmbH (for household appliances) and Fujitsu Siemens Computers
and other operating activities not associated with a Group. In fiscal 2003, higher contribu-
tions from joint ventures increased Group profit from Other Operations to €212 million
from €99 million in the prior year.
Reconciliation to Financial Statements
Reconciliation to financial statements consists of Corporate items, pensions and elimina-
tions, Other interest expense, as well as Gains on sales and dispositions of significant busi-
ness interests.
Corporate items, pensions and eliminations: Corporate items includes corporate
charges such as personnel costs for corporate headquarters, the results of corporate-related
derivative activities as well as corporate projects and non-operating investments including
the Company’s share of earnings (losses) from the equity investment in Infineon. Pensions
include the Company’s pension related income (expenses) not allocated to the Groups and
consists of all pension related costs, other than amounts related to the service cost of for-
eign pension plans. Eliminations represent the consolidation of transactions within the
Operations component. Corporate items, pensions and eliminations was a negative €1.576
billion in fiscal 2003, compared to a negative €1.282 billion in the same period a year ear-
lier. Corporate items was a negative €747 million, down from a negative €947 million in the
prior year, the difference due primarily to a lower loss in fiscal 2003 related to Siemens’
equity interest in Infineon and the positive resolution of an arbitration proceeding as well
as reduced corporate costs in fiscal 2003. Siemens’ equity share of Infineon’s loss was €170
million in fiscal 2003, compared to €338 million a year earlier. Pensions was €828 million in
fiscal 2003 compared to €250 million a year earlier, with the change due to lower return
assumptions on lower net asset values in our pension trusts, and increased amortization
expense related to the underfunding of our pension trusts.
Other interest expense for fiscal 2003 was €88 million, compared to €96 million in fiscal
2002, reflecting lower interest rates in the current year.
Gains on sales and dispositions of significant business interests in fiscal 2002 include
tax-free gains of €936 million resulting from the sale of 23.1 million Infineon shares during
the first quarter and an additional 40 million shares in the second quarter. Both transac-
tions took place on the open market.

Man
agem
ent’s
dis
cuss
ion
and
anal
ysis
management’s discussion and analysis 81
Financing and Real Estate
Siemens Financial Services (SFS)
Income before income taxes rose 25% at SFS, to €269 million compared to €216 million a
year ago. The Equity division again contributed to higher earnings for the Group, in partic-
ular due to equity earnings from an investment in an Indonesian power station. Income
before income taxes also benefited from lower provisions and write-offs at the Equipment
and Sales Financing division.
Total assets decreased to €8.445 billion, compared to €8.681 billion, primarily due to
negative currency translation effects. Net cash from operating and investing activities
decreased significantly from a positive €282 million in fiscal 2002 to negative €312 million
due to higher receivables. EVA improved due to the increase in earnings.
Year endedSeptember 30,
(€ in millions) Change 2003 2002
Income before income taxes 25% 269 216
Total sales 532 582
Net cash from operating and investing activities (312) 282
September 30,
2003 2002
Total assets 8,445 8,681
Allocated equity 1,080 930
Total debt 6,821 6,730
Therein intracompany financing 6,571 6,469
Therein debt from external sources 250 261
Employees (in thousands) 1 1

82 management’s discussion and analysis
Siemens Real Estate (SRE)
SRE earned €206 million before income taxes compared to €229 million a year earlier,
as lower interest costs were more than offset by the effects of lower occupancy rates. Sales
edged down 1% to €1.592 billion compared to €1.612 billion in fiscal 2002. Total assets
decreased to €3.607 billion in fiscal 2003 from €4.090 billion in fiscal 2002 due to sales of
real estate holdings. Net cash from operating and investing activities increased from €309
million in fiscal 2002 to €351 million in fiscal 2003. EVA decreased, but remained positive.
Eliminations, reclassifications and Corporate Treasury
Income before income taxes from Eliminations, reclassifications and Corporate Treasury
was €266 million, up from a loss of €284 million in the prior year, which included the sig-
nificant negative results of Infineon until it was deconsolidated in December 2001. Further-
more, the improvement in the current year results include positive effects from Corporate
Treasury, due primarily to lower short-term interest rates as well as positive effects relating
to hedges, not qualifying for hedge accounting, against interest rate developments. Corpo-
rate Treasury earnings also included a gain on the buyback of a nominal €1.440 billion of a
bond exchangeable into shares of Infineon. For further information, see Component Infor-
mation – Statements of Income – Eliminations, reclassifications and Corporate Treasury.
Year endedSeptember 30,
(€ in millions) Change 2003 2002
Income before income taxes (10)% 206 229
Total sales (1)% 1,592 1,612
Net cash from operating and investing activities 351 309
September 30,
2003 2002
Total assets 3,607 4,090
Allocated equity 920 920
Total debt 1,469 1,751
Therein intracompany financing 1,088 1,402
Therein debt from external sources 381 349
Employees (in thousands) 2 2

Man
agem
ent’s
dis
cuss
ion
and
anal
ysis
management’s discussion and analysis 83
Component information – statements of income
The following discussion adheres to our component model of reporting. We first provide
an analysis of the income statement for our Operations and Financing and Real Estate
components, which together include the 15 Siemens Groups that comprise our reportable
segments under U.S. GAAP. We then provide an income statement analysis for the Elimina-
tions, reclassifications and Corporate Treasury component, and for Siemens worldwide.
Operations
The following table presents selected income statement information for the Operations
component:
Net sales from Operations were €73.744 billion compared to €83.127 billion a year ear-
lier. The majority of the difference resulted from currency translation effects, primarily
reflecting the strength of the euro versus the U.S. dollar. Together with the net effect of
acquisitions and dispositions, these impacts reduced sales by 7%. Excluding these effects,
sales rose year over year at A&D, Med, Osram, SV and TS.
Gross profit as a percentage of sales increased to 27.7% from 27.4% in the prior year. Most
of the Groups increased their gross margins, led by SV, ICN, PTD, and Med. ICN’s improve-
ment reflects the results of its PACT cost-cutting program, and PTD and SV made significant
improvements in reducing materials costs and other productivity measures. Osram, A&D
and TS maintained their gross margins levels. Partly offsetting these results were gross
margin declines at SD and SBS, as these Groups took charges relating to long-term con-
tracts during fiscal 2003. ICM’s gross margin decreased less sharply, in part due to lower
average earnings per mobile phone sold. See the Segment Information Analysis for further
comments on the individual Groups.
Year endedSeptember 30,
(€ in millions) 2003 2002
Net sales from Operations 73,744 83,127
Gross profit on sales 20,446 22,805
as percentage of sales 27.7% 27.4%
Research and development expenses (5,067) (5,650)
as percentage of sales (6.9)% (6.8)%
Marketing, selling and general administrative expenses (13,243) (15,083)
as percentage of sales (18.0)% (18.1)%
Other operating income (expense), net 555 326
Income (loss) from investments in other companies, net 66 (142)
Income (expense) from financial assets and marketable securities, net (69) 124
Interest income of Operations, net 31 94
Other interest income (expense), net (88) (96)
Gains on sales and dispositions of significant business interests – 936
Income before income taxes 2,631 3,314

84 management’s discussion and analysis
Research and development expenses (R&D) were €5.067 billion in fiscal 2003, or 6.9% of
sales, representing a slight increase compared to the prior fiscal year. Among the Groups,
Med increased its R&D spending and ICN and ICM maintained stable R&D expenditures rel-
ative to declining sales.
Marketing, selling and general administrative expenses decreased 12% to €13.243 bil-
lion compared to the prior year, and declined as a percentage of sales from 18.1% to 18.0%.
Cost cutting and productivity programs at ICN, ICM, I&S, SV and Osram contributed to this
result, as did lower provisions for accounts and loans receivable, partially resulting from
revised estimates, in particular at ICM.
Other operating income (expense), net was a positive €555 million compared to a posi-
tive €326 million last year. The current period includes €359 million of net gains related to
cancellation of orders at PG, which are partly offset by inventory allowances recorded in
cost of sales. Also included in fiscal 2003 was a €63 million gain from Med’s contribution of
assets to a joint venture with Draeger. The prior year included a €421 million gain on the
sale of Unisphere Networks by ICN, a €60 million gain at ICN, a €56 million gain on the sale
of Hydraulik-Ring by SV, a €21 million gain from the sale of a portfolio of business activities
to KKR, and significantly lower contract cancellation gains at PG. Partly offsetting these
gains in fiscal 2002 was a €378 million impairment at ICN.
Income (loss) from investments in other companies, net was a positive €66 million com-
pared to a negative €142 million in the prior year. In fiscal 2003, there were higher contri-
butions from joint ventures compared to fiscal 2002. The prior year included higher losses
associated with Siemens’ equity share of Infineon partly offset by a €133 million gain on
the sale of two investments.
Income (expense) from financial assets and marketable securities, net was a negative
€69 million compared to a positive €124 million in fiscal 2002. The current year included
losses related to financial instrument contracts not qualifying for hedge accounting,
whereas the prior year included gains associated with such contracts.
Interest income (expense) of Operations, net was €31 million compared to €94 million
a year earlier, primarily due to lower interest rates and lower income in fiscal 2003.
Other interest expense for fiscal 2003 was €88 million, compared to €96 million in fiscal
2002. Lower interest expense in the current period reflects lower interest rates.
There were no gains on sales and dispositions of significant business interests in fiscal
2003. The prior year included tax-free gains of €936 million resulting from the sale of 23.1
million Infineon shares in the first quarter and 40 million shares in the second quarter.
Both transactions took place on the open market.

Man
agem
ent’s
dis
cuss
ion
and
anal
ysis
management’s discussion and analysis 85
Financing and Real Estate
The following table presents selected income statement information for the Financing and
Real Estate component:
Sales from Financing and Real Estate for the fiscal year 2003 were stable at €2.112 billion
compared to €2.186 billion in the prior fiscal year. Marketing, selling and general adminis-
trative expenses increased €9 million to €291 million. Other operating income, net was
€164 million compared to €151 million last year, primarily reflecting gains on sales of land
and buildings. Income from investments in other companies, net increased from €44 mil-
lion to €76 million in fiscal 2003, driven by strong investment earnings at SFS’ Equity divi-
sion, in particular related to an investment in a power generation project in Indonesia.
Income (expense) from financial assets and marketable securities, net was a negative €5
million compared to a negative €25 million in the prior year. For fiscal 2003, other interest
income (expense), net was €96 million compared to €81 million in fiscal 2002. As a result,
income before income taxes for fiscal year 2003 increased to €475 million compared to
€445 million in fiscal 2002.
Eliminations, reclassifications and Corporate Treasury
This component of Siemens worldwide includes results of intra-Siemens activity by our
Corporate Treasury, which provides corporate finance and treasury management services
to our Operations component and to our Financing and Real Estate component. It also
includes eliminations of activity conducted between those two components, and reclassifi-
cation of financial items.
Corporate Treasury in fiscal 2003 includes net gains from financial instrument transac-
tions not qualifying for hedge accounting and a €35 million gain from the buyback of a
nominal €1.440 billion of a bond exchangeable into shares of Infineon. Reclassifications in
fiscal 2002 include gains of €936 million resulting from the Infineon share sales mentioned
above, reclassified from gains on sales and disposition of significant business interests to
other operating income for Siemens worldwide.
Since December 2001, Infineon has been accounted for under the equity method. The
results of Infineon for the first two months of fiscal 2002, a loss of €115 million, are in-
cluded in Eliminations, reclassifications and Corporate Treasury.
Year endedSeptember 30,
(€ in millions) 2003 2002
Sales 2,112 2,186
Gross profit on sales 435 476
Marketing, selling and general administrative expenses (291) (282)
Other operating income (expense), net 164 151
Income (loss) from investments in other companies, net 76 44
Income (expense) from financial assets and marketable securities, net (5) (25)
Other interest income (expense), net 96 81
Income before income taxes 475 445
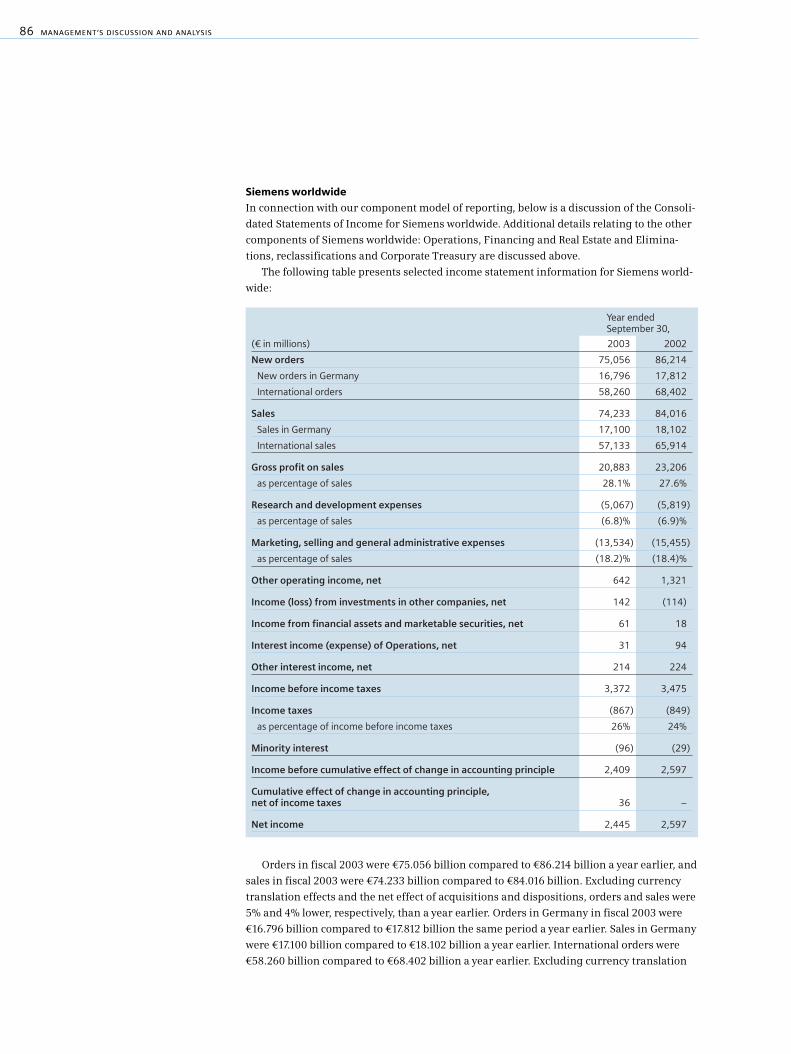
86 management’s discussion and analysis
Siemens worldwide
In connection with our component model of reporting, below is a discussion of the Consoli-
dated Statements of Income for Siemens worldwide. Additional details relating to the other
components of Siemens worldwide: Operations, Financing and Real Estate and Elimina-
tions, reclassifications and Corporate Treasury are discussed above.
The following table presents selected income statement information for Siemens world-
wide:
Orders in fiscal 2003 were €75.056 billion compared to €86.214 billion a year earlier, and
sales in fiscal 2003 were €74.233 billion compared to €84.016 billion. Excluding currency
translation effects and the net effect of acquisitions and dispositions, orders and sales were
5% and 4% lower, respectively, than a year earlier. Orders in Germany in fiscal 2003 were
€16.796 billion compared to €17.812 billion the same period a year earlier. Sales in Germany
were €17.100 billion compared to €18.102 billion a year earlier. International orders were
€58.260 billion compared to €68.402 billion a year earlier. Excluding currency translation
Year endedSeptember 30,
(€ in millions) 2003 2002
New orders 75,056 86,214
New orders in Germany 16,796 17,812
International orders 58,260 68,402
Sales 74,233 84,016
Sales in Germany 17,100 18,102
International sales 57,133 65,914
Gross profit on sales 20,883 23,206
as percentage of sales 28.1% 27.6%
Research and development expenses (5,067) (5,819)
as percentage of sales (6.8)% (6.9)%
Marketing, selling and general administrative expenses (13,534) (15,455)
as percentage of sales (18.2)% (18.4)%
Other operating income, net 642 1,321
Income (loss) from investments in other companies, net 142 (114)
Income from financial assets and marketable securities, net 61 18
Interest income (expense) of Operations, net 31 94
Other interest income, net 214 224
Income before income taxes 3,372 3,475
Income taxes (867) (849)
as percentage of income before income taxes 26% 24%
Minority interest (96) (29)
Income before cumulative effect of change in accounting principle 2,409 2,597
Cumulative effect of change in accounting principle, net of income taxes 36 –
Net income 2,445 2,597

Man
agem
ent’s
dis
cuss
ion
and
anal
ysis
management’s discussion and analysis 87
and the net effects of acquisitions and dispositions, the decline in international orders was
6%. International sales were €57.133 billion compared to €65.914 billion a year earlier.
Excluding currency translation and the net effects of acquisitions and dispositions, the
decline in international sales was 4%.
Orders in the U.S. in fiscal 2003 were €14.702 billion compared to €21.205 billion a year
earlier. Sales in the U.S. were €15.357 billion compared to €20.288 billion in the prior year.
The change in sales was driven by expected volume declines at PG following the end of the
gas turbine energy boom and by a negative 14% currency translation effect. Orders in Asia-
Pacific in fiscal 2003 were €9.152 billion compared to €10.092 billion and sales were €8.728
billion compared to €9.668 billion a year earlier, in part due to currency translation and the
net effect of acquisitions and dispositions. Sales in China in fiscal 2003 were €2.838 billion
compared to €3.223 billion a year earlier, due in large part to the effect of currency transla-
tion and dispositions.
Gross profit as a percentage of sales in fiscal 2003 increased 28.1% from 27.6% in the
prior year. Most of the Groups increased their gross margins, particularly SV, ICN, PTD,
and Med. ICN’s improvement reflects the results of its PACT cost-cutting program, and PTD
and SV made significant improvements in reducing materials costs and other productivity
measures. Osram, A&D and TS maintained their gross margins levels. Partly offsetting
these results were gross margin declines at SD and SBS, as these Groups took charges relat-
ing to long-term contracts during fiscal 2003. ICM’s gross margin decreased less sharply,
in part due to lower average earnings per mobile phone sold. See the Segment Information
Analysis for further comments on the individual Groups.
Research and development (R&D) expenses were €5.067 billion compared to €5.819 bil-
lion in the prior year. R&D spending represented 6.8% of sales, compared to 6.9% in fiscal
year 2002.
Marketing, selling and general administrative expenses were €13.534 billion in fiscal
2003 compared to €15.455 billion in fiscal 2002 and declined as a percentage of sales from
18.4% to 18.2%. Cost cutting and productivity programs at ICN, ICM, I&S, SV and Osram
contributed to this result, as did lower provisions for accounts and loans receivable, par-
tially resulting from revised estimates, in particular at ICM.
Other operating income (expense), net was €642 million compared to €1.321 billion in
fiscal 2002. The current year includes €359 million of net gains related to cancellation of
orders at PG, which are partly offset by inventory allowances recorded in cost of sales. Also
included in fiscal 2003 was a €63 million gain from Med’s contribution of assets to a joint
venture with Draeger. The prior year included a €936 million tax-free gain resulting from
Infineon share sales, a €421 million gain on the sale of Unisphere Networks by ICN, a €60
million gain at ICN, a €56 million gain on the sale of Hydraulik-Ring by SV, a €21 million
gain from the KKR transaction, and significantly lower contract customer cancellation
gains at PG. Partially offsetting these gains in fiscal 2002 was a €378 million impairment
at ICN.
The effective tax rate on income for the fiscal year 2003 was approximately 26% and was
positively impacted by tax benefits resulting from the dispositions of business interests.
The effective tax rate on income for the fiscal year 2002 was approximately 24%, which was
positively impacted by the tax-free sales of Infineon shares and negatively affected by non-
deductible goodwill impairment.

88 management’s discussion and analysis
EVA Performance
During fiscal 2003, Siemens continued its enterprise-wide focus on economic value added
(EVA). We tie a significant portion of our executive incentive compensation to achieving
EVA targets.
EVA is a financial performance measure of the value created or destroyed by a business.
In simple terms, it compares the earnings of a business (using Group profit for the Opera-
tions Groups and income before income taxes for the Financing and Real Estate businesses
as a base) against the cost of capital employed to run that business. A positive EVA means
that a business has earned more than its cost of capital, whereas a negative EVA means that
a business has earned less than its cost of capital. Depending on the change of EVA between
comparable fiscal periods, a business is defined as value-creating or value-destroying. Con-
sequently, the increase or decrease of EVA is an important measure of financial perform-
ance.
We use this measure of performance in addition to Group profit and income before
income taxes because those measures focus on results without taking into consideration
the cost of capital employed in the business. In this manner, EVA complements Group profit
and income before income taxes. For EVA calculation purposes, data from the consolidated
financial statements is used and to a limited extent adjusted. The most important financial
adjustment, representing the major part of the total EVA adjustment amount within our
Operations component results from operating lease commitments. We believe that includ-
ing such financial adjustment in the EVA measure enhances our business decision-making
processes.
Because the two major business components of Siemens – Operations and Financing
and Real Estate – are fundamentally different from each other, we use two types of EVA cal-
culations. In the case of Operations Groups, we use Group profit as the base measure and
apply a flat tax rate of 35% for calculating operating profit after taxes. The cost of capital for
each Group is determined by taking the weighted average of the after-tax cost of debt and
equity of Siemens and applying a risk-based factor, which takes into account the specific
risks associated with the particular business. In fiscal 2003, this determination of the cost
of capital within Operations Groups ranged from 8% to 10%, unchanged compared to the
prior year. This percentage is applied against average net operating assets in order to deter-
mine the capital charge. Average net operating assets were determined in fiscal 2003 on a
monthly basis.
In the case of Financing and Real Estate, we take income before income taxes as the base
measure and also apply a flat tax rate of 35% to arrive at net operating profit after taxes.
From this result we deduct the capital charge, which is calculated by multiplying the cost of
capital expressed as a percentage by the risk-adjusted equity allocated to this component. In
fiscal 2003 the determination of the risk-based cost of capital within the Financing and Real
Estate component ranged from 8.0% to 9.75%, unchanged compared to the prior year. EVA
for Corporate Treasury is calculated similarly to Financing and Real Estate.
Other organizations that use EVA as a measure of financial performance may define and
calculate EVA differently.
EVA for Siemens worldwide excluding the impact of Infineon, was a positive €822 mil-
lion in fiscal 2003 compared to a positive €397 million in fiscal 2002.
EVA for Operations was a positive €135 million in fiscal 2003, compared to a negative
€520 million in the prior fiscal year. Financing and Real Estate realized EVA of €156 million,
up from €147 million in fiscal 2002. These improvements led to an EVA for Siemens world-
wide of a positive €449 million in fiscal 2003 compared to a negative €319 million in fiscal
2002, excluding a €936 million tax-free gain on the sale of shares in Infineon. Including
this gain, EVA for fiscal 2002 was a positive €617 million.

Man
agem
ent’s
dis
cuss
ion
and
anal
ysis
management’s discussion and analysis 89
(1) The income taxes of Eliminations, reclassifications and Corporate Treasury, Operations, and Financing and Real Estate are based on the consolidatedeffective corporate tax rate applied to income before income taxes.
(2) Other includes financial adjustments and certain reclassifications regarding Infineon in fiscal 2002.(3) The term “Net operating assets” is the same as Net capital employed except the effects of financial adjustment and the fact that Average net operating
assets are calculated in fiscal 2003 based on monthly basis. In fiscal 2002 Average net operating assets are calculated as the average of four fiscal quar-ters with a time lag of one quarter.
(4) As a result of allocated equity, liabilities are also partly allocated.(5) Capital charge for eliminations, reclassifications and Corporate Treasury is risk-determined.(6) Centrally recorded gains in fiscal 2002 represent gains on the sales of shares in Infineon.
EVA calculationFor the fiscal years ended September 30, 2003 and 2002
Eliminations,Siemens reclassifications and Financing andworldwide Corporate Treasury Operations Real Estate
(in millions of €) 2003 2002 2003 2002 2003 2002 2003 2002
Net Income 2,445 2,597 198 (213) 1,897 2,474 350 336
Cumulative effect of change in accounting principle, net of income taxes (36) – – – (39) – 3 –
Minority interest 96 29 – (2) 96 31 – –
Income taxes(1) 867 849 68 (69) 677 809 122 109
Income (loss) before income taxes 3,372 3,475 266 (284) 2,631 3,314 475 445
Other interest income (expense) of Operations, net 88 96 – – 88 96 – –
Gains on sales and dispositions of significant business interest – (936) – – – (936) – –
Taxes and other(2) (1,098) (713) (93) 353 (865) (933) (140) (133)
Net operating profit after taxes 2,362 1,922 173 69 1,854 1,541 335 312
Sept. 30, Sept. 30, Sept. 30, Sept. 30, Sept. 30, Sept. 30, Sept. 30, Sept. 30,2003 2002 2003 2002 2003 2002 2003 2002
Total assets 77,605 77,939 1,543 (1,970) 64,475 67,699 11,587 12,210
Other asset and liability related reconciling items (see table segment information) (48,533) (51,944)
Financial adjustments 1,334 1,926
Average calculation(3) 1,883 5,034
Liabilities(4) (9,587) (10,360)
Average net operating assets for Operations/allocated equity for Financing and Real Estate 19,159 22,715 2,000 1,850
2003 2002 2003 2002 2003 2002 2003 2002
Net operating profit after taxes 2,362 1,922 173 69 1,854 1,541 335 312
Capital charge(5) (1,913) (2,241) (15) (15) (1,719) (2,061) (179) (165)
EVA 449 (319) 158 54 135 (520) 156 147
Adjustments for certain centrally recorded gains/charges(6) – 936
EVA Siemens worldwide 449 617

90 management’s discussion and analysis
Dividend
Siemens AG, the parent company of all businesses discussed in this report, recorded a net
income under German accounting principles of €1.018 billion for fiscal 2003, compared to
€1.009 billion in the previous year.
At the Annual Shareholders’ Meeting scheduled for January 22, 2004, the Managing
Board, in agreement with the Supervisory Board, will submit the following proposal: to pay
€1.10 per share as a dividend, which aggregates to a total payout of €980 million. The prior
year dividend was €1.00 per share.
Liquidity and capital resources
Cash flow – fiscal 2003 compared to fiscal 2002
The following discussion adheres to our component model of reporting and includes an
analysis of cash flow and related balance sheet effects in our Operations and Financing and
Real Estate components.
Net cash provided by the operating activities of the Operations component for fiscal
2003 was €4.123 billion compared to €4.277 billion in the prior year. The current year
includes increased earnings in fiscal 2003 in comparison to the prior year after adjusting
for non-cash gains in fiscal 2002. Both periods included supplemental cash contributions to
Siemens pension trusts, totalling €1.192 billion and €1.782 billion in fiscal 2003 and 2002,
respectively. Changes in net working capital (current assets less current liabilities) within
Operations used cash of €482 million, compared to cash provided of €1.019 billion in the
same period a year earlier. While the prior fiscal year included positive cash flows from sig-
nificant reductions in inventory at ICN, ICM and PG, further decreases at these Groups in
fiscal 2003 were offset by an increase in inventories at TS. Other current liabilities
decreased, in particular at PG, as a result of lower advance payments due to order cancella-
tions in the U.S and as the Group used advance payments for project inventories. Severance
programs negatively impacted cash flow during fiscal 2003 and we expect payments from
these programs to continue in fiscal 2004, but at a lesser amount. Among the Groups, ICN,
ICM, A&D and PTD achieved improvements in net working capital.
Net cash used in investing activities within Operations was €3.655 billion. Expenditures
for intangible assets and property, plant and equipment were €2.468 billion, €681 million
lower than in the previous fiscal year. Cash outflows for acquisitions in fiscal 2003 include
€929 million for the purchase of the industrial turbine businesses of Alstom. Purchases of
investments and marketable securities include an aggregate €599 million for the acquisi-
tion of various debt and fund securities. Total outlays within Operations for investments
and marketable securities were €841 million. Net cash used in investing activities within
Operations in fiscal 2002 was €250 million. Cash used for acquisitions in fiscal 2002 was
€3.787 billion which included a €3.657 billion payment to complete the Atecs-Mannesmann
acquisition initiated in fiscal 2001. Proceeds from sales and dispositions in fiscal 2002
totalled €6.097 billion, including sales of businesses related to Atecs including Rexroth AG
and Mannesmann Sachs AG, as well as the sale of a portfolio of businesses to Kohlberg
Kravis Roberts & Co. L.P. Other dispositions included the sale of Unisphere Networks, Inc.
and the Hydraulik-Ring business of SV. Fiscal 2002 also included proceeds of €1.522 billion
related to sales of shares of Infineon.

Man
agem
ent’s
dis
cuss
ion
and
anal
ysis
management’s discussion and analysis 91
Net cash provided by operating activities within the Financing and Real Estate compo-
nent in fiscal 2003 was €469 million compared to €558 million in fiscal 2002. The current
year reflects improved earnings at SFS offset by a decrease in other liabilities.
Net cash used in investing activities within the Financing and Real Estate component
was €515 million compared to net cash used of €100 million a year earlier. Fiscal 2003
included a net increase in financing receivables, compared to a substantial reduction in the
prior year. Fiscal 2002 included a negative €607 million net effect from the sale of receiv-
ables by SFS, as collections on previously sold accounts receivable were greater than new
sales. Sales of accounts receivable using the SieFunds asset securitization program have
been discontinued for the time being.
Net cash provided by operating activities of Siemens worldwide totalled €5.712 billion in
fiscal 2003 compared to €5.564 billion for fiscal 2002. Strong worldwide earnings were a
primary factor in the high level achieved in the current year. As noted above, both periods
included supplemental cash contributions to Siemens pension trusts. Changes in net work-
ing capital for Siemens worldwide provided cash of €71 million in fiscal 2003 compared to
€1.323 billion in the prior year. Within this development, fiscal 2002 included substantial
decreases in inventory, while current year decreases at several Groups were offset by an
increase in inventory at TS. In addition, net cash includes a positive net effect from Corpo-
rate Treasury of over €1 billion associated with financial instruments which manage the
Company’s exposure to fluctuations in foreign exchange rates, particularly with regard to
intra-company financing.
Net cash used in investing activities of Siemens worldwide was €3.939 billion in fiscal
2003 compared to €810 million in fiscal 2002, a period which included approximately
€2.8 billion in net proceeds from portfolio activities described above. The current period
included cash outflows of €929 million for the acquisition of the industrial turbine busi-
nesses of Alstom and €957 million for purchases of investments and marketable securities.
For further information regarding net cash from operating and investing activities of the
Groups, see the Segment Information Analysis above.
Net cash used by financing activities of Siemens worldwide was €487 million in fiscal
2003 compared to net cash used of €859 million in fiscal 2002. The current year total
includes proceeds of €2.5 billion from the issuance of notes, convertible into shares of
Siemens AG. In fiscal 2003, Siemens made repayments of debt totalling €1.742 billion,
which includes the repurchase of nominal €1.440 billion of a bond exchangeable into Infi-
neon shares. During the current fiscal year, €896 million of dividends were paid to share-
holders. Fiscal 2002 included €847 million for repayment of debt and €888 million in divi-
dend payments.
For Siemens worldwide, total net cash provided by operating activities of €5.712 billion,
less net cash used in investing and financing activities of €4.426 billion, less currency
translation effects of €333 million, resulted in a €953 million increase in cash and cash
equivalents, to €12.149 billion.

92 management’s discussion and analysis
Capital resources and capital requirements
Siemens is committed to a strong financial profile, characterized by a conservative capital
structure which gives us excellent financial flexibility.
Our current corporate credit ratings from Moody’s Investors Service and Standard &
Poor’s are noted below:
Moody’s Investor Service rates our long-term corporate credit Aa3 (negative outlook).
The rating classification of Aa is the second highest rating within the agency’s debt ratings
category. The numerical modifier 3 indicates that our long-term debts ranks in the lower
end of the Aa category. The Moody’s rating outlook is an opinion regarding the likely direc-
tion of an issuer’s rating over the medium-term. Rating outlooks fall into the following six
categories: Positive, Negative, Stable, Developing, Ratings Under Review and No Outlook.
Our outlook was changed from stable to negative in December 2002.
Moody’s Investors Service’s rating for our short-term corporate credit and commercial
paper is P–1, the highest available rating in the prime rating system, which assesses
issuers’ ability to honor senior financial obligations and contracts generally with a maturity
not exceeding one year.
Standard & Poor’s rates our long-term corporate credit AA– (stable outlook). Within
Standard & Poor’s long-term issue and issuer credit ratings, an obligation rated AA has the
second highest rating category assigned. The modifier “–” indicates that our long-term
debt ranks in the lower end of the AA category. The Standard & Poor’s rating outlook is an
opinion regarding the likely direction of an issuer’s rating over the intermediate to longer
term. Rating outlooks fall into the following four categories: Positive, Negative, Stable and
Developing.
Our short-term debt and commercial paper is rated A–1+ within Standard & Poor’s short-
term issue credit ratings, giving Siemens the highest-ranking short-term rating.
Siemens has no further agreements with nationally recognized statistical rating organi-
zations to provide a long-term and short-term credit rating for our Company.
The rating agencies have focused more specifically on an assessment of liquidity risk.
Moody’s most recent liquidity risk assessment for Siemens as of October 23, 2003, classified
the liquidity profile of the Company as “very healthy.”
Moody’s Investors Standard &Service Poor’s
Long-term debt Aa3 AA–
Short-term debt P–1 A–1+

Man
agem
ent’s
dis
cuss
ion
and
anal
ysis
management’s discussion and analysis 93
Capital resources at September 30, 2003 included €12.149 billion in cash and cash equiv-
alents held in various currencies. Corporate Treasury generally manages cash and cash
equivalents for the entire Company, except in countries where local capital controls require
otherwise. At September 30, 2003, Corporate Treasury managed approximately 93% of
Siemens’ worldwide cash and cash equivalents. Corporate Treasury carefully manages
investments of cash and cash equivalents subject to strict credit requirements and counter-
party limits. Another €650 million is held in available-for-sale marketable securities,
including shares in Epcos AG. Furthermore, our remaining shares in Infineon had a market
value of approximately €3.2 billion based on the share price at September 30, 2003. In addi-
tion to these capital resources, SFS has established structures for raising funds through the
sale of accounts receivable, either by issuing asset-backed securities under our SieFunds
program or by selling receivables directly to banks. Due to our ample capital resources, we
have phased-out the use of the SieFunds structure. Siemens continues to place a high prior-
ity on improving cash flows from operating and investing activities.
Capital requirements include normal debt service and regular capital spending and cash
requirements. Other commercial commitments, including primarily guarantees, are con-
tingent upon the occurrence of specific events. Approximately €1.7 billion of debt including
€385 million of commercial paper is scheduled to become due in fiscal 2004. Capital spend-
ing programs have been reduced in line with more difficult market conditions. In addition,
the deconsolidation of Infineon at the end of the first quarter of fiscal 2002, which had
accounted for a substantial percentage of overall capital expenditures of Siemens world-
wide, has resulted in considerably lower capital expenditures compared with previous peri-
ods. We plan capital expenditures for property, plant and equipment for the coming fiscal
year to approximate current depreciation expense of approximately €2.5 billion for fiscal
2003.
Our shareholders’ equity at September 30, 2003 was €23.715 billion, an increase of €194
million since September 30, 2002. See also the discussion of pension plan funding below as
well as the consolidated statements of changes in shareholders’ equity. We have authoriza-
tion from our shareholders to repurchase up to 10% of our outstanding shares at any time
until July 22, 2004. Such stock may be (i) retired with the approval of the Supervisory Board,
(ii) used to satisfy the Company’s obligations under the 1999 Siemens Stock Option Plan
and the 2001 Siemens Stock Option Plan or (iii) offered for sale to employees within the
employee share program.

94 management’s discussion and analysis
Principal Sources of Liquidity
Our principal source of Company financing is cash flow from operating and investing
activities, totaling €1.773 billion in fiscal 2003 after supplemental cash contributions of
€1.192 billion to Siemens’ pension trusts. Cash flows are complemented by the substantial
capital resources noted above. We further strengthened our financial flexibility through a
set of backstop facilities, commercial paper programs, and a medium-term note program.
The backstop facilities consist of €3.7 billion in unused committed lines of credit. We also
have two commercial paper programs, under which we typically issue instruments with a
maturity of less than 90 days, for an aggregate U.S.$3.0 billion in the U.S. domestic market
and an aggregate €3.0 billion in the euro market. The amount outstanding under all com-
mercial paper programs was €385 million at September 30, 2003. In addition, the Company
has a medium-term note program under which we may issue up to €5.0 billion in medium-
term notes. The amount outstanding under this program was €1.368 billion at September
30, 2003.
In addition to our existing cash and cash equivalents, and current cash flows, our
unused backstop facilities are available in the unlikely event that we are unable to access
commercial paper or medium-term notes markets. The backstop facilities at our disposal
include a U.S.$3.0 billion multi-currency revolving loan facility expiring May 2007 provided
by a syndicate of international banks. During the third quarter of fiscal 2003, the Company
terminated its €1 billion revolving loan facility, which was to expire in February 2004, and
entered into a new revolving loan facility with a domestic bank for an aggregate amount of
€750 million expiring in June 2008. In addition, we have a €400 million revolving loan facil-
ity expiring in July 2006 also provided by a domestic bank. None of our backstop facilities
contain a Material Adverse Change clause of the type typically included in low-risk backstop
facility agreements.
Neither our commercial paper and medium-term note programs nor our backstop facili-
ties have specific financial covenants such as rating triggers or interest coverage, leverage
or capitalization ratios that could trigger remedies, such as acceleration of repayment or
additional collateral support, except in the case of nonpayment of amounts when due.
In June 2003, the Company issued €2.5 billion of convertible notes through its wholly
owned Dutch subsidiary, Siemens Finance B.V., which are fully and unconditionally guaran-
teed by Siemens AG. The convertible notes have a 1.375% coupon and are convertible into
approximately 44.5 million shares of Siemens AG at a conversion price of €56.1681 per
share, which is subject to change under certain circumstances. The conversion right is con-
tingently exercisable by the holders upon the occurrence of one of several conditions,
including, upon the Company’s share price having exceeded 110% of the conversion price
on at least 20 trading days in a period of 30 consecutive trading days ending on the last
trading day of any calendar quarter. The Company may, at any time from June 18, 2007,
redeem the notes outstanding at their principal amount together with interest accrued
thereon, if Siemens’ share price exceeds 130% of the conversion price on any 15 of 30 con-
secutive trading days before notice of early redemption. Unless previously redeemed, con-
verted or repurchased and cancelled, the notes mature on June 4, 2010.
In addition to the above-described sources of liquidity, we constantly monitor funding
options available in the capital markets as well as trends in the availability and cost of such
funding, with a view to maintaining excellent financial flexibility and limiting undue
repayment risks.

Man
agem
ent’s
dis
cuss
ion
and
anal
ysis
management’s discussion and analysis 95
Contractual Obligations and Commercial Commitments
In the ordinary course of business, Siemens’ primary contractual obligations regarding
cash involve debt service as well as operating lease commitments. Other commercial com-
mitments, including primarily guarantees of credit of third parties, are contingent upon
the occurrence of specific events. Following is a detailed discussion of these contractual
obligations and commercial commitments.
The following table summarizes contractual obligations for future cash outflows as of
September 30, 2003:
Debt – At September 30, 2003, Siemens worldwide had €13.178 billion of short- and long-
term debt, of which €1.745 billion will become due within the next 12 months. Included in
short-term debt is €385 million of commercial paper, reflecting all amounts outstanding
under our commercial paper programs, therefore limiting refinancing risk. The remainder
is represented by bonds and other loans from banks coming due within the next 12 months.
At September 30, 2003, the weighted average maturity of our bonds and notes due after one
year was 4.9 years. At September 30, 2002, total debt was €12.346 billion. Further informa-
tion about the components of debt is given in the Notes to the consolidated financial state-
ments.
Debt for Siemens worldwide at September 30, 2003 consisted of the following:
Our notes and bonds contain no specific financial covenants such as rating triggers or
interest coverage, leverage or capitalization ratios that could trigger a requirement for early
payment or additional collateral support, except in the case of nonpayment of interest or
principal.
Our Corporate Treasury has primary responsibility for raising funds in the capital mar-
kets for the entire Company, including the Financing and Real Estate component, except in
countries with conflicting capital market controls. In these countries, the Siemens sub-
sidiary companies obtain financing primarily from local banks. Corporate Treasury lends
funds via intracompany financing to the Operations and Financing and Real Estate compo-
nents. This intracompany financing together with intracompany liabilities between the
components is shown under intracompany liabilities in the balance sheets. Under this
approach, at September 30, 2003, €7.659 billion of such intracompany financing was directly
attributable to the Financing and Real Estate component and the remainder to the Opera-
Payments due by period (€ in millions)
LessContractual than 1–3 4–5 AfterObligations Total 1year years years 5 years
Debt 13,178 1,745 3,552 2,558 5,323
Operating leases 2,834 473 820 596 945
Total contractual cash obligations 16,012 2,218 4,372 3,154 6,268
(€ in millions) Short-Term Long-Term Total
Notes and bonds 436 9,997 10,433
Loans from banks 777 287 1,064
Other financial indebtedness 494 904 1,398
Obligations under capital leases 38 245 283
Total debt 1,745 11,433 13,178

96 management’s discussion and analysis
tions component. At September 30, 2003, the Financing and Real Estate component addi-
tionally held €122 million in short-term and €509 million in long-term debt from external
sources.
In fiscal 2000, Siemens Nederland N.V., as the owner of the underlying shares of stock
of Infineon Technologies AG, issued €2.5 billion of 1% exchangeable notes due in 2005. For
fiscal years 2001 and 2002 this debt was recorded under Corporate, eliminations (Opera-
tions). Beginning fiscal 2003 this debt is recorded under Corporate Treasury. In fiscal 2003,
Siemens repurchased and retired a notional amount of €1.440 billion of exchangeable
notes, which resulted in a gain of €35 million. As of September 30, 2003, of the issued €2.5
billion, notional €1.060 billion is still outstanding.
The capital structure of the Financing and Real Estate component at September 30, 2003
and 2002 consisted of the following:
Both Moody’s and Standard & Poor’s view Siemens Financial Services as a captive
finance company. These ratings agencies generally recognize and accept higher levels of
debt attributable to captive finance subsidiaries in determining long-term and short-term
credit ratings.
The allocated equity for SFS is determined and influenced by the respective credit rat-
ings of the rating agencies and by the expected size and quality of its portfolio of leasing
and factoring assets and equity investments and is determined annually. This allocation is
designed to cover the risks of the underlying business and is in line with common credit
risk management standards in banking. The actual risk profile of the SFS portfolio is moni-
tored and controlled monthly and is evaluated against the allocated equity.
September 30, 2003 September 30, 2002(€ in millions) SFS SRE SFS SRE
Assets 8,445 3,607 8,681 4,090
Allocated equity 1,080 920 930 920
Total debt 6,821 1,469 6,730 1,751
Therein intracompany financing 6,571 1,088 6,469 1,402
Therein debt from external sources 250 381 261 349
Debt to equity ratio 6.32 1.60 7.24 1.90

Man
agem
ent’s
dis
cuss
ion
and
anal
ysis
management’s discussion and analysis 97
Operating leases – At September 30, 2003, the Company had a total of €2.834 billion in
total future payment obligations under non-cancellable operating leases.
The following table summarizes contingent commercial commitments as of September
30, 2003:
Lines of credit – At September 30, 2003, Siemens provided lines of credit totaling €111
million which primarily related to asset based lending transactions of SFS where SFS pro-
vides a line of credit and in return receives assets as collateral.
Guarantees – Guarantees are principally represented by credit guarantees and guaran-
tees of third-party performance. Credit guarantees cover the financial obligation of third-
parties in cases where Siemens is the vendor and /or contractual partner. See also “Cus-
tomer financing” below. In addition, Siemens provides credit line guarantees with variable
utilization to associated and related companies. Performance bonds and guarantees of
advanced payments guarantee the fulfillment of contractual commitments of partners in a
consortium where Siemens may be the general or subsidiary partner. In the event of non-
performance under the contract by the consortium partner(s), Siemens will be required to
pay up to an agreed-upon maximum amount. Furthermore, the Company has provided
indemnifications in connection with dispositions of business entities, which protect the
buyer from tax, legal, and other risks related to the purchased business entity. The €1.778
billion total in the table above includes €206 million in customer financing guarantees. In
the event that it becomes probable that Siemens will be required to satisfy these guaran-
tees, provisions are established. Such provisions are established in addition to the liabilities
recognized for the non-contingent component of the guarantees. Most of the guarantees
have fixed or scheduled expiration dates, and in practice such guarantees are rarely drawn.
Other commercial commitments – The Company has commitments related to cus-
tomer financing arrangements represented by approved but unutilized loans and guaran-
tees of approximately €622 million at September 30, 2003. See “Customer financing” below.
Siemens also has commitments to make capital contributions of €57 million through
Siemens Project Ventures (SPV) in connection with investments whose primary goal is the
development of infrastructure projects. At September 30, 2003, Siemens had a small portfo-
lio of ten infrastructure projects, eight in the power business and two in the telecommuni-
cations business. The largest of such commitments relates to Jawa Power, a power genera-
tion project in Indonesia. In connection with such projects, Siemens purchases insurance
that covers certain specific project risks, particularly political risks. At September 30, 2003,
the net equity investment in these projects totaled approximately €328 million. Other
than capital contributions, Siemens has no other commercial commitments related to
these projects.
Amount of commitment expiration per period
Total LessOther commercial amounts than 1–3 4–5 Aftercommitments committed 1 year years years 5 years
Lines of credit 111 88 8 _ 15
Guarantees 1,778 856 792 47 83
Other commercial commitments 949 426 362 77 84
Total commercial commitments 2,838 1,370 1,162 124 182

98 management’s discussion and analysis
We also have commitments to make capital contributions totaling €199 million to cer-
tain project companies and to venture capital investments. Other commercial commit-
ments also include €61 million in discounted bills of exchange and €10 million in collater-
als for third-party liabilities.
Customer financing – Siemens’ strong financial profile enables us to selectively pro-
vide customers with financing. We also selectively assist customers in arranging financing
from various third-party sources, including export credit agencies. This has historically
been an important competitive advantage in such long-cycle businesses as power genera-
tion, transportation, and telecommunications. We also provide direct vendor financing and
grant guarantees to banks in support of loans to Siemens customers and we may enter into
a combination of the above arrangements. Financing requirements are entered into on
a very selective basis; we have forgone and will continue to forgo new business contracts
if the financing risks are not justifiable relative to the rewards. Due to significantly lower
levels of capital spending at most major telecommunications operators, however, requests
for such financing have decreased. As a result, customer financing commitments requiring
the approval of Siemens’ Corporate Executive Committee of the Managing Board have
decreased significantly. The total loans and guarantees relating to such customer financing
as of September 30, 2003 amounted to €1.4 billion including loans and guarantees of €756
million for approved and utilized commitments and €622 million for approved but not uti-
lized commitments. As of September 30, 2002 total loans and guarantees relating to this
customer financing amounted to €2.5 billion including loans and guarantees of €1.6 billion
for approved and utilized commitments and €936 million for approved but not utilized
commitments.
Provisions – In the ordinary course of business Siemens establishes various types of
provisions. As of September 30, 2003, provisions for contract losses totaled approximately
€1.2 billion. Accrued contract losses relate primarily to the groups PG (€276 million), ICM
(€179 million), TS (€171 million), ICN (€143 million), SD (€129 million) and SBS (€106 mil-
lion). For all accrued contract losses, we anticipate that the cash outflows for labor, materi-
als, contract penalties and related costs on such contract losses will occur predominately
over the next two fiscal years. In addition to provisions for losses, losses on contracts can
include write-offs of inventories and other charges.

Man
agem
ent’s
dis
cuss
ion
and
anal
ysis
management’s discussion and analysis 99
Pension Plan Funding
Siemens’ projected benefit obligation (PBO), which considers future compensation
increases, amounted to €20.9 billion on September 30, 2003, compared to €19.5 billion on
September 30, 2002. This increase is due primarily to a reduction in the average discount
rate from 6.0% to 5.4%, which reflects the worldwide decline in interest rates in financial
markets. The fair value of plan assets as of September 30, 2003 was €15.9 billion, compared
to €14.5 billion on September 30, 2002. Over the last twelve months, the actual return on
plan assets amounted to 7.4%. Because the measurement date for the valuation of certain
Siemens pension funds, particularly our large funds in the U.S. and U.K., does not coincide
with the end of our fiscal year, we are not able to fully recognize this return for fiscal year
2003. On September 30, 2003, the combined funding status of all Siemens pension plans
showed an underfunding of €5.0 billion, unchanged from the end of fiscal 2002.
Siemens was one of the first German companies to transfer its pension obligations to
a pension trust with segregated assets to cover pension obligations. The principal funded
pension plans outside Germany had already been established in this manner. The assets
allocated to these pension trusts serve solely to cover future pension obligations and are
not available for other purposes. At the time we established our German pension trust, it
was fully funded based on the fair value of its assets. However, substantial declines in
equity valuations due to stock market trends over the past three years have led to lower fair
values for plan assets, which in turn has resulted in underfunding of pension plans.
The Company constantly reviews the design and the asset allocation of its pension
plans, in order to detect and analyze trends and events that may affect asset values and ini-
tiate appropriate counter-measures at a very early stage. These efforts are part of the Com-
pany’s overall program of sound financial management of its pension funds, including
adjustments to the asset allocation and supplemental contributions to pension plans. In fis-
cal 2003, these supplemental contributions included €1.192 billion in cash and €377 million
in real estate. In fiscal 2002, supplemental contributions totaled €1.782 billion in cash.
In fiscal 2003, we decided to change the design of the German pension plan from a
defined benefit plan into effectively, a defined contribution plan. This change in approach
will enable the Company to better control future benefit obligations. Under the new system
(BSAV), previously earned benefits are not affected. From October 1, 2004 onward, all
employees of Siemens AG and domestic affiliates will receive pension benefits in line with
the new system only. We expect to continue to review the need for defined contribution
plans also outside Germany in the coming years.
For more information on Siemens pension plans see Notes to the Consolidated Financial
Statements.

100 management’s discussion and analysis
Critical accounting estimates
The preparation of financial statements requires management estimates and assumptions
that affect reported amounts and related disclosures. All estimates and assumptions are
made to the best of management’s knowledge and belief in order to fairly present our posi-
tion and the result of our Operations. The following of our accounting policies are signifi-
cantly impacted by such management judgment and estimates.
Revenue Recognition on Long-Term Contracts
Our ICN, ICM, SBS, I&S, SD, PG, PTD and TS Groups conduct a significant portion of their
business under long-term contracts with customers. We generally account for long-term
projects using the percentage-of-completion method, recognizing revenue as performance
on a contract progresses. This method places considerable importance on accurate esti-
mates of the extent of progress towards completion. Depending on the methodology to
determine contract progress, the significant estimates include total contract costs, remain-
ing costs to completion, total contract revenues, contract risks and other judgments. The
managements of the operating Groups continually review all estimates involved in such
long-term contracts and adjust them as necessary. We also use the percentage-of-comple-
tion method for projects financed directly or indirectly by Siemens. In order to qualify for
such accounting, the credit quality of the customer must meet certain minimum parame-
ters as evidenced by the customer’s credit rating or by a credit analysis performed by SFS,
which performs such reviews in support of the Corporate Executive Committee. At a mini-
mum, a customer’s credit rating must be single B from the rating agencies, or an equivalent
SFS-determined rating. In cases where the credit quality does not meet such standards, we
recognize revenue for long-term contracts and financed projects based on the lower of cash
if irrevocably received, or contract completion.
Accounts Receivable
The allowance for doubtful accounts involves significant management judgment and
review of individual receivables based on individual customer creditworthiness, current
economic trends and analysis of historical bad debts on a portfolio basis. For the determi-
nation of the country-specific component of the individual allowance, we also consider
country credit ratings, which are centrally determined based on information from external
rating agencies. Regarding the determination of the valuation allowance derived from a
portfolio-based analysis of historical bad debts, a decline of receivables in volume results in
a corresponding reduction of such provisions. As of September 30, 2003 and 2002,
Siemens recorded a total valuation allowance for accounts receivable of €1.122 billion and
€1.585 billion, respectively. Additionally, Siemens selectively assists customers, particularly
in the telecommunication equipment area, through arranging financing from various
third-party sources, including export credit agencies, in order to be awarded supply con-
tracts. In addition, the Company provides direct vendor financing and grants guarantees to
banks in support of loans to Siemens customers when necessary and deemed appropriate.
Due to the previous high levels of capital spending and associated debt at most major
telecommunications operators, however, requests for such financing continued to
decrease.

Man
agem
ent’s
dis
cuss
ion
and
anal
ysis
management’s discussion and analysis 101
Goodwill
SFAS 142 requires that goodwill be tested for impairment at least annually using a two-step
approach at the division level. In the first step, the fair value of the division is compared to
its carrying amount including goodwill. In order to determine the fair value of the division,
significant management judgment is applied in order to estimate the underlying dis-
counted future free cash flows. In the case that the fair value of the division is less than its
carrying amount, a second step is performed which compares the fair value of the division’s
goodwill to the carrying amount of its goodwill. The fair value of goodwill is determined
based upon the difference between the fair value of the division and the net of the fair val-
ues of the identifiable assets and liabilities of the division. If the fair value of goodwill is
less than the carrying amount, the difference is recorded as an impairment. As of Septem-
ber 30, 2003 and 2002, Siemens had total goodwill of €6.501 billion and €6.459 billion,
respectively. For more information, see Notes to the Consolidated Financial Statements.
Pension and Postretirement Benefit Accounting
Our pension benefit costs and credits are determined in accordance with actuarial valua-
tions, which rely on key assumptions including discount rates and expected return on plan
assets. We determine the market-related value of plan assets for the Siemens German Pen-
sion Trust based on the average of the historical market values of plan assets over the four
quarters of the preceding fiscal year. This value is the basis for the determination of the
return on plan assets and amortization of unrecognized losses in the fiscal year following
the actuarial valuation. For all other pension plans, asset values are based upon the fair
value of plan assets at the measurement date. Due to the underfunded status of certain
pension plans at their respective measurement dates, an additional minimum liability is
recorded net of deferred tax assets in other comprehensive income. Our postretirement
benefit costs and credits are determined in accordance with actuarial valuations, which rely
on key assumptions including discount rates, and increase or decrease in health care trend
rates. The discount rate assumptions reflect the rates available on high-quality fixed-
income investments of appropriate duration at the measurement dates of each plan. The
expected return on plan assets assumption is determined on a uniform basis, considering
long-term historical returns, asset allocation, and future estimates of long-term investment
returns. Other key assumptions for our pension and postretirement benefit costs and cred-
its are based in part on current market conditions. Pension and related postretirement ben-
efit costs or credits could change due to variations in these underlying key assumptions.
The assumptions used for the calculation of net periodic pension cost in fiscal 2004 have
already been determined. A one percentage point increase (decrease) in the discount rate
assumption would result in a decrease (increase) in net periodic pension cost of €160
(€200) million. A one percentage point change in the assumption for expected return on
plan assets would result in a decrease (increase) of €172 million. A one percentage point
increase (decrease) in the rates of compensation increase and pension progression would
result in a combined increase (decrease) of €360 (€310) million. If more than one of these
assumptions were changed simultaneously, the impact would not necessarily be the same
as if only one assumption was changed in isolation. For a discussion of our current funding
status and the impact of these critical assumptions, see Notes to the Consolidated Financial
Statements, Pension plans and similar commitments.

102 management’s discussion and analysis
Accruals
Significant estimates are involved in the determination of provisions related to contract
losses and warranty costs. A significant portion of the business of certain of our Operating
Groups is performed pursuant to long-term contracts, often for large projects, in Germany
and abroad, awarded on a competitive bidding basis. Siemens records an accrual for con-
tract losses when current estimates of total contract costs exceed contract revenue. Such
estimates are subject to change based on new information as projects progress toward
completion. Loss contracts are identified by monitoring the progress of the project and
updating the estimate of total contract costs which also requires significant judgment relat-
ing to achieving certain performance standards, particularly in our Power business, and
estimates involving warranty costs.

Man
agem
ent’s
dis
cuss
ion
and
anal
ysis
management’s discussion and analysis 103
Risk Management
Siemens’ risk management policy is to pursue sustainable growth while taking on only
manageable risks associated with creating economic value. Risk management is therefore
an integral part of how we plan and execute our business strategies, and our risk manage-
ment policy is set by Siemens’ Corporate Executive Committee (a committee of the Manag-
ing Board that includes both the CEO and CFO). Group management executes this policy in
line with Siemens’ overall organizational and accountability structure. For example, each
operating unit or business entity is accountable for managing the risks associated with its
regional or worldwide business.
We use a coordinated set of sophisticated risk management and control systems to
anticipate, measure, monitor and manage our exposure to risk. The most important of
these are our well-established, enterprise-wide processes for strategic planning and man-
agement reporting. The former allows us to consider potential risks well in advance of
major business decisions, and the latter enables us to monitor them closely over time as
our business progresses. Our internal auditors regularly review the adequacy and effi-
ciency of our risk management and control systems. The coordination of all these processes
and procedures are intended to ensure that the Managing Board and the Supervisory
Board are informed about material risks on a timely basis, as described in more detail in
the section Corporate Governance.
Below we describe the major categories of risks that could materially affect our business,
our financial condition and our results of operations. The risks we describe here are not
necessarily the only ones we face. Additional risks not known to us, or that we now consider
less significant, could also adversely affect our business.
Business Risks
Siemens operates in competitive global markets, where both customers and competitors
can access many sources of information to identify the lowest prices for products and serv-
ices, as well as those with high quality, superior customer service, and favorable financing
terms. For example, Siemens faces aggressive price-cutting by competitors in its Informa-
tion & Communications Groups (I&C) and in Medical Solutions (Med), especially in times
of slow or stalled growth in customer demand. Siemens is exposed to market downturns,
particularly in the highly volatile mobile communications market of ICM, the carrier
switching business of ICN, the gas turbine business of PG and the automotive supplier mar-
ket of SV. The recent macroeconomic downturn resulted in cost-cutting and productivity
initiatives and in stagnating investing activities in fiscal 2001, 2002, and 2003. The contin-
ued effectiveness of such programs will be a factor in our future success as well.
Siemens businesses are extensively engaged in the development, acquisition and use of
technology, which advances rapidly in many of the industries in which we participate. To
maintain a high level of innovation and technological competitiveness, we execute divesti-
tures, acquisitions, strategic alliances and joint ventures. Transactions such as these carry
inherent risks associated with the challenges of integrating people, operations, technolo-
gies and products. We also face the risk that acquired technologies may become obsolete
due to unforeseen business or market developments. To counter these risks, we conduct
extensive technological analysis of potential acquisitions and business partners, and
employ defined processes designed to increase the speed and effectiveness of mergers,
acquisitions, and joint ventures.

104 management’s discussion and analysis
Operational Risks
Within many of our operating Groups, the normal course of business includes large and
complex projects for customers. PG, PTD, TS, SD, the I&C groups and I&S are generally
engaged in such projects. The risks associated with these projects include unexpected tech-
nological problems, unforeseen developments at project sites, problems with our partners
and subcontractors companies, and logistic difficulties. Any of these factors could lead to
significant cost over-runs or project penalties.
We also have production facilities worldwide with a high degree of organizational and
technological complexity. We therefore face risks within our value chain processes such as
operational failures, quality issues and potential safety risks involving our products, our
workers, or the environment. To manage these risks, we have established a comprehensive
set of policies and procedures relating to project and quality management, product safety,
workplace safety, and environmental protection. We also continuously develop and refine
our production processes and technologies and our administrative processes. In addition,
we rigorously maintain our facilities and train our employees.
Supplier Risks
We rely on third parties to supply us with parts, components and services. This reliance
creates risks that our businesses could be affected by unexpected shortages on the part of
suppliers, or by unexpected price increases due to market forces or currency fluctuations.
Using third parties to manufacture, assemble and test parts and components also limits
our direct control over manufacturing yields, quality assurance, and delivery schedules.
We manage these supplier-related risks by closely monitoring our supply markets, carefully
evaluating supplier performance, and using long-term agreements to ensure favorable
supply, pricing and delivery of key parts, components, and services.
Human Resource Risks
In many of the fields in which we operate intense competition exists for highly qualified
managers, professionals, and technicians who possess the necessary scientific, technical or
industry-specific skills we require. Therefore, we face risks related to our continued ability
to recruit, assimilate and retain qualified people in all these areas. To manage these risks,
we maintain intensive contact with trade schools, universities, and professional associa-
tions that educate and train the people we are likely to need. We also provide abundant
opportunities for existing employees to acquire new skills and knowledge related to our
business; attractive remuneration systems aimed at retaining qualified employees; and
programs designed to successfully integrate new employees into the Company.

Man
agem
ent’s
dis
cuss
ion
and
anal
ysis
management’s discussion and analysis 105
Credit Risks
As described above, Siemens provides various forms of direct or indirect financing to cus-
tomers, for large projects as well as specific product orders. It is customary in some indus-
tries, for example, for suppliers to finance large-scale infrastructure projects. Because we
have the capability to engage in large infrastructure projects throughout the world, such
financing could expose us to specific risks associated with a particular country or its cur-
rency. Because some of our infrastructure customers are newly formed companies, particu-
larly in the wireless telecommunications area, we could also face infrastructure financing
risks associated with a particular company. Additionally, vendor financing of projects such
as GSM or UMTS wireless network equipment exposes us to credit risks. We also face a num-
ber of general risks in providing financing to our customers, including delayed payments
from customers or difficulties in the collection of receivables, especially when we conduct
business in emerging markets, in markets with economic difficulties, or in markets with a
high number of start-up companies. We manage these risks through our enterprise-wide
management emphasis on collecting receivables fully and timely. We further manage these
credit risks using defined processes for assessing customer creditworthiness.
Market Risks
We define “market risk” as a potential loss due to an adverse move in market rates. We
define “potential loss” for equity price risk as a decline in fair values due to an adverse
move in market prices. For foreign exchange risk, a “potential loss” is defined as a decline
in future cash flows due to an adverse move in market rates. For interest rate risk, we con-
sider “potential loss” to mean, for fixed-rate instruments, a decline in fair values, and, for
variable-rate instruments, a decline in future cash flows. We use the “sensitivity analysis”
method to measure our market risk.
Assets from the groups’ pension plans (equity investments and interest bearing securi-
ties) are not included in the discussion below.
Equity Price Risks
We have direct and indirect investments in publicly traded companies, which are held for
purposes other than trading. The market value of these investments as of September 30,
2003 was €4.121 billion, with our 39.7% interest in Infineon Technologies AG, our 12.5%
interest in EPCOS AG and our 9.7% interest in Juniper Networks representing a large share.
An adverse move in equity prices of 20% would reduce the value of these investments by
(€824) million. In fiscal 2002, an adverse move in equity prices of 20% would have reduced
the value of these investments by (€450) million. The difference between the fiscal years is
primarily due to an increase in Infineons and Juniper Networks’ share prices during fiscal
2003.

106 management’s discussion and analysis
Foreign Currency and Interest Rate Exposure
Our risk management approach is to pool and analyze interest rate and currency risk expo-
sures of the business groups. Exceptions to this approach are made in the case of country-
specific restrictions and similar considerations. The pooled exposures are recorded on a
real-time basis in a treasury management system maintained by our Treasury and Financ-
ing Services (TFS) Division of SFS. This system allows us to perform an ongoing mark-to-
market valuation of interest rate and currency risks of all pooled transactions, as well as a
measure of credit exposure to individual financial institutions. TFS acting on behalf of Cor-
porate Finance Treasury, hereinafter referred to as Treasury, enters into financial instru-
ments with third-party financial institutions to offset pooled exposures using a value-at-
risk model. The instruments used are readily marketable, liquid and priced on a daily
basis. They include: forward exchange contracts, interest-rate swaps, cross-currency swaps,
forward contracts and options. For all these tasks, Treasury has in place appropriate func-
tional and organizational separation of duties between transaction initiation, processing,
risk controlling and accounting. Unless prohibited by local restrictions, foreign exchange
controls or in order to mitigate political risk, operating units are obliged to invest their
excess liquidity or to cover their financial needs with Treasury. Treasury’s global coverage
represents approximately about 90% as far as investments but also borrowings of operat-
ing units are concerned.
As a company doing business around the world, Siemens is exposed to foreign currency
cash flows from the sale of products and services which are not denominated in the func-
tional currency of the respective Siemens unit. The operative foreign currency exposure
arising from our business groups are partly offset through our production facilities
abroad, as well as through procurement activities conducted in foreign currencies. In addi-
tion, a financial foreign currency exposure arises from investments and financing activi-
ties of Siemens in foreign currencies. We define generally foreign currency exposure as
balance sheet items, firm commitments and foreign currency-denominated cash inflows
and cash outflows from anticipated transactions for the next three months. This foreign
currency exposure is determined from the point of view of the respective functional curren-
cies of the Siemens’ entity where the exposure exists. To address the effects of foreign
exchange translation risk in our risk management, our working assumption is that invest-
ments in our foreign-based operations are permanent and that reinvestment is continual.
Whenever a divestment of a particular asset or entity is made, we incorporate the approxi-
mate value of this transaction into our sensitivity analysis. Effects from currency fluctua-
tions on the translation of net asset amounts into euro are reflected in the Siemens consoli-
dated equity position. Operating units are not allowed to borrow or invest money in foreign
currencies on a speculative basis. Intercompany financing or investments of operating
units are preferably done in their functional currency or on a hedged basis.
Our group-wide guidelines require each entity to monitor their foreign currency expo-
sure. Based on a guideline developed by our Corporate Finance department, the entities are
required to hedge at least 75% of their total foreign currency exposure. Exceptions require
special permission from and additional supervision by Corporate Finance regarding the
related foreign currency exposure. Entities enter into foreign exchange contracts with Treas-
ury. The unhedged balances from foreign currency exposure and the financial foreign cur-
rency exposure are reported to the Corporate Finance department, which monitors the
overall net foreign exchange exposure of the Company. Approximately 60% of the overall
foreign currency exposure is related to operative cash flows while the remaining 40% arise

Man
agem
ent’s
dis
cuss
ion
and
anal
ysis
management’s discussion and analysis 107
from financial cash flows. In the U.S. dollar approximately 50% of the exposure is related to
operative cash flow and the remainder arises from financial intercompany needs. These
financial cash flows mainly accrue from our financial debt issued in euro fulfilling our
financing requirements in North America. The values presented in the foreign exchange
risk disclosures made in this document are the unhedged positions multiplied by the
assumed 10% appreciation of the euro against all currencies. In determining our foreign
exchange sensitivity, we aggregate the net foreign exchange risk exposure of the operating
units and Treasury.
Because our foreign currency inflows exceed our outflows, an appreciation of the euro
against all foreign currencies, particularly the U.S. dollar would have a negative financial
impact to the extent that future sales are not already hedged. Future changes in the foreign
exchange rates can impact sales prices and may lead to margin impacts, the extent of which
is determined by the matching of foreign currency revenues and expenses. In order to opti-
mize cost of capital, the decision about the funding currency is independent from the cur-
rency needs for capital requirements. Exchange rate risk arising out of this approach is
hedged. For the reasons outlined, changes in foreign currency exchange rates do not neces-
sarily result in an impact on the profit of our Groups, but may impact cash flow.
At September 30, 2003, a parallel 10% alteration of the euro against all foreign curren-
cies would have resulted in a decline in future cash flows of €(8) million, particularly to the
U.S. dollar, the British pound and the Swiss franc, and €(79) million at September 30, 2002.
Our fair value interest risk results primarily from our long-term fixed rate debt obligations
and interest bearing investments. We seek to limit this risk through the use of derivative
instruments which allow us to hedge fair value changes by swapping fixed rates of interest
into variable rates of interest. Assuming a 100-basis-point increase in interest rates, our fair
value interest risk was €(22) million on September 30, 2003, increasing from €(4) on Sep-
tember 30, 2002, assuming a 100 basis point decrease. This change in position was mainly
due to transforming liquidity invested on a short term basis into intended maturity.
Our cash flow interest rate risk on our variable-rate portfolio was €(85) million at Sep-
tember 30, 2003 and €(67) million at September 30, 2002, assuming a 100-basis-point
increase in interest rates. Such risk is largely related to variable interest rates resulting
from the aforementioned hedges of fixed rate debt obligations.
Annual Report / 20F Disclosure Differences
In addition to this Annual Report, Siemens prepares and files an “Annual Report on Form
20-F” with the U.S. Securities and Exchange Commission (SEC) as a foreign private issuer.
The Form 20-F and this Annual Report are not identical.
In particular, this Annual Report includes a quantification of our economic value added
(EVA) measure, because a significant portion of our management’s incentive compensation
is tied to EVA targets. We provide disclosure of how the measure is calculated and how
investors should use this information. Form 20-F does not include this information.
Our Annual Report on Form 20-F is available on our website at
www.siemens.com/investor_relations

108 management’s discussion and analysis
Outlook
Following the volume declines of the past year, which were substantially driven by currency
translation, our goal in fiscal 2004 is to achieve further growth in profitability and win mar-
ket share. As a number of our Groups have demonstrated, we are well positioned for this
effort, with our clear customer focus, strength in innovation, global competitiveness, and
sound financial condition. These qualities should also create the basis for double-digit per-
centage growth in net income for fiscal 2004, assuming generally stable economic condi-
tions.

Man
agem
ent’s
dis
cuss
ion
and
anal
ysis
management’s discussion and analysis 109
Subsequent events
After the close of fiscal 2003, in October 2003, Med completed the sale of its life support sys-
tems business to Getinge AB, of Sweden. Also in October 2003, Siemens made additional
supplemental cash contributions to its U.S. and German pension trusts of €1.255 billion.
This Annual Report contains forward-looking statements based on beliefs of Siemens’
management. We use the words “anticipate”, “believe”, “estimate”, “expect”, “intend”,
“should”, “plan” and “project” to identify forward-looking statements. Such statements
reflect our current views with respect to future events and are subject to risks and uncer-
tainties. Many factors could cause the actual results to be materially different, including,
among others, changes in general economic and business conditions, changes in cur-
rency exchange rates and interest rates, introduction of competing products, lack of
acceptance of new products or services and changes in business strategy. Actual results
may vary materially from those projected here. Please refer to the discussion of Siemens’
risk factors in our Form 20-F. Siemens does not intend or assume any obligation to
update these forward-looking statements. It is our policy to disclose material information
on an open, nonselective basis.

110 consolidated financial statements
Consolidated Statements of IncomeFor the fiscal years ended September 30, 2003 and 2002 (in millions of €, per share amounts in €)
Eliminations,reclassifications and Financing and
Siemens worldwide Corporate Treasury(2) Operations Real Estate
Note 2003 2002 2003 2002 2003 2002 2003 2002
Net sales 74,233 84,016 (1,623) (1,297) 73,744 83,127 2,112 2,186
Cost of sales (53,350) (60,810) 1,625 1,222 (53,298) (60,322) (1,677) (1,710)
Gross profit on sales 20,883 23,206 2 (75) 20,446 22,805 435 476
Research and development expenses (5,067) (5,819) – (169) (5,067) (5,650) – –
Marketing, selling and general administrative expenses (13,534) (15,455) – (90) (13,243) (15,083) (291) (282)
Other operating income (expense), net (therein gain on issuance of subsidiaryand associated company stock €3 and €37, respectively) 3, 4 642 1,321 (77) 844 555 326 164 151
Income (loss) from investments in other companies, net 5 142 (114) – (16) 66 (142) 76 44
Income (expense) from financial assets and marketable securities, net 6 61 18 135 (81) (69) 124 (5) (25)
Interest income of Operations, net 7 31 94 – – 31 94 – –
Other interest income (expense), net 7 214 224 206 239 (88) (96) 96 81
Gains on sales and dispositions of significant business interests – – – (936) – 936 – –
Income (loss) before income taxes 3,372 3,475 266 (284) 2,631 3,314 475 445
Income taxes(1) 8 (867) (849) (68) 69 (677) (809) (122) (109)
Minority interest (96) (29) – 2 (96) (31) – –
Income (loss) before cumulative effect of change in accounting principle 2,409 2,597 198 (213) 1,858 2,474 353 336
Cumulative effect of change in accounting principle, net of income taxes 36 – – – 39 – (3) –
Net income (loss) 2,445 2,597 198 (213) 1,897 2,474 350 336
Basic earnings per share 30Income before cumulative effect of change in accounting principle 2.71 2.92
Cumulative effect of change in accounting principle, net of income taxes 0.04 –
Net income 2.75 2.92
Diluted earnings per share 30Income before cumulative effect of change in accounting principle 2.71 2.92
Cumulative effect of change in accounting principle, net of income taxes 0.04 –
Net income 2.75 2.92
(1) The income taxes of Eliminations, reclassifications and Corporate Treasury, Operations,and Financing and Real Estate are based on the consolidated effective corporate taxrate applied to income before income taxes.
(2) As of December 5, 2001, Siemens deconsolidated Infineon. The results of operationsfrom Infineon for the first two months of the fiscal year 2002 are included in Elimina-tions, reclassifications and Corporate Treasury. As of December 5, 2001, the share inearnings (loss) from Infineon is included in Income (loss) from investments in othercompanies, net in Operations.
The accompanying notes are an integral part of these consolidated financial statements.

Con
solid
ated
Fin
anci
alSt
atem
ents
consolidated financial statements 111
Eliminations,reclassifications and Financing and Corporate Treasury(2) Operations Real Estate
2003 2002 2003 2002 2003 2002
(1,623) (1,297) 73,744 83,127 2,112 2,186
1,625 1,222 (53,298) (60,322) (1,677) (1,710)
2 (75) 20,446 22,805 435 476
– (169) (5,067) (5,650) – –
– (90) (13,243) (15,083) (291) (282)
(77) 844 555 326 164 151
– (16) 66 (142) 76 44
135 (81) (69) 124 (5) (25)
– – 31 94 – –
206 239 (88) (96) 96 81
– (936) – 936 – –
266 (284) 2,631 3,314 475 445
(68) 69 (677) (809) (122) (109)
– 2 (96) (31) – –
198 (213) 1,858 2,474 353 336
– – 39 – (3) –
198 (213) 1,897 2,474 350 336

112 consolidated financial statements
Consolidated Balance SheetsAs of September 30, 2003 and 2002 (in millions of €)
Eliminations,reclassifications and Financing and
Siemens worldwide Corporate Treasury Operations Real Estate
Note 9/30/03 9/30/02 9/30/03 9/30/02 9/30/03 9/30/02 9/30/03 9/30/02
AssetsCurrent assets
Cash and cash equivalents 12,149 11,196 11,345 10,269 725 873 79 54
Marketable securities 9 650 399 101 25 529 356 20 18
Accounts receivable, net 10 14,511 15,230 (9) (7) 10,894 12,058 3,626 3,179
Intracompany receivables – – (10,777) (13,284) 10,742 13,209 35 75
Inventories, net 11 10,366 10,672 (4) (5) 10,284 10,592 86 85
Deferred income taxes 8 1,063 1,212 77 64 909 1,143 77 5
Other current assets 12 4,750 5,353 736 1,028 3,143 3,306 871 1,019
Total current assets 43,489 44,062 1,469 (1,910) 37,226 41,537 4,794 4,435
Long-term investments 13 5,992 5,092 19 2 5,636 4,797 337 293
Goodwill 14 6,501 6,459 – – 6,421 6,369 80 90
Other intangible assets, net 15 2,358 2,384 – – 2,338 2,362 20 22
Property, plant and equipment, net 16 10,756 11,742 1 2 7,114 7,628 3,641 4,112
Deferred income taxes 8 4,359 3,686 1,127 764 3,165 2,771 67 151
Other assets 17 4,150 4,514 131 103 1,371 1,304 2,648 3,107
Other intracompany receivables – – (1,204) (931) 1,204 931 – –
Total assets 77,605 77,939 1,543 (1,970) 64,475 67,699 11,587 12,210
Liabilities and shareholder’s equityCurrent liabilities
Short-term debt and current maturities of long-term debt 20 1,745 2,103 977 1,143 646 785 122 175
Accounts payable 8,404 8,649 4 6 8,216 8,453 184 190
Intracompany liabilities – – (7,426) (7,776) 1,771 1,799 5,655 5,977
Accrued liabilities 18 8,884 9,608 6 18 8,748 9,445 130 145
Deferred income taxes 8 870 661 (271) (206) 877 647 264 220
Other current liabilities 19 12,125 13,691 284 375 11,578 12,853 263 463
Total current liabilities 32,028 34,712 (6,426) (6,440) 31,836 33,982 6,618 7,170
Long-term debt 20 11,433 10,243 10,176 6,833 748 2,974 509 436
Pension plans and similar commitments 21 5,843 5,326 – – 5,813 5,299 30 27
Deferred income taxes 8 534 195 182 (50) 250 119 102 126
Other accruals and provisions 22 3,418 3,401 21 28 3,101 3,068 296 305
Other intracompany liabilities – – (2,410) (2,341) 378 45 2,032 2,296
53,256 53,877 1,543 (1,970) 42,126 45,487 9,587 10,360
Minority interests 634 541 – – 634 541 – –
Shareholders’ equity 23Common stock, no par value.
Authorized: 1,129,742,969 and 1,145,917,335 shares, respectivelyIssued: 890,866,301 and 890,374,001 shares, respectively 2,673 2,671
Additional paid-in capital 5,073 5,053
Retained earnings 23,020 21,471
Accumulated other comprehensive income (loss) (7,051) (5,670)
Treasury stock, at cost. 1,184 and 49,864 shares, respectively – (4)
Total shareholders’ equity 23,715 23,521 – – 21,715 21,671 2,000 1,850
Total liabilities and shareholders’ equity 77,605 77,939 1,543 (1,970) 64,475 67,699 11,587 12,210
The accompanying notes are an integral part of these consolidated financial statements.

Con
solid
ated
Fin
anci
alSt
atem
ents
consolidated financial statements 113
Eliminations,reclassifications and Financing and Corporate Treasury Operations Real Estate
9/30/03 9/30/02 9/30/03 9/30/02 9/30/03 9/30/02
11,345 10,269 725 873 79 54
101 25 529 356 20 18
(9) (7) 10,894 12,058 3,626 3,179
(10,777) (13,284) 10,742 13,209 35 75
(4) (5) 10,284 10,592 86 85
77 64 909 1,143 77 5
736 1,028 3,143 3,306 871 1,019
1,469 (1,910) 37,226 41,537 4,794 4,435
19 2 5,636 4,797 337 293
– – 6,421 6,369 80 90
– – 2,338 2,362 20 22
1 2 7,114 7,628 3,641 4,112
1,127 764 3,165 2,771 67 151
131 103 1,371 1,304 2,648 3,107
(1,204) (931) 1,204 931 – –
1,543 (1,970) 64,475 67,699 11,587 12,210
977 1,143 646 785 122 175
4 6 8,216 8,453 184 190
(7,426) (7,776) 1,771 1,799 5,655 5,977
6 18 8,748 9,445 130 145
(271) (206) 877 647 264 220
284 375 11,578 12,853 263 463
(6,426) (6,440) 31,836 33,982 6,618 7,170
10,176 6,833 748 2,974 509 436
– – 5,813 5,299 30 27
182 (50) 250 119 102 126
21 28 3,101 3,068 296 305
(2,410) (2,341) 378 45 2,032 2,296
1,543 (1,970) 42,126 45,487 9,587 10,360
– – 634 541 – –
– – 21,715 21,671 2,000 1,850
1,543 (1,970) 64,475 67,699 11,587 12,210

114 consolidated financial statements
Consolidated Statements of Cash FlowFor the fiscal years ended September 30, 2003 and 2002 (in millions of €)
The accompanying notes are an integral part of these consolidated financial statements.
Eliminations,reclassifications and Financing and
Siemens worldwide Corporate Treasury Operations Real Estate2003 2002 2003 2002 2003 2002 2003 2002
Cash flows from operating activities Net income (loss) 2,445 2,597 198 (213) 1,897 2,474 350 336Adjustments to reconcile net income to cash provided
Minority interest 96 29 – (2) 96 31 – –Amortization, depreciation and impairments 3,334 4,126 – 209 2,894 3,440 440 477Deferred taxes 262 (191) 20 (185) 206 18 36 (24)Gains on sales and disposals of businesses and property, plant and equipment, net, and gain from issuance of subsidiary and associated company stock (232) (1,610) – (936) (145) (588) (87) (86)Losses (gains) on sales of investments, net 2 (177) – 7 2 (172) – (12)Gains on sales and dispositions of significant business interests – – – 936 – (936) – –Losses (gains) on sales and impairments of marketable securities, net 23 4 9 (2) 13 3 1 3Loss (income) from equity investees, net of dividends received 10 298 – 17 70 322 (60) (41)Change in current assets and liabilities
(Increase) decrease in inventories, net 8 1,349 – 86 14 1,234 (6) 29(Increase) decrease in accounts receivable, net 623 1,763 (527) 844 1,141 871 9 48Increase (decrease) in outstanding balance of receivables sold (291) (503) (21) (607) (270) 104 – –(Increase) decrease in other current assets 1,416 1,213 835 459 561 833 20 (79)Increase (decrease) in accounts payable (396) (899) 3 (254) (396) (595) (3) (50)Increase (decrease) in accrued liabilities (621) (575) – 30 (571) (577) (50) (28)Increase (decrease) in other current liabilities (668) (1,025) 466 (99) (961) (851) (173) (75)
Supplemental contributions to pension trusts (1,192) (1,782) – – (1,192) (1,782) – –Change in other assets and liabilities 893 947 137 439 764 448 (8) 60
Net cash provided by operating activities 5,712 5,564 1,120 729 4,123 4,277 469 558
Cash flows from investing activities Additions to intangible assets and property, plant and equipment (2,852) (3,894) – (149) (2,468) (3,149) (384) (596)Acquisitions, net of cash acquired (1,055) (3,787) – – (1,055) (3,787) – –Purchases of investments (736) (332) – (65) (714) (263) (22) (4)Purchases of marketable securities (221) (338) (92) (306) (127) (27) (2) (5)Increase in receivables from financing activities (94) (172) 276 (864) – – (370) 692Increase (decrease) in outstanding balance of receivables sold by SFS – – 21 607 – – (21) (607)Proceeds from sales of long-term investments, intangibles and property, plant and equipment 839 1,218 – – 556 801 283 417Proceeds from sales and dispositions of businesses 119 6,097 – – 119 6,097 – –Proceeds from sales of marketable securities 61 398 26 317 34 78 1 3
Net cash (used in) provided by investing activities (3,939) (810) 231 (460) (3,655) (250) (515) (100)
Cash flows from financing activitiesProceeds from issuance of common stock – 156 – – – 156 – –Purchase of common stock of Company – (152) – – – (152) – –Proceeds from issuance of treasury shares 4 81 – – 4 81 – –Proceeds from issuance of debt 2,702 384 2,702 384 – – – –Repayment of debt (1,742) (847) (1,700) (809) (12) (15) (30) (23)Change in short-term debt (445) 512 (106) 843 (323) (481) (16) 150Change in restricted cash – (2) – (2) – – – –Dividends paid (896) (888) – – (896) (888) – –Dividends paid to minority shareholders (110) (103) – – (110) (103) – –Intracompany financing – – (907) 3,178 787 (2,615) 120 (563)
Net cash (used in) provided by financing activities (487) (859) (11) 3,594 (550) (4,017) 74 (436)
Effect of deconsolidation of Infineon on cash and cash equivalents – (383) – (383) – – – –Effect of exchange rates on cash and cash equivalents (333) (118) (264) (71) (66) (44) (3) (3)Net increase (decrease) in cash and cash equivalents 953 3,394 1,076 3,409 (148) (34) 25 19Cash and cash equivalents at beginning of period 11,196 7,802 10,269 6,860 873 907 54 35Cash and cash equivalents at end of period 12,149 11,196 11,345 10,269 725 873 79 54
Supplemental disclosure of cash paid for: Interest 545 794Income taxes 795 389

Con
solid
ated
Fin
anci
alSt
atem
ents
consolidated financial statements 115
Eliminations,reclassifications and Financing and Corporate Treasury Operations Real Estate
2003 2002 2003 2002 2003 2002
198 (213) 1,897 2,474 350 336
– (2) 96 31 – –– 209 2,894 3,440 440 477
20 (185) 206 18 36 (24)
– (936) (145) (588) (87) (86)– 7 2 (172) – (12)– 936 – (936) – –9 (2) 13 3 1 3– 17 70 322 (60) (41)
– 86 14 1,234 (6) 29(527) 844 1,141 871 9 48
(21) (607) (270) 104 – –835 459 561 833 20 (79)
3 (254) (396) (595) (3) (50)– 30 (571) (577) (50) (28)
466 (99) (961) (851) (173) (75)– – (1,192) (1,782) – –
137 439 764 448 (8) 60
1,120 729 4,123 4,277 469 558
– (149) (2,468) (3,149) (384) (596)– – (1,055) (3,787) – –– (65) (714) (263) (22) (4)
(92) (306) (127) (27) (2) (5)276 (864) – – (370) 692
21 607 – – (21) (607)– – 556 801 283 417– – 119 6,097 – –
26 317 34 78 1 3
231 (460) (3,655) (250) (515) (100)
– – – 156 – –– – – (152) – –– – 4 81 – –
2,702 384 – – – –(1,700) (809) (12) (15) (30) (23)
(106) 843 (323) (481) (16) 150– (2) – – – –– – (896) (888) – –– – (110) (103) – –
(907) 3,178 787 (2,615) 120 (563)
(11) 3,594 (550) (4,017) 74 (436)
– (383) – – – –(264) (71) (66) (44) (3) (3)
1,076 3,409 (148) (34) 25 1910,269 6,860 873 907 54 3511,345 10,269 725 873 79 54
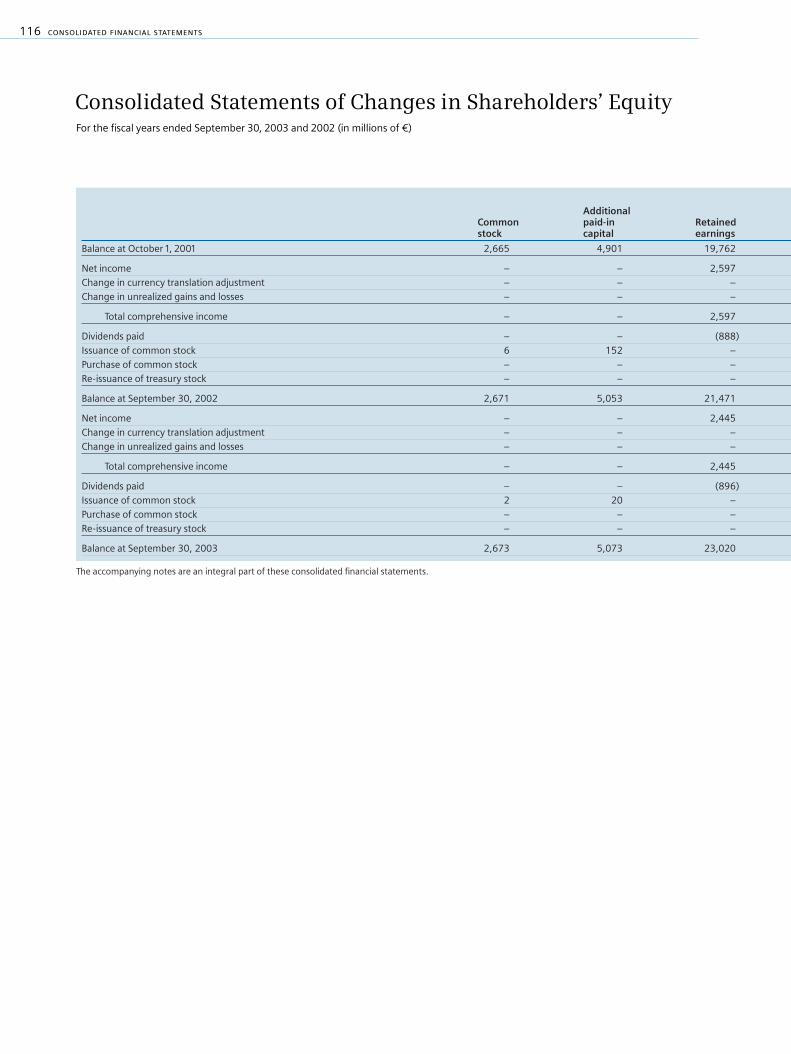
116 consolidated financial statements
Consolidated Statements of Changes in Shareholders’ EquityFor the fiscal years ended September 30, 2003 and 2002 (in millions of €)
Accumulated other comprehensive income (loss)Additional Cumulative Available- Minimum Treasury
Common paid-in Retained translation for-sale Derivative pension sharesstock capital earnings adjustment securities instruments liability at cost Total
Balance at October 1, 2001 2,665 4,901 19,762 401 54 23 (3,994) – 23,812
Net income – – 2,597 – – – – – 2,597
Change in currency translation adjustment – – – (533) – – – – (533)
Change in unrealized gains and losses – – – – (239) 36 (1,418) – (1,621)
Total comprehensive income – – 2,597 (533) (239) 36 (1,418) – 443
Dividends paid – – (888) – – – – – (888)
Issuance of common stock 6 152 – – – – – – 158
Purchase of common stock – – – – – – – (167) (167)
Re-issuance of treasury stock – – – – – – – 163 163
Balance at September 30, 2002 2,671 5,053 21,471 (132) (185) 59 (5,412) (4) 23,521
Net income – – 2,445 – – – – – 2,445
Change in currency translation adjustment – – – (695) – – – – (695)
Change in unrealized gains and losses – – – – 268 24 (978) – (686)
Total comprehensive income – – 2,445 (695) 268 24 (978) – 1,064
Dividends paid – – (896) – – – – – (896)
Issuance of common stock 2 20 – – – – – – 22
Purchase of common stock – – – – – – – (127) (127)
Re-issuance of treasury stock – – – – – – – 131 131
Balance at September 30, 2003 2,673 5,073 23,020 (827) 83 83 (6,390) – 23,715
The accompanying notes are an integral part of these consolidated financial statements.

Con
solid
ated
Fin
anci
alSt
atem
ents
consolidated financial statements 117
Accumulated other comprehensive income (loss)Cumulative Available- Minimum Treasurytranslation for-sale Derivative pension sharesadjustment securities instruments liability at cost Total
401 54 23 (3,994) – 23,812
– – – – – 2,597
(533) – – – – (533)
– (239) 36 (1,418) – (1,621)
(533) (239) 36 (1,418) – 443
– – – – – (888)
– – – – – 158
– – – – (167) (167)
– – – – 163 163
(132) (185) 59 (5,412) (4) 23,521
– – – – – 2,445
(695) – – – – (695)
– 268 24 (978) – (686)
(695) 268 24 (978) – 1,064
– – – – – (896)
– – – – – 22
– – – – (127) (127)
– – – – 131 131
(827) 83 83 (6,390) – 23,715

118 notes to consolidated financial statements
Segment InformationAs of and for the fiscal years ended September 30, 2003 and 2002 (in millions of €)
Siemens worldwide 75,056 86,214 74,233 84,016 – – 74,233 84,016 3,372 3,475 77,605 77,939 1,773 4,754 4,643 8,013 3,334 4,126
(1) Group profit of the Operations Groups is earnings before financing interest,certain pension costs and income taxes.
(2) Net capital employed of the Operations Groups represents total assets lesstax assets, certain accruals and non-interest bearing liabilities other than taxliabilities.
(3) Intangible assets, property, plant and equipment, acquisitions, and invest-ments.
(4) Includes amortization and impairments of intangible assets, depreciation ofproperty, plant and equipment, and write-downs of investments.
(5) Other operations primarily refer to certain centrally-held equity invest-ments and other operating activities not associated with a Group.
(6) Includes (for Eliminations within Financing and Real Estate consists of)cash paid for income taxes according to the allocation of income taxes toOperations, Financing and Real Estate, and Eliminations, reclassificationsand Corporate Treasury in the Consolidated Statements of Income.
Income beforeincome taxes Total assets
Financing and Real Estate Groups
Siemens Financial Services (SFS) 532 582 433 436 99 146 532 582 269 216 8,445 8,681 (312) 282 237 283 220 271
Siemens Real Estate (SRE) 1,592 1,612 265 243 1,327 1,369 1,592 1,612 206 229 3,607 4,090 351 309 169 317 220 206
Eliminations – – – – (12) (8) (12) (8) – – (465) (561) (85)(6) (133)(6) – – – –
Total Financing and Real Estate 2,124 2,194 698 679 1,414 1,507 2,112 2,186 475 445 11,587 12,210 (46) 458 406 600 440 477
Net cash from Amortization,New orders Intersegment Net capital operating and Capital depreciation and(unaudited) External sales sales Total sales Group profit(1) employed(2) investing activities spending(3) impairments(4)
2003 2002 2003 2002 2003 2002 2003 2002 2003 2002 9/30/03 9/30/02 2003 2002 2003 2002 2003 2002
Operations Groups
Information and Communication Networks (ICN) 7,070 8,697 6,592 9,169 530 478 7,122 9,647 (366) (691) 722 1,100 106 711 219 415 447 850
Information and Communication Mobile (ICM) 9,960 11,538 9,811 10,910 153 135 9,964 11,045 180 96 1,367 1,973 692 594 347 453 326 368
Siemens Business Services (SBS) 5,226 6,256 3,964 4,212 1,241 1,561 5,205 5,773 13 101 294 264 (62) 173 193 222 255 282
Automation and Drives (A&D) 8,476 8,728 7,159 7,430 1,216 1,205 8,375 8,635 806 723 1,925 2,197 1,060 1,019 281 248 231 240
Industrial Solutions and Services (I&S) 3,955 4,120 2,907 3,378 1,105 1,102 4,012 4,480 (41) (198) 167 315 54 (107) 45 60 52 56
Siemens Dematic (SD) 2,599 2,810 2,444 2,894 156 101 2,600 2,995 (218) 45 877 975 (170) (70) 42 71 55 62
Siemens Building Technologies (SBT) 4,775 5,601 4,706 5,291 284 328 4,990 5,619 101 195 1,447 1,778 375 295 82 133 144 155
Power Generation (PG) 7,302 10,586 6,949 9,398 18 48 6,967 9,446 1,171 1,582 1,712 (144) (448) 662 1,120 300 163 184
Power Transmission and Distribution (PTD) 3,586 4,429 3,188 3,928 211 271 3,399 4,199 207 109 798 928 387 149 65 92 65 75
Transportation Systems (TS) 4,674 5,247 4,668 4,349 29 18 4,697 4,367 284 247 (252) (741) (217) 95 120 135 65 64
Siemens VDO Automotive (SV) 8,375 8,515 8,365 8,491 10 24 8,375 8,515 418 65 3,949 3,746 184 224 569 534 400 435
Medical Solutions (Med) 7,835 8,425 7,345 7,604 77 19 7,422 7,623 1,118 1,018 3,128 3,414 845 1,124 321 321 227 206
Osram 4,172 4,363 4,113 4,308 59 55 4,172 4,363 410 365 2,074 2,436 528 284 280 330 268 289
Other operations(5) 1,840 1,895 1,129 1,238 728 785 1,857 2,023 212 99 1,515 535 (362) 89 520 50 64 51
Total Operations Groups 79,845 91,210 73,340 82,600 5,817 6,130 79,157 88,730 4,295 3,756 19,723 18,776 2,972 5,242 4,204 3,364 2,762 3,317
Reconciliation to financial statements
Corporate items, pensions and eliminations (6,916) (7,688) 192 244 (5,605) (5,847) (5,413) (5,603) (1,576) (1,282) (3,781) (3,021) (2,504)(6) (1,215)(6) 33 3,835 132 123
Other interest expense – – – – – – – – (88) (96) – – – – – – – –
Gains on sales and dispositions of significant business interests – – – – – – – – – 936 – – – – – – – –
Other assets related reconciling items – – – – – – – – – – 48,533 51,944 – – – – – –
Total Operations (for columns Group profit/Net capital employed, i.e. Income before income taxes/Total assets) 72,929 83,522 73,532 82,844 212 283 73,744 83,127 2,631 3,314 64,475 67,699 468 4,027 4,237 7,199 2,894 3,440
Eliminations, reclassifications and Corporate Treasury 3 498 3 493 (1,626) (1,790) (1,623) (1,297) 266 (284) 1,543 (1,970) 1,351(6) 269(6) – 214 – 209

notes to consolidated financial statements 119
3,372 3,475 77,605 77,939 1,773 4,754 4,643 8,013 3,334 4,126
Income beforeincome taxes Total assets
269 216 8,445 8,681 (312) 282 237 283 220 271
206 229 3,607 4,090 351 309 169 317 220 206
– – (465) (561) (85)(6) (133)(6) – – – –
475 445 11,587 12,210 (46) 458 406 600 440 477
Net cash from Amortization,Net capital operating and Capital depreciation and
Group profit(1) employed(2) investing activities spending(3) impairments(4)
2003 2002 9/30/03 9/30/02 2003 2002 2003 2002 2003 2002
(366) (691) 722 1,100 106 711 219 415 447 850
180 96 1,367 1,973 692 594 347 453 326 368
13 101 294 264 (62) 173 193 222 255 282
806 723 1,925 2,197 1,060 1,019 281 248 231 240
(41) (198) 167 315 54 (107) 45 60 52 56
(218) 45 877 975 (170) (70) 42 71 55 62
101 195 1,447 1,778 375 295 82 133 144 155
1,171 1,582 1,712 (144) (448) 662 1,120 300 163 184
207 109 798 928 387 149 65 92 65 75
284 247 (252) (741) (217) 95 120 135 65 64
418 65 3,949 3,746 184 224 569 534 400 435
1,118 1,018 3,128 3,414 845 1,124 321 321 227 206
410 365 2,074 2,436 528 284 280 330 268 289
212 99 1,515 535 (362) 89 520 50 64 51
4,295 3,756 19,723 18,776 2,972 5,242 4,204 3,364 2,762 3,317
(1,576) (1,282) (3,781) (3,021) (2,504)(6) (1,215)(6) 33 3,835 132 123
(88) (96) – – – – – – – –
– 936 – – – – – – – –
– – 48,533 51,944 – – – – – –
2,631 3,314 64,475 67,699 468 4,027 4,237 7,199 2,894 3,440
Not
es t
o co
nso
lidat
edfin
anci
al s
tate
men
ts266 (284) 1,543 (1,970) 1,351(6) 269(6) – 214 – 209

120 notes to consolidated financial statements
(in millions of €, except where otherwise stated and per share amounts)
1 Basis of presentation
The accompanying Consolidated Financial Statements present the operations of Siemens
AG and its subsidiaries, (the Company or Siemens). The Consolidated Financial Statements
have been prepared in accordance with United States Generally Accepted Accounting Princi-
ples (U.S. GAAP). Siemens has prepared and reported its Consolidated Financial Statements
in euros (€).
Siemens is a German based multinational corporation with a balanced business portfo-
lio of activities predominantly in the field of electronics and electrical engineering (for fur-
ther information see Note 31).
In order to comply with §292a of the German Commercial Code (HGB), the Consolidated
Financial Statements were supplemented with Management’s Discussion and Analysis on a
consolidated basis and additional explanations. Therefore, the Consolidated Financial
Statements, which have to be filed with the Commercial Registry and published in the Ger-
man Federal Gazette (Bundesanzeiger), comply with the Fourth and Seventh Directives of
the European Community. For the interpretation of these directives the Company relied on
the German Accounting Standard No. 1 of the German Accounting Standards Committee.
The Consolidated Financial Statements and Management’s Discussion and Analysis as of
September 30, 2003, prepared in accordance with §292a of the HGB, are being filed with the
Commercial Registries of the Berlin-Charlottenburg and Munich District Courts under the
numbers HRB 12300 and HRB 6684, respectively.
Financial statement presentation
The presentation of the Company’s worldwide financial data is accompanied by a compo-
nent model presentation breaking down Siemens’ financial position, results of operations
and cash flows into three components (see below). These components contain the Com-
pany’s reportable segments (also referred to as “Groups”).
n Siemens worldwide – Represents the Consolidated Financial Statements of the Com-
pany.
n Operations – is defined as Siemens’ thirteen operating Groups including certain oper-
ating activities not associated with these Groups and centrally managed items including
corporate headquarters, but excluding the activities of the Financing and Real Estate
Groups and the Corporate Treasury.
n Financing and Real Estate – Siemens’ Financing and Real Estate Groups are respon-
sible for the Company’s international leasing, finance, credit and real estate manage-
ment activities.
n Eliminations, reclassifications and Corporate Treasury – Captures separately the
consolidation of transactions among Operations and Financing and Real Estate, as
well as certain reclassifications. This component also includes the Company’s Corporate
Treasury activities.
The Company’s presentation of Operations, Financing and Real Estate and Corporate
Treasury reflects the management of these components as distinctly different business
activities, with different goals and requirements. Management believes that this presenta-
tion provides a clearer understanding of the components of the Company’s financial posi-
tion, results of operations and cash flows. The accounting and valuation principles applied
to these components are generally the same as those used for Siemens worldwide. The
Company has allocated shareholders’ equity to the Financing and Real Estate business
Notes

Not
es t
o co
nso
lidat
edfin
anci
al s
tate
men
ts
notes to consolidated financial statements 121(in millions of €, except where otherwise stated and per share amounts)
based on a management approach which takes into consideration the inherent risk evident
in the underlying assets. The remaining amount of total shareholders’ equity is shown
under Operations. The financial data presented for the Operations and Financing and
Real Estate components are not intended to purport the financial position, results of oper-
ations and cash flows as if they were separate entities under U.S. GAAP.
Effective December 2001, Infineon is no longer consolidated but instead accounted for
as an investment using the equity method. Accordingly, the Company’s net investment in
Infineon is included within Long-term investments in the Consolidated Balance Sheets, and
its share of the net income or losses of Infineon is included as part of Income (loss) from
investments in other companies, net in the Consolidated Statements of Income (see Notes 3
and 13). The consolidated results of operations and cash flows of Infineon for the two
months ended November 2001 are included in Eliminations, reclassifications and Cor-
porate Treasury.
The information disclosed in these Notes relates to Siemens worldwide unless other-
wise stated.
2 Summary of significant accounting policies
Basis of consolidation – The Consolidated Financial Statements include the accounts of
Siemens AG and all subsidiaries which are directly or indirectly controlled. Results of asso-
ciated companies – companies in which Siemens has the ability to exercise significant
influence over operating and financial policies (generally through direct or indirect owner-
ship of 20% to 50% of the voting rights) – are recorded in the Consolidated Financial State-
ments using the equity method of accounting.
A complete list of Siemens’ subsidiaries and associated companies is being filed with the
Commercial Registries of the Berlin-Charlottenburg and Munich District Courts.
Foreign currency translation – The assets and liabilities of foreign subsidiaries, where
the functional currency is other than the euro, are translated using period-end exchange
rates, while the statements of operations are translated using average exchange rates dur-
ing the period. Differences arising from such translations are included as a separate com-
ponent of shareholders’ equity.
The exchange rates of the significant currencies of non-euro countries used in the
preparation of the Consolidated Financial Statements were as follows:
Year-end exchange rate Annual average rate 1 € quoted into 1 € quoted into cur-
Currency ISO Code currencies specified below rencies specified below
September, 30 Year endedSeptember, 30
2003 2002 2003 2002
Swiss francs CHF 1.538 1.461 1.498 1.469
British pound GBP 0.699 0.630 0.676 0.624
U.S. dollar USD 1.169 0.985 1.085 0.922

122 notes to consolidated financial statements
(in millions of €, except where otherwise stated and per share amounts)
Revenue recognition – Revenue is recognized for product sales when title passes, the
risks and rewards of ownership have been transferred to the customer, the fee is fixed or
determinable, and collection of the related receivable is probable. If product sales are sub-
ject to customer acceptance, revenues are not recognized until customer acceptance occurs.
For product sales which require the Company to install the product at the customer loca-
tion, and for which installation is essential to the functionality of the product being in-
stalled, revenue is recognized when the equipment has been delivered to and installed at
the customer location provided those sales do not qualify for multiple deliverable account-
ing as set forth in Emerging Issues Task Force (EITF) Issue 00-21, Revenue Arrangements
with Multiple Deliverables (see Accounting changes below). If a contract or arrangement
involves the provision of multiple elements, the Company applies the guidance in EITF
00-21 to determine if the contract or arrangement contains more than one unit of account-
ing and, if applicable, the allocation of arrangement consideration to such units of account-
ing. The appropriate revenue recognition convention is then applied to each separate unit
of accounting. Revenues from service transactions are recognized based on service per-
formance. For long-term service contracts, revenues are generally recognized on a straight-
line basis over the term of the contract. Revenues under certain fixed-price long-term IT-
related contracts and revenues from long-term construction-type projects are generally
recognized under the percentage-of-completion method, based on the percentage of costs
to date compared to the total estimated contract costs, contractual milestones or perform-
ance. Operating lease income for the rental of equipment is recognized on a straight-line
basis over the lease term. Interest income from capital leases is recognized using the inter-
est method.
Product-related expenses and contract loss provisions – Provisions for estimated
costs related to product warranties are recorded in cost of sales at the time the related sale
is recognized, and are established on an individual basis except for consumer products,
which are accrued for on an aggregate basis. The estimates reflect historic trends of war-
ranty costs as well as information regarding product failure experienced during construc-
tion, installation or testing of products. In the case of new products, expert opinions and
industry data are also taken into consideration in estimating product warranty accruals.
Research and development costs are expensed as incurred. Contract loss provisions are
established in the period when the current estimate of total contract costs exceeds contract
revenue.
Earnings per share – Basic earnings per share is computed by dividing net income by
the weighted average shares outstanding during the year. Diluted earnings per share is cal-
culated by adjusting outstanding shares assuming conversion or exercise of all potentially
dilutive securities or stock options. Share and per share data for all periods presented
reflect the Company’s 3-for-2 stock split in fiscal 2001 and are based on the new number of
shares (except where otherwise stated).
Cash and cash equivalents – The Company considers all highly liquid investments
purchased with an original maturity of three months or less to be cash equivalents.

Not
es t
o co
nso
lidat
edfin
anci
al s
tate
men
ts
notes to consolidated financial statements 123(in millions of €, except where otherwise stated and per share amounts)
Marketable securities and investments – The Company’s marketable securities are
accounted for at fair value if readily determinable. Securities are classified as either avail-
able-for-sale or trading securities. Management determines the appropriate classification
of its investments in marketable securities at the time of purchase and reevaluates such
determination at each balance sheet date. Marketable securities classified as available-for-
sale are reported at fair value, with unrealized gains and losses included in accumulated
other comprehensive income, net of applicable deferred taxes. Realized gains and losses
are accounted for using the specific identification method. Investments for which there is
no readily determinable market value are recorded at cost.
Available-for-sale marketable securities and investments which incur a decline in value
below cost that is judged to be other than temporary are considered impaired. The Com-
pany considers all available evidence such as market conditions and prices, investee-spe-
cific factors and the duration and extent to which fair value is less than cost in evaluating
potential impairment of its marketable securities and investments. Impairments are recog-
nized in earnings in the period in which the decline in value is judged to be other than tem-
porary and a new cost basis in the marketable security or investment is established.
Securitization transactions – When the Company sells trade receivables in securitiza-
tions, it retains a deferred payment account and servicing obligations, all of which are
retained interests in the securitized receivables. Servicing responsibilities for these trans-
actions remain with the Company, for which it receives an adequate servicing fee. The gain
or loss on the sale of receivables is determined based upon the difference between the total
proceeds received on the sale and the allocated carrying amount of the sold receivables.
The allocated carrying amount is determined based upon the relative fair value of the
receivables sold and the retained interest. Fair values are based upon quoted market prices
whenever available. As such information is generally not available for retained interests,
estimates of fair values are based on the present value of future expected cash flows deter-
mined using management’s best estimate of key assumptions including credit risk and dis-
count rates commensurate with the risks involved. In subsequent periods following securi-
tization, retained interests in securitized receivables are carried at fair value. Changes in
fair value of retained interests are recognized in earnings. In fiscal 2003, the Company did
not enter into securitization transactions.
Inventories – Inventory is valued at the lower of acquisition or production cost or mar-
ket, cost being generally determined on the basis of an average or first-in, first-out method
(FIFO). Production costs comprise direct material and labor and applicable manufacturing
overheads, including depreciation charges. The determination of the market value involves
valuation allowances derived from consumption trends.
Goodwill and Other intangible assets – Intangible assets consist of goodwill and
patents, software, licenses and similar rights. In July 2001, the Financial Accounting Stand-
ards Board (FASB) issued Statement of Financial Accounting Standards (SFAS) 141, Busi-
nessCombinations, and SFAS 142, Goodwill and Other Intangible Assets. Since October 1,
2001, the Company amortizes, consistent with these statements, intangible assets with
finite useful lives on a straight-line basis over their respective estimated useful lives to
their estimated residual values. Estimated useful lives for software, patents, licenses and
other similar rights generally range from three to five years, except for intangible assets
with finite useful lives acquired in business combinations. Goodwill and intangible assets
other than goodwill which are determined to have indefinite useful lives are not amortized,

124 notes to consolidated financial statements
(in millions of €, except where otherwise stated and per share amounts)
but instead tested for impairment at least annually. In connection with the adoption of SFAS
142, the Company was required to reassess the lives of its intangible assets and determined
that none of its intangible assets have indefinite useful lives. The Company evaluates the
recoverability of goodwill using a two-step impairment test approach at the division level.
In the first step, the fair value of the division is compared to its carrying amount including
goodwill. In the case that the fair value of the division is less than its carrying amount, a
second step is performed which compares the fair value of the division’s goodwill to the
carrying amount of its goodwill. The fair value of goodwill is determined based upon the
difference between the fair value of the division and the net of the fair values of the identifi-
able assets and liabilities of the division. If the fair value of goodwill is less than the carry-
ing amount, the difference is recorded as an impairment. See Note 14 and 15 for further
information.
Property, plant and equipment – Property, plant and equipment is valued at acquisi-
tion or manufacturing cost less accumulated depreciation. Depreciation expense is recog-
nized either using the declining balance method until the straight-line method yields
larger expenses or the straight-line method. Costs of construction of certain long-term
assets include capitalized interest, which is amortized over the estimated useful life of the
related asset. The following useful lives are assumed:
Impairment of long-lived assets – The Company reviews long-lived assets for impair-
ment whenever events or changes in circumstances indicate that the carrying amount of an
asset may not be recoverable. Recoverability of assets to be held and used is measured by
the comparison of the carrying amount of the asset to the undiscounted future net cash
flows expected to be generated by the asset. If such assets are considered to be impaired,
the impairment to be recognized is measured by the amount by which the carrying amount
of the assets exceeds the fair value of the assets. Estimated fair value is generally based on
either appraised value or measured by discounted estimated future cash flows (see below
Accounting changes for information regarding the adoption of SFAS 144).
Derivative instruments and hedging activities – In accordance with SFAS 133,
Accounting for Derivative Instruments and Hedging Activities, as amended, derivative
instruments, such as interest rate swap contracts and foreign-currency exchange contracts,
are recognized in the financial statements and measured at fair value regardless of the pur-
pose or intent for holding them. Changes in the fair value of derivative financial instru-
ments are recognized periodically either in income or, in the case of a cash flow hedge, in
shareholders’ equity (as a component of other comprehensive income). Certain derivative
instruments embedded in host contracts are also accounted for separately as derivatives.
See Note 25, Derivative instruments and hedging activities, for a description of the Com-
pany’s risk management strategies and the effect these strategies have on the Consolidated
Financial Statements.
Factory and office buildings 20 to 50 years
Other buildings 5 to 10 years
Technical machinery & equipment 5 to 10 years
Furniture & office equipment generally 5 years
Equipment leased to others generally 3 to 5 years

Not
es t
o co
nso
lidat
edfin
anci
al s
tate
men
ts
notes to consolidated financial statements 125(in millions of €, except where otherwise stated and per share amounts)
Taxes – The Company applies SFAS 109, Accounting for Income Taxes. Under the asset
and liability method of SFAS 109, deferred tax assets and liabilities are recognized for the
future tax consequences attributable to differences between the financial statement carry-
ing amounts of existing assets and liabilities and their respective tax bases. The effect on
deferred tax assets and liabilities of a change in tax laws is recognized in the results of
operations in the period the new laws are enacted. A valuation allowance is recorded to
reduce the carrying amounts of deferred tax assets unless it is more likely than not that
such assets will be realized.
Asset retirement obligations – On October 1, 2002, Siemens adopted SFAS 143,
Accounting for Asset Retirement Obligations, as described below in Accounting changes.
Legal obligations associated with the retirement of long-lived assets that result from the
acquisition, construction, development or normal use of the asset are recognized at fair
value in the period in which the liability is incurred if a reasonable estimate of fair value
can be made. Such estimates are generally determined based upon estimated future cash
flows discounted using a credit-adjusted risk-free interest rate. The fair value of the liability
is added to the carrying amount of the associated asset. The additional carrying amount is
depreciated over the life of the asset. The liability is accreted at the end of each period
through charges to operating expense. If the obligation is settled for other than the carry-
ing amount of the liability, the Company will recognize a gain or loss on settlement.
Issuance of shares by subsidiaries or associated companies – Gains or losses arising
from the issuances of shares by subsidiaries or associated companies, due to changes in the
Company’s proportionate share of the value of the issuer’s equity, are recorded as income
or expense pursuant to U.S. Securities and Exchange Commission Staff Accounting Bulletin
Topic 5H, Accounting for Sales of Stock by a Subsidiary.
Stock-based compensation – Pursuant to SFAS 123, Siemens has elected to apply
Accounting Principles Board (APB) Opinion 25, Accounting for Stock Issued to Employees,
and related Interpretations in accounting for its stock-based compensation plans (see Note
27). The following table illustrates recorded compensation expense and the effect on net
income and earnings per share if the Company had adopted the fair value based account-
ing method prescribed by SFAS 123:
Year endedSeptember 30,
2003 2002
Net income
As reported 2,445 2,597
Plus: Stock-based employee compensation expense included
in reported net income, net of taxes 28 46
Less: Stock-based employee compensation expense determined
under fair value based accounting method, net of taxes (147) (144)
Pro forma 2,326 2,499
Basic earnings per share
As reported 2.75 2.92
Pro forma 2.61 2.81
Diluted earnings per share
As reported 2.75 2.92
Pro forma 2.61 2.81

126 notes to consolidated financial statements
(in millions of €, except where otherwise stated and per share amounts)
Use of estimates – The preparation of financial statements requires management to
make estimates and assumptions that affect the reported amounts of assets and liabilities
and disclosure of contingent amounts at the date of the financial statements and reported
amounts of revenues and expenses during the reporting period. Actual results could differ
from those estimates.
Reclassification – The presentation of certain prior year information has been reclassi-
fied to conform to the current year presentation.
Accounting changes – On October 1, 2002, Siemens adopted SFAS 143, Accounting for
Asset Retirement Obligations, as described above (see Asset retirement obligations). As a
result of adopting SFAS 143, income of €59 (€36 net of income taxes) has been recorded as
a Cumulative effect of change in accounting principle, primarily in connection with the
Company’s remediation and environmental accrual related to the decommissioning of the
facilities for the production of uranium and mixed-oxide fuel elements in Hanau, Germany
(Hanau facilities) as well as the facilities in Karlstein, Germany (Karlstein facilities). See
Note 22 for further information.
On October 1, 2002, the Company adopted SFAS 144, Accounting for the Impairment or
Disposal of Long-Lived Assets, which supersedes SFAS 121, Accounting for the Impairment
of Long-Lived Assets and for Long-Lived Assets to Be Disposed Of, and the accounting and
reporting provisions of APB Opinion 30, Reporting the Results of Operations – Reporting
the Effects of Disposal of a Segment of a Business, and Extraordinary, Unusual and Infre-
quently Occurring Events and Transactions, for the disposal of a segment of a business.
This statement establishes a single accounting model based on SFAS 121 for long-lived
assets to be disposed of by sale, including discontinued operations. Major changes include
additional criteria for long-lived assets to qualify as “held for sale” and the requirement
that long-lived assets to be disposed of other than by sale be classified as held and used
until the disposal transaction occurs. SFAS 144 retains the current requirement to sepa-
rately report discontinued operations but expands that reporting to include a component of
an entity (rather than only a segment of a business) that either has been disposed of or is
classified as held for sale. SFAS 144 requires long-lived assets to be disposed of by sale to be
recorded at the lower of carrying amount or fair value less costs to sell and to cease depreci-
ation. Siemens applied the provisions of SFAS 144 prospectively and the adoption of SFAS
144 did not have a material impact on the Company’s financial statements.
In July 2002, the FASB issued SFAS 146, Accounting for Costs Associated with Exit or Dis-
posal Activities, which nullifies EITF Issue 94-3, Liability Recognition for Certain Employee
Termination Benefits and Other Costs to Exit an Activity (including Certain Costs Incurred
in a Restructuring). SFAS 146 requires that a liability for costs associated with exit or dis-
posal activities first be recognized when the liability is irrevocably incurred rather than at
the date of management’s commitment to an exit or disposal plan. Examples of costs cov-
ered by the standard include certain employee severance costs, contract termination costs
and costs to consolidate or close facilities or relocate employees. In addition, SFAS 146 stip-
ulates that the liability be measured at fair value and adjusted for changes in estimated cash
flows. The provisions of the new standard are effective prospectively for exit or disposal
activities initiated after December 31, 2002. Siemens applied the provisions of SFAS 146
prospectively and the adoption of SFAS 146 did not have a material impact on the Com-
pany’s financial statements.

Not
es t
o co
nso
lidat
edfin
anci
al s
tate
men
ts
notes to consolidated financial statements 127(in millions of €, except where otherwise stated and per share amounts)
In November 2002, the FASB issued FASB Interpretation (FIN) 45, Guarantor’s Account-
ing and Disclosure Requirements for Guarantees, Including Indirect Guarantees of Indebt-
edness of Others, which addresses the disclosure to be made by a guarantor in its interim
and annual financial statements about its obligation under guarantees. FIN 45 also
requires the guarantor to recognize a liability for the non-contingent component of the
guarantee, that is, the obligation to stand ready to perform in the event that specified trig-
gering events or conditions occur. The initial measurement of this liability is the fair value
of the guarantee at inception. The Company has adopted the disclosure requirements of
FIN 45 (see Note 24 for information about guarantees and for information related to prod-
uct warranties, see above Product-related expenses and contract loss provisions and Note
18) and has applied the recognition and measurement provisions for all guarantees entered
into or modified after December 31, 2002.
In November 2002, the EITF reached a final consensus on EITF Issue 00-21, Revenue
Arrangements with Multiple Deliverables. This Issue addresses certain aspects of the
accounting by a vendor for arrangements under which it will perform multiple revenue-
generating activities, specifically how to determine whether an arrangement involving
multiple deliverables contains more than one unit of accounting. The Issue also addresses
how arrangement consideration should be measured and allocated to the separate units of
accounting in the arrangement. This issue is effective for revenue arrangements entered
into in fiscal periods beginning after June 15, 2003. The adoption of EITF Issue 00-21 did
not have a material impact on the Company’s financial statements.
In January 2003, the FASB issued FIN 46, Consolidation of Variable Interest Entities,
which interprets Accounting Research Bulletin (ARB) 51, Consolidated Financial
Statements. FIN 46 clarifies the application of ARB 51 with respect to the consolidation of
certain entities (variable interest entities – “VIE’s”) to which the usual condition for consoli-
dation described in ARB 51 does not apply because the controlling financial interest in VIE’s
may be achieved through arrangements that do not involve voting interests. In addition,
FIN 46 requires the primary beneficiary of VIE’s and the holder of a significant variable
interest in VIE’s to disclose certain information relating to their involvement with the VIE’s.
The provisions of FIN 46 apply immediately to VIE’s created after January 31, 2003, and to
VIE’s in which an enterprise obtains an interest after that date. On October 9, 2003, the
FASB issued FASB Staff Position (FSP) FIN 46-6, Effective Date of FASB’s Interpretation No.
46, Consolidation of Variable Interest Entities, which defers the effective date for initial
application of FIN 46 for VIE’s created before February 1, 2003 to December 31, 2003. Follow-
ing FSP FIN 46-6, the Company decided to adopt FIN 46 as of December 31, 2003 for those
VIE’s created before February 1, 2003. The Company holds variable interests in various VIE’s
which are not significant either individually or in the aggregate. The impact of consolidat-
ing certain of these VIE’s on the Company’s financial statements will not be material.

128 notes to consolidated financial statements
(in millions of €, except where otherwise stated and per share amounts)
3 Acquisitions and dispositions
Acquisitions
During the years ended September 30, 2003 and 2002, the Company completed a number
of acquisitions. These acquisitions have been accounted for under the purchase method
and have been included in the Company’s Consolidated Financial Statements since the date
of acquisitions.
In connection with the acquisition of Atecs Mannesmann AG (Atecs) in April 2001,
Siemens was granted an option to acquire Mannesmann AG’s remaining interest in Atecs,
either at the option of Mannesmann during the period from the date of closing through
September 30, 2002, or at the option of Siemens during the period from April 1, 2002
through December 31, 2003. In January 2002, the Company completed its acquisition of
Atecs through Vodafone AG’s exercise of its option to sell its 50% minus two shares stake in
Atecs to Siemens for cash consideration of approximately €3.7 billion. The purchase price
was paid on March 1, 2002.
In July 2003, Siemens completed the acquisition of the industrial turbine business of
Alstom S.A., Paris (Alstom), which was structured in two transactions. In the first transac-
tion in April 2003, Power Generation (PG) acquired the small gas turbine business of
Alstom. In the second transaction in July 2003, PG acquired the medium-sized gas and
steam turbine businesses of Alstom. Both transactions resulted in an aggregate net pur-
chase price of €929, net of cash acquired. The Company has not finalized the purchase price
allocation for these acquisitions. Based on the preliminary purchase price allocation,
approximately €195 was allocated to intellectual property rights, €129 to customer relation-
ships and €393 to goodwill.
The Company made certain other acquisitions during the years ended September 30,
2003 and 2002 and accounted for by the purchase method of accounting, which did not
have a significant effect on the Consolidated Financial Statements.
Dispositions
On November 20, 2001, the Company sold Mannesmann Sachs AG to ZF Friedrichshafen
AG. The disposition resulted in net proceeds of €716. This business had been accounted for
as an asset held-for-sale and no gain or loss was recorded in connection with the disposi-
tion.
On December 5, 2001, Siemens entered into a transaction as described below under
Deconsolidation of Infineon, the effect of which is that it no longer has majority voting
interest in Infineon and from such date no longer included the assets and liabilities and
results of operations of Infineon in its Consolidated Financial Statements but instead
accounts for its interest in Infineon using the equity method.
In January 2002, Siemens exercised its option to sell its remaining interest in Rexroth, a
wholly-owned subsidiary of Atecs classified as held-for-sale, to Bosch for an adjusted equity
value of €2.7 billion less proceeds from businesses already sold to Bosch. This business had
been accounted for as an asset held-for-sale and no gain or loss was recorded in connection
with the disposition.

Not
es t
o co
nso
lidat
edfin
anci
al s
tate
men
ts
notes to consolidated financial statements 129(in millions of €, except where otherwise stated and per share amounts)
On July 1, 2002, Siemens completed the sale of Unisphere Networks, Inc. to Juniper Net-
works, Inc. (Juniper) in exchange for €376 cash and 35.8 million shares of Juniper stock. At
closing, the value of the Juniper shares received was €208. The sale transaction resulted in
a pretax gain of €421. Included in the gain calculation is €179, representing the carrying
amount of Unisphere’s goodwill (see Note 14). As a result of the transaction Siemens
received 9.7% of Juniper common shares. The Juniper shares held by Siemens are subject to
certain restriction provisions. Accordingly, Siemens may only sell 3 million of Juniper com-
mon shares during each of the first three quarters beginning 3 months subsequent to clos-
ing and afterwards 6 million of Juniper common shares each quarter thereafter (see Note 13
for further information regarding the Company’s investment in Juniper shares).
In September 2002, Siemens completed the sale of several business activities to
Kohlberg Kravis Roberts & Co. L.P. (KKR). KKR took over units that had belonged to the for-
mer Atecs Mannesmann Group: Mannesmann Plastics Machinery, the gas spring producer
Stabilus, Demag Cranes & Components and the harbor crane unit Gottwald. As part of the
package, Siemens also sold the metering business of its Power Transmission and Distribu-
tion Group, the Ceramics division of its Power Generation Group, and Network Systems, a
regional service business belonging to its Information and Communication Networks
Group. The business activities were placed in a holding company, called Demag Holding
s.a.r.l (Luxembourg). The gross purchase price totaled €1.69 billion. KKR holds an 81% and
Siemens a 19% stake in the holding company. In addition to this 19% equity stake in the
holding company Siemens received a vendor note of €215 and another note receivable of
€38. The purchaser assumed net debt of €372, and Siemens received net cash proceeds of
approximately €1.0 billion. The transaction resulted in a pretax gain of €21. Siemens will
use cost accounting for its 19% interest in Demag Holding. The governing structure of
Demag Holding provides for KKR to have absolute control over virtually all operating, finan-
cial, and other management decisions, while Siemens ownership is proportionate to the
investment and only passive in nature.
In June 2003, Med contributed its Patient Care System and Electro Cardiography System
businesses into a joint venture with Draegerwerk AG in exchange for a 35 percent interest in
the joint venture Draeger Medical AG & Co. KGaA (Draeger Medical), headquartered in Lue-
beck, Germany. In connection with the contribution, Siemens realized a pretax gain of €63.
The contribution agreement obligates Siemens to contribute to Draeger Medical the net
proceeds from the sale of its Life Support Systems business. By consenting to this sale,
Siemens and Draegerwerk AG received approval for the joint venture transaction by
antitrust authorities. In August 2003, Siemens signed a contract toward the sale of its Life
Support Systems business to Getinge AB, Sweden. The transaction closed in October 2003.
Siemens’ investment in Draeger Medical is accounted for using the equity method.

130 notes to consolidated financial statements
(in millions of €, except where otherwise stated and per share amounts)
Deconsolidation of Infineon
As of December 5, 2001, Siemens deconsolidated Infineon. The deconsolidation followed a
series of other transactions pursuant to which the Company reduced its ownership interest
in Infineon from approximately 71% at the beginning of fiscal 2001 to 47.1% at December 31,
2001.
In April 2001, Siemens irrevocably transferred 93,825,225 Infineon shares to its domes-
tic pension trust. A pretax gain of €3,459 (after-tax gain of €2,519) was realized on the non-
cash contribution of these shares based upon the market price of Infineon shares at the
date of transfer. The business purpose of the contribution of Infineon shares to this pen-
sion trust was to shore up an already existing under-funded position in the pension trust
that was to increase substantially during the third quarter of fiscal 2001 following the Com-
pany’s acquisition of Atecs. As a result of the transfer, the Company reduced its ownership
interest in Infineon by approximately 15% of Infineon’s then outstanding share capital.
In July 2001, Infineon completed a capital increase by way of a public offering of 60 mil-
lion of its shares for which Siemens realized a pretax gain of €484.
In August 2001, Infineon issued an additional 6.4 million shares of new stock in connec-
tion with the acquisition of Catamaran Communications Inc. As a result of this transaction,
the Company realized a pretax gain of €83. The acquisition of Catamaran Communications
Inc. was accounted for using the purchase method of accounting with a purchase price of
€252 resulting in goodwill of €179 and a charge for acquired IPR&D of €57.
As a result of Siemens’ irrevocable transfer of Infineon shares into the domestic pension
trust, the follow-on offering of 60 million shares by Infineon and additional dilution result-
ing from acquisitions made by Infineon using its shares, Siemens’ ownership interest in
Infineon decreased to approximately 50.4% as of September 30, 2001.
During the first quarter of fiscal 2002, the Company sold 23.1 million shares of Infineon
in open market transactions resulting in net proceeds of €556 and reducing its ownership
interest to its December 31, 2001 level of 47.1%. As a result of these sales Siemens realized a
tax-free gain of €332.
On December 5, 2001, the Company transferred 200 million Infineon shares or approxi-
mately 28.9% of Infineon’s share capital to an irrevocable, non-voting trust under a trust
agreement. The trustee is not related to the Company or any of its affiliates. Under the
terms of the trust agreement, the trustee has legal title to the shares held in trust and the
Company has irrevocably relinquished all voting rights in the shares. However, the trustee
is not permitted to vote any Infineon shares it holds in trust under the agreement. The
Company continues to be entitled to all the benefits of economic ownership of the shares
held in trust, including the right to receive cash dividends and other cash distributions,
which the trustee has agreed to pay to the Company promptly upon receipt. The trustee is
not entitled to sell or encumber the shares held in trust except at the Company’s direction,
but the Company has agreed not to direct the sale of any such shares to itself, any affiliate,
any vehicle established by the Company or any of its affiliates, or to Infineon. The trustee
has agreed to pay to the Company any proceeds resulting from a permitted sale. Under the
arrangement, the trustee holds the shares in trust for the benefit of the beneficiaries under
the trust agreement, which include the Company as trustor and third party shareholders of

Not
es t
o co
nso
lidat
edfin
anci
al s
tate
men
ts
notes to consolidated financial statements 131(in millions of €, except where otherwise stated and per share amounts)
Infineon. The trust agreement will terminate only when the Company and its affiliates, on a
consolidated basis, have held, directly or indirectly, less than 50% of the voting share capi-
tal of Infineon, including the shares held in trust by the trustee, for a period of two consec-
utive years. Upon termination, any shares held by the trustee would revert to the Company
and the Company would be again entitled to vote these shares. Certain provisions of the
trust agreement, including those relating to voting and transfer of the shares held in trust,
may not be amended without the approval of Infineon’s shareholders.
Under the terms of a related standstill agreement, the Company has agreed with the
trustee that it will not, and it will not permit its affiliates to, directly or indirectly, acquire
or offer to acquire ownership of Infineon shares, or securities convertible into Infineon
shares, or any other Infineon voting securities or securities convertible into Infineon vot-
ing securities. The Company has also agreed that neither it nor any of its affiliates will pro-
cure for itself any third party’s voting rights in respect of Infineon shares. These provisions
terminate on the termination of the trust agreement.
The Company’s irrevocable transfer of Infineon shares to the non-voting trust on
December 5, 2001, reduced the Company’s voting interest in Infineon by an amount corre-
sponding to the number of shares transferred. Accordingly, while the Company’s owner-
ship interest at December 31, 2001 was 47.1%, its voting interest based on total outstanding
shares of Infineon was 18.2%. Such voting interest, when combined with the voting interest
in Infineon shares of 13.2% held by the Company’s domestic pension trust, represented a
combined voting interest of 31.4% as of December 31, 2001. Since shareholders of Infineon
other than the Company and the pension trust owned approximately 39.7% of Infineon’s
share capital as of December 31, 2001, they control a majority of the shares that may be
voted at any Infineon shareholders’ meeting. The effect of the transfer of Infineon shares
into the non-voting trust resulted in shareholders in Infineon other than the Company and
the pension trust having a disproportionate voting interest (see Note 13).
As the Company no longer has a majority voting interest in Infineon, it has from Decem-
ber 5, 2001 no longer included the assets and liabilities and results of operations of
Infineon in its Consolidated Financial Statements and instead accounts for its ownership
interest in Infineon using the equity method. Under the equity method of accounting, the
Company’s net investment in Infineon is included within Long-term investments in the
Consolidated Balance Sheets, and its share of the net income or losses of Infineon is
included as part of Income (loss) from investments in other companies, net in the Consoli-
dated Statements of Income.
After the deconsolidation, in January 2002, the Company sold an additional 40 million
shares of Infineon in open market transactions resulting in net proceeds of €966. As a
result of these sales, Siemens realized a tax-free gain of €604 and its ownership interest in
Infineon decreased to approximately 39.7% (see Note 13).
Siemens’ net income for the fiscal years ended September 30, 2003 and 2002, includes
the Company’s share of the loss of Infineon of €170 and €453, respectively.

132 notes to consolidated financial statements
(in millions of €, except where otherwise stated and per share amounts)
4 Other operating income (expense), net
For a description of significant items included in Gains on sales and disposals of busi-
nesses, net, see Note 3.
As described in Note 2, the Company ceased to amortize goodwill at the beginning of
fiscal 2002 due to the adoption of SFAS 142. Impairment of goodwill in fiscal 2002 relates to
the Access Solutions division of ICN (see Note 14).
The line item Other includes net gains recognized in connection with the cancellation of
orders at PG amounting to €359 for fiscal year ended September 30, 2003.
5 Income (loss) from investments in other companies, net
Share in earnings (losses) from equity investees, net for fiscal 2003 includes negative
€170, representing Siemens’ share in the net loss of Infineon. For fiscal 2002, the equity
share of Infineon’s net loss following the deconsolidation of Infineon in December 2001 was
a negative €338. The Company’s total share of losses in Infineon amounted to €453 for fis-
cal 2002. Gains on sales of investments for fiscal 2002 includes the gains on the sale of two
centrally held investments totaling €133.
Year endedSeptember 30,
2003 2002
Gains on sales and disposals of businesses, net 101 1,455
Gains on sales of property, plant and equipment, net 131 155
Impairment of goodwill – (378)
Other 410 89
642 1,321
Year endedSeptember 30,
2003 2002
Income from investments 42 61
Share in earnings (losses) from equity investees, net 236 (158)
Gains on sales of investments 21 209
Losses on sales of investments (23) (32)
Write-downs on investments (159) (193)
Other 25 (1)
142 (114)

Not
es t
o co
nso
lidat
edfin
anci
al s
tate
men
ts
notes to consolidated financial statements 133(in millions of €, except where otherwise stated and per share amounts)
6 Income from financial assets and marketable securities, net
In fiscal 2003 and 2002, included in Other financial gains (losses), net, are impairments
of certain marketable securities totaling €17 and €24, respectively, where the decline in
value was determined to be other than temporary.
7 Interest income, net
Interest income (expense) of Operations, net includes interest income and expense
related to receivables from customers and payables to suppliers, interest on advances from
customers and advanced financing of customer contracts. Other interest (expense) income,
net includes all other interest amounts primarily consisting of interest relating to debt and
related hedging activities as well as interest income on corporate assets.
8 Income taxes
Income (loss) before income taxes is attributable to the following geographic regions:
Year endedSeptember 30,
2003 2002
Gains (losses) on sales of available-for-sale securities, net (6) 20
Other financial gains (losses), net 67 (2)
61 18
Year endedSeptember 30,
2003 2002
Interest income (expense) of Operations, net 31 94
Other interest (expense) income, net 214 224
Total interest income, net 245 318
Thereof: Interest and similar income 789 1,061
Thereof: Interest and similar expense (544) (743)
Year endedSeptember 30,
2003 2002
Germany 477 (1,033)
Foreign 2,895 4,508
3,372 3,475

Income tax expense (benefit) consists of the following:
For the fiscal year ended September 30, 2003, the Company is subject to German federal
corporation income tax at a base rate of 26.5% plus a solidarity surcharge of 5.5% on federal
corporation taxes payable. As a result, the statutory rate for the year ended September 30,
2003 consists of the federal corporate tax rate, including solidarity surcharge, of 28% and
trade tax net of federal benefit of 13% for a combined rate of 41%.
For the fiscal year ended September 30, 2002, the Company was subject to German fed-
eral corporation tax at a base rate of 25% plus solidarity surcharge of 5.5% on federal corpo-
ration taxes payable. As a result, the statutory rate for the year ended September 30, 2002
consists of the federal corporate tax rate, including solidarity surcharge, of 26.4% and trade
tax net of federal benefit of 12.6%, for a combined rate of 39%.
In September 2002, the German government enacted the Flood Victim Solidarity Law.
Under this legislation, for the Company’s fiscal year ending September 30, 2003 only, the
base rate of German federal corporation taxation is increased from 25% to 26.5%. Included
in the 2002 financial statements is a deferred tax benefit of €7 reflecting the net tax impact
of items which are expected to reverse in fiscal year 2003 at a differentiated rate for 2003.
Income tax expense differs from the amounts computed by applying the German federal
corporation income tax rate, including the solidarity surcharge, plus the after-federal tax
benefit rate for trade taxes on income (41% and 39% for September 2003 and 2002, respec-
tively) as follows:
134 notes to consolidated financial statements
(in millions of €, except where otherwise stated and per share amounts)
Year endedSeptember 30,
2003 2002
Current:
German corporation and trade taxes 149 105
Foreign income taxes 457 935
606 1,040
Deferred:
Germany 16 (454)
Foreign 245 263
261 (191)
Income tax expense, net 867 849
Year endedSeptember 30,
2003 2002
Expected income tax expense 1,383 1,355
Increase (decrease) in income taxes resulting from:
Non-deductible losses and expenses 88 164
Goodwill and acquired in-process research and development 26 162
Tax-free income (158) (18)
Change in tax base of investments 148 –
Gains from sales of business interests (66) (586)
Effect of change in German tax rates – (7)
Foreign tax rate differential (419) (171)
Tax-effect of equity method investments (153) (72)
Other 18 22
Actual income tax expense 867 849

Deferred income tax assets and liabilities on a gross basis are summarized as follows:
As of September 30, 2003, the Company had approximately €5,132 of gross tax loss car-
ryforwards. Of the total, €4,210 tax loss carryforwards have unlimited carryforward periods
and €922 expire over the periods to 2021.
Not
es t
o co
nso
lidat
edfin
anci
al s
tate
men
ts
notes to consolidated financial statements 135(in millions of €, except where otherwise stated and per share amounts)
September 30,
2003 2002
Current assets:
Inventories 505 227
Receivables 256 623
Accrued liabilities 682 899
Liabilities 324 218
Tax loss and credit carryforward 615 632
Other 406 533
Total current deferred tax assets, before valuation allowances 2,788 3,132
Valuation allowances (82) (158)
Current deferred tax assets 2,706 2,974
Current liabilities:
Inventories 1,482 1,343
Receivables 281 102
Accrued liabilities 423 403
Liabilities 156 392
Other 171 183
Current deferred tax liabilities 2,513 2,423
Current deferred tax assets, net 193 551
Non-current assets:
Intangibles 269 40
Property, plant and equipment 140 232
Retirement plans 1,993 1,511
Accrued liabilities 576 671
Liabilities 363 262
Tax loss and credit carryforward 1,605 1,563
Other 881 972
Total non-current deferred tax assets, before valuation allowances 5,827 5,251
Valuation allowances (559) (389)
Non-current deferred tax assets 5,268 4,862
Non-current liabilities:
Intangibles 252 364
Property, plant and equipment 572 380
Accrued liabilities 259 305
Liabilities 21 273
Other 339 49
Non-current deferred tax liabilities 1,443 1,371
Non-current deferred tax assets, net 3,825 3,491
Total deferred tax assets, net 4,018 4,042

In assessing the realizability of deferred tax assets, management considers whether it
is more likely than not that some portion of the deferred tax asset will not be realized. The
ultimate realization of deferred tax assets is dependent upon the generation of future tax-
able profits during the periods in which those temporary differences and tax loss carryfor-
wards become deductible. Management considers the scheduled reversal of deferred tax
liabilities and projected future taxable income in making this assessment. Based upon the
level of historical taxable income and projections for future taxable income over the periods
which the deferred tax assets are deductible, management believes it is more likely than not
the Company will realize the benefits of these deductible differences, after giving effect to
related valuation allowances.
The Company provides for income taxes or foreign withholding taxes on the cumulative
earnings of foreign subsidiaries when it is determined that such earnings either will be
subject to taxes or are intended to be repatriated. During the years ended September 30,
2003 and 2002, the Company provided for €44 and €17, respectively of deferred tax liabili-
ties associated with declared, but unpaid, foreign dividends. Income taxes on cumulative
earnings of €5,397 of foreign subsidiaries have not been provided for because such earn-
ings will either not be subject to any such taxes or are intended to be indefinitely reinvested
in those operations. It is not practicable to estimate the amount of the unrecognized
deferred tax liabilities for these undistributed foreign earnings.
Including the items charged or credited directly to related components of accumulated
other comprehensive loss and the benefit from changes in accounting principles, the provi-
sion (benefit) for income taxes consists of the following:
9 Marketable securities
As of September 30, 2003 and 2002, the Company’s portfolio of marketable securities con-
sisted solely of securities classified as available-for-sale.
The following tables summarize the current portion of the Company’s investment in
available-for-sale securities (for information regarding the non-current available-for-sale
securities, see Note 13):
136 notes to consolidated financial statements
(in millions of €, except where otherwise stated and per share amounts)
September 30, 2003 September 30, 2002
Fair Unrealized Fair UnrealizedCost Value Gain Loss Cost Value Gain Loss
Equity securities 118 194 78 2 238 199 9 48
Debt securities 424 436 12 – 52 53 1 –
Fund securities 20 20 1 1 158 147 1 12
562 650 91 3 448 399 11 60
Year endedSeptember 30,
2003 2002
Provision for income taxes 867 849
Cumulative effect of change in accounting principle 23 –
Shareholders’ equity for other comprehensive income (394) (1,008)
496 (159)

Unrealized gains (losses) on available-for-sale securities included in accumulated other
comprehensive income (loss) (AOCI) are shown net of applicable deferred income taxes,
as well as tax effects which were previously provided but were reversed into earnings upon
the changes in the German tax law enacted in October 2000. Those tax effects amounted to
€134 and will remain in AOCI until such time as the entire portfolio of available-for-sale
securities in Germany is liquidated.
The estimated fair values of investments in debt securities by contractual maturity were
as follows:
Actual maturities may differ from contractual maturities because borrowers have the
right to call or prepay certain obligations.
Proceeds from sales of available-for-sale securities for the years ended September 30,
2003 and 2002 were €61 and €398, respectively. Gross realized gains on sales of available-
for-sale securities for the years ended September 30, 2003 and 2002 were €8 and €29,
respectively. Gross realized losses on sales of available-for-sale securities for the years
ended September 30, 2003 and 2002, were €14 and €9, respectively.
10 Accounts receivable, net
Related companies are those in which Siemens has an ownership interest of less than 20%
and no significant influence over their operating and financial policies.
The valuation allowance for accounts receivable developed as follows:N
otes
to
con
solid
ated
finan
cial
sta
tem
ents
notes to consolidated financial statements 137(in millions of €, except where otherwise stated and per share amounts)
September 30,2003
Due within one year 27
Due after one year through five years 292
Thereafter 117
September 30,
2003 2002
Trade receivables from the sale of goods and services, net 13,094 13,882
Receivables from sales and finance leases, net 1,289 1,146
Receivables from associated and related companies, net 128 202
14,511 15,230
Year endedSeptember 30,
2003 2002
Valuation allowance as of beginning of fiscal year 1,585 1,785
Increase (decrease) in valuation allowances recorded in the income statement in the current period (50) 215
Write-offs charged against the allowance (383) (385)
Recoveries of amounts previously written-off 23 37
Foreign exchange translation adjustment (53) (67)
Valuation allowance as fiscal year-end 1,122 1,585

138 notes to consolidated financial statements
(in millions of €, except where otherwise stated and per share amounts)
Receivables from sales and finance leases
Investments in direct financing and sales-type leases primarily relates to equipment for
information and communication products, data processing and medical engineering
equipment. Investments in direct financing leases also include leases of industrial and con-
sumer products of third party manufacturers. Actual cash flows will vary from contractual
maturities due to future sales of finance receivables, prepayments and write-offs.
Securitization of trade receivables
During fiscal 2002 and 2001, the Company sold a total of €4,553 and €1,848, respectively, in
short-term trade receivable securitizations and retained interests in all trade receivables
sold through the SieFunds structure, which are subordinated to the interests of the in-
vestors. The value of retained interests was subject to credit, prepayment, and interest rate
risks of the trade receivables sold. As of September 30, 2002 and 2001, the fair value of
retained interests in trade receivables sold amounted to €50 and €65, respectively, based on
the following key assumptions used: average days outstanding of 37 and 64, discount rates
of 3.0% and 4.0% per annum and credit risks of 0.5% and 0.7% per annum. At the time
securitizations were completed, those key assumptions were assessed at: average days out-
standing of 43 and 61, discount rates of 3.0% and 4.6% per annum and credit risks of 0.4%
and 0.6% per annum, for the fiscal years 2002 and 2001. In addition, the Company has pro-
vided letters of credit to cover up to an additional 17% of credit losses on receivables origi-
nated by the Company. As of September 30, 2002 and 2001, the letters of credit covered €40
and €127, respectively, of receivables originated by the Company. There were no further
recourses to the Company’s other assets and liabilities for failure of debtors to pay when
due.
In fiscal years 2002 and 2001, the Company recognized pretax losses on securitization
transactions of €22 and €13, respectively. Cash received from securitization trusts totaled
approximately €4,156 and €1,673, in fiscal years 2002 and 2001. Cash flows resulting from
retained interests amounted to €365 and €95, in fiscal periods ended September 30, 2002
and 2001.
September 30,2003
2004 1,424
2005 998
2006 670
2007 410
2008 229
Thereafter 195
Minimum future lease payments 3,926
Less: Unearned income (517)
Less: Allowance for doubtful accounts (126)
Plus: Unguaranteed residual values 162
Net investment in lease receivables 3,445
Less: Long-term portion (2,156)
Receivables from sales and finance leases, current 1,289

Not
es t
o co
nso
lidat
edfin
anci
al s
tate
men
ts
notes to consolidated financial statements 139(in millions of €, except where otherwise stated and per share amounts)
11 Inventories, net
12 Other current assets
13 Long-term investments
Investments in associated companies generally represent non-controlling interests in
entities of 20% to 50% accounted for using the equity method of accounting. During fiscal
2003, Investments in associated companies increased mainly due to the Company’s invest-
ment in various equity and debt security funds. As of September 30, 2003 and 2002, this
line item included €2,249 and €2,441, respectively, related to the Company’s equity invest-
ment in Infineon. The market value of the Company’s investment in Infineon (based upon
the Infineon share price) at the end of September 30, 2003 and 2002, was €3,212 and
€1,606, respectively. Until December 2001, Infineon was included in the Consolidated
Financial Statements of Siemens AG. The Company entered into transactions as described
in Note 3 under Deconsolidation of Infineon, the effect of which is that Siemens no longer
has majority voting interest and therefore, as of December 5, 2001, the assets and liabilities
and results of operations of Infineon are no longer included in its Consolidated Financial
Statements but the Company instead accounts for its interest in Infineon using the equity
method. In January 2002, the Company sold an additional 40 million shares in open market
transactions. As a result of these series of transactions and additional dilution resulting
from acquisitions made by Infineon using its shares, Siemens ownership interest and vot-
ing interest in Infineon was 39.7% and 33.3%, respectively, as of September 30, 2002. As a
September 30,
2003 2002
Raw materials and supplies 2,118 2,430
Work in process 2,066 1,674
Costs and earnings in excess of billings on uncompleted contracts 5,787 5,572
Finished goods and products held for resale 2,770 3,385
Advances to suppliers 795 544
13,536 13,605
Advance payments received (3,170) (2,933)
10,366 10,672
September 30,
2003 2002
Taxes receivable 1,100 1,320
Loans receivable 707 905
Other receivables from associated and related companies 337 466
Other 2,606 2,662
4,750 5,353
September 30,
2003 2002
Investment in associated companies 4,834 4,120
Miscellaneous investments 1,158 972
5,992 5,092

140 notes to consolidated financial statements
(in millions of €, except where otherwise stated and per share amounts)
result of the Siemens German Pension Trust’s sale of its remaining Infineon shares during
the first half of fiscal 2003, Siemens voting interest in Infineon decreased to 16.6% as of
September 30, 2003 (see table below).
Miscellaneous investments generally include interests in other companies for which
there is no readily determinable market value and which are recorded at the lower of cost or
net realizable value. As of September 30, 2003, in this line item Siemens reported €308 of
the fair value related to its investment in Juniper representing the Company’s total non-cur-
rent portion of available-for-sale securities (cost amounted to €104 and unrealized gains
to €204).
14 Goodwill
The table below presents the carrying amount of goodwill by Group:
September 30, 2003 September 30, 2002shares in shares inthousands thousands
Siemens’ ownership interest 39.7% 286,292 39.7% 286,292
Less: Non-voting trust’s interest 200,000 200,000
Siemens’ voting interest 16.6%* 86,292 16.6%* 86,292
Siemens German Pension Trust’s voting interest – – 16.7%* 87,053
Siemens’ total voting interest 16.6%* 86,292 33.3%* 173,345
* Based upon total Infineon shares outstanding at September 30, 2003 and 2002, respectively, less 200 millionshares contributed to the non-voting trust (see Note 3). As of September 30, 2003 and 2002, Siemens’ totalvoting interest is 12.0% and 24.0%, respectively, based on the total shares outstanding.
Translationadjustment Acqui- Dis-
10/1/02 and other sitions positions 9/30/03
Operations
Information and Communication Networks (ICN) 265 (2) 4 18 249
Information and Communication Mobile (ICM) 93 – 3 – 96
Siemens Business Services (SBS) 230 (23) 74 – 281
Automation and Drives (A&D) 281 (1) 49 1 328
Industrial Solutions and Services (I&S) 92 (26) 1 – 67
Siemens Dematic (SD) 581 (2) – 15 564
Siemens Building Technologies (SBT) 442 (13) 1 1 429
Power Generation (PG) 598 (64) 409 – 943
Power Transmission and Distribution (PTD) 148 (10) 3 – 141
Transportation Systems (TS) 115 – – – 115
Siemens VDO Automotive (SV) 1,528 (1) 2 5 1,524
Medical Solutions (Med) 1,898 (284) 19 31 1,602
Osram 98 (16) – – 82
Financing and Real Estate
Siemens Financial Services (SFS) 90 (10) – – 80
Siemens Real Estate (SRE) – – – – –
Siemens worldwide 6,459 (452) 565 71 6,501

Not
es t
o co
nso
lidat
edfin
anci
al s
tate
men
ts
notes to consolidated financial statements 141(in millions of €, except where otherwise stated and per share amounts)
In fiscal 2002, as a result of the adoption of SFAS 142, €348 of net intangibles relating to
customer base (€287 at PG and €61 at Med) were reclassified from Other intangible assets,
net to Goodwill. In addition, Goodwill increased by €306 resulting from minor acquisitions
and purchase price allocation adjustments totaling €228 at ICN, SD, PG, SV and Med prima-
rily related to Atecs and Acuson. Retirements totaled €492 mainly as a consequence of the
deconsolidation of Infineon and the Company's sale of Unisphere Networks at ICN (see
Note 3). In connection with its annual goodwill impairment tests required by SFAS 142, the
Company determined that the goodwill at its Access Solutions division of ICN, mainly origi-
nating from the acquisition of Efficient, was impaired. As a result of significant declines in
demand in the telecommunications equipment market, management recorded a goodwill
impairment charge of €378 in the fourth quarter of 2002. Fair value was determined using
a traditional discounted cash flows approach.
15 Other intangible assets, net
Amortization expense for the year ended September 30, 2002 amounted to €618.
The estimated amortization expense of other intangible assets for the next five fiscal
years is as follows:
Accu- Depre-Trans- Accu- Net book mulated- Net book ciationlation mulated value depre- value- duringadjust- Addi- Retire- depre- as of ciation as of fiscal
10/1/02 ment tions ments 9/30/03 ciation 9/30/03 10/1/02 10/1/02 year
Software 1,453 (104) 444 134 1,659 664 995 444 1,009 354
Patents, licenses andsimilar rights 2,485 (160) 441 243 2,523 1,160 1,363 1,110 1,375 334
Other intangible assets 3,938 (264) 885 377 4,182 1,824 2,358 1,554 2,384 688
Fiscal year
2004 573
2005 419
2006 270
2007 219
2008 165

142 notes to consolidated financial statements
(in millions of €, except where otherwise stated and per share amounts)
16 Property, plant and equipment, net
17 Other assets
18 Accrued liabilities
Employee related costs primarily include accruals for vacation pay, bonuses, accrued
overtime and service anniversary awards and the current portion of accruals for pension
plans and similar commitments, as well as provisions for severance payments.
Net Accu- Net Depre-Trans- Re- Accu- book mulated book ciationlation classi- mulated value depre- value duringadjust- Addi- fica- Retire- depre- as of ciation as of fiscal
10/1/02 ment tions tions ments 9/30/03 ciation 9/30/03 10/1/02 10/1/02 year
Land and buildings 9,476 (305) 888 177 820 9,416 4,586 4,830 4,522 4,954 300
Technical machineryand equipment 8,578 (410) 786 231 736 8,449 5,930 2,519 6,061 2,517 612
Furniture and officeequipment 10,294 (364) 1,045 139 1,492 9,622 7,544 2,078 7,762 2,532 1,323
Equipment leasedto others 1,701 (95) 226 (5) 174 1,653 945 708 862 839 250
Advances to suppliersand construction in progress 912 (42) 438 (542) 143 623 2 621 12 900 –
Property, plant andequipment 30,961 (1,216) 3,383 – 3,365 29,763 19,007 10,756 19,219 11,742 2,485
September 30,
2003 2002
Long-term portion of receivables from sales and finance leases (see Note 10) 2,156 2,320
Prepaid pension assets 52 197
Long-term loans receivable 531 557
Other 1,411 1,440
4,150 4,514
September 30,
2003 2002
Employee related costs 2,366 2,637
Income and other taxes 1,234 1,574
Product warranties 1,830 1,634
Accrued losses on uncompleted contracts 987 864
Other 2,467 2,899
8,884 9,608

Not
es t
o co
nso
lidat
edfin
anci
al s
tate
men
ts
notes to consolidated financial statements 143(in millions of €, except where otherwise stated and per share amounts)
The current and non-current accruals for product warranties developed as follows:
19 Other current liabilities
20 Debt
Year endedSeptember 30,2003
Accrual as of beginning of period 2,094
Amount charged to expense in current period (additions) 1,159
Reduction due to payments in cash or in kind (usage) (605)
Foreign exchange translation adjustment (77)
Other changes related to existing warranties (218)
Accrual as of end of period 2,353
September 30,
2003 2002
Billings in excess of costs and estimated earnings onuncompleted contracts and related advances 4,755 6,054
Payroll and social security taxes 2,493 2,305
Sales and other taxes 944 941
Bonus obligations 1,099 1,073
Liabilities to associated and related companies 428 372
Deferred income 633 786
Accrued interest 140 151
Other liabilities 1,633 2,009
12,125 13,691
September 30,
2003 2002
Short-term
Notes and bonds 436 322
Loans from banks 777 1,461
Other financial indebtedness 494 280
Obligations under capital leases 38 40
Short-term debt and current maturities of long-term debt 1,745 2,103
Long-term
Notes and bonds (maturing 2004 – 2011) 9,997 9,315
Loans from banks (maturing 2004 – 2011) 287 152
Other financial indebtedness (maturing 2004 – 2015) 904 527
Obligations under capital leases 245 249
Long-term debt 11,433 10,243
13,178 12,346
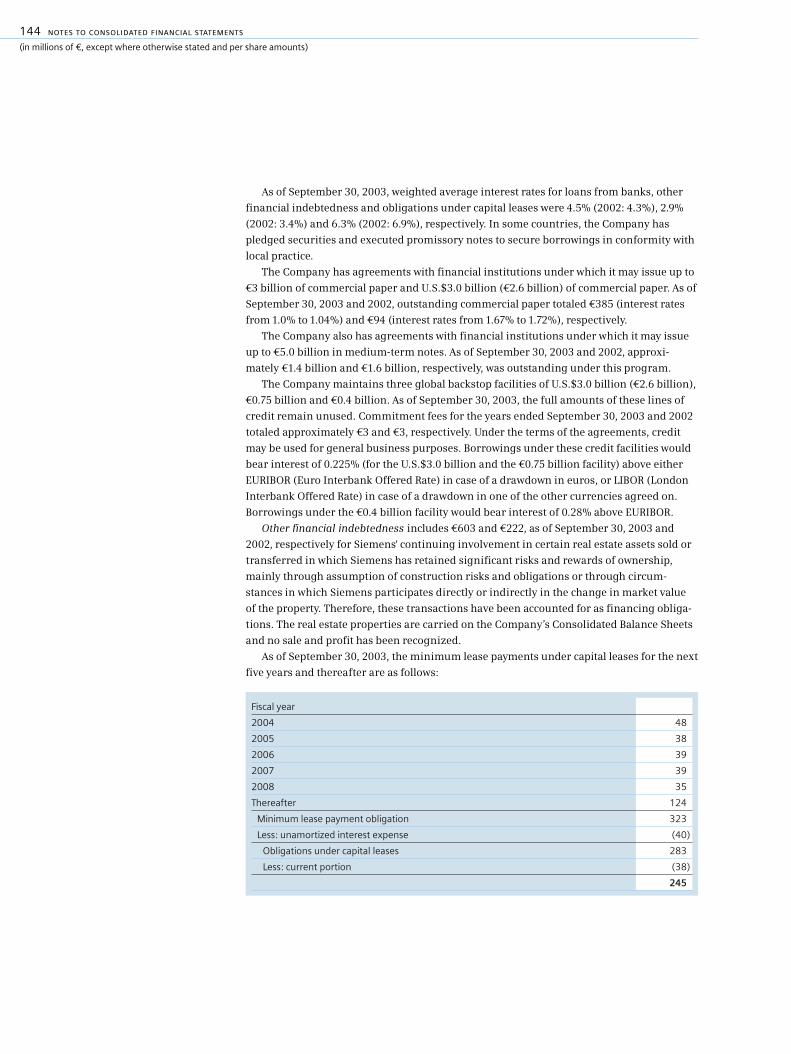
144 notes to consolidated financial statements
(in millions of €, except where otherwise stated and per share amounts)
As of September 30, 2003, weighted average interest rates for loans from banks, other
financial indebtedness and obligations under capital leases were 4.5% (2002: 4.3%), 2.9%
(2002: 3.4%) and 6.3% (2002: 6.9%), respectively. In some countries, the Company has
pledged securities and executed promissory notes to secure borrowings in conformity with
local practice.
The Company has agreements with financial institutions under which it may issue up to
€3 billion of commercial paper and U.S.$3.0 billion (€2.6 billion) of commercial paper. As of
September 30, 2003 and 2002, outstanding commercial paper totaled €385 (interest rates
from 1.0% to 1.04%) and €94 (interest rates from 1.67% to 1.72%), respectively.
The Company also has agreements with financial institutions under which it may issue
up to €5.0 billion in medium-term notes. As of September 30, 2003 and 2002, approxi-
mately €1.4 billion and €1.6 billion, respectively, was outstanding under this program.
The Company maintains three global backstop facilities of U.S.$3.0 billion (€2.6 billion),
€0.75 billion and €0.4 billion. As of September 30, 2003, the full amounts of these lines of
credit remain unused. Commitment fees for the years ended September 30, 2003 and 2002
totaled approximately €3 and €3, respectively. Under the terms of the agreements, credit
may be used for general business purposes. Borrowings under these credit facilities would
bear interest of 0.225% (for the U.S.$3.0 billion and the €0.75 billion facility) above either
EURIBOR (Euro Interbank Offered Rate) in case of a drawdown in euros, or LIBOR (London
Interbank Offered Rate) in case of a drawdown in one of the other currencies agreed on.
Borrowings under the €0.4 billion facility would bear interest of 0.28% above EURIBOR.
Other financial indebtedness includes €603 and €222, as of September 30, 2003 and
2002, respectively for Siemens' continuing involvement in certain real estate assets sold or
transferred in which Siemens has retained significant risks and rewards of ownership,
mainly through assumption of construction risks and obligations or through circum-
stances in which Siemens participates directly or indirectly in the change in market value
of the property. Therefore, these transactions have been accounted for as financing obliga-
tions. The real estate properties are carried on the Company’s Consolidated Balance Sheets
and no sale and profit has been recognized.
As of September 30, 2003, the minimum lease payments under capital leases for the next
five years and thereafter are as follows:
Fiscal year
2004 48
2005 38
2006 39
2007 39
2008 35
Thereafter 124
Minimum lease payment obligation 323
Less: unamortized interest expense (40)
Obligations under capital leases 283
Less: current portion (38)
245

Not
es t
o co
nso
lidat
edfin
anci
al s
tate
men
ts
notes to consolidated financial statements 145(in millions of €, except where otherwise stated and per share amounts)
As of September 30, 2003, the aggregate amounts of indebtedness maturing during the
next five years and thereafter are as follows (excluding capital leases which are disclosed
separately):
Details of the Company’s medium-term notes and bonds are as follows:
In June 2003, the Company issued €2.5 billion of convertible notes through its wholly
owned Dutch subsidiary, Siemens Finance B.V., which are fully and unconditionally guaran-
teed by Siemens AG. The convertible notes have a 1.375% coupon and are convertible into
approximately 44.5 million shares of Siemens AG at a conversion price of €56.1681 per
share, which is subject to change under certain circumstances. The conversion right is con-
tingently exercisable by the holders upon the occurrence of one of several conditions,
including, upon the Company’s share price having exceeded 110% of the conversion price
on at least 20 trading days in a period of 30 consecutive trading days ending on the last
trading day of any calendar quarter. The Company may, at any time from June 18, 2007,
redeem the notes outstanding at their principal amount together with interest accrued
thereon, if Siemens’ share price exceeds 130% of the conversion price on any 15 of 30 con-
secutive trading days before notice of early redemption. Unless previously redeemed, con-
verted or repurchased and cancelled, the notes mature on June 4, 2010.
September 30, 2003 September 30, 2002Currency Currency(notional amount) €* (notional amount) €*
3.25% 1997/2002 Swiss franc notes CHF 350 240
2.75% 1993/2003 Swiss franc bonds CHF 100 68
7.5% 1998/2003 Greek drachma € notes GRD 5,000 14
1.11% 2002/2003 U.S.$ LIBOR linked notes USD 200 171
1.22% 2002/2003 U.S.$ LIBOR linked notes USD 50 43 USD 50 51
1.15% 2002/2004 U.S.$ LIBOR linked bonds USD 125 107 USD 125 127
3% 1994/2004 Swiss franc bonds CHF 178 115 CHF 178 122
1.0% 2000/2005 EUR exchangeable notes EUR 1,060 1,094 EUR 2,500 2,554
5.0% 2001/2006 € bonds EUR 2,000 2,109 EUR 2,000 2,078
2.5% 2001/2007 Swiss franc bonds CHF 250 168 CHF 250 174
5.5% 1997/2007 € bonds EUR 991 1,025 EUR 991 1,016
6% 1998/2008 U.S.$ notes USD 970 945 USD 970 1,110
1.375% 2003/2010 € convertible notes EUR 2,500 2,500
5.75% 2001/2011 € bonds EUR 2,000 2,156 EUR 2,000 2,083
10,433 9,637
* Includes adjustments for fair value hedge accounting.
Fiscal year
2004 1,707
2005 1,222
2006 2,269
2007 1,494
2008 998
Thereafter 5,205
12,895

146 notes to consolidated financial statements
(in millions of €, except where otherwise stated and per share amounts)
During fiscal 2003, Siemens repurchased and retired €1,440 of the €2,500 Siemens
Nederland N.V. 1.0% exchangeable notes into shares of Infineon Technologies AG and recog-
nized a gain of €35.
21 Pension plans and similar commitments
Pension benefits provided by Siemens are currently organized primarily through defined
benefit pension plans which cover virtually all of the Company’s domestic employees and
many of the Company’s foreign employees. In order to fund Siemens’ obligations under the
defined benefit plans, the Company’s major pension plans are funded with assets in segre-
gated pension entities. Furthermore, there are other postretirement benefits, which prima-
rily comprise transition payments to German employees after retirement as well as postre-
tirement health care and life insurance benefits to U.S. employees. These predominantly
unfunded other postretirement benefit plans are qualified as defined benefit plans under
U.S. GAAP.
In addition to the above, the Company has foreign defined contribution plans for pen-
sions and other postretirement benefits. The recognition of a liability is not required
because the obligation of the Company is limited to the payment of the contributions into
these plans.
Accounting for defined benefit plans
Consolidated Balance Sheets
Defined benefit plans determine the entitlements of their beneficiaries. The net present
value of the total fixed benefits for service already rendered is represented by the actuarially
calculated accumulated benefit obligation (ABO).
An employee’s final benefit entitlement at regular retirement age may be higher than
the fixed benefits at the measurement date due to future compensation or benefits in-
creases. The net present value of this ultimate future benefit entitlement for service already
rendered is represented by the projected benefit obligation (PBO), which is actuarially
calculated with consideration for future compensation increases.
The accrued benefit cost is equal to the PBO when the assumptions used to calculate the
PBO such as discount rate, compensation increase rate and pension progression rate are
achieved. In the case of funded plans, the market value of the external assets is offset
against the benefit obligations. The net liability or asset recorded on the balance sheet is
equal to the under- or overfunding of the PBO in this case, when the expected return on
plan assets is subsequently realized.
Differences between actual experience and assumptions made for the discount rate,
compensation increase rate and pension progression rate, as well as the differences
between actual and expected returns on plan assets, result in the asset or liability related to
pension plans being different than the under- or overfunding of the PBO. Such a difference
also occurs when the assumptions used to value the PBO are adjusted at the measurement
date. If the difference is so significant that the current benefit obligation represented by the
ABO (or the amount thereof not funded by plan assets) exceeds the liability recorded on the
balance sheet, such liability must be increased. The unfunded portion of the ABO is
referred to as the Minimum Liability. This increase of the liability, however, is not recog-

Not
es t
o co
nso
lidat
edfin
anci
al s
tate
men
ts
notes to consolidated financial statements 147(in millions of €, except where otherwise stated and per share amounts)
nized as an expense in the income statement, because this U.S. GAAP regulation only serves
as a basis to improve the transparency of the financial statements. The required increase in
the liability is referred to as the additional minimum liability (AML), and its offsetting
adjustment results in the recognition of either an intangible asset or as a separate compo-
nent of shareholders’ equity (accumulated other comprehensive income). The treatment
as a separate component of shareholders’ equity is recorded, net of tax, as a reduction of
shareholders’ equity.
Funded pension plans can result in a prepaid pension asset despite an underfunded
ABO – as in the case of the Siemens German Pension Trust. In the case of an underfunded
ABO, the prepaid pension asset is no longer considered recoverable and must be eliminated
through the recognition of a liability. The AML is recorded and the prepaid pension asset
that is no longer considered recoverable is eliminated with an offsetting adjustment
recorded as described above. This will result in a pension liability totaling the amount of
the underfunded ABO.
The Consolidated Balance Sheets include the following significant components related
to pension plans and similar commitments based upon the situation at September 30:
September 30,
2003 2002
Accumulated other comprehensive income (10,340) (8,863)
thereof principal pension benefit plans (10,192) (8,829)
Less income tax effect 3,950 3,451
thereof principal pension benefit plans 3,901 3,443
Accumulated other comprehensive income, net of income taxes (6,390) (5,412)
thereof principal pension benefit plans (6,291) (5,386)
Accruals for pension plans and similar commitments 5,843 5,326
thereof principal pension benefit plans 3,935 3,557
thereof principal other postretirement benefit plans 1,303 1,431
thereof other 605 338

Consolidated Statements of Income
The recognized expense related to pension plans and similar commitments in the Consoli-
dated Statements of Income is referred to as net periodic pension cost (NPPC) and con-
sists of several separately calculated and presented components. The related minimum
expense is the service cost, which is the actuarial net present value of the part of the PBO
for the service rendered in the respective fiscal year; the interest cost for the expense
derived from the addition of accrued interest on the PBO at the end of the preceding fiscal
year on the basis of the identified discount rate; and the expected return on plan assets
in the case of funded benefit plans.
The presentation on the balance sheet is derived from the sum of: the recognized his-
torical service cost plus interest cost, and in the case of funded pension plans, additionally
the expected return on plan assets and the contributions – the latter of which does not
affect net income. A prepaid pension asset, as in the case of the German Siemens Pension
Trust, results on the basis of this principle when the sum of the recognized expected return
on plan assets, plus the contributions, is greater than the sum of the recognized expense of
service cost and interest cost.
The balance sheet item is equal to the PBO or, respectively, the funded status, as far as
the assumptions used to calculate the PBO such as discount rate, compensation increase
rate and pension progression rate as well as the expected return on plan assets are realized
(as described above). Changes in the selected assumptions and deviations between the
actual experience and the assumptions for discount rate, compensation increase rate and
pension progression rate as well as an actual return different from the expected return lead
to changes of the PBO and the fair value of plan assets which have not yet been previously
recognized in the income statement and thus are not part of the recorded balance sheet
item. These differences – termed unrecognized gains and losses – are calculated and
recorded separately without an immediate impact on the net income. However, U.S. GAAP
provides a corridor of 10% of the higher of PBO or plan assets, whereby an amortization
over the average remaining service period of the active employees is required as a separate
component of the NPPC for the amounts exceeding the 10% corridor.
In the Consolidated Statements of Income, NPPC is allocated among functional costs
(cost of sales, research and development, marketing, selling and general administrative
expense), according to the function of the employee groups accruing benefits.
In the Consolidated Statements of Income, results for the Company’s principal pension
and other postretirement benefits was a loss before income taxes in fiscal 2003 of €1,032
compared to €570 in the previous fiscal year.
148 notes to consolidated financial statements
(in millions of €, except where otherwise stated and per share amounts)

Consolidated Statements of Cash Flow
The Company makes payments directly to the participants in the case of unfunded benefit
plans and the payments are included in net cash provided by (used in) operating activities.
For funded pension plans, the participants are paid by the external pension fund and
accordingly these payments are cash neutral to the Company. In this case, the Company’s
regular funding (service cost) and supplemental cash contributions result in a net cash use
in operating activities.
In the Consolidated Statements of Cash Flow, results for the Company’s principal pen-
sion and other postretirement benefits was a net cash use in operating activities of €1,453
compared to €2,085 in the previous fiscal year. The separately reported supplemental cash
contributions to pension trusts in fiscal 2003 and 2002 of €1,192 and €1,782, respectively,
were included in these amounts.
Principal pension benefits
The principal pension benefit plans cover approximately 498,000 participants, including
246,000 active employees, 86,000 former employees with vested benefits and 166,000
retirees and surviving dependants. Individual benefits are generally based on eligible com-
pensation levels and/or ranking within the Company hierarchy and years of service. Retire-
ment benefits under these plans vary depending on legal, fiscal and economic require-
ments in each country.
The Company’s principal pension benefit plans are explicitly explained in the subse-
quent sections with regard to:
n Pension obligations and funded status (page 150),
n Recognition of an additional minimum liability (AML) (page 152),
n Components of NPPC (page 153),
n Assumptions for the calculation of the PBO and NPPC (page 154),
n Sensitivity analysis (page 156),
n Additional information concerning changes of the AML and the actual returns on plan
assets (page 156),
n Plan assets (page 157),
n Pension plan funding (page 158) and
n Pension benefit payments (page 159).
Not
es t
o co
nso
lidat
edfin
anci
al s
tate
men
ts
notes to consolidated financial statements 149(in millions of €, except where otherwise stated and per share amounts)

150 notes to consolidated financial statements
(in millions of €, except where otherwise stated and per share amounts)
Pension benefits: Pension obligations and funded status
A reconciliation of the funded status of the principal pension benefit plans to the amounts
recognized in the Consolidated Balance Sheets is as follows:
The measurement date for the PBO and fair value of plan assets of the Company’s
domestic pension benefit plans is September 30, and either September 30 or June 30 for the
majority of its foreign plans. For such plans with a measurement date of June 30, the actual
investment return of the plan assets relate to the period from July 1, of the prior fiscal year,
until June 30 of the current fiscal year, and not the year ended September 30.
September 30, 2003 September 30, 2002Total Domestic Foreign Total Domestic Foreign
Fair value of plan assets 15,899 11,016 4,883 14,531 9,676 4,855
Projected benefit obligation (PBO) 20,878 14,156 6,722 19,492 13,331 6,161
Funded status(1) (4,979) (3,140) (1,839) (4,961) (3,655) (1,306)
Siemens German Pension Trust (3,140) (3,655)
U.S. (1,061) (746)
U.K. (458) (299)
Other (320) (261)
Unrecognized net losses(2) 11,295 9,313 1,982 10,424 8,969 1,455
Unrecognized prior service cost 83 – 83 119 – 119
Unrecognized net transition asset (1) – (1) (3) – (3)
Net amount recognized 6,398 6,173 225 5,579 5,314 265
Amounts recognized in the consolidated balance sheets consist of:
Prepaid pension assets 52 – 52 197 – 197
Accrued pension liability (3,935) (2,702) (1,233) (3,557) (3,063) (494)
Intangible assets 89 – 89 110 – 110
Accumulated other comprehensive loss 10,192 8,875 1,317 8,829 8,377 452
Net amount recognized 6,398 6,173 225 5,579 5,314 265
(1) Funded status: The funded status shows the coverage of the PBO by the plan assets as of the measurement date, and, where applicable, fundingsbetween the measurement date and the balance sheet date. The PBO is calculated based on the projected unit credit method and reflects the net pres-ent value as of the measurement date of the accumulated pension entitlements of active employees, former employees with vested rights and ofretirees and their surviving dependents with consideration of future compensation and pension increases. The funded status of the Company’s principalpension plans, amounting to approximately €5 billion, did not change significantly compared to the previous year. Two offsetting factors contributed tothis effect. First, the Company contributed €1,192 in cash to the pension trusts, as well as €377 in real estate as additional supplemental contributions.These supplemental contributions occurred in the first and fourth quarters of fiscal 2003. Offsetting this effect was an increase in the PBO of the plans asa result of a reduction in the discount rates used in measuring the PBO from a weighted average of 6.0% to 5.4% consistent with the general decline ininterest rates worldwide. This increased the PBO by € 1.4 billion.
(2) Unrecognized net losses: The NPPC is determined at the beginning of the relevant measurement period based on assumptions for the discount rate,compensation increase rate and pension progression rate as well as the long-term rate of return on plan assets. The effect of differences between theactual experience and the assumed assumptions and changes in the assumptions are disclosed in the line item Unrecognized net losses. The unrecog-nized net losses amounting to €11,295 are particularly due to the negative development in international capital markets in the years 2001 and 2002.During these two years, an actual loss of €6,444 has been realized while assuming an expected return on pension assets of the principal pension benefitplans of €3,030, thus increasing the unrecognized net losses by €9,474.

Not
es t
o co
nso
lidat
edfin
anci
al s
tate
men
ts
notes to consolidated financial statements 151(in millions of €, except where otherwise stated and per share amounts)
A detailed reconciliation of the changes in the PBO for fiscal 2003 and 2002 and some
additional detail information concerning pension plans is provided in the following table:
The total projected benefit obligation at the end of the fiscal year includes approximately
€8,600 for active employees, €2,200 for former employees with vested benefits and €10,100
for retirees and surviving dependants.
The following table shows the change in plan assets for fiscal year 2003 and 2002, and
some additional detail information concerning pension plans:
September 30, 2003 September 30, 2002Total Domestic Foreign Total Domestic Foreign
Change in plan assets:
Fair value of plan assets at beginning of year 14,531 9,676 4,855 14,761 9,682 5,079
Foreign currency exchange rate changes (546) – (546) (166) – (166)
Actual return on plan assets 648 641 7 (1,187) (713) (474)
Acquisitions and other 413 – 413 171 – 171
Divestments and other (20) – (20) (173) (173) –
Employer contributions (supplemental) 1,569 1,385 184 1,782 1,500 282
Employer contributions (regular) 219 – 219 241 – 241
Plan participants’ contributions 32 – 32 32 – 32
Benefits paid (947) (686) (261) (930) (620) (310)
Fair value of plan assets at end of year 15,899 11,016 4,883 14,531 9,676 4,855
Siemens German Pension Trust 11,016 9,676
U.S. 1,970 2,349
U.K. 1,461 1,443
Other 1,452 1,063
September 30, 2003 September 30, 2002Total Domestic Foreign Total Domestic Foreign
Change in projected benefit obligations:
Projected benefit obligation at beginning of year 19,492 13,331 6,161 18,544 13,077 5,467
Foreign currency exchange rate changes (739) – (739) (265) – (265)
Service cost 484 212 272 487 206 281
Interest cost 1,121 767 354 1,151 772 379
Settlements and curtailments (2) – (2) – – –
Plan participants’ contributions 32 – 32 32 – 32
Amendments and other 476 (34) 510 (53) (197) 144
Actuarial losses 1,000 563 437 697 301 396
Acquisitions 44 10 34 84 13 71
Divestments (83) (7) (76) (255) (221) (34)
Benefits paid (947) (686) (261) (930) (620) (310)
Projected benefit obligation at end of year 20,878 14,156 6,722 19,492 13,331 6,161
Siemens German Pension Trust 14,156 13,331
U.S. 3,031 3,095
U.K. 1,919 1,742
Other 1,772 1,324

Pension benefits: Recognition of an Additional Minimum Liability (AML)
The total accumulated benefit obligation (ABO) of the principal pension benefit plans
amounted to €19,779 and €17,842, as of September 30, 2003 and 2002, respectively.
For fiscal 2003 and 2002, the PBO, ABO and fair value of plan assets for the principal
pension benefit plans whose ABO exceeded the fair value of plan assets at the measurement
date were as follows:
The underfunded ABO of €3,898 (the Minimum Liability) was recorded as an accrued
pension liability. Including a pension liability of €37 for principal pension benefit plans
whose ABO was not underfunded at their measurement date, the total pension liability for
the principal pension benefit plans as of September 30, 2003 totaled €3,935.
Excluding the AML adjustment, the Company has a net prepaid pension asset of €6,383,
primarily related to the transfer of Infineon shares to the Siemens German Pension Trust
in fiscal 2001 and from the supplemental funding of the Siemens German Pension Trust in
fiscal 2003 and 2002. This amount together with the underfunded ABO of €3,898, resulted
in an AML adjustment of €10,281. Of this amount, €10,192 (€6,291 net of tax) was recorded
in accumulated other comprehensive income as a separate component of shareholders’
equity and €89 was recorded as an intangible asset.
152 notes to consolidated financial statements
(in millions of €, except where otherwise stated and per share amounts)
September 30, 2003 September 30, 2002Total Domestic Foreign Total Domestic Foreign
Projected benefit obligation 20,701 14,156 6,545 16,940 13,331 3,609
Siemens German Pension Trust 14,156 13,331
U.S. 3,031 3,095
U.K 1,919 –
Other 1,595 514
Accumulated benefit obligation 19,642 13,718 5,924 15,825 12,739 3,086
Siemens German Pension Trust 13,718 12,739
U.S. 2,746 2,659
U.K 1,749 –
Other 1,429 427
Fair value of plan assets 15,744 11,016 4,728 12,149 9,676 2,473
Siemens German Pension Trust 11,016 9,676
U.S. 1,970 2,105
U.K 1,450 –
Other 1,308 368
Underfunding of accumulated benefit obligation (3,898) (2,702) (1,196) (3,676) (3,063) (613)
Siemens German Pension Trust (2,702) (3,063)
U.S. (776) (554)
U.K (299) –
Other (121) (59)
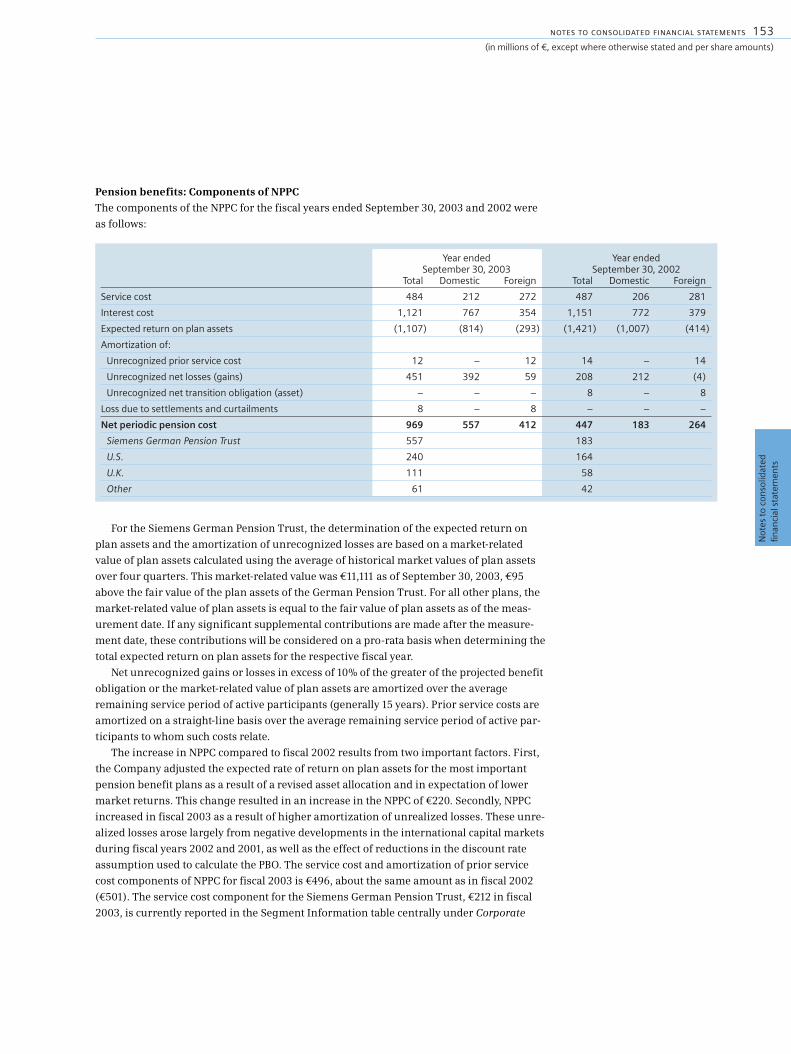
Pension benefits: Components of NPPC
The components of the NPPC for the fiscal years ended September 30, 2003 and 2002 were
as follows:
For the Siemens German Pension Trust, the determination of the expected return on
plan assets and the amortization of unrecognized losses are based on a market-related
value of plan assets calculated using the average of historical market values of plan assets
over four quarters. This market-related value was €11,111 as of September 30, 2003, €95
above the fair value of the plan assets of the German Pension Trust. For all other plans, the
market-related value of plan assets is equal to the fair value of plan assets as of the meas-
urement date. If any significant supplemental contributions are made after the measure-
ment date, these contributions will be considered on a pro-rata basis when determining the
total expected return on plan assets for the respective fiscal year.
Net unrecognized gains or losses in excess of 10% of the greater of the projected benefit
obligation or the market-related value of plan assets are amortized over the average
remaining service period of active participants (generally 15 years). Prior service costs are
amortized on a straight-line basis over the average remaining service period of active par-
ticipants to whom such costs relate.
The increase in NPPC compared to fiscal 2002 results from two important factors. First,
the Company adjusted the expected rate of return on plan assets for the most important
pension benefit plans as a result of a revised asset allocation and in expectation of lower
market returns. This change resulted in an increase in the NPPC of €220. Secondly, NPPC
increased in fiscal 2003 as a result of higher amortization of unrealized losses. These unre-
alized losses arose largely from negative developments in the international capital markets
during fiscal years 2002 and 2001, as well as the effect of reductions in the discount rate
assumption used to calculate the PBO. The service cost and amortization of prior service
cost components of NPPC for fiscal 2003 is €496, about the same amount as in fiscal 2002
(€501). The service cost component for the Siemens German Pension Trust, €212 in fiscal
2003, is currently reported in the Segment Information table centrally under Corporate
Not
es t
o co
nso
lidat
edfin
anci
al s
tate
men
ts
notes to consolidated financial statements 153(in millions of €, except where otherwise stated and per share amounts)
Year ended Year endedSeptember 30, 2003 September 30, 2002
Total Domestic Foreign Total Domestic Foreign
Service cost 484 212 272 487 206 281
Interest cost 1,121 767 354 1,151 772 379
Expected return on plan assets (1,107) (814) (293) (1,421) (1,007) (414)
Amortization of:
Unrecognized prior service cost 12 – 12 14 – 14
Unrecognized net losses (gains) 451 392 59 208 212 (4)
Unrecognized net transition obligation (asset) – – – 8 – 8
Loss due to settlements and curtailments 8 – 8 – – –
Net periodic pension cost 969 557 412 447 183 264
Siemens German Pension Trust 557 183
U.S. 240 164
U.K. 111 58
Other 61 42

items, pensions and eliminations, whereas the service cost and amortization of prior serv-
ice cost components for the foreign pension plans, €284 in fiscal 2003, are allocated to the
Operations Groups. All other components of NPPC are reported centrally under Corporate
items, pensions and eliminations for both the Siemens German Pension Trust and the for-
eign pension plans.
Based on the established assumptions, the Company expects that NPPC will increase
slightly in fiscal 2004, primarily due to a further increase in the amortization of unrecog-
nized losses. Such increase is due to increases in total unrecognized losses resulting pri-
marily from the reduction in the weighted-average discount rate from 6.0% to 5.4%. The
effect on NPPC was partly offset by higher expected absolute returns on plan assets result-
ing from the supplemental contributions.
Pension benefits: Assumptions for the calculation of the PBO and NPPC
Assumed discount rates, compensation increase rates and pension progression rates used
in calculating the PBO together with long-term rates of return on plan assets vary according
to the economic conditions of the country in which the retirement plans are situated as well
as capital market expectations.
The weighted-average assumptions used for the actuarial valuation of the PBO as of the
respective measurement date (June 30 or September 30), were as follows:
The assumptions used for the calculation of the PBO as of measurement date (June 30 or
September 30) of the preceding fiscal year are also valid for the calculation of interest cost
and service cost of the following year. Therefore, the assumptions used for the calculation
of the NPPC for fiscal 2004 are already determined except for the expected return on plan
assets. Regarding the assumption of the expected rate of return on plan assets, the Com-
pany decided to maintain the same fiscal 2003 return for fiscal 2004. Accordingly, the total
expected return for fiscal 2004 will be based on such expected rate of return multiplied by
the market-related value of plan assets at the fiscal 2003 measurement date.
154 notes to consolidated financial statements
(in millions of €, except where otherwise stated and per share amounts)
Year ended Year endedSeptember 30, 2003 September 30, 2002
Total Domestic Foreign Total Domestic Foreign
Discount rate 5.4% 5.25% 5.6% 6.0% 5.75% 6.4%
Siemens German Pension Trust 5.25% 5.75%
U.S. 6.25% 7.25%
U.K. 5.4% 5.7%
Rate of compensation increase 2.5% 2.25% 2.9% 3.1% 2.75% 3.9%
Siemens German Pension Trust 2.25% 2.75%
U.S. 3.0% 4.25%
U.K. 3.6% 4.1%
Rate of pension progression 1.4% 1.25% 2.1% 1.4% 1.25% 2.3%
Siemens German Pension Trust 1.25% 1.25%
U.K. 2.6% 2.5%

The weighted-average assumptions used for determining the NPPC for the fiscal years
ended September 30, 2004, 2003 and 2002 are shown in the following table:
The discount rate assumptions reflect the rates available on high-quality fixed-income
investments of appropriate duration at the measurement date of each plan. The expected
return on plan assets is determined on a uniform basis, considering long-term historical
returns, asset allocation, and future estimates of long-term investment returns. As of Octo-
ber 1, 2002, Siemens reduced the expected return on plan assets for its German Pension
Trust and for its principal foreign pension plans in order to represent expected investment
performance and future asset allocations. Actuarial assumptions not shown in the table
above, such as employee turnover, mortality, disability etc., remained primarily unchanged
in 2003.
Not
es t
o co
nso
lidat
edfin
anci
al s
tate
men
ts
notes to consolidated financial statements 155(in millions of €, except where otherwise stated and per share amounts)
Year ended Year ended Year endedSeptember 30, 2004 September 30, 2003 September 30, 2002
Total Domestic Foreign Total Domestic Foreign Total Domestic Foreign
Discount rate 5.4% 5.25% 5.6% 6.0% 5.75% 6.4% 6.2% 6.0% 6.7%
Siemens German Pension Trust 5.25% 5.75% 6.0%
U.S. 6.25% 7.25% 7.5%
U.K. 5.4% 5.7% 6.2%
Expected return on plan assets 6.7% 6.75% 6.6% 6.7% 6.75% 6.7% 8.0% 8.25% 7.9%
Siemens German Pension Trust 6.75% 6.75% 8.25%
U.S. 6.95% 6.95% 9.0%
U.K. 6.85% 6.85% 7.2%
Rate of compensation increase 2.5% 2.25% 2.9% 3.1% 2.75% 3.9% 3.3% 3.0% 4.1%
Siemens German Pension Trust 2.25% 2.75% 3.0%
U.S. 3.0% 4.25% 4.5%
U.K. 3.6% 4.1% 4.1%
Rate of pension progression 1.4% 1.25% 2.1% 1.4% 1.25% 2.3% 1.6% 1.5% 2.3%
Siemens German Pension Trust 1.25% 1.25% 1.5%
U.K. 2.6% 2.5% 2.5%

Pension benefits: Sensitivity Analysis
A one-percentage-point change of the established assumptions mentioned above, used for
the calculation of the NPPC for fiscal 2004, and a change of the market-related value of plan
assets of €500 as of balance sheet date September 30, 2003, would result in the following
impact on the fiscal 2004 NPPC:
Increases and decreases in the discount rate, rate of compensation increase and rate of
pension progression which are used in determining the PBO do not have a symmetrical
effect on NPPC primarily due to the compound interest effect created when determining the
present value of the future pension benefit. If more than one of the assumptions were
changed simultaneously, the impact would not necessarily be the same as if only one
assumption was changed in isolation.
Pension benefits: Additional information concerning changes of the AML
and actual returns on plan assets
The reduction of shareholders’ equity caused by the underfunded ABO increased by
€1,363. This reduction of shareholders’ equity has no effect on income and was primarily
caused by the increase in the ABO amounting to approximately 1.2 billion, as a result of the
decline in the weighted-average discount rate from 6.0% to 5.4%. The contributions to plan
assets had no effect on the AML. In fact, the contributions resulted in a lower difference
between the ABO and the fair value of plan assets and at the same time prepaid pension
assets before AML adjustments increased by the same amount.
Actual investment returns for the Siemens German Pension Trust from October 1 to Sep-
tember 30, 2003 amounted to €641 million or 5.3%. This was less than the €814 or 6.75%
that was included in the NPPC. The expected return on plan assets is based on the market-
related value of plan assets at the measurement date of the respective plan considering
significant supplemental contributions after the measurement date. The most significant
156 notes to consolidated financial statements
(in millions of €, except where otherwise stated and per share amounts)
Effect on NPPC 2004due toone-percentage-point/€500 €500increase decrease
Discount rate 160 (200)
Expected return on plan assets 172 (172)
Rate of compensation increase (90) 80
Rate of pension progression (270) 230
Market-related value of plan assets 70 (70)
Year ended Year endedSeptember 30, 2003 September 30, 2002
Total Domestic Foreign Total Domestic Foreign
Increase of the minimum liability within the accumulated other comprehensive income 1,363 498 865 2,300 1,935 365
Year ended Year endedSeptember 30, 2003 September 30, 2002
Total Domestic Foreign Total Domestic Foreign
Actual return on plan assets 648 641 7 (1,187) (713) (474)

principal foreign pension benefit plans have a measurement date of June 30. Accordingly,
the expected return of our principal foreign pension benefit plans of €293 relates to the
period from July 1, 2002 to June 30, 2003, during which the actual return was €7 or 0.1%, as
compared to the expected return of 6.7%. Included in this actual return of €7 are losses
totaling €551 incurred during the period from June 30, 2002 to September 30, 2002 by the
principal foreign pension benefit plans with measurement dates of June 30. For the period
from October 1, 2002 to September 30, 2003, the actual return on plan assets of our princi-
pal foreign pension benefit plans was €618 or 12.3%, and the investment return of the
worldwide plan assets was €1,259 or 7.4%. Included in this amount is €60 or 5.7%, on an
annualized basis, of actual returns earned during the period from June 30, 2003 to Septem-
ber 30, 2003 on assets of the principal foreign pension benefit plans with a measurement
date of June 30. Such returns are relevant only for fiscal 2004.
Pension benefits: Plan Assets
The asset allocation of the plan assets of the principal pension benefit plans as of the meas-
urement date for fiscal 2003 and 2002 as well as the target asset allocation for fiscal year
2004, are as follows:
As of September 30, 2002, the Siemens German Pension Trust held 87.1 million shares
in Infineon from the transfer which occurred in April 2001. During the first six months of
2002, the remaining holdings of the Siemens German Pension Trust in shares in Infineon
were sold. While United States pension plans subject to the Employee Retirement Income
Security Act (ERISA) are restricted in the amount of securities they are permitted to own in
the employer or its affiliates to 10% of the plan assets, the Siemens German Pension Trust is
not subject to such ERISA provisions.
Current asset allocation is biased towards high quality government and selected corpo-
rate bonds. As of September 30, 2003, the equity-portion of the pension assets of the princi-
pal pension benefit plans approximates the prior year level, despite a significant reduction
during the year. The target asset allocation is based on pension asset and liability studies
and is regularly reviewed with respect to market movements and also timely-adjusted based
on market conditions, when necessary.
Not
es t
o co
nso
lidat
edfin
anci
al s
tate
men
ts
notes to consolidated financial statements 157(in millions of €, except where otherwise stated and per share amounts)
Targetassetallocation
Asset allocation as of the measurement date
September September 30, 2003 September 30, 2002Asset class 30, 2004 Total Domestic Foreign Total Domestic Foreign
Equity 30 – 60% 31% 26% 41% 33% 20% 60%
Fixed income 30 – 60% 50% 54% 39% 46% 58% 22%
Real estate 5 – 15% 10% 10% 11% 8% 7% 9%
Cash 5 – 15% 9% 10% 9% 13% 15% 9%
100% 100% 100% 100% 100% 100%

158 notes to consolidated financial statements
(in millions of €, except where otherwise stated and per share amounts)
Pension benefits: Pension Plan Funding
Contributions made by the Company to its principal pension benefit plans in fiscal 2003
and 2002, as well as those planned in fiscal 2004, are as follows:
In September 2002, the Company made a supplemental cash contribution to the Siemens
German Pension Trust as well as to the pension plans in the U.S. and the U.K., totaling
€1,782. In addition, another supplemental funding of the Siemens German Pension Trust
totaling €635, including €377 in real estate and €258 in cash was made in October 2002.
Also in October 2002, Siemens made another supplemental cash contribution to the pen-
sion plan in the U.K. amounting to €184. In September 2003, Siemens made a supplemental
cash contribution of €750 to the German Pension Trust. In October 2003, €1,255 in cash
was contributed as follows: €700 to the Siemens German Pension Trust and €555 to the
pension plan in the U.S.
Beginning in fiscal 2004, regular funding will be based generally on the level of service
costs incurred. With regards to the Siemens German Pension Trust, this funding in the
amount of €230 has already been contributed in October 2003. The contributions abroad
will be allocated on a pro-rata basis during the fiscal year. Future funding decisions for the
Company’s pension plans will be made with due consideration of developments affecting
plan assets and pension liabilities, taking into account minimum funding requirements
abroad and local tax deductibility.
Year ended September 30, Year ended September 30, Year ended September 30,2004 (expected) 2003 2002
Total Domestic Foreign Total Domestic Foreign Total Domestic Foreign
Regular funding 499 230 269 219 – 219 241 – 241
Supplemental contributions
Cash 1,255 700 555 1,192 1,008 184 1,782 1,500 282
Real estate – – – 377 377 – – – –
1,754 930 824 1,788 1,385 403 2,023 1,500 523

Not
es t
o co
nso
lidat
edfin
anci
al s
tate
men
ts
notes to consolidated financial statements 159(in millions of €, except where otherwise stated and per share amounts)
Pension benefits: Pension benefit payments
The following overview comprises pension benefits paid out of the principal pension bene-
fit plans during the years ended September 30, 2003 and 2002, and expected pension pay-
ments in the next five years (undiscounted):
As pension benefit payments for our principal funded pension benefit plans reduce the
PBO and plan assets by the same amount, there is no impact on the funded status of such
plans.
Other postretirement benefits
In Germany, employees who entered into the Company’s employment on or before Septem-
ber 30, 1983, are entitled to transition payments for the first six months after retirement
equal to the difference between their final compensation and the retirement benefits
payable under the corporate pension plan. Certain foreign companies, primarily in the
U.S., provide other postretirement benefits in the form of medical, dental and life insur-
ance. The amount of obligations for other postretirement benefits in the form of medical
and dental benefits specifically depends on the expected cost trend in the health care sector.
To be entitled to such healthcare benefits participants must contribute to the insurance pre-
miums. Participant contributions are based on specific regulations of cost sharing which
are defined in the benefit plans. The Company has the right to adjust the cost allocation at
any time, generally this is done on an annual basis. Premiums for life insurance benefits
are paid solely by the Company.
Total Domestic Foreign
Pension benefits paid
2002 930 620 310
2003 947 686 261
Expected pension payments
2004 1,002 713 289
2005 1,044 746 298
2006 1,083 776 307
2007 1,101 781 320
2008 1,121 786 335

160 notes to consolidated financial statements
(in millions of €, except where otherwise stated and per share amounts)
Other postretirement benefits are illustrated in detail in the subsequent sections with
regard to:
n Obligations and funded status (page 160),
n Plan assets (page 161),
n Components of net periodic benefit cost for other postretirement benefits (page 161),
n Assumptions used in the calculation of the PBO and net periodic benefit cost (page 162),
and
n Benefit payments (page 162).
Other postretirement benefits: Obligations and funded status
The funded status of plan assets and a reconciliation of the funded status to the amounts
recognized in the Consolidated Balance Sheets is as follows:
The following table shows a detailed reconciliation of the changes in the projected bene-
fit obligation for other postretirement benefits for the years ended September 30, 2003 and
2002:
September 30, 2003 September 30, 2002Total Domestic Foreign Total Domestic Foreign
Fair value of plan assets 3 – 3 13 – 13
Projected benefit obligations 1,088 482 606 1,150 534 616
Funded status (plan assets less other postretirement obligations) (1,085) (482) (603) (1,137) (534) (603)
Unrecognized net loss (211) (221) 10 (300) (166) (134)
Unrecognized prior service cost (8) – (8) 5 – 5
Unrecognized net transition asset 1 – 1 1 – 1
Net amount recognized (1,303) (703) (600) (1,431) (700) (731)
September 30, 2003 September 30, 2002Total Domestic Foreign Total Domestic Foreign
Change in projected benefit obligations:
Projected benefit obligation at beginning of year 1,150 534 616 1,170 587 583
Foreign currency exchange rate changes (104) – (104) (46) – (46)
Service cost 42 19 23 52 21 31
Interest cost 66 30 36 80 33 47
Settlements and curtailments (29) – (29) – – –
Plan participant’s contributions 1 – 1 – – –
Plan amendments (19) – (19) – – –
Actuarial (gains) losses 58 (62) 120 (59) (81) 22
Acquisitions – – – 61 17 44
Divestments (24) (22) (2) (49) (22) (27)
Benefits paid (53) (17) (36) (59) (21) (38)
Projected benefit obligation at end of year 1,088 482 606 1,150 534 616

Not
es t
o co
nso
lidat
edfin
anci
al s
tate
men
ts
notes to consolidated financial statements 161(in millions of €, except where otherwise stated and per share amounts)
Other postretirement benefits: Plan assets
The following table shows the change in plan assets for fiscal 2003 and 2002:
Other postretirement benefits: Components of net periodic benefit cost
The components of the net periodic benefit cost for other postretirement benefits for the
years ended September 30, 2003 and 2002 are as follows:
September 30, 2003 September 30, 2002Total Domestic Foreign Total Domestic Foreign
Change in plan assets
Fair value of plan assets at beginning of year 13 – 13 28 17 11
Foreign currency exchange rate changes – – – (1) – (1)
Divestments and other – – – (17) (17) –
Employer contributions 25 – 25 41 – 41
Plan participant’s contributions 1 – 1 – – –
Benefits paid (36) – (36) (38) – (38)
Fair value of plan assets at year end 3 – 3 13 – 13
Year ended Year endedSeptember 30, 2003 September 30, 2002
Total Domestic Foreign Total Domestic Foreign
Service cost 42 19 23 52 21 31
Interest cost 66 30 36 80 33 47
Amortization of:
Unrecognized prior service cost (5) – (5) – – –
Unrecognized net gains (13) (7) (6) (9) – (9)
Net gain due to settlements and curtailments (27) – (27) – – –
Net periodic benefit cost 63 42 21 123 54 69

162 notes to consolidated financial statements
(in millions of €, except where otherwise stated and per share amounts)
Other postretirement benefits: Assumptions used in the calculation of the PBO
and net periodic benefit cost
Discount rates and other key assumptions used for transition payments in Germany are the
same as those utilized for domestic pension benefit plans.
The weighted average assumptions used in calculating the actuarial values for the
postretirement healthcare and life insurance benefits, primarily in the U.S., are as follows:
The health care assumptions may be significantly influenced by the expected progres-
sion in health care expense. A one-percentage-point change in the healthcare trend rates
would have the following effects on the accumulated postretirement benefit obligation and
the service and interest cost as of and for the year ended September 30, 2003:
Other postretirement benefits: Benefit payments
Benefit payments for other postretirement benefits for fiscal year 2003 were €53 (including
€17 for domestic plans) compared to €59 in the preceding fiscal year (including €21 for
domestic plans). For fiscal 2004, the Company expects benefit payments to be approxi-
mately the same as the fiscal 2003 level. Since the benefit obligations for other postretire-
ment benefits are generally not funded, such payments will impact the current operating
cash flow of the Company.
22 Other accruals and provisions
The Company is subject to asset retirement obligations related to certain tangible long-
lived assets. Such asset retirement obligations are primarily attributable to environmental
clean-up costs (€543 as of September 30, 2003; thereof non-current portion of €460) and to
costs associated with the removal of leasehold improvements at the end of the lease term
(€49 as of September 30, 2003; thereof non-current portion of €35).
Year ended September 30,
2003 2002
Discount rate 6.25% 7.25%
Medical trend rates (initial/ultimate/year):
Medicare ineligible pre-65 8.33%/5%/2007 9.17%/5%/2007
Medicare eligible post-65 8.33%/5%/2007 9.17%/5%/2007
Fixed dollar benefit 6% 6%
Dental trend rates (initial/ultimate/year) 6%/5%/2021 6%/5%/2021
September 30, 2003One-percentage-point
increase decrease
Effect on accumulated postretirement benefit obligation 57 (47)
Effect on total of service and interest cost components 8 (7)
September 30,
2003 2002
Asset retirement obligations 495 599
Deferred income 288 281
Product warranties 523 460
Other long-term accruals 2,112 2,061
3,418 3,401

Not
es t
o co
nso
lidat
edfin
anci
al s
tate
men
ts
notes to consolidated financial statements 163(in millions of €, except where otherwise stated and per share amounts)
Environmental clean-up costs are mainly related to remediation and environmental
protection liabilities which have been accrued for the estimated costs of decommissioning
facilities for the production of uranium and mixed-oxide fuel elements in Hanau, Germany
(Hanau facilities) as well as in Karlstein, Germany (Karlstein facilities). According to the
German Atomic Energy Act, when such a facility is closed, the resulting radioactive waste
must be collected and delivered to a government-developed final storage facility. In this
regard, the Company has developed a plan to decommission the Hanau and Karlstein facili-
ties in the following steps: clean-out, decontamination and disassembly of equipment and
installations, decontamination of the facilities and buildings, sorting of radioactive materi-
als, and intermediate and final storage of the radioactive waste. This process will be sup-
ported by continuing engineering studies and radioactive sampling under the supervision
of German federal and state authorities. The decontamination, disassembly and sorting
activities are planned to continue in Hanau until 2007 and in Karlstein until 2009; there-
after, the Company is responsible for intermediate storage of the radioactive materials until
a final storage facility is available. The final location is not expected to be available before
approximately 2030. The ultimate costs of the remediation are contingent on the decision
of the federal government on the location of the final storage facility and the date of its
availability. Consequently, the accrual is based on a number of significant estimates and
assumptions. The Company does not expect any recoveries from third parties and did not
reduce the accruals for such recoveries. The Company believes that it has adequately pro-
vided for this exposure. The previously recorded liabilities for such obligations were based
on estimated future cash flows discounted using a risk-free rate. Therefore, the impact of
the adoption of SFAS 143 principally relates to the application of current credit-adjusted
risk-free interest rates. The interest rates for the environmental liabilities relating to the
decommissioning of the Hanau and Karlstein facilities, previously ranging from approxi-
mately 4% to 5%, have been adjusted to a range from approximately 3% to 6%. The rates are
determined based on the differing durations of the steps of decommissioning. As of Sep-
tember 30, 2003 and 2002, the accrual totals €543 and €641, respectively, and are recorded
net of a present value discount of €1,438 and €1,429, respectively. The total expected pay-
ments for each of the next five fiscal years and the total thereafter are €46, €48, €51, €54,
€12 and €1,770 (includes €1,680 for the costs associated with final storage in 2033).
The Company recognizes the accretion of the liability for the Hanau facility using the
interest method. During the years ended September 30, 2003 and 2002 the Company recog-
nized €22 and €32 in accretion expense in Other operating income (expense), net.
The cumulative effect of initially applying SFAS 143 amounted to a positive €36 (net of
income taxes). Had SFAS 143 been applied as of September 30, 2002 and October 1, 2001,
the impact on the liability recorded, net income and earnings per share would not have
been material.

164 notes to consolidated financial statements
(in millions of €, except where otherwise stated and per share amounts)
The current and non-current portion of asset retirement obligations developed as
follows:
23 Shareholders’ equity
Common stock and Additional paid-in capital
As of September 30, 2003, the Company’s common stock totaled €2,673 divided into
890,866,301 shares without par value with a notional value of €3.00 per share. Each share
of common stock is entitled to one vote.
As of September 30, 2002, the Company’s common stock totaled €2,671 representing
888,374,001 shares.
The following table provides a summary of outstanding capital and the changes in
authorized and conditional capital for fiscal years 2003 and 2002:
Capital increases
In January 2002, €6 or 2,000,000 shares from Authorized Capital 2001/II were issued to an
underwriter and subsequently offered for sale to employees with respect to the Company’s
employee share program (see also Treasury stock below).
Common stock Authorized capital Conditional capital(authorized and issued) (not issued) (not issued)
in in in in in inthousands thousand thousands thousand thousands thousandof € shares of € shares of € shares
As of October 1, 2001 2,664,690 888,230 772,630 257,543 194,525 64,842
Stock options 413 138 – – (413) (138)
Settlement to former SNI shareholders 19 6 – – (19) (6)
Capital increases 6,000 2,000 (6,000) (2,000) – –
As of September 30, 2002 2,671,122 890,374 766,630 255,543 194,093 64,698
Settlement to former SNI shareholders 1,477 492 – – (1,477) (492)
New approved capital – – 250,000 83,334 267,000 89,000
Expired capital – – (300,000) (100,000) – –
As of September 30, 2003 2,672,599 890,866 716,630 238,877 459,616 153,206
Year endedSeptember 30,2003
Aggregate carrying amount as of the beginning of the period
(thereof current portion of €93) 692
Effect of adopting SFAS 143, before income taxes (59)
Liabilities incurred in the current period 10
Liabilities settled in the current period (93)
Accretion Expense 25
Revision in estimated cash flows 17
Aggregate carrying amount at the end of the period(thereof current portion of €97) 592
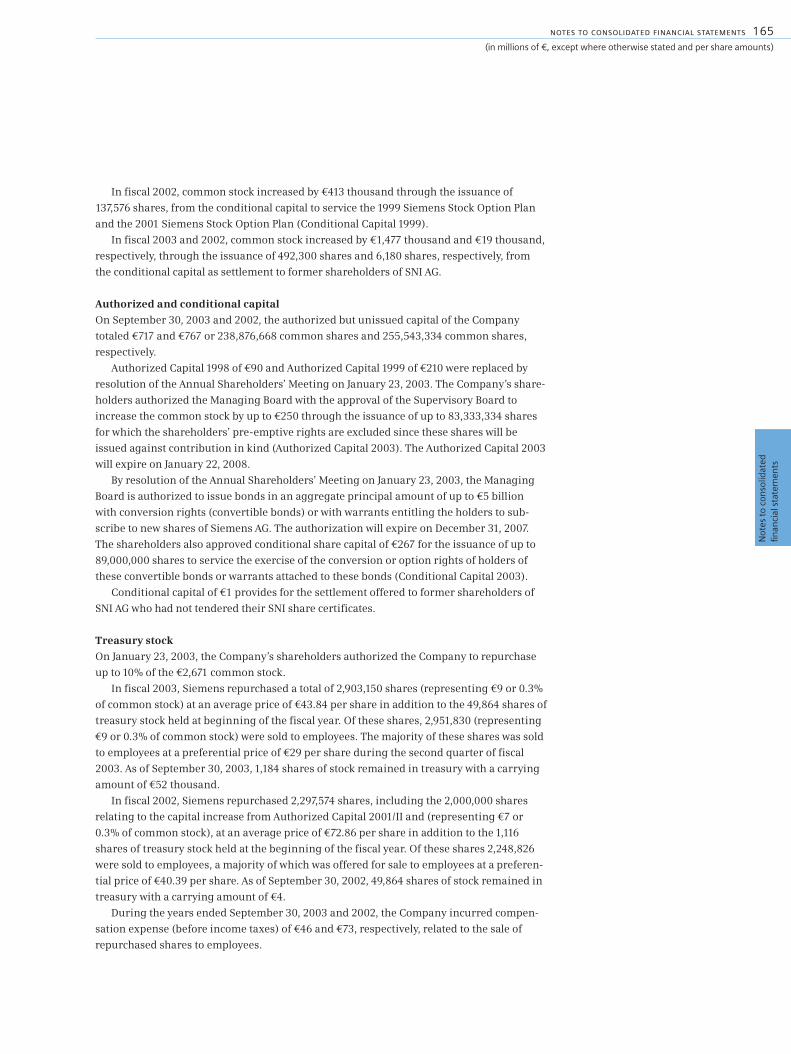
Not
es t
o co
nso
lidat
edfin
anci
al s
tate
men
ts
notes to consolidated financial statements 165(in millions of €, except where otherwise stated and per share amounts)
In fiscal 2002, common stock increased by €413 thousand through the issuance of
137,576 shares, from the conditional capital to service the 1999 Siemens Stock Option Plan
and the 2001 Siemens Stock Option Plan (Conditional Capital 1999).
In fiscal 2003 and 2002, common stock increased by €1,477 thousand and €19 thousand,
respectively, through the issuance of 492,300 shares and 6,180 shares, respectively, from
the conditional capital as settlement to former shareholders of SNI AG.
Authorized and conditional capital
On September 30, 2003 and 2002, the authorized but unissued capital of the Company
totaled €717 and €767 or 238,876,668 common shares and 255,543,334 common shares,
respectively.
Authorized Capital 1998 of €90 and Authorized Capital 1999 of €210 were replaced by
resolution of the Annual Shareholders’ Meeting on January 23, 2003. The Company’s share-
holders authorized the Managing Board with the approval of the Supervisory Board to
increase the common stock by up to €250 through the issuance of up to 83,333,334 shares
for which the shareholders’ pre-emptive rights are excluded since these shares will be
issued against contribution in kind (Authorized Capital 2003). The Authorized Capital 2003
will expire on January 22, 2008.
By resolution of the Annual Shareholders’ Meeting on January 23, 2003, the Managing
Board is authorized to issue bonds in an aggregate principal amount of up to €5 billion
with conversion rights (convertible bonds) or with warrants entitling the holders to sub-
scribe to new shares of Siemens AG. The authorization will expire on December 31, 2007.
The shareholders also approved conditional share capital of €267 for the issuance of up to
89,000,000 shares to service the exercise of the conversion or option rights of holders of
these convertible bonds or warrants attached to these bonds (Conditional Capital 2003).
Conditional capital of €1 provides for the settlement offered to former shareholders of
SNI AG who had not tendered their SNI share certificates.
Treasury stock
On January 23, 2003, the Company’s shareholders authorized the Company to repurchase
up to 10% of the €2,671 common stock.
In fiscal 2003, Siemens repurchased a total of 2,903,150 shares (representing €9 or 0.3%
of common stock) at an average price of €43.84 per share in addition to the 49,864 shares of
treasury stock held at beginning of the fiscal year. Of these shares, 2,951,830 (representing
€9 or 0.3% of common stock) were sold to employees. The majority of these shares was sold
to employees at a preferential price of €29 per share during the second quarter of fiscal
2003. As of September 30, 2003, 1,184 shares of stock remained in treasury with a carrying
amount of €52 thousand.
In fiscal 2002, Siemens repurchased 2,297,574 shares, including the 2,000,000 shares
relating to the capital increase from Authorized Capital 2001/II and (representing €7 or
0.3% of common stock), at an average price of €72.86 per share in addition to the 1,116
shares of treasury stock held at the beginning of the fiscal year. Of these shares 2,248,826
were sold to employees, a majority of which was offered for sale to employees at a preferen-
tial price of €40.39 per share. As of September 30, 2002, 49,864 shares of stock remained in
treasury with a carrying amount of €4.
During the years ended September 30, 2003 and 2002, the Company incurred compen-
sation expense (before income taxes) of €46 and €73, respectively, related to the sale of
repurchased shares to employees.

166 notes to consolidated financial statements
(in millions of €, except where otherwise stated and per share amounts)
Other comprehensive income (loss)
The changes in the components of other comprehensive income are as follows:
Miscellaneous
Under the German Stock Corporation Act, the amount of dividends available for distribu-
tion to shareholders is based upon the earnings of Siemens AG as reported in its statutory
financial statements determined in accordance with the German Commercial Code (Han-
delsgesetzbuch). During the fiscal year ended September 30, 2003, Siemens AG manage-
ment distributed an ordinary dividend of €888 (€1.00 per share) of the 2002 earnings of
Siemens AG as a dividend to the shareholders. During the year ended September 30, 2002,
Siemens AG management distributed €888 (€1.00 per share) of the 2001 earnings of
Siemens AG as a dividend to the shareholders.
24 Commitments and contingencies
Guarantees and other commitments
The following table presents the undiscounted amount of maximum potential future pay-
ments for each major group of guarantee.
Year ended September 30,
2003 2002Tax Tax
Pretax effect Net Pretax effect Net
Changes in unrealized gains (losses) on securities:
Unrealized holding gains (losses) for the period 334 (87) 247 (368) 128 (240)
Reclassification adjustments for (gains) losses included in net income 25 (4) 21 4 (3) 1
Net unrealized gains (losses) on available-for-sale securities 359 (91) 268 (364) 125 (239)
Changes in unrealized gains (losses) on derivative financial instruments:
Unrealized gains (losses) on derivative financial instruments: 179 (68) 111 110 (43) 67
Reclassification adjustments for (gains) losses included in net income (141) 54 (87) (51) 20 (31)
Net unrealized gains (losses) on derivative financial instruments 38 (14) 24 59 (23) 36
Minimum pension liability (1,477) 499 (978) (2,324) 906 (1,418)
Foreign-currency translation adjustment (695) – (695) (533) – (533)
(1,775) 394 (1,381) (3,162) 1,008 (2,154)
September 30,
2003 2002
Discounted bills of exchange 61 51
Guarantees
Credit guarantees. 515 945
Guarantees of third-party performance 559 1,678
Other guarantees 704 1,960
1,778 4,583
Collateral for third party liabilities 10 17

Not
es t
o co
nso
lidat
edfin
anci
al s
tate
men
ts
notes to consolidated financial statements 167(in millions of €, except where otherwise stated and per share amounts)
Credit guarantees cover the financial obligations of third parties in cases where
Siemens is the vendor and/or contractual partner. These guarantees generally provide that
in the event of default or non-payment by the primary debtor, Siemens will be required to
pay such financial obligations. In addition, Siemens provides credit guarantees generally as
credit-line guarantees with variable utilization to associated and related companies. The
maximum amount of these guarantees is subject to the outstanding balance of the credit
or, in case where a credit line is subject to variable utilization, the nominal amount of the
credit line. These guarantees usually have terms of between one year and five years. Except
for statutory recourse provisions against the primary debtor, credit guarantees are gener-
ally not subject to additional contractual recourse provisions. In connection with the forma-
tion of Infineon as a separate legal entity, Siemens had guarantees relating to business
obligations of Infineon that could not be transferred to Infineon for legal, technical or prac-
tical reasons. With respect to such guarantees, as of September 30, 2002, Credit guarantees
include €61 (that expired in fiscal 2003), for which Siemens had guaranteed the indebted-
ness of ProMOS, a subsidiary of Infineon. As of September 30, 2003, the Company has
accrued €125 relating to credit guarantees compared to €191 at September 30, 2002.
Furthermore, Siemens issues Guarantees of third-party performance, which include
guarantees of third-party performance and guarantees of advanced payments in cases
where Siemens is the general or subsidiary partner in a consortium. In the event of non-
fulfillment of contractual obligations by the consortium partner(s), Siemens will be
required to pay up to an agreed-upon maximum amount. These agreements span the term
of the contract, typically ranging from three months to five years. Generally, consortium
agreements provide for fallback guarantees as a recourse provision among the consortium
partners. In actual practice, such guarantees are rarely drawn and therefore no significant
liability has been recognized in connection with these guarantees. As of September 30,
2002, Guarantees of third-party performance also include a guarantee of €767 (which
expired in fiscal 2003) related to commitments of Siemens’ formerly owned defense elec-
tronics business, which was sold in 1998.
Other guarantees include indemnifications issued in connection with dispositions of
business entities. Such indemnifications protect the buyer from tax, legal and other risks
related to the purchased business entity. As of September 30, 2002, Other guarantees also
include a guarantee for Infineon totaling €313 (which expired in fiscal 2003) with respect to
contingent liabilities for government grants previously received. As of September 30, 2003
and September 30, 2002, the total accruals for Other guarantees amounted to €196 and
€284, respectively.
As of September 30, 2003, the amount recognized for the non-contingent component of
guarantees entered into after December 31, 2002 (see Note 2) was not significant.

168 notes to consolidated financial statements
(in millions of €, except where otherwise stated and per share amounts)
As of September 30, 2003, future payment obligations under non-cancellable operating
leases are as follows:
The total operating rental expense for the years ended September 30, 2003 and 2002 was
€530 and €328, respectively.
As of September 30, 2003, the Company has commitments to make capital contributions
of €256 to other companies.
The Company is jointly and severally liable and has capital contribution obligations as
a partner in companies formed under the German Civil Code (BGB), through which it has
executed profit-and-loss transfer agreements with other companies as a partner in com-
mercial partnerships and in a European Economic Interest Grouping (EEIG) and as a partic-
ipant in various consortiums.
Siemens AG and its subsidiaries have been named as defendants in various legal actions
and proceedings arising in connection with their activities as a global diversified group.
Some of the legal actions include claims for substantial compensatory or punitive damages
or claims for indeterminate amounts of damages. In the ordinary course of business,
Siemens may also be involved in investigations and administrative and governmental pro-
ceedings. Given the number of legal actions and other proceedings to which Siemens is
subject, some may result in adverse decisions. Siemens believes it has defenses to the
actions and contests them when appropriate. In view of the inherent difficulty of predicting
the outcome of such matters, particularly in cases in which claimants seek substantial or
indeterminate damages, Siemens often cannot predict what the eventual loss or range of
loss related to such matters will be. Although the final resolution of such matters could have
a material effect on Siemens’ consolidated operating results for any reporting period in
which an adverse decision is rendered, Siemens believes that its consolidated financial
position should not be materially affected.
25 Derivative instruments and hedging activities
As part of the Company’s risk management program, a variety of derivative financial
instruments are used to reduce risks resulting primarily from fluctuations in foreign-cur-
rency exchange rates and interest rates as well as to reduce credit risks. The following is a
summary of Siemens’ risk management strategies and the effect of these strategies on the
Consolidated Financial Statements.
Foreign currency exchange risk management
Siemens’ significant international operations expose the Company to significant foreign-
currency exchange risks in the ordinary course of business. The Company employs various
strategies discussed below involving the use of derivative financial instruments to mitigate
or eliminate certain of those exposures.
Derivative financial instruments not designated as hedges
The Company manages its risks associated with fluctuations in foreign-currency-denomi-
2004 473
2005 427
2006 393
2007 319
2008 277
Thereafter 945

Not
es t
o co
nso
lidat
edfin
anci
al s
tate
men
ts
notes to consolidated financial statements 169(in millions of €, except where otherwise stated and per share amounts)
nated receivables, payables, debt, firm commitments and anticipated transactions prima-
rily through a Company-wide portfolio approach. This approach concentrates the associ-
ated Company-wide risks centrally, and various derivative financial instruments, primarily
foreign exchange contracts and, to a lesser extent, interest rate and cross-currency interest
rate swaps and options, are utilized to minimize such risks. Such a strategy does not qual-
ify for hedge accounting treatment under SFAS 133. Accordingly, all such derivative finan-
cial instruments are recorded at fair value on the Consolidated Balance Sheets as either an
Other current asset or Other current liability and changes in fair values are charged to
earnings.
The Company also has foreign-currency derivative instruments, which are embedded in
certain sale and purchase contracts denominated in a currency other than the functional
currency of the significant parties to the contract, principally the U.S. dollar. Gains or losses
relating to such embedded foreign-currency derivatives are reported in Cost of sales in the
Consolidated Statements of Income.
Hedging activities
The Company’s operating units applied hedge accounting for certain significant antici-
pated transactions and firm commitments denominated in foreign currencies. Specifically,
the Company entered into foreign exchange contracts to reduce the risk of variability of
future cash flows resulting from forecasted sales and purchases and firm commitments
resulting from its business units entering into long-term contracts (project business) which
are denominated primarily in U.S. dollars.
Cash flow hedges – Changes in fair value of forward exchange contracts that were des-
ignated as foreign-currency cash flow hedges are recorded in Accumulated other compre-
hensive income (loss) as a separate component of shareholders’ equity. During the years
ended September 30, 2003 and 2002, net gains (losses) of €40 and € –, respectively, were
reclassified from accumulated other comprehensive income into cost of sales because the
occurrence of the related hedged forecasted transaction was no longer probable. Net gains
(losses) of €5 and €(3), respectively, were recognized in cost of sales representing hedge
ineffectiveness of derivative contracts.
It is expected that €89 of net deferred gains in Accumulated other comprehensive
income (loss) will be reclassified into earnings during the year ended September 30, 2004
when the hedged forecasted foreign-currency denominated sales and purchases occur.
As of September 30, 2003, the maximum length of time over which the Company is
hedging its future cash flows associated with foreign-currency forecasted transactions is
65 months.
Fair value hedges – As of September 30, 2003, the Company hedged firm commitments
using forward exchange contracts that were designated as foreign-currency fair value
hedges of future sales related primarily to the Company’s project business and, to a lesser
extent, purchases. The hedging transactions resulted in the recognition of an Other current
asset of €21 (2002: €13) and Other current liability of €25 (2002: €6) for the hedged firm
commitments, whose changes in fair value were charged to cost of sales. Changes in fair
value of the derivative contracts were also recorded in cost of sales. During the year ended
September 30, 2003, a net loss of €13 was recognized in cost of sales because the hedged
firm commitment no longer qualified as a fair value hedge (no such gains or losses were
recorded in fiscal 2002). During the years ended September 30, 2003 and 2002 there was no
hedge ineffectiveness.

170 notes to consolidated financial statements
(in millions of €, except where otherwise stated and per share amounts)
Interest rate risk management
Interest rate risk arises from the sensitivity of financial assets and liabilities to changes in
market rates of interest. The Company seeks to mitigate such risk by entering into interest
rate derivative financial instruments such as interest rate swaps, options and, to a lesser
extent, cross-currency interest rate swaps and interest rate futures.
Interest rate swap agreements are used to adjust the proportion of total debt, and to a
lesser extent interest-bearing investments, that are subject to variable and fixed interest
rates. Under an interest rate swap agreement, the Company either agrees to pay an amount
equal to a specified variable rate of interest times a notional principal amount, and to re-
ceive in return an amount equal to a specified fixed rate of interest times the same notional
principal amount or, vice-versa, to receive a variable-rate amount and to pay a fixed-rate
amount. The notional amounts of the contracts are not exchanged. No other cash payments
are made unless the agreement is terminated prior to maturity, in which case the amount
paid or received in settlement is established by agreement at the time of termination, and
usually represents the net present value, at current rates of interest, of the remaining obli-
gations to exchange payments under the terms of the contract.
Derivative financial instruments not designated as hedges
The Company uses a portfolio-based approach to manage its interest rate risk associated
with certain interest-bearing assets and liabilities, primarily interest-bearing investments
and debt obligations. This approach focuses on mismatches in the structure of the interest
terms of these assets and liabilities without referring to specific assets or liabilities. Such a
strategy does not qualify for hedge accounting treatment under SFAS 133. Accordingly, all
interest rate derivative instruments used in this strategy are recorded at fair value as either
an Other current asset or Other current liability and changes in the fair values are charged
to earnings.
Fair value hedges of fixed-rate debt obligations
Under the interest rate swap agreements outstanding during the years ended September 30,
2003 and 2002, the Company agrees to pay a variable rate of interest multiplied by a notional
principle amount, and receive in return an amount equal to a specified fixed rate of inter-
est multiplied by the same notional principal amount. These interest rate swap agreements
offset an impact of future changes in interest rates on the fair value of the underlying fixed-
rate debt obligations. The interest rate swap contracts are reflected at fair value in the Com-
pany’s Consolidated Balance Sheet and the related portion of fixed-rate debt being hedged
is reflected at an amount equal to the sum of its carrying amount plus an adjustment repre-
senting the change in fair value of the debt obligations attributable to the interest rate risk
being hedged. Changes in the fair value of interest rates swap contracts, and the offsetting
changes in the adjusted carrying amount of the related portion of fixed-rate debt being
hedged, are recognized as adjustments to the line item Income from financial assets and
marketable securities, net in the Consolidated Statements of Income. Net cash receipts and
payments relating to such interest rate swap agreements are recorded to interest expense.

Not
es t
o co
nso
lidat
edfin
anci
al s
tate
men
ts
notes to consolidated financial statements 171(in millions of €, except where otherwise stated and per share amounts)
The Company had interest rate swap contracts to pay variable rates of interest (average
rate of 2.3% and 3.3% as of September 30, 2003 and 2002, respectively) and receive fixed
rates of interest (average rate of 4.9% and 5.1% as of September 30, 2003 and 2002, respec-
tively). The notional amount of indebtedness hedged as of September 30, 2003 and 2002
was €5,153 and €6,146, respectively. This resulted in 52% and 66% of the Company’s under-
lying notes and bonds being subject to variable interest rates as of September 30, 2003 and
2002, respectively. The notional amounts of these contracts mature at varying dates based
on the maturity of the underlying hedged items. The net fair value of interest rate swap con-
tracts used to hedge indebtedness as of September 30, 2003 and 2002 was €309 and €305,
respectively. During the years ended September 30, 2003 and 2002, net gains of €13 and €2,
respectively, on the interest rate swaps was recognized in Income from financial assets and
marketable securities, net representing hedge ineffectiveness.
Credit risk management
Siemens Financial Services uses credit default swaps to protect from credit risks stemming
from its receivables purchase business. The credit default swaps are classified as guaran-
tees or as derivatives under SFAS 133.
26 Fair value of financial instruments
The fair value of a financial instrument represents the amount at which the instrument
could be exchanged in a current transaction between willing parties, other than in a forced
sale or liquidation. In determining the fair values of the derivative financial instruments,
certain compensating effects from underlying transactions (e.g., firm commitments and
anticipated transactions) are not taken into consideration.
Derivative financial instruments
The Company enters into derivative financial instruments with various counterparties,
principally financial institutions with investment grade credit ratings.
Derivative interest rate contracts – The fair values of derivative interest rate contracts
(e.g., interest rate swap agreements) are estimated by discounting expected future cash
flows using current market interest rates and yield curve over the remaining term of the
instrument. Interest rate options are valued on the basis of quoted market prices or on esti-
mates based on option pricing models.
Derivative currency contracts – The fair value of forward foreign exchange contracts
is based on forward exchange rates. Currency options are valued on the basis of quoted
market prices or on estimates based on option pricing models.
Credit default swaps – The fair value of credit default swaps is calculated by comparing
discounted expected future cash flows using current bank conditions with discounted
expected future cash flows using contracted conditions.
As of September 30, 2003, the Company’s derivative financial instruments had a net fair
value of €757 (2002: €398) and were recorded on the Consolidated Balance Sheets as Other
current assets of €1,020 (2002: €623) and Other current liabilities of €263 (2002: €225).

172 notes to consolidated financial statements
(in millions of €, except where otherwise stated and per share amounts)
Non-derivative financial instruments
The fair values for non-derivative financial instruments are determined as follows: Fair
value of cash and cash equivalents, short-term receivables, accounts payable, additional lia-
bilities and commercial paper and borrowings under revolving credit facilities approximate
their carrying amount due to the short-term maturities of these instruments.
Financial assets and securities
Fair values for marketable securities and publicly traded long-term equity investments
are derived from quoted market prices. It is not practicable to estimate the fair value of the
Company’s long-term investments which are not publicly traded, as there are no readily
available market prices. The following table presents the fair value (if readily available) and
carrying amount of long-term investments:
Financing receivables
Long-term fixed-rate and variable-rate receivables are evaluated by the Company based on
parameters such as interest rates, specific country risk factors, individual creditworthiness
of the customer and the risk characteristics of the financed project. Based on this evalua-
tion, allowances are taken to account for the expected losses of these receivables. As such,
as of September 30, 2003 and 2002, the carrying amounts of such receivables, net of
allowances, approximates their fair value.
Debt
The fair value of debt is estimated by discounting future cash flows using rates currently
available for debt of similar terms and remaining maturities. As of September 30, 2003 and
2002, the fair value and carrying amount of debt is as follows:
September 30,
2003 2002
Fair value 7,049 4,238
Carrying amount 5,992 5,092
September 30,
2003 2002
Fair value 13,533 12,284
Carrying amount 13,178 12,346

Not
es t
o co
nso
lidat
edfin
anci
al s
tate
men
ts
notes to consolidated financial statements 173(in millions of €, except where otherwise stated and per share amounts)
27 Stock-based compensation
Pursuant to SFAS 123, Accounting for Stock-Based Compensation, the Company has elected
to apply Accounting Principles Board (APB) Opinion No. 25, Accounting for Stock Issued to
Employees and related Interpretations in accounting for its stock-based compensation plan.
Description of plans – 1999 Siemens Stock Option Plan
As part of a stock option plan for members of the Managing Board, executive officers and
other eligible employees, the Company’s shareholders authorized the Managing Board on
February 18, 1999 to distribute non-transferable options exercisable for up to an aggregate
of 10 million common shares. The authority to distribute options under this plan would
have originally expired on February 18, 2004. With the ratification by Siemens shareholders
of the 2001 Siemens Stock Option Plan (further details see below), the 1999 Siemens Stock
Option Plan (the 1999 Plan) has been terminated and further options have not been
granted. In connection with the 1999 Plan, the shareholders originally approved an
increase in conditional capital in an amount not to exceed €26, which has been increased
to up to €45.
Under the 1999 Plan, the Supervisory Board decided annually after the end of each fiscal
year how many options to grant to the Managing Board, and the Managing Board decided
annually how many options to grant to executive officers and other eligible employees. The
exercise price is equal to the average market price of Siemens’ stock during the five days
preceding the date the options were granted. The options are exercisable within the five
years following a holding period of two years if Siemens AG stock price outperforms the
Dow Jones Stoxx-Index by at least two percentage points on five consecutive days. This per-
centage applies to the first year of the five-year option exercise period, and increases by 0.5
percentage points in each subsequent year. As a result of such performance requirements,
the plan has been accounted for as a variable plan under APB Opinion No. 25.
The options may be settled either in newly issued shares of common stock of Siemens
AG from the Conditional Capital reserved for this purpose, treasury stock or cash. The alter-
natives offered to optionees are determined by the Managing Board in each case as
approved by the Supervisory Board. Compensation in cash shall be equal to the difference
between the exercise price and the average market price of the Company’s stock on the five
trading days preceding the exercise of the stock options.
Description of plans – 2001 Siemens Stock Option Plan
At the Annual Shareholders’ Meeting on February 22, 2001, shareholders authorized
Siemens AG to establish the 2001 Siemens Stock Option Plan, making available up to 55
million options. Compared to the 1999 Plan, the number of eligible recipients is signifi-
cantly larger. The option grants are subject to a two-year vesting period, after which they
may be exercised for a period of up to three years. The exercise price is equal to 120% of the
reference price, which corresponds to the average opening market price of Siemens AG dur-
ing the five trading days preceding the date of the stock option grant. However, an option
may only be exercised if the trading price of the Company’s shares reaches a performance
target which is equal to the exercise price at least once during the life of the option. The
terms of the plan allow the Company, at its discretion upon exercise of the option, to offer
optionees settlement of the options in either newly issued shares of common stock of
Siemens AG from the Conditional Capital reserved for this purpose, treasury stock or cash.

174 notes to consolidated financial statements
(in millions of €, except where otherwise stated and per share amounts)
The alternatives offered to optionees are determined by the Managing Board in each case
as approved by the Supervisory Board. Compensation in cash shall be equal to the differ-
ence between the exercise price and the opening market price of the Company’s stock on
the day of exercising the stock options. As a result of its design, the new plan will have no
income effect in the case of settlement in shares due to the fact that the exercise price is also
the performance target. Any settlements in cash would be recorded as compensation
expense. In connection with the 2001 Siemens Stock Option Plan, the shareholders
approved an increase in conditional capital in an amount not to exceed €147.
Stock options may be granted within a period of 30 days after publication of the results
for the fiscal year or quarter then ended. The Supervisory Board decides how many options
to grant to the Managing Board, and the Managing Board decides how many options to
grant to executive officers and other eligible employees. Option grants to members of the
Managing Board may only be made once annually after the close of the fiscal year.
Additionally, Supervisory Board members receive stock appreciation rights under the
same conditions as the Siemens Stock Option Plans (for further information see Note 29).
Details on option activity and weighted average exercise prices are as follows. On
December 13, 2001, the Supervisory Board and the Managing Board granted options exer-
cisable to 5,413 key executives under the 2001 Siemens Stock Option Plan for 7,357,139
shares with an exercise price of €87.19 of which options exercisable for 151,000 shares were
granted to the Managing Board. On November 14, 2002, the Supervisory Board and Manag-
ing Board granted options to 5,814 key executives for 9,397,005 shares with an exercise
price of €53.70 of which options for 345,000 shares were granted to the Managing Board.
September 30, 2003 September 30, 2002
Weighted Weightedaverage average exercise exercise
Options price Options price
Outstanding, beginning of Period 11,648,767 €82.85 4,963,672 €76.01
Granted 9,397,005 €53.70 7,357,139 €87.19
Options exercised – – (139,826) €57.73
Options forfeited (634,896) €70.28 (532,218) €85.77
Outstanding, end of period 20,410,876 €69.82 11,648,767 €82.85
Exercisable, end of period 4,573,058 €76.36 1,617,899 €57.73

Not
es t
o co
nso
lidat
edfin
anci
al s
tate
men
ts
notes to consolidated financial statements 175(in millions of €, except where otherwise stated and per share amounts)
The following table summarizes information on stock options outstanding and exercis-
able at September 30, 2003:
Fair value information
The Company’s determination of the fair value of grants is based on the Black-Scholes
option pricing model. The fair value of grants made during the years ended September 30,
2003 and 2002 are as follows:
The Black-Scholes option valuation model was developed for use in estimating the fair
values of options that have no vesting restrictions. Option valuation models require the
input of highly subjective assumptions including the expected stock price volatility.
Because the Company’s stock options may have characteristics that vary significantly from
traded options and because changes in subjective assumptions can materially affect the
fair value of the option, it is management’s opinion that existing models do not necessarily
provide a single reliable measure of fair value.
28 Personnel costs
Options outstanding Options exercisableWeightedaverage Weighted Weighted
Options remaining average Number averageExercise prices outstanding life (years) exercise price exercisable exercise price
€53.70 9,108,875 4 €53.70 – –
€57.73 1,583,674 3 €57.73 1,583,674 €57.73
€86.23 2,989,384 4 €86.23 2,989,384 €86.23
€87.19 6,728,943 3 €87.19 – –
Assumptionsat grant date
2003 2002
Risk-free interest rate 3.31% 4.12%
Expected dividend yield 2.23% 1.41%
Expected volatility 53.49% 62.55%
Expected option life 3 years 4 years
Estimated weighted average fair value per option €9.80 €23.36
Fair value of total options granted during fiscal year €92 €172
Year endedSeptember 30,
2003 2002
Wages and salaries 20,740 22,639
Statutory social welfare contributions and expenses for optional support payments 3,573 3,592
Expenses relating to pension plans and employee benefits 1,439 964
25,752 27,195

176 notes to consolidated financial statements
(in millions of €, except where otherwise stated and per share amounts)
The average number of employees in fiscal year 2003 and 2002 was 419,300 and 445,100,
respectively. Part-time employees are included on a proportionate basis rather than being
counted as full units. The employees were engaged in the following activities:
29 Additional information relating to Board members
Supervisory Board
The remuneration of members of the Supervisory Board is established by the Annual Share-
holder’s Meeting upon the proposal of the Managing and Supervisory Boards. Details are
set forth in Paragraph 17 of the Articles of Association of Siemens AG. The remuneration
includes a fixed and a dividend-related component. The chairman of the Supervisory Board
receives twice and each vice chairman receives 1.5 times the annual compensation rates of
a simple member. On the basis of the authorization by the Annual Shareholder’s Meeting
on January 23, 2003, members of the Audit Committee receive an additional 50 percent
while the chairman of the Audit Committee receives an additional 100 percent of the com-
pensation rate of a simple member. In addition, each member of the Supervisory Board
receives annually 1,500 stock appreciation rights (SAR’s) granted on the same terms as
options issued under the Siemens Stock Option Plan in effect at the time.
The remuneration of the members of the Supervisory Board amounts to €1.8 and €1.3
for the years ended September 30, 2003 and 2002, respectively.
In addition, each member of the Supervisory Board received 1,500 stock appreciation
rights (SAR)’s granted under the same conditions as under the 1999 and 2001 Siemens
Stock Option Plans, which had a fair value as of the grant dates in fiscal 2003 (in November
2002) and fiscal 2002 of €0.3 and €0.7, respectively. For each member of the Supervisory
Board, the fair value of these SAR’s was €15 thousand and €35 thousand, respectively (see
Note 27).
Remuneration of the members of the Supervisory Board including stock appreciation
rights at fair value as of the grant date amounts to €2.1 and €2.0 for the years ended Sep-
tember 30, 2003 and 2002, respectively.
During the last two fiscal years there have been no loans outstanding to members of the
Supervisory Board.
After the Annual Shareholders’ Meeting 2003, the Company renewed a contract with
Mr. Peter von Siemens, whereas Mr. Peter von Siemens, as a representative of the founder’s
family, represents the Company at home as well as abroad and in various associations. The
contract grants him a reimbursement of his expenses and he is entitled to a company car
and secretarial services.
September 30,
2003 2002
Manufacturing 184,900 183,400
Sales and marketing 132,100 146,700
Research and development 45,700 55,700
Administration and general services 56,600 59,300
419,300 445,100

Not
es t
o co
nso
lidat
edfin
anci
al s
tate
men
ts
notes to consolidated financial statements 177(in millions of €, except where otherwise stated and per share amounts)
Managing Board
The Chairman’s Committee of the Supervisory Board is responsible for determining the
remuneration of members of the Managing Board. The remuneration takes into considera-
tion the Company’s size and global presence, its economic and financial position, and the
level and structure of managing board compensation at peer group companies in Germany
and abroad. Furthermore, the remuneration is performance related and has three compo-
nents: a fixed salary, a variable bonus, and a stock-based compensation. A significant por-
tion of the goals for the members of the Corporate Executive Committee is tied to company-
wide economic value added (EVA) performance while for the remaining members of the
Managing Board their financial goals depend primarily on the performance of the Group
led by them. For fiscal 2003, an additional achievement of an ambitious target for net cash
from operating and investing activities had been set. One-half of the variable bonus is paid
as an annual bonus while the other half is granted as a long-term bonus. The annual bonus
is contingent upon achieving the EVA target established for the fiscal year. The long-term
bonus depends on the average attainment of EVA targets over a three-year period. As stock-
based compensation, members of the Managing Board receive stock options under the
Siemens Stock Option Plans authorized by the Annual Shareholders’ Meeting. The number
of share granted for each member of the Managing Board is performance-related and
determined annually. For more information relating to the conditions of the Siemens Stock
Option Plans, see Note 27.
The remuneration of the members of the Managing Board comprised the following:
Other fixed compensation relates to non-cash benefits for company cars, accommoda-
tion allowances, social welfare contributions subsidies (or for corresponding direct insur-
ances of the Company) and remunerations for memberships in Supervisory Boards of affili-
ated companies. Additional payment for the acquisition of shares of Siemens AG for the
year ended September 30, 2002 relates to the remaining amount of fiscal 2001 remunera-
tion component for the immediate acquisition of a total of 775 shares under the condition
that each board member, within a period of 18 months, buys the same number of shares on
his own account, and that each board member pays any taxes and other levies associated
with the initial payment. These shares are subject to a holding period until the holder
leaves the Managing Board.
Also, in fiscal 2003 and 2002, the members of the Managing Board received 345,000 and
151,000, respectively, of stock options under the 2001 Siemens Stock Option Plan. The fair
value per option at grant date was €9.80 and €23.36, respectively. Accordingly, the total
value of stock options granted to members of the Managing Board amounted to €3.4 and
€3.5, respectively (for more information relating to the conditions of the Siemens Stock
Option Plans, see Note 27).
Year endedSeptember 30,
2003 2002
Base salary 6.5 4.9
Other fixed compensation 1.2 0.7
Annual bonus 12.6 9.8
Long-term bonus 7.9 3.0
Additional payment for the acquisition of shares of Siemens AG – 0.1
Total cash compensation 28.2 18.5
Fair value of total options received at grant date 3.4 3.5
Total remuneration 31.6 22.0

178 notes to consolidated financial statements
(in millions of €, except where otherwise stated and per share amounts)
Pension commitments to current members of the Managing Board are covered by
Siemens AG. As of September 30, 2003 and 2002, accruals of €42.3 and €37.0, respectively,
have been recorded. Such amounts are included in the amounts disclosed in Note 21.
During the last two fiscal years, there have been no loans outstanding to members of the
Managing Board.
Former members of the Managing Board and their surviving dependents received pen-
sions and transitional payments of €12.5 and €11.2 for the years ended September 30, 2003
and 2002, respectively. Members of the Managing Board, which were appointed to the Man-
aging Board before October 1, 2002, have the contractually accorded right to receive transi-
tional payments after leaving the Managing Board. The transitional payments generally
amount to the fixed salary of the year of resignation and the average of bonus paid for the
last three fiscal years before resignation. In single cases, the transitional payments equal
a one-year “target compensation.” If a member of the Managing Board resigns early from
office, the member has the right to receive a severance payment which amounts to the
“target compensation” for the remaining period of service.
Pension commitments to former members of the Managing Board and their surviving
dependents are also covered by Siemens AG. As of September 30, 2003 and 2002, accruals
of €106.4 and €106.2, respectively, have been recorded. Such amounts are included in the
amounts disclosed in Note 21.
Share ownership
As of October 25, 2003, the fiscal 2003 members of the Managing and Supervisory Boards
hold 690,229 and 13,998, respectively, shares and options representing 0.077% and 0.002%,
respectively, of Siemens’ total shares outstanding. These amounts do not include 16,736,966
shares representing 2% of outstanding share capital that is held by the von Siemens-Vermö-
gensverwaltung GmbH (vsV), and the 38,877,285 shares representing approximately 4% as
to which the vSV has voting power under a power of attorney. Mr. Peter von Siemens as a
representative of the founder’s family has voting control over these shares.
According to §15a WpHG, members of the Supervisory and Managing Boards have to
disclose acquisitions and sales of shares of Siemens AG or of rights with respect to these
shares, if shares or rights are not part of the compensation and provided the transactions
exceed the threshold set forth in the WpHG. In fiscal 2003, none of those transactions were
reported.
Directors and officers (D&O) liability insurance
The Company provides a D&O insurance policy for all members of the Supervisory and
Managing Boards of Siemens AG as well as for all board members of its subsidiaries. This
worldwide group insurance policy is renewed annually and expires September 30, 2004.
The insurance covers the personal liability of the insured in the case of a financial loss asso-
ciated to employment functions. There is no deductible for Managing Board and Supervi-
sory Board members in terms of Code Section 3,8, paragraph 2 of the German Corporate
Governance Code. It is not considered appropriate to differentiate between board members
and other high-level personnel. Furthermore, such a deductible is not common outside
Germany.

Not
es t
o co
nso
lidat
edfin
anci
al s
tate
men
ts
notes to consolidated financial statements 179(in millions of €, except where otherwise stated and per share amounts)
Related party transactions
Certain of the board members of Siemens AG hold or in the last fiscal year have held posi-
tions of significant responsibility with other entities. The Company has relationships with
almost all of these entities in the ordinary course of business, whereby it buys and sells a
wide variety of products and services at arm’s length. Significant are the relationships with
Deutsche Bank AG. Dr. Josef Ackermann is the Spokesman of the Managing Board of
Deutsche Bank AG. The Company’s transactions with Deutsche Bank AG include securities
underwritings, other investment banking services, and credit, money market and foreign
exchange business.
The members of the Managing Board of Siemens AG are listed on page 9 and 192 of this
Annual Report, and the Supervisory Board members are named on page 190.
30 Earnings per share
Fiscal 2003 earnings per share amounts are reported after cumulative effects of a
change in accounting principles. Basic earnings per share and diluted earnings per share
before cumulative effects of a change in accounting principle amounted to €2.71 and €2.71,
respectively, for the year ended September 30, 2003.
31 Segment information
Siemens has fifteen reportable segments (referred to as “Groups”) reported among the
components used in Siemens’ financial statement presentation (see Note 1). The Groups are
organized based on the nature of products and services provided.
Within the Operations component, Siemens has thirteen Groups which involve manu-
facturing, industrial and commercial goods, solutions and services in areas more or less
related to Siemens origins in the electrical business. Also included in Operations are oper-
ating activities not associated with a Group, which are reported under Other operations (see
below) as well as other reconciling items discussed in Reconciliation to financial statements
below.
The Financing and Real Estate component includes the Groups SFS and SRE. The
Eliminations, reclassifications and Corporate Treasury component separately reports
the consolidation of transactions among Operations and Financing and Real Estate as
well as certain reclassifications and the activities of the Company’s Corporate Treasury.
The results of operations of Infineon for the first two months of the fiscal year 2002 are
included in Eliminations, reclassifications and Corporate Treasury. Siemens’ at-equity
share in Infineon’s results is shown under Operations (see below Reconciliation to finan-
cial statements).
Year endedSeptember 30,
(shares in thousands) 2003 2002
Net income 2,445 2,597
Weighted average shares outstanding – basic 889,988 889,539
Effect of dilutive stock options – 92
Weighted average shares outstanding – diluted 889,988 889,631
Basic earnings per share 2.75 2.92
Diluted earnings per share 2.75 2.92

180 notes to consolidated financial statements
(in millions of €, except where otherwise stated and per share amounts)
The accounting policies of these components, as well as the Groups included, are gener-
ally the same as those used for Siemens worldwide and are described in the Summary of
significant accounting policies (Note 2). Corporate overhead is generally not allocated to
segments. Intersegment transactions are generally based on market prices.
New orders are determined principally as the estimated sales value of accepted purchase
orders and order value changes and adjustments, excluding letters of intent.
Operations
The Managing Board is responsible for assessing the performance of the Operations
Groups. The Company’s profitability measure for its Operations Groups is earnings before
financing interest, certain pension costs and income taxes (Group profit) as determined by
the Managing Board as the chief operating decision maker (see discussion below). The pre-
viously used term “EBIT” was retitled, however the definition remained unchanged.
Group profit excludes various categories of items which are not allocated to the Groups
since the Managing Board does not regard such items as indicative of the Groups’ perform-
ance. Financing interest is any interest income or expense other than interest income
related to receivables from customers, from cash allocated to the Groups and interest
expense on payables to suppliers. Financing interest is excluded from Group profit because
decision-making regarding financing is typically made centrally by Corporate Treasury.
Similarly, decision-making regarding essential pension items is done centrally. As a con-
sequence, Group profit includes only amounts related to the service cost of foreign pension
plans, while all other pension related costs (including charges for the German pension
insurance association and plan administration costs) are included in the line item Corpo-
rate items, pensions and eliminations.
Furthermore, income taxes are excluded from Group profit since tax expense is subject
to legal structures which typically do not correspond to the structure of the Operations
Groups.
Earnings (losses) from equity investees included in Group profit for the years ended
September 30, 2003 and 2002 of Operations Groups were €16 and €37, respectively, at ICN;
€2 and €(20), respectively, at ICM; €84 and €44, respectively, at PG; and €21 and €29, respec-
tively, in the other Operations Groups.
The Managing Board also determined Net capital employed as the asset measure used
to assess the capital intensity of the Operations Groups. Its definition corresponds with the
Group profit measure. Net capital employed is based on total assets excluding intracom-
pany financing receivables and intracompany investments and tax related assets, as the
corresponding positions are excluded from Group profit (Asset-based adjustments). The
remaining assets are reduced by non-interest bearing liabilities other than tax related lia-
bilities (e.g. accounts payable) and certain accruals (Liability-based adjustments) to derive
Net capital employed. The reconciliation of total assets to Net capital employed is presented
below.
As a result, both Group profit and Net capital employed represent performance meas-
ures focused on operational success excluding the effects of capital market financing
issues.

Not
es t
o co
nso
lidat
edfin
anci
al s
tate
men
ts
notes to consolidated financial statements 181(in millions of €, except where otherwise stated and per share amounts)
Other operations primarily refers to operating activities not associated with a Group
and certain centrally-held equity investments (such as BSH Bosch und Siemens Hausgeräte
GmbH), but excluding the equity investment in Infineon, which is not considered under an
operating perspective since Siemens intends to divest its remaining interest in Infineon
over time.
Reconciliation to financial statements
Reconciliation to financial statements includes items which are excluded from definition
of Group profit as well as costs of corporate headquarters.
Corporate items includes corporate charges such as personnel costs for corporate head-
quarters, the results of corporate-related derivative activities as well as corporate projects
and non-operating investments including the Company’s share of earnings (losses) from
the equity investment in Infineon. Pensions include the Company’s pension related income
(expenses) not allocated to the Groups and consists of all pension related costs, other than
amounts related to the service cost of foreign pension plans. Eliminations represent the
consolidation of transactions within the Operations component.
Corporate items, pensions and eliminations in the column Group profit consists of:
In fiscal 2003, Corporate items include €170, representing Siemens’ at-equity share in
the net loss incurred by Infineon. Fiscal 2003 also includes the positive resolution of an
arbitration proceeding as well as reduced corporate costs. Corporate items for the fiscal
year ended September 30, 2002, includes negative €338 related to the Company’s share in
the net loss of Infineon and the gain on the sale of two centrally-held investments totaling
€133 and charges of €146 related to the sale of a portfolio of businesses to KKR (see Note 3).
The transaction in the fourth quarter of 2002 was effected as a sale of a portfolio of busi-
nesses that resulted in a net gain of €21. However, separate results were allocated to the
operating segments where the sold businesses had previously resided. As a result, ICN and
PG were allocated gains of €153 and €68, respectively, while PTD was allocated a loss of €54.
The allocated values are based on amounts stated in the sales contracts and are not neces-
sarily indicative of their actual fair values. In addition, Corporate items for fiscal 2002
includes charges of €70 relating to the write-off of centrally held investments.
Pensions for fiscal 2003 and 2002 were negatively affected by changes in pension trust
net asset values and lower return assumptions. In addition, fiscal 2003 was impacted by
increased amortization expense primarily related to the underfunding of the Company’s
pension trusts. For more information related to the Company’s pension plans, see Note 21.
Other interest expense of Operations relates primarily to interest paid on debt and cor-
porate financing transactions through Corporate Treasury.
Year endedSeptember 30,
2003 2002
Corporate items (747) (947)
Pensions (828) (250)
Eliminations (1) (85)
(1,576) (1,282)

182 notes to consolidated financial statements
(in millions of €, except where otherwise stated and per share amounts)
For fiscal 2002, Gains on sales and dispositions of significant business interests include
gains of €936 from the sales of approximately 63.1 million Infineon shares in open market
transactions.
The following table reconciles total assets of the Operations component to Net capital
employed of the Operations Groups as disclosed in Segment Information according to the
above definition:
Financing and Real Estate
The Company’s performance measurement for its Financing and Real Estate Groups is
Income before income taxes. In contrast to the performance measurement used for the
Operations Groups, interest expense and income is an important source of revenue and
expense for Financing and Real Estate.
For the years ended September 30, 2003 and 2002, Income before income taxes at SFS
includes interest revenue of €445 and €510, respectively, and interest expense of €253 and
€310, respectively. In addition, Income before income taxes includes earnings from equity
investees for the years ended September 30, 2003 and 2002 of €60 and €41, respectively.
For the years ended September 30, 2003 and 2002, Income before income taxes at SRE
includes interest revenue of €9 and €13, respectively, and interest expense of €105 and
€132, respectively.
Eliminations, reclassifications and Corporate Treasury
Income before income taxes consists primarily of interest income due to cash management
activities, corporate finance, and certain currency and interest rate derivative instruments.
For the fiscal year ended September 30, 2003, Income before income taxes also includes a
gain of €35 from the repurchase and the retirement of €1,440 notional amount of the
Siemens Nederland N.V. 1% exchangeable notes. For the fiscal year ended September 30,
2002, the results of operations from Infineon for the first two months of the fiscal year 2002
are included.
September 30,
2003 2002
Total assets of Operations 64,475 67,699
Asset-based adjustments
Intracompany financing receivables and investments (11,931) (14,127)
Tax related assets (4,373) (4,350)
Liability-based adjustments
Pension plans and similar commitments (5,813) (5,299)
Accruals (6,022) (6,690)
Liabilities to third parties (20,394) (21,478)
Total adjustments (line item Other assets related reconciling items within the Segment Information table) (48,533) (51,944)
Net capital employed of Corporate items, pensions and eliminations 3,781 3,021
Net capital employed of Operations Groups 19,723 18,776

Not
es t
o co
nso
lidat
edfin
anci
al s
tate
men
ts
notes to consolidated financial statements 183(in millions of €, except where otherwise stated and per share amounts)
Description of business segments
The Operations Groups are comprised of the following businesses:
Information and Communication Networks (ICN) – ICN develops, manufactures and
sells public communication systems, private business communication systems and related
software, and provides a wide variety of consulting, maintenance and other services. This
includes circuit switching and communication access equipment, private branch exchange
systems, voice and data public telecommunication elements, and broadband network prod-
ucts for carrying data over the Internet. It also provides Internet core network switches,
routers and related services.
Information and Communication Mobile (ICM) – ICM designs, manufactures and
sells a broad range of communication devices, applications and interfaces, and mobile net-
work products and systems including mobile, cordless and corded fixed-line telephones
and radio base stations, base station controllers and switches for mobile communications
networks as well as mobile and intelligent network systems.
Siemens Business Services (SBS) – SBS provides information and communications
services to customers in industry, in the public sector, and in the telecommunications,
transport, utilities and finance industries. SBS designs, builds and operates both discrete
and large-scale information and communications systems, and provides related mainte-
nance and support services.
Automation and Drives (A&D) – A&D produces and installs manufacturing automation
systems, drives systems, low voltage controllers and distributors, and process automation
products and instrument systems.
Industrial Solutions and Services (I&S) – I&S provides a range of facilities systems
and services, including general contracting, to raw materials processing companies and
infrastructure customers.
Siemens Dematic (SD) – SD supplies logistics and factory automation equipment. It
designs, engineers, manufactures and supplies turnkey facilities and the associated com-
ponents, systems and services for electronic assembly systems, logistics and factory
automation equipment as well as postal automation systems. SD was formed in May 2001,
following the merger of the former Group Siemens Production and Logistics Systems and
Mannesmann Dematic Systems.
Siemens Building Technologies (SBT) – SBT provides products, systems and services
for monitoring and regulating the temperature, safety, electricity, lighting and security of
commercial and industrial property. In addition, it provides full technical facility manage-
ment services within selected markets.
Power Generation (PG) – PG provides customers worldwide with a full range of equip-
ment necessary for the efficient conversion of energy into electricity and heat. It offers a
broad range of power plant technology, with activities that include: development and manu-
facture of key components, equipment, and systems; planning, engineering and construc-
tion of new power plants; and comprehensive servicing, retrofitting and modernizing of
existing facilities.
Power Transmission and Distribution (PTD) – PTD supplies energy utilities and large
industrial power users with equipment, systems and services used to process and transmit
electrical power to various points along the power transmission network, including end
users.
Transportation Systems (TS) – TS provides products and services for the rail industry,
including signaling and control systems, railway electrification systems, complete heavy
rail systems including rapid transit systems and locomotives, light rail systems and other
rail vehicles.

Siemens VDO Automotive (SV) – SV designs, manufactures and sells integrated electri-
cal, electronic and electromechanical systems and modules and individual components
used in automotive applications. Its product range includes components and systems used
in automobile powertrains, body electronic systems, safety and chassis systems, electric
motor drives, information and cockpit systems, and driver information, communication
and multimedia systems. SV is the result of the merger in April 2001 of the former Siemens
Automotive group with Mannesmann VDO.
Medical Solutions (Med) – Med develops, manufactures and markets diagnostic and
therapeutic systems and devices such as computed tomography, magnetic resonance
imagers, ultrasound and radiology devices, and hearing instruments as well as information
technology systems for clinical and administrative purposes. It provides technical mainte-
nance, professional and consulting services.
Osram – Osram designs, manufactures and sells a full spectrum of lighting products
for a variety of applications such as general lighting and automotive, photo-optic and opto-
semiconductor lighting.
Infineon Technologies (Infineon) – Infineon’s products include discrete and inte-
grated semiconductor circuit and systems for wireless communications, computer net-
works and for use in automotive and industrial applications. Effective December 2001,
Infineon is no longer consolidated but instead accounted for as an investment using the
equity method.
The Financing and Real Estate Groups are comprised of the following two businesses:
Siemens Financial Services (SFS) – SFS, the Company’s international financial serv-
ices segment, provides a variety of customized financial solutions both to third parties and
to other Siemens business groups and their customers.
Siemens Real Estate (SRE) – SRE owns and manages a substantial part of Siemens’ real
estate portfolio and offers service portfolio specializing in real estate development projects,
real estate disposals, asset management, and lease and service management.
32 Geographic information
The following table presents data by geographic region as of and for the years ended Sep-
tember 30, 2003 and 2002.
184 notes to consolidated financial statements
(in millions of €, except where otherwise stated and per share amounts)
Sales by location Sales by locationof customer of companies
2003 2002 2003 2002
Germany 17,100 18,102 27,123 28,845
Europe (other than Germany) 25,327 26,597 22,196 23,326
U.S. 15,357 20,288 15,293 21,078
Americas other than U.S. 3,206 4,389 2,683 3,229
Asia-Pacific 8,728 9,668 5,560 6,153
Other countries 4,515 4,972 1,378 1,385
Siemens worldwide 74,233 84,016 74,233 84,016

Long-lived assets consist of property, plant and equipment.
33 Principal accountant fees and services
Fees billed to the Company for professional services by its principal accountant, KPMG,
during the fiscal year 2003 were as follows:
In the above table, Audit fees are the aggregate fees billed by KPMG for professional
services in connection with the audit of the Company’s consolidated annual financial state-
ments, reviews of interim financial statements, as well as audits of statutory financial state-
ments of Siemens AG and its affiliates. Also included in Audit fees are amounts billed for
attestation services in relation to regulatory filings and other compliance requirements.
Audit-related fees are fees billed by KPMG for accounting advice on actual or contemplated
transactions, due diligence engagements related to acquisitions or divestments, attestation
regarding compliance with certain agreements, employee benefit plan audits and other
agreed-upon procedures. Tax fees are fees for tax advice on actual or contemplated trans-
actions, expatriate employee tax services and transfer pricing studies.
34 Subsequent events
In October 2003, Med completed the sale of its Life Support Systems business to Getinge AB,
of Sweden.
Also in October 2003, Siemens made additional supplemental cash contributions to its
pension trusts of €1,255.
Not
es t
o co
nso
lidat
edfin
anci
al s
tate
men
ts
notes to consolidated financial statements 185(in millions of €, except where otherwise stated and per share amounts)
Long-lived assets
2003 2002
Germany 4,340 4,447
Europe (other than Germany) 3,036 3,198
U.S. 2,174 2,735
Americas other than U.S. 447 477
Asia-Pacific 718 842
Other countries 41 43
Siemens worldwide 10,756 11,742
Year endedSeptember 30, 2003
Audit fees 38.9
Audit-related fees 5.3
Tax fees 5.4
All other fees 1.2
50.8

186 statement of the managing board
Statement of the Managing Board
The Managing Board of Siemens AG is responsible for preparing the following consolidated
financial statements and management’s discussion and analysis.
Siemens employs extensive internal controls, company-wide uniform reporting guide-
lines and additional measures, including employee training and continuing education, to
ensure that its financial reporting is conducted in accordance with accepted accounting
principles. The presidents and chief financial officers (CFOs) of the Groups as well as the
presidents and CFOs of the Siemens companies have confirmed to us both the correctness
of the financial data they have reported to Siemens’ corporate headquarters and the func-
tionality of the related monitoring systems. We continually monitor the compliance with
these measures and guidelines, and also the functionality and reliability of our internal
control system, through a company-wide internal audit process. In addition, we have estab-
lished a Disclosure Committee that has evaluated all documents to be disclosed as to their
completeness and conformity with both the provisions of the Securities and Exchange Act
and the rules of the Securities and Exchange Commission (SEC) in the U.S. and reported the
results of this evaluation to us.
Our risk management system complies with the requirements of the German Corpora-
tion Act (AktG). Our risk management system is designed to enable the Managing Board to
recognize potential risks early on and initiate timely countermeasures.
In accordance with the resolution made at the Annual Shareholders’ Meeting, KPMG
Deutsche Treuhand-Gesellschaft Aktiengesellschaft has audited the consolidated financial
statements prepared in accordance with U.S. GAAP and management’s discussion and
analysis, and approved them without qualification.
Together with the independent auditors, the Supervisory Board has thoroughly exam-
ined the consolidated financial statements, management’s discussion and analysis, and the
independent auditors’ report. The result of this examination is included in the Report of the
Supervisory Board which begins on page 40 of this Annual Report.
Dr. Heinrich v. Pierer Heinz-Joachim Neubürger
President and Chief Executive Chief Financial Officer
Officer of Siemens AG of Siemens AG

independent auditors’ report 187
Independent auditors’ report
The Supervisory Board of Siemens AG:
We have audited the accompanying consolidated balance sheets of Siemens AG and sub-
sidiaries as of September 30, 2003 and 2002, and the related consolidated statements of
income, cash flow and changes in shareholders’ equity for each of the years then ended.
These consolidated financial statements are the responsibility of the Company’s manage-
ment. Our responsibility is to express an opinion on these consolidated financial state-
ments based on our audits.
We conducted our audits in accordance with auditing standards generally accepted in
the United States of America. Those standards require that we plan and perform the audit
to obtain reasonable assurance about whether the financial statements are free of material
misstatement. An audit includes examining, on a test basis, evidence supporting the
amounts and disclosures in the financial statements. An audit also includes assessing the
accounting principles used and significant estimates made by management, as well as eval-
uating the overall financial statement presentation. We believe that our audits provide a
reasonable basis for our opinion.
In our opinion, the consolidated financial statements referred to above present fairly, in
all material respects, the financial position of Siemens AG and subsidiaries as of September
30, 2003 and 2002, and the results of their operations and their cash flows for each of the
years then ended in conformity with accounting principles generally accepted in the United
States of America.
As discussed in Note 2 to the consolidated financial statements, Siemens AG adopted
Statement of Financial Accounting Standards No. 143, “Accounting for Asset Retirement
Obligations” effective October 1, 2002 and Statement of Financial Accounting Standards
No. 142, “Goodwill and Other Intangible Assets” effective October 1, 2001.
Munich, Germany
November 21, 2003
KPMG Deutsche Treuhand-Gesellschaft
Aktiengesellschaft
Wirtschaftsprüfungsgesellschaft
Prof. Dr. Wiedmann Berger
Wirtschaftsprüfer Wirtschaftsprüfer
(independent auditors)

188 five-year summary
2003 2002 2001 2000 1999
Sales and earnings (in millions of euros)
Net sales 74,233 84,016 87,000 77,484 68,069
Gross profit on sales 20,883 23,206 23,105 21,535 17,909
Research and development expenses 5,067 5,819 6,782 5,848 5,260
as a percentage of sales 6.8 6.9 7.8 7.5 7.7
Net income 2,445 2,597 2,088 8,860 1,209
Employees
Employees(2) (in thousands) 417 426 484 448 437
Employee costs (in millions of euros) 25,752 27,195 27,102 26,601 23,126
Cash flows (in millions of euros)
Net cash provided by operating activities 5,712 5,564 7,016 6,154 3,640
Amortization, depreciation and impairments 3,334 4,126 6,264 4,652 3,594
Net cash used in investing activities (3,939) (810) (5,886) (435) (2,876)
Additions to intangible assets, property, plant and equipment (2,852) (3,894) (7,048) (5,544) (3,998)
Net cash used in financing activities (487) (859) (95) (1,174) (1,111)
Net increase (decrease) in cash and cash equivalents 953 3,394 940 4,725 (292)
Assets, liabilities and shareholders’ equity (in millions of euros)
Current assets 43,489 44,062 51,013 49,091 44,850
Current liabilities 32,028 34,712 44,524 36,855 31,049
Debt 13,178 12,346 12,610 9,338 7,492
Long-term debt 11,433 10,243 9,973 6,734 4,753
Net debt(1) (379) (751) (4,017) 841 6,103
Pension plans and similar commitments 5,843 5,326 4,721 2,473 11,540
Shareholders’ equity 23,715 23,521 23,812 28,480 19,138
as a percentage of total assets 31 30 26 35 27
Total assets 77,605 77,939 90,118 81,654 71,720
(1) Net debt includes four positions from the Consolidated BalanceSheets: Cash and cash equivalents, Marketable securities, Short-termdebt and current maturities of long-term debt and Long-term debt.
(2) Without temporary student workers and trainees.(3) Data reflect stock split (one additional share for two existing shares)
effective April 30, 2001.(4) To be proposed at the Annual Shareholders’ Meeting.(5) XETRA closing prices, Frankfurt.

five-year summary 189
Quarterly data (in millions of euros) 2003 4th Quarter 3rd Quarter 2nd Quarter 1 st Quarter
Net sales 74,233 19,778 17,380 18,230 18,845
Net income 2,445 724 632 568 521
Quarterly data (in millions of euros) 2002 4th Quarter 3rd Quarter 2nd Quarter 1 st Quarter
Net sales 84,016 21,290 20,482 21,258 20,986
Net income 2,597 53 725 1,281 538
Siemens AG – Statement of income and balance sheet*(condensed version) (in billions of euros)
Years ended September 30 2003 2002
Net sales 27.1 27.7
Cost of sales (19.9) (21.1)
Gross profit on sales 7.2 6.6
Other functional costs (8.0) (9.0)
Other income and expense, net 1.9 3.1
Income before income taxes 1.1 0.7
Income taxes (0.1) 0.3
Net income 1.0 1.0
Profit available for distribution 1.0 0.9
As of September 30 2003 2002
Property, plant equipment 1.5 1.7
Investments 37.6 26.4
Noncurrent 39.1 28.1
Inventories – –
Accounts receivable 14.5 19.2
Marketable securities, liquid assets 10.9 10.6
Total assets 64.5 57.9
Shareholders’ equity 14.6 14.1
Accrued liabilities and special reserves 17.4 17.4
Debt 0.4 0.3
Other liabilities 32.1 26.1
Total shareholders’ equity and liabilities 64.5 57.9
Key capital market data(3) (in euros, unless otherwise indicated) 2003 2002 2001 2000 1999
EVA (in millions of euros) 449 617 (743) 7,095 –
Earnings per share 2.75 2.92 2.36 9.97 1.36
Diluted earnings per share 2.75 2.92 2.36 9.96 1.36
Dividend per share 1.10(4) 1.00 1.00 1.60 0.67
Siemens stock price(5)
High 58.32 78.52 105.77 127.67 57.53
Low 32.05 34.00 37.50 50.65 26.93
Year-end (September 30) 51.14 34.00 41.89 97.33 51.60
Siemens stock performance over prior year (in percentage points)
Compared to DAX index + 36.34 + 18.25 – 19.84 + 57.88 + 63.23
Compared to Dow Jones STOXX index + 44.81 + 7.87 – 28.30 + 63.95 + 47.85
Number of shares (in millions) 891 890 888 883 892
Market capitalization (in millions of euros) 45,559 30,273 37,208 85,939 46,037
Credit rating of long-term debt
Standard & Poor’s AA– AA– AA AA AA
Moody’s Aa3 Aa3 Aa3 Aa3 Aa3
* Prepared in accordance with the German Commercial Code(HGB).

190 positions held by supervisory board members
Karl-Hermann Baumann,Dr. rer.oec. ChairmanDate of birth: 7/22/35First elected: 2/19/98
Additional positionsGerman Supervisory Board positions:Deutsche Bank AG, Frankfurt/MainE.ON AG, DüsseldorfLinde AG, WiesbadenSchering AG, BerlinThyssenKrupp AG, DüsseldorfWilhelm von Finck AG, Grasbrunn
Ralf HeckmannFirst Deputy Chairman Chairman of the Central WorksCouncil, Siemens AG Date of birth: 7/19/49First elected: 3/24/88
Josef Ackermann, Dr. oec. Second Deputy ChairmanSpokesman of the Board of ManagingDirectors, Deutsche Bank AGDate of birth: 2/7/48First elected: 1/23/03
Additional positionsGerman Supervisory Board positions: Bayer AG, LeverkusenLinde AG, WiesbadenDeutsche Lufthansa AG, Cologne
Lothar AdlerDeputy Chairman of the CentralWorks Council, Siemens AGDate of birth: 2/22/49First elected: 1/23/03
Gerhard BieletzkiMember of the Combine WorksCouncil, Siemens AGDate of birth: 5/16/47First elected: 1/23/03
Group positionsGerman Supervisory Board positions:Siemens VDO Automotive AG,Munich (Deputy Chairman)
John David CoombeChief Financial Officer, GlaxoSmithKline plcDate of birth: 3/17/45First elected: 1/23/03
Gerhard Cromme, Dr. jur.Chairman of the Supervisory Board,ThyssenKrupp AGDate of birth: 2/25/43First elected: 1/23/03
Additional positionsGerman Supervisory Board positions:Allianz AG, MunichAxel Springer Verlag AG, BerlinE.ON AG, DüsseldorfDeutsche Lufthansa AG, CologneRuhrgas AG, EssenVolkswagen AG, WolfsburgComparable positions outsideGermany:BNP Paribas S.A., FranceSUEZ S.A., France
Rolf DittmarMember of the Works Council,Munich/Perlach facility, Siemens AGDate of birth: 10/25/43First elected: 1/23/03
Bertin EichlerExecutive Member of the Board ofManagement, Finance, IG MetallDate of birth: 8/27/52First elected: 11/13/96
Additional positionsGerman Supervisory Board positions:Allgemeine Deutsche Direktbank AG, Frankfurt/MainBGAG Beteiligungsgesellschaft derGewerkschaften AG, Frankfurt/Main (Chairman)BauBeCon Holding AG, HanoverBHW Holding AG, Hameln
Birgit GrubeOffice clerkDate of birth: 8/21/45First elected: 3/11/93
Heinz HawreliukHead of the Company Codetermina-tion Department, IG MetallDate of birth: 3/23/47First elected: 4/1/85
Additional positionsGerman Supervisory Board positions: Astrium GmbH, MunichDaimlerChrysler Aerospace AG,MunichDaimlerChrysler Luft und RaumfahrtHolding AG, MunichEurocopter Deutschland GmbH,MunichInfineon Technologies AG, Munich
Walter Kröll, Prof. Dr. rer. nat.President of Helmholtz-Gemein-schaft Deutscher Forschungs-zentren e.V.Date of birth: 5/30/38First elected: 1/23/03
Additional positionsGerman Supervisory Board positions:MTU Aero Engines GmbH, Munich
Wolfgang MüllerHead of the Siemens Team, IG MetallDate of birth: 1/14/48First elected: 1/23/03
Additional positionsInfineon Technologies AG, Munich
Georg NassauerSteel casting constructorDate of birth: 3/8/48First elected: 3/11/93
Albrecht Schmidt, Dr. jur. Chairman of the Supervisory Board,Bayerische Hypo- und VereinsbankAGDate of birth: 3/13/38First elected: 3/11/93
Additional positionsGerman Supervisory Board positions:HVB Real Estate Bank AG, Munich (Chairman until 9/30/03)Münchener Rückversicherungs-Gesellschaft AG, Munich
Henning Schulte-Noelle, Dr. jur.
Chairman of the Supervisory Board,Allianz AGDate of birth: 8/26/42First elected: 2/13/97
Additional positionsGerman Supervisory Board positions:E.ON AG, DüsseldorfThyssenKrupp AG, Düsseldorf
Peter von Siemens
Industrial managerDate of birth: 8/10/37First elected: 3/11/93
Additional positionsGerman Supervisory Board positions:Münchener Tierpark Hellabrunn AG, Munich
Jerry I. SpeyerPresident, TishmanSpeyer PropertiesDate of birth: 6/23/40First appointed: 7/14/03
Sir Iain VallanceVice Chairman, The Royal Bank of Scotland GroupDate of birth: 5/20/43First elected: 1/23/03
Klaus Wigand
Industrial manager Date of birth: 11/19/45First elected: 2/19/98
Members whose term of officeexpired on January 23, 2003:
Rolf-E. Breuer, Dr. jur. Second Deputy ChairmanChairman of the Supervisory Board,Deutsche Bank AG Date of birth: 11/3/37First elected: 2/19/98
Additional positionsGerman Supervisory Board positions:Bertelsmann AG, GüterslohDeutsche Bank AG, Frankfurt/Main(Chairman)Deutsche Börse AG, Frankfurt/Main(Chairman)E.ON AG, DüsseldorfComparable positions outsideGermany:Compagnie de Saint-Gobain S.A.,France
Comparable positions in Germany:Kreditanstalt für Wiederaufbau,Frankfurt/MainLandwirtschaftliche Rentenbank,Frankfurt/Main
Helmut Cors Head of Industrial Services andProduction, Vereinte Dienstleistungs-gewerkschaft (ver.di)Date of birth: 12/2/46First elected: 2/19/98
Additional positionsGerman Supervisory Board positions:Framatome ANP GmbH, Erlangen
Jean GandoisMember of the Supervisory Board,SUEZ S.A.Date of birth: 5/7/30First elected: 2/13/97
Additional positionsComparable positions outsideGermany:Air Liquide Italie S.p.A., ItalyDanone S.A., FranceEurazéo, FranceSociété Générale de Belgique S.A.,BelgiumSUEZ S.A., France
Robert M. Kimmitt Executive Vice President,Time WarnerDate of birth: 12/19/47First elected: 2/19/98
Additional positionsComparable positions outsideGermany:Allianz Life Insurance Co., USAXign Corporation, USA
Heinz Kriwet, Dr. rer. pol. Chairman of the Supervisory Board,ThyssenKrupp AGDate of birth: 11/2/31First elected: 3/11/93
Additional positionsGerman Supervisory Board positions: Dresdner Bank AG, Frankfurt/MainThyssenKrupp AG, Düsseldorf
Supervisory Board

positions held by supervisory board members and supervisory board committees 191
Members whose term of officeexpired on January 23, 2003 (cont.):
Hubert Markl, Prof. Dr. rer. nat.Date of birth: 8/17/38First elected: 2/19/98
Additional positionsGermany Supervisory Board positions:Bayerische Motoren Werke AG,MunichMünchener Rückversicherungs-Gesellschaft AG, MunichComparable positions outsideGermany:Aventis S.A., FranceRoyal Dutch Petroleum Company,The Netherlands
Werner Mönius Chairman of the European WorksCouncil of SiemensChairman of the Works Council,Siemens Medical Solutions, ErlangenDate of birth: 5/16/54First elected: 3/1/02
Georg Seubert
Fitter Date of birth: 7/27/41First elected: 2/19/98
Daniel L. Vasella, Dr. med. President and Delegate of the Boardof Administration, Novartis AGDate of birth: 8/15/53First elected: 2/19/98
Additional positionsComparable positions outsideGermany:PepsiCo, Inc., USA
Erwin Zahl
Telecommunications installerDate of birth: 11/18/39First elected: 10/1/94
Member who resigned from theSupervisory Board on July 12, 2003:Dr. Hans-Dieter WiedigDipl.-KaufmannDate of birth: 6/27/36First elected: 1/23/03
The Supervisory Board of Siemens AGhas 20 members. As stipulated bythe German Codetermination Act,half of the members representCompany shareholders, and halfrepresent Company employees. Theshareholders’ representatives wereelected at the Annual Shareholders’Meeting on January 23, 2003, andthe employee representatives wereelected by an assembly of employeedelegates on December 5, 2002.The Supervisory Board is electedfor five years.
As of September 30, 2003
Supervisory Board committees
Committee
Chairman’sCommitteeof the SupervisoryBoard
Meetings in FY 2003
7 plus9 decisionsby nota-tional vot-ing usingwrittencirculations
Duties and responsibilities
The Chairman’s Committee of the Supervi-sory Board is responsible for reviewing basicissues of business policy and management,especially in matters concerning theManag-ing Board. The Committee makes recom-mendations to the Supervisory Board onthe appointment and dismissal of ManagingBoard members and determines the Manag-ing Board’s employment and remunerationframework. The Committee executes thecontracts of employment with ManagingBoard members and determines their re-muneration as well as the annual amountsof the variable and stock-based compo-nents of their compensation. The Commit-tee makes recommendations to the Super-visory Board on the composition of Supervi-sory Board committees and – through rep-resentatives of the shareholders – proposesshareholder candidates for appointment tothe Supervisory Board. The Committee de-cides whether to approve business transac-tions with Managing Board members andrelated parties. The Committee’s duties in-clude a regular review of the Company’scorporate governance principles and formu-lating proposals to improve the Company’sapproach to corporate governance issues.
Membersas of Sept. 30, 2003
Dr. Karl-Hermann Baumann(Chairman)
Ralf Heckmann
Dr. Josef Ackermann
MediationCommittee, § 31 (3), (5) ofthe GermanCodetermina-tion Act
0 The Mediation Committee, as stipulated byGerman law, makes recommendations tothe Supervisory Board regarding theappointment or revocation of appointmentof Managing Board members, if therequired two-thirds majority of the Super-visory Board member votes is not obtainedon the first ballot.
Dr. Karl-Hermann Baumann(Chairman)
Ralf Heckmann
Dr. Josef Ackermann
Heinz Hawreliuk
InvestmentCommittee,§ 32 of theGermanCodetermina-tion Act
04 decisionsby nota-tional votingusing writ-ten circu-lations
The Committee is responsible for decisionsrelating to the exercise of ownership rightsresulting from interests in other companies.
Dr. Karl-Hermann Baumann(Chairman)
Dr. Josef Ackermann
Dr. Albrecht Schmidt
Audit Committee
5 The Audit Committee’s duties includepreparing Supervisory Board reviews of theannual financial statements of Siemens AGand of the consolidated financial state-ments of Siemens worldwide. The Commit-tee also reviews the quarterly reports andliaises with the internal Financial Audit De-partment and with the independent audi-tors (particularly with regard to awardingthe audit contract, defining the focal pointsof the audit, determining the auditors’ fee,and monitoring their independence).
Dr. Karl-Hermann Baumann*(Chairman)
Ralf Heckmann
Dr. Josef Ackermann*
Heinz Hawreliuk
Dr. Henning Schulte-Noelle*
* Audit Committee financial experts
Further information on corporate governance at Siemens is available at: www.siemens.com/corporate_governance
The Supervisory Board of Siemens AG has established four standing committees. Information on theiractivities in fiscal 2003 is provided on page 44 of this Report.

192 positions held by managing board members
Managing Board
Heinrich v. Pierer, Dr. jur. Dr.-Ing. E.h. President and Chief Executive Officer, Siemens AGDate of birth: 1/26/41First appointed: 10/1/89Term expires: 9/30/04
Outside positionsGerman Supervisory Board positions:Bayer AG, LeverkusenHochtief AG, EssenMünchener Rückversicherungs-Gesellschaft AG, MunichVolkswagen AG, Wolfsburg
Company positionsComparable positions outsideGermany:Siemens Aktiengesellschaft Österreich, Austria (Chairman)
Johannes FeldmayerDate of birth: 10/16/56First appointed: 5/1/03Term expires: 9/30/07
Company positionsGerman Supervisory Board positions:Siemens Dematic AG, MunichComparable positions outsideGermany:Siemens AB, Sweden (since 10/1/03)Siemens A.E., Greece(Chairman; since 10/1/03)Siemens A/S, Denmark(since 10/1/03)Siemens A.S., TurkeySiemens Building Technologies AG,Switzerland (Chairman)Siemens Holdings plc, UK (since 10/1/03)Siemens Rt., Hungary(Chairman; since 10/1/03)Siemens S.A., Belgium(since 10/1/03)Siemens S.A., Spain(Deputy Chairman; since 10/1/03)Siemens S.p.A., Italy(Deputy Chairman; since 10/1/03)Siemens s.r.o., Czech Republic(Chairman)
Thomas GanswindtDate of birth: 11/18/60First appointed: 12/1/02Term expires: 9/30/07
Company positionsGerman Supervisory Board positions:Siemens VDO Automotive AG,MunichComparable positions outsideGermany:Efficient Networks, Inc., USA(Chairman)Siemens Information and Commu-nication Networks, Inc., USA(Chairman)Siemens Network Convergence LLC,USA (Chairman)Siemens Ltd., Thailand (Chairman)Siemens Osakeyhtiö, Finland(Deputy Chairman)Siemens Rt., HungarySiemens S.A., Belgium (Chairman)
Volker Jung, Dr.Eng.h.c. (until 9/30/03)Date of birth: 8/28/39First appointed: 7/2/91Term expired: 9/30/03
Outside positionsGerman Supervisory Board positions:DAB bank AG, MunichMAN AG, Munich (Chairman)
Company positionsComparable positions outsideGermany:Siemens A.E., Greece (Chairman)Siemens Ltd., South Africa(Chairman)
Klaus Kleinfeld, Dr. rer. pol.Date of birth: 11/6/57First appointed: 12/1/02Term expires: 9/30/07
Outside positionsComparable positions outsideGermany:Alcoa Inc., USA (since 11/14/03)The Turner Corporation, USA
Company positionsComparable positions outsideGermany:Osram Sylvania, Inc., USASiemens Building Technologies, Inc.,USASiemens Business Services, Inc., USASiemens Corporate Research, Inc.,USASiemens Dematic Corp., USASiemens Energy & Automation, Inc.,USASiemens Information and Commu-nication Mobile LLC, USASiemens Information and Commu-nication Networks, Inc., USASiemens Medical Solutions USA, Inc.Siemens Power Transmission &Distribution, Inc., USASiemens Transportation Systems,Inc., USASiemens VDO Automotive Corp., USASiemens Westinghouse Power Corp.,USA
Edward G. Krubasik, Prof. Dr. rer. nat. Date of birth: 1/19/44First appointed: 1/1/97Term expires: 9/30/06
Outside positionsGerman Supervisory Board positions:Dresdner Bank AG, Frankfurt/MainSTINNES AG, Mülheim/Ruhr
Company positionsGerman Supervisory Board positions:Siemens Dematic AG, Munich(Chairman)Siemens VDO Automotive AG,Munich (Chairman)Comparable positions outsideGermany:Siemens A/S, NorwaySiemens France S.A., France
Rudi LamprechtDate of birth: 10/12/48First appointed: 4/26/00Term expires: 9/30/04
Company positionsGerman Supervisory Board positions:BSH Bosch und Siemens HausgeräteGmbH, MunichComparable positions outsideGermany: Fujitsu Siemens Computers B.V., The Netherlands (Deputy Chairman)Siemens Information and Commu-nication Mobile LLC, USASiemens France S.A., FranceSiemens S.A., Belgium
Heinz-Joachim NeubürgerDate of birth: 1/11/53First appointed: 11/5/97Term expires: 9/30/07
Outside positionsGerman Supervisory Board positions:Allianz Versicherungs-AG, MunichBayerische Börse AG, Munich
Comparable positions outsideGermany:Merrill Lynch & Co., Inc., USA
Company positionsComparable positions outsideGermany:Siemens Corp., USA
Peter Pribilla, Prof. (died on 8/9/03)Date of birth: 6/11/41First appointed: 4/1/94Term was to expire: 9/30/03
Outside positionsGerman Supervisory Board positions:Deutsche Krankenversicherung AG,Cologne (until 8/9/03)
Jürgen RadomskiDate of birth: 10/26/41First appointed: 6/29/94Term expires: 9/30/06
Outside positionsGerman Supervisory Board positions:Deutsche Krankenversicherung AG,CologneDräger Medical AG, Lübeck
Company positionsGerman Supervisory Board positions:BSH Bosch und Siemens HausgeräteGmbH, Munich (Deputy Chairman)Osram GmbH, Munich (Chairman)Comparable positions outsideGermany:Siemens Aktiengesellschaft Österreich, AustriaSiemens Osakeyhtiö, FinlandSiemens Nederland N.V., The NetherlandsSiemens Schweiz AG, Switzerland(Chairman)
Erich R. Reinhardt, Prof. Dr.Date of birth: 10/3/46First appointed: 12/1/01Term expires: 9/30/06
Outside positionsGerman Supervisory Board positions:BioM AG, MunichDräger Medical AG, Lübeck
Comparable positions outsideGermany:Siemens AB, SwedenSiemens Medical Solutions USA, Inc. (Chairman)
Uriel J. Sharef, Dr. rer.pol. Date of birth: 8/19/44First appointed: 7/26/00Term expires: 9/30/04
Company positionsComparable positions outsideGermany:Siemens Canada Ltd., CanadaSiemens Corp., USA (Chairman)Siemens Israel Ltd., Israel (Chairman)Siemens Ltda., BrazilSiemens Power Transmission &Distribution, Inc., USA
Claus Weyrich, Prof. Dr.phil. Dr.-Ing.E.h. Date of birth: 1/6/44First appointed: 10/1/96Term expires: 9/30/06
Outside positionsGerman Supervisory Board positions:HERAEUS Holding GmbH, Hanau
Company positionsComparable positions outsideGermany:Siemens Corporate Research, Inc.,USA (Chairman)
Klaus Wucherer, Prof. Dr.-Ing. Date of birth: 7/9/44First appointed: 8/1/99Term expires: 3/31/08
Outside positionsGerman Supervisory Board positions:Deutsche Messe AG, HanoverInfineon Technologies AG, Munich
Company positionsComparable positions in Germany:BSH Bosch und Siemens HausgeräteGmbH, MunichComparable positions outsideGermany:Eviop-Tempo A.E., GreeceSiemens Building Technologies AG,SwitzerlandSiemens Energy & Automation, Inc.,USA (Chairman)Siemens K.K., Japan (Chairman)Siemens Ltd., IndiaSiemens S.A., Portugal (Chairman)
As of September 30, 2003
The Siemens corporate structure is shownon the foldout inside the back cover.

managing board committees 193
Managing Board committees
Committee Respon-sible for the Issuanceof Employee Stock
1 The Committee oversees the utilization of authorizedcapital in connection with the issuance of employeestock.
Dr. Heinrich v. Pierer
Heinz-Joachim Neubürger
Jürgen Radomski
Equity Committee 2plus 1 decisionby notationalvoting usingwritten circu-lations
The Equity Committee is responsible for implementingvarious capital measures.
Dr. Heinrich v. Pierer
Heinz-Joachim Neubürger
Jürgen Radomski
Corporate ExecutiveCommittee
57 The Corporate Executive Committee currently comprisesthe Chairman of the Managing Board, the heads of Cor-porate Finance and Corporate Personnel, and five otherManaging Board members elected by the ManagingBoard. The Corporate Executive Committee has fullauthority to act for and on behalf of the Managing Boardbetween meetings of the Managing Board.
Dr. Heinrich v. Pierer
Johannes Feldmayer
Dr. Volker Jung
Prof. Dr. Edward G. Krubasik
Heinz-Joachim Neubürger
Jürgen Radomski
Dr. Uriel J. Sharef
Prof. Dr. Klaus Wucherer
Committee Meetingsin FY 2003
Duties and responsibilities Membersas of Sept. 30, 2003
Further information on corporate governance at Siemens is available at:www.siemens.com/corporate_governance

194 glossary
GlossaryA
B
C
D
E
F
G
Accumulated benefit A measure to determine a company’s pension-related “additional minimum liability.” obligation (ABO) The ABO is based on the same computational methodologies as the projected benefit
obligation (PBO), except for compensation levels. The ABO applies to past and currentcompensation levels. It does not incorporate compensation increases.
Asset management The process of managing corporate assets in order to enhance operational efficiencywhile minimizing costs and associated risks.
Backstop facility Bank line of credit to provide liquidity support to an organization in the event ofunfavorable capital markets.
Benchmarking A technique used to compare the products, services, processes and financials withinan organization, in relation to “best of practice” in other similar organizations.
Business portfolio The aggregate total of business areas in which Siemens is active.
Captive finance unit A financial services unit organized as a business within an industrial enterprise thatoffers financial solutions primarily to customers of the operating groups of that enter-prise.
Cash flow The net cash inflow or outflow for a specific time period.
Cash management The management of cash and cash equivalents within an organization to optimize finan-cial activities.
Consolidated Financial statements that bring together all assets, liabilities, net worth, and operating financial statements figures of two or more affiliated companies, as though the business were in fact a single
economic entity. Duplications in items are eliminated so that the combined figures donot show more assets and equities than actually exist.
Corporate Treasury A corporate function responsible for ensuring the availability of company-wide financingand cash management, including consulting services involving issues of corporatefinance, interest rates and currencies, liquidity management and all other questionsrelated to the financial management of operations.
Cost of capital The rate that a company must pay for its capital.
Debt-to-equity ratio Total long-term debt divided by total shareholders’ equity. This is a measure of leverage– the use of borrowed money to enhance the return on shareholders’ equity. The higherthe ratio, the greater the leverage.
Deferred taxes Assets and liabilities in the balance sheet arising from the different treatment of transac-tions for financial and tax reporting purposes.
Derivative A financial instrument that derives its value from the price or expected price of anunderlying asset (e.g. a security, currency or bond).
Equity method Valuation method used to account for holdings in companies whose business policy canbe significantly influenced (associated companies).
EVA Short for “economic value added.” As a measure, EVA is equal to net operating profitafter taxes (NOPAT) less a charge for the capital employed in the business (cost ofcapital).
Expected long-term Represents the average rate of earnings expected on plan assets.rate of return on pension plan assets
Financing and The worldwide leasing, lending, financing and real estate activities of Siemens Real Estate Financial Services (SFS) and Siemens Real Estate (SRE).
Fully diluted Earnings per share are fully diluted when they reflect the effects of exercising stockoptions or warrants or converting convertible securities.
Functional costs Functional costs include cost of sales, R&D expenses, marketing and selling expenses,and general administration expenses.
Funded status The difference between a pension plan’s projected benefit obligation (PBO) and the of a pension plan fair market value of assets designated to the pension plan (plan assets) as of a specific
date.
GASC Short for “German Accounting Standards Committee.” An independent registered asso-ciation to develop, among other things, accounting standards for application in the areaof consolidated financial reporting.
German GAAP Short for “Generally Accepted Accounting Principles in Germany.” The accountingconcepts, measurements, techniques and standards of presentation used in financialstatements in Germany pursuant to the German Commercial Code (HGB).

glossary 195
H
J
M
N
O
P
R
S
U
V
Goodwill The excess of the fair value of net assets acquired over cost resulting from a businesscombination accounted for as a purchase.
Group profit Measure of individual Group profit or loss. Earnings before financing interest, certainpension costs and income taxes.
Hedging A strategy used to minimize exposure to changes in prices, interest rates or exchangerates by means of derivative financial instruments (options, swaps, forward contracts,etc.).
Joint venture A form of business partnership between two or more companies to engage in a com-mercial enterprise with mutual sharing of profits and losses.
Medium Term Flexible financing framework providing for the issuance of notes in rotation in the Note Program context of a program unrestricted in time (constant issue). The notes may be issued
in several tranches, with terms and conditions and time of issue being determined inaccordance with then current goals and prevailing market conditions.
Moody’s Independent rating agency that provides evaluation of securities investment and Investors Service credit risk.
Net capital employed Consists of long-term assets plus excess of current assets over current non-interest-bearing liabilities.
Net cash from operating Total of cash provided by (used in) operating and investing activities as determined in and investing activities the statement of cash flow.
Net periodic The amount of pension costs recorded in the statement of income. Net periodic pen-pension cost sion cost components include service cost, interest cost, expected return on plan assets,
amortization of unrecognized prior service cost (if any), gains or losses recognized andamortized after exceeding a certain corridor (if any), amortization of unrecognized initialnet obligation and/or initial net asset.
Operations The most important of the three major components of Siemens. Operations comprisesall activities of the Siemens organization worldwide with the exception of Financing andReal Estate and Corporate Treasury.
Projected benefit A measure to determine pension liabilities. The PBO is the actuarial present value as obligation (PBO) of a specific date of employees’ vested and non-vested pension benefits incorporating
compensation increases, attributable to employee services performed as of that date.
R&D Short for “research and development.”
Rating Standardized evaluation of issuers’ credit standing and debt instruments, carried out byspecialized agencies (such as Standard & Poor’s or Moody’s Investors Service).
Risk management Systematic process of identifying, assessing and monitoring various financial risk factorsand of selecting and implementing measures to handle them.
SEC Short for “Securities and Exchange Commission.” The primary federal agency in the U.S.responsible for regulating the financial reporting practices of most publicly owned cor-porations in connection with the buying and selling of stocks and bonds.
Standard & Poor’s Independent rating agency that provides evaluation of securities investment and creditrisk.
Stock options Form of employee incentive and compensation. The employee is given an option to pur-chase a company’s shares if certain targets are met under specified conditions.
UMTS Short for “Universal Mobile Telecommunications System.” Third-generation mobile com-munications standard that will provide broadband services optimized for high-speeddata, mobile Internet and applications based on intranets, extranets and mobile multi-media.
U.S. GAAP Short for “United States Generally Accepted Accounting Principles.” The accounting con-cepts, measurements, techniques and standards of presentation applicable to financialstatements in the U.S.
Volatility The degree of fluctuation for a given price or rate, such as a stock price or currencyexchange rate.

196 index
A
BC
D
E
F
G
HI
KL
Index
100 Accounting estimates
100, 137 Accounts receivable
98, 102, 142 Accrued liabilities, Provisions
146 Accumulated benefit obligation (ABO)
66, 128 Acquisitions and dispositions
36 Affiliates (see also Long-term investments and Marketable securities and investments)
198 Annual Shareholders’ Meeting
24, 70, 183 Automation and Drives (A&D)
112 Balance sheets
90 Cash flow
116, 164 Changes in shareholders’ equity
48, 52 Code of Ethics
164 Common stock
116, 166 Comprehensive income
166 Contingencies
51, 103 Controlling and risk management
43, 48 Corporate governance
98 Customer financing
95, 143 Debt
53 Declaration of conformity with the German Corporate Governance Code
124, 168 Derivative financial instruments
90 Dividend
122, 179 Earnings per share
12 Employees
199 Environmental protection (see also our Corporate Responsibility Report)
88 EVA performance
153 Expected return on plan assets
171, 175 Fair value
51 Financial accounting
3 Financial highlights
51 Financial reporting
34 Financing and Real Estate
106, 168, 170 Foreign currency exchange and interest rate risks
150 Funded status of pension plan
101, 123, 140 Goodwill
166 Guarantees and other committments
169 Hedging activities
187 Independent auditors’ report
25, 71, 183 Industrial Solutions and Services (I&S)
130, 184 Infineon
21, 68, 183 Information and Communication Mobile (ICM)
22, 67, 183 Information and Communication Networks (ICN)
123, 141 Intangible assets
133 Interest income
107, 199 Internet website
123, 139 Inventories
51, 107 Investor relations
189 Key data
4 Letter to our shareholders
90 Liquidity and capital resources
143 Long-term debt
139 Long-term investments

index 197
M
N
O
P
R
S
T
62 Management’s discussion and analysis
9, 50, 177, 192 Managing Board
136 Marketable securities
123 Marketable securities and investments
32, 78, 184 Medical Solutions (Med)
148, 153 Net periodic pension cost (NPPC)
143 Notes and bonds
97, 138 Operating leases
33, 79, 184 Osram
162 Other accruals and provisions
142 Other assets
143 Other liabilities
132 Other operating income
108 Outlook
11 Patents
99, 146 Pension plans
175 Personnel costs
192 Positions held by Managing Board members
190 Positions held by Supervisory Board members
28, 74, 183 Power Generation (PG)
29, 75, 183 Power Transmission and Distribution (PTD)
146 Projected benefit obligation (PBO)
124, 142 Property, plant and equipment
92 Rating
179 Related party transactions
40 Report of the Supervisory Board
11 Research and development (investments)
100, 122 Revenue recognition
51, 103 Risk management
10 Sales by region
123, 138 Securitization
67, 118, 179, 183 Segment information
164 Shareholders’ equity
27, 73, 183 Siemens Building Technologies (SBT)
23, 69, 183 Siemens Business Services (SBS)
26, 72, 183 Siemens Dematic (SD)
198 Siemens financial calendar
34, 81, 184 Siemens Financial Services (SFS)
7 Siemens Management System (SMS)
35, 82, 184 Siemens Real Estate (SRE)
10 Siemens share
31, 77, 184 Siemens VDO Automotive (SV)
186 Statement of the Managing Board
90, 114 Statements of cash flow
83, 110 Statements of income
10 Stock market information
125, 173 Stock options and stock-based compensation
121 Summary of significant accounting policies
176, 190 Supervisory Board
125, 133 Taxes
12 Training
30, 76, 183 Transportation Systems (TS)

198 siemens financial calendar
Siemens financial calendar*
Jan. 22, 2004 First-quarter financial report
Jan. 22, 2004 Annual Shareholders’ Meeting – Olympiahalle, Munich, 10:00 a.m.
Jan. 23, 2004 Ex-dividend date
Apr. 28, 2004 Second-quarter financial report and Semiannual Press Conference
July 29, 2004 Third-quarter financial report
Nov. 11, 2004 Preliminary figures for fiscal year / Press conference
Jan. 27, 2005 Annual Shareholders’ Meeting for fiscal 2004
* Provisional. Updates will be posted at: www.siemens.com/financial_calendar

Information resources
Designations used in this Report may be trademarks, the use of whichby third parties for their own purposes could violate the rights of thetrademark owners.
Concept and coordination:Dr. Christoph WegenerCorporate CommunicationsE-mail [email protected]
Layout:Kai Brüninghaus Kommunikationsdesign, Hamburg
Pictures credits:Siemens AG holds the copyright for all photos. We would especially liketo thank:Enno Kapitza (pages 14, 16, 18), Doug Durham (page 17),minx creative factory (pages 2-3, 22, 35), Regina Recht (pages 4, 9, 13, 40). Other photos:Osram GmbH (page 33)BSH Bosch und Siemens Hausgeräte GmbH (page 36)Fujitsu Siemens Computers (Holding) BV (page 37)
Production:Publicis KommunikationsAgentur GmbH, GWA, Munich
© 2003 by Siemens AG, Berlin and Munich
Information on contents
Telephone +49 89 636-33032 (Press Office)
+49 89 636-32474 (Investor Relations)
Fax +49 89 636-32825 (Press Office)
+49 89 636-32830 (Investor Relations)
E-mail [email protected]
Address
Siemens AG
Wittelsbacherplatz 2
D-80333 Munich
Federal Republic of Germany
Internet www.siemens.com
This Annual Report is also available in French, German and
Spanish. An abridged Japanese version will be available as
of January 2004 at www.siemens.co.jp
The German and English versions can be downloaded at
www.siemens.com
Additional copies of this Report are available from:
E-mail [email protected]
Internet www.siemens.com/order_annualreport
Telephone +49 7237-480024
Fax +49 7237-1736
Employees may also obtain additional copies from
LZF, Fürth-Bislohe, Germany:
Intranet http://c4bs.spls.de/
Fax +49 911 654-4271
English Order no. A19100-F-V60-X-7600
German Order no. A19100-F-V60
French Order no. A19100-F-V60-X-7700
Spanish Order no. A19100-F-V60-X-7800
Please include mailing address and complete company unit
designation (Org-ID) when ordering.
Also available:
Corporate Responsibility Report 2003
Copies of this Report may be ordered at the above address.
Employees may also place orders at the LZF order center:
German: Order no. A19100-F-V93
English: Order no. A19100-F-V93-X-7600
In addition to an Annual Report at the end of each fiscal year,
Siemens publishes quarterly consolidated financial state-
ments in the form of press releases. Conference calls with
journalists and analysts supplement these reports. Two major
press conferences – one at mid-year and one at year-end –
as well as an annual analyst conference give journalists and
analysts additional opportunities to review developments in
our businesses. The financial reports for the first three quar-
ters are also complemented by an extensive interim report
comprising management’s discussion and analysis as well as
the consolidated financial statements (with notes). These
reports are submitted to Deutsche Börse and the U.S. Securi-
ties and Exchange Commission (SEC), among other organiza-
tions. Siemens also provides the SEC with the annual report on
Form 20-F. All of these financial reports are available on the
Internet at: www.siemens.com/financial_reports
199

Corporate structure
co
rp
or
at
e s
tr
uc
tu
re
Operations
Corporate Departments
Thomas Ganswindt
Michael Kutschenreuter Andy W. MattesAnton Hendrik Schaaf
Information and Communication Networks (ICN)
Paul A. Stodden
Jürgen Frischmuth Bernd Regendantz
Siemens Business Services GmbH & Co. OHG (SBS)
Information and Communications
Helmut Gierse
Anton S. HuberAlfred Ötsch
Joergen Ole Haslestad
Bernd Euler Joachim Möller
Industrial Solutions and Services(I&S)
Johann Löttner
Peter Drexel, Dr.-Ing.E.h. Alfred Frank
Siemens Dematic AG (SD)
Heinrich Hiesinger, Dr.-Ing.
Vincenzo GioriHubert Ovenhausen Rolf Renz
Siemens Building Technologies AG(SBT)
Automation and Control
Klaus Voges
Andreas KleyNorbert KönigRandy H. Zwirn
Power Generation(PG)
Udo Niehage, Dr.-Ing.
Hans-Jürgen Schloß, Dr.-Ing.
Power Transmission andDistribution (PTD)
Power
Hans M. Schabert
Hans-Dieter BottFriedrich Smaxwil
Transportation Systems(TS)
Wolfgang Dehen
Klaus Egger, Dr.-Ing. Günter HauptmannReinhard Pinzer
Siemens VDO Automotive AG(SV)
Transportation
Heinz-Joachim Neubürger
Karl Heinz MidunskyAlbrecht Schäfer, Dr. jur.
Corporate Finance (CF)
Jürgen Radomski
Günther G. Goth
Corporate Personnel (CP)
Claus Weyrich, Prof. Dr.phil. Dr.-Ing.E.h.
Winfried Büttner, Prof. Dr.-Ing.
Corporate Technology (CT)
Heinrich v. Pierer, Dr. jur. Dr.-Ing.E.h.
Klaus Kleinfeld, Dr. rer.pol.**Pamela KnappVolkhart P. Matthäus
Heinrich v. Pierer,Dr. jur. Dr.-Ing.E.h., President and Chief Executive OfficerHead of CD Special responsibilities: CC, CT, ECR
Corporate Executive Committee
Heinz-Joachim NeubürgerHead of CF Special responsibilities: SFS, SRE
Jürgen RadomskiHead of CPSpecial responsibilities: Med, Osram,MCP
Johannes FeldmayerSpecial responsibilities: SBT, CIO, GPLEurope
Klaus Kleinfeld, Dr. rer.pol. Special responsibilities: ICM, ICN, SBS Africa, Middle East, C.I.S.
Edward G. Krubasik, Prof. Dr. rer.nat. Special responsibilities: SD, SV, TS
Uriel J. Sharef, Dr. rer.pol. Special responsibilities: PG, PTDThe Americas
Corporate Development (CD)
Regional Offices, Regional Companies, Representative Offices, agencies
Regional organization
Managing Board of Siemens AG*
* see also page 9** temporarily assigned
Rudi Lamprecht
Joe Kaeser Lothar Pauly
Information and CommunicationMobile (ICM)
Automation and Drives(A&D)

Financing and Real Estate
Corporate Centers
Erich R. Reinhardt, Prof. Dr.-Ing.
Hermann Requardt, Dr.phil.nat. Götz Steinhardt
Medical Solutions(Med)
Medical
Wolf-Dieter Bopst, Dr.oec.publ.
Jörg Schaefer, Dr.-Ing. Thomas Seeberg, Dr. rer.pol.
Osram GmbH
Lighting
Herbert Lohneiß, Dr. rer.nat.
Johannes Schmidt
Siemens Financial Services GmbH (SFS)
Jochen Scharpe, Dr. rer.pol. Karl-Heinz Seibert
Siemens Real Estate(SRE)
. Klaus Wucherer, Prof. Dr.-Ing. Special responsibilities: A&D, I&SAsia, Australia
Thomas GanswindtHead of ICN
Rudi LamprechtHead of ICM
Erich R. Reinhardt, Prof. Dr.-Ing. Head of Med
Claus Weyrich, Prof. Dr.phil. Dr.-Ing.E.h. Head of CT
Corporate Communications (CC)Eberhard Posner, Dr. rer.oec.
Corporate Information and Operations(CIO)Friedrich Fröschl, Dr. rer.nat.
Global Procurement and Logistics (GPL)Erich Hautz, Dr. rer.comm.
Chief Economist /Corporate Relations(ECR)Bernd Stecher, Prof. Dr.sc.pol.
Management Consulting Personnel (MCP)Karl-Heinz Sämann, Dr.-Ing.
As of January 1, 2004
Members of the Supervisory Board are listed on page 190–91.

“Our aim is to continuallyincrease the value of theCompany – your Company.”
Siemens Aktiengesellschaft Order no. A19100-F-V60-X-7600


![Download [1.10 MB]](https://static.fdocuments.us/doc/165x107/589f1bfb1a28ab9f498c3b83/download-110-mb.jpg)