Go Figure? - WOUB - WOUB Public Media
122
Interactive Multimedia Mathematics Resources for Grades 5-7 www.woub.org/gofigure
Transcript of Go Figure? - WOUB - WOUB Public Media
Interactive Multimedia Mathematics Resources for Grades 5-7
www.woub.org/gofigure
Go Figure?
Interactive Multimedia Mathematics Resource Kit for Teachers and Their Students in Grades 5-7
The Go Figure? Interactive Mathematics Resources Kit – including an interactive CD-ROM edu-game, eight dramatic video programs on DVD, and a Web Site with a Teacher Resources Guide – was produced by the WOUB Center for Public Media at Ohio University. The multimedia kit was designed for teachers and their students in grades 5-7. These curriculum resources are also appropriate for remediation of high school-aged students. The goal of Go Figure? is to help students prepare for the Ohio Achievement Tests in mathematics.
Permission to copy this guide in whole or part is given to educators and parents.
For information please contact:
Go Figure? WOUB Center for Public Media
9 South College Street Athens, OH 45701
(800) 825-1771 [email protected]
©2006 Ohio University
Go Figure? Introduction & Overview - i -
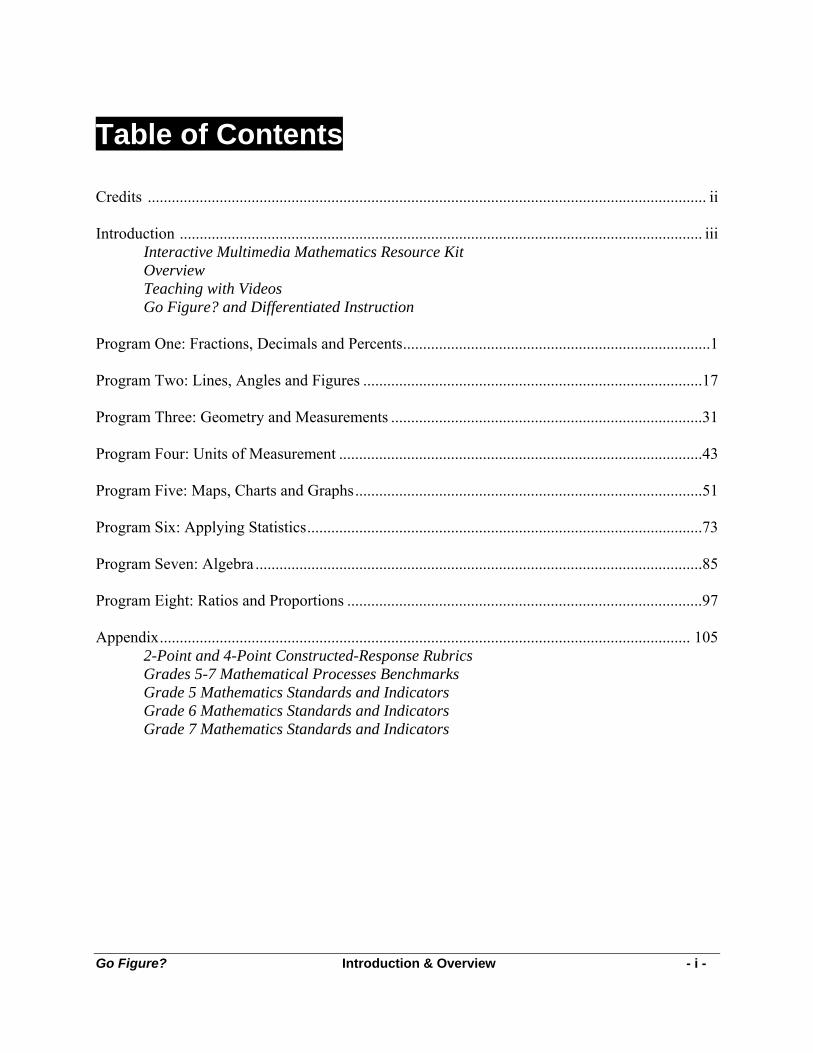
Table of Contents
Credits ............................................................................................................................................ ii Introduction ................................................................................................................................... iii Interactive Multimedia Mathematics Resource Kit Overview Teaching with Videos Go Figure? and Differentiated Instruction Program One: Fractions, Decimals and Percents.............................................................................1 Program Two: Lines, Angles and Figures .....................................................................................17 Program Three: Geometry and Measurements ..............................................................................31 Program Four: Units of Measurement ...........................................................................................43 Program Five: Maps, Charts and Graphs.......................................................................................51 Program Six: Applying Statistics...................................................................................................73 Program Seven: Algebra ................................................................................................................85 Program Eight: Ratios and Proportions .........................................................................................97 Appendix..................................................................................................................................... 105 2-Point and 4-Point Constructed-Response Rubrics Grades 5-7 Mathematical Processes Benchmarks Grade 5 Mathematics Standards and Indicators Grade 6 Mathematics Standards and Indicators Grade 7 Mathematics Standards and Indicators

Go Figure? Introduction & Overview - ii -
Go Figure? Credits
Resources Guide Revised Version, 2006
Jayne Stehle, M. A., Guide Editor
Educational Technology for Southeastern Ohio (eTSEO)
Sue Nichols, M. Ed. Mathematics Education Instructor, College of Education
Ohio University
Angela Malone, M. Ed. Mathematics Educator, Athens High School
Paige Flemming, B. S.
Mathematics Educator, Marietta Middle School
Resources Guide Original Version, 1997
© WVIZ, Cleveland and WOUB, Ohio University
William J. Hunt, M. A. Guide Writer Mathematics Educator (Retired), Mayfield City Schools, Ohio
Margaret Raub Hunt, Ed. D., Guide Writer
Executive Director, Ohio Council of Teachers of Mathematics
New Image Graphics, Editorial Supervision
Go Figure? Project 2006
Executive Producer Mark Brewer, MPA, Associate Director
WOUB Center for Public Media
Project Director Fred Charles Harner, M.A., Executive Director
Educational Technology for Southeastern Ohio (ETSEO)
Multimedia Content/Curriculum Developer Jayne Stehle, M. A.
Educational Technology for Southeastern Ohio (ETSEO)
The Go Figure? project funding was provided by a grant from eTech Ohio, a State of Ohio Commission whose mission is to advance education and accelerate the learning of all Ohioans
through the use of technology.
Go Figure? Introduction & Overview - iii -
Go Figure? Resource Kit Go Figure? Interactive Multimedia Mathematics Resources for Grades 5-7 components:
• DVD Dramatic Video Programs • CD-ROM Edu-Game • Web Site: www.woub.org/gofigure
Presented in a fun and creative way, each of the eight dramatic programs on the Go Figure? DVD can be used as an introduction to or a review of basic mathematics concepts. Go Figure? may be used in a classroom or intervention setting. The CD-ROM edu-game was designed for use by students on an individual basis. The object of the edu-game is to solve a mystery. In order to do this, the student must solve mathematics problems in the specific content areas presented by the DVD dramatic video series. Consequently, programs on the DVD are used to generate interest in and enthusiasm for learning mathematics concepts, while the CD-ROM edu-game allows students to practice the concepts in a challenging game format. The Web Site, www.woub.org/gofigure, provides the following resources:
• Teacher Resources Guide – The downloadable guide provides Ohio Mathematics Academic Content correlations, instructional strategies, episode content, mathematics content and teacher notes that will clarify some of the ideas presented in each program in the DVD series.
• Challenging student worksheets with answer keys • 2-Point and 4-Point Constructed Response Rubrics • Ohio Academic Content Indicators for Mathematics – Grades 5, 6, and 7 • Internet Resources for:
o Differentiated Instruction o Virtual Math Manipulatives o Ohio Resources for Mathematics Education
Go Figure? Introduction & Overview - iv -
Overview The Go Figure? digital video programs help students review for the mathematics section of the Ohio Academic Achievement Tests. The topics covered in these programs address critical objectives found in the tests, but more importantly, address those items that are frequently missed by students. All eight programs are set in an abandoned high school, Etna High, in the fictional city of Enigma, Ohio. The school was closed after the 500 students and staff disappeared on June 13, 1966. The mystery of the disappearance has been kept shrouded in secrecy, because the residents of Enigma won’t discuss it. A high school student, Chris, mysteriously receives a letter with a key to the high school building. She convinces her friend, Carter, to accompany her on a search to unravel the mystery. As they investigate the interior of the high school, they encounter Pythagleo, the resident custodian. Pythagleo has been waiting 40 years for the return of the 500 students and staff. As Pythagleo states, “How strange is your world?” The unexplained, the aliens, and the weird happenings make for an enticing backdrop to study numbers, lines, planes, measurement, algebra, and more. The mystery continues in the CD-ROM edu-game without Pythagleo or Carter. The voice of Chris, now trapped in the school, explains how the game works. Mathra, a mysterious mathematical maniac, delights in challenging students to explore Etna High. Inanimate objects have a life of their own – a book flips its pages incessantly, a trombone seems to play by itself, a skeleton pops out of a locker. Students solve problems to calm the objects and move from room to room. The solution to the mystery waits in the school’s attic. The Teacher Resources Guide provides Ohio Mathematics Academic Content correlations, instructional strategies, episode content, mathematics content and teacher notes that will clarify some of the ideas presented in each program in the DVD series. Worksheets provide challenging practice on content skills. Answer keys and grading rubrics are provided.
Go Figure? Teaching With Videos - v -
Teaching with Videos Before Viewing
• Before viewing, provide students with a task to focus their attention on a particular concept or information that you want to emphasize.
o Ask questions to which the video can provide answers or provide direction for the viewing.
o Introduce unfamiliar vocabulary – as needed. o Provide information or an activity to make the video’s content clearer – as needed.
During Viewing
• During viewing, the instructor should: o Lights on whenever possible during viewing to indicate that the video is an integral,
active part of the lesson. o Pause. Require interaction with the video. While the video is on pause, check for
understanding, or for student forecasting, or to point out details. Ask questions to check comprehension. Require students to record information, make predictions, analyze what they’ve
seen, draw a diagram, etc. Examine a chart/formula/image more closely.
o View a portion of the video in a “no video” or “no audio” mode to encourage student input, speculation, and/or assessment.
After Viewing
• After viewing, follow up to reinforce concepts. Consider these ideas: o A student-centered project. o An investigation based on some concept or topic from the video. o Internet activities – especially math manipulatives web sites. o Hands-on activities to extend learning or to practice a skill or skills. o Journal writing.
Other Sources National Teacher Training Institute: Video Utilization Strategies http://www.thirteen.org/edonline/ntti/resources/video2.html “Video in Theory and Practice: Issues for Classroom Use and Teacher Video Evaluation” David Denning, University of Victoria, British Columbia Adobe Acrobat PDF file downloadable at http://ebiomedia.com/downloads/VidPM.pdf
Go Figure? Differentiated Instruction - vi -
Differentiated Instruction Both the Go Figure? DVD dramatic videos and the Go Figure? CD-ROM edu-game • are high interest level and can capture the interest of students with low motivation. • can be used for enrichment for students at lower grade levels than the target audience. • can be used for remediation for students at higher grade levels than the target audience The eight Go Figure? DVD dramatic videos • are interesting, easy to understand video instruction on key mathematics skills. • can be viewed individually, in pairs, or in heterogeneous groups. • can be reviewed repeatedly for those who want or need extra time. • may be stopped at any time to check for understanding of content. • provide for adjustments in volume levels. The Go Figure? Teacher Program Guide • are available in electronic form. They contain information and worksheets with an abundance of
sample problems that may be reproduced and adjusted for size, font clarity, color preference, or they may be read to students with text-to-speech devices.
• worksheets are designed so that each problem has a “Teacher” option. Students may choose “Teacher” instead of or in conjunction with answering questions whenever they want help or guidance from an instructor.
The Go Figure? CD-ROM edu-game • has built in instructional materials to aid the student in solving problems. • has help tip material that may be accessed as often as desired. • can be played individually or collaboratively. • “reads” visually displayed text aloud for all problems and help screens. • has the option of turning off /turning on the sound and the reading of text as desired. • is un-timed. Text remains on the screen as long as a student desires. Four Ways to Differentiate Instruction http://members.shaw.ca/priscillatheroux/differentiating.html
1. Differentiate the content/topic. 2. Differentiate the process/activities. 3. Differentiate the product. 4. Differentiate by manipulating the environment or accommodating to individual learning
styles. Other Sources “Intervention Strategies for Mathematics Teachers”. “Teaching Today”. Glencoe/McGraw Education. http://www.glencoe.com/sec/teachingtoday/subject/intervention_strategies.phtml “Math Methodology”. Computing Technology for Math Excellence. http://www.ct4me.net/math_methodology.htm

Go Figure? Differentiated Instruction - vii -
Wright, Jim. “Intervention Central”. http://www.interventioncentral.org Willis, Scott and Mann, Larry. “Differentiating Instruction: Strategies for Differentiating Instruction”. http://www.ascd.org/ed_topics/cu2000win_willis.html Willis and Mann note that the list below was adapted and condensed from the 1999 ASCD book The Differentiated Classroom: Responding to the Needs of All Learners by Carol Ann Tomlinson. Nearly all educators agree with the goal of differentiating instruction, but teachers may lack strategies for making it happen. Here are some of the many strategies—in addition to flexible grouping and tiered activities—that teachers can use to avoid lockstep instruction:
• Stations. Using stations involves setting up different spots in the classroom where students work on various tasks simultaneously. These stations invite flexible grouping because not all students need to go to all stations all the time.
• Pre-assessment. Assess students before beginning a unit of study or development of a skill. Students who do well on the pre-assessment do not continue work on what they already know.
• Task Lists. Personalized lists of tasks that a student must complete in a specified time, usually two to three weeks. Student task lists throughout a class will have similar and dissimilar elements.
• Complex Instruction. This strategy uses challenging materials, open-ended tasks, and small instructional groups. Teachers move among the groups as they work, asking students questions and probing their thinking.
• Independent Investigation. Students select their own topics, and they work with guidance and coaching from the teacher. These independent investigations, generally lasting three to six weeks, revolve around some facet of the curriculum.
• Gardner Entry Points. This strategy from Howard Gardner proposes student exploration of a given topic through as many as five avenues: narrational (presenting a story), logical-quantitative (using numbers or deduction), foundational (examining philosophy and vocabulary), aesthetic (focusing on sensory features), and experiential (hands-on).
• Problem-Based Learning. This strategy places students in the active role of solving problems in much the same way adult professionals perform their jobs.
• Student Task Selection. With this strategy, work assignments are written on cards that are placed in hanging pockets. By asking a student to select a card from a particular row of pockets, the teacher targets work toward student needs yet allows student choice.
• 4MAT. Teachers use Bernice McCarthy’s 4MAT plan of instruction for each of four learning preferences over the course of several days on a given topic. Thus, some lessons focus on mastery, some on understanding, some on personal involvement, and some on synthesis. As a result, each learner has a chance to approach the topic through preferred modes and also to strengthen weaker areas. The 4MAT quadrants are:
o Concrete experience or experiencing o Reflective observation or conceptualizing o Abstract conceptualization or applying o Active experimentation or creating
- viii -
NOTES:

Go Figure? Fractions, Decimals, and Percents - 1 - Program 1
Fractions, Decimals, and Percents Program 1 Guide The Go Figure? Interactive Multimedia Kit may be used in a classroom or intervention setting. Presented in a fun and creative way, each program on the Go Figure? DVD can be used as an introduction to or a review of basic mathematics concepts. The accompanying CD-ROM edu-game was designed for use by students on an individual basis. The object of the edu-game is to solve a mystery. In order to do this, the student must solve mathematics problems in the specific content areas presented by the DVD dramatic video series. Consequently, programs on the DVD are used to generate interest in and enthusiasm for learning mathematics concepts, while the CD-ROM edu-game allows students to practice the concepts in a challenging game format. The three main characters in each DVD video program – the mysterious Pythagleo, plus two students named Carter and Chris who are trying to solve the mystery of Etna High School – discuss the targeted math concepts. Chris, and to a lesser extent, Carter, verbalizes what each is thinking as they work through problems associated with the math concepts. The DVD programs assume that, like Chris and Carter, your students have already been introduced to the math concepts presented in the episode. The dialog may be too quick for some students. Every step that some of your students will need to solve similar problems on their own may not be mentioned in the programs. Therefore, pausing the DVD to review or present additional information will help adapt the learning situation to the needs of your students. See additional materials about teaching with videos and differentiated instruction in the Introduction of the Teacher Resources Guide. Ohio Mathematics Content Standards and Benchmarks Numbers, Number Sense, and Operations
B. Compare, order and convert among fractions, decimals and percents. C. Develop meaning for percents, including percents greater than 100 and less than 1. F. Apply number system properties when performing computations. H. Use and analyze the steps in standard and non-standard algorithms for computing with fractions,
decimals and integers. I. Use a variety of strategies, including proportional reasoning, to estimate, compute, solve and
explain solutions to problems involving integers, fractions, decimals and percents. Measurement
B. Convert units of length, area, volume, mass and time within the same measurement system. E. Use problem solving techniques and technology as needed to solve problems involving… time
and temperature. Math Content
• Three ways to write the same number: fraction, decimal, percent • Basketball and baseball statistics: fractions, decimals, and percents • Discounts and sales: fractions, decimals, and percents • Fractional part of a whole number • Add simple unlike fractions, find the common denominator, and make equivalent fractions • Reduce an improper faction to lowest terms • Compare and order discount and sale prices based on fractions, decimals, and percents • A summary of all skills covered in the episode
Go Figure? Fractions, Decimals, and Percents - 2 - Program 1
Episode Notes • Chris and Carter begin their quest to solve the mystery of the disappearance of over
500 Etna High School staff and students in 1966. They meet Pythagleo and learn that they must work with math concepts and skills in order to receive clues to the mystery.
• The actor portraying Pythagleo’s versatility allows him to take on the role of a teacher, a librarian, a chef and a custodian. He is very good at spontaneous action, as seen by Carter’s expression when being hit by the ruler.
• The actors portraying Chris and Carter, at times, admit to memorizing lines and not personally understanding the content they were presenting. This is reality and models the behavior of our students.
• Chris accuses Pythagleo of being sexist at one point in this episode. Teacher Notes Ways to express parts of a whole –
Express 7 of 10 equal parts:
Decimal .7 Percent 70% Fraction
107
Review: How to reduce proper fractions: Find the greatest common factor (GCF) for the numerator and the denominator. Divide both the numerator and the denominator by the greatest common factor. Examples:
Reduce10025 to lowest terms.
• The factors of 25 are 1 × 25, and 5 × 5. o Listed in order from least to greatest, the factors are 1, 5, 25.
• The factors of 100 are 1× 100, 2 × 50, 4 × 25, 5 × 20, and 10 × 10. o Listed in order from least to greatest, the factors are 1, 2, 4, 5, 10, 20, 25, 50, 100.
• The largest factor that is common to both lists (Greatest Common Factor) is 25.
41
251002525
2525
10025
=÷÷
=÷
Adding Fractions with Unlike Denominators Example: Example:
14
hour + 12
hour + 25
hour + 35
hour
You need a number (preferably, the smallest) that is divisible by all of the denominators: 4, 2, and 5. The least common multiple (LCM) – the common denominator – is 20.
• Multiples of 2: 2, 4, 6, 8, 10, 12, 14, 16,18, 20 • Multiples of 4: 4, 8, 12, 16, 20 • Multiples of 5: 5, 10, 15, 20
Go Figure? Fractions, Decimals, and Percents - 3 - Program 1
All of the original fractions must be changed to fractions with 20 in the denominator. Equivalent fractions are created in the process because each original fraction is always multiplied by a value that is equal to one.
Create an equivalent for each fraction and add them together.
14
x 55=
520
12
x 1010
=1020
25
x 44=
820
35
x 44=
1220
2035
Convert the improper fraction to a mixed number.
431
43
44
47 and=+=
or
431 hours
431
53
52
21
41
=+++ hours
Reduce the fraction to lowest terms.
2035
Factors of 35: 1, 5, 7, 35 Factors of 20: 1, 2, 4, 5, 10 20 Greatest Common Factor: 5
47
55
2035
=÷
Convert the mixed number into hours and minutes.
1 whole hour is 60 minutes. What is
43 of 60 minutes?
==××
=×4
18041360
4360 45 min.
431 hours = 1 hour and 45 minutes
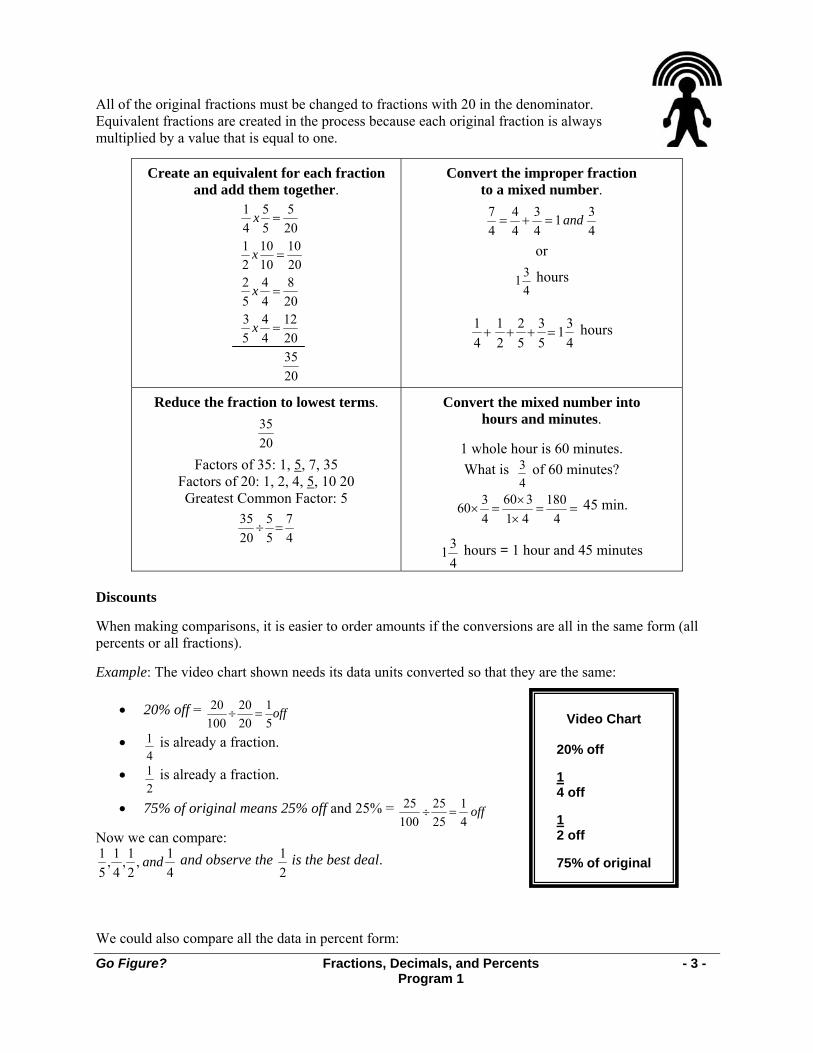
Discounts When making comparisons, it is easier to order amounts if the conversions are all in the same form (all percents or all fractions). Example: The video chart shown needs its data units converted so that they are the same:
• 20% off = off51
2020
10020
=÷
• 41 is already a fraction.
• 21 is already a fraction.
• 75% of original means 25% off and 25% = off41
2525
10025
=÷
Now we can compare: 15
, 14
,12
, and 14
and observe the 12
is the best deal.
We could also compare all the data in percent form:
Video Chart
20% off 1 4 off 1 2 off 75% of original
Go Figure? Fractions, Decimals, and Percents - 4 - Program 1
• 20% off is already a percent. • 1
2off =
10050
5050
21
=× or 50% off.
• 14
off = 10020
2020
41
=× or 25% off.
• 75% of (the) original (price) means 100 - 75 = 25 or 25% off. Comparing the results, 20% off, 25% off, 50% off, and 25% off, we observe that 50% off is the best deal.
Go Figure? Fractions, Decimals & Percents - 5 - Worksheet 1
Fractions, Decimals, and Percents Worksheet 1 Choice E, in multiple-choice questions, is always: I request help from the teacher. You may mark E in addition to one other choice if you think that you have the right answer to the question but you do not feel that you have a complete understanding of the problem. Your teacher will decide whether to use the two-point or four-point scoring rubric for problems that use numbers, pictures, or words to justify/explain your answer(s). You may request help for these questions, too. Write the word “teacher” by your answer(s). 1. Which list has three equivalent numbers?
A. 0.65, 65%, 43 B. 0.40, 45%,
54 C. 0.80, 80%,
54 D. 0.25, 25%,
21 E. Teacher
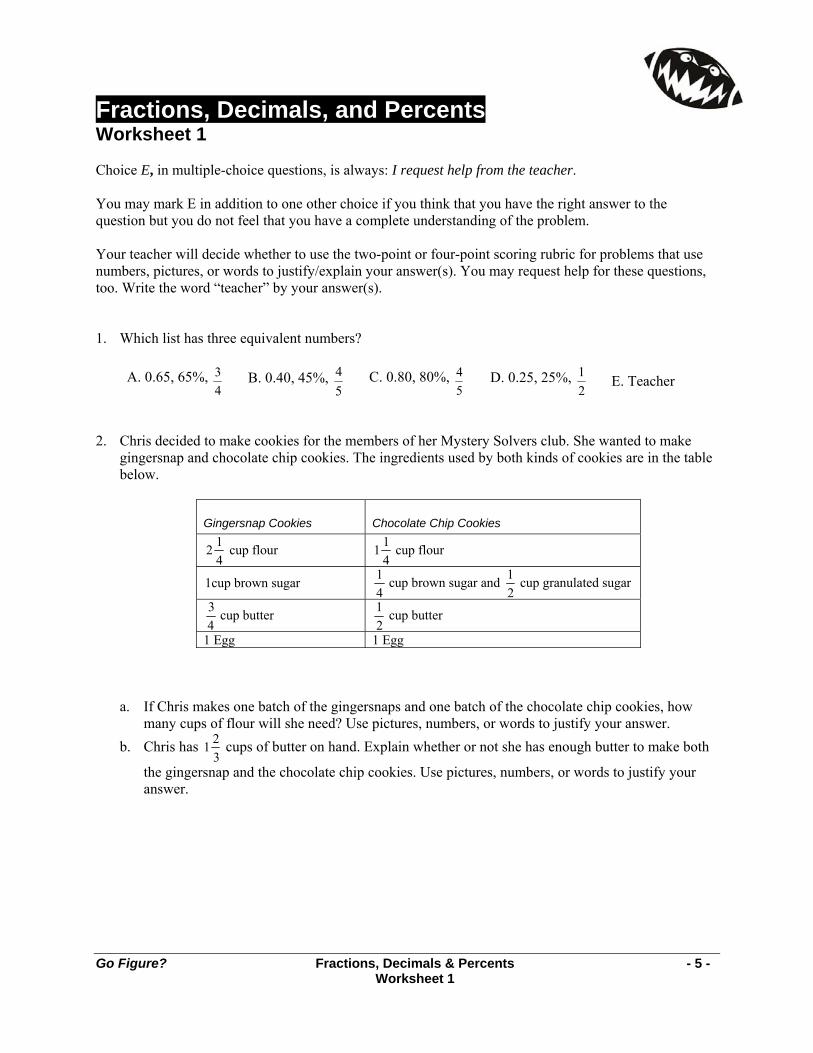
2. Chris decided to make cookies for the members of her Mystery Solvers club. She wanted to make
gingersnap and chocolate chip cookies. The ingredients used by both kinds of cookies are in the table below.
a. If Chris makes one batch of the gingersnaps and one batch of the chocolate chip cookies, how many cups of flour will she need? Use pictures, numbers, or words to justify your answer.
b. Chris has 1 23
cups of butter on hand. Explain whether or not she has enough butter to make both
the gingersnap and the chocolate chip cookies. Use pictures, numbers, or words to justify your answer.
Gingersnap Cookies Chocolate Chip Cookies
2 14
cup flour 1 14
cup flour
1cup brown sugar 14
cup brown sugar and 12
cup granulated sugar
34
cup butter 12
cup butter
1 Egg 1 Egg
Go Figure? Fractions, Decimals & Percents - 6 - Worksheet 1
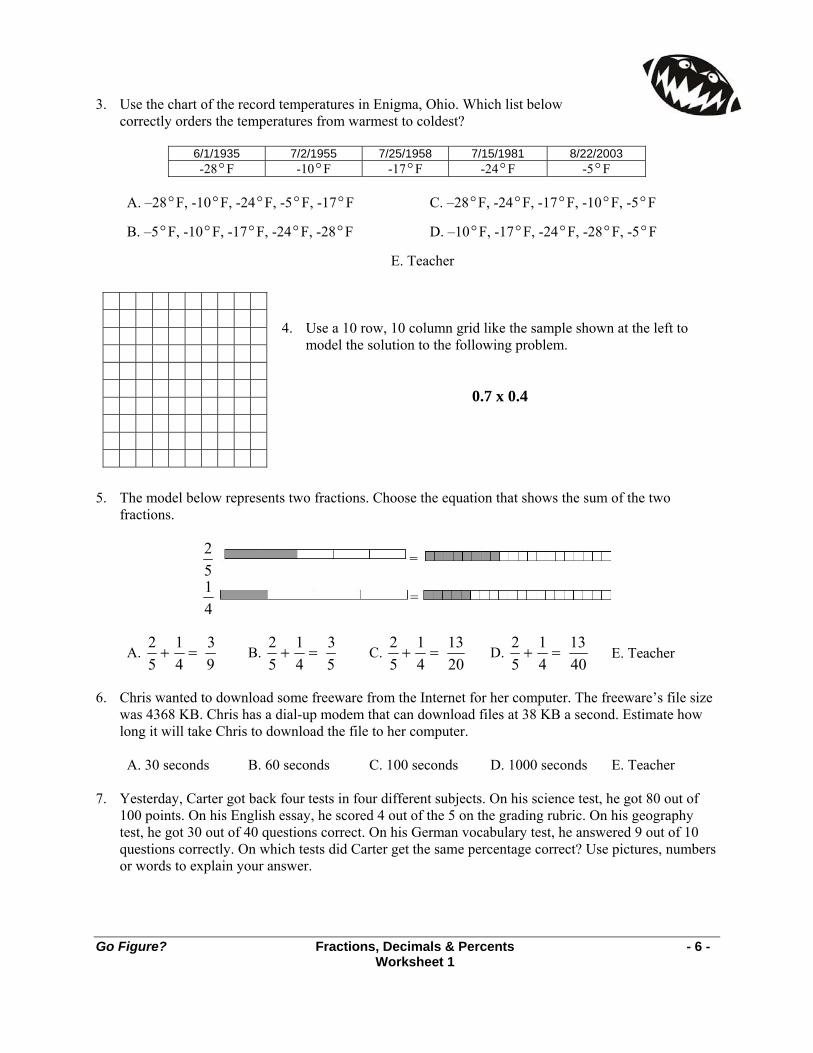
3. Use the chart of the record temperatures in Enigma, Ohio. Which list below correctly orders the temperatures from warmest to coldest?
6/1/1935 7/2/1955 7/25/1958 7/15/1981 8/22/2003 -28°F -10 °F -17 °F -24 °F -5°F
A. –28 °F, -10 °F, -24 °F, -5°F, -17°F
C. –28 °F, -24 °F, -17 °F, -10 °F, -5°F
B. –5°F, -10°F, -17°F, -24°F, -28°F
D. –10 °F, -17 °F, -24 °F, -28 °F, -5°F
E. Teacher
4. Use a 10 row, 10 column grid like the sample shown at the left to
model the solution to the following problem.
0.7 x 0.4
5. The model below represents two fractions. Choose the equation that shows the sum of the two fractions.
25
=
14
=
A. 25+
14=
39
B. 25+
14=
35
C. 25+
14=
1320
D. 25+
14=
1340
E. Teacher
6. Chris wanted to download some freeware from the Internet for her computer. The freeware’s file size
was 4368 KB. Chris has a dial-up modem that can download files at 38 KB a second. Estimate how long it will take Chris to download the file to her computer.
A. 30 seconds B. 60 seconds C. 100 seconds D. 1000 seconds E. Teacher
7. Yesterday, Carter got back four tests in four different subjects. On his science test, he got 80 out of
100 points. On his English essay, he scored 4 out of the 5 on the grading rubric. On his geography test, he got 30 out of 40 questions correct. On his German vocabulary test, he answered 9 out of 10 questions correctly. On which tests did Carter get the same percentage correct? Use pictures, numbers or words to explain your answer.
Go Figure? Fractions, Decimals & Percents - 7 - Worksheet 1
8. Carter and Chris found that downloading their favorite songs went up in price to $1.37 a song. About how many songs can Carter and Chris download for $20.00?
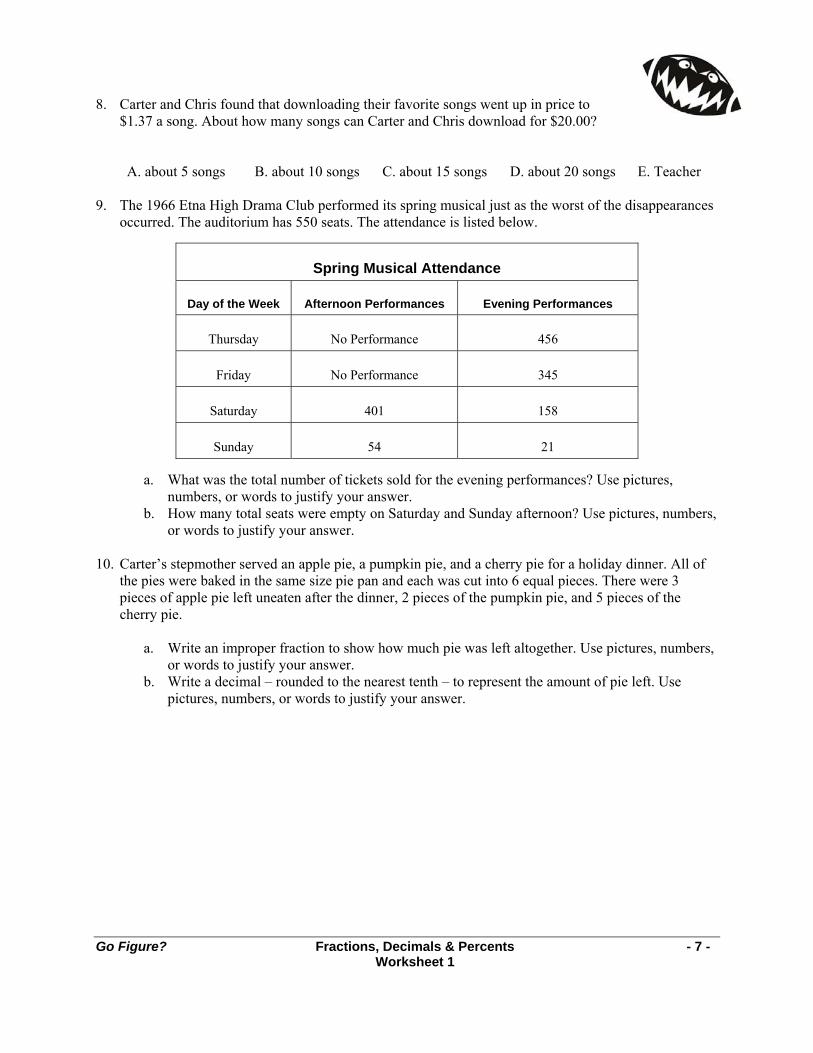
A. about 5 songs B. about 10 songs C. about 15 songs D. about 20 songs E. Teacher 9. The 1966 Etna High Drama Club performed its spring musical just as the worst of the disappearances
occurred. The auditorium has 550 seats. The attendance is listed below.
a. What was the total number of tickets sold for the evening performances? Use pictures, numbers, or words to justify your answer.
b. How many total seats were empty on Saturday and Sunday afternoon? Use pictures, numbers, or words to justify your answer.
10. Carter’s stepmother served an apple pie, a pumpkin pie, and a cherry pie for a holiday dinner. All of
the pies were baked in the same size pie pan and each was cut into 6 equal pieces. There were 3 pieces of apple pie left uneaten after the dinner, 2 pieces of the pumpkin pie, and 5 pieces of the cherry pie.
a. Write an improper fraction to show how much pie was left altogether. Use pictures, numbers,
or words to justify your answer. b. Write a decimal – rounded to the nearest tenth – to represent the amount of pie left. Use
pictures, numbers, or words to justify your answer.
Spring Musical Attendance
Day of the Week Afternoon Performances Evening Performances
Thursday No Performance 456
Friday No Performance 345
Saturday 401 158
Sunday 54 21
Go Figure? Fractions, Decimals & Percents - 8 - Worksheet 2
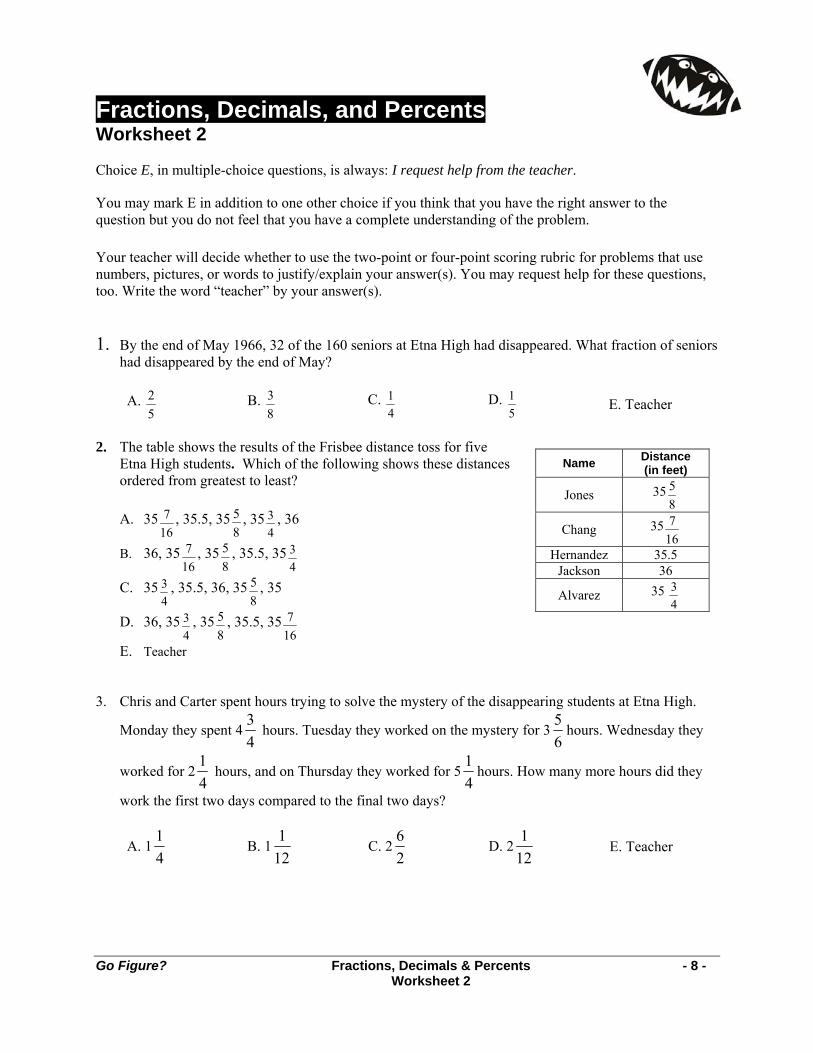
Name Distance (in feet)
Jones 3585
Chang 35167
Hernandez 35.5 Jackson 36
Alvarez 35 43
Fractions, Decimals, and Percents Worksheet 2 Choice E, in multiple-choice questions, is always: I request help from the teacher.
You may mark E in addition to one other choice if you think that you have the right answer to the question but you do not feel that you have a complete understanding of the problem. Your teacher will decide whether to use the two-point or four-point scoring rubric for problems that use numbers, pictures, or words to justify/explain your answer(s). You may request help for these questions, too. Write the word “teacher” by your answer(s). 1. By the end of May 1966, 32 of the 160 seniors at Etna High had disappeared. What fraction of seniors
had disappeared by the end of May?
A. 52 B.
83 C.
41 D.
51 E. Teacher
2. The table shows the results of the Frisbee distance toss for five
Etna High students. Which of the following shows these distances ordered from greatest to least?
A. 35
167 , 35.5, 35
85 , 35
43 , 36
B. 36, 35167 , 35
85 , 35.5, 35
43
C. 3543 , 35.5, 36, 35
85 , 35
D. 36, 3543 , 35
85 , 35.5, 35
167
E. Teacher
3. Chris and Carter spent hours trying to solve the mystery of the disappearing students at Etna High.
Monday they spent 443
hours. Tuesday they worked on the mystery for 365
hours. Wednesday they
worked for 241
hours, and on Thursday they worked for 541
hours. How many more hours did they
work the first two days compared to the final two days?
A. 141
B. 1121
C. 226
D. 2121
E. Teacher
Go Figure? Fractions, Decimals & Percents - 9 - Worksheet 2
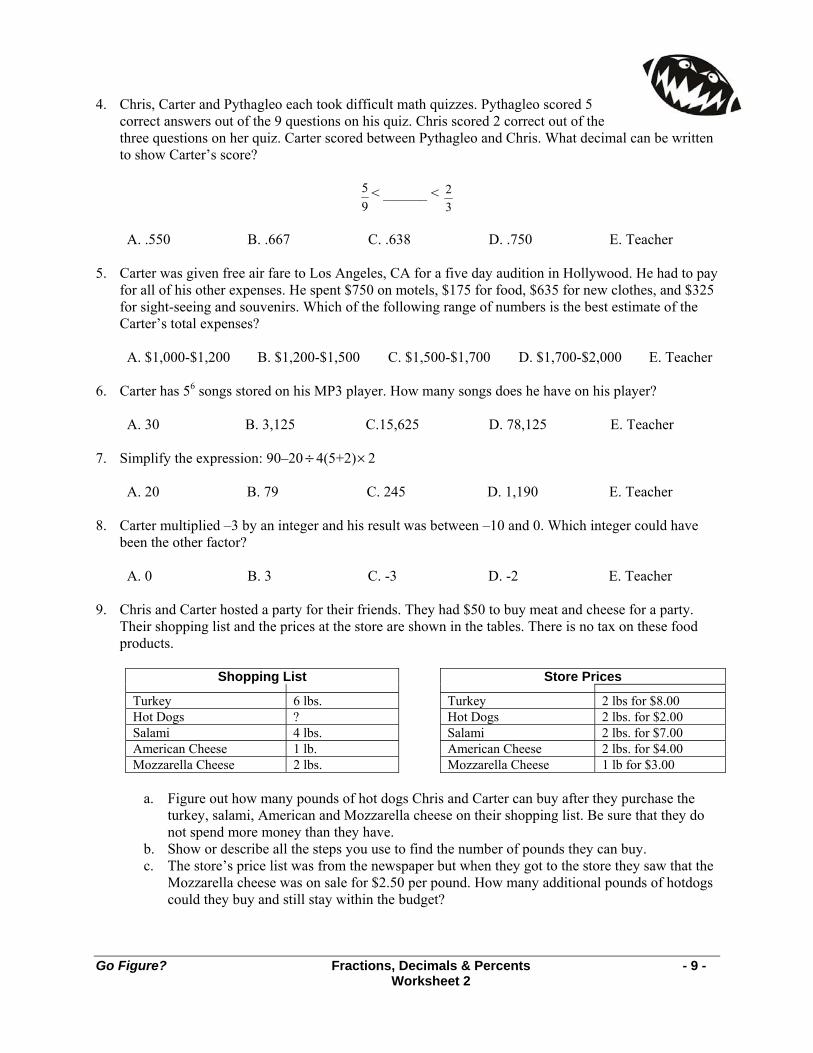
4. Chris, Carter and Pythagleo each took difficult math quizzes. Pythagleo scored 5 correct answers out of the 9 questions on his quiz. Chris scored 2 correct out of the three questions on her quiz. Carter scored between Pythagleo and Chris. What decimal can be written to show Carter’s score?
95 < ______ <
32
A. .550 B. .667 C. .638 D. .750 E. Teacher
5. Carter was given free air fare to Los Angeles, CA for a five day audition in Hollywood. He had to pay
for all of his other expenses. He spent $750 on motels, $175 for food, $635 for new clothes, and $325 for sight-seeing and souvenirs. Which of the following range of numbers is the best estimate of the Carter’s total expenses?
A. $1,000-$1,200 B. $1,200-$1,500 C. $1,500-$1,700 D. $1,700-$2,000 E. Teacher
6. Carter has 56 songs stored on his MP3 player. How many songs does he have on his player?
A. 30 B. 3,125 C.15,625 D. 78,125 E. Teacher 7. Simplify the expression: 90–20÷4(5+2)×2
A. 20 B. 79 C. 245 D. 1,190 E. Teacher 8. Carter multiplied –3 by an integer and his result was between –10 and 0. Which integer could have
been the other factor? A. 0 B. 3 C. -3 D. -2 E. Teacher
9. Chris and Carter hosted a party for their friends. They had $50 to buy meat and cheese for a party.
Their shopping list and the prices at the store are shown in the tables. There is no tax on these food products.
Shopping List Store Prices
Turkey 6 lbs. Turkey 2 lbs for $8.00 Hot Dogs ? Hot Dogs 2 lbs. for $2.00 Salami 4 lbs. Salami 2 lbs. for $7.00 American Cheese 1 lb. American Cheese 2 lbs. for $4.00 Mozzarella Cheese 2 lbs. Mozzarella Cheese 1 lb for $3.00
a. Figure out how many pounds of hot dogs Chris and Carter can buy after they purchase the
turkey, salami, American and Mozzarella cheese on their shopping list. Be sure that they do not spend more money than they have.
b. Show or describe all the steps you use to find the number of pounds they can buy. c. The store’s price list was from the newspaper but when they got to the store they saw that the
Mozzarella cheese was on sale for $2.50 per pound. How many additional pounds of hotdogs could they buy and still stay within the budget?
Go Figure? Fractions, Decimals & Percents - 10 - Worksheet 2
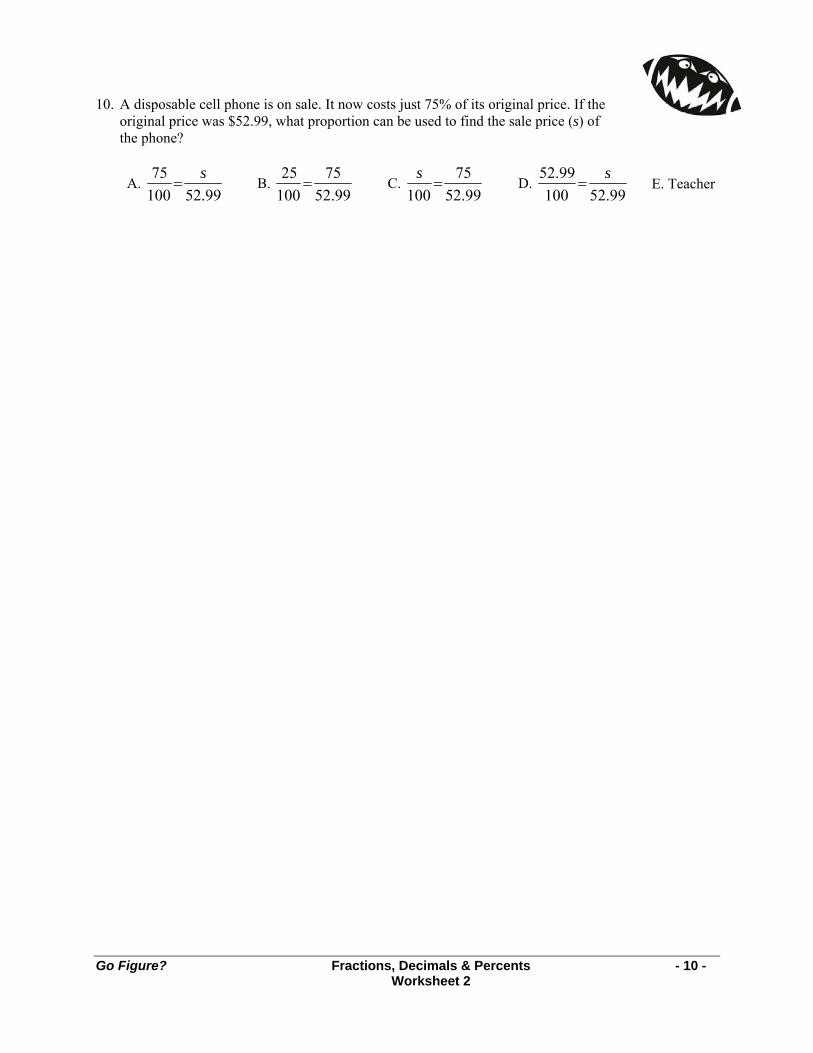
10. A disposable cell phone is on sale. It now costs just 75% of its original price. If the original price was $52.99, what proportion can be used to find the sale price (s) of the phone?
A. 99.52100
75 s= B.
99.5275
10025
= C. 99.52
75100
=s
D. 99.52100
99.52 s= E. Teacher
Go Figure? Fractions, Decimals & Percents - 11 - Worksheet 3
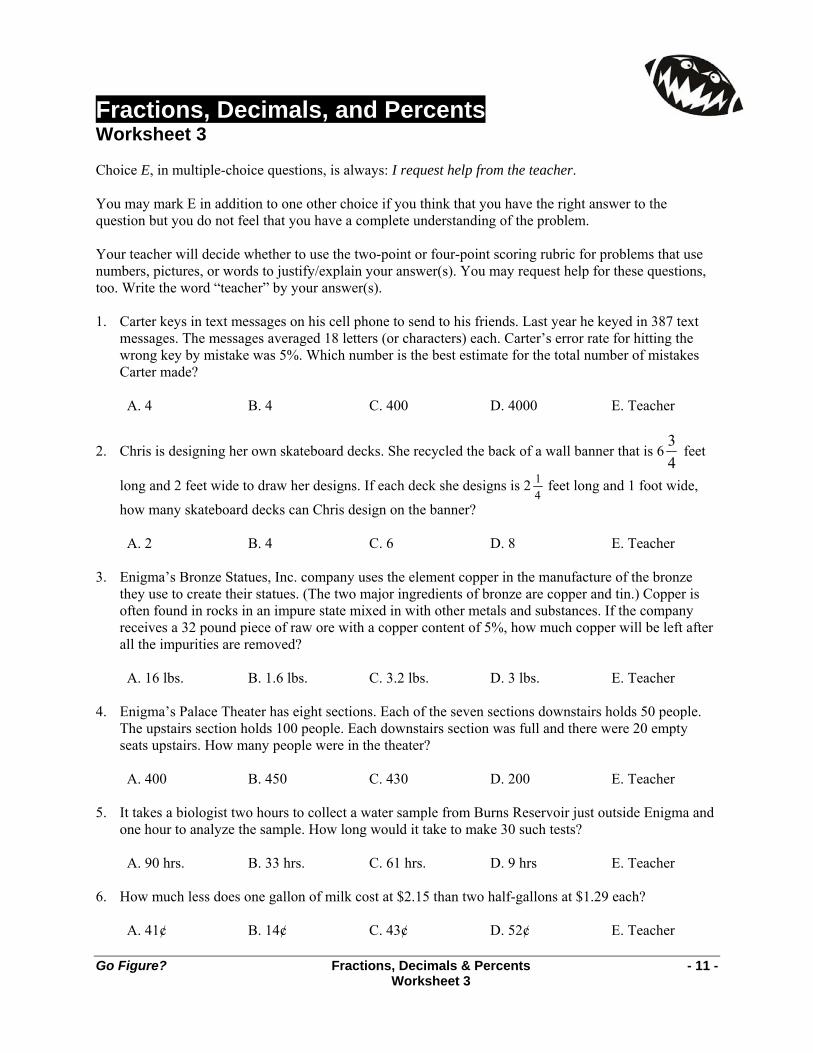
Fractions, Decimals, and Percents Worksheet 3 Choice E, in multiple-choice questions, is always: I request help from the teacher. You may mark E in addition to one other choice if you think that you have the right answer to the question but you do not feel that you have a complete understanding of the problem. Your teacher will decide whether to use the two-point or four-point scoring rubric for problems that use numbers, pictures, or words to justify/explain your answer(s). You may request help for these questions, too. Write the word “teacher” by your answer(s). 1. Carter keys in text messages on his cell phone to send to his friends. Last year he keyed in 387 text
messages. The messages averaged 18 letters (or characters) each. Carter’s error rate for hitting the wrong key by mistake was 5%. Which number is the best estimate for the total number of mistakes Carter made?
A. 4 B. 4 C. 400 D. 4000 E. Teacher
2. Chris is designing her own skateboard decks. She recycled the back of a wall banner that is 643
feet
long and 2 feet wide to draw her designs. If each deck she designs is 2 14
feet long and 1 foot wide,
how many skateboard decks can Chris design on the banner?
A. 2 B. 4 C. 6 D. 8 E. Teacher 3. Enigma’s Bronze Statues, Inc. company uses the element copper in the manufacture of the bronze
they use to create their statues. (The two major ingredients of bronze are copper and tin.) Copper is often found in rocks in an impure state mixed in with other metals and substances. If the company receives a 32 pound piece of raw ore with a copper content of 5%, how much copper will be left after all the impurities are removed?
A. 16 lbs. B. 1.6 lbs. C. 3.2 lbs. D. 3 lbs. E. Teacher
4. Enigma’s Palace Theater has eight sections. Each of the seven sections downstairs holds 50 people.
The upstairs section holds 100 people. Each downstairs section was full and there were 20 empty seats upstairs. How many people were in the theater?
A. 400 B. 450 C. 430 D. 200 E. Teacher
5. It takes a biologist two hours to collect a water sample from Burns Reservoir just outside Enigma and
one hour to analyze the sample. How long would it take to make 30 such tests?
A. 90 hrs. B. 33 hrs. C. 61 hrs. D. 9 hrs E. Teacher 6. How much less does one gallon of milk cost at $2.15 than two half-gallons at $1.29 each?
A. 41¢ B. 14¢ C. 43¢ D. 52¢ E. Teacher

Go Figure? Fractions, Decimals & Percents - 12 - Worksheet 3
7. Chris had $427.31 in her checking account. She wrote three checks, one for $25.72, one for $24.32, and one for $37.51. How much money does she have left in her account?
A. $340.00 B. $339.76 C. $339.86 D. $321.00 E. Teacher 8. Chris visited a farm where she could pick raspberries for $2.00 a quart. She decided to pick
raspberries for herself, her aunt, her mother, her older sister and her grandfather. She kept seven quarts or 25% of the berries for her own use. How many quarts of raspberries did Chris pick all together?
A. 14 qts. B. 56 qts. C. 100 qts. D. 28 qts. E. Teacher
9. The scale on a map is 12
inch = 20 miles. How far is it from one city to another if the distance is 3 14
inches?
A. 150 mi. B. 130 mi C. 50 mi D. 100 mi E. Teacher 10. Which statement is incorrect?
A. 25<
46
B. 23<
59
C. 68=
34
D. 49>
15
E. Teacher
Go Figure? Fractions, Decimals & Percents - 13 - Worksheet 4
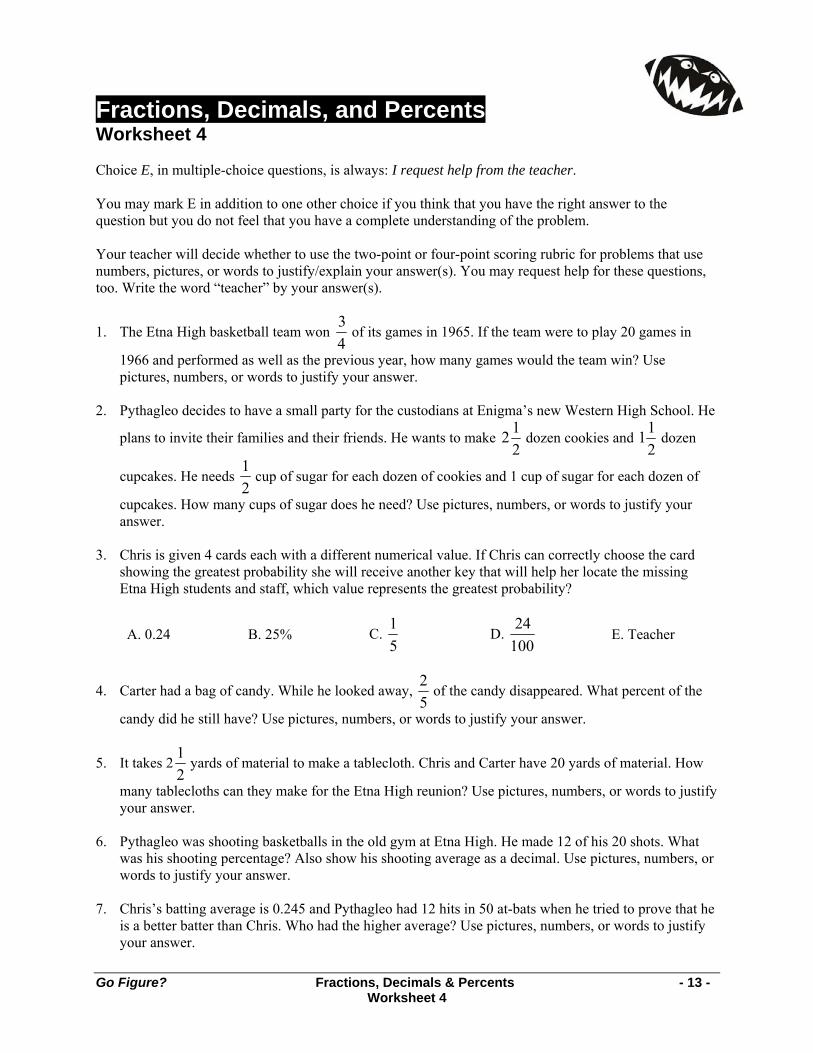
Fractions, Decimals, and Percents Worksheet 4 Choice E, in multiple-choice questions, is always: I request help from the teacher. You may mark E in addition to one other choice if you think that you have the right answer to the question but you do not feel that you have a complete understanding of the problem. Your teacher will decide whether to use the two-point or four-point scoring rubric for problems that use numbers, pictures, or words to justify/explain your answer(s). You may request help for these questions, too. Write the word “teacher” by your answer(s).
1. The Etna High basketball team won 34
of its games in 1965. If the team were to play 20 games in
1966 and performed as well as the previous year, how many games would the team win? Use pictures, numbers, or words to justify your answer.
2. Pythagleo decides to have a small party for the custodians at Enigma’s new Western High School. He
plans to invite their families and their friends. He wants to make 2 12
dozen cookies and 112
dozen
cupcakes. He needs 12
cup of sugar for each dozen of cookies and 1 cup of sugar for each dozen of
cupcakes. How many cups of sugar does he need? Use pictures, numbers, or words to justify your answer.
3. Chris is given 4 cards each with a different numerical value. If Chris can correctly choose the card
showing the greatest probability she will receive another key that will help her locate the missing Etna High students and staff, which value represents the greatest probability?
A. 0.24 B. 25% C. 51
D. 10024
E. Teacher
4. Carter had a bag of candy. While he looked away, 25
of the candy disappeared. What percent of the
candy did he still have? Use pictures, numbers, or words to justify your answer.
5. It takes 212
yards of material to make a tablecloth. Chris and Carter have 20 yards of material. How
many tablecloths can they make for the Etna High reunion? Use pictures, numbers, or words to justify your answer.
6. Pythagleo was shooting basketballs in the old gym at Etna High. He made 12 of his 20 shots. What
was his shooting percentage? Also show his shooting average as a decimal. Use pictures, numbers, or words to justify your answer.
7. Chris’s batting average is 0.245 and Pythagleo had 12 hits in 50 at-bats when he tried to prove that he
is a better batter than Chris. Who had the higher average? Use pictures, numbers, or words to justify your answer.

Go Figure? Fractions, Decimals & Percents - 14 - Program 1 Answer Keys
Fractions, Decimals and Percents Answer Keys, Program 1: Worksheets 1 - 4 Each question on every worksheet offers the students the option of marking “Teacher” instead of or in conjunction with answering the question. The “Teacher” option is included to support student understanding and achievement. Students may have as much help and guidance as they need to understand concepts and master skills. Instructors may decide whether to use the two or four point scoring rubric for constructed response problems (problems that use numbers, pictures, or words to justify/explain student answers). See the appendix for the complete rubrics.
Two-Point Scoring Rubric Four-Point Scoring Rubric 2 – Complete 1 – Partial 0 – Inadequate
4 – Complete 3 – Clear 2 – Partial 1 – Minimal 0 - Inadequate
Worksheet 1 1. C. 0.80, 80%,
54
2. a. 213 , b. yes, Student responses should show an understanding of the following concepts:
a. 213 , Add the mixed numbers:
213
411
412 =+
b. yes, Add one half and three fourths to get five fourths, then compare five fourths to five thirds:
45
42
43
21
43
=+=+ or 411 , and
411
321 ⟩
3. B. –5 F, -10 F, -17 F, -24 F, -28 F 4. .28. Student responses should show a 10 by 10 grid similar to the one below. The grid should illustrate the
problem .7 x .4 = .28. Variables: Student may shade the tenths rather than use cross hatches. They may begin in any quadrant of the grid.
5. C. 2
5+
14=
1320
6. C. 100 seconds
Go Figure? Fractions, Decimals & Percents - 15 - Program 1 Answer Keys
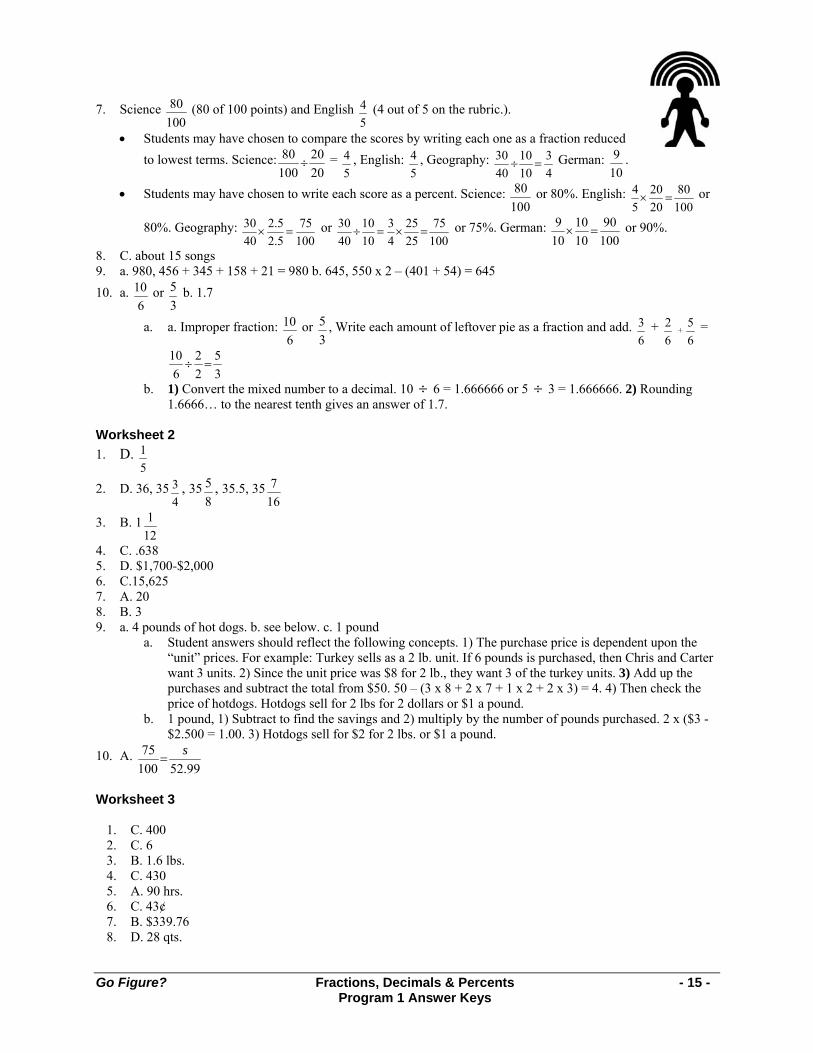
7. Science 10080 (80 of 100 points) and English
54 (4 out of 5 on the rubric.).
• Students may have chosen to compare the scores by writing each one as a fraction reduced to lowest terms. Science:
2020
10080
÷ = 54 , English:
54 , Geography:
43
1010
4030
=÷ German: 109 .
• Students may have chosen to write each score as a percent. Science: 10080 or 80%. English:
10080
2020
54
=× or
80%. Geography: 10075
5.25.2
4030
=× or 10075
2525
43
1010
4030
=×=÷ or 75%. German: 10090
1010
109
=× or 90%.
8. C. about 15 songs 9. a. 980, 456 + 345 + 158 + 21 = 980 b. 645, 550 x 2 – (401 + 54) = 645 10. a.
610 or
35 b. 1.7
a. a. Improper fraction: 6
10 or 35 , Write each amount of leftover pie as a fraction and add.
63 +
62 +
65 =
35
22
610
=÷
b. 1) Convert the mixed number to a decimal. 10 ÷ 6 = 1.666666 or 5 ÷ 3 = 1.666666. 2) Rounding 1.6666… to the nearest tenth gives an answer of 1.7.
Worksheet 2 1. D.
51
2. D. 36, 3543 , 35
85 , 35.5, 35
167
3. B. 1121
4. C. .638 5. D. $1,700-$2,000 6. C.15,625 7. A. 20 8. B. 3 9. a. 4 pounds of hot dogs. b. see below. c. 1 pound
a. Student answers should reflect the following concepts. 1) The purchase price is dependent upon the “unit” prices. For example: Turkey sells as a 2 lb. unit. If 6 pounds is purchased, then Chris and Carter want 3 units. 2) Since the unit price was $8 for 2 lb., they want 3 of the turkey units. 3) Add up the purchases and subtract the total from $50. 50 – (3 x 8 + 2 x 7 + 1 x 2 + 2 x 3) = 4. 4) Then check the price of hotdogs. Hotdogs sell for 2 lbs for 2 dollars or $1 a pound.
b. 1 pound, 1) Subtract to find the savings and 2) multiply by the number of pounds purchased. 2 x ($3 - $2.500 = 1.00. 3) Hotdogs sell for $2 for 2 lbs. or $1 a pound.
10. A. 99.52100
75 s=
Worksheet 3
1. C. 400 2. C. 6 3. B. 1.6 lbs. 4. C. 430 5. A. 90 hrs. 6. C. 43¢ 7. B. $339.76 8. D. 28 qts.
Go Figure? Fractions, Decimals & Percents - 16 - Program 1 Answer Keys
9. B. 130 mi 10. B.
95
32<
Worksheet 4 1. The teams would win 15 games. Answers should include the solution to the problem: 20 x
43 = 15
2. Pythagleo needs 243 cups or sugar. Answers should include the solution to the
problem:432
23
451
211
21
212 =+=×+×
3. B. 25%
4. 60% of the candy was left. Answers should include the solution to the problems: 1) 55 - 2
5 =
53 and 2)
10060
2020
53
=× (or 3 ÷ 5 = .6) or 60%
5. 8 tablecloths could be made. Answers should include the solution to the problem: 20 ÷212 = 8
6. Percent: 60%. Decimal .6. Answers should include the solution to the problem: 12 ÷ 20 = .6 or 60% 7. Chris had the higher average. Answers should include the solution to the problems: 1) 12 ÷ 50 = .24 or .240 and 2)
0.245 > 0.240

Go Figure? Lines, Angles, and Figures - 17 - Program 2
Lines, Angles, and Figures Program 2 Guide The Go Figure? Interactive Multimedia Kit may be used in a classroom or intervention setting. Presented in a fun and creative way, each program on the Go Figure? DVD can be used as an introduction to or a review of basic mathematics concepts. The accompanying CD-ROM edu-game was designed for use by students on an individual basis. The object of the edu-game is to solve a mystery. In order to do this, the student must solve mathematics problems in the specific content areas presented by the DVD dramatic video series. Consequently, programs on the DVD are used to generate interest in and enthusiasm for learning mathematics concepts, while the CD-ROM edu-game allows students to practice the concepts in a challenging game format. The three main characters in each DVD video program – the mysterious Pythagleo, plus two students named Carter and Chris who are trying to solve the mystery of Etna High School – discuss the targeted math concepts. Chris, and to a lesser extent, Carter, verbalizes what each is thinking as they work through problems associated with the math concepts. The DVD programs assume that, like Chris and Carter, your students have already been introduced to the math concepts presented in the episode. The dialog may be too quick for some students. Every step that some of your students will need to solve similar problems on their own may not be mentioned in the programs. Therefore, pausing the DVD to review or present additional information will help adapt the learning situation to the needs of your students. See additional materials about teaching with videos and differentiated instruction in the Introduction of the Teacher Resources Guide. Ohio Mathematics Content Standards and Benchmarks Geometry and Spatial Sense Benchmark:
A. Identify and label angle parts and the regions defined within the plane where the angle resides. D. Identify, describe and classify types of line pairs, angles, two-dimensional figures and three-
dimensional objects and their properties. G. Describe and use properties of triangles to solve problems involving angle measures and side
lengths of right triangles. Measurement Benchmark:
A. Select appropriate units to measure angles, circumference, surface area, mass and volume, using: • U. S. customary units: e.g., degrees, square feet, pounds, and other units as appropriate; • Metric units, e.g., square meters, kilograms and other units as appropriate.
Math Content
• Parallel and perpendicular: lines and planes • Protractor use • Acute, right, and obtuse angles • Complementary, supplementary, and vertical angles • Triangle: Sum of the angles = 180

Go Figure? Lines, Angles, and Figures - 18 - Program 2
Episode Notes • Carter and Chris must work with math concepts and solve problems related to lines,
angles, and rays in order to receive numbered pool balls. The numbers will be used to spell out a coded message that Pythagleo hints will explain what makes Etna High School “different”.
• Note that Chris and Carter always point out that complementary angles and supplementary angles must share a common ray. This prevents students from overlapping their angles.
Teacher Notes Use the episode to lead to discussions of Ohio Geometry and Spatial Sense content in this area. The glossary on the next page and the worksheets that accompany this guide provide information and practice.
• Grade Five: Indicators 2, 3, 5 and 7 • Grade Six: Indicators 1, 2, 3, and 4. • Grade Seven: Indicator 2
Reminders:
• The sum of the interior angles of a triangle is 180 °. • The sum of the interior angles of a quadrilateral is 360 °. • Pythagorean Theorem for right triangles: a2 + b2 = c2. The square of the hypotenuse (line
segment opposite the right angle) of a right triangle is equal to the sum of the squares of the other two sides (line segments adjacent to the right angle).
Go Figure? Lines, Angles, and Figures - 19 - Program 2
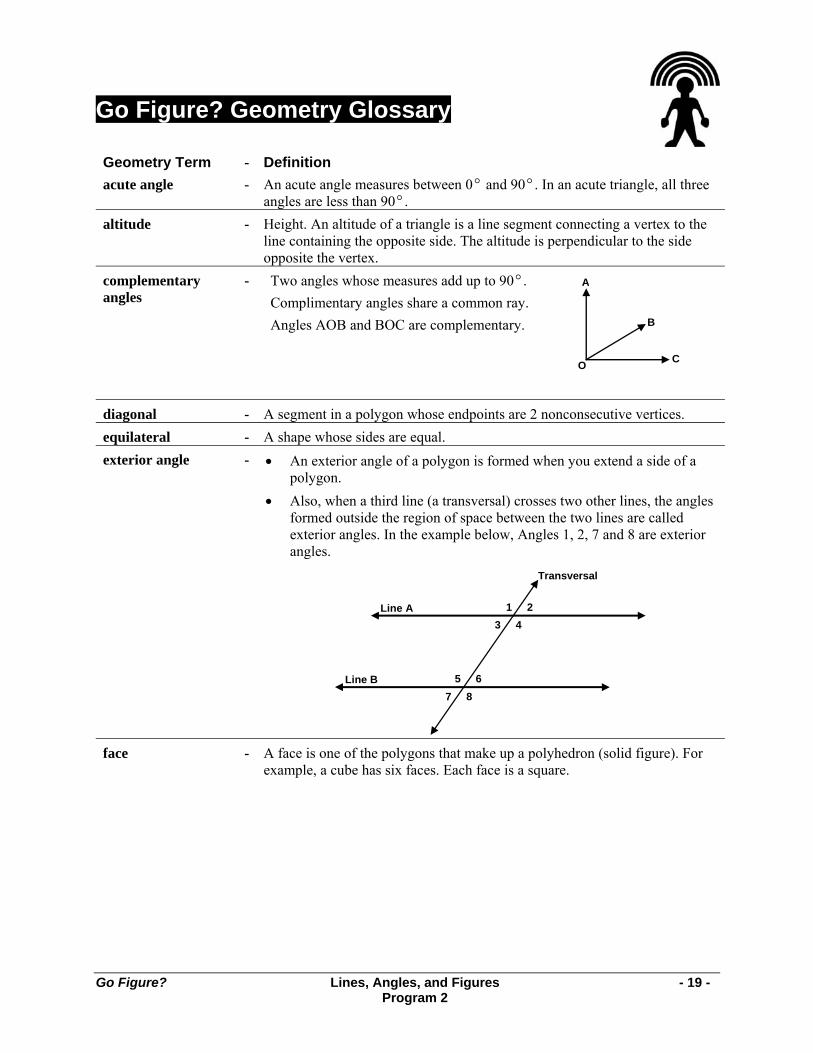
Go Figure? Geometry Glossary
Geometry Term - Definition acute angle - An acute angle measures between 0 ° and 90 °. In an acute triangle, all three
angles are less than 90°. altitude - Height. An altitude of a triangle is a line segment connecting a vertex to the
line containing the opposite side. The altitude is perpendicular to the side opposite the vertex.
complementary angles
-
Two angles whose measures add up to 90 °. Complimentary angles share a common ray. Angles AOB and BOC are complementary.
C
A
B
O
diagonal - A segment in a polygon whose endpoints are 2 nonconsecutive vertices. equilateral - A shape whose sides are equal. exterior angle - • An exterior angle of a polygon is formed when you extend a side of a
polygon. • Also, when a third line (a transversal) crosses two other lines, the angles
formed outside the region of space between the two lines are called exterior angles. In the example below, Angles 1, 2, 7 and 8 are exterior angles.
1 2 3 4
5 6 7 8
Line A
Line B
Transversal
face - A face is one of the polygons that make up a polyhedron (solid figure). For
example, a cube has six faces. Each face is a square.
Go Figure? Lines, Angles, and Figures - 20 - Program 2
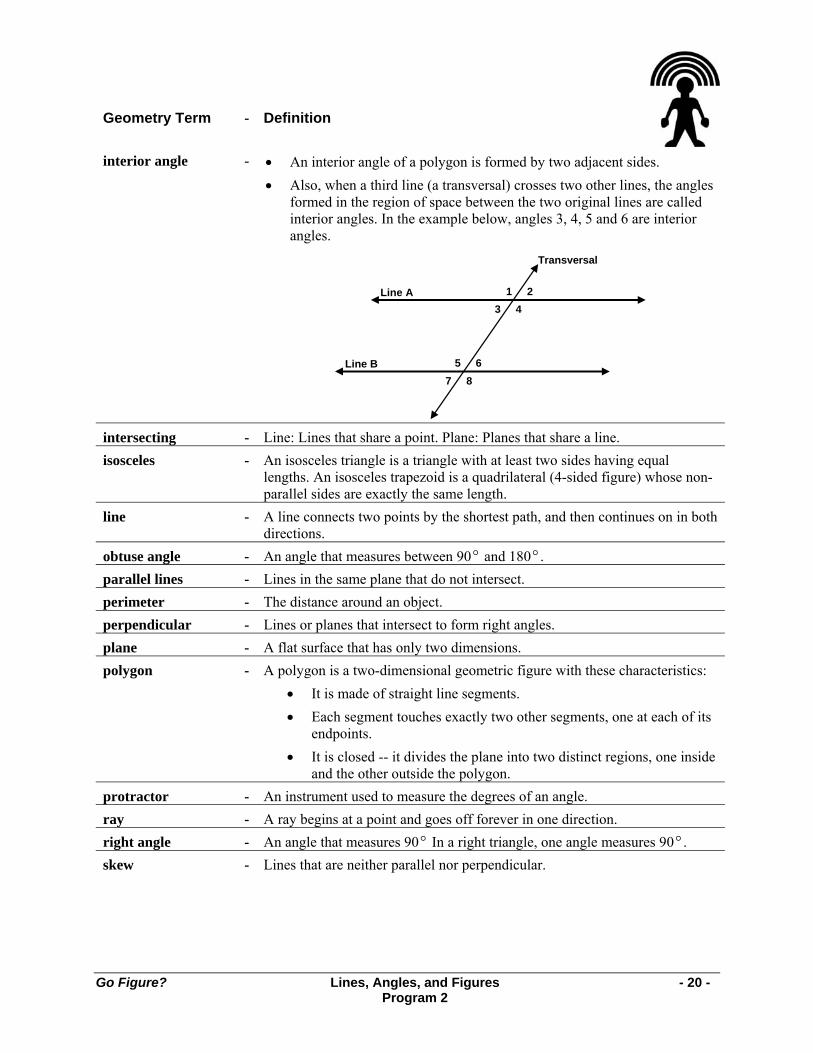
Geometry Term - Definition
interior angle - • An interior angle of a polygon is formed by two adjacent sides. • Also, when a third line (a transversal) crosses two other lines, the angles
formed in the region of space between the two original lines are called interior angles. In the example below, angles 3, 4, 5 and 6 are interior angles.
1 2 3 4
5 6 7 8
Line A
Line B
Transversal
intersecting - Line: Lines that share a point. Plane: Planes that share a line. isosceles - An isosceles triangle is a triangle with at least two sides having equal
lengths. An isosceles trapezoid is a quadrilateral (4-sided figure) whose non-parallel sides are exactly the same length.
line - A line connects two points by the shortest path, and then continues on in both directions.
obtuse angle - An angle that measures between 90 ° and 180 °. parallel lines - Lines in the same plane that do not intersect. perimeter - The distance around an object. perpendicular - Lines or planes that intersect to form right angles. plane - A flat surface that has only two dimensions. polygon - A polygon is a two-dimensional geometric figure with these characteristics:
• It is made of straight line segments. • Each segment touches exactly two other segments, one at each of its
endpoints. • It is closed -- it divides the plane into two distinct regions, one inside
and the other outside the polygon. protractor - An instrument used to measure the degrees of an angle. ray - A ray begins at a point and goes off forever in one direction. right angle - An angle that measures 90 ° In a right triangle, one angle measures 90 °. skew - Lines that are neither parallel nor perpendicular.
Go Figure? Lines, Angles, and Figures - 21 - Program 2
Geometry Term - Definition
supplementary angles
- Two angles whose measures add up to 180 °. Supplementary angles share a common ray. Angles AOB and BOC are supplementary.
CA
B
O vertex - Vertex of an angle: The common endpoint of the two rays that serve as the
sides of an angle. Vertex of a polygon: The common endpoint of two line segments that serve as two sides of a polygon. Vertex of a 3-dimensional object: The point where three or more faces of a solid shape intersect.
vertical angles - Vertical angles are formed by two intersecting lines. They are not side by side, and they do not overlap. Angles 1 and 2 are vertical angles.
1 2
Go Figure? Lines, Angles and Figures - 22 - Worksheet 1
A
B
C
Lines, Angles, and Figures Worksheet 1 Choice E, in multiple-choice questions, is always: I request help from the teacher. You may mark E in addition to one other choice if you think that you have the right answer to the question but you do not feel that you have a complete understanding of the problem. Your teacher will decide whether to use the two-point or four-point scoring rubric for problems that use numbers, pictures, or words to justify/explain your answer(s). You may request help for these questions, too. Write the word “teacher” by your answer(s). 1. In a triangle XYZ (not shown), angle X measures 42 °, and angle Y measures 65 °, what is the
measure angle Z?
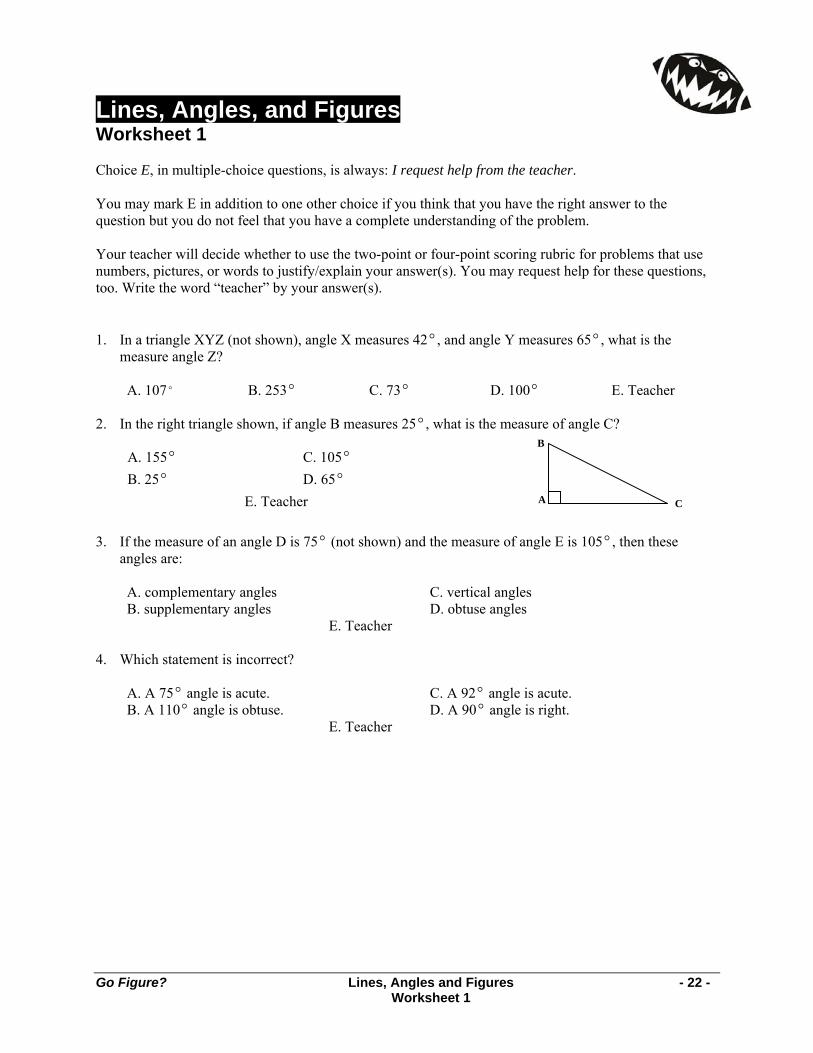
A. 107 ° B. 253° C. 73 ° D. 100° E. Teacher 2. In the right triangle shown, if angle B measures 25 °, what is the measure of angle C? 3. If the measure of an angle D is 75 ° (not shown) and the measure of angle E is 105°, then these
angles are:
A. complementary angles C. vertical angles B. supplementary angles D. obtuse angles E. Teacher
4. Which statement is incorrect?
A. A 75 ° angle is acute. C. A 92° angle is acute. B. A 110° angle is obtuse. D. A 90 ° angle is right. E. Teacher
A. 155 ° C. 105 ° B. 25 ° D. 65 ° E. Teacher

Go Figure? Lines, Angles and Figures - 23 - Worksheet 1
Line A
Line B
1 2 3 4
5 6
7 8
Angle 2 is 60°
This protractor sketch represents degree markings for #5, #6, and #7.
5. The measure of angle AOC is
A. 45° B. 180° C. 135 ° D. 90 ° E. Teacher 6. The measure of angle EOB is
A. 100 ° B. 80 ° C. 60 ° D. 90 ° E. Teacher 7. The measure of angle DOB is
A. 100 ° B. 170° C. 80 ° D. 90° E. Teacher 8. If lines A and B are parallel, and the measure of angle 2 is 60°,
then the measure of angle 3 is 9. Of the angles 1 and 2 in the figure above, which is an exterior angle?
A. 1 B. 2 C. Both D. Neither E. Teacher 10. In the figure above, the measure of angle 5 is
A. 120 ° B. 60 ° C. 90 ° D. 110° E. Teacher
0 ° , 180 ° A E 180 ° , 0 °
80 ° , 100 ° B
90 °
C 135 ° , 45 °
D 170 ° , 10 °
o
A. 120 ° C. 90 ° B. 60 ° D. 110 ° E. Teacher
Go Figure? Lines, Angles and Figures - 24 - Worksheet 2
Lines, Angles, and Figures Worksheet 2 Choice E, in multiple-choice questions, is always: I request help from the teacher. You may mark E in addition to one other choice if you think that you have the right answer to the question but you do not feel that you have a complete understanding of the problem. Your teacher will decide whether to use the two-point or four-point scoring rubric for problems that use numbers, pictures, or words to justify/explain your answer(s). You may request help for these questions, too. Write the word “teacher” by your answer(s). 1. If a triangle has sides of lengths 3 inches, 4 inches, and 6 inches, it is which type of triangle?
A. right B. scalene C. isosceles D. equilateral E. Teacher 2. If a triangle has two angles that measure 70° and 70 °, what type of triangle is this?
A. obtuse B. acute C. right D. isosceles E. Teacher 3. A STOP sign has eight sides and is called
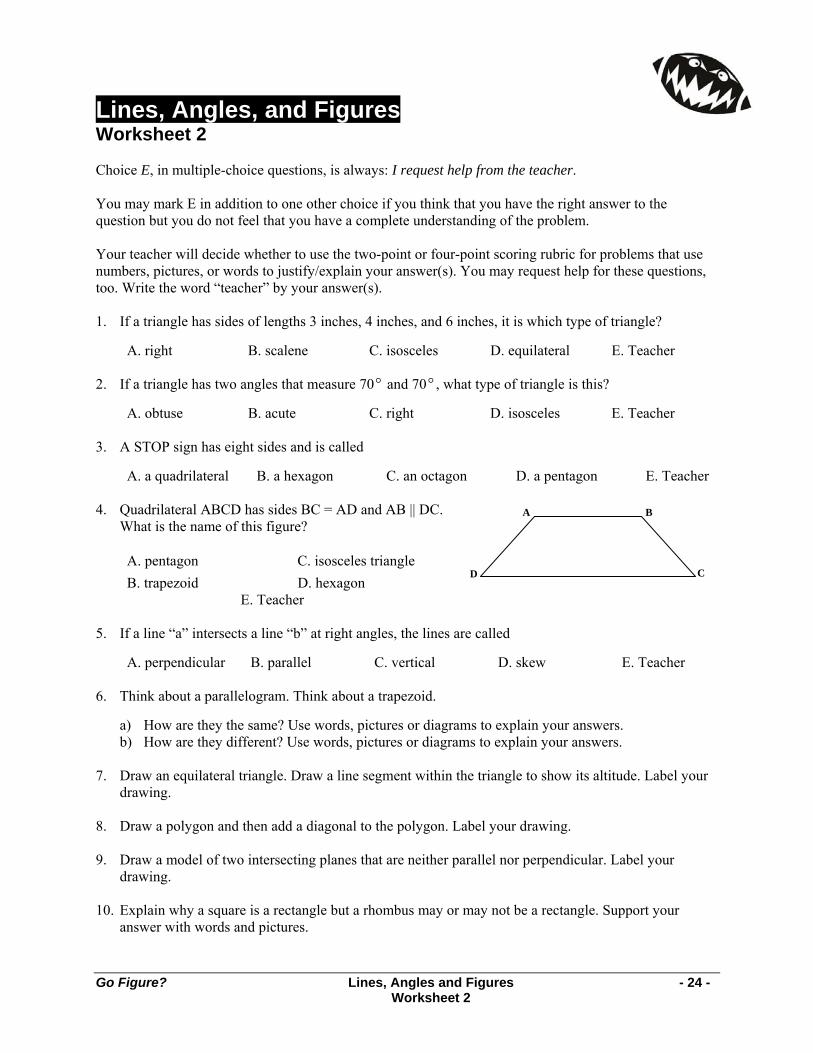
A. a quadrilateral B. a hexagon C. an octagon D. a pentagon E. Teacher 4. Quadrilateral ABCD has sides BC = AD and AB || DC.
What is the name of this figure?
A. pentagon C. isosceles triangle B. trapezoid D. hexagon E. Teacher
5. If a line “a” intersects a line “b” at right angles, the lines are called
A. perpendicular B. parallel C. vertical D. skew E. Teacher 6. Think about a parallelogram. Think about a trapezoid.
a) How are they the same? Use words, pictures or diagrams to explain your answers. b) How are they different? Use words, pictures or diagrams to explain your answers.
7. Draw an equilateral triangle. Draw a line segment within the triangle to show its altitude. Label your
drawing. 8. Draw a polygon and then add a diagonal to the polygon. Label your drawing. 9. Draw a model of two intersecting planes that are neither parallel nor perpendicular. Label your
drawing. 10. Explain why a square is a rectangle but a rhombus may or may not be a rectangle. Support your
answer with words and pictures.
A
D
B
C

Go Figure? Lines, Angles and Figures - 25 - Worksheet 3
Leveling line
Lines, Angles, and Figures Worksheet 3 Choice E, in multiple-choice questions, is always: I request help from the teacher. You may mark E in addition to one other choice if you think that you have the right answer to the question but you do not feel that you have a complete understanding of the problem. Your teacher will decide whether to use the two-point or four-point scoring rubric for problems that use numbers, pictures, or words to justify/explain your answer(s). You may request help for these questions, too. Write the word “teacher” by your answer(s). 1. Triangle ABC is shown. What is the sum of the interior angles of this figure?
A. 90º C. 270º B. 180º D. 360º E. Teacher
2. In triangle EFG, the length of EF is equal to the length of FG. GE is a different length.
Triangle EFG is which type of triangle?
A. right equilateral triangle C. right isosceles triangle B. acute equilateral triangle D. acute isosceles triangle E. Teacher
3. A classroom is a rectangular prism. Which term best describes the relationship between the plane
represented by the floor of a classroom and the plane represented by its front wall?
A. parallel B. perpendicular C. skewed D. vertical E. Teacher 4. Carter wants to project his PowerPoint
presentation but the image is crooked. The diagram shows that the projector is not level. Using a protractor, how many degrees must Carter lower the higher side of the project to make the top of the projector level with the leveling line?
A. 170 degrees B. 10 degrees C. 15 degrees D. 165 degrees E. Teacher
A
B
C
E
F
G
Go Figure? Lines, Angles and Figures - 26 - Worksheet 3
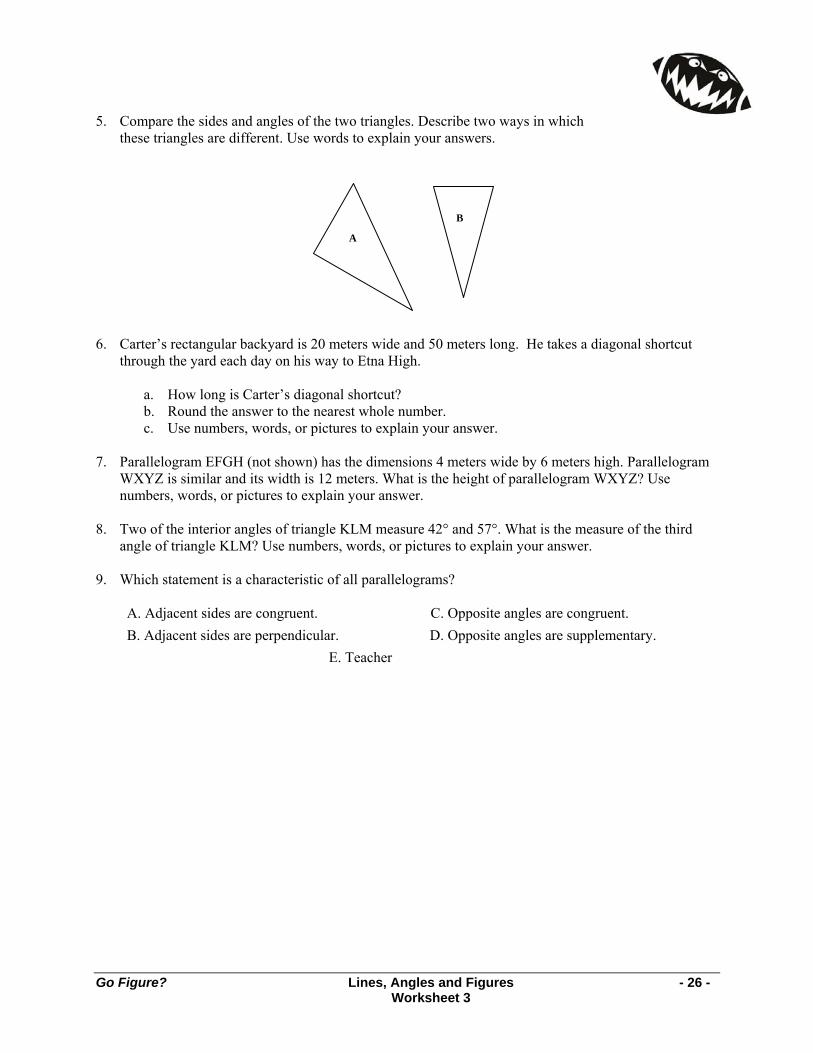
5. Compare the sides and angles of the two triangles. Describe two ways in which
these triangles are different. Use words to explain your answers.
6. Carter’s rectangular backyard is 20 meters wide and 50 meters long. He takes a diagonal shortcut
through the yard each day on his way to Etna High.
a. How long is Carter’s diagonal shortcut? b. Round the answer to the nearest whole number. c. Use numbers, words, or pictures to explain your answer.
7. Parallelogram EFGH (not shown) has the dimensions 4 meters wide by 6 meters high. Parallelogram
WXYZ is similar and its width is 12 meters. What is the height of parallelogram WXYZ? Use numbers, words, or pictures to explain your answer.
8. Two of the interior angles of triangle KLM measure 42° and 57°. What is the measure of the third
angle of triangle KLM? Use numbers, words, or pictures to explain your answer. 9. Which statement is a characteristic of all parallelograms?
A. Adjacent sides are congruent. C. Opposite angles are congruent. B. Adjacent sides are perpendicular. D. Opposite angles are supplementary. E. Teacher
A
B
Go Figure? Lines, Angles and Figures - 27 - Worksheet 3
3 feet
13 feet
Etna High School sign with shadow.
? feet
156 feet
Flagpole with shadow.
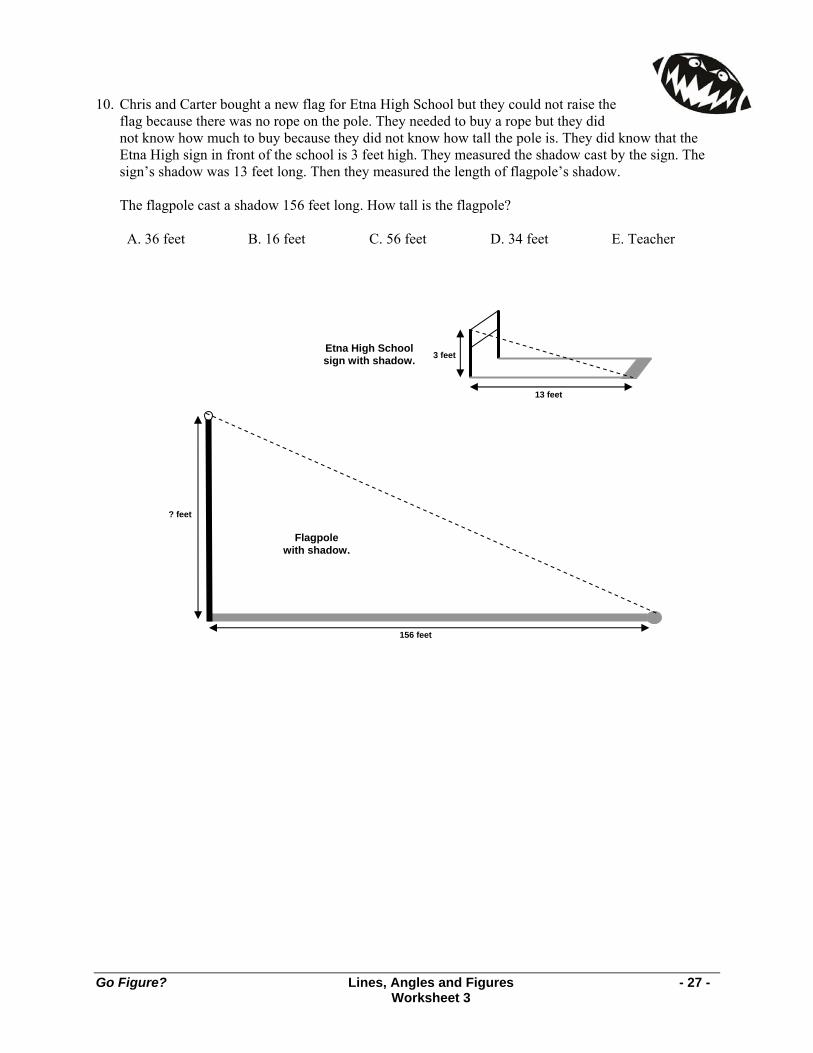
10. Chris and Carter bought a new flag for Etna High School but they could not raise the flag because there was no rope on the pole. They needed to buy a rope but they did not know how much to buy because they did not know how tall the pole is. They did know that the Etna High sign in front of the school is 3 feet high. They measured the shadow cast by the sign. The sign’s shadow was 13 feet long. Then they measured the length of flagpole’s shadow. The flagpole cast a shadow 156 feet long. How tall is the flagpole?
A. 36 feet B. 16 feet C. 56 feet D. 34 feet E. Teacher
Go Figure? Lines, Angles and Figures - 28 - Program 2 Answer Keys
Lines, Angles, and Forms Answer Keys, Program 2: Worksheets 1-3 Each question on every worksheet offers the students the option of marking “Teacher” instead of or in conjunction with answering the question. The “Teacher” option is included to support student understanding and achievement. Students may have as much help and guidance as they need to understand concepts and master skills. Instructors may decide whether to use the two or four point scoring rubric for constructed response problems (problems that use numbers, pictures, or words to justify/explain student answers). See the appendix for the complete rubrics.
Two-Point Scoring Rubric Four-Point Scoring Rubric 2 – Complete 1 – Partial 0 – Inadequate
4 – Complete 3 – Clear 2 – Partial 1 – Minimal 0 - Inadequate
Worksheet 1 1. C. 73 ° 2. D. 65 ° 3. B. supplementary angles 4. C. A 92 ° angle is acute. 5. C. 135 ° 6. A. 100 ° 7. D. 90 ° 8. B. 60 ° 9. C.1 and 2 (Angles1, 2, 7, and 8 are all exterior angles.) 10. A. 120 ° Worksheet 2 1. B. scalene 2. D. isosceles 3. C. an octagon 4. B. trapezoid 5. A. perpendicular
6. Answers should reflect the following facts: 1) A parallelogram is a quadrilateral (four-sided polygon) that has two pairs of opposite sides that are parallel. 2) A trapezoid is a quadrilateral that has one pair of opposite sides that are parallel. Students will need to identify the differences and similarities between the two figures.
7. Drawings or diagrams should reflect the following facts: 1) An equilateral triangle is a triangle with three congruent sides and three equal angles. 2) Altitude is the height of the triangle.
Parallelograms Trapezoids
Altitude
Go Figure? Lines, Angles and Figures - 29 - Program 2 Answer Keys
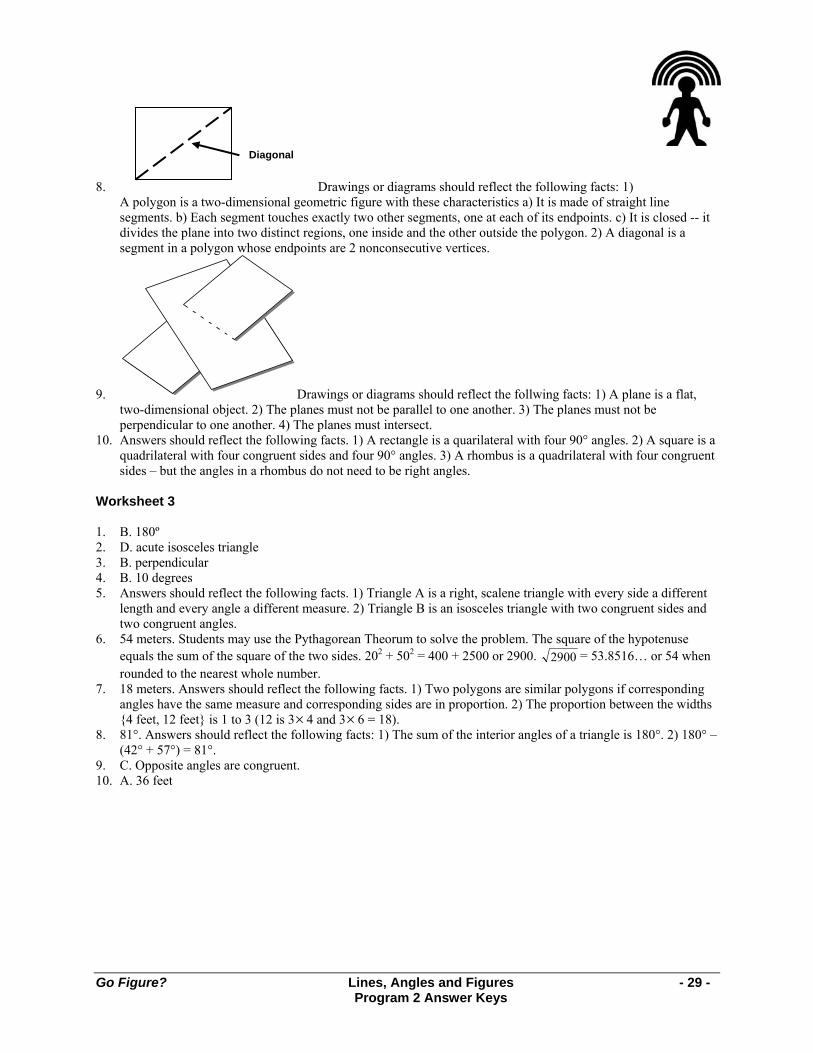
8. Drawings or diagrams should reflect the following facts: 1) A polygon is a two-dimensional geometric figure with these characteristics a) It is made of straight line segments. b) Each segment touches exactly two other segments, one at each of its endpoints. c) It is closed -- it divides the plane into two distinct regions, one inside and the other outside the polygon. 2) A diagonal is a segment in a polygon whose endpoints are 2 nonconsecutive vertices.
9.
Drawings or diagrams should reflect the follwing facts: 1) A plane is a flat, two-dimensional object. 2) The planes must not be parallel to one another. 3) The planes must not be perpendicular to one another. 4) The planes must intersect.
10. Answers should reflect the following facts. 1) A rectangle is a quarilateral with four 90° angles. 2) A square is a quadrilateral with four congruent sides and four 90° angles. 3) A rhombus is a quadrilateral with four congruent sides – but the angles in a rhombus do not need to be right angles.
Worksheet 3 1. B. 180º 2. D. acute isosceles triangle 3. B. perpendicular 4. B. 10 degrees 5. Answers should reflect the following facts. 1) Triangle A is a right, scalene triangle with every side a different
length and every angle a different measure. 2) Triangle B is an isosceles triangle with two congruent sides and two congruent angles.
6. 54 meters. Students may use the Pythagorean Theorum to solve the problem. The square of the hypotenuse equals the sum of the square of the two sides. 202 + 502 = 400 + 2500 or 2900. 2900 = 53.8516… or 54 when rounded to the nearest whole number.
7. 18 meters. Answers should reflect the following facts. 1) Two polygons are similar polygons if corresponding angles have the same measure and corresponding sides are in proportion. 2) The proportion between the widths {4 feet, 12 feet} is 1 to 3 (12 is 3×4 and 3×6 = 18).
8. 81°. Answers should reflect the following facts: 1) The sum of the interior angles of a triangle is 180°. 2) 180° – (42° + 57°) = 81°.
9. C. Opposite angles are congruent. 10. A. 36 feet
Diagonal

- 30 -
NOTES:

Go Figure? Geometry and Measurements - 31 - Program 3
Geometry and Measurements Program 3 Guide The Go Figure? Interactive Multimedia Kit may be used in a classroom or intervention setting. Presented in a fun and creative way, each program on the Go Figure? DVD can be used as an introduction to or a review of basic mathematics concepts. The accompanying CD-ROM edu-game was designed for use by students on an individual basis. The object of the edu-game is to solve a mystery. In order to do this, the student must solve mathematics problems in the specific content areas presented by the DVD dramatic video series. Consequently, programs on the DVD are used to generate interest in and enthusiasm for learning mathematics concepts, while the CD-ROM edu-game allows students to practice the concepts in a challenging game format. The three main characters in each DVD video program – the mysterious Pythagleo, plus two students named Carter and Chris who are trying to solve the mystery of Etna High School – discuss the targeted math concepts. Chris, and to a lesser extent, Carter, verbalizes what each is thinking as they work through problems associated with the math concepts. The DVD programs assume that, like Chris and Carter, your students have already been introduced to the math concepts presented in the episode. The dialog may be too quick for some students. Every step that some of your students will need to solve similar problems on their own may not be mentioned in the programs. Therefore, pausing the DVD to review or present additional information will help adapt the learning situation to the needs of your students. See additional materials about teaching with videos and differentiated instruction in the Introduction of the Teacher Resources Guide. Ohio Mathematics Content Standards and Benchmarks Measurement Benchmarks
B. Covert units of length, area, volume, mass, and time within the same measurement system. C. Identify appropriate tools and apply appropriate techniques for measuring angles, perimeter, or
circumference and area of triangles, quadrilaterals, circles and composite shapes, and surface area and volume of prisms and cylinders.
E. Using problem solving techniques and technology as needed to solve problems involving length, weight, perimeter, area, volume, time and temperature.
G. Understand and demonstrate the independence of perimeter and area for two-dimensional shapes and of surface area and volume for there-dimensional shapes.
Math Content
• Area of a rectangle • Area of a triangle • Area of a circle • Value of pi • Volume of a rectangular solid • Circumference of a circle • Perimeter
Go Figure? Geometry and Measurements - 32 - Program 3
3 rows wide
5 rows long
3 cubes wide 5 cubes long
4 cubes high
Episode Content • Carter did some outside research with old newspapers at his uncle’s house. He
discovered that the Etna High principal was the only one who did not disappear. Chris and Carter go to the principal’s office and discover his notes and a map. The principal encoded his theories about the 1966 disappearances by using geometry and measurement concepts.
Teacher Notes Use the episode to lead to discussions of Ohio Measurement and Geometry and Spatial Sense content. The formula lists below and the worksheets that accompany this guide provide information and practice.
• Grade Five: Measurement Indicators 3 and 6: Geometry Indicator 1 • Grade Six: Measurement Indicators 1, 2, 3, and 5 • Grade Seven: Indicator 1, 6, 7, 8, and 9
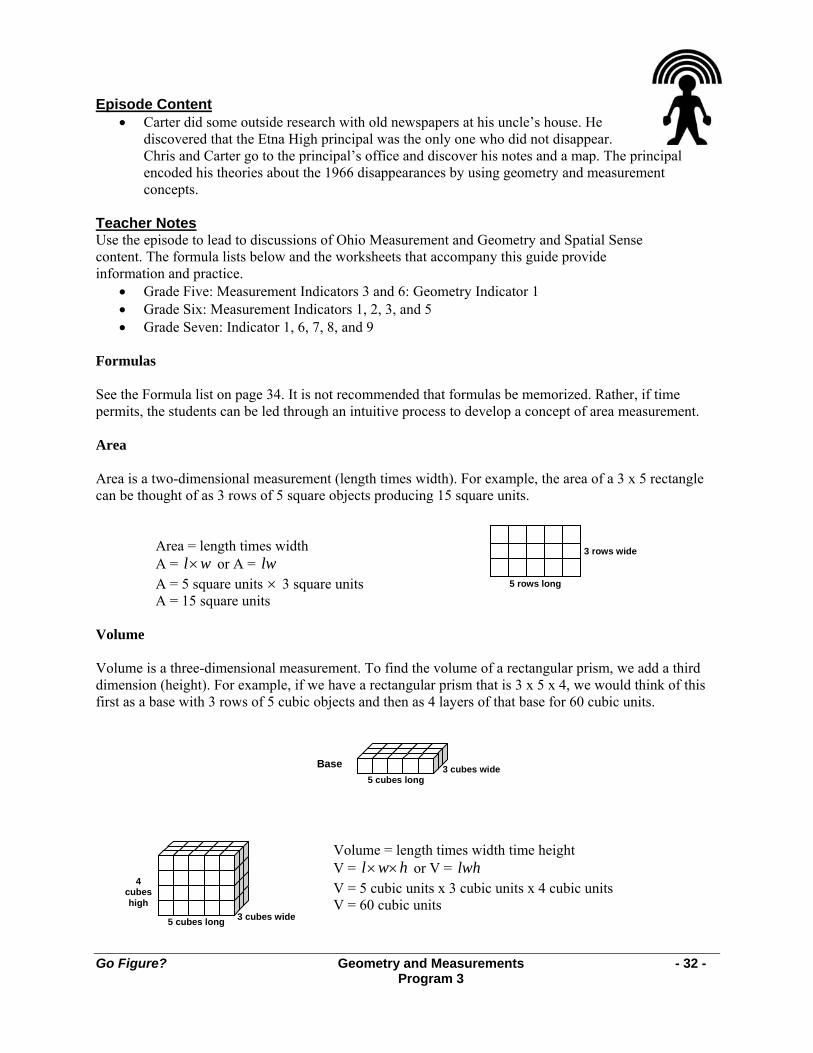
Formulas See the Formula list on page 34. It is not recommended that formulas be memorized. Rather, if time permits, the students can be led through an intuitive process to develop a concept of area measurement. Area Area is a two-dimensional measurement (length times width). For example, the area of a 3 x 5 rectangle can be thought of as 3 rows of 5 square objects producing 15 square units.
Area = length times width A = wl× or A = lw A = 5 square units × 3 square units A = 15 square units
Volume Volume is a three-dimensional measurement. To find the volume of a rectangular prism, we add a third dimension (height). For example, if we have a rectangular prism that is 3 x 5 x 4, we would think of this first as a base with 3 rows of 5 cubic objects and then as 4 layers of that base for 60 cubic units.
5 cubes long
3 cubes wideBase
Volume = length times width time height V = hwl ×× or V = lwh V = 5 cubic units x 3 cubic units x 4 cubic units V = 60 cubic units
Go Figure? Geometry and Measurements - 33 - Program 3
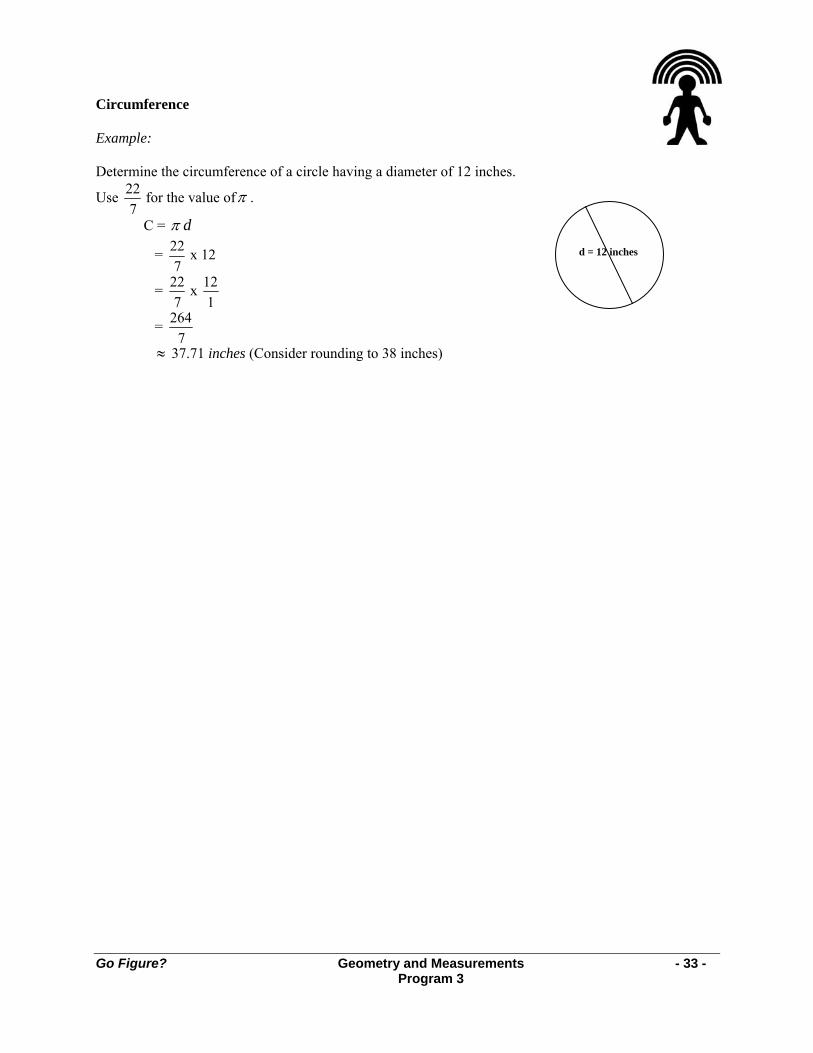
Circumference Example: Determine the circumference of a circle having a diameter of 12 inches.
Use 227
for the value ofπ .
C = dπ
= 227
x 12
= 227
x 121
= 2647
≈ 37.71 inches (Consider rounding to 38 inches)
d = 12 inches
Go Figure? Geometry and Measurements - 34 - Program 3
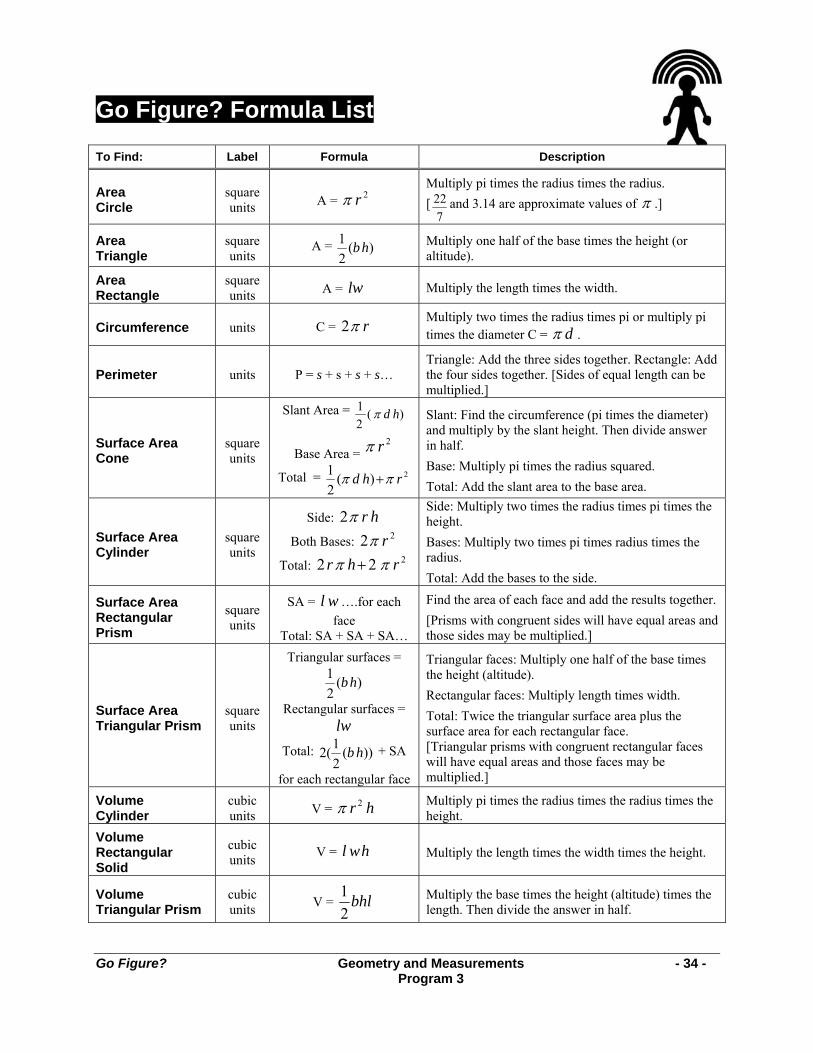
Go Figure? Formula List
To Find: Label Formula Description
Area Circle
square units A = 2rπ
Multiply pi times the radius times the radius. [
722 and 3.14 are approximate values of π .]
Area Triangle
square units
A = )(21 hb Multiply one half of the base times the height (or
altitude).
Area Rectangle
square units A = lw Multiply the length times the width.
Circumference units C = rπ2 Multiply two times the radius times pi or multiply pi times the diameter C = dπ .
Perimeter units P = s + s + s + s… Triangle: Add the three sides together. Rectangle: Add the four sides together. [Sides of equal length can be multiplied.]
Surface Area Cone
square units
Slant Area = )(21 hdπ
Base Area = 2rπ
Total = 2)(21 rhd ππ +
Slant: Find the circumference (pi times the diameter) and multiply by the slant height. Then divide answer in half. Base: Multiply pi times the radius squared. Total: Add the slant area to the base area.
Surface Area Cylinder
square units
Side: hrπ2
Both Bases: 22 rπ
Total: 222 rhr ππ +
Side: Multiply two times the radius times pi times the height. Bases: Multiply two times pi times radius times the radius. Total: Add the bases to the side.
Surface Area Rectangular Prism
square units
SA = wl ….for each face
Total: SA + SA + SA…
Find the area of each face and add the results together. [Prisms with congruent sides will have equal areas and those sides may be multiplied.]
Surface Area Triangular Prism
square units
Triangular surfaces =
)(21 hb
Rectangular surfaces = lw
Total: ))(21(2 hb + SA
for each rectangular face
Triangular faces: Multiply one half of the base times the height (altitude). Rectangular faces: Multiply length times width. Total: Twice the triangular surface area plus the surface area for each rectangular face. [Triangular prisms with congruent rectangular faces will have equal areas and those faces may be multiplied.]
Volume Cylinder
cubic units V = hr 2π Multiply pi times the radius times the radius times the
height. Volume Rectangular Solid
cubic units V = hwl Multiply the length times the width times the height.
Volume Triangular Prism
cubic units V = bhl
21
Multiply the base times the height (altitude) times the length. Then divide the answer in half.
Go Figure? Geometry and Measurements - 35 - Worksheet 1
1 2 3 4 5 6 7
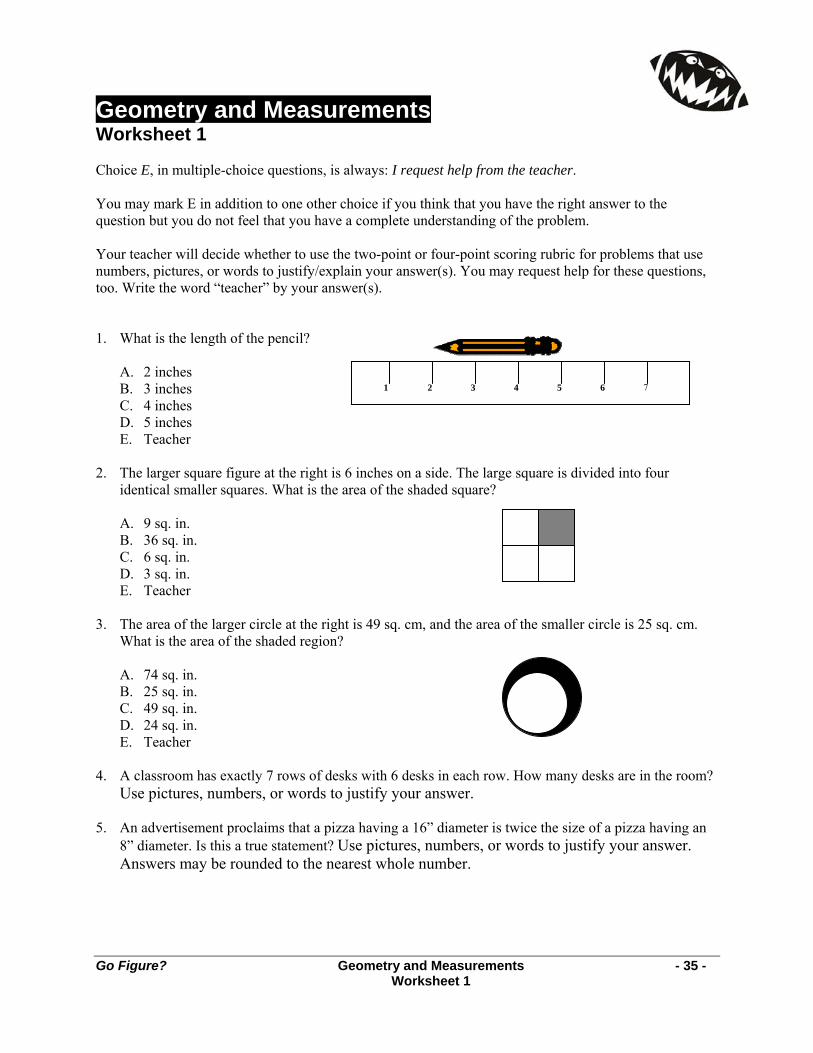
Geometry and Measurements Worksheet 1 Choice E, in multiple-choice questions, is always: I request help from the teacher. You may mark E in addition to one other choice if you think that you have the right answer to the question but you do not feel that you have a complete understanding of the problem. Your teacher will decide whether to use the two-point or four-point scoring rubric for problems that use numbers, pictures, or words to justify/explain your answer(s). You may request help for these questions, too. Write the word “teacher” by your answer(s). 1. What is the length of the pencil?
A. 2 inches B. 3 inches C. 4 inches D. 5 inches E. Teacher
2. The larger square figure at the right is 6 inches on a side. The large square is divided into four
identical smaller squares. What is the area of the shaded square?
A. 9 sq. in. B. 36 sq. in. C. 6 sq. in. D. 3 sq. in. E. Teacher
3. The area of the larger circle at the right is 49 sq. cm, and the area of the smaller circle is 25 sq. cm.
What is the area of the shaded region?
A. 74 sq. in. B. 25 sq. in. C. 49 sq. in. D. 24 sq. in. E. Teacher
4. A classroom has exactly 7 rows of desks with 6 desks in each row. How many desks are in the room?
Use pictures, numbers, or words to justify your answer. 5. An advertisement proclaims that a pizza having a 16” diameter is twice the size of a pizza having an
8” diameter. Is this a true statement? Use pictures, numbers, or words to justify your answer. Answers may be rounded to the nearest whole number.
Go Figure? Geometry and Measurements - 36 - Worksheet 1
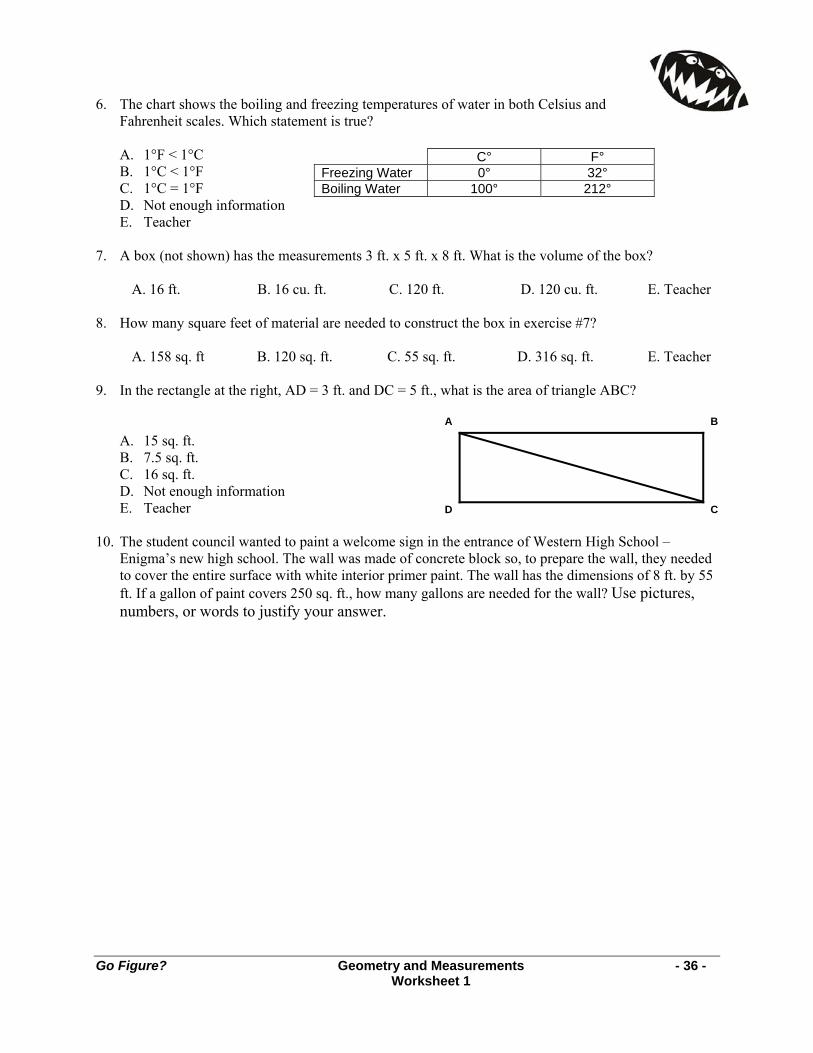
6. The chart shows the boiling and freezing temperatures of water in both Celsius and Fahrenheit scales. Which statement is true?
A. 1°F < 1°C B. 1°C < 1°F C. 1°C = 1°F D. Not enough information E. Teacher
7. A box (not shown) has the measurements 3 ft. x 5 ft. x 8 ft. What is the volume of the box?
A. 16 ft. B. 16 cu. ft. C. 120 ft. D. 120 cu. ft. E. Teacher 8. How many square feet of material are needed to construct the box in exercise #7?
A. 158 sq. ft B. 120 sq. ft. C. 55 sq. ft. D. 316 sq. ft. E. Teacher 9. In the rectangle at the right, AD = 3 ft. and DC = 5 ft., what is the area of triangle ABC?
A. 15 sq. ft. B. 7.5 sq. ft. C. 16 sq. ft. D. Not enough information E. Teacher
10. The student council wanted to paint a welcome sign in the entrance of Western High School –
Enigma’s new high school. The wall was made of concrete block so, to prepare the wall, they needed to cover the entire surface with white interior primer paint. The wall has the dimensions of 8 ft. by 55 ft. If a gallon of paint covers 250 sq. ft., how many gallons are needed for the wall? Use pictures, numbers, or words to justify your answer.
A B
D C
C° F° Freezing Water 0° 32° Boiling Water 100° 212°

Go Figure? Geometry and Measurements - 37 - Worksheet 2
Geometry and Measurements Worksheet 2 Choice E, in multiple-choice questions, is always: I request help from the teacher. You may mark E in addition to one other choice if you think that you have the right answer to the question but you do not feel that you have a complete understanding of the problem. Your teacher will decide whether to use the two-point or four-point scoring rubric for problems that use numbers, pictures, or words to justify/explain your answer(s). You may request help for these questions, too. Write the word “teacher” by your answer(s). 1. Pythagelo has a strange 7 sided garden in back of Etna High school. The garden is a regular polygon.
If Pythagelo wants to buy fence to enclose the garden – and each side is 5 meters long, how much fence must he buy? Use numbers, pictures, or words to justify your answer.
2. Chris thought about two different ways to add a ribbon to the pot holding her favorite plant – a ficus
tree. She could glue the ribbon to the pot or tie it around it. She decided to the tie a ribbon around the circular pot. The pot has a of radius 3 ft. Estimate which length of ribbon could be used by Chris.
A. 18 ft. B. 6 ft. C. 20 ft. D. 12 ft. E. Teacher
3. The student council wanted to put a fence around the flowerbed it planted in the front of Western
High School, the new high school in Enigma. The flowerbed is rectangular in shape. The length is 14 ft. and the width 5 ft. How many feet of fencing is needed to enclose the flower garden?
A. 38 ft. B. 19 ft. C. 38 sq. ft. D. 19 sq. ft. E. Teacher
4. Carter accidentally knocked Pythagleo’s picture off the shelf breaking the glass. Carter needs to
replace the glass. The glass needs to be 8” x 10”. At the cost of $0.10 (10¢) per square inch, how much change will Carter get from a $20.00 bill after he pays for the glass?
A. $12.00 B. $8.00 C. $19.20 D. $10.00 E. Teacher
5. Carter needs one cubic yard of dirt for the part of the school flowerbed for which he agreed to take
responsibility. He used a rectangular box which is 3 ft. by 2 ft. by 2 ft. for a planter. It is only half full of dirt so he will need to add more. How much more dirt will he need?
A. 12 cu. ft. B. 15 cu. ft. C. 21 cu. ft. D. 6 cu. ft. E. Teacher
6. The Western High School Spirit Team is putting each football player’s number on flags that are the
shape of equilateral triangles. These flags will be hung in the cafeteria. Each side of a flag is 5 inches. The Spirit Team wants to put fringe all the way around each of these flags. If there are 50 players on the team, how many feet of fringe will they need to go around all the flags?
A. 50.5 ft. B. 240 ft. C. 100 ft. D. 62.5 ft. E. Teacher

Go Figure? Geometry and Measurements - 38 - Worksheet 2
Bedroom
Bedroom
Closet
Closet
Living Room
Kitchen
13 inches
7 in.
3 in. 12 in.
Box A 10 in.
7. A cylinder with a height of 8 inches and a base with a diameter of 6 inches is standing on its base. A cone with a height of 8 inches and a base with a diameter of 6 inches is also standing on its base next to the cone. Use the formulas:
Cone 2)(21 rhd ππ + Cylinder 222 rhr ππ +
a. What is the surface area of the cone? Round answer to the nearest whole number. b. What is the surface area of the cylinder? Round answers to the nearest whole number. c. Use numbers, words, or pictures to explain your answers.
8. A drawing for a house uses the scale of 1 inch =
2 feet. The dimensions of a living room on the drawing are 7 inches by 13 inches.
a. Determine the actual dimensions of the
living room. b. Label your answer with appropriate
units. 9. Pythagleo is installing floor tiles in part of the
janitor’s office in the Etna High basement. The space measures 12 feet by 15 feet. Pythagleo is using square tiles with sides that measure 6 inches. How many tiles will it take to cover the entire floor?
A. 180 tiles B. 300 tiles C. 720 tiles D. 1,540 tiles E. Teacher
10. Enigma’s Ohio Flag Works company needs to create a box shaped like a rectangular prism. The
volume must be 360 cubic inches, but the surface area needs to be as small as possible. One possible box is shown.
a. Sketch or describe a different box that has the same volume as Box A, and a surface area less
than that of Box A. b. Show your work or provide an explanation to verify that the new box meets the criteria.
Go Figure? Geometry and Measurements - 39 - Worksheet 3
Cube
5 feet
8 feet
6 inches
3 inches
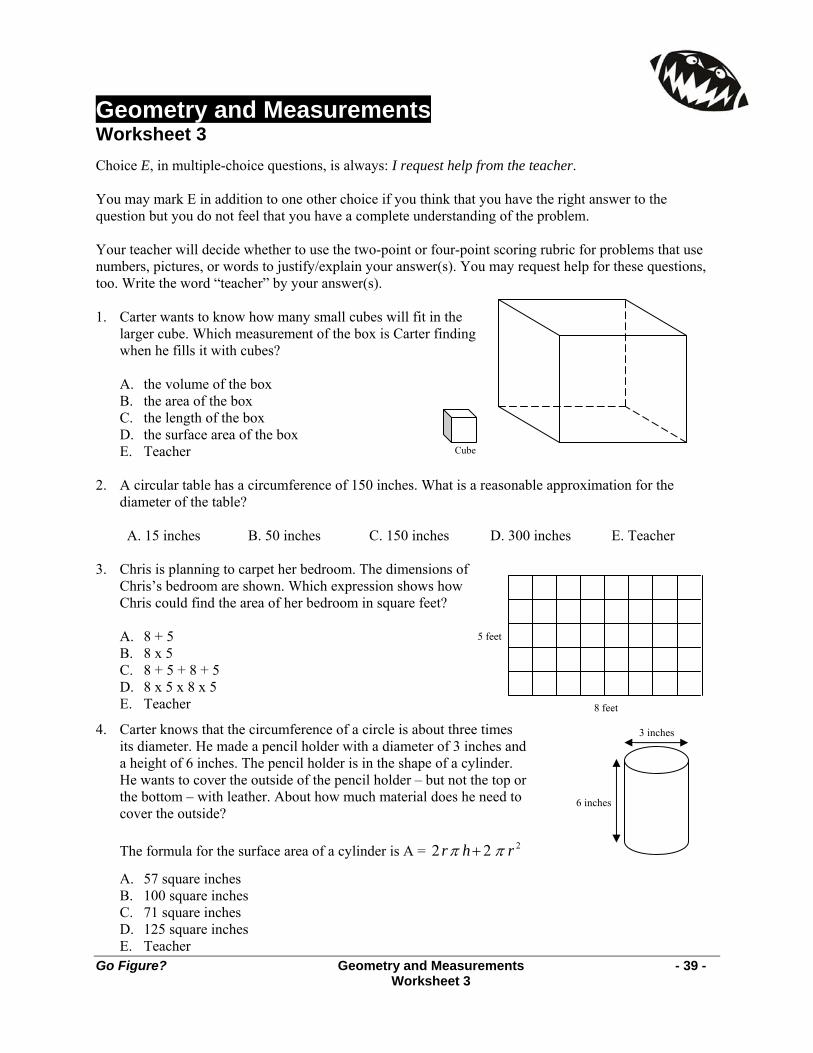
Geometry and Measurements Worksheet 3 Choice E, in multiple-choice questions, is always: I request help from the teacher. You may mark E in addition to one other choice if you think that you have the right answer to the question but you do not feel that you have a complete understanding of the problem. Your teacher will decide whether to use the two-point or four-point scoring rubric for problems that use numbers, pictures, or words to justify/explain your answer(s). You may request help for these questions, too. Write the word “teacher” by your answer(s). 1. Carter wants to know how many small cubes will fit in the
larger cube. Which measurement of the box is Carter finding when he fills it with cubes?
A. the volume of the box B. the area of the box C. the length of the box D. the surface area of the box E. Teacher
2. A circular table has a circumference of 150 inches. What is a reasonable approximation for the
diameter of the table?
A. 15 inches B. 50 inches C. 150 inches D. 300 inches E. Teacher 3. Chris is planning to carpet her bedroom. The dimensions of
Chris’s bedroom are shown. Which expression shows how Chris could find the area of her bedroom in square feet?
A. 8 + 5 B. 8 x 5 C. 8 + 5 + 8 + 5 D. 8 x 5 x 8 x 5 E. Teacher
4. Carter knows that the circumference of a circle is about three times its diameter. He made a pencil holder with a diameter of 3 inches and a height of 6 inches. The pencil holder is in the shape of a cylinder. He wants to cover the outside of the pencil holder – but not the top or the bottom – with leather. About how much material does he need to cover the outside? The formula for the surface area of a cylinder is A = 222 rhr ππ +
A. 57 square inches B. 100 square inches C. 71 square inches D. 125 square inches E. Teacher
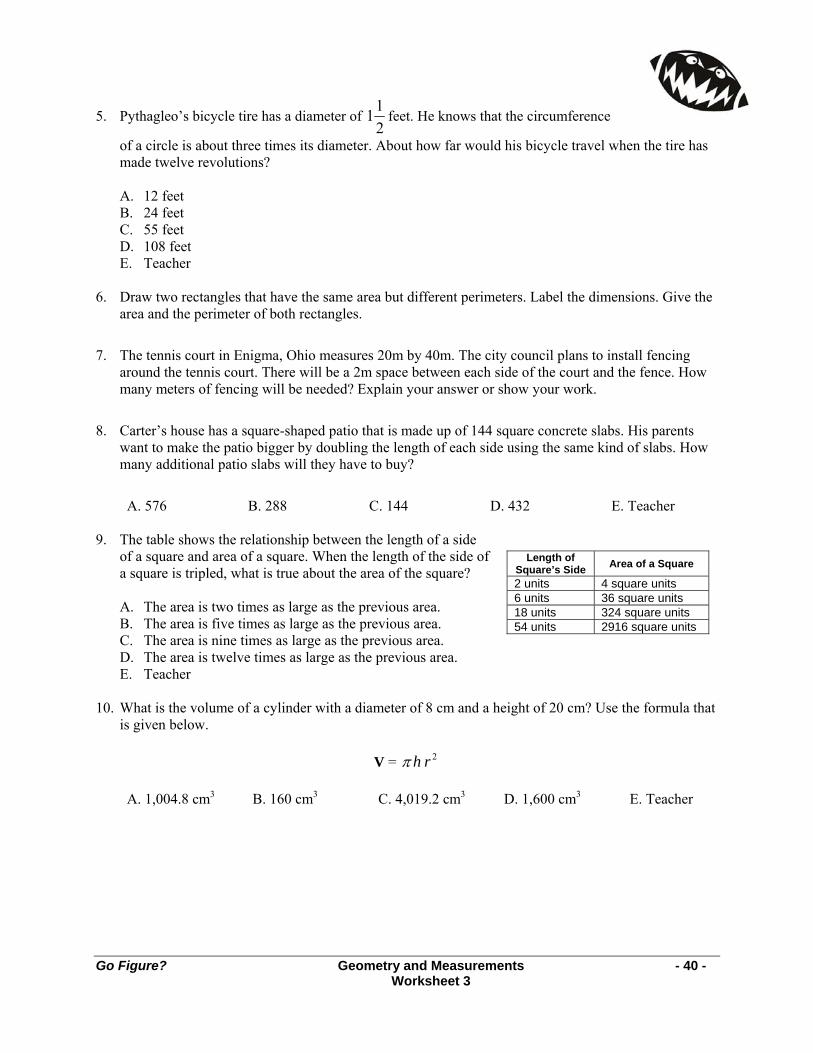
Go Figure? Geometry and Measurements - 40 - Worksheet 3
Length of Square’s Side Area of a Square
2 units 4 square units 6 units 36 square units 18 units 324 square units 54 units 2916 square units
5. Pythagleo’s bicycle tire has a diameter of 211 feet. He knows that the circumference
of a circle is about three times its diameter. About how far would his bicycle travel when the tire has made twelve revolutions?
A. 12 feet B. 24 feet C. 55 feet D. 108 feet E. Teacher
6. Draw two rectangles that have the same area but different perimeters. Label the dimensions. Give the
area and the perimeter of both rectangles.
7. The tennis court in Enigma, Ohio measures 20m by 40m. The city council plans to install fencing around the tennis court. There will be a 2m space between each side of the court and the fence. How many meters of fencing will be needed? Explain your answer or show your work.
8. Carter’s house has a square-shaped patio that is made up of 144 square concrete slabs. His parents want to make the patio bigger by doubling the length of each side using the same kind of slabs. How many additional patio slabs will they have to buy?
A. 576 B. 288 C. 144 D. 432 E. Teacher 9. The table shows the relationship between the length of a side
of a square and area of a square. When the length of the side of a square is tripled, what is true about the area of the square?
A. The area is two times as large as the previous area. B. The area is five times as large as the previous area. C. The area is nine times as large as the previous area. D. The area is twelve times as large as the previous area. E. Teacher
10. What is the volume of a cylinder with a diameter of 8 cm and a height of 20 cm? Use the formula that
is given below.
V = 2rhπ
A. 1,004.8 cm3 B. 160 cm3 C. 4,019.2 cm3 D. 1,600 cm3 E. Teacher
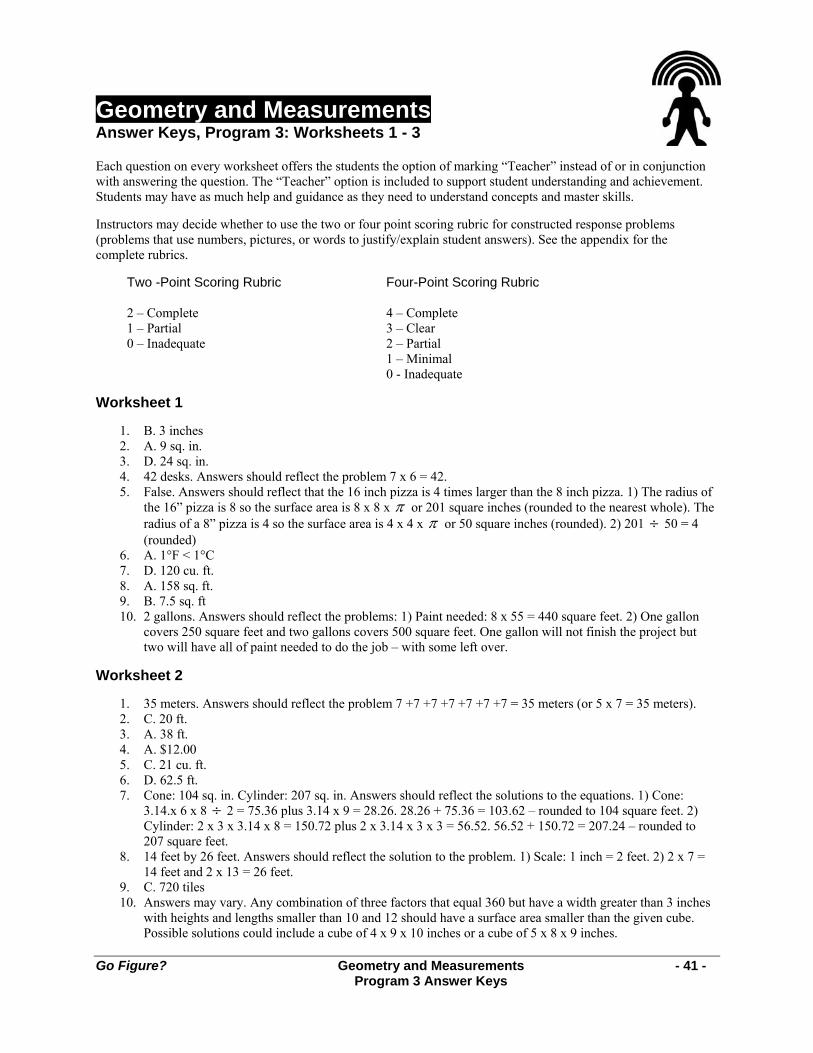
Go Figure? Geometry and Measurements - 41 - Program 3 Answer Keys
Geometry and Measurements Answer Keys, Program 3: Worksheets 1 - 3 Each question on every worksheet offers the students the option of marking “Teacher” instead of or in conjunction with answering the question. The “Teacher” option is included to support student understanding and achievement. Students may have as much help and guidance as they need to understand concepts and master skills. Instructors may decide whether to use the two or four point scoring rubric for constructed response problems (problems that use numbers, pictures, or words to justify/explain student answers). See the appendix for the complete rubrics.
Two -Point Scoring Rubric Four-Point Scoring Rubric 2 – Complete 1 – Partial 0 – Inadequate
4 – Complete 3 – Clear 2 – Partial 1 – Minimal 0 - Inadequate
Worksheet 1
1. B. 3 inches 2. A. 9 sq. in. 3. D. 24 sq. in. 4. 42 desks. Answers should reflect the problem 7 x 6 = 42. 5. False. Answers should reflect that the 16 inch pizza is 4 times larger than the 8 inch pizza. 1) The radius of
the 16” pizza is 8 so the surface area is 8 x 8 x π or 201 square inches (rounded to the nearest whole). The radius of a 8” pizza is 4 so the surface area is 4 x 4 x π or 50 square inches (rounded). 2) 201 ÷ 50 = 4 (rounded)
6. A. 1°F < 1°C 7. D. 120 cu. ft. 8. A. 158 sq. ft. 9. B. 7.5 sq. ft 10. 2 gallons. Answers should reflect the problems: 1) Paint needed: 8 x 55 = 440 square feet. 2) One gallon
covers 250 square feet and two gallons covers 500 square feet. One gallon will not finish the project but two will have all of paint needed to do the job – with some left over.
Worksheet 2
1. 35 meters. Answers should reflect the problem 7 +7 +7 +7 +7 +7 +7 = 35 meters (or 5 x 7 = 35 meters). 2. C. 20 ft. 3. A. 38 ft. 4. A. $12.00 5. C. 21 cu. ft. 6. D. 62.5 ft. 7. Cone: 104 sq. in. Cylinder: 207 sq. in. Answers should reflect the solutions to the equations. 1) Cone:
3.14.x 6 x 8 ÷ 2 = 75.36 plus 3.14 x 9 = 28.26. 28.26 + 75.36 = 103.62 – rounded to 104 square feet. 2) Cylinder: 2 x 3 x 3.14 x 8 = 150.72 plus 2 x 3.14 x 3 x 3 = 56.52. 56.52 + 150.72 = 207.24 – rounded to 207 square feet.
8. 14 feet by 26 feet. Answers should reflect the solution to the problem. 1) Scale: 1 inch = 2 feet. 2) 2 x 7 = 14 feet and 2 x 13 = 26 feet.
9. C. 720 tiles 10. Answers may vary. Any combination of three factors that equal 360 but have a width greater than 3 inches
with heights and lengths smaller than 10 and 12 should have a surface area smaller than the given cube. Possible solutions could include a cube of 4 x 9 x 10 inches or a cube of 5 x 8 x 9 inches.
Go Figure? Geometry and Measurements - 42 - Program 3 Answer Keys
Worksheet 3
1. A. the volume of the box 2. B. 50 inches 3. B. 8 x 5 4. A. 48 square inches 5. C. 55 feet 6. Answers will vary. Responses should reflect the following facts: 1) How to compute area and perimeter:
A = lh and P = s + s + s + s (P = 2l +2w or P =4s for a square) and 2) The two rectangles should display two different sets of factors for the same number. For example, if a rectangle has an area of 36 square units, then the factors/sides could be:
a. 4 by 9 – Area: 4 x 9 = 36 sq units, Perimeter: 4 + 4 + 9 + 9 = 26 units b. 3 by 12 – Area: 36 sq units, Perimeter: 30 units c. 2 by 18 – Area: 36 sq units, Perimeter: 40 units d. 6 by 6 – Area: 36 sq units, Perimeter: 24 units
7. 136 meters. Responses should reflect the solution to the problem: P = 2(l+4) + 2(w+4). 8. D. 432 9. C. The area is nine times as large as the previous area. 10. A. 1,004.8 cm3

Go Figure? Units of Measurement - 43 - Program 4
Units of Measurement Program 4 Guide The Go Figure? Interactive Multimedia Kit may be used in a classroom or intervention setting. Presented in a fun and creative way, each program on the Go Figure? DVD can be used as an introduction to or a review of basic mathematics concepts. The accompanying CD-ROM edu-game was designed for use by students on an individual basis. The object of the edu-game is to solve a mystery. In order to do this, the student must solve mathematics problems in the specific content areas presented by the DVD dramatic video series. Consequently, programs on the DVD are used to generate interest in and enthusiasm for learning mathematics concepts, while the CD-ROM edu-game allows students to practice the concepts in a challenging game format. The three main characters in each DVD video program – the mysterious Pythagleo, plus two students named Carter and Chris who are trying to solve the mystery of Etna High School – discuss the targeted math concepts. Chris, and to a lesser extent, Carter, verbalizes what each is thinking as they work through problems associated with the math concepts. The DVD programs assume that, like Chris and Carter, your students have already been introduced to the math concepts presented in the episode. The dialog may be too quick for some students. Every step that some of your students will need to solve similar problems on their own may not be mentioned in the programs. Therefore, pausing the DVD to review or present additional information will help adapt the learning situation to the needs of your students. See additional materials about teaching with videos and differentiated instruction in the Introduction of the Teacher Resources Guide. Ohio Mathematics Content Standards and Benchmarks Measurement Benchmarks
A. Select appropriate units to measure angles, circumference, surface area, mass, and volume, using: • U. S. customary units: e.g., degrees, square feet, pounds, and other units as appropriate; • Metric units, e.g., square meters, kilograms and other units as appropriate.
B. Convert units of length, area, volume, mass, and time within the same measurement system. Math Content
• How to add and subtract units of time • Length, standard units • Length, metric units • Metric units are based on powers of 10. • Square units are used for surface area, cubic units for volume • Weight, standard units • Weight, metric units • Capacity • Temperature, Celsius/Fahrenheit
Episode Note
• Carter is trapped in a locked basement room when he searches for a girl who keeps appearing and disappearing. Chris must answer units of measure questions to get the combination to free Carter.
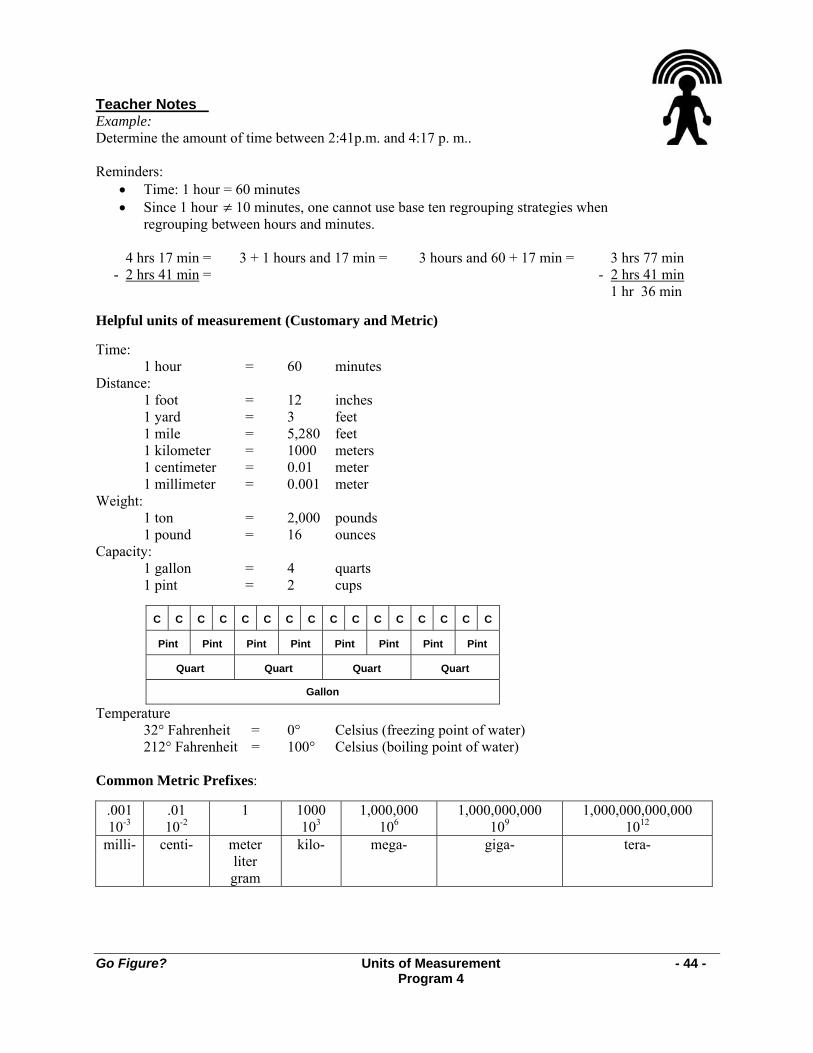
Go Figure? Units of Measurement - 44 - Program 4
Teacher Notes Example: Determine the amount of time between 2:41p.m. and 4:17 p. m.. Reminders:
• Time: 1 hour = 60 minutes • Since 1 hour ≠ 10 minutes, one cannot use base ten regrouping strategies when
regrouping between hours and minutes. 4 hrs 17 min = 3 + 1 hours and 17 min = 3 hours and 60 + 17 min = 3 hrs 77 min - 2 hrs 41 min = - 2 hrs 41 min 1 hr 36 min Helpful units of measurement (Customary and Metric) Time: 1 hour = 60 minutes Distance: 1 foot = 12 inches 1 yard = 3 feet 1 mile = 5,280 feet 1 kilometer = 1000 meters 1 centimeter = 0.01 meter 1 millimeter = 0.001 meter Weight: 1 ton = 2,000 pounds 1 pound = 16 ounces Capacity: 1 gallon = 4 quarts 1 pint = 2 cups
C C C C C C C C C C C C C C C C
Pint Pint Pint Pint Pint Pint Pint Pint
Quart Quart Quart Quart
Gallon
Temperature 32° Fahrenheit = 0° Celsius (freezing point of water) 212° Fahrenheit = 100° Celsius (boiling point of water) Common Metric Prefixes:
.001 10-3
.01 10-2
1 1000 103
1,000,000 106
1,000,000,000 109
1,000,000,000,000 1012
milli- centi- meter liter gram
kilo- mega- giga- tera-
Go Figure? Units of Measurement - 45 - Worksheet 1
Units of Measurement Worksheet 1 Choice E, in multiple-choice questions, is always: I request help from the teacher. You may mark E in addition to one other choice if you think that you have the right answer to the question but you do not feel that you have a complete understanding of the problem. Your teacher will decide whether to use the two-point or four-point scoring rubric for problems that use numbers, pictures, or words to justify/explain your answer(s). You may request help for these questions, too. Write the word “teacher” by your answer(s). 1. It takes Carter 45 minutes to get dressed for school, 10 minutes to eat his Pop Tart, and 15 minutes to
walk the dog. If the bus comes at 8:15 a.m., what time must be set his alarm clock to have just enough time to get ready for school?
A. 7:00 a.m. B. 7:05 a.m. C. 7:30 a.m. D. 7:45 a.m. E. Teacher
2. An appropriate unit of measurement for the capacity of a freezer is:
A. cubic gallons B. meters C. pounds D. cubic feet E. Teacher 3. Carter and Chris walked to Etna High School. Chris walked from her house to the high school, which
is one mile and three yards. Carter walked to the school from his house which was 5,000 feet. After walking to Etna High and back to their own houses, how many more feet has Chris walked than Carter?
A. 289 ft. B. 578 ft. C. 293 ft. D. 576 ft. E. Teacher
4. Pythagleo wanted 1 12
gallons of lemonade for a party. He only has a pint measuring utensil. How
many pints will he need?
A. 6 B. 8 C. 12 D. 3 E. Teacher 5. Which could be a possible temperature of a freezer?
A. 8°F B. 8°C C. 32°C D. 34°F E. Teacher 6. In October of 1964, three Enigma, Ohio students – Miriam, Mindy, and Susie – went trick or treating.
They weighed the bags of candy when they returned home. Miriam had 2 lb. 11 oz., Mindy had 3 lb. 2 oz., and Susie had 2 lb. 10 oz. How much candy did they collect together?
A. 9 lb. 3 oz. B. 8 lb. 7 oz. C. 7 lb. 22 oz. D. 8 lb. 6 oz. E. Teacher
7. Mrs. Sawyer is having a picnic for her stepson, Carter, and five of his friends. She plans to make two
quarter-pound hamburgers for each person. She will not eat any hamburgers herself. How many pounds of hamburger meat should she buy?
A. 3 lbs. B. 10 lbs. C. 5 lbs. D. 1 lb. E. Teacher

Go Figure? Units of Measurement - 46 - Worksheet 1
8. Chris measured Carter’s height and found it to be 68 inches. What is another way to give the measure of Carter’s height?
A. 6 ft. 8 in. B. 4 ft. 4 in. C. 5 ft. 5 in. D. 5 ft. 8 in. E. Teacher
9. Pythagleo said that for some unknown reason, the school nurse gave all 500 missing Etna High
students and staff a flu shot shortly before they disappeared. If each injection of the flu vaccine was 3 milliliter, how many liters of vaccine are needed?
A. 1500 liters B. 150 liters C. 15 liters D. 1.5 liters E. Teacher
10. Which would be the best metric unit to measure the distance from one’s elbow to one’s shoulder?
A. kilometer B. millimeter C. meter D. centimeter E. Teacher
Go Figure? Units of Measurement - 47 - Worksheet 2
Units of Measurement Worksheet 2 Choice E, in multiple-choice questions, is always: I request help from the teacher. You may mark E in addition to one other choice if you think that you have the right answer to the question but you do not feel that you have a complete understanding of the problem. Your teacher will decide whether to use the two-point or four-point scoring rubric for problems that use numbers, pictures, or words to justify/explain your answer(s). You may request help for these questions, too. Write the word “teacher” by your answer(s).
1. Before they all disappeared, the Junior Class sold 121
tons of citrus fruit (oranges, grapefruit, and
tangerines) as a fund raiser. How many 10 lb. sacks of fruit are there?
A. 3,000 B. 300 C. 350 D. 30 E. Teacher 2. Which unit is the best to use for weighing sacks of coffee beans?
A. pounds B. tons C. ounces D. cubic inches E. Teacher 3. The average human body temperature is
A. 98.6° C B. 98.6° F C. 32° C D. 100° C E. Teacher 4. Carter ran 9,000 meters, while Chris ran 8,500 meters in the Enigma Arthritis Foundation “New
Knees Run” for arthritis research. How many kilometers did they run in total to benefit the research?
A. 17,500 B. 1.75 C. 17.5 D. 175 E. Teacher 5. At the Etna High reunion party, Pythagleo wanted to serve orange juice and, strange as it may seem,
15 gallons of juice mysteriously appeared! Pythagleo expected 250 to attend and thought that each person would drink 8 ounces of juice. Determine whether 15 gallons of orange juice would be enough for each of 250 people to get 8 ounces. Uses numbers, pictures, or words to support your answer.
6. Pythagelo searched for 343
hours trying to find more people to come to his reunion party. How many
minutes did he search?
A. 90 minutes B. 180 minutes C. 225 minutes D. 240 minutes E. Teacher 7. The Etna High School mascot was a Norwegian Elkhound. Elkhounds are very tall dogs. Pythagleo
decided to make a doghouse in hopes that the dog, Thor, would someday reappear. Thor would need a doghouse that is at least 1.75 meters tall. What is the height of the doghouse in millimeters?
A. 175 mm B. 1,075 mm C. 1,705 mm D. 1,750 mm E. Teacher
Go Figure? Units of Measurement - 48 - Worksheet 2
8. Pythagleo bought a half gallon of milk. He drank one cup of milk with his breakfast, one cup at lunch, and one pint of milk simply disappeared. Explain or show how much milk is left. Use numbers, pictures, or words to support your answer.
9. On the day of the most disappearances from Etna High in 1966, the temperature was 68ºF at 7:00 a.m.
At noon on that same day, the temperature had dropped to 38ºF. By 6:00 p.m. that day, the temperature was 80ºF. Which is the most appropriate way to describe the average rate of change in temperature?
A. hours per degree C. degrees per hour B. minutes per degree D. degrees per minute E. Teacher
10. The chemistry teacher had 13 liters of hydrogen chloride when school began. After 30 experiments
(which each used 0.25 liters of hydrogen chloride), how much is left for more experiments?
A. 5.5 liters B. 10 liters C. 3 liters D. 7.5 liters E. Teacher
Go Figure? Units of Measurement - 49 - Program 4 Answer Keys
Units of Measurement Answer Keys, Program 4: Worksheets 1 - 2 Each question on every worksheet offers the students the option of marking “Teacher” instead of or in conjunction with answering the question. The “Teacher” option is included to support student understanding and achievement. Students may have as much help and guidance as they need to understand concepts and master skills. Instructors may decide whether to use the two or four point scoring rubric for constructed response problems (problems that use numbers, pictures, or words to justify/explain student answers). See the appendix for the complete rubrics.
Two-Point Scoring Rubric Four-Point Scoring Rubric 2 – Complete 1 – Partial 0 – Inadequate
4 – Complete 3 – Clear 2 – Partial 1 – Minimal 0 - Inadequate
Worksheet 1
1. B. 7:05 a.m. 2. D. cubic feet 3. B. 578 ft. 4. C. 12 5. A. 8°F 6. B. 8 lb. 7 oz. 7. A. 3 lbs. 8. D. 5 ft. 8 in. 9. D. 1.5 liters 10. D. centimeter
Worksheet 2
1. B. 300 2. A. pounds 3. B. 98.6° F 4. C. 17.5 5. No, 15 gallons was not enough for 250 people to have 8 ounces each. Answers should reflect the following:
1) 250 people x 8 ounces = 2000 ounces needed. 2) 16 cups in a gallon x 8 ounces per cup = 128 ounces in a gallon. 3) 15 gallons x 128 ounces = 1920 ounces of juice in 15 gallons. 4) 2000 ounces > 1920 ounces.
6. C. 225 minutes 7. D. 1,750 mm
8. 1 quart. Answers should reflect the following. 1) Convert gallons to cups. 21 gallon = 8 cups. 2) Convert
pints to cups 1 pint = 2 cups. 3) Determine the number of missing and used cups of milk. 1 + 1 + 2 = 4 cups of milk. 4). Determine how much milk is left. 8 cups – 4 cups = 4 cups. 4) Convert the cups back into pints/quarts. 4 cups = 2 pints or 1 quart.
9. C. degrees per hour 10. A. 5.5 liters
- 50 -
NOTES:

Go Figure? Maps, Charts and Graphs - 51 - Program 5
Maps, Charts, & Graphs Program 5 Guide The Go Figure? Interactive Multimedia Kit may be used in a classroom or intervention setting. Presented in a fun and creative way, each program on the Go Figure? DVD can be used as an introduction to or a review of basic mathematics concepts. The accompanying CD-ROM edu-game was designed for use by students on an individual basis. The object of the edu-game is to solve a mystery. In order to do this, the student must solve mathematics problems in the specific content areas presented by the DVD dramatic video series. Consequently, programs on the DVD are used to generate interest in and enthusiasm for learning mathematics concepts, while the CD-ROM edu-game allows students to practice the concepts in a challenging game format. The three main characters in each DVD video program – the mysterious Pythagleo, plus two students named Carter and Chris who are trying to solve the mystery of Etna High School – discuss the targeted math concepts. Chris, and to a lesser extent, Carter, verbalizes what each is thinking as they work through problems associated with the math concepts. The DVD programs assume that, like Chris and Carter, your students have already been introduced to the math concepts presented in the episode. The dialog may be too quick for some students. Every step that some of your students will need to solve similar problems on their own may not be mentioned in the programs. Therefore, pausing the DVD to review or present additional information will help adapt the learning situation to the needs of your students. See additional materials about teaching with videos and differentiated instruction in the Introduction of the Teacher Resources Guide. Ohio Mathematics Content Standards and Benchmarks Data Analysis and Probability
A. Read, create and use line graphs, histograms, circle graphs, box-and-whisker plots, stem-and-leaf plots, and other representations when appropriate.
B. Interpret data by looking for patterns and relationships, draw and justify conclusions, and answer related questions.
D. Compare increasingly complex displays of data for a specific purpose or need. E. Collect, organize, display, and interpret data for a specific purpose or need.
Math Content
• How to use coordinates to find locations and read a conversion scale on a map • Chart/table – lists of data • How to read and interpret
o Circle Graph – defined and how to use o Bar Graph – defined and how to use o Line Graph – defined and how to use o Pictograph – defined and how to use
Additional Math Content
• Frequency Table • Histogram • Stem-and-Leaf Plot • Box-and-Whisker Plot (Box Plot)

Go Figure? Maps, Charts and Graphs - 52 - Program 5
Carl’s 2nd Term Quiz Score Histogram 4 3 2 1 0 Fr
eque
ncy
50-54 55-59 60-64 65-69 70-74 75-79 80-84 85-89 Quiz Scores
Episode Note • Chris and Carter find a map with a note saying “The room located at E3 will be the
containment room.” Why would a school need a containment room? What does it have to do with the missing students? They search for the room and find 1966 newspaper stories about increased “sightings” and dropping water levels at the nearby reservoir. Pythagleo shares other statistics about Etna High in 1966.
Teacher Notes
• See the chart, graph, table, and plot examples included with this guide. o Most were shown in the Program 5 video “Maps, Charts, and Graphs”. o The following are not in the video but are based on information in the video: frequency
table, histogram, stem-and-leaf plot, and box plot (box-and-whisker plot). • See background on frequency tables, histograms, stem-and-leaf plots and box plots below.
Frequency Table
Carl’s 2nd Term Quiz Score Frequency Table
54 55 56 58 60 61 65 66 74 75 77 80 84 85 1 2 1 1 1 1 1 1 2 4 1 1 1 1
A frequency table is a record of how often each value (or set of values) of the variable in question occurs. It may be enhanced by the addition of percentages that fall into each category. The frequency table in the example uses the data set {55, 56, 85, 65, 58, 77, 75, 74, 66, 61, 60, 54, 55, 74, 75, 80, 75, 84, 75}. The data set was ordered {54, 55, 55, 56, 58, 60, 61, 65, 66, 74, 74, 75, 75, 75, 75, 77, 80, 84, 85}. The frequency of each different data item is counted and entered into a table. The table may be horizontal or vertical. Histogram A histogram is a frequency graph that looks similar to a bar graph without spaces between the bars. Histogram creators simplify the data by grouping it into equal spaced intervals. The quantity of the intervals is important. A histogram with too few or too many interval bars may distort the data or make the graph difficult to read. A histogram uses the frequency of data to paint a visual representation of that data. Histograms will make it easy to see where the majority of values fall in a measurement scale, and how much variation there is. The histogram in the example uses the data from the Frequency Table example above. The quiz scores were grouped by intervals of 5 starting at 50 to create eight bars.
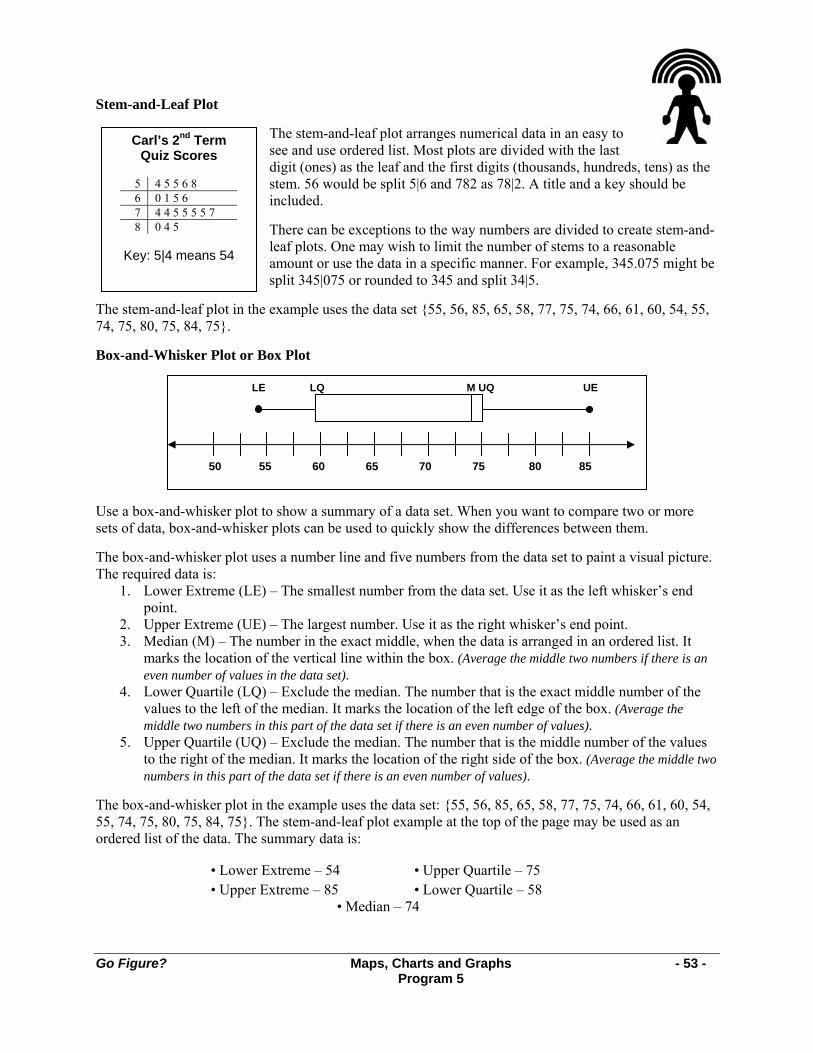
Go Figure? Maps, Charts and Graphs - 53 - Program 5
Stem-and-Leaf Plot
The stem-and-leaf plot arranges numerical data in an easy to see and use ordered list. Most plots are divided with the last digit (ones) as the leaf and the first digits (thousands, hundreds, tens) as the stem. 56 would be split 5|6 and 782 as 78|2. A title and a key should be included. There can be exceptions to the way numbers are divided to create stem-and-leaf plots. One may wish to limit the number of stems to a reasonable amount or use the data in a specific manner. For example, 345.075 might be split 345|075 or rounded to 345 and split 34|5.
The stem-and-leaf plot in the example uses the data set {55, 56, 85, 65, 58, 77, 75, 74, 66, 61, 60, 54, 55, 74, 75, 80, 75, 84, 75}. Box-and-Whisker Plot or Box Plot
Use a box-and-whisker plot to show a summary of a data set. When you want to compare two or more sets of data, box-and-whisker plots can be used to quickly show the differences between them. The box-and-whisker plot uses a number line and five numbers from the data set to paint a visual picture. The required data is:
1. Lower Extreme (LE) – The smallest number from the data set. Use it as the left whisker’s end point.
2. Upper Extreme (UE) – The largest number. Use it as the right whisker’s end point. 3. Median (M) – The number in the exact middle, when the data is arranged in an ordered list. It
marks the location of the vertical line within the box. (Average the middle two numbers if there is an even number of values in the data set).
4. Lower Quartile (LQ) – Exclude the median. The number that is the exact middle number of the values to the left of the median. It marks the location of the left edge of the box. (Average the middle two numbers in this part of the data set if there is an even number of values).
5. Upper Quartile (UQ) – Exclude the median. The number that is the middle number of the values to the right of the median. It marks the location of the right side of the box. (Average the middle two numbers in this part of the data set if there is an even number of values).
The box-and-whisker plot in the example uses the data set: {55, 56, 85, 65, 58, 77, 75, 74, 66, 61, 60, 54, 55, 74, 75, 80, 75, 84, 75}. The stem-and-leaf plot example at the top of the page may be used as an ordered list of the data. The summary data is:
• Lower Extreme – 54 • Upper Quartile – 75 • Upper Extreme – 85 • Lower Quartile – 58 • Median – 74
50 55 60 65 70 75 80 85
LE LQ M UQ UE
Carl’s 2nd Term Quiz Scores
5 4 5 5 6 8 6 0 1 5 6 7 4 4 5 5 5 5 7 8 0 4 5
Key: 5|4 means 54

Go Figure? Maps, Charts and Graphs - 54 - Program 5
Go Figure? Charts and Graphs Glossary Term Definition
categorical data The values or observations belonging to a data set can be sorted according to category. For example, color: red, yellow, blue; or dog breeds: Collie, German Shepherd, Norwegian Elkhound.
continuous data Data that has meaning at all points between the numbers given For example: age – a data set may give the ages 15, 16, 17, 18; but a living thing could have an age of 18 years 8 months, 18.2 or 18 –and-a-half.
discrete data Data that does not have meaning between all points of the given numbers For example: multimedia sales – one does not sell a portion of a CD, half of a DVD, or 0.25 of an iTune download.
level of symmetry The degree to which a set of values or observations has symmetry. skewness Skewness is when a set of values are not distributed in the same way above and
below the middle of the sample. Values on one side of the distribution tend to be further from the middle than values on the other side.
1110
9876543210
5 10 15 20 25 30 35 40 45
1110
9876543210
5 10 15 20 25 30 35 40 45 Skew Left
This histogram has a negative skew. The data has a “tail” to the left – the
negative side.
Skew Right This histogram has a positive skew. The data has a “tail” to the right –
the positive side.
symmetry When a set of values or observations is distributed in the same way above and below the middle of a sample, it is said to be symmetrical.
Symmetrical data sets are easily interpreted. In a perfectly symmetrical distribution of the data, the mean, median and mode have the same value. Half of all measurements are greater than the mean, while half are less than the mean.
1110
9876543210
5 10 15 20 25 30 35 40 45 Symmetrical Histogram
Go Figure? Maps, Charts and Graphs - 55 - Program 5
Term Definition
outlier Any value that is markedly smaller or larger than other values For example, in the data set {3, 5, 4, 4, 6, 2, 25, 5, 6, 2} the value of 25 is an outlier. An outlier might be the result of an error in measurement. If it is an error it will distort the interpretation of the data. Outliers should not be removed unless there is a good reason to delete them from the data. If an outlier is a genuine result, it is important because it might indicate an extreme of behavior of the process under study. For this reason, all outliers must be examined.
quartiles Quartiles are values that are given a fraction of the way through a data set which has been arranged in order from least to greatest.
• Median: Half way through the ordered set. 50 % of the data is above the point and 50% is below it. It is also known as the 50th percentile point.
• Lower Quartile: One fourth of the way through the ordered set. 25% of the data is below the point and 75% of the data is above it. It is also known as the 25th percentile point.
• Upper Quartile: Three fourths of the way through the values. 75% of the data is below the point and 25% of the data is above it. It is also known as the 75th percentile point.

Go Figure? Maps, Charts and Graphs - 56 - Worksheet 1
12th
9th
10th
11th
Maps, Charts, & Graphs Worksheet 1 Choice E, in multiple-choice questions, is always: I request help from the teacher. You may mark E in addition to one other choice if you think that you have the right answer to the question but you do not feel that you have a complete understanding of the problem. Your teacher will decide whether to use the two-point or four-point scoring rubric for problems that use numbers, pictures, or words to justify/explain your answer(s). You may request help for these questions, too. Write the word “teacher” by your answer(s). 1. The circle graph below represents the number of students at Western High School in Enigma, Ohio.
Western replaced Etna High when it was abandoned. The total school population of Western High School is 1,000. Which statement is true?
A. There are more than 250 9th graders. B. There are more than 510 10th graders. C. There are more than 250 10th graders. D. There are less than 200 11th graders. E. Teacher
2. Using the graph in Exercise 1, again, which statement is true?
A. Number of 9th graders > number of 10th graders. B. Number of 9th graders + number on 10th graders < number of 11th graders. C. Number of 12th graders > number of 10th graders. D. Number of 10th graders > number of 9th graders. E. Teacher
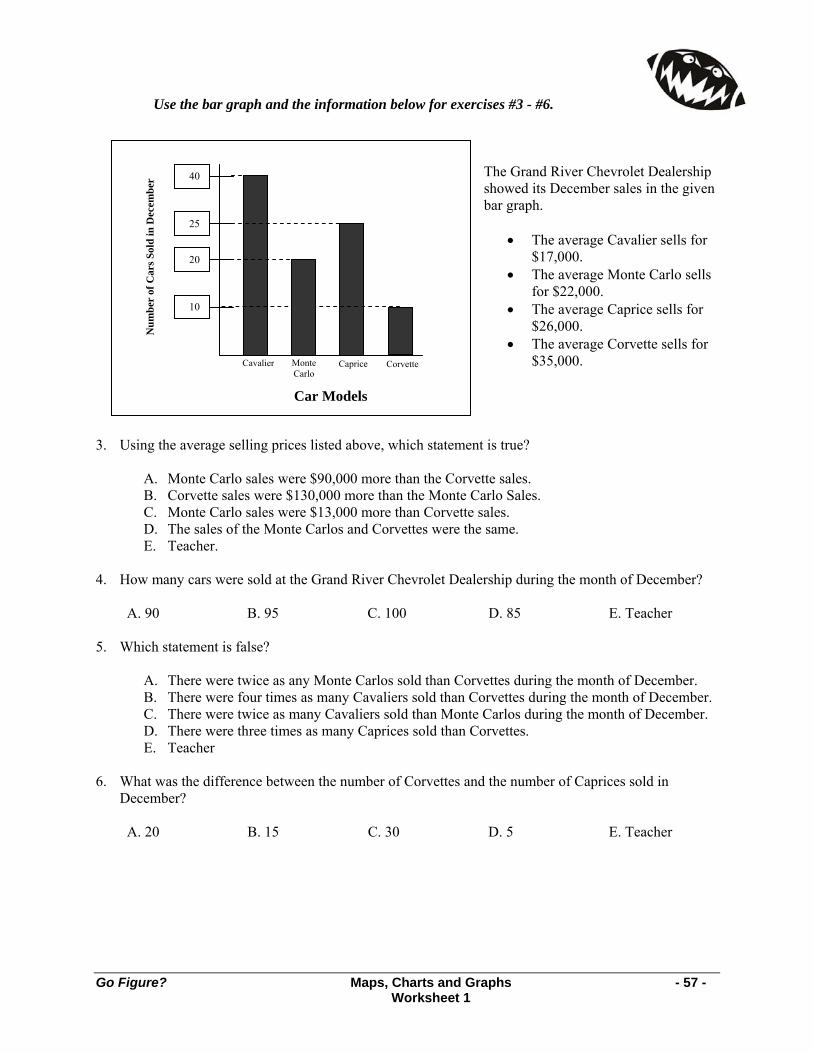
Go Figure? Maps, Charts and Graphs - 57 - Worksheet 1
Use the bar graph and the information below for exercises #3 - #6.
The Grand River Chevrolet Dealership showed its December sales in the given bar graph.
• The average Cavalier sells for $17,000.
• The average Monte Carlo sells for $22,000.
• The average Caprice sells for $26,000.
• The average Corvette sells for $35,000.
3. Using the average selling prices listed above, which statement is true?
A. Monte Carlo sales were $90,000 more than the Corvette sales. B. Corvette sales were $130,000 more than the Monte Carlo Sales. C. Monte Carlo sales were $13,000 more than Corvette sales. D. The sales of the Monte Carlos and Corvettes were the same. E. Teacher.
4. How many cars were sold at the Grand River Chevrolet Dealership during the month of December?
A. 90 B. 95 C. 100 D. 85 E. Teacher 5. Which statement is false?
A. There were twice as any Monte Carlos sold than Corvettes during the month of December. B. There were four times as many Cavaliers sold than Corvettes during the month of December. C. There were twice as many Cavaliers sold than Monte Carlos during the month of December. D. There were three times as many Caprices sold than Corvettes. E. Teacher
6. What was the difference between the number of Corvettes and the number of Caprices sold in
December?
A. 20 B. 15 C. 30 D. 5 E. Teacher
25
40
10
20
Cavalier Monte Carlo
Caprice Corvette
Car Models
Num
ber
of C
ars S
old
in D
ecem
ber
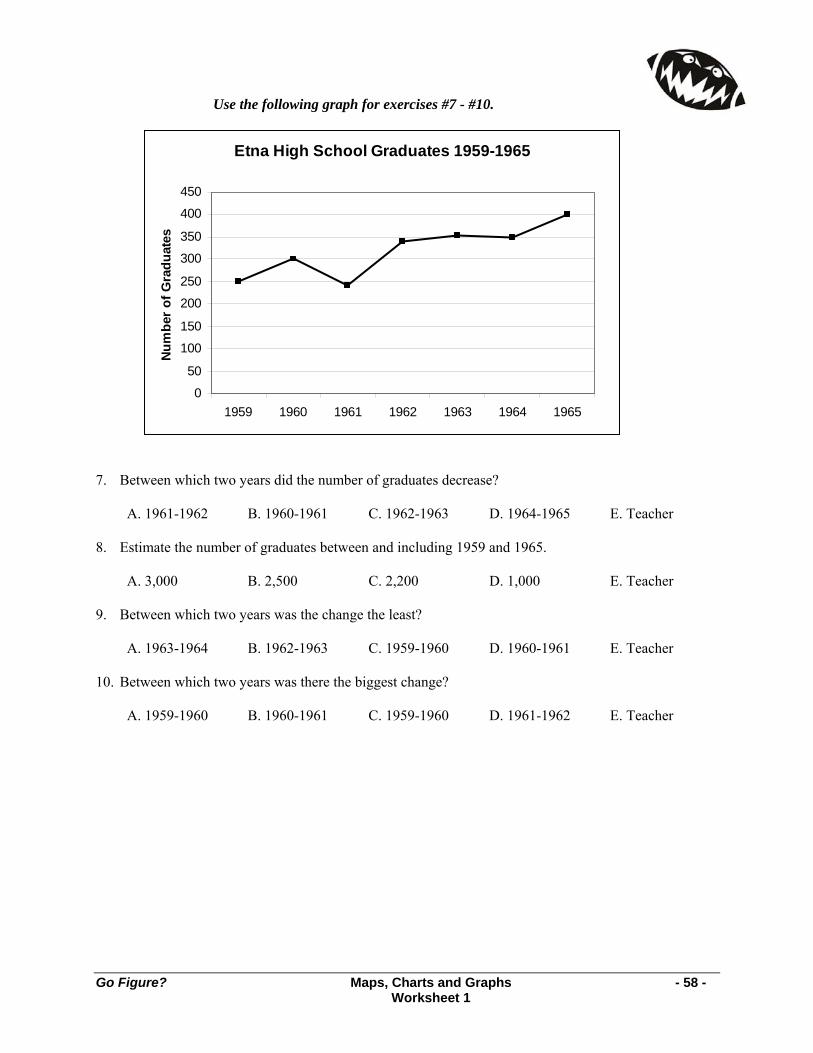
Go Figure? Maps, Charts and Graphs - 58 - Worksheet 1
Etna High School Graduates 1959-1965
0
50
100
150
200
250
300
350
400
450
1959 1960 1961 1962 1963 1964 1965
Num
ber
of G
radu
ates
Use the following graph for exercises #7 - #10. 7. Between which two years did the number of graduates decrease?
A. 1961-1962 B. 1960-1961 C. 1962-1963 D. 1964-1965 E. Teacher 8. Estimate the number of graduates between and including 1959 and 1965.
A. 3,000 B. 2,500 C. 2,200 D. 1,000 E. Teacher 9. Between which two years was the change the least?
A. 1963-1964 B. 1962-1963 C. 1959-1960 D. 1960-1961 E. Teacher 10. Between which two years was there the biggest change?
A. 1959-1960 B. 1960-1961 C. 1959-1960 D. 1961-1962 E. Teacher

Go Figure? Maps, Charts and Graphs - 59 - Worksheet 2
Annual Sales at Tomika's Tennis Togs
0
10
20
30
40
50
60
70
80
90
1 2 3 4 5 6 7 8
Sales Year - Year 1 = 1998
Sale
s (T
hous
ands
of D
olla
rs)
-8
-6
-4
-2
0
2
4
6
8
-10 -5 0 5 10
y
x
A
Maps, Charts, & Graphs Worksheet 2 Choice E, in multiple-choice questions, is always: I request help from the teacher. You may mark E in addition to one other choice if you think that you have the right answer to the question but you do not feel that you have a complete understanding of the problem. Your teacher will decide whether to use the two-point or four-point scoring rubric for problems that use numbers, pictures, or words to justify/explain your answer(s). You may request help for these questions, too. Write the word “teacher” by your answer(s). 1. The graph shows annual sales at
Tomika’s Tennis Togs during its first eight years of business. According to the graph, which prediction is reasonable for the annual sales in Year 9?
A. $ 75,000 B. $ 80,000 C. $105,000 D. $120,000 E. Teacher
2. Point A is shown on the coordinate grid. Which ordered pair represents point A?
A. (2, 4) B. (– 2, 4) C. (– 4, – 2) D. (– 2, – 4) E. Teacher
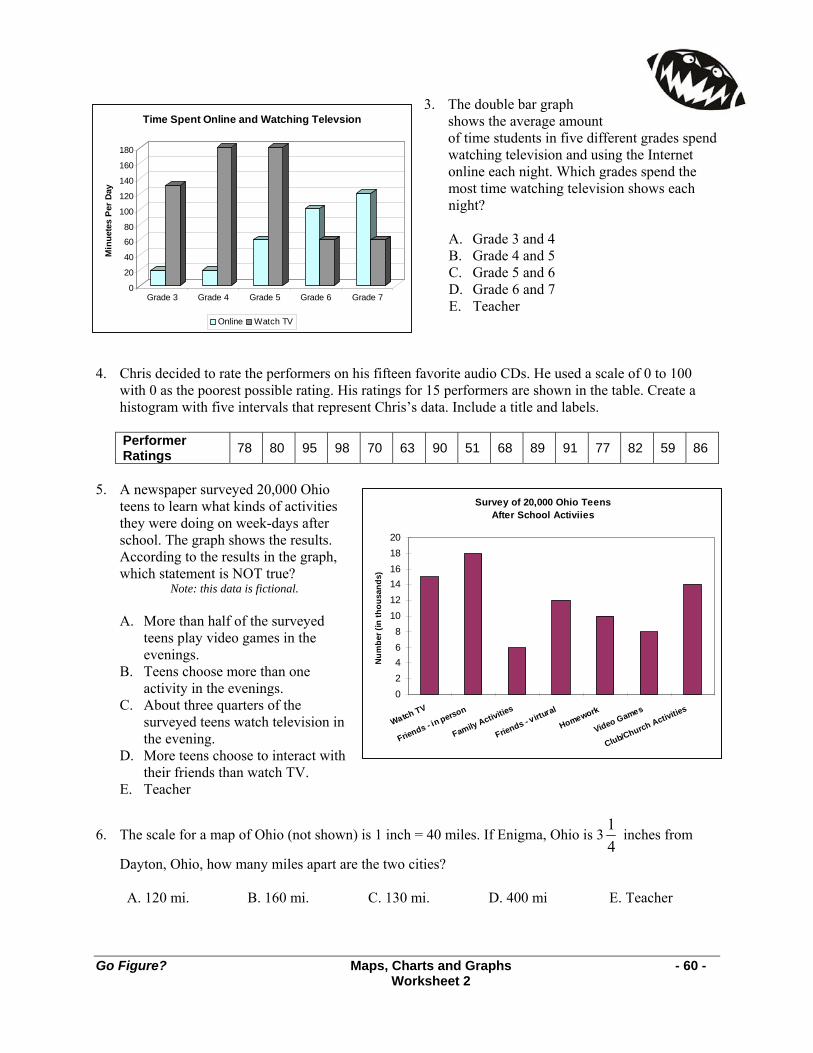
Go Figure? Maps, Charts and Graphs - 60 - Worksheet 2
0
20
40
60
80
100
120
140
160
180
Min
uete
s P
er D
ay
Grade 3 Grade 4 Grade 5 Grade 6 Grade 7
Time Spent Online and Watching Televsion
Online Watch TV
Survey of 20,000 Ohio Teens After School Activiies
02468
101214161820
Watch TV
Friends - in person
Family Activities
Friends - virtural
Homework
Video Games
Club/Church Activities
Num
ber (
in th
ousa
nds)
3. The double bar graph shows the average amount of time students in five different grades spend watching television and using the Internet online each night. Which grades spend the most time watching television shows each night?
A. Grade 3 and 4 B. Grade 4 and 5 C. Grade 5 and 6 D. Grade 6 and 7 E. Teacher
4. Chris decided to rate the performers on his fifteen favorite audio CDs. He used a scale of 0 to 100
with 0 as the poorest possible rating. His ratings for 15 performers are shown in the table. Create a histogram with five intervals that represent Chris’s data. Include a title and labels.
Performer Ratings 78 80 95 98 70 63 90 51 68 89 91 77 82 59 86
5. A newspaper surveyed 20,000 Ohio
teens to learn what kinds of activities they were doing on week-days after school. The graph shows the results. According to the results in the graph, which statement is NOT true?
Note: this data is fictional.
A. More than half of the surveyed teens play video games in the evenings.
B. Teens choose more than one activity in the evenings.
C. About three quarters of the surveyed teens watch television in the evening.
D. More teens choose to interact with their friends than watch TV.
E. Teacher
6. The scale for a map of Ohio (not shown) is 1 inch = 40 miles. If Enigma, Ohio is 341
inches from
Dayton, Ohio, how many miles apart are the two cities?
A. 120 mi. B. 160 mi. C. 130 mi. D. 400 mi E. Teacher
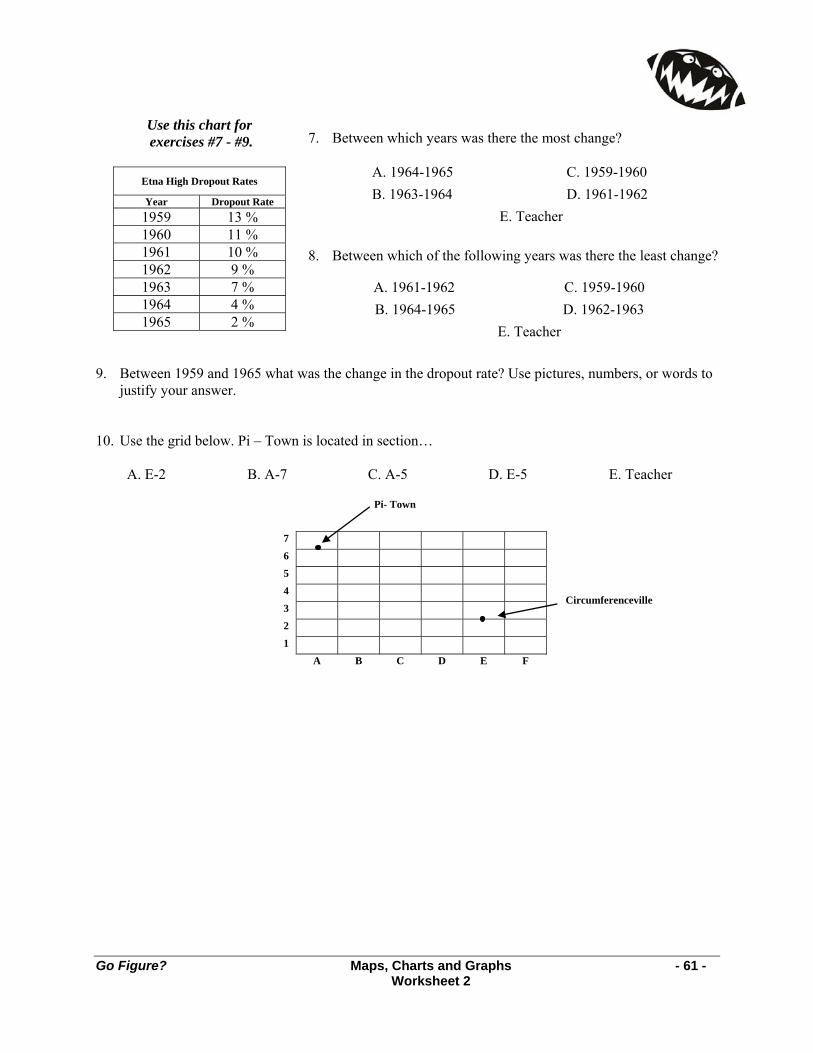
Go Figure? Maps, Charts and Graphs - 61 - Worksheet 2
7. Between which years was there the most change? 8. Between which of the following years was there the least change?
9. Between 1959 and 1965 what was the change in the dropout rate? Use pictures, numbers, or words to
justify your answer. 10. Use the grid below. Pi – Town is located in section…
A. E-2 B. A-7 C. A-5 D. E-5 E. Teacher
Use this chart for exercises #7 - #9.
Etna High Dropout Rates
Year Dropout Rate 1959 13 % 1960 11 % 1961 10 % 1962 9 % 1963 7 % 1964 4 % 1965 2 %
7 6 5 4 3 2 1
A B C D E F
Pi- Town
Circumferenceville
A. 1964-1965 C. 1959-1960 B. 1963-1964 D. 1961-1962 E. Teacher
A. 1961-1962 C. 1959-1960 B. 1964-1965 D. 1962-1963 E. Teacher

Go Figure? Maps, Charts and Graphs - 62 - Worksheet 3
Carter's Expenses
Entertainment45%
Clothes20%
Savings25%
Snacks10%
Population of Ohio Cities
City 2000 Population 2003 Population %Change
Akron 217,000 212,000 –2% Cincinnati 364,000 317,000 –13% Cleveland 506,000 461,000 –9% Columbus 633,000 728,000 +15% Toledo 314,000 309,000 –2%
Maps, Charts, & Graphs Worksheet 3 Choice E, in multiple-choice questions, is always: I request help from the teacher. You may mark E in addition to one other choice if you think that you have the right answer to the question but you do not feel that you have a complete understanding of the problem. Your teacher will decide whether to use the two-point or four-point scoring rubric for problems that use numbers, pictures, or words to justify/explain your answer(s). You may request help for these questions, too. Write the word “teacher” by your answer(s). 1. Carter earns $18 every week. The
circle graph shows how Carter uses his money each week. How much money does Carter use for snacks and clothes each week? Use numbers, pictures, or words to explain your answer.
2. The chart above shows changes in population in Ohio’s five largest cities from 2000 to 2003. Based
on the chart, which claim is a misuse of the data?
A. Cincinnati lost 13% of its population between 2000 and 2003. B. Columbus gained people between 2000 and 2003. C. Akron and Toledo lost the same number of people between 2000 and 2003. D. As a general rule, Ohio’s largest cities lost population between 2000 and 2003. E. Teacher
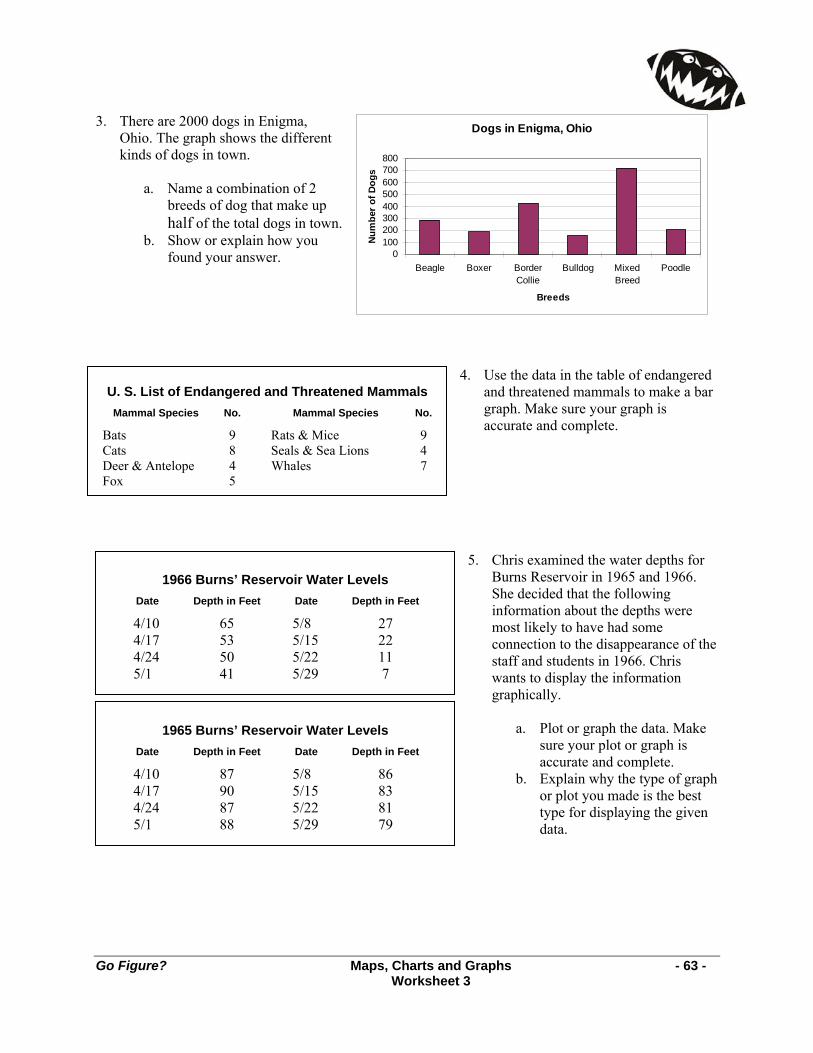
Go Figure? Maps, Charts and Graphs - 63 - Worksheet 3
U. S. List of Endangered and Threatened Mammals
Mammal Species No. Mammal Species No.
Bats 9 Rats & Mice 9 Cats 8 Seals & Sea Lions 4 Deer & Antelope 4 Whales 7 Fox 5
1966 Burns’ Reservoir Water Levels
Date Depth in Feet Date Depth in Feet
4/10 65 5/8 27 4/17 53 5/15 22 4/24 50 5/22 11 5/1 41 5/29 7
1965 Burns’ Reservoir Water Levels
Date Depth in Feet Date Depth in Feet
4/10 87 5/8 86 4/17 90 5/15 83 4/24 87 5/22 81 5/1 88 5/29 79
Dogs in Enigma, Ohio
0100200300400500600700800
Beagle Boxer BorderCollie
Bulldog MixedBreed
Poodle
Breeds
Num
ber
of D
ogs
3. There are 2000 dogs in Enigma,
Ohio. The graph shows the different kinds of dogs in town.
a. Name a combination of 2
breeds of dog that make up half of the total dogs in town.
b. Show or explain how you found your answer.
4. Use the data in the table of endangered
and threatened mammals to make a bar graph. Make sure your graph is accurate and complete.
5. Chris examined the water depths for
Burns Reservoir in 1965 and 1966. She decided that the following information about the depths were most likely to have had some connection to the disappearance of the staff and students in 1966. Chris wants to display the information graphically.
a. Plot or graph the data. Make
sure your plot or graph is accurate and complete.
b. Explain why the type of graph or plot you made is the best type for displaying the given data.
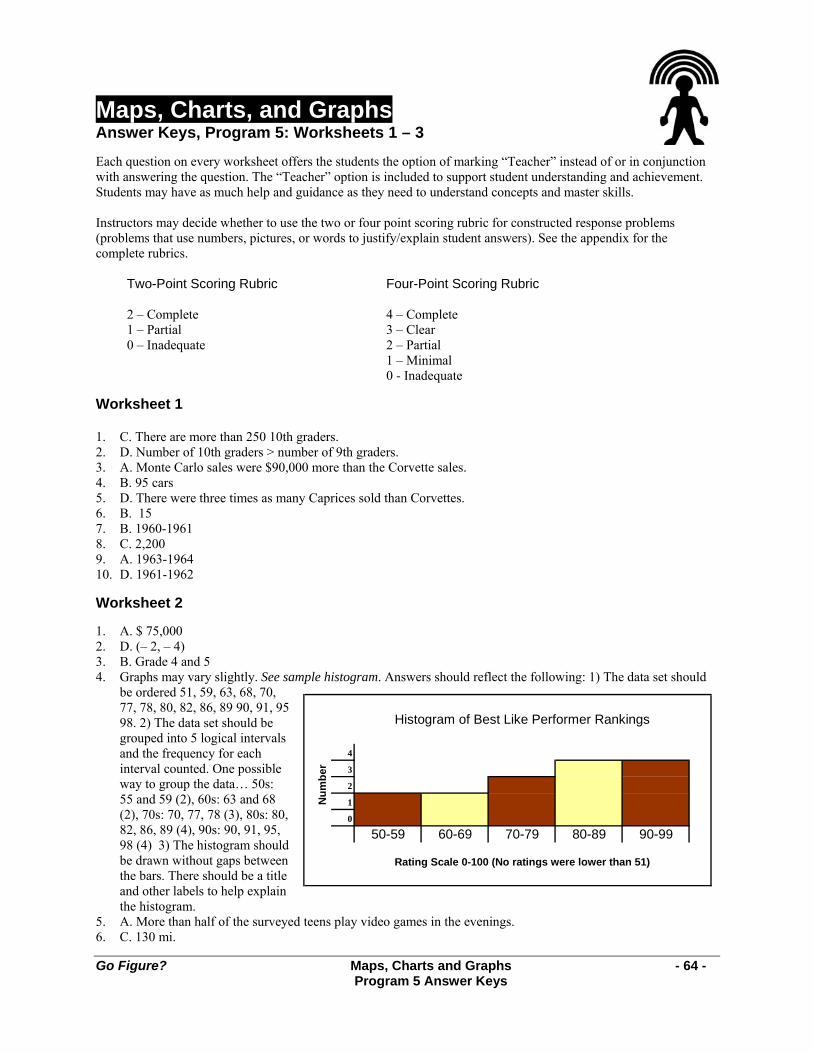
Go Figure? Maps, Charts and Graphs - 64 - Program 5 Answer Keys
4
3
2
1
0
50-59 60-69 70-79 80-89 90-99
Histogram of Best Like Performer Rankings
Num
ber
Rating Scale 0-100 (No ratings were lower than 51)
Maps, Charts, and Graphs Answer Keys, Program 5: Worksheets 1 – 3 Each question on every worksheet offers the students the option of marking “Teacher” instead of or in conjunction with answering the question. The “Teacher” option is included to support student understanding and achievement. Students may have as much help and guidance as they need to understand concepts and master skills. Instructors may decide whether to use the two or four point scoring rubric for constructed response problems (problems that use numbers, pictures, or words to justify/explain student answers). See the appendix for the complete rubrics.
Two-Point Scoring Rubric Four-Point Scoring Rubric 2 – Complete 1 – Partial 0 – Inadequate
4 – Complete 3 – Clear 2 – Partial 1 – Minimal 0 - Inadequate
Worksheet 1 1. C. There are more than 250 10th graders. 2. D. Number of 10th graders > number of 9th graders. 3. A. Monte Carlo sales were $90,000 more than the Corvette sales. 4. B. 95 cars 5. D. There were three times as many Caprices sold than Corvettes. 6. B. 15 7. B. 1960-1961 8. C. 2,200 9. A. 1963-1964 10. D. 1961-1962 Worksheet 2 1. A. $ 75,000 2. D. (– 2, – 4) 3. B. Grade 4 and 5 4. Graphs may vary slightly. See sample histogram. Answers should reflect the following: 1) The data set should
be ordered 51, 59, 63, 68, 70, 77, 78, 80, 82, 86, 89 90, 91, 95 98. 2) The data set should be grouped into 5 logical intervals and the frequency for each interval counted. One possible way to group the data… 50s: 55 and 59 (2), 60s: 63 and 68 (2), 70s: 70, 77, 78 (3), 80s: 80, 82, 86, 89 (4), 90s: 90, 91, 95, 98 (4) 3) The histogram should be drawn without gaps between the bars. There should be a title and other labels to help explain the histogram.
5. A. More than half of the surveyed teens play video games in the evenings. 6. C. 130 mi.
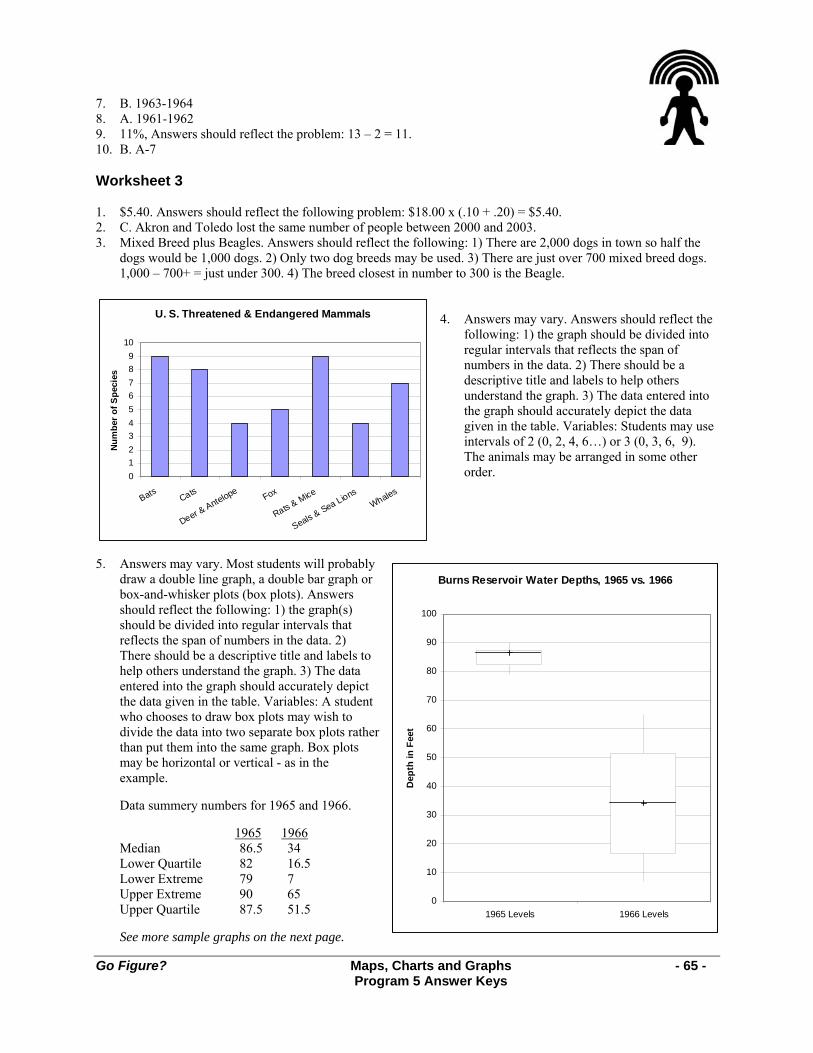
Go Figure? Maps, Charts and Graphs - 65 - Program 5 Answer Keys
U. S. Threatened & Endangered Mammals
0123456789
10
Bats Cats
Deer & Antelope Fox
Rats & Mice
Seals & Sea LionsWhales
Num
ber o
f Spe
cies
Burns Reservoir Water Depths, 1965 vs. 1966
0
10
20
30
40
50
60
70
80
90
100
1965 Levels 1966 Levels
Dep
th in
Fee
t
7. B. 1963-1964 8. A. 1961-1962 9. 11%, Answers should reflect the problem: 13 – 2 = 11. 10. B. A-7 Worksheet 3 1. $5.40. Answers should reflect the following problem: $18.00 x (.10 + .20) = $5.40. 2. C. Akron and Toledo lost the same number of people between 2000 and 2003. 3. Mixed Breed plus Beagles. Answers should reflect the following: 1) There are 2,000 dogs in town so half the
dogs would be 1,000 dogs. 2) Only two dog breeds may be used. 3) There are just over 700 mixed breed dogs. 1,000 – 700+ = just under 300. 4) The breed closest in number to 300 is the Beagle.
4. Answers may vary. Answers should reflect the
following: 1) the graph should be divided into regular intervals that reflects the span of numbers in the data. 2) There should be a descriptive title and labels to help others understand the graph. 3) The data entered into the graph should accurately depict the data given in the table. Variables: Students may use intervals of 2 (0, 2, 4, 6…) or 3 (0, 3, 6, 9). The animals may be arranged in some other order.
5. Answers may vary. Most students will probably
draw a double line graph, a double bar graph or box-and-whisker plots (box plots). Answers should reflect the following: 1) the graph(s) should be divided into regular intervals that reflects the span of numbers in the data. 2) There should be a descriptive title and labels to help others understand the graph. 3) The data entered into the graph should accurately depict the data given in the table. Variables: A student who chooses to draw box plots may wish to divide the data into two separate box plots rather than put them into the same graph. Box plots may be horizontal or vertical - as in the example. Data summery numbers for 1965 and 1966. 1965 1966 Median 86.5 34 Lower Quartile 82 16.5 Lower Extreme 79 7 Upper Extreme 90 65 Upper Quartile 87.5 51.5 See more sample graphs on the next page.

Go Figure? Maps, Charts and Graphs - 66 - Program 5 Answer Keys
5. Double Line Graph Example
Burns Reservoir Water Depths 1965 vs. 1966
0
20
40
60
80
100
April 10th April 17th April 24th May 1st May 8th May 15th May 22nd May 29th
Date
Dep
th in
Fee
t
1966 1965
5. Double Bar Graph Example
Burns Reservoir Water Depths 1965 vs. 1966
0
20
40
60
80
100
April 10th April 17th April 24th May 1st May 8th May 15th May 22nd May 29th
Date
Dep
th in
Fee
t
1966 1965

Go Figure? Maps, Chart, and Graphs - 67 - Sample Table and Pictograph
Chart: A Gallon Compared to Quarts, Pints, and Cups
C U P
C U P
C U P
C U P
C U P
C U P
C U P
C U P
C U P
C U P
C U P
C U P
C U P
C U P
C U P
C U P
Pint Pint Pint Pint Pint Pint Pint Pint
Quart Quart Quart Quart
Gallon
Pictograph:
Sightings at Enigma, Ohio • 1966
January
February
March
April
May
June
Each = 6 sightings
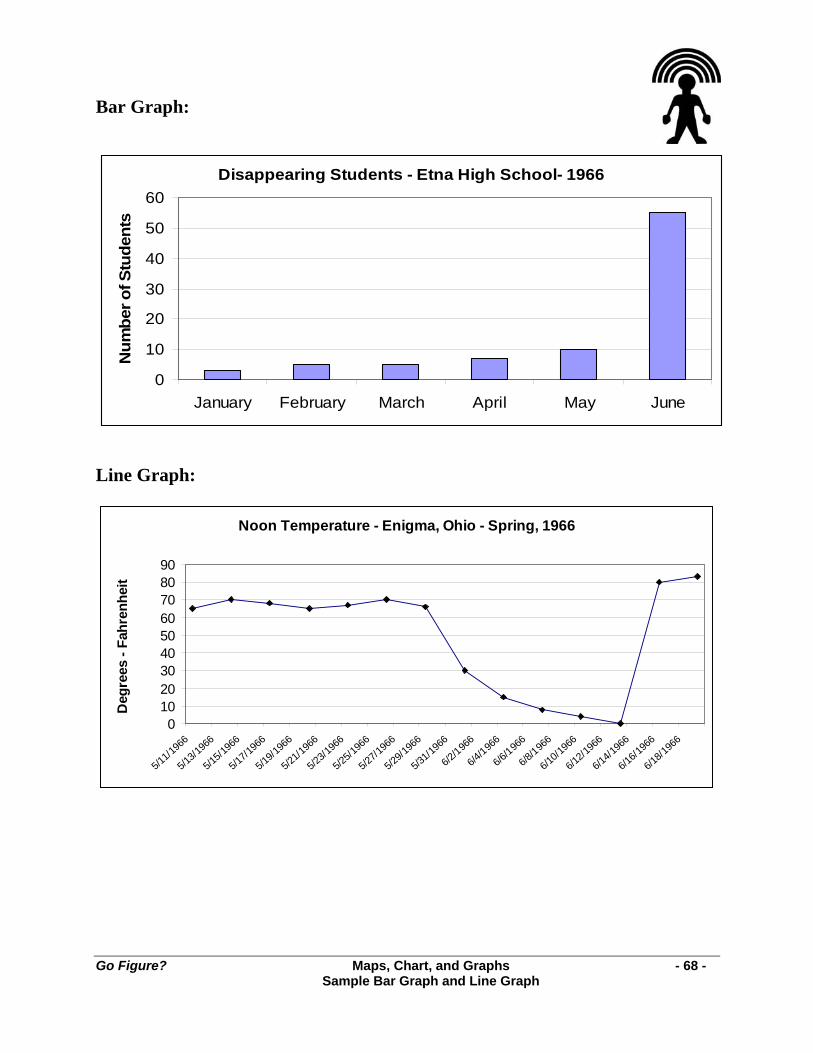
Go Figure? Maps, Chart, and Graphs - 68 - Sample Bar Graph and Line Graph
Bar Graph:
Disappearing Students - Etna High School- 1966
0
10
20
30
40
50
60
January February March April May June
Num
ber o
f Stu
dent
s
Line Graph:
Noon Temperature - Enigma, Ohio - Spring, 1966
0102030405060708090
5/11/1
966
5/13/1
966
5/15/1
966
5/17/1
966
5/19/1
966
5/21/1
966
5/23/1
966
5/25/1
966
5/27/1
966
5/29/1
966
5/31/1
966
6/2/196
6
6/4/196
6
6/6/196
6
6/8/196
6
6/10/1
966
6/12/1
966
6/14/1
966
6/16/1
966
6/18/1
966
Deg
rees
- Fa
hren
heit

Go Figure? Maps, Chart, and Graphs - 69 - Sample Pie Graph and Double Bar Graph
Pie Graph:
Double Bar Graph
Etna High Missing Students Juniors Compared to Total Missing - 1966
02468
10121416
Novem
ber
Decem
ber
Janu
ary
Februa
ryMarc
hApri
lMay
Num
ber o
f Stu
dent
s
Juniors Total
Etna High School Population • 06/13/1966
Seniors20%
Juniors17%
Sophomores18%
Freshmen30%
Faculty5%
Other10%
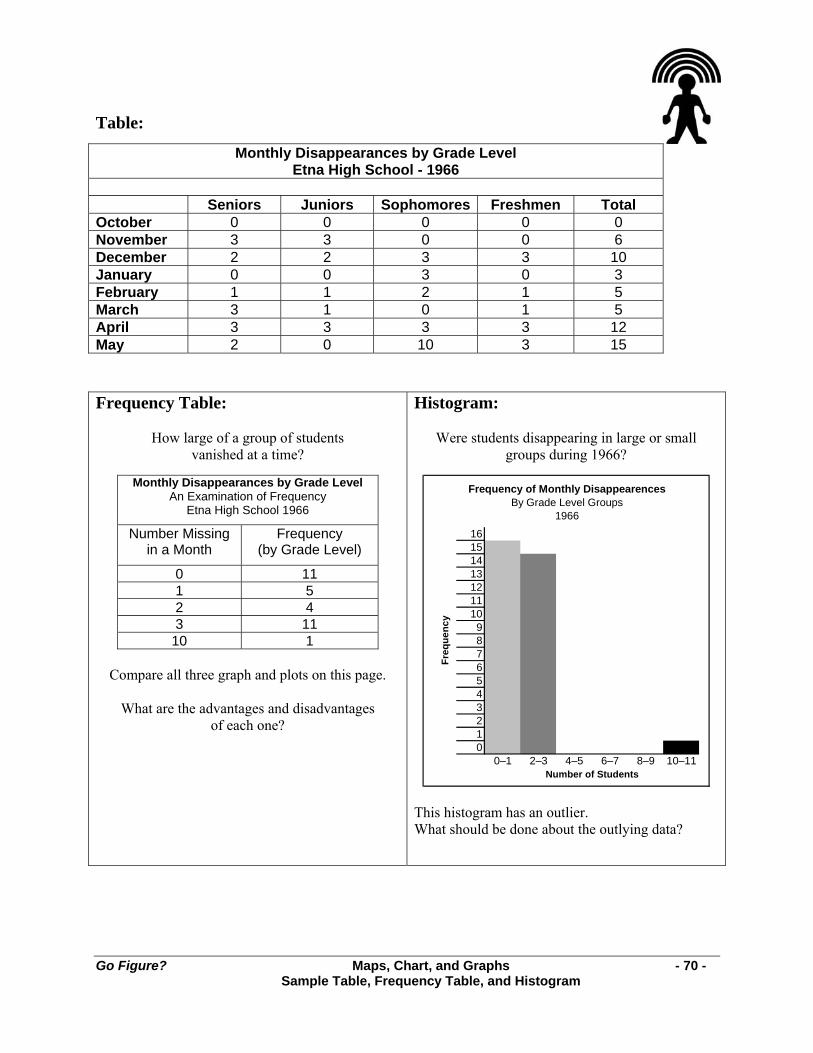
Go Figure? Maps, Chart, and Graphs - 70 - Sample Table, Frequency Table, and Histogram
Table:
Monthly Disappearances by Grade Level Etna High School - 1966
Seniors Juniors Sophomores Freshmen Total October 0 0 0 0 0 November 3 3 0 0 6 December 2 2 3 3 10 January 0 0 3 0 3 February 1 1 2 1 5 March 3 1 0 1 5 April 3 3 3 3 12 May 2 0 10 3 15
Frequency Table:
How large of a group of students vanished at a time?
Monthly Disappearances by Grade Level
An Examination of Frequency Etna High School 1966
Number Missing in a Month
Frequency (by Grade Level)
0 11 1 5 2 4 3 11
10 1
Compare all three graph and plots on this page.
What are the advantages and disadvantages of each one?
Histogram:
Were students disappearing in large or small groups during 1966?
16151413121110
9876543210
0–1 2–3 4–5 6–7 8–9 10–11
Freq
uenc
y
Number of Students
1966By Grade Level Groups
Frequency of Monthly Disappearences
This histogram has an outlier. What should be done about the outlying data?

Go Figure? Maps, Chart, and Graphs - 71 - Sample Table, Stem-and-Leaf Plot, and Box-and-Whisker Plot
Table: Stem-and-Leaf Plots:
Water Levels at Burns Reservoir
1965 and 1966 Date Level 1965 Level 1966 1/2 73 ft. 73 ft. 1/9 73 ft. 71 ft.
1/16 70 ft. 69 ft. 1/23 71 ft. 71 ft. 1/30 74 ft. 70 ft. 2/6 74 ft. 74 ft.
2/13 77 ft. 78 ft. 2/20 78 ft. 80 ft. 2/27 79 ft. 81 ft. 3/6 86 ft. 85 ft.
3/13 89 ft. 83 ft. 3/20 92 ft. 87 ft. 3/27 91 ft. 87 ft. 4/3 88 ft. 85 ft.
4/10 87 ft. 65 ft. 4/17 90 ft. 53 ft. 4/24 87 ft. 50 ft. 5/1 88 ft. 41 ft. 5/8 86 ft. 27 ft.
5/15 83 ft. 22 ft. 5/22 81 ft. 11 ft. 5/29 79 ft. 7 ft. 6/4 78 ft. 5 ft.
Water Levels at Burns Reservoir January 2nd to June 12th, 1965
7 0 1 3 3 4 4 7 8 8 9 9 8 1 3 6 6 7 7 8 8 9 9 0 1 2
Key: 7|0 = 70
Water Levels at Burns Reservoir January 2nd to June 12th, 1966
5 7 1 1 2 2 7 3 4 1 5 0 3 6 5 9 7 0 1 1 3 4 8 8 0 1 3 5 5 7 7
Key: 7|0 = 70 Box-and-Whisker Plots:
Compare all three tables and plots on this page. What are the advantages and disadvantages of each one?
10 20 30 40 50 60 70 80 90 Depth in Feet
Water Levels at Burns Reservoir – January 2nd to June 12th, 1965
10 20 30 40 50 60 70 80 90 Depth in Feet
Water Levels at Burns Reservoir – January 2nd to June 12th, 1966

- 72 -
NOTES:
Go Figure? Applying Statistics - 73 - Program 6
Applying Statistics Program 6 Guide Each episode of Go Figure? can be used as an introduction or a “refresher” of basic mathematics concepts presented in a fun and creative way. It may be used in a classroom or an intervention setting. The accompanying CD-ROM edu-game was designed for use by students on an individual basis. The object of the edu-game is to solve a mystery. In order to do this, the student must solve mathematics problems in the specific content areas presented in the video series. Thus the digital video series is used to generate interest and enthusiasm in the presentation of mathematics concepts, and the CD-ROM allows students to practice using the concepts in a “video-game” format. The three main characters in each DVD video program – the mysterious Pythagleo, plus two students named Carter and Chris who are trying to solve the mystery of Etna High School – discuss the targeted math concepts. Chris, and to a lesser extent, Carter, verbalizes what each is thinking as they work through problems associated with the math concepts. The DVD programs assume that, like Chris and Carter, your students have already been introduced to the math concepts presented in the episode. The dialog may be too quick for some students. Every step that some of your students will need to solve similar problems on their own may not be mentioned in the programs. Therefore, pausing the DVD to review or present additional information will help adapt the learning situation to the needs of your students. See additional materials about teaching with videos and differentiated instruction in the Introduction of the Teacher Resources Guide. Ohio Mathematics Content Standards and Benchmarks Data Analysis and Probability Benchmarks
A. Read, create, and use line graphs, histograms, circle graphs, box-and-whisker plots, stem-and-leaf plots, and other representations when appropriate.
B. Interpret data by looking for patterns and relationships, draw and justify conclusions, and answer related questions.
E. Collect, organize, display and interpret data for a specific pupose or need. F. Determine and use the range, mean, median and mode to analyze and compare data, and explain
what each indicates about the data.
Math Content
• Mean: definition and how to find • Mode: definition and how to find • Median: definition and how to find • Range: definition and how to find • Probability: definition and examples
Episode Notes
• Pythagleo drops several reports labeled “Government Agencies Attempting to Suppress the Study of Phenomena” as he runs to avoid Carter and Chris. Chris and Carter study the reports and other data they find as they continue trying to solve the mysterious disappearance of the Etna High students in 1966. Pythagleo denounces any government involvement but Chris finds a folder marked “Etna High Test Subjects”, “Confidential”, and “FBI”.
Go Figure? Applying Statistics - 74 - Program 6
• The chart that is used to explain mean, median, and mode is misrepresented by Chris and Carter. See if students can find the error……Hint: there are “12” 3’s instead of “15”, as Chris explains.
Teacher Notes The mean is the arithmetical average of a set of data. To find the mean, find the sum of all values in the set of data, then divide this sum by the number of items in the set. The mode is the number or item that has the greatest frequency in the set of data. To find the mode record the frequency of each item and choose the item having the greatest frequency. Notice that the mode can be something other than a number. There can be more than one mode. The median is the middle value of a set of data when the numbers are arranged in order of magnitude. To find the median of a set of data having an odd number of numbers, merely observe your data, perhaps counting from both ends, and pick the middle number. If the set of data has an even number of data points, then the median is the arithmetic average of the two middle terms (or half-way between them.) A probability is a number that describes how likely it is that an event will occur. A probability is expressed as the ratio of the number of successful ways that an event can happen to the total number of ways that the event can happen.
Probability = outcomesofnumbertotal
outcomessuccessfulofNumber
Probabiltiy is a number between 0 and 1, inclusive. A probability of 0 means the event is impossible to occur. The probability that the sun will not rise tomorrow is 0. A probabliity of 1 means the event must occur. The probability that the sun will rise tomorrow is 1.
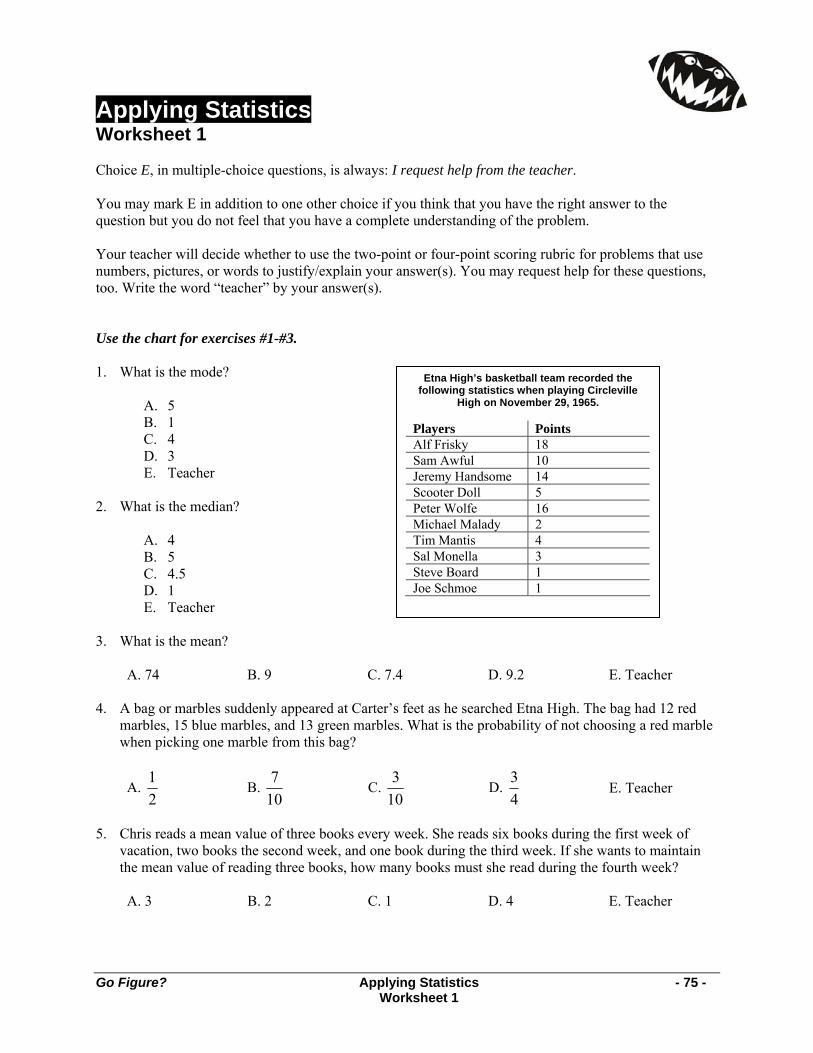
Go Figure? Applying Statistics - 75 - Worksheet 1
Etna High’s basketball team recorded the following statistics when playing Circleville
High on November 29, 1965. Players Points Alf Frisky 18 Sam Awful 10 Jeremy Handsome 14 Scooter Doll 5 Peter Wolfe 16 Michael Malady 2 Tim Mantis 4 Sal Monella 3 Steve Board 1 Joe Schmoe 1
Applying Statistics Worksheet 1 Choice E, in multiple-choice questions, is always: I request help from the teacher. You may mark E in addition to one other choice if you think that you have the right answer to the question but you do not feel that you have a complete understanding of the problem. Your teacher will decide whether to use the two-point or four-point scoring rubric for problems that use numbers, pictures, or words to justify/explain your answer(s). You may request help for these questions, too. Write the word “teacher” by your answer(s). Use the chart for exercises #1-#3. 1. What is the mode?
A. 5 B. 1 C. 4 D. 3 E. Teacher
2. What is the median?
A. 4 B. 5 C. 4.5 D. 1 E. Teacher
3. What is the mean?
A. 74 B. 9 C. 7.4 D. 9.2 E. Teacher 4. A bag or marbles suddenly appeared at Carter’s feet as he searched Etna High. The bag had 12 red
marbles, 15 blue marbles, and 13 green marbles. What is the probability of not choosing a red marble when picking one marble from this bag?
A. 21
B. 107
C. 103
D. 43
E. Teacher
5. Chris reads a mean value of three books every week. She reads six books during the first week of
vacation, two books the second week, and one book during the third week. If she wants to maintain the mean value of reading three books, how many books must she read during the fourth week?
A. 3 B. 2 C. 1 D. 4 E. Teacher

Go Figure? Applying Statistics - 76 - Worksheet 1
6. Carter has 20 coins in his pocket. There are five nickels, ten dimes, and five quarters. Ignoring the size of the coins and randomly choosing one coin in the pocket, what is the probability of getting a nickel?
A. 21
B. 1510
C. 41
D. 11
E. Teacher
7. A jar contains only red, white, and blue marbles. What is the probability of drawing a white or red or
blue marble on a single draw?
A. 31
B. 1 C. 0 D. 32
E. Teacher
8. In exercise #7, what is the probability of drawing a green marble on a single draw?
A. 31
B. 1 C. 0 D. 32
E. Teacher
9. A bag contains three marbles of each color: red, green, and blue. From the nine marbles, a marble is
drawn and seen to be red. The red marble is replaced. What is the probability of drawing a red marble on the next draw?
A. 3 B. 31
C. 32
D. 1 E. Teacher
10. A jar contains two red, five green, and four blue marbles. A red marble is randomly drawn from the
container and not replaced. What is the probability of drawing a red marble on the next draw?
A. 51
B. 1110
C. 101
D.0 E. Teacher
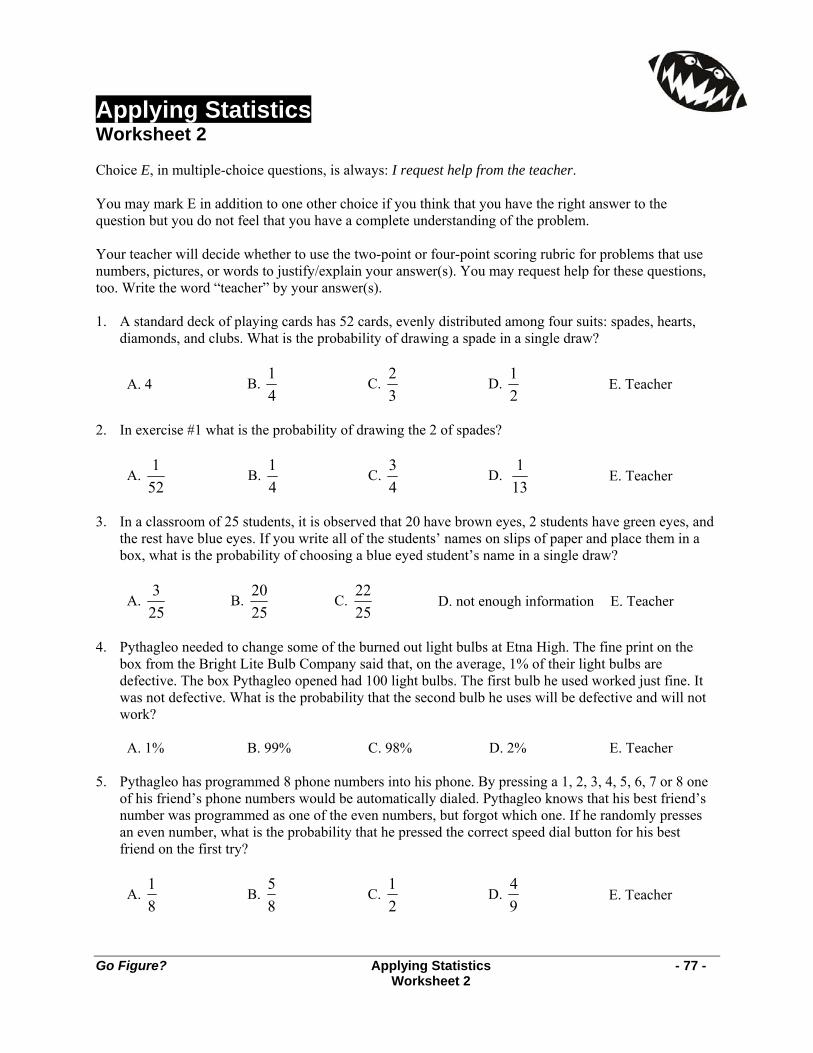
Go Figure? Applying Statistics - 77 - Worksheet 2
Applying Statistics Worksheet 2 Choice E, in multiple-choice questions, is always: I request help from the teacher. You may mark E in addition to one other choice if you think that you have the right answer to the question but you do not feel that you have a complete understanding of the problem. Your teacher will decide whether to use the two-point or four-point scoring rubric for problems that use numbers, pictures, or words to justify/explain your answer(s). You may request help for these questions, too. Write the word “teacher” by your answer(s). 1. A standard deck of playing cards has 52 cards, evenly distributed among four suits: spades, hearts,
diamonds, and clubs. What is the probability of drawing a spade in a single draw?
A. 4 B. 41
C. 32
D. 21
E. Teacher
2. In exercise #1 what is the probability of drawing the 2 of spades?
A. 521
B. 41
C. 43
D. 131
E. Teacher
3. In a classroom of 25 students, it is observed that 20 have brown eyes, 2 students have green eyes, and
the rest have blue eyes. If you write all of the students’ names on slips of paper and place them in a box, what is the probability of choosing a blue eyed student’s name in a single draw?
A. 253
B. 2520
C. 2522
D. not enough information E. Teacher
4. Pythagleo needed to change some of the burned out light bulbs at Etna High. The fine print on the
box from the Bright Lite Bulb Company said that, on the average, 1% of their light bulbs are defective. The box Pythagleo opened had 100 light bulbs. The first bulb he used worked just fine. It was not defective. What is the probability that the second bulb he uses will be defective and will not work?
A. 1% B. 99% C. 98% D. 2% E. Teacher
5. Pythagleo has programmed 8 phone numbers into his phone. By pressing a 1, 2, 3, 4, 5, 6, 7 or 8 one
of his friend’s phone numbers would be automatically dialed. Pythagleo knows that his best friend’s number was programmed as one of the even numbers, but forgot which one. If he randomly presses an even number, what is the probability that he pressed the correct speed dial button for his best friend on the first try?
A. 81
B. 85
C. 21
D. 94
E. Teacher

Go Figure? Applying Statistics - 78 - Worksheet 2
Ink Pen Sales
Each
Pen
Icon
Rep
rese
nts
1,00
0
Red Blue Black Green Yellow
6. A regular, two-sided coin is tossed nine times, falling heads up on each toss. What is the probability of the next toss being a tails up?
A. 21
B. 101
C. 109
D. 1 E. Teacher
7. Diane has a list of four numbers. The mode is 5, the median is 6, and the mean is 7. What are the four
possible numbers?
A. 5, 5, 6, 11 B. 5, 5, 7, 11 C. 5, 5, 6, 7 D. 5, 6, 7, 11 E. Teacher
Use the pictograph for exercises #8-#10. 8. What is the total number of pens illustrated in
the pictograph?
A. 15 B. 15,000 C. 4,000 D. 7,500 E. Teacher
9. What color represents the mode?
A. Red B. Blue C. Black D. Green E. Teacher
10. What is the mean number of pens sold?
A. 3 B. 3,000 C. 5 D. 15,000 E. Teacher
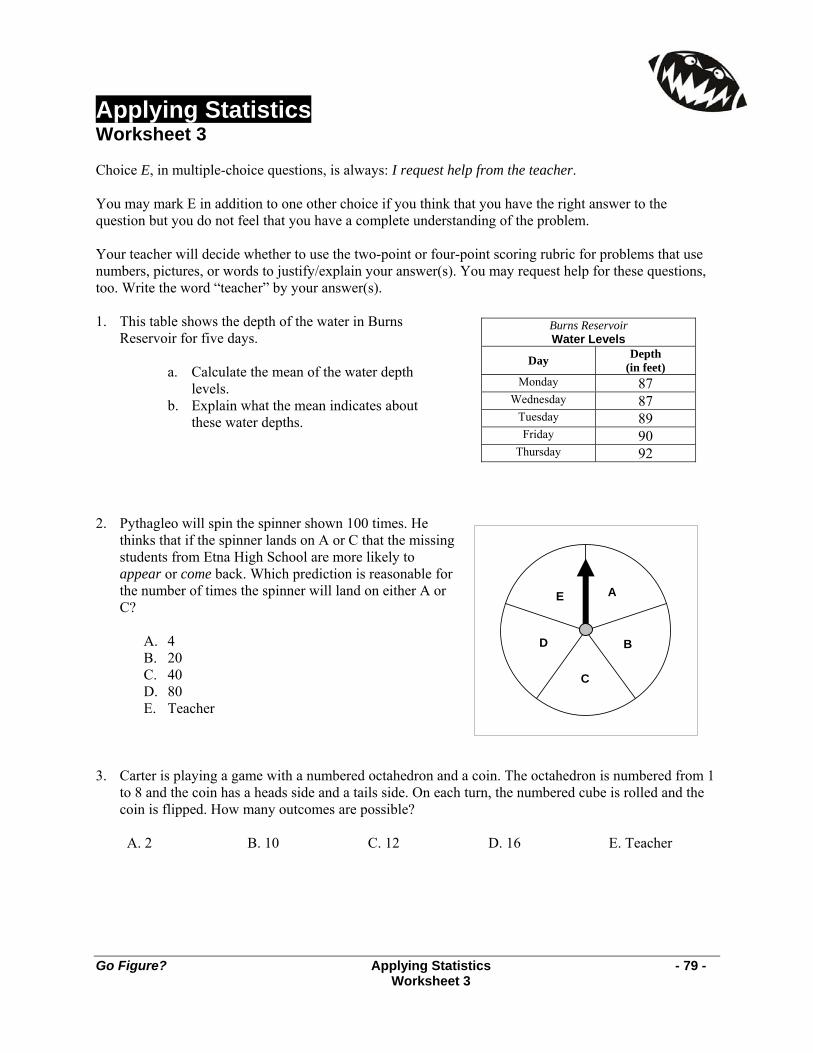
Go Figure? Applying Statistics - 79 - Worksheet 3
Burns Reservoir Water Levels
Day Depth (in feet)
Monday 87 Wednesday 87
Tuesday 89 Friday 90
Thursday 92
A
B
C
D
E
Applying Statistics Worksheet 3 Choice E, in multiple-choice questions, is always: I request help from the teacher. You may mark E in addition to one other choice if you think that you have the right answer to the question but you do not feel that you have a complete understanding of the problem. Your teacher will decide whether to use the two-point or four-point scoring rubric for problems that use numbers, pictures, or words to justify/explain your answer(s). You may request help for these questions, too. Write the word “teacher” by your answer(s). 1. This table shows the depth of the water in Burns
Reservoir for five days.
a. Calculate the mean of the water depth levels.
b. Explain what the mean indicates about these water depths.
2. Pythagleo will spin the spinner shown 100 times. He
thinks that if the spinner lands on A or C that the missing students from Etna High School are more likely to appear or come back. Which prediction is reasonable for the number of times the spinner will land on either A or C?
A. 4 B. 20 C. 40 D. 80 E. Teacher
3. Carter is playing a game with a numbered octahedron and a coin. The octahedron is numbered from 1
to 8 and the coin has a heads side and a tails side. On each turn, the numbered cube is rolled and the coin is flipped. How many outcomes are possible?
A. 2 B. 10 C. 12 D. 16 E. Teacher
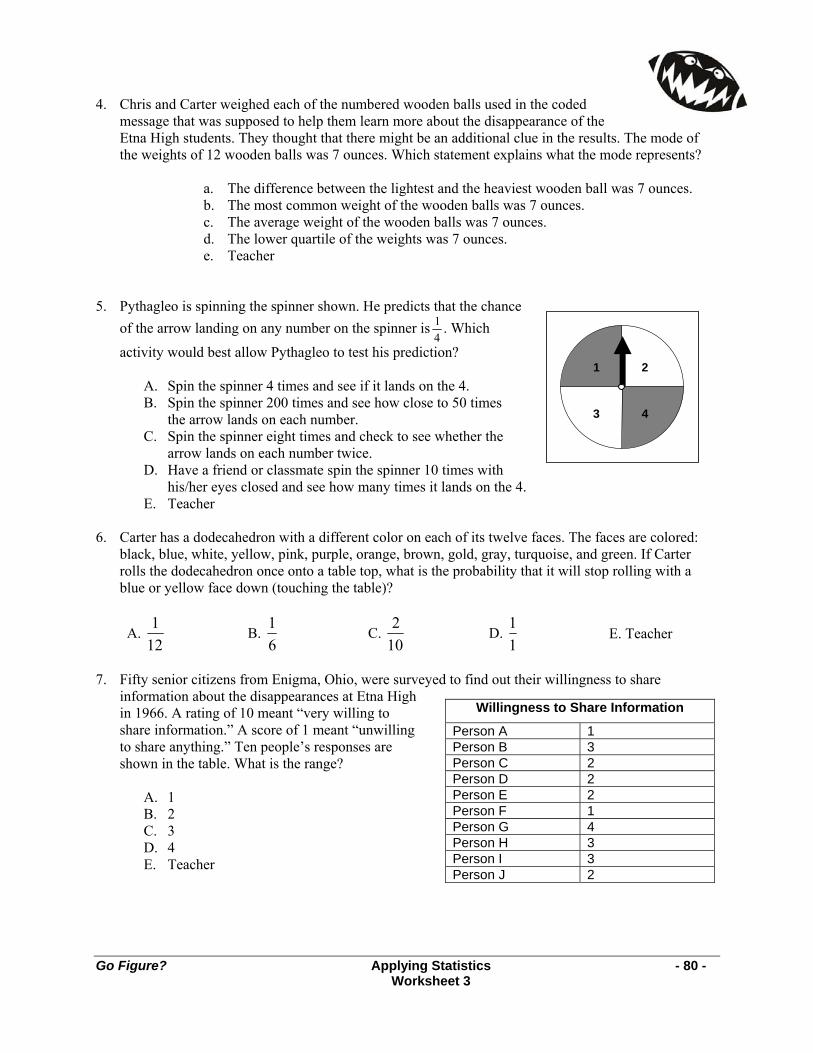
Go Figure? Applying Statistics - 80 - Worksheet 3
1 2
3 4
Willingness to Share Information
Person A 1 Person B 3 Person C 2 Person D 2 Person E 2 Person F 1 Person G 4 Person H 3 Person I 3 Person J 2
4. Chris and Carter weighed each of the numbered wooden balls used in the coded message that was supposed to help them learn more about the disappearance of the Etna High students. They thought that there might be an additional clue in the results. The mode of the weights of 12 wooden balls was 7 ounces. Which statement explains what the mode represents?
a. The difference between the lightest and the heaviest wooden ball was 7 ounces. b. The most common weight of the wooden balls was 7 ounces. c. The average weight of the wooden balls was 7 ounces. d. The lower quartile of the weights was 7 ounces. e. Teacher
5. Pythagleo is spinning the spinner shown. He predicts that the chance
of the arrow landing on any number on the spinner is 14
. Which
activity would best allow Pythagleo to test his prediction?
A. Spin the spinner 4 times and see if it lands on the 4. B. Spin the spinner 200 times and see how close to 50 times
the arrow lands on each number. C. Spin the spinner eight times and check to see whether the
arrow lands on each number twice. D. Have a friend or classmate spin the spinner 10 times with
his/her eyes closed and see how many times it lands on the 4. E. Teacher
6. Carter has a dodecahedron with a different color on each of its twelve faces. The faces are colored:
black, blue, white, yellow, pink, purple, orange, brown, gold, gray, turquoise, and green. If Carter rolls the dodecahedron once onto a table top, what is the probability that it will stop rolling with a blue or yellow face down (touching the table)?
A. 121
B. 61
C. 102
D. 11
E. Teacher
7. Fifty senior citizens from Enigma, Ohio, were surveyed to find out their willingness to share
information about the disappearances at Etna High in 1966. A rating of 10 meant “very willing to share information.” A score of 1 meant “unwilling to share anything.” Ten people’s responses are shown in the table. What is the range?
A. 1 B. 2 C. 3 D. 4 E. Teacher

Go Figure? Applying Statistics - 81 - Worksheet 3
Carter's Quiz Scores7 4 5 6 6 88 3 7 9 9 1 4 4 5 6 6 7 7 8 9 9
10 0 0 0 0 0
Key: 10|0 = 100%
8. The parents’ organization at the elementary school in Enigma, Ohio, sold raffle tickets to raise money to buy playground equipment. To help promote the raffle and raise interest, four prizes were given: $200, $100, $75 and $25. Each ticket cost $7.00 and 2000 tickets were sold.
a. Write a fraction (in lowest terms) that expresses the ratio between the total amount
of money given away in prizes and the total money raised by the ticket sales. b. What percent (rounded to the nearest whole percent) of the money raised was paid
out in prizes? c. Use numbers, pictures, or words to explain your answers.
9. Chris is on the baseball team at Western High School. His batting averages for the last seven games
were .478, .267, .188, .193, .196, .245, and .358. What is the mean for his batting averages?
A. 275 B. .275 C. 1.925 D. .245 E. Teacher 10. The stem-and-leaf plot represents the Carter’s Social Studies
quiz scores for the first half of the school year. a. What is the mode of the data set? b. What is the median? c. What is the range? d. Use numbers, pictures, or words to support
your answers. 11. Pythagleo was paid for ten weeks of work at Etna High School. His mean (average) earnings were
$275 per week for the first nine weeks. In the last week (week ten), he earned $515 because he worked so much overtime. How was Pythagleo’s mean weekly earnings for the ten weeks affected by the overtime of the last week?
A. the mean did not change C. increased by $299 B. increased by $24 D. increased by $515 E. Teacher
12. Chris has one green, one white, one red, one yellow and one blue tee shirt. She also has one pair of
black jeans, one pair of dark blue jeans, and one pair of light blue jeans. Chris was so tired from trying to solve the mystery of Etna High School that she chose a tee shirt and a pair of jeans from her closet without even looking at what she is doing. What is the probability that Chris chose a yellow tee shirt and a pair of black jeans? Use number, pictures or words to support your answer.
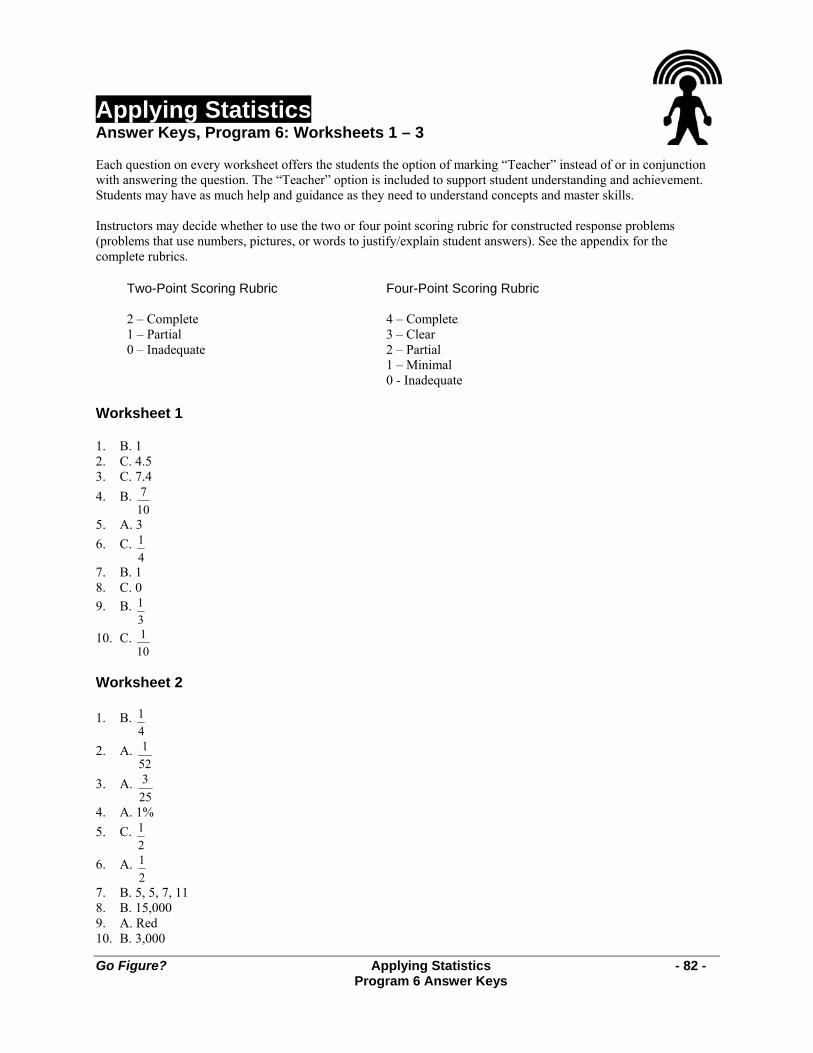
Go Figure? Applying Statistics - 82 - Program 6 Answer Keys
Applying Statistics Answer Keys, Program 6: Worksheets 1 – 3 Each question on every worksheet offers the students the option of marking “Teacher” instead of or in conjunction with answering the question. The “Teacher” option is included to support student understanding and achievement. Students may have as much help and guidance as they need to understand concepts and master skills. Instructors may decide whether to use the two or four point scoring rubric for constructed response problems (problems that use numbers, pictures, or words to justify/explain student answers). See the appendix for the complete rubrics.
Two-Point Scoring Rubric Four-Point Scoring Rubric 2 – Complete 1 – Partial 0 – Inadequate
4 – Complete 3 – Clear 2 – Partial 1 – Minimal 0 - Inadequate
Worksheet 1 1. B. 1 2. C. 4.5 3. C. 7.4 4. B.
107
5. A. 3 6. C.
41
7. B. 1 8. C. 0 9. B.
31
10. C. 101
Worksheet 2 1. B.
41
2. A. 521
3. A. 253
4. A. 1% 5. C.
21
6. A. 21
7. B. 5, 5, 7, 11 8. B. 15,000 9. A. Red 10. B. 3,000
Go Figure? Applying Statistics - 83 - Program 6 Answer Keys
Worksheet 3 1. The mean is 89°. The mean shows how deep the water would be in Burns Reservoir if it was the same
all five days. Answers should reflect the following 1) (87 + 87 + 89 + 90 +92) ÷ 5. 2) The definition of mean is the average of the numbers in a data set. An average is a number that typifies a set of numbers of which it is a function.
2. C. 40 3. D. 16 4. B. The most common weight of the wooden balls was 7 ounces. 5. B. Spin the spinner 200 times and see how close to 50 times the arrow lands on each number. 6. B.
61
7. C. 3 8.
351 , 3%. Answers should reflect the following:
1) Total money earned. 2000 x $7 = $14,000 2) Total prize money. 200 + 100 + 75 + 25 = $400. 3) Ratio.
351
400000,14400400
14000400
=÷
÷=
4) Convert the fraction to a percent. %30285.35
100351
1100351
1100 or==
××
=×
9. B. .275 10. Mode: 100%, Median: 95.5% Range: 26%. Answers should reflect the following:
1) Mode is the score that appears most often and Chris got a 100% five times. 2) Median is the central number (or the average of the central 2 numbers in a data set with a even
amount of numbers) when a data set is ordered least to greatest. For the 24 numbers in the Chris’s scores {74, 75, 76, 76, 78, 83, 87, 89, 91, 94, 94, 95, 96, 96, 97, 97, 98, 99, 99, 100, 100, 100, 100, 100}, the two central numbers are 95 and 96. The average of 95 and 96 is 95.5%.
3) Range is distance between the lowest number and the highest number in a data set. 100 – 74 = 26%.
11. B. increased by $24 12.
151 . Answers should reflect the following:
1) There are 5 different colors of tee shirts. 2) There are 3 different colors of jeans. 3) There are 15 different possible combinations of the tee shirts and the jeans. 5 x 3 = 15 4) Of the 15 possible combinations of outfits, there is only one combination that is the yellow tee
shirt and the black jeans. 1 : 15 is 151

- 84 -
NOTES:
Go Figure? Algebra - 85 - Program 7
Algebra Program 7 Guide Each episode of Go Figure? can be used as an introduction or a “refresher” of basic mathematics concepts presented in a fun and creative way. It may be used in a classroom or an intervention setting. The accompanying CD-ROM edu-game was designed for use by students on an individual basis. The object of the edu-game is to solve a mystery. In order to do this, the student must solve mathematics problems in the specific content areas presented in the video series. Thus the digital video series is used to generate interest and enthusiasm in the presentation of mathematics concepts, and the CD-ROM allows students to practice using the concepts in a “video-game” format. The three main characters in each DVD video program – the mysterious Pythagleo, plus two students named Carter and Chris who are trying to solve the mystery of Etna High School – discuss the targeted math concepts. Chris, and to a lesser extent, Carter, verbalizes what each is thinking as they work through problems associated with the math concepts. The DVD programs assume that, like Chris and Carter, your students have already been introduced to the math concepts presented in the episode. The dialog may be too quick for some students. Every step that some of your students will need to solve similar problems on their own may not be mentioned in the programs. Therefore, pausing the DVD to review or present additional information will help adapt the learning situation to the needs of your students. See additional materials about teaching with videos and differentiated instruction in the Introduction of the Teacher Resources Guide. Ohio Mathematics Content Standards and Benchmarks Patterns, Functions and Algebra
B. Represent, ananlyze and generalize a variety of patterns and functions with tables, graphs, words and symbolic rules.
C. Use variables to create and solve equations and inequalities representing problem situations F. Use representations, such as tables, graphs and equations, to model situations and to solve
problems, especially those that involve linear relationships. G. Write, simplify and evaluate algebraic expressions. I. Explain how inverse operations are used to solve linear equeations. L. Analyze functional relationships, and explain how a change in one quantitiy results in a change in
the other. Math Content
• Solving algebraic equations • Chris explains how to find the numeric data in a word problem with the equation D = r x t. The
problem gives the values of D (100 miles) and r (20 mph). Chris then explains how to isolate variable t and find its value.
• Letters can be used to stand in for unknown quantities. • Trial and Error – Substitute a possible answer for a variable.
Episode Note
• Carter and Chris try to get information from the only person who did not disappear in 1966, the school principal. Pythagelo says he has the principal’s phone number but he gives Chris and Carter only two of the digits. They must solve several algebraic equations to learn the missing numbers.
Go Figure? Algebra - 86 - Program 7
Teacher Notes Some problem situations that can be solved using algebra.
• If a car travels at a speed of 20 miles per hour (mph), how long will it take to travel 100 miles?
Distance = rate x time D = rt
100 = 20 × t
2020
20100 t
=
5 = t
Replace the variables given data: 20 mph, 100 miles. Isolate t.
• Since t is multiplied by 20, divide by 20. • Remember to preform the same opertion on both sides of the equation.
It will take a car 5 hours traveling at 20 mph to travel 100 miles.
• When evaluating expressions, replace the variable with the given value If m = 3, find the value of the expression 4m + 6 4m + 6 = 4 (3) + 6 = 12 + 6 = 18
• If a problem appears to be too difficult to solve or evaluate, replace the given values in the equation with some possible value(s), and find which value(s) produces a true statement.
Given that 46= x2 – 3 Find which value from the set [3, 4, 7] is the soution: Try x = 3 Try x = 4 Try x = 7
46 = x2 – 3 46 = (3)2 – 3 46 = 9 – 3
46 ≠ 6
46 = x2 – 3 46 = (4)2 – 3 46 = 16 – 3
46 ≠ 13
46 = x2 – 3 46 = (7)2 – 3 46 = 49 – 3
46 = 46
False 3 is not the correct
value.
False 4 is not the correct
value
True This statement is true, therefore x = 7
is the solution to the equation 46 = x2 – 3
Go Figure? Algebra - 87 - Worksheet 1
Algebra Worksheet 1 Choice E, in multiple-choice questions, is always: I request help from the teacher. You may mark E in addition to one other choice if you think that you have the right answer to the question but you do not feel that you have a complete understanding of the problem. Your teacher will decide whether to use the two-point or four-point scoring rubric for problems that use numbers, pictures, or words to justify/explain your answer(s). You may request help for these questions, too. Write the word “teacher” by your answer(s). 1. Evaluate 5x + 3 when x = 2.
A. 25 B. 13 C. 10 D. 7 E. Teacher 2. Solve for y: 2(y+1) = 14
A. 7 B. –7 C. 6 D. 2
13 E. Teacher
3. Solve for m: 3m ≥ 117
A. m < 39 B. m ≥ 39 C. m ≤ 39 D. m > 50 E. Teacher 4. A sunflower grows at a rate of 4 in. per week. The sunflower was 6 in. tall when Chris brought it
home from an experiment at school. The expression of the growth of the sunflower after the weeks (w) that Chris has the plant at home is 4w + 6. What is the height of the plant after 4 weeks at Chris’s house?
A. 22 ft. B. 14 in. C. 1 ft. 10 in. D. 1 ft. 2 in. E. Teacher
5. What is the solution for 2(n+3) < 14?
A. n < 4 B. n ≥ 4 C. n < 5 D. n > 1 E. Teacher 6. Which value below is a possible solution for 2(p+5) ≤ 10?
A. p = 1 B. p = 2 C. p = 0 D. p = 3 E. Teacher 7. The perimeter of a rectangle can be found by using the formula P = 2(L + W), where L represents the
measure of the length and W represents the measure of the width (all in the same units). If the perimeter of the rectangle is 80 inches and the width is 5 inches, what is the length?
A. 70 in. B. 14 in. C. 10 in. D. 35 in. E. Teacher

Go Figure? Algebra - 88 - Worksheet 1
8. The formula to convert Celsius degree temperature to Fahrenheit degrees is
F = 59
C+32. What Fahrenheit temperature is equivalent to 40ºC?
A. 104º B. 32º C. 40º D. 100º E. Teacher
9. The formula for the area of a circle is A = 2rπ . If the area of the circle is 78 sq. in., then the radius is
estimated to be…
A. 25 in. B. 24 in. C. 4 in. D. 5 in. E. Teacher 10. Which value below is a possible for solution for 5(m-4) <10?
A. 6 B. 7 C. 5 D.10 E. Teacher
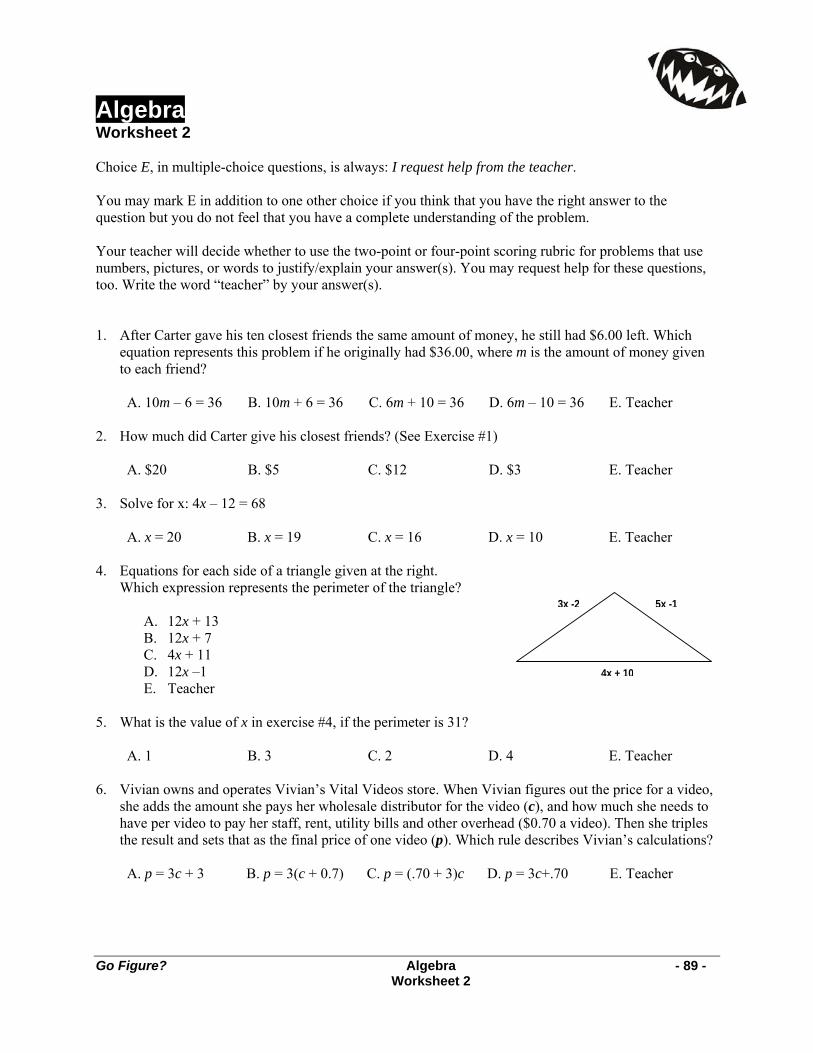
Go Figure? Algebra - 89 - Worksheet 2
3x -2 5x -1
4x + 10
Algebra Worksheet 2 Choice E, in multiple-choice questions, is always: I request help from the teacher. You may mark E in addition to one other choice if you think that you have the right answer to the question but you do not feel that you have a complete understanding of the problem. Your teacher will decide whether to use the two-point or four-point scoring rubric for problems that use numbers, pictures, or words to justify/explain your answer(s). You may request help for these questions, too. Write the word “teacher” by your answer(s). 1. After Carter gave his ten closest friends the same amount of money, he still had $6.00 left. Which
equation represents this problem if he originally had $36.00, where m is the amount of money given to each friend?
A. 10m – 6 = 36 B. 10m + 6 = 36 C. 6m + 10 = 36 D. 6m – 10 = 36 E. Teacher
2. How much did Carter give his closest friends? (See Exercise #1)
A. $20 B. $5 C. $12 D. $3 E. Teacher 3. Solve for x: 4x – 12 = 68
A. x = 20 B. x = 19 C. x = 16 D. x = 10 E. Teacher 4. Equations for each side of a triangle given at the right.
Which expression represents the perimeter of the triangle?
A. 12x + 13 B. 12x + 7 C. 4x + 11 D. 12x –1 E. Teacher
5. What is the value of x in exercise #4, if the perimeter is 31?
A. 1 B. 3 C. 2 D. 4 E. Teacher 6. Vivian owns and operates Vivian’s Vital Videos store. When Vivian figures out the price for a video,
she adds the amount she pays her wholesale distributor for the video (c), and how much she needs to have per video to pay her staff, rent, utility bills and other overhead ($0.70 a video). Then she triples the result and sets that as the final price of one video (p). Which rule describes Vivian’s calculations?
A. p = 3c + 3 B. p = 3(c + 0.7) C. p = (.70 + 3)c D. p = 3c+.70 E. Teacher
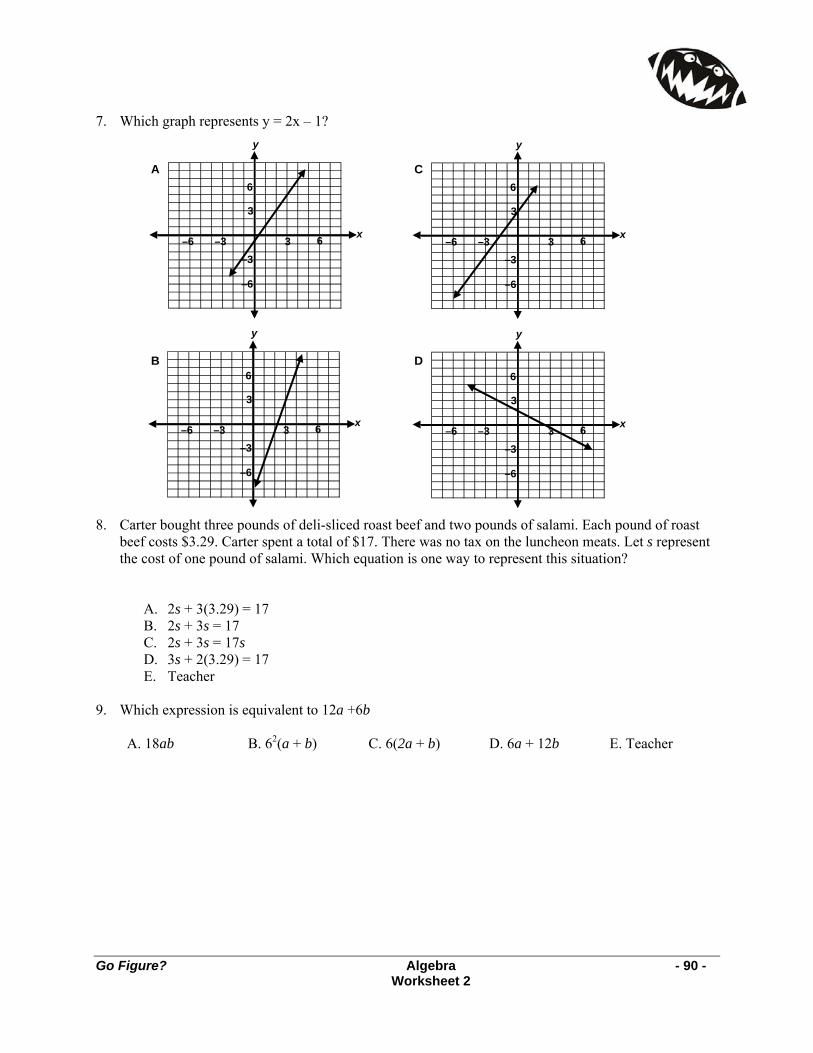
Go Figure? Algebra - 90 - Worksheet 2
A
B
y
6 3 –3
6
3
–3
–6
–6x
y
6 3 –3
6
3
–3
–6
–6x
y
C
D
6 3 –3
6
3
–3
–6
–6 x
6 3 –3
6
3
–3
–6
–6 x
y
7. Which graph represents y = 2x – 1? 8. Carter bought three pounds of deli-sliced roast beef and two pounds of salami. Each pound of roast
beef costs $3.29. Carter spent a total of $17. There was no tax on the luncheon meats. Let s represent the cost of one pound of salami. Which equation is one way to represent this situation?
A. 2s + 3(3.29) = 17 B. 2s + 3s = 17 C. 2s + 3s = 17s D. 3s + 2(3.29) = 17 E. Teacher
9. Which expression is equivalent to 12a +6b
A. 18ab B. 62(a + b) C. 6(2a + b) D. 6a + 12b E. Teacher
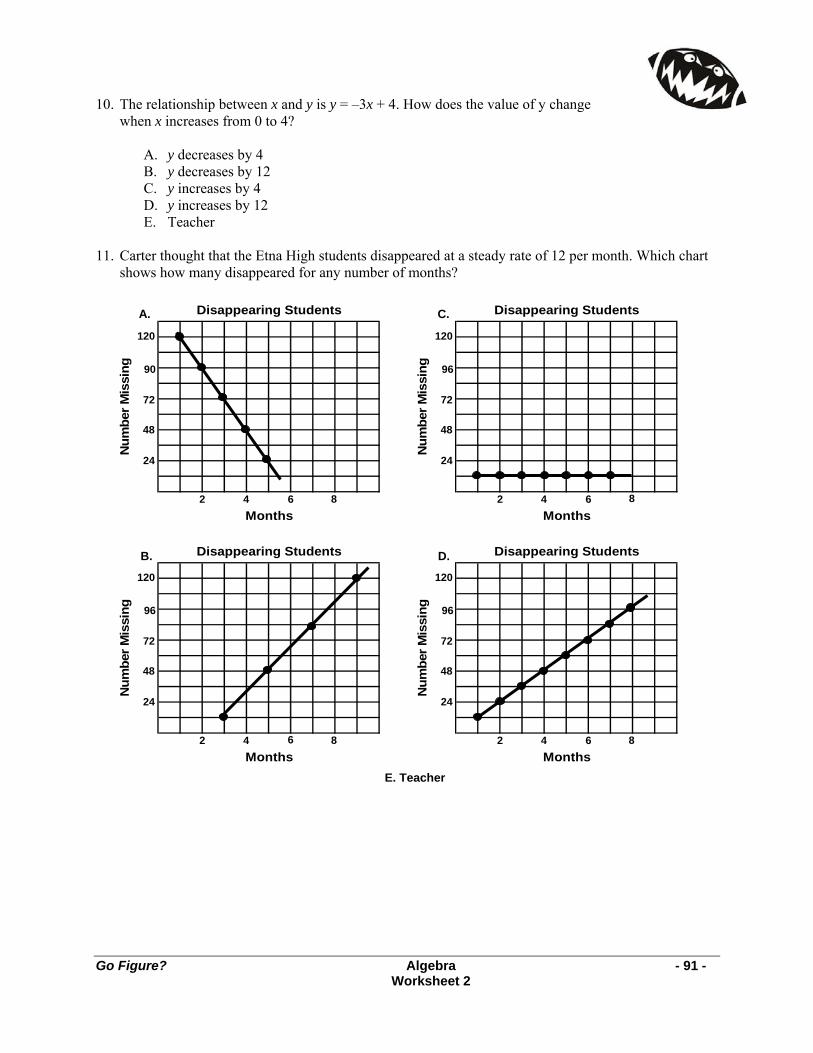
Go Figure? Algebra - 91 - Worksheet 2
E. Teacher
C.
B.
2 4 6
120
90
72
48
Disappearing Students
Months
Num
ber M
issi
ng
24
8 2 4 6
120
96
72
48
Disappearing Students
Months
Num
ber M
issi
ng
24
2 4
120
96
72
48
Disappearing Students
Months
Num
ber M
issi
ng
24
8 2 4 6
120
96
72
48
Disappearing Students
Months
Num
ber M
issi
ng
24
8
A.
D.
6
8
10. The relationship between x and y is y = –3x + 4. How does the value of y change when x increases from 0 to 4?
A. y decreases by 4 B. y decreases by 12 C. y increases by 4 D. y increases by 12 E. Teacher
11. Carter thought that the Etna High students disappeared at a steady rate of 12 per month. Which chart
shows how many disappeared for any number of months?
Go Figure? Algebra - 92 - Worksheet 3
Algebra Worksheet 3 Choice E, in multiple-choice questions, is always: I request help from the teacher. You may mark E in addition to one other choice if you think that you have the right answer to the question but you do not feel that you have a complete understanding of the problem. Your teacher will decide whether to use the two-point or four-point scoring rubric for problems that use numbers, pictures, or words to justify/explain your answer(s). You may request help for these questions, too. Write the word “teacher” by your answer(s). 1. Which problem situation is represented by the equation 12 + 3x = 72?
A. Carter had $72. He paid $12 for a snow shovel and spent the rest of the money to hire his brothers to shovel snow during three different show storms (x). How much money did Carter have left?
B. Carter had $12. Then he earned money for each of three jobs shoveling snow. If Carter had a total of $72 dollars when he finished the jobs, how much did he charge (x) to shovel snow?
C. Carter has $3. He earned $12 for 72 snow shoveling jobs. If x equals the cost of the snow shovel, how long did it take for Carter to make up the price of the snow shovel?
D. Carter had $12. He earned $72 for 3 snow shoveling jobs. If x equals the time it took to complete each job, how long did it take Carter to complete all three jobs?
E. Teacher 2. Pythagleo rented his neighbor’s old car for several days at a fee of $20 a day. He also paid $35 for
gasoline. All together he paid out $115. Write an equation that shows this situation. Use your equation to find the number of days Pythageo rented the car.
3. The mysterious person or persons who created mathematical problems for Chris and Carter to solve in
order to learn more about the disappearance of 500 Etna High student and staff created a number pattern for them. The number pattern was 2913, 969, 321 105, 33… Which rule describes how to find the next term in the pattern?
A. Divide the previous number by three and subtract 2. B. Multiply the previous number by three and add 2. C. Divide the previous number by three and add 2. D. Multiply the previous number by three and subtract 2. E. Teacher
4. Which expression is equivalent to 2x + 18?
A. 18 + x + 2 B. 18 + x C. 18 ÷ 2 + x D. 2(x + 9) E. Teacher 5. Carter visited the candy dispensers in the shopping mall to get candy for his little brothers. He spent a
roll of nickels valued at $2.00. Which equation represents how many nickels (n) Carter spent?
A. .05 × n = $2.00 C. .05 ÷ n = $2.00 B. .05 × $2.00 = n D. $2.00 × n = .05 E. Teacher
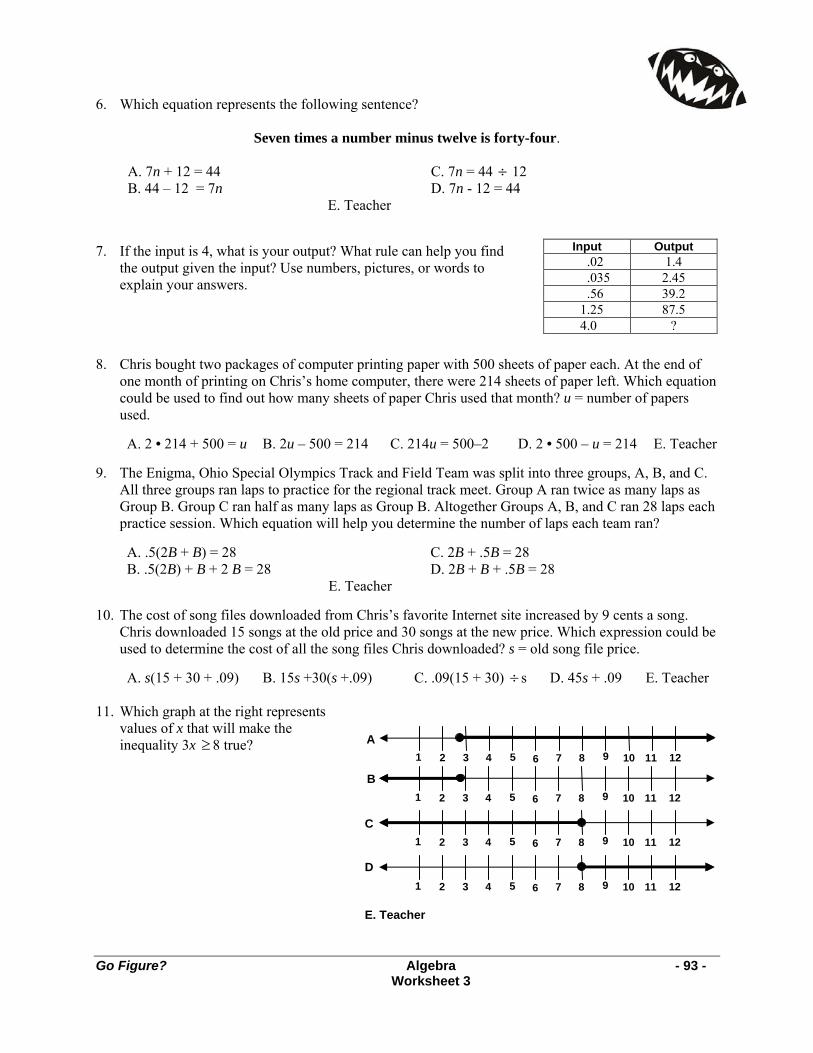
Go Figure? Algebra - 93 - Worksheet 3
1 2 3 4 5 6 7 8 9 10 11 12A
1 2 3 4 5 6 7 8 9 10 11 12C
E. Teacher
1 2 3 4 5 6 7 8 9 10 11 12
D
B 1 2 3 4 5 6 7 8 9 10 11 12
Input Output .02 1.4 .035 2.45 .56 39.2
1.25 87.5 4.0 ?
6. Which equation represents the following sentence?
Seven times a number minus twelve is forty-four.
A. 7n + 12 = 44 C. 7n = 44 ÷ 12 B. 44 – 12 = 7n D. 7n - 12 = 44 E. Teacher
7. If the input is 4, what is your output? What rule can help you find
the output given the input? Use numbers, pictures, or words to explain your answers.
8. Chris bought two packages of computer printing paper with 500 sheets of paper each. At the end of
one month of printing on Chris’s home computer, there were 214 sheets of paper left. Which equation could be used to find out how many sheets of paper Chris used that month? u = number of papers used.
A. 2 • 214 + 500 = u B. 2u – 500 = 214 C. 214u = 500–2 D. 2 • 500 – u = 214 E. Teacher
9. The Enigma, Ohio Special Olympics Track and Field Team was split into three groups, A, B, and C.
All three groups ran laps to practice for the regional track meet. Group A ran twice as many laps as Group B. Group C ran half as many laps as Group B. Altogether Groups A, B, and C ran 28 laps each practice session. Which equation will help you determine the number of laps each team ran?
A. .5(2B + B) = 28 C. 2B + .5B = 28 B. .5(2B) + B + 2 B = 28 D. 2B + B + .5B = 28 E. Teacher
10. The cost of song files downloaded from Chris’s favorite Internet site increased by 9 cents a song.
Chris downloaded 15 songs at the old price and 30 songs at the new price. Which expression could be used to determine the cost of all the song files Chris downloaded? s = old song file price.
A. s(15 + 30 + .09) B. 15s +30(s +.09) C. .09(15 + 30) ÷ s D. 45s + .09 E. Teacher
11. Which graph at the right represents
values of x that will make the inequality 3x ≥ 8 true?
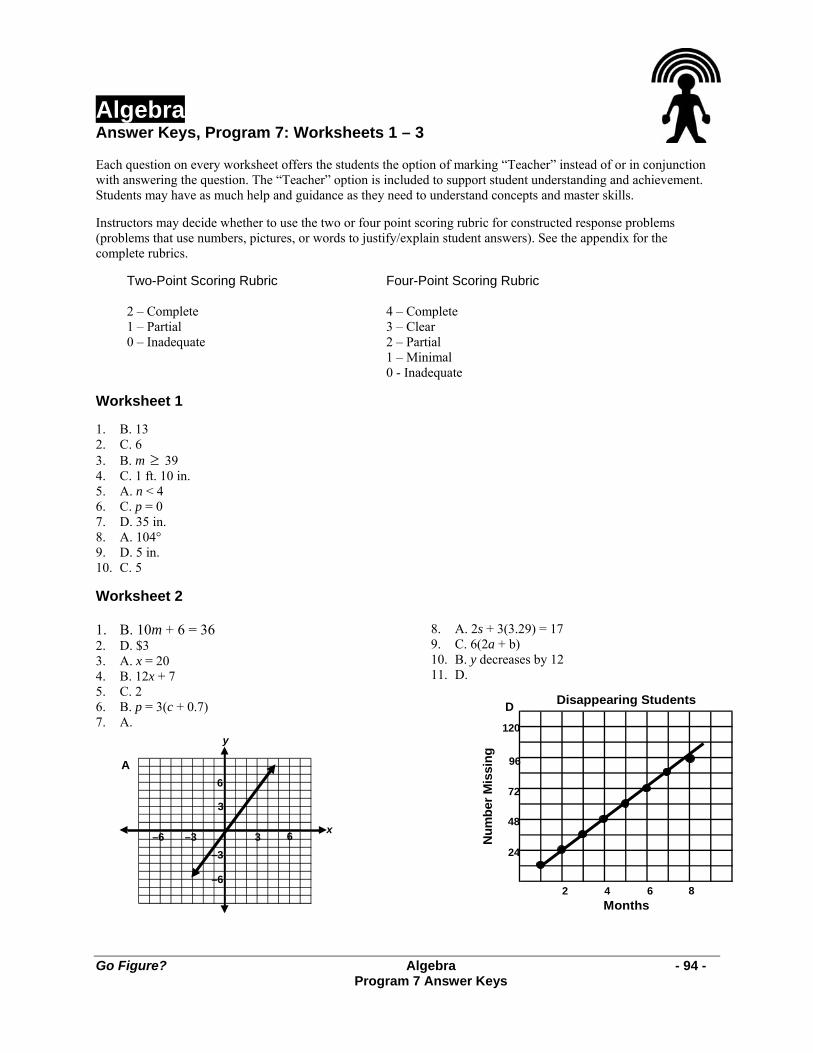
Go Figure? Algebra - 94 - Program 7 Answer Keys
Algebra Answer Keys, Program 7: Worksheets 1 – 3 Each question on every worksheet offers the students the option of marking “Teacher” instead of or in conjunction with answering the question. The “Teacher” option is included to support student understanding and achievement. Students may have as much help and guidance as they need to understand concepts and master skills. Instructors may decide whether to use the two or four point scoring rubric for constructed response problems (problems that use numbers, pictures, or words to justify/explain student answers). See the appendix for the complete rubrics.
Two-Point Scoring Rubric Four-Point Scoring Rubric 2 – Complete 1 – Partial 0 – Inadequate
4 – Complete 3 – Clear 2 – Partial 1 – Minimal 0 - Inadequate
Worksheet 1 1. B. 13 2. C. 6 3. B. m ≥ 39 4. C. 1 ft. 10 in. 5. A. n < 4 6. C. p = 0 7. D. 35 in. 8. A. 104° 9. D. 5 in. 10. C. 5 Worksheet 2 1. B. 10m + 6 = 36 2. D. $3 3. A. x = 20 4. B. 12x + 7 5. C. 2 6. B. p = 3(c + 0.7) 7. A.
6 3 –3
6
3
–3
–6
–6 x
y
A
8. A. 2s + 3(3.29) = 17 9. C. 6(2a + b) 10. B. y decreases by 12 11. D.
. Teacher
2 4 6
120
96
72
48
Disappearing Students
Months
Num
ber M
issi
ng
24
8
D
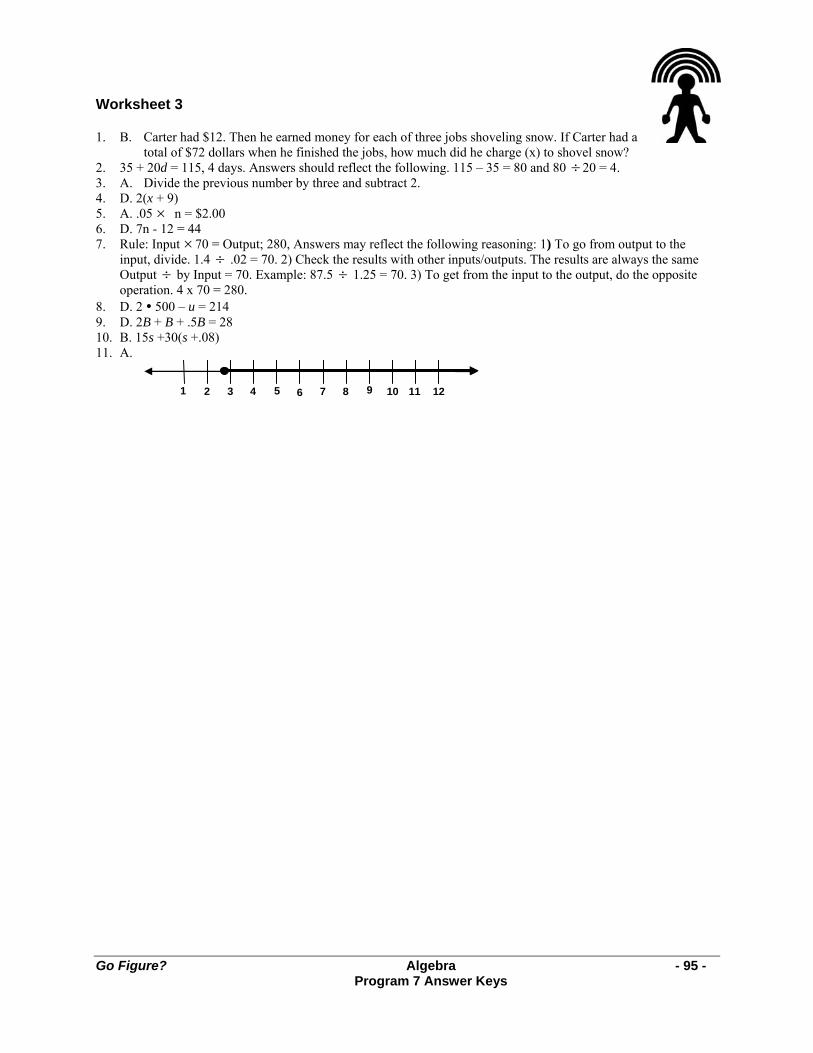
Go Figure? Algebra - 95 - Program 7 Answer Keys
Worksheet 3 1. B. Carter had $12. Then he earned money for each of three jobs shoveling snow. If Carter had a
total of $72 dollars when he finished the jobs, how much did he charge (x) to shovel snow? 2. 35 + 20d = 115, 4 days. Answers should reflect the following. 115 – 35 = 80 and 80 ÷ 20 = 4. 3. A. Divide the previous number by three and subtract 2. 4. D. 2(x + 9) 5. A. .05 × n = $2.00 6. D. 7n - 12 = 44 7. Rule: Input ×70 = Output; 280, Answers may reflect the following reasoning: 1) To go from output to the
input, divide. 1.4 ÷ .02 = 70. 2) Check the results with other inputs/outputs. The results are always the same Output ÷ by Input = 70. Example: 87.5 ÷ 1.25 = 70. 3) To get from the input to the output, do the opposite operation. 4 x 70 = 280.
8. D. 2 • 500 – u = 214 9. D. 2B + B + .5B = 28 10. B. 15s +30(s +.08) 11. A.
1 2 3 4 5 6 7 8 9 10 11 12

- 96 -
NOTES:
Go Figure? Ratios and Proportions - 97 - Program 8
Ratios and Proportions Program 8 Guide Each episode of Go Figure? can be used as an introduction or a “refresher” of basic mathematics concepts presented in a fun and creative way. It may be used in a classroom or an intervention setting. The accompanying CD-ROM edu-game was designed for use by students on an individual basis. The object of the edu-game is to solve a mystery. In order to do this, the student must solve mathematics problems in the specific content areas presented in the video series. Thus the digital video series is used to generate interest and enthusiasm in the presentation of mathematics concepts, and the CD-ROM allows students to practice using the concepts in a “video-game” format. The three main characters in each DVD video program – the mysterious Pythagleo, plus two students named Carter and Chris who are trying to solve the mystery of Etna High School – discuss the targeted math concepts. Chris, and to a lesser extent, Carter, verbalizes what each is thinking as they work through problems associated with the math concepts. The DVD programs assume that, like Chris and Carter, your students have already been introduced to the math concepts presented in the episode. The dialog may be too quick for some students. Every step that some of your students will need to solve similar problems on their own may not be mentioned in the programs. Therefore, pausing the DVD to review or present additional information will help adapt the learning situation to the needs of your students. See additional materials about teaching with videos and differentiated instruction in the Introduction of the Teacher Resources Guide. Ohio Mathematics Content Standards and Benchmarks Data Analysis and Probability Benchmark
I. Describe the probability of an event using ratios, including fractional notation. Measurment Benchmarks
A. Select appropriate units to measure angles, circumference, surface area, mass, and volume using: • U. S. Customary units; e.g., degrees, square feet, pounds, and other units as appropriate; • Metric units; e.g., square meters, kilograms and other units as appropriate. Math Content
• How to write ratios to compare two quantities • Write ratios as fractions • Proportions – two ratios are equal • Proportions can be used to enlarge something without distorting it.
Episode Notes
• Pythagleo plans a reunion party for the missing students complete with decorations. Pythagleo, Chris, and Carter plan the menu and the amount of food to order. Three foot-long subs can feed four people. The mysterious Emily attended the party.
• If your students have viewed all eight episodes, they are probably wondering why there is not a definitive conclusion to the story. Please encourage the use of the CD-ROM edu-game for each episode that they have viewed. This allows them to practice using the concepts that were presented in the video programs. (It also may give them the answers for which they are looking!!)
Go Figure? Ratios and Proportions - 98 - Program 8
• After Chris defines proportion, Pythagelo begins to share information about people offering to do something for others – “like the other night on Main Street.” Chris stops Pythagleo in mid sentence and tells him “No, That’s a proposition.”
Teacher Notes A ratio is a comparison of two numbers and can be written in many different ways. Here are three ways:
A. use the word “to” 1 to 3 B. use a colon: 1 : 3 C. use a fraction 1
3
A proportion is the equality of two ratios such as: 26=
13
If one of the terms of the proportion is unknown, then the proportion needs to be solved. (The value of the unknow term must be found by isolating the unknown or variable.) To solve the proportion, the opposite operation is performed on both sides of the equation. Example:
m2=
65
256
22 ×=×
m
256
22 ×=×
m
Isolate for m. • Since the division operation is given, the opposite operation is
multiplication. • Multiply by 2 since m is being divided by 2. Remember – Perform
the same operation on each side of the equation.
1526
212
××
=××m
or 5
122
2=
m
m = 2.4
Solve the problem.
22m
= m and 5
12 = 2.4
Go Figure? Ratios and Proportions - 99 - Program 8
Cross -Multiply Method Be sure your students understand why this method works.
The Cross-Multiply Method
m2=
65
Understanding the Cross-Multiply Method
m2=
65
Multiply the opposing numerators and denominators
5 × m = 2 × 6
5m = 12
Multiply each term by a faction equal to one – based on the denominator of the opposite term – so that the terms have common denominators.
22
56
55
2×=×
m
105
525 mm=
×× and
1012
2526=
×× or
1012
105
=m
Isolate for the variable m.
110
1012
105
110
×=×m
or 10
12010
50=
m
• Since the division operation is given, the opposite operation is multiplication.
• Multiply by 10 since m is being divided by 10.
• Remember – Perform the same operation on each side of the equation.
Reduce the fractions to lowest terms.
15
1010
1050 mm
=÷ and 1
121010
10120
=÷ or 1
121
5=
m
112
15
=m = 5m = 12
Once students understand the process, they can see that the same answer results when you multiply the numerator of each of a pair of fractions by the denominator of the other.
5m = 12 Solve for the variable m.
512
55
=m Since m is multiplied by 5, divide by 5 on both sides of the equation.
5m ÷ 5= m and 12 ÷ 5 = 2.4
m = 2.4

Go Figure? Ratios and Proportions - 100 - Worksheet 1
Ratios and Proportions Worksheet 1 Choice E, in multiple-choice questions, is always: I request help from the teacher. You may mark E in addition to one other choice if you think that you have the right answer to the question but you do not feel that you have a complete understanding of the problem. Your teacher will decide whether to use the two-point or four-point scoring rubric for problems that use numbers, pictures, or words to justify/explain your answer(s). You may request help for these questions, too. Write the word “teacher” by your answer(s). 1. Chris is helping plan a party for her sister, Jillian. Jillian invited 35 friends. Chris wants to make old
fashioned strawberry shortcake. Her grandmother’s recipe for the shortcake biscuits will make enough for 12 biscuits. Since Jillian’s friends like to eat, Chris wants enough so that Jillian and each of her friends get two biscuits. How many recipes should she make so she has enough biscuits?
A. 2 1
2 B. 4 C. 6 D. 3 E. Teacher
2. For the strawberry shortcake in exercise #1, Chris needs 1
2 pint of strawberries for each person. How
many strawberries should she buy?
A. 18 quarts B. 9 quarts C. 12 pints D. 6 pints E. Teacher 3. Jillian wants to string popcorn as a decoration for her party. She estimates that it will take 15 popped
kernels for every 9 inches of string. She needs 100 feet of stringed popcorn. How many popped kernels does she need?
A. 20 B. 200 C. 2,000 D. 20,000 E. Teacher
4. Jillian decided to string glass beads instead of popcorn. She can use 7 very large beads for every 9
inches of string. She now wants 240 feet of stringed beads. If the beads cost 13 cents per bead, how much money would it cost buy enough beads to string 240 feet of them?
A. $31.20 B. $163.80 C. $216.00 D. $291.20 E. Teacher
5. Manny is bringing his favorite cherry flavored Kool-Aid for the 36 people at Jillian’s party. He
figures that each person will drink two 8-oz. glasses of Kool-Aid. One packet of Kool-Aid will make eight 8-oz. glasses. How many packets should he buy?
A. 18 B. 9 C. 4 D. 2 E. Teacher
6. How much water would Manny need if he decided to use six packets of Kool-Aid and each packet
needed 4 cups?
A. 6 quarts B. 6 pints C. 6 cups D. 20 cups E. Teacher

Go Figure? Ratios and Proportions - 101 - Worksheet 1
7. How much sugar would Manny need if he used 6 packets of Kool-Aid and each packet needed 1 1
2 cups of sugar?
A. 6 cups B. 8 cups C. 9 cups D. 4 cups E. Teacher
8. Carter has 230 CDs. He saw a CD holder at the store that he really liked. This holder was made for 21
CDs. How many holders does Carter need so all of his CDs will fit?
A. 8 B. 9 C. 10 D. 11 E. Teacher 9. Chris’s parents will open a new restaurant called The Red Hot Chili Peppers. The restaurant will have
circular tables that seat six people each. How many tables should they purchase if they want seating for 150 patrons at one time (assuming there is sufficient room)?
A. 25 B. 30 C. 40 D. 50 E. Teacher
10. Chris’s parents bought a used coffee maker for their restaurant. The coffee maker needs 2 pre-
measured packets of gound coffee beans for 10 cups of perked coffee. If Chris is supposed to make 35 cups of coffee, how many packets does she need?
A. 5 B. 4 C. 7 D. 10 E. Teacher
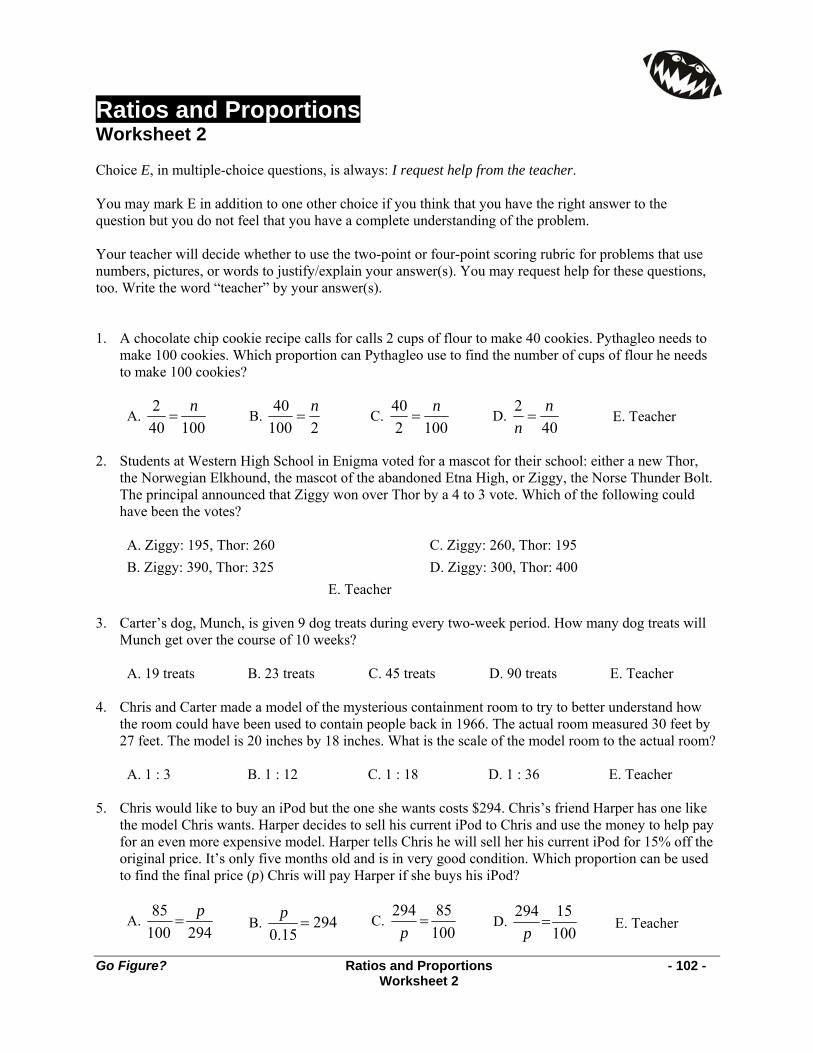
Go Figure? Ratios and Proportions - 102 - Worksheet 2
Ratios and Proportions Worksheet 2 Choice E, in multiple-choice questions, is always: I request help from the teacher. You may mark E in addition to one other choice if you think that you have the right answer to the question but you do not feel that you have a complete understanding of the problem. Your teacher will decide whether to use the two-point or four-point scoring rubric for problems that use numbers, pictures, or words to justify/explain your answer(s). You may request help for these questions, too. Write the word “teacher” by your answer(s). 1. A chocolate chip cookie recipe calls for calls 2 cups of flour to make 40 cookies. Pythagleo needs to
make 100 cookies. Which proportion can Pythagleo use to find the number of cups of flour he needs to make 100 cookies?
A. 240
=n
100 B.
40100
=n2
C. 402=
n100
D. 2n=
n40
E. Teacher
2. Students at Western High School in Enigma voted for a mascot for their school: either a new Thor,
the Norwegian Elkhound, the mascot of the abandoned Etna High, or Ziggy, the Norse Thunder Bolt. The principal announced that Ziggy won over Thor by a 4 to 3 vote. Which of the following could have been the votes?
A. Ziggy: 195, Thor: 260 C. Ziggy: 260, Thor: 195 B. Ziggy: 390, Thor: 325 D. Ziggy: 300, Thor: 400 E. Teacher
3. Carter’s dog, Munch, is given 9 dog treats during every two-week period. How many dog treats will
Munch get over the course of 10 weeks?
A. 19 treats B. 23 treats C. 45 treats D. 90 treats E. Teacher 4. Chris and Carter made a model of the mysterious containment room to try to better understand how
the room could have been used to contain people back in 1966. The actual room measured 30 feet by 27 feet. The model is 20 inches by 18 inches. What is the scale of the model room to the actual room?
A. 1 : 3 B. 1 : 12 C. 1 : 18 D. 1 : 36 E. Teacher
5. Chris would like to buy an iPod but the one she wants costs $294. Chris’s friend Harper has one like
the model Chris wants. Harper decides to sell his current iPod to Chris and use the money to help pay for an even more expensive model. Harper tells Chris he will sell her his current iPod for 15% off the original price. It’s only five months old and is in very good condition. Which proportion can be used to find the final price (p) Chris will pay Harper if she buys his iPod?
A. 294100
85 p= B. 294
15.0=
p C.
10085294
=p
D. 10015294
=p
E. Teacher
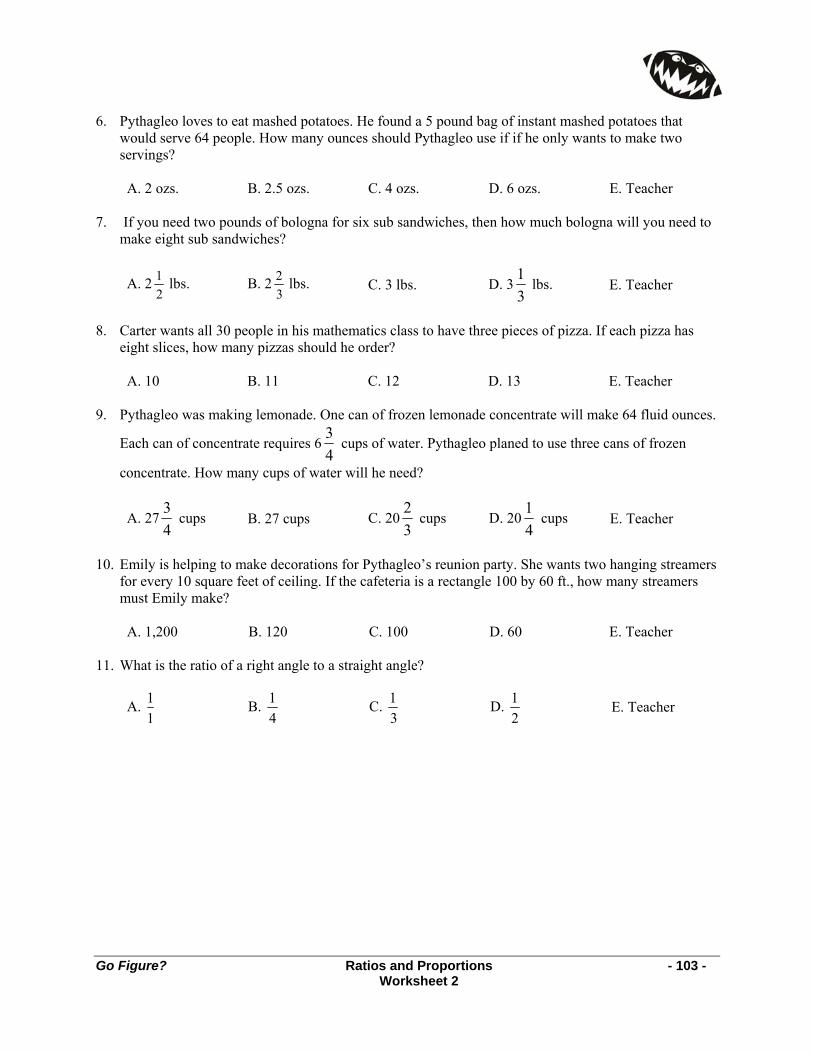
Go Figure? Ratios and Proportions - 103 - Worksheet 2
6. Pythagleo loves to eat mashed potatoes. He found a 5 pound bag of instant mashed potatoes that
would serve 64 people. How many ounces should Pythagleo use if if he only wants to make two servings?
A. 2 ozs. B. 2.5 ozs. C. 4 ozs. D. 6 ozs. E. Teacher
7. If you need two pounds of bologna for six sub sandwiches, then how much bologna will you need to
make eight sub sandwiches?
A. 2 12
lbs. B. 2 23
lbs. C. 3 lbs. D. 331
lbs. E. Teacher
8. Carter wants all 30 people in his mathematics class to have three pieces of pizza. If each pizza has
eight slices, how many pizzas should he order?
A. 10 B. 11 C. 12 D. 13 E. Teacher 9. Pythagleo was making lemonade. One can of frozen lemonade concentrate will make 64 fluid ounces.
Each can of concentrate requires 643
cups of water. Pythagleo planed to use three cans of frozen
concentrate. How many cups of water will he need?
A. 2743
cups B. 27 cups C. 2032
cups D. 2041
cups E. Teacher
10. Emily is helping to make decorations for Pythagleo’s reunion party. She wants two hanging streamers
for every 10 square feet of ceiling. If the cafeteria is a rectangle 100 by 60 ft., how many streamers must Emily make?
A. 1,200 B. 120 C. 100 D. 60 E. Teacher
11. What is the ratio of a right angle to a straight angle?
A. 11
B. 14
C. 13
D. 12
E. Teacher
Go Figure? Ratios and Proportions - 104 - Program 8 Answer Keys
Ratios and Proportion Answer Keys, Program 8: Worksheets 1 – 2 Each question on every worksheet offers the students the option of marking “Teacher” instead of or in conjunction with answering the question. The “Teacher” option is included to support student understanding and achievement. Students may have as much help and guidance as they need to understand concepts and master skills. Instructors may decide whether to use the two or four point scoring rubric for constructed response problems (problems that use numbers, pictures, or words to justify/explain student answers). See the appendix for the complete rubrics.
Two-Point Scoring Rubric Four-Point Scoring Rubric 2 – Complete 1 – Partial 0 – Inadequate
4 – Complete 3 – Clear 2 – Partial 1 – Minimal 0 - Inadequate
Worksheet 1 1. C. 6 2. B. 9 quarts 3. C. 2,000 4. D. $291.20 5. B. 9 6. A. 6 quarts 7. C. 9 cups 8. D. 11 9. A. 25 10. C. 7 Worksheet 2 1. A.
100402 n=
2. C. Ziggy: 260, Thor: 195 3. C. 45 treats 4. C. 1:18 5. A.
29410085 p
=
6. B. 2.5 ozs.
7. B. 2 23
lbs.
8. C. 12 9. D. 20
41 cups
10. A. 1,200 11. D.
21
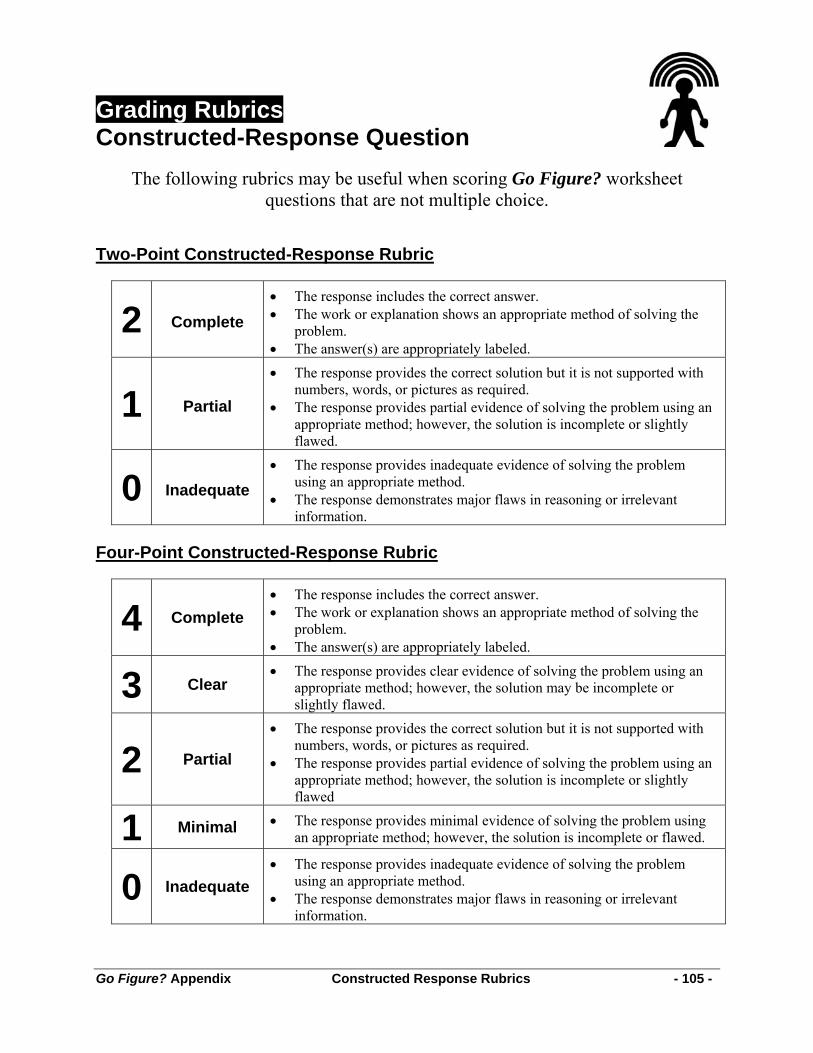
Go Figure? Appendix Constructed Response Rubrics - 105 -
Grading Rubrics Constructed-Response Question
The following rubrics may be useful when scoring Go Figure? worksheet questions that are not multiple choice.
Two-Point Constructed-Response Rubric
2 Complete • The response includes the correct answer. • The work or explanation shows an appropriate method of solving the
problem. • The answer(s) are appropriately labeled.
1 Partial
• The response provides the correct solution but it is not supported with numbers, words, or pictures as required.
• The response provides partial evidence of solving the problem using an appropriate method; however, the solution is incomplete or slightly flawed.
0 Inadequate • The response provides inadequate evidence of solving the problem
using an appropriate method. • The response demonstrates major flaws in reasoning or irrelevant
information. Four-Point Constructed-Response Rubric
4 Complete • The response includes the correct answer. • The work or explanation shows an appropriate method of solving the
problem. • The answer(s) are appropriately labeled.
3 Clear • The response provides clear evidence of solving the problem using an
appropriate method; however, the solution may be incomplete or slightly flawed.
2 Partial
• The response provides the correct solution but it is not supported with numbers, words, or pictures as required.
• The response provides partial evidence of solving the problem using an appropriate method; however, the solution is incomplete or slightly flawed
1 Minimal • The response provides minimal evidence of solving the problem using an appropriate method; however, the solution is incomplete or flawed.
0 Inadequate • The response provides inadequate evidence of solving the problem
using an appropriate method. • The response demonstrates major flaws in reasoning or irrelevant
information.

Go Figure? Appendix Ohio Mathematical Processes Benchmarks - 106 -
Ohio Mathematical Processes Benchmarks Grade 5-7
A. Clarify problem-solving situation and identify potential solution processes; e.g., consider different strategies and approaches to a problem, restate problem from various perspectives.
B. Apply and adapt problem-solving strategies to solve a variety of problems, including
unfamiliar and non-routine problem situations.
C. Use more than one strategy to solve a problem, and recognize there are advantages associated with various methods.
D. Recognize whether an estimate or an exact solution is appropriate for a given problem
situation.
E. Use deductive thinking to construct informal arguments to support reasoning and to justify solutions to problems.
F. Use inductive thinking to generalize a pattern of observations for particular cases, make
conjectures, and provide supporting arguments for conjectures.
G. Relate mathematical ideas to one another and to other content areas; e.g., use area models for adding fractions, interpret graphs in reading, science and social studies.
H. Use representations to organize and communicate mathematical thinking and problem
solutions.
I. Select, apply, and translate among mathematical representations to solve problems; e.g., representing a number as a fraction, decimal or percent as appropriate for a problem.
J. Communicate mathematical thinking to others and analyze the mathematical thinking and
strategies of others.
K. Recognize and use mathematical language and symbols when reading, writing and conversing with others.
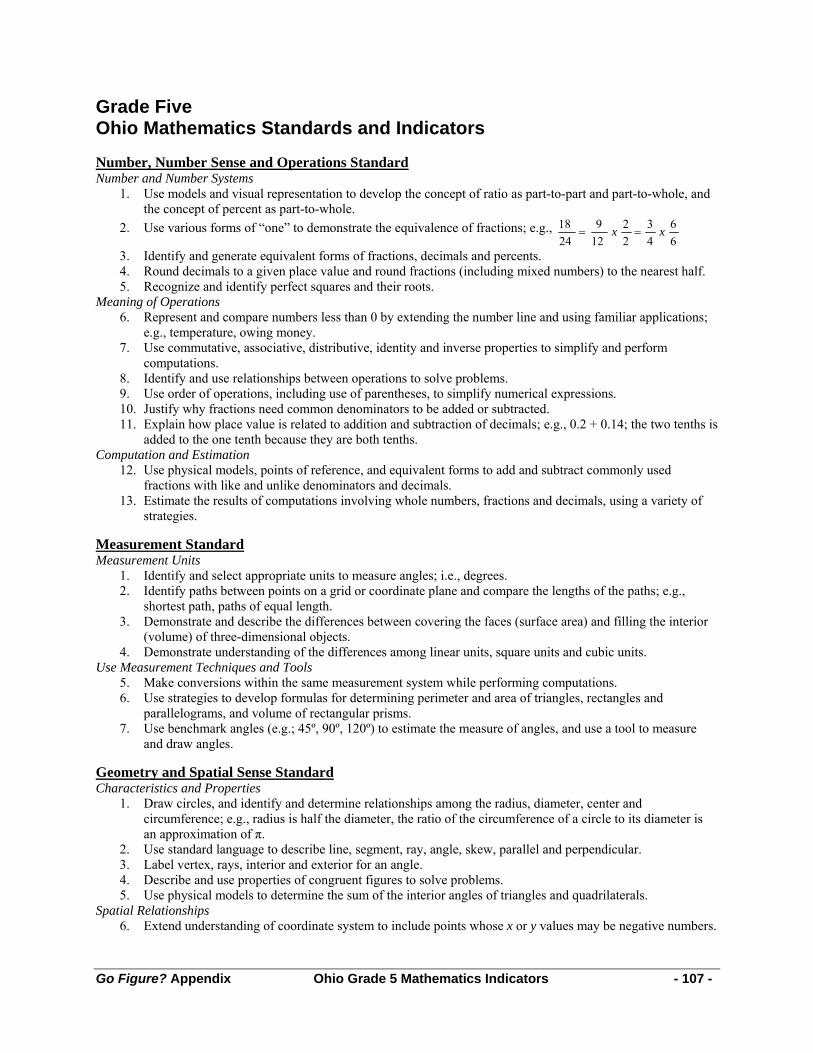
Go Figure? Appendix Ohio Grade 5 Mathematics Indicators - 107 -
Grade Five Ohio Mathematics Standards and Indicators Number, Number Sense and Operations Standard Number and Number Systems
1. Use models and visual representation to develop the concept of ratio as part-to-part and part-to-whole, and the concept of percent as part-to-whole.
2. Use various forms of “one” to demonstrate the equivalence of fractions; e.g., 66
43
22
129
2418 xx ==
3. Identify and generate equivalent forms of fractions, decimals and percents. 4. Round decimals to a given place value and round fractions (including mixed numbers) to the nearest half. 5. Recognize and identify perfect squares and their roots.
Meaning of Operations 6. Represent and compare numbers less than 0 by extending the number line and using familiar applications;
e.g., temperature, owing money. 7. Use commutative, associative, distributive, identity and inverse properties to simplify and perform
computations. 8. Identify and use relationships between operations to solve problems. 9. Use order of operations, including use of parentheses, to simplify numerical expressions. 10. Justify why fractions need common denominators to be added or subtracted. 11. Explain how place value is related to addition and subtraction of decimals; e.g., 0.2 + 0.14; the two tenths is
added to the one tenth because they are both tenths. Computation and Estimation
12. Use physical models, points of reference, and equivalent forms to add and subtract commonly used fractions with like and unlike denominators and decimals.
13. Estimate the results of computations involving whole numbers, fractions and decimals, using a variety of strategies.
Measurement Standard Measurement Units
1. Identify and select appropriate units to measure angles; i.e., degrees. 2. Identify paths between points on a grid or coordinate plane and compare the lengths of the paths; e.g.,
shortest path, paths of equal length. 3. Demonstrate and describe the differences between covering the faces (surface area) and filling the interior
(volume) of three-dimensional objects. 4. Demonstrate understanding of the differences among linear units, square units and cubic units.
Use Measurement Techniques and Tools 5. Make conversions within the same measurement system while performing computations. 6. Use strategies to develop formulas for determining perimeter and area of triangles, rectangles and
parallelograms, and volume of rectangular prisms. 7. Use benchmark angles (e.g.; 45º, 90º, 120º) to estimate the measure of angles, and use a tool to measure
and draw angles. Geometry and Spatial Sense Standard Characteristics and Properties
1. Draw circles, and identify and determine relationships among the radius, diameter, center and circumference; e.g., radius is half the diameter, the ratio of the circumference of a circle to its diameter is an approximation of π.
2. Use standard language to describe line, segment, ray, angle, skew, parallel and perpendicular. 3. Label vertex, rays, interior and exterior for an angle. 4. Describe and use properties of congruent figures to solve problems. 5. Use physical models to determine the sum of the interior angles of triangles and quadrilaterals.
Spatial Relationships 6. Extend understanding of coordinate system to include points whose x or y values may be negative numbers.

Go Figure? Appendix Ohio Grade 5 Mathematics Indicators - 108 -
Transformations and Symmetry 7. Understand that the measure of an angle is determined by the degree of rotation of an angle side rather than
the length of either side. 8. Predict what three-dimensional object will result from folding a two-dimensional net, then confirm the
prediction by folding the net. Patterns, Functions and Algebra Standard Use Patterns, Relations and Functions
1. Justify a general rule for a pattern or a function by using physical materials, visual representations, words, tables or graphs.
2. Use calculators or computers to develop patterns, and generalize them using tables and graphs. Use Algebraic Representations
3. Use variables as unknown quantities in general rules when describing patterns and other relationships. 4. Create and interpret the meaning of equations and inequalities representing problem situations. 5. Model problems with physical materials and visual representations, and use models, graphs and tables to
draw conclusions and make predictions. Analyze Change
6. Describe how the quantitative change in a variable affects the value of a related variable; e.g., describe how the rate of growth varies over time, based upon data in a table or graph.
Data Analysis and Probability Standard Data Collection
1. Read, construct and interpret frequency tables, circle graphs and line graphs. 2. Select and use a graph that is appropriate for the type of data to be displayed; e.g., numerical vs. categorical
data, discrete vs. continuous data. 3. Read and interpret increasingly complex displays of data, such as double bar graphs. 4. Determine appropriate data to be collected to answer questions posed by students or teacher, collect and
display data, and clearly communicate findings. Statistical Methods
5. Modify initial conclusions, propose and justify new interpretations and predictions as additional data are collected.
6. Determine and use the range, mean, median and mode, and explain what each does and does not indicate about the set of data.
Probability 7. List and explain all possible outcomes in a given situation. 8. Identify the probability of events within a simple experiment, such as three chances out of eight. 9. Use 0, 1 and ratios between 0 and 1 to represent the probability of outcomes for an event, and associate the
ratio with the likelihood of the outcome. 10. Compare what should happen (theoretical/expected results) with what did happen (experimental/actual
results) in a simple experiment. 11. Make predictions based on experimental and theoretical probabilities.

Go Figure? Appendix Ohio Grade 6 Mathematics Indicators - 109 -
Grade Six Ohio Mathematics Standards and Indicators
Number, Number Sense and Operations Standard Number and Number Systems
1. Decompose and recompose whole numbers using factors and exponents (e.g., 32 = 2 x 2 x 2 x 2 x 2 = 25), and explain why “squared” means “second power” and “cubed” means “third power.”
2. Find and use the prime factorization of composite numbers. For example: a. Use the prime factorization to recognize the greatest common factor (GCF). b. Use the prime factorization to recognize the least common multiple (LCM). c. Apply the prime factorization to solve problems and explain solutions.
3. Explain why a number is referred to as being “rational,” and recognize that the expression C can mean a parts of size b
1 each, a divided by b, or the ratio of a to b. 4. Describe what it means to find a specific percent of a number, using real-life examples. 5. Use models and pictures to relate concepts of ratio, proportion and percent, including percents less than 1
and greater than 100. Meaning of Operations
6. Use the order of operations, including the use of exponents, decimals and rational numbers, to simplify numerical expressions.
7. Use simple expressions involving integers to represent and solve problems; e.g., if a running back loses 15 yards on the first carry but gains 8 yards on the second carry, what is the net gain/loss?
8. Represent multiplication and division situations involving fractions and decimals with models and visual representations; e.g., show with pattern blocks what it means to take 2 3
2 ÷ 61 .
9. Give examples of how ratios are used to represent comparisons; e.g., part-to-part, part-to-whole, whole-to-part.
10. Recognize that a quotient may be larger than the dividend when the divisor is a fraction; e.g., 6÷ 21 =
12. Computation and Estimation
11. Perform fraction and decimal computations and justify their solutions; e.g., using manipulatives, diagrams, mathematical reasoning.
12. Develop and analyze algorithms for computing with fractions and decimals, and demonstrate fluency in their use.
13. Estimate reasonable solutions to problem situations involving fractions and decimals; e.g., 87 + 13
12 ≈ 2 and 4.23 x 5.8 25.
14. Use proportional reasoning, ratios and percents to represent problem situations and determine the reasonableness of solutions.
15. Determine the percent of a number and solve related problems; e.g., find the percent markdown if the original price was $140, and the sale price is $100.
Measurement Standard Measurement Units
1. Understand and describe the difference between surface area and volume. Use Measurement Techniques and Tools
2. Use strategies to develop formulas for finding circumference and area of circles, and to determine the area of sectors; e.g., 2
1 circle, 32 circle, 3
1 circle, 41 circle.
3. Estimate perimeter or circumference and area for circles, triangles and quadrilaterals, and surface area and volume for prisms and cylinders by: a. estimating lengths using string or links, areas using tiles or grid, and volumes using cubes; b. measuring attributes (diameter, side lengths, or heights) and using established formulas for circles,
triangles, rectangles, parallelograms and rectangular prisms. 4. Determine which measure (perimeter, area, surface area, volume) matches the context for a problem
situation; e.g., perimeter is the context for fencing a garden, surface area is the context for painting a room.
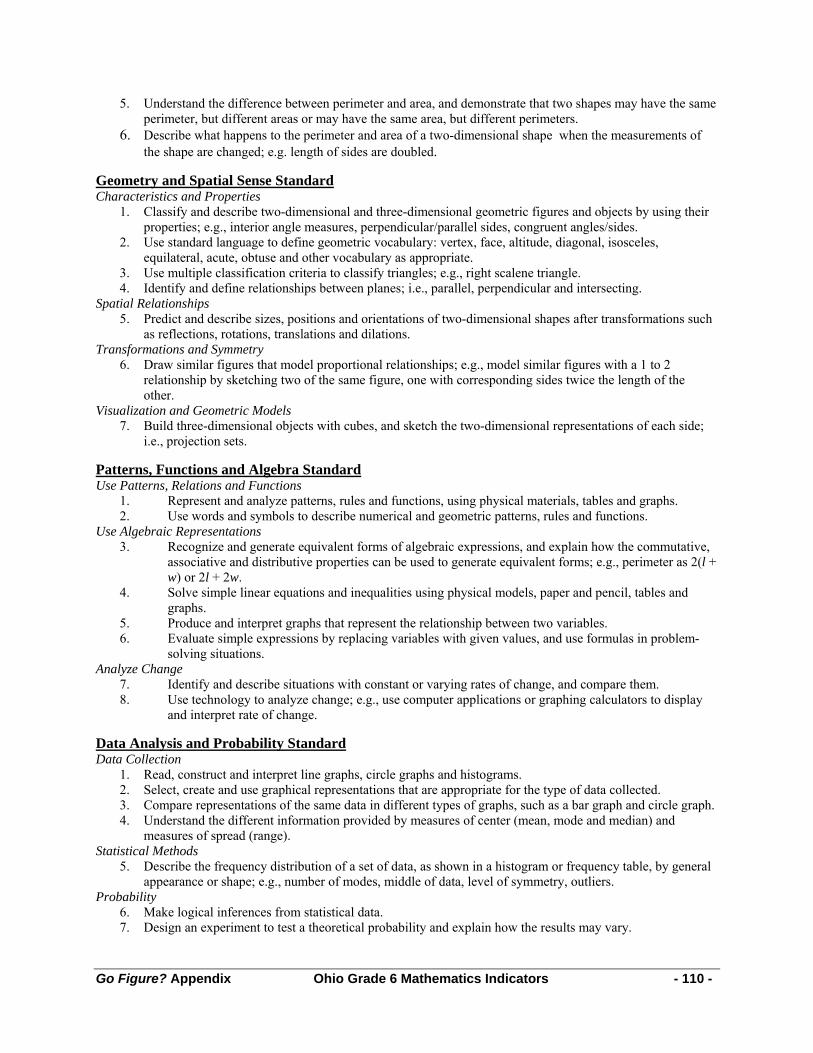
Go Figure? Appendix Ohio Grade 6 Mathematics Indicators - 110 -
5. Understand the difference between perimeter and area, and demonstrate that two shapes may have the same perimeter, but different areas or may have the same area, but different perimeters.
6. Describe what happens to the perimeter and area of a two-dimensional shape when the measurements of the shape are changed; e.g. length of sides are doubled.
Geometry and Spatial Sense Standard Characteristics and Properties
1. Classify and describe two-dimensional and three-dimensional geometric figures and objects by using their properties; e.g., interior angle measures, perpendicular/parallel sides, congruent angles/sides.
2. Use standard language to define geometric vocabulary: vertex, face, altitude, diagonal, isosceles, equilateral, acute, obtuse and other vocabulary as appropriate.
3. Use multiple classification criteria to classify triangles; e.g., right scalene triangle. 4. Identify and define relationships between planes; i.e., parallel, perpendicular and intersecting.
Spatial Relationships 5. Predict and describe sizes, positions and orientations of two-dimensional shapes after transformations such
as reflections, rotations, translations and dilations. Transformations and Symmetry
6. Draw similar figures that model proportional relationships; e.g., model similar figures with a 1 to 2 relationship by sketching two of the same figure, one with corresponding sides twice the length of the other.
Visualization and Geometric Models 7. Build three-dimensional objects with cubes, and sketch the two-dimensional representations of each side;
i.e., projection sets. Patterns, Functions and Algebra Standard Use Patterns, Relations and Functions
1. Represent and analyze patterns, rules and functions, using physical materials, tables and graphs. 2. Use words and symbols to describe numerical and geometric patterns, rules and functions.
Use Algebraic Representations 3. Recognize and generate equivalent forms of algebraic expressions, and explain how the commutative,
associative and distributive properties can be used to generate equivalent forms; e.g., perimeter as 2(l + w) or 2l + 2w.
4. Solve simple linear equations and inequalities using physical models, paper and pencil, tables and graphs.
5. Produce and interpret graphs that represent the relationship between two variables. 6. Evaluate simple expressions by replacing variables with given values, and use formulas in problem-
solving situations. Analyze Change
7. Identify and describe situations with constant or varying rates of change, and compare them. 8. Use technology to analyze change; e.g., use computer applications or graphing calculators to display
and interpret rate of change. Data Analysis and Probability Standard Data Collection
1. Read, construct and interpret line graphs, circle graphs and histograms. 2. Select, create and use graphical representations that are appropriate for the type of data collected. 3. Compare representations of the same data in different types of graphs, such as a bar graph and circle graph. 4. Understand the different information provided by measures of center (mean, mode and median) and
measures of spread (range). Statistical Methods
5. Describe the frequency distribution of a set of data, as shown in a histogram or frequency table, by general appearance or shape; e.g., number of modes, middle of data, level of symmetry, outliers.
Probability 6. Make logical inferences from statistical data. 7. Design an experiment to test a theoretical probability and explain how the results may vary.

Go Figure? Appendix Ohio Grade 7 Mathematics Indicators - 111 -
Grade Seven Ohio Mathematics Standards and Indicators
Number, Number Sense and Operations Standard Number and Number Systems
1. Demonstrate an understanding of place value using powers of 10 and write large numbers in scientific notation.
2. Explain the meaning of exponents that are negative or 0. 3. Describe differences between rational and irrational numbers; e.g., use technology to show that some
numbers (rational) can be expressed as terminating or repeating decimals and others (irrational) as non-terminating and non-repeating decimals.
Meaning of Operations 4. Use order of operations and properties to simplify numerical expressions involving integers, fractions and
decimals. 5. Explain the meaning and effect of adding, subtracting, multiplying and dividing integers; e.g., how adding
two integers can result in a lesser value. Computation and Estimation
6. Simplify numerical expressions involving integers and use integers to solve real-life problems. 7. Solve problems using the appropriate form of a rational number (fraction, decimal or percent). 8. Develop and analyze algorithms for computing with percents and integers, and demonstrate fluency in their
use. 9. Represent and solve problem situations that can be modeled by and solved using concepts of absolute
value, exponents and square roots (for perfect squares). Measurement Standard Measurement Units
1. Select appropriate units for measuring derived measurements; e.g., miles per hour, revolutions per minute. 2. Convert units of area and volume within the same measurement system using proportional reasoning and a
reference table when appropriate; e.g., square feet to square yards, cubic meters to cubic centimeters. Use Measurement Techniques and Tools
3. Estimate a measurement to a greater degree of precision than the tool provides. 4. Solve problems involving proportional relationships and scale factors; e.g., scale models that require unit
conversions within the same measurement system. 5. Analyze problem situations involving measurement concepts, select appropriate strategies, and use an
organized approach to solve narrative and increasingly complex problems. 6. Use strategies to develop formulas for finding area of trapezoids and volume of cylinders and prisms. 7. Develop strategies to find the area of composite shapes using the areas of triangles, parallelograms, circles
and sectors. 8. Understand the difference between surface area and volume and demonstrate that two objects may have the
same surface area, but different volumes or may have the same volume, but different surface areas. 9. Describe what happens to the surface area and volume of a three- dimensional object when the
measurements of the object are changed; e.g., length of sides are doubled. Geometry and Spatial Sense Standard Characteristics and Properties
1. Use proportional reasoning to describe and express relationships between parts and attributes of similar and congruent figures.
2. Determine sufficient (not necessarily minimal) properties that define a specific two-dimensional figure or three-dimensional object. For example: a. Determine when one set of figures is a subset of another; e.g., all squares are rectangles. b. Develop a set of properties that eliminates all but the desired figure; e.g., only squares are quadrilaterals
with all sides congruent and all angles congruent. 3. Use and demonstrate understanding of the properties of triangles. For example:
a. Use Pythagorean Theorem to solve problems involving right triangles. b. Use triangle angle sum relationships to solve problems.
Go Figure? Appendix Ohio Grade 7 Mathematics Indicators - 112 -
4. Determine necessary conditions for congruence of triangles. 5. Apply properties of congruent or similar triangles to solve problems involving missing lengths and angle
measures. Spatial Relationships
6. Determine and use scale factors for similar figures to solve problems using proportional reasoning. Transformations and Symmetry
7. Identify the line and rotation symmetries of two-dimensional figures to solve problems. 8. Perform translations, reflections, rotations and dilations of two-dimensional figures using a variety of
methods (paper folding, tracing, graph paper). Visualization and Geometric Models
9. Draw representations of three-dimensional geometric objects from different views. Patterns, Functions and Algebra Standard Use Patterns, Relations and Functions
1. Represent and analyze patterns, rules and functions with words, tables, graphs and simple variable expressions.
2. Generalize patterns by describing in words how to find the next term. 3. Recognize and explain when numerical patterns are linear or nonlinear progressions; e.g., 1, 3, 5, 7... is
linear and 1, 3, 4, 8, 16... is nonlinear. Use Algebraic Representations
4. Create visual representations of equation-solving processes that model the use of inverse operations. 5. Represent linear equations by plotting points in the coordinate plane. 6. Represent inequalities on a number line or a coordinate plane. 7. Justify that two forms of an algebraic expression are equivalent, and recognize when an expression is
simplified; e.g., 4m = m + m + m + m or a · 5 + 4 = 5a + 4. 8. Use formulas in problem-solving situations. 9. Recognize a variety of uses for variables; e.g., placeholder for an unknown quantity in an equation,
generalization for a pattern, formula. Analyze Change
10. Analyze linear and simple nonlinear relationships to explain how a change in one variable results in the change of another.
11. Use graphing calculators or computers to analyze change; e.g., distance-time relationships. Data Analysis and Probability Standard Data Collection
1. Read, create and interpret box-and-whisker plots, stem-and-leaf plots, and other types of graphs, when appropriate.
2. Analyze how decisions about graphing affect the graphical representation; e.g., scale, size of classes in a histogram, number of categories in a circle graph.
Statistical Methods 3. Analyze a set of data by using and comparing combinations of measures of center (mean, mode, median)
and measures of spread (range, quartile, interquartile range), and describe how the inclusion or exclusion of outliers affects those measures.
4. Construct opposing arguments based on analysis of the same data, using different graphical representations. 5. Compare data from two or more samples to determine how sample selection can influence results. 6. Identify misuses of statistical data in articles, advertisements, and other media.
Probability 7. Compute probabilities of compound events; e.g., multiple coin tosses or multiple rolls of number cubes,
using such methods as organized lists, tree diagrams and area models. 8. Make predictions based on theoretical probabilities, design and conduct an experiment to test the
predictions, compare actual results to predicted results, and explain differences.