GM FINANCIAL DE MEXICO, S.A. DE C.V. - gmfsecure.com Financieros a diciembre de... · capital...
91
GM FINANCIAL DE MEXICO, S.A. DE C.V. SOCIEDAD FINANCIERA DE OBJETO MULTIPLE, E.R. Avenida Eugenio Garza Lagüera 933 Valle Oriente, San Pedro Garza García N.L. 66269 BALANCE GENERAL AL 31 DE DICIEMBRE DE 2016 Y 2015 (Cifras en pesos) 2016 2015 2016 2015 DISPONIBILIDADES 1,908,163,853 $ 1,488,176,556 $ PASIVOS BURSATILES 1,186,142,500 $ 1,403,429,319 $ CUENTAS DE MARGEN PRESTAMOS BANCARIOS Y DE OTROS ORGANISMOS De corto plazo 23,894,104,397 14,988,253,513 INVERSIONES EN VALORES De largo plazo 14,848,777,636 9,638,604,815 Títulos para negociar - - 38,742,882,032 24,626,858,328 Títulos disponibles para la venta - - Títulos conservados a vencimiento - - COLATERALES VENDIDOS Reportos (Saldo acreedor) - - DEUDORES POR REPORTO (SALDO DEUDOR) 2,405,629,552 1,541,614,669 Derivados - - Otros colaterales vendidos - - DERIVADOS Con fines de negociación 331,896,558 9,839,172 DERIVADOS Con fines de cobertura - - Con fines de negociación - 4,469,539 Con fines de cobertura - - AJUSTE DE VALUACION POR COBERTURA DE ACTIVOS FINANCIEROS AJUSTES DE VALUACION POR COBERTURA DE - - PASIVOS FINANCIEROS CARTERA DE CREDITO VIGENTE Créditos comerciales OBLIGACIONES EN OPERACIONES DE Actividad Empresarial 19,463,306,882 15,270,559,329 BURSATILIZACION - - Entidades financieras - - Entidades gubernamentales - - Créditos al consumo 33,634,660,714 20,120,335,616 Créditos a la vivienda - - OTRAS CUENTAS POR PAGAR TOTAL CARTERA DE CREDITO VIGENTE 53,097,967,596 35,390,894,945 Impuestos a la utilidad por pagar 101,433,183 189,801,060 Participación de los trabajadores en las utilidades por pagar - - CARTERA DE CREDITO VENCIDA Aportaciones para futuros aumentos de capital pendientes de - Créditos comerciales - - formalizar en asamblea de accionistas - - Actividad Empresarial o comercial 64,523,794 48,177,152 Acreedores por liquidación de operaciones - - Entidades financieras - - Acreedores por cuentas de margen - - Entidades gubernamentales - - Acreedores por colaterales recibidos en efectivo - - Créditos al consumo 472,516,863 267,757,168 Acreedores diversos y otras cuentas por pagar 10,114,394,358 5,469,504,786 Créditos a la vivienda - - 10,215,827,542 5,659,305,846 TOTAL CARTERA DE CREDITO VENCIDA 537,040,658 315,934,320 OBLIGACIONES SUBORDINADAS EN CIRCULACION - - CARTERA DE CREDITO 53,635,008,254 35,706,829,265 (-) MENOS: IMPUESTOS Y PTU DIFERIDOS (NETO) - - ESTIMACION PREVENTIVA PARA RIESGOS CREDITOS DIFERIDOS Y COBROS ANTICIPADOS 2,890,064,696 981,990,957 CREDITICIOS (1,174,130,256) (714,125,945) CARTERA DE CREDITO (NETO) 52,460,877,997 34,992,703,320 TOTAL PASIVO 53,034,916,770 32,676,053,989 DERECHOS DE COBRO ADQUIRIDOS - - (-) MENOS: ESTIMACION POR IRRECUPERABILIDAD O DIFICIL COBRO - - CAPITAL CONTRIBUIDO DERECHOS DE COBRO (NETO) - - Capital social 85,986,339 85,986,339 Aportaciones para futuros aumentos de capital TOTAL DE CARTERA DE CREDITO (NETO) 52,460,877,997 34,992,703,320 acordados en asamblea de accionistas - - Prima en venta de acciones - - BENEFICIOS POR RECIBIR EN OPERACIONES DE Obligaciones subordinadas en circulación - - BURSATILIZACION 85,986,339 85,986,339 OTRAS CUENTAS POR COBRAR (NETO) 464,030,686 284,256,262 CAPITAL GANADO Reservas de capital 25,915,938 25,915,938 BIENES ADJUDICADOS 57,000 99,642 Resultado de ejercicios anteriores 6,807,311,281 6,053,679,207 Resultado por valuación de títulos disponibles para la venta - - INMUEBLES, MOBILIARIO Y EQUIPO (NETO) 1,282,682,736 147,039,121 Resultado por valuación de instrumentos de cobertura de flujos de efectivo - - INVERSIONES PERMANENTES - - Resultado por tenencia de activos no monetarios - - Resultado neto 1,062,871,617 753,330,233 ACTIVOS DE LARGA DURACION DIPONIBLES PARA 7,896,098,836 6,832,925,378 LA VENTA TOTAL CAPITAL CONTABLE 7,982,085,175 6,918,911,717 IMPUESTOS DIFERIDOS (NETO) 867,165,998 371,398,759 OTROS ACTIVOS Cargos diferidos, pagos anticipados e intangibles 1,296,497,565 759,838,205 Otros activos - - TOTAL ACTIVO 61,017,001,945 $ 39,594,965,706 $ TOTAL PASIVO Y CAPITAL CONTABLE 61,017,001,945 $ 39,594,965,706 $ Avales otorgados - $ - $ Activos y pasivos contingentes - - Compromisos crediticios 4,381,318,674 4,488,799,536 Bienes en fideicomiso o mandato - - Bienes en administración - - Colaterales recibidos por la entidad 2,405,629,552 1,541,614,669 Colaterales recibidos y vendidos por la entidad - - Intereses devengados no cobrados derivados de cartera de crédito vencida 38,091,533 17,130,385 Rentas devengadas no cobradas derivadas de operaciones de arrendamiento 384,041 - Otras cuentas de registro - - " El saldo historico del capital social al 31 de diciembre de $50,000,000 de pesos" El presente balance general fue aprobado por el consejo de administración bajo la responsabilidad de los directivos que lo suscriben. Las notas aclaratorias que se acompañan, forman parte integrante de este estado financiero. https://www.gmfsecure.com/inversionistas/#inicio http://www.cnbv.gob.mx Frederick George Livingood Christiaan Salvador Glastra Tejeda Armando Valdés Hernández Abigail Cecilia Muníz González Director General Director de Finanzas Contralor Auditor Interno A C T I V O P A S I V O CUENTAS DE ORDEN C A P I T A L C O N T A B L E El presente balance general, se formuló de conformidad con los Criterios de Contabilidad para las Instituciones de Crédito, emitidos por la Comisión Nacional Bancaria y de Valores, con fundamento en lo dispuesto por los Artículos 99, 101 y 102 de la Ley de Instituciones de Crédito, de observancia general y obligatoria, aplicados de manera consistente, encontrándose reflejadas las operaciones efectuadas por la institución hasta la fecha arriba mencionada, las cuales se realizaron y valuaron con apego a sanas prácticas bancarias y a las disposiciones legales y administrativas aplicables.
-
Upload
duongkhuong -
Category
Documents
-
view
222 -
download
0
Transcript of GM FINANCIAL DE MEXICO, S.A. DE C.V. - gmfsecure.com Financieros a diciembre de... · capital...

GM FINANCIAL DE MEXICO, S.A. DE C.V.SOCIEDAD FINANCIERA DE OBJETO MULTIPLE, E.R.
Avenida Eugenio Garza Lagüera 933 Valle Oriente, San Pedro Garza García N.L. 66269BALANCE GENERAL AL 31 DE DICIEMBRE DE 2016 Y 2015
(Cifras en pesos)
2016 2015 2016 2015DISPONIBILIDADES 1,908,163,853$ 1,488,176,556$ PASIVOS BURSATILES 1,186,142,500$ 1,403,429,319$
CUENTAS DE MARGEN PRESTAMOS BANCARIOS Y DE OTROS ORGANISMOSDe corto plazo 23,894,104,397 14,988,253,513
INVERSIONES EN VALORES De largo plazo 14,848,777,636 9,638,604,815Títulos para negociar - - 38,742,882,032 24,626,858,328Títulos disponibles para la venta - -Títulos conservados a vencimiento - - COLATERALES VENDIDOS
Reportos (Saldo acreedor) - -DEUDORES POR REPORTO (SALDO DEUDOR) 2,405,629,552 1,541,614,669 Derivados - -
Otros colaterales vendidos - -DERIVADOSCon fines de negociación 331,896,558 9,839,172 DERIVADOSCon fines de cobertura - - Con fines de negociación - 4,469,539
Con fines de cobertura - -AJUSTE DE VALUACION POR COBERTURA DEACTIVOS FINANCIEROS AJUSTES DE VALUACION POR COBERTURA DE - -
PASIVOS FINANCIEROSCARTERA DE CREDITO VIGENTECréditos comerciales OBLIGACIONES EN OPERACIONES DE Actividad Empresarial 19,463,306,882 15,270,559,329 BURSATILIZACION - - Entidades financieras - - Entidades gubernamentales - -Créditos al consumo 33,634,660,714 20,120,335,616Créditos a la vivienda - -
OTRAS CUENTAS POR PAGARTOTAL CARTERA DE CREDITO VIGENTE 53,097,967,596 35,390,894,945 Impuestos a la utilidad por pagar 101,433,183 189,801,060
Participación de los trabajadores en las utilidades por pagar - -CARTERA DE CREDITO VENCIDA Aportaciones para futuros aumentos de capital pendientes de -Créditos comerciales - - formalizar en asamblea de accionistas - - Actividad Empresarial o comercial 64,523,794 48,177,152 Acreedores por liquidación de operaciones - - Entidades financieras - - Acreedores por cuentas de margen - - Entidades gubernamentales - - Acreedores por colaterales recibidos en efectivo - -Créditos al consumo 472,516,863 267,757,168 Acreedores diversos y otras cuentas por pagar 10,114,394,358 5,469,504,786Créditos a la vivienda - - 10,215,827,542 5,659,305,846
TOTAL CARTERA DE CREDITO VENCIDA 537,040,658 315,934,320OBLIGACIONES SUBORDINADAS EN CIRCULACION - -
CARTERA DE CREDITO 53,635,008,254 35,706,829,265
(-) MENOS: IMPUESTOS Y PTU DIFERIDOS (NETO) - -
ESTIMACION PREVENTIVA PARA RIESGOS CREDITOS DIFERIDOS Y COBROS ANTICIPADOS 2,890,064,696 981,990,957CREDITICIOS (1,174,130,256) (714,125,945)CARTERA DE CREDITO (NETO) 52,460,877,997 34,992,703,320 TOTAL PASIVO 53,034,916,770 32,676,053,989
DERECHOS DE COBRO ADQUIRIDOS - -(-) MENOS:ESTIMACION POR IRRECUPERABILIDAD ODIFICIL COBRO - - CAPITAL CONTRIBUIDODERECHOS DE COBRO (NETO) - - Capital social 85,986,339 85,986,339
Aportaciones para futuros aumentos de capitalTOTAL DE CARTERA DE CREDITO (NETO) 52,460,877,997 34,992,703,320 acordados en asamblea de accionistas - -
Prima en venta de acciones - -BENEFICIOS POR RECIBIR EN OPERACIONES DE Obligaciones subordinadas en circulación - -BURSATILIZACION 85,986,339 85,986,339
OTRAS CUENTAS POR COBRAR (NETO) 464,030,686 284,256,262 CAPITAL GANADOReservas de capital 25,915,938 25,915,938
BIENES ADJUDICADOS 57,000 99,642 Resultado de ejercicios anteriores 6,807,311,281 6,053,679,207Resultado por valuación de títulos disponibles para la venta - -
INMUEBLES, MOBILIARIO Y EQUIPO (NETO) 1,282,682,736 147,039,121 Resultado por valuación de instrumentos de coberturade flujos de efectivo - -
INVERSIONES PERMANENTES - - Resultado por tenencia de activos no monetarios - -Resultado neto 1,062,871,617 753,330,233
ACTIVOS DE LARGA DURACION DIPONIBLES PARA 7,896,098,836 6,832,925,378LA VENTA
TOTAL CAPITAL CONTABLE 7,982,085,175 6,918,911,717IMPUESTOS DIFERIDOS (NETO) 867,165,998 371,398,759
OTROS ACTIVOSCargos diferidos, pagos anticipados e intangibles 1,296,497,565 759,838,205Otros activos - -
TOTAL ACTIVO 61,017,001,945$ 39,594,965,706$ TOTAL PASIVO Y CAPITAL CONTABLE 61,017,001,945$ 39,594,965,706$
Avales otorgados -$ -$Activos y pasivos contingentes - -Compromisos crediticios 4,381,318,674 4,488,799,536Bienes en fideicomiso o mandato - -Bienes en administración - -Colaterales recibidos por la entidad 2,405,629,552 1,541,614,669Colaterales recibidos y vendidos por la entidad - -Intereses devengados no cobrados derivados de cartera de crédito vencida 38,091,533 17,130,385Rentas devengadas no cobradas derivadas de operaciones de arrendamiento 384,041 -Otras cuentas de registro - -
" El saldo historico del capital social al 31 de diciembre de $50,000,000 de pesos"
El presente balance general fue aprobado por el consejo de administración bajo la responsabilidad de los directivos que lo suscriben.
Las notas aclaratorias que se acompañan, forman parte integrante de este estado financiero.
https://www.gmfsecure.com/inversionistas/#inicio
http://www.cnbv.gob.mx
Frederick George Livingood Christiaan Salvador Glastra Tejeda Armando Valdés Hernández Abigail Cecilia Muníz González Director General Director de Finanzas Contralor Auditor Interno
A C T I V O P A S I V O
CUENTAS DE ORDEN
C A P I T A L C O N T A B L E
El presente balance general, se formuló de conformidad con los Criterios de Contabilidad para las Instituciones de Crédito, emitidos por la Comisión Nacional Bancaria y de Valores, con fundamento en lo dispuesto por los Artículos 99, 101 y 102 de la Ley de Instituciones de Crédito, de observancia general y obligatoria, aplicados de maneraconsistente, encontrándose reflejadas las operaciones efectuadas por la institución hasta la fecha arriba mencionada, las cuales se realizaron y valuaron con apego a sanas prácticas bancarias y a las disposiciones legales y administrativas aplicables.
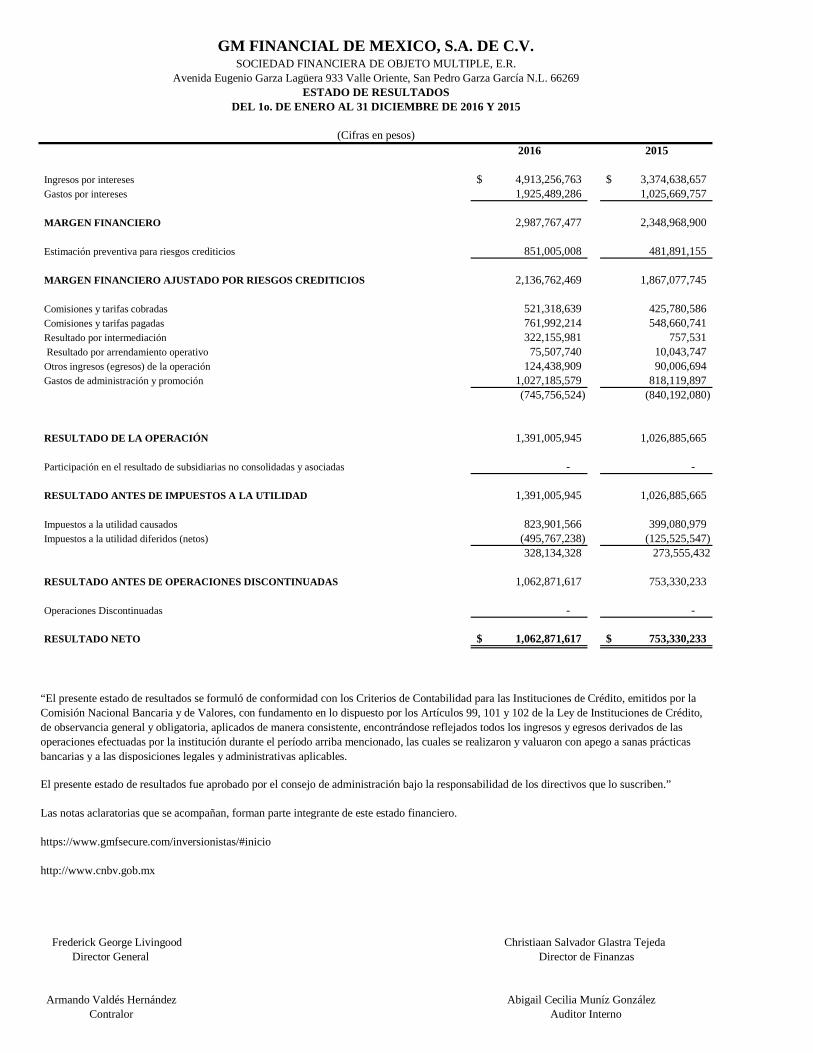
2016 2015
Ingresos por intereses 4,913,256,763$ 3,374,638,657$Gastos por intereses 1,925,489,286 1,025,669,757
MARGEN FINANCIERO 2,987,767,477 2,348,968,900
Estimación preventiva para riesgos crediticios 851,005,008 481,891,155
MARGEN FINANCIERO AJUSTADO POR RIESGOS CREDITICIOS 2,136,762,469 1,867,077,745
Comisiones y tarifas cobradas 521,318,639 425,780,586Comisiones y tarifas pagadas 761,992,214 548,660,741Resultado por intermediación 322,155,981 757,531 Resultado por arrendamiento operativo 75,507,740 10,043,747Otros ingresos (egresos) de la operación 124,438,909 90,006,694Gastos de administración y promoción 1,027,185,579 818,119,897
(745,756,524) (840,192,080)
RESULTADO DE LA OPERACIÓN 1,391,005,945 1,026,885,665
Participación en el resultado de subsidiarias no consolidadas y asociadas - -
RESULTADO ANTES DE IMPUESTOS A LA UTILIDAD 1,391,005,945 1,026,885,665
Impuestos a la utilidad causados 823,901,566 399,080,979Impuestos a la utilidad diferidos (netos) (495,767,238) (125,525,547)
328,134,328 273,555,432
RESULTADO ANTES DE OPERACIONES DISCONTINUADAS 1,062,871,617 753,330,233
Operaciones Discontinuadas - -
RESULTADO NETO 1,062,871,617$ 753,330,233$
El presente estado de resultados fue aprobado por el consejo de administración bajo la responsabilidad de los directivos que lo suscriben.”
Las notas aclaratorias que se acompañan, forman parte integrante de este estado financiero.
https://www.gmfsecure.com/inversionistas/#inicio
http://www.cnbv.gob.mx
Frederick George Livingood Christiaan Salvador Glastra Tejeda Director General Director de Finanzas
Armando Valdés Hernández Abigail Cecilia Muníz González Contralor Auditor Interno
“El presente estado de resultados se formuló de conformidad con los Criterios de Contabilidad para las Instituciones de Crédito, emitidos por laComisión Nacional Bancaria y de Valores, con fundamento en lo dispuesto por los Artículos 99, 101 y 102 de la Ley de Instituciones de Crédito,de observancia general y obligatoria, aplicados de manera consistente, encontrándose reflejados todos los ingresos y egresos derivados de lasoperaciones efectuadas por la institución durante el período arriba mencionado, las cuales se realizaron y valuaron con apego a sanas prácticasbancarias y a las disposiciones legales y administrativas aplicables.
GM FINANCIAL DE MEXICO, S.A. DE C.V.SOCIEDAD FINANCIERA DE OBJETO MULTIPLE, E.R.
Avenida Eugenio Garza Lagüera 933 Valle Oriente, San Pedro Garza García N.L. 66269ESTADO DE RESULTADOS
DEL 1o. DE ENERO AL 31 DICIEMBRE DE 2016 Y 2015
(Cifras en pesos)

SOCIEDAD FINANCIERA DE OBJETO MULTIPLE, E.R.Avenida Eugenio Garza Lagüera 933 Valle Oriente, San Pedro Garza García N.L. 66269
ESTADO DE FLUJOS DE EFECTIVODEL 1o. DE ENERO AL 31 DEDICIEMBRE DE 2016 Y 2015
(Cifras en pesos)2016 2015
Resultado neto 1,062,871,617$ 753,330,233$
Ajustes por partidas que no implican flujo de efectivo:Perdidas por deterioro o efecto por reversión del deterioro asociado a actividades de inversión - -Depreciaciones de inmubles, mobiliario y equipo 165,454,820 35,493,688Amortizaciones de activos intangiblesProvisiones 8,486,303 21,068,276Impuestos a la utilidad causados y diferidos 328,134,328 273,555,432Participación en el resultado de subsidiarias no consolidadas y asociadasOperaciones discontinuadas - -
502,075,451$ 330,117,396$
Actividades de operaciónCambios en cuentas de margen -$ -$Cambio en inversiones en valores - -Cambio en deudores por reporto (864,014,883) (37,535,031)Cambo en derivados (activo) (322,057,386) (2,363,368)Cambio en cartera de credito (neta) (17,468,174,676) (9,118,632,132)Cambio en derecho de cobro adquiridos (neto) - -Cambios en beneficios por recibir en operaciones de bursatilización - -Cambio en bienes adjudicados (neto) 42,642 (99,642)Cambios en otros activos operativos (neto) (2,819,123,347) (825,710,030)Cambios en pasivos bursatiles (217,286,819) 300,934,152Cambios en préstamos interbancarios y de otros organismos 14,116,023,704 7,916,771,237Cambios en colaterales vendidos - -Cambio en derivados (pasivo) (4,469,539) (20,468,327)Cambio en obligaciones en operaciones de bursatilización - -Cambio en obligaciones subordinadas con caracteristicas de pasivo - -Cambio en otros pasivos operativos 6,456,410,971 1,632,218,892Cambio en instrumentos de cobertura (de partidas cubiertas relacionadas con actividades de operación) - -Cobro de impuestos a la utilidad (devoluciones) - -Pago de impuestos a la utilidad - -Flujos netos de efectivo de actividades de operación (1,122,649,332)$ (154,884,249)$
Actividades de inversiónCobros por disposición de inmuebles, mobiliario y equipo 6,876,336$ 6,487,496$Pagos por adquisición de inmuebles, mobiliario y equipo (29,186,774) (25,541,125)Cobros por disposición de subsidiarias, asociadas y acuerdos con control conjuntoPagos por adquisición de subsidiarias, asociadas y acuerdos con control conjunto - -Cobros por disposición de otras inversiones permanentes - -Pagos por disposición de otras inversiones permanentes - -Cobros de dividendos en efectivo - -Pago por adquisición de activos intangibles - -Cobros por disposición de activos de larga duración disponibles para la venta - -Cobros por disposición de otros activos de larga duración - -Pagos por disposición de otros activos de larga duración - -Cobros asociados a instrumentos de cobertura (de partidas cubiertas relacionadas con actividadesde inversión) - -Pagos asociados a instrumentos de cobertura (de partidas cubiertas relacionadas con actividadesde inversión) - -Flujos netos de efectivo de actividades de inversión (22,310,438)$ (19,053,629)$
Actividades de financiamientoCobros por emisiones de acciones -$ -$Pagos por reembolsos de capital social - -Pagos de dividendos en efectivo - (600,000,000)Pagos asociados a la recompra de acciones propias - -Cobros por la emisión de obligaciones subordinadas con caracteristicas de capital - -Pagos asociados a obligaciones subordinadas con caracteristicas de capital - -Flujos netos de efectivo de actividades de financiamiento -$ (600,000,000)$
Incremento o disminución neta de efectivo 419,987,297$ 309,509,751$
Ajustes al flujo de efectivo por variaciones en el tipo de cambio y en los niveles de inflación - -
Efectivo y equivalentes al inicio del periodo 1,488,176,556 1,178,666,805
Efectivo y equivalentes al final del periodo 1,908,163,853$ 1,488,176,556$ ##
El presente estado de flujos de efectivo fue aprobado por el consejo de administración bajo la responsabilidad de los directivos que lo suscriben.”
Las notas aclaratorias que se acompañan, forman parte integrante de este estado financiero.
https://www.gmfsecure.com/inversionistas/#inicio
http://www.cnbv.gob.mx
Frederick George Livingood Christiaan Salvador Glastra Tejeda Director General 'Director de Finanzas
Armando Valdés Hernández Abigail Cecilia Muníz González Contralor Auditor Interno
GM FINANCIAL DE MEXICO, S.A. DE C.V.
“El presente estado de flujos de efectivo se formuló de conformidad con los Criterios de Contabilidad para las Instituciones de Crédito, emitidos por la ComisiónNacional Bancaria y de Valores, con fundamento en lo dispuesto por los Artículos 99, 101 y 102 de la Ley de Instituciones de Crédito, de observancia general yobligatoria, aplicados de manera consistente, encontrándose reflejadas las entradas de efectivo y salidas de efectivo derivadas de las operaciones efectuadas por lainstitución durante el período arriba mencionado, las cuales se realizaron y valuaron con apego a sanas prácticas bancarias y a las disposiciones legales yadministrativas aplicables.

Concepto Capital social Aportaciones Prima en venta Obligaciones Reservas Resultado Resultado por Resultado por Efecto Resultado por Totalpara futuros de acciones subordinadas de de ejercicios valuación de valuación de Acumulado tenencia de capital Contableaumentos de en circulación capital anteriores títulos disponibles instrumentos de por conversión de activos
capital acordados para la venta cobertura de no monetariosen asamblea flujos de
de accionistas efectivo
Saldo al 31 de diciembre de 2015 85,986,339 - - - 25,915,938 6,053,679,207 - 753,330,233 6,918,911,717
MOVIMIENTOS INHERENTES A LASDECISIONES DE LOS ACCIONISTAS
Suscripción de acciones
Capitalización de utilidades - -
Constitución de reservas
Traspaso del resultado neto al resultado de ejercicios anteriores 753,330,233 (753,330,233) -
Pago de dividendos -
Otros 301,841 301,841
Total - - - - - 753,632,074 - - - - (753,330,233) 301,841
MOVIMIENTOS INHERENTES AL RECONOCIMIENTODE LA UTILIDAD INTEGRAL
Resultado neto 1,062,871,617 1,062,871,617
Resultado por valuación de títulos disponibles para la venta
Resultado por valuación de instrumentos de coberturade flujos de efectivo -
Resultado por tenencia de activos no monetarios
Otros 0 -
Total - - - - - - - - - - 1,062,871,617 1,062,871,617
Saldo final al 31 de diciembre de 2016 85,986,339 - - - 25,915,938 6,807,311,281 - - - - 1,062,871,617 7,982,085,175
17,091,450
El presente estado de variaciones en el capital contable fue aprobado por el consejo de administración bajo la responsabilidad de los directivos que lo suscriben.”
Las notas aclaratorias que se acompañan, forman parte integrante de este estado financiero.
https://www.gmfsecure.com/inversionistas/#inicio
http://www.cnbv.gob.mx
Frederick George Livingood Christiaan Salvador Glastra Tejeda Armando Valdés Hernández Abigail Cecilia Muníz González Director General Director de Finanzas Contralor Auditor Interno
“El presente estado de variaciones en el capital contable se formuló de conformidad con los Criterios de Contabilidad para las Instituciones de Crédito, emitidos por la Comisión Nacional Bancaria y de Valores, con fundamento en lo dispuesto por los Artículos 99, 101 y 102 de la Ley de Instituciones de Crédito, de observancia general y obligatoria, aplicados de maneraconsistente, encontrándose reflejados todos los movimientos en las cuentas de capital contable derivados de las operaciones efectuadas por la institución durante el período arriba mencionado, las cuales se realizaron y valuaron con apego a sanas prácticas bancarias y a las disposiciones legales y administrativas aplicables.
Resultado neto
Capital Ganado
SOCIEDAD FINANCIERA DE OBJETO MULTIPLE, E.R.GM FINANCIAL DE MEXICO, S.A. DE C.V.
(Cifras en pesos)
ESTADO DE VARIACIONES EN EL CAPITAL CONTABLE DEL 1o. DE ENERO DEL 2016 AL 31 DE DICIEMBRE DE 2016
Capital Contribuido
Avenida Eugenio Garza Lagüera 933 Valle Oriente, San Pedro Garza García N.L. 66269

GM FINANCIAL DE MEXICO, S.A. DE C.V.SOCIEDAD FINANCIERA DE OBJETO MULTIPLE, E.R.
Avenida Eugenio Garza Laguera 933 Valle Oriente, San Pedro Garza García N.L. 66269NOTAS A LOS ESTADOS FINANCIEROS
AL 31 DE DICIEMBRE DE 2016(Cifras en miles de pesos)
1.- CARTERA DE CREDITO
La cartera de crédito está representada por créditos comerciales y de consumo en moneda nacional. El monto de la cartera de crédito al 31 dediciembre de 2016, asciende a $53,635,008 el cual se integra de la siguiente forma:
Cartera de consumo vigente sin restricción $ 15,363,111
Cartera de consumo vigente restringida 18,271,550
Total cartera de consumo vigente $ 33,634,661
Cartera comercial vigente sin restricción $8,329,683
Cartera comercial vigente restringida 11,133,624
Total cartera comercial vigente $ 19,463,307
Total cartera vigente: $53,097,968
Cartera de consumo vencida sin restricción $ 404,252
Cartera de consumo vencida restringida 68,265
Total cartera de consumo vencida $472,517
Cartera comercial vencida sin restricción $ 52,408
Cartera comercial vencida restringida 12,116
Total cartera comercial vencida $ 64,524
Total cartera vencida: $537,041
La cartera de crédito vencida se integra de créditos de consumo y comerciales en moneda nacional con pagos periódicos parciales de principal eintereses que presentan 90 ó más días vencidos. De acuerdo a su antigüedad, los saldos de cartera vencida se integran como sigue:
90 a 180 días $261,721Mayor a 180 días 210,796
Cartera de consumo vencida $472,517
90 a 180 días $ 35,734Mayor a 180 días 28,790
Cartera comercial vencida $ 64,524
Total cartera vencida $537,041

Derivado de las operaciones de financiamiento de la compañía a las que se refiere la nota 9, existen activos restringidos dentro del rubro decartera de crédito por un monto que asciende a: $29,485,555.
La cartera de crédito vigente al cierre de diciembre cuenta con una reestructura, la cual se desglosa a continuación:
Cartera de consumo vigente $ 33,634,661
Cartera comercial vigente $19,443,967
Cartera comercial vigente reestructurada 19,340
Total cartera comercial vigente $ 19,463,307
Total cartera vigente: $ 53,097,968
Esta reestructura se debió a prorroga en el plazo del crédito y cambio en la tasa de interés. Las políticas y procedimientos para realizar lasreestructuras de cartera de crédito se detallan en el punto 13 de estas notas.
Los intereses generados por tipo de crédito al cierre de diciembre 2016, se integran como sigue:
Cartera de crédito al consumo $ 3,647,853Cartera de crédito comercial 943,731
$ 4,591,584
Las comisiones reconocidas como ingresos al cierre de diciembre de 2016 por créditos al consumo ascienden a $521,319.
2.- PORCENTAJE DE CONCENTRACIÓN Y PRINCIPALES CARACTERÍSTICAS DE LA CARTERA POR REGIÓN
La concentración de la cartera por región al cierre del periodo se muestra a continuación:
Región Saldo Porcentaje
Ciudad de México y Area Metropolitana 14,595,770 27.21%
Noreste 10,618,441 19.80%
Occidente 6,532,901 12.18%
Centro 5,890,594 10.98%
Sur 4,995,353 9.32%
Oriente 4,599,401 8.58%
Noroeste 3,789,988 7.07%
Sureste 2,612,560 4.86%
Total: 53,635,008 100.00%

3.- ESTIMACIÓN DE RESERVA PREVENTIVA
A continuación se establece la metodología para determinar esta estimación:
Reserva de cartera consumo – La reserva de la cartera de consumo se determina con base en los artículos 90 y 91 de la Circular Única de Bancos(CUB). Las reservas de la cartera de consumo no revolvente, se determinan evaluando la probabilidad de incumplimiento, la severidad de lapérdida y la exposición al incumplimiento, crédito por crédito, considerando los datos históricos de dicha cartera.
Reserva de cartera comercial – La reserva de la cartera comercial se determina con base al artículo 110 de la Circular Única de Bancos (CUB).Hasta 2013, para calificar la cartera comercial y reconocer la reserva respectiva, se utilizaba la metodología establecida en las Disposiciones, queconsideraba la situación financiera, el entorno económico, la fuente e historial de pago, la calidad de la información y las garantías. Dichacalificación se realizaba individualmente excepto por los créditos a cargo de un mismo deudor cuyo saldo era menor a un importe equivalente a 4,000,000 de UDIS, los cuales eran evaluados de forma paramétrica atendiendo a los meses transcurridos a partir del primer incumplimiento yasignando porcentajes de reserva diferentes según se tratara de cartera reestructurada o no reestructurada.
El 24 de junio de 2013, la Comisión emitió cambios a las Disposiciones en materia de calificación de cartera crediticia comercial aplicables alejercicio 2014, adicionando los anexos 21 y 22 al artículo 110 de la Circular Única de Bancos (CUB), los cuales señalan que para ladeterminación de la calificación de cartera, se debe de considerar la probabilidad de incumplimiento, severidad de la pérdida y exposición alincumplimiento. Así mismo la probabilidad de incumplimiento se determina mediante la evaluación del puntaje crediticio total para créditos acargo de Personas Morales y Personas Físicas con Actividad Empresarial, haciendo la separación de aquellos con ingresos netos o ventas netasanuales menores al equivalente en moneda nacional a 14 millones de Unidades de Inversión (UDIS) de conformidad con los anexosmencionados.
En función del porcentaje requerido de estimación preventiva para la cartera, se determina el grado de riesgo asignado, como se muestra acontinuación:
Grados de riesgo
Cartera de consumo Carteracomercial
A-1 0 a 2.0 0 a 0.9A-2 2.01 a 3.0 0.901 a 1.5B-1 3.01 a 4.0 1.501 a 2.0B-2 4.01 a 5.0 2.001 a 2.50B-3 5.01 a 6.0 2.501 a 5.0C-1 6.01 a 8.0 5.001 a 10.0C-2 8.01 a 15.0 10.001 a 15.5D 15.01 a 35.0 15.501 a 45.0E 35.01 a 100.0 Mayor a 45.0
Los intereses devengados no cobrados, considerados como cartera vencida, se reservan en su totalidad al momento del traspaso a dicha cartera.
Los créditos castigados se cancelan contra la estimación preventiva cuando se determina la imposibilidad práctica de recuperación.
Cualquier recuperación derivada de los créditos previamente castigados, se reconoce en los resultados del ejercicio.
A continuación se muestran los resultados de la calificación de la cartera crediticia al cierre del periodo:

CARTERACOMERCIAL
CARTERA DECONSUMO
CARTERAHIPOTECARIADE VIVIENDA
TOTAL RESERVASPREVENTIVAS
EXCEPTUADACALIFICADA -$
Riesgo A 49,651,106 122,943$ 412,980$ -$ 535,923$
Riesgo B 2,319,811 26,431$ 50,665 0 77,096
Riesgo C 615,905 4,840$ 46,680 0 51,520
Riesgo D 445,610 49,477$ 71,865 0 121,342
Riesgo E 602,576 2$ 388,247 0 388,249
TOTAL 53,635,008$ 203,693$ 970,437$ -$ 1,174,130$
Menos:
RESERVAS CONSTIT UIDAS 1,174,130$
EXCESO 0$
GM FINANCIAL DE MEXICO, S.A. DE C.V. SOFOM, E.R.
CALIFICACIÓN DE LA CARTERA CREDIT ICIA AL 31 DE DICIEMBRE DE 2016
(Cifras en miles de persos)
IMPORTECARTERA
CREDITICA
RESERVAS PREVENTIVAS NECESARIAS
Las cifras para la calificación y constitución de las reservas preventivas, son las correspondientes al día último del mes a que se refiere el balancegeneral al 31 de diciembre de 2016. La Compañía utiliza para la calificación de la cartera crediticia la metodología establecida por la CNBV.
4.- ARRENDAMIENTO OPERATIVO
El importe de ingresos por arrendamiento operativo al cierre del periodo ascendió a $226,647.
5.- DISPONIBILIDADES
El rubro de disponibilidades al cierre del periodo se integra como se muestra a continuación:
Tipo de DisponibilidadDepósitos en Entidades Financieras $ 194,296Otras disponibilidades 1,713,868
Total $ 1,908,164

6.- OPERACIONES CON VALORES Y DERIVADAS
Al cierre del periodo la Compañía tenía celebrados contratos de derivados para hacer frente a las fluctuaciones en las tasas de interés relacionadascon algunos de los instrumentos de deuda. Las operaciones celebradas con fines de cobertura de tasa tienen vencimientos entre el 2016 y el 2022.
Las operaciones celebradas por la Compañía con instrumentos financieros derivados corresponden principalmente a contratos de Swaps yOpciones de tasa de interés, ambos tienen como subyacente la tasa TIIE a 28 días. La Compañía reconoce contablemente estas operaciones eninstrumentos financieros derivados como de negociación.
Al 31 de diciembre de 2016 el saldo en instrumentos financieros derivados en su parte activa es de $331,897 y en su parte pasiva $0, y se integracomo se muestra a continuación:
Dic-16
Monto nominal Posición activa Posición Pasiva
Opciones de tasas 4,759,363 42,540 -
Swaps de tasas 18,998,238 289,357 -
Total negociación 23,757,601 331,897 -
De acuerdo a lo anterior, el resultado por valuación de instrumentos de cobertura de flujos de efectivo dentro del rubro de resultado porintermediación asciende a un ingreso de $322,155.
Estos instrumentos financieros derivados son supervisados desde su contratación, y analizados por el área destinada al seguimiento ycomparación de los valores razonables. El área de Reporteo Financiero y Derivados con base en los Estados Unidos de Norte América, fungecomo la parte responsable de la integridad de la información, valuación de precios a través de un proveedor Internacional, así como de realizarlas verificaciones de las valuaciones de dichos precios. Periódicamente, se informa al consejo de administración respecto de la realización de lasoperaciones con instrumentos financieros derivados, lo cual consta en los estados financieros que se aprueban en las Sesiones de Consejo.
7.-BIENES ADJUDICADOS
El proceso de adjudicación de vehículos a favor de GM Financial de México sucede dentro de un proceso de cobranza judicial seguido ante unaautoridad competente. El proceso de valoración del bien sujeto a adjudicarse se lleva a cabo por un perito que se encuentra certificado y adscritoal juzgado donde se está llevando a cabo el juicio. Para definir el valor del vehículo, el perito puede tomar en cuenta las siguientesconsideraciones, el valor comparado con bienes similares nuevos que se encuentren en el mercado y/o cotizar los valores de reposición nuevosque existen en el mercado sobre bienes similares. Al cierre del ejercicio el saldo de los bienes adjudicados asciende a $57.
8.-PASIVOS BURSATILES
La Compañía cuenta con un programa de certificados bursátiles de corto plazo y largo plazo el cual fué autorizado por la Comisión NacionalBancaria y de Valores (CNBV) el 27 de octubre de 2016 hasta por un monto total de $7,000,000, donde el saldo insoluto de principal de loscertificados bursátiles de corto plazo no podrá exceder de $3,000,000. El programa tiene vigencia de cinco años a partir de la fecha deautorización.
El rubro de pasivos bursátiles se integra por emisiones de certificados bursátiles, al amparo de programas autorizados por la CNBV.
Al 31 de diciembre de 2016, el saldo de certificados bursátiles de corto plazo en circulación asciende a $1,180,000 los cuales devengan interesesa tasas de mercado basadas en la Tasa de Interés Interbancaria de Equilibrio (TIIE) a 28 días. Al cierre del periodo, el interés devengado fue de$6,143 y las tasa de interés del 5.84%.
El valor de los certificados bursátiles de corto plazo se aproxima a su valor razonable debido a la naturaleza de su vencimiento.

9.- PRESTAMOS BANCARIOS Y DE OTROS ORGANISMOS
a. De corto plazo
Préstamos quirografarios con instituciones de banca múltiple, algunos de los cuales puedenestar garantizados total e incondicionalmente por la Tenedora, los cuales devenganintereses a tasas de mercado basadas en la Tasa de Interés Interbancaria de Equilibrio (TIIE)a 28 o 91 días. $15,295,000
Intereses devengados por pagar 158,615
15,453,615
Más porción circulante del pasivo a largo plazo 8,440,489
$23,894,104
b. De largo plazo
Préstamos no garantizados con instituciones de banca de desarrollo, los cuales devenganintereses a una tasa basada en la Tasa de Interés Interbancaria de Equilibrio (TIIE) a 28días más 185 puntos base. Al cierre del periodo, las tasas de interés devengada fue del7.45%. 2,500,000
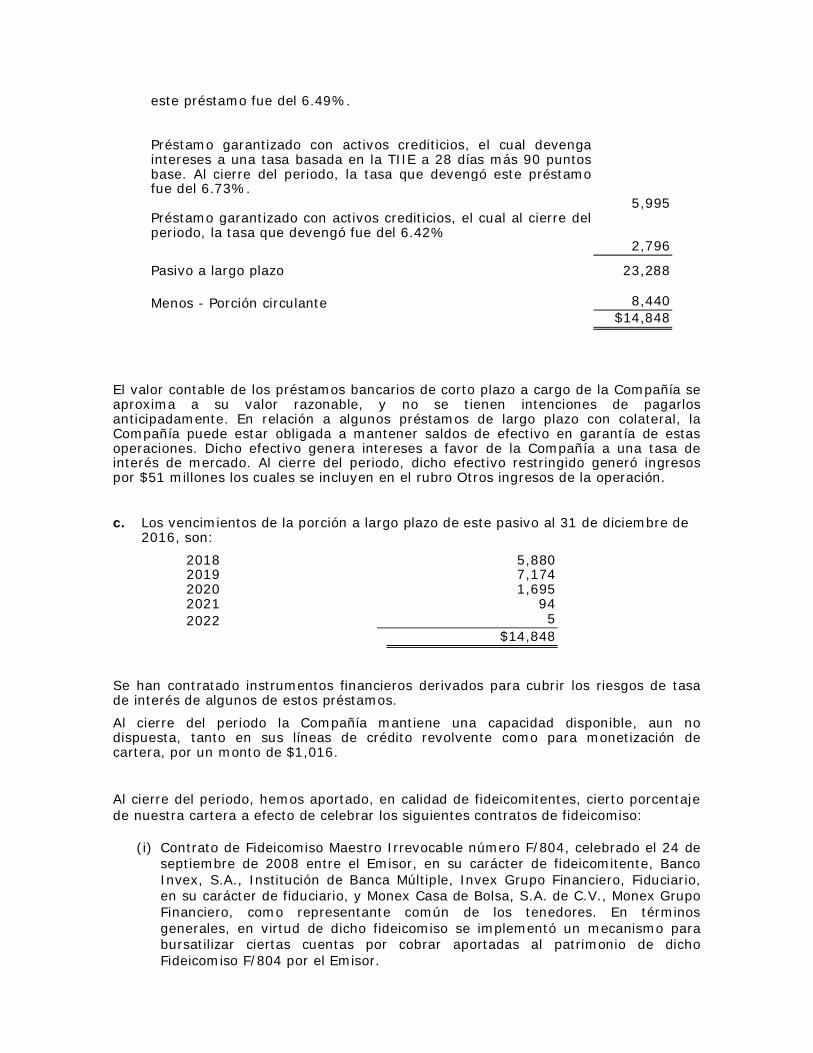
Préstamo con colateral, garantizado con activos crediticios, el cual devenga intereses a unatasa basada en la TIIE a 28 días más 129 puntos base. Al cierre del periodo la tasa quedevengó este préstamo fue del 6.72%. 3,500,000
Préstamo con colateral, garantizado con activos crediticios, el cual devenga intereses a unatasa basada en la TIIE a 28 días más 95 puntos base. Al cierre del periodo, la tasa quedevengó este préstamo fue del 6.49%. 8,497,479
Préstamo garantizado con activos crediticios, el cual devenga intereses a una tasa basadaen la TIIE a 28 días más 90 puntos base. Al cierre del periodo, la tasa que devengó estepréstamo fue del 6.73%. 5,995,075
Préstamo garantizado con activos crediticios, el cual al cierre del periodo, la tasa quedevengó fue del 6.42%. 2,796,713
Pasivo a largo plazo 23,289,267
Menos porción circulante del pasivo a largo plazo 8,440,489$ 14,848,778

El valor contable de los préstamos bancarios de corto plazo a cargo de la Compañía se aproxima a su valor razonable, y no se tienen intencionesde pagarlos anticipadamente. La Compañía está obligada a mantener saldos de efectivo en garantía de los préstamos garantizados con activoscrediticios. Dicho efectivo genera intereses a favor de la Compañía a una tasa de interés de mercado. Al cierre del periodo, dicho efectivorestringido generó ingresos por $51,153 los cuales se incluyen en el rubro otros ingresos de la operación.
c. Los vencimientos de la porción a largo plazo de este pasivo al 31 de diciembre de 2016, son:
2018 5,880,2772019 7,174,0512020 1,695,225
20212022
93,9555,270
$14,848,778
Se han contratado instrumentos financieros derivados para cubrir los riesgos de tasa de interés de algunos de estos préstamos.
Al cierre del periodo, la Compañía mantiene una capacidad disponible, aún no dispuesta, tanto en sus líneas de crédito revolventes como paramonetización de cartera, por un monto de $1,015,734.
Al cierre del periodo, hemos aportado, en calidad de fideicomitentes, cierto porcentaje de nuestra cartera a efecto de celebrar los siguientescontratos de fideicomiso:
(i) Contrato de Fideicomiso Maestro Irrevocable número F/804, celebrado el 24 de septiembre de 2008 entre el Emisor, en su carácter defideicomitente, Banco Invex, S.A., Institución de Banca Múltiple, Invex Grupo Financiero, Fiduciario, en su carácter de fiduciario, yMonex Casa de Bolsa, S.A. de C.V., Monex Grupo Financiero, como representante común de los tenedores. En términos generales, envirtud de dicho fideicomiso se implementó un mecanismo para bursatilizar ciertas cuentas por cobrar aportadas al patrimonio de dichoFideicomiso F/804 por el Emisor.
(ii) Contrato de Fideicomiso Irrevocable número F/00251, celebrado el 14 de octubre de 2005 entre el Emisor, en su carácter defideicomitente y fideicomisario en segundo lugar, y CIBanco, S.A., Institución de Banca Múltiple (antes The Bank of New YorkMellon, S.A., Institución de Banca Múltiple), como fiduciario. En términos generales, en virtud del Fideicomiso F/00251 se establecióun mecanismo para (i) el financiamiento de ciertos créditos cedidos por el Emisor al patrimonio de dicho fideicomiso, y (ii) la emisióndel pagaré pagadero a la orden del fideicomisario en primer lugar, solamente con los recursos del patrimonio del mismo.
(iii) Contrato de Fideicomiso Irrevocable número F/242896, celebrado el 31 de agosto de 2007 entre el Emisor, en su carácter defideicomitente y fideicomisario en segundo lugar, y HSBC México, S.A., Institución de Banca Múltiple, Grupo Financiero HSBC,División Fiduciaria, como fiduciario. Dicho fideicomiso fue modificado en virtud de un convenio de sustitución fiduciaria, de fecha 6de febrero de 2013 en el cual HSBC México, S.A., Institución de Banca Múltiple, Grupo Financiero HSBC, División Fiduciaria fuesustituido por Banco Invex, S.A., Institución de Banca Múltiple, Invex Grupo Financiero, Fiduciario como fiduciario del mismo ydicho a fideicomiso le fue reasignado como número de identificación, el F/1380. En virtud de dicho fideicomiso se estableció unmecanismo para que el fideicomisario en primer lugar pudiera invertir en pagarés emitidos por el fiduciario mediante (i) la cesión yaportación de créditos cedidos por el Emisor al patrimonio de dicho fideicomiso, así como de todos los derechos y obligacionesprevistos en los contratos de intercambio de tasas de interés, en su caso, por parte del fideicomitente al fiduciario de conformidad conciertos contratos de cesión correspondientes, y (ii) el fondeo por parte del fideicomisario en primer lugar y la emisión por parte delfiduciario del pagaré pagadero a la orden del fideicomisario en primer lugar, con recurso limitado únicamente al patrimonio delfideicomiso aquí descrito.
(iv) Contrato de Fideicomiso Irrevocable número F/2965, celebrado el 31 de marzo de 2016 entre el Emisor, en su carácter defideicomitente y fideicomisario en segundo lugar, y Banco Monex, S.A., Institución de Banca Múltiple, Monex Grupo Financiero,como fiduciario. En términos generales, en virtud del fideicomiso aquí descrito se implementó un mecanismo para proporcionarfinanciamiento al Emisor y que la misma adquiera ciertos créditos por parte del fideicomisario en primer lugar, en los términosestablecidos en dicho fideicomiso.
Manifestamos que para los fideicomisos anteriormente enlistados no es aplicable la consolidación a los activos totales de la Emisora en virtud deque los mismos se mantuvieron dentro de los Estados Financieros de la compañía.

10.- OPERACIONES DE BURSATILIZACIÓN
Con el propósito de diversificar sus fuentes de financiamiento, la compañía ha celebrado en forma privada estructuras financieras mediante lascuales ha monetizado parte de su cartera de crédito de consumo y comercial a favor de instituciones de crédito con presencia en la RepúblicaMexicana y en el Extranjero las cuales son sin baja de activos financieros. Dichas transacciones se han realizado desde el 14 de octubre de 2005.El saldo de principal vigente al cierre del ejercicio de las estructuras financieras asciende a $20,789,266 y los intereses por pagar derivados dedichos préstamos ascienden a $94,697 en un vencimiento mensual. La tasa de interés promedio que aplicaron en el período fue de 6.62%.
11.- SALDOS CON PARTES RELACIONADAS
Los saldos con partes relacionadas al 31 de diciembre, se integran como sigue:
Cuentas por cobrar:
General Motors de México, S. de R.L. de C.V. Incentivos y comisiones $354,096
General Motors Financial Company Inc. Servicios administrativos 18
Cuentas por pagar:
General Motors de México, S. de R.L. de C.V. Inventario en transito $5,754,238
General Motors Financial International B.V. Préstamo Intercompañia 3,639,609
Servicios GMAC, S.A. de C.V. Préstamo Intercompañia 100,297
$9,494,144
La compañía cuenta con una línea de crédito comprometida con General Motors Financial Company Inc., que asciende a $10,000,000.
12.- CAPITAL CONTABLE
En asamblea general de accionistas con fecha de 25 de junio de 2015 se acordó pagar un dividendo en efectivo por $600 mil pesos por cada unade las 1,000 acciones en circulación representativas del capital social de la compañía, con cargo al resultado de ejercicios anteriores.
13.- IMPUESTOS A LA UTILIDAD
El impuesto a la utilidad causado se determina mediante la aplicación de la legislación fiscal vigente sobre los ingresos gravables y deduccionesautorizadas del ejercicio. El impuesto anual determinado se presenta como un pasivo a corto plazo neto de los anticipos efectuados durante el año,o como un activo en el caso de que los anticipos sean superiores al impuesto anual determinado.
El impuesto a la utilidad diferido se determina aplicando el método de activos y pasivos. Bajo este método, a todas las diferencias que surgenentre los valores contables y fiscales de los activos y pasivos, se les aplica la tasa del impuesto sobre la renta (ISR), vigente a la fecha de losestados financieros, o bien, aquellas tasas aprobadas a esa fecha y que estarán vigentes al momento en que se estima que los activos y pasivos porimpuesto a la utilidad diferido se recuperarán o se liquidarán. La Compañía evalúa periódicamente la recuperabilidad de los activos por impuestodiferido, creando en su caso, una estimación sobre aquellos montos en los que no existe una alta probabilidad de recuperación.
El impuesto causado y diferido es reconocido como un gasto en los resultados del ejercicio, excepto cuando haya surgido de una transacción osuceso que se reconoce fuera del resultado del ejercicio como otro resultado integral o una partida reconocida directamente en el capital contable.

14.-INDICADORES FINANCIEROS
A continuación se enlistan los principales indicadores financieros al cierre del periodo:
Índice de Morosidad: 1.00%
Índice de Cobertura de Cartera de Crédito Vencida: 218.63%
Eficiencia Operativa: 2.01%
Retorno sobre Capital: 18.01%
Retorno sobre Activos: 2.47%
Índice de Capitalización: 13.08%
Liquidez: Activos líquidos / Pasivos líquidos: 17.20%
MIN: Margen financiero del trimestre ajustado por riesgos crediticios anualizado / Activos productivos promedio: 3.92%
15.- PRINCIPALES POLITICAS CONTABLES
Las políticas contables que sigue la Entidad están de acuerdo con los criterios contables establecidos por la Comisión, los cuales se incluyen enlas “Disposiciones de Carácter General Aplicables a los Almacenes Generales de Depósito, Casas de Cambio, Uniones de Crédito, SociedadesFinancieras de Objeto Múltiple Reguladas” (las “Disposiciones”), las cuales requieren que la Administración efectúe ciertas estimaciones yutilice ciertos supuestos para determinar la valuación de algunas de las partidas incluidas en los estados financieros y efectuar las revelacionesque se requieran en los mismos. Aun cuando pueden llegar a diferir de su efecto final, la Administración considera que las estimaciones ysupuestos utilizados fueron los adecuados en las circunstancias actuales.
De acuerdo con el criterio contable A-1 “Esquema básico del conjunto de criterios contables aplicables a Instituciones de Crédito” de laComisión, la contabilidad de las Sofomes se ajustará a las normas de información financiera aplicables en México (NIF), definidas por el ConsejoMexicano de Normas de Información Financiera, A.C. (CINIF), excepto cuando a juicio de la Comisión sea necesario aplicar una normatividad oun criterio contable específico, tomando en consideración que las Sofomes realizan operaciones especializadas.
A continuación se describen las principales políticas contables seguidas por la Entidad:
a. Cambios contables –
A partir del 1 de enero de 2016, la Sociedad adoptó las siguientes mejoras a las NIF:
Mejoras a las NIF 2016 – Se emitieron las siguientes mejoras que provocaron cambios contables:
Asimismo, se adoptaron las siguientes normas que no generan cambios contables:
NIF C-7, Inversiones en asociadas, negocios conjuntos y otras inversiones permanentes - Se establece que en caso de aportaciones en especie,éstas deben reconocerse al valor razonable que fue negociado entre los propietarios o accionistas, a menos que sean consecuencia de lacapitalización de una deuda, en cuyo caso,
Asimismo, se adoptaron las siguientes normas que no generan cambios contables:
NIF C-3, Cuentas por cobrar - Se hacen precisiones al alcance de la norma para homologar varios conceptos relacionados al tema de instrumentosfinancieros
Al 31 de diciembre de 2016, la Sociedad no tuvo efectos de estas nuevas normas en su información financiera.
b. Reconocimiento de los efectos de la inflación - La inflación acumulada de los tres ejercicios anuales anteriores al 31 de diciembrede 2016, 2015 y 2014, es 9.57%, 11.68% y 11.80%, respectivamente; por lo tanto, el entorno económico califica como no inflacionario en ambosejercicios y, consecuentemente, no se reconocen los efectos de la inflación en los estados financieros adjuntos. Los porcentajes de inflación porlos años que terminaron el 31 de diciembre de 2016, 2015 y 2014 fueron 3.36%, 2.13% y 4.08%, respectivamente.

c. Disponibilidades - Este rubro se integra principalmente por depósitos en compañías financieras efectuados en el país,representados por efectivo e inversiones a corto plazo, de gran liquidez, fácilmente convertibles en efectivo. Se valúan a valor nominal y en elcaso de moneda extranjera se valúa a su valor razonable con base en el tipo de cambio emitido por Banco de México al cierre del ejercicio. Lacobranza procedente de la cartera cedida en garantía, se reconoce como una disponibilidad restringida. Los rendimientos que generan losdepósitos se reconocen en los resultados del ejercicio conforme se devengan.
d. Instrumentos financieros derivados - La Entidad obtiene financiamientos bajo diferentes condiciones; cuando estos son a tasavariable, con la finalidad de reducir su exposición a riesgos de volatilidad en tasas de interés, pueden ser contratados algunos instrumentosfinancieros derivados tales como Swaps que convierten su perfil de pago de intereses de tasa variable a tasa fija, así como opciones Caps de tasade interés. La negociación con instrumentos derivados se realiza sólo con instituciones de reconocida solvencia y se han establecido límites decontraparte para cada institución. La política de la Entidad es la de no realizar operaciones con instrumentos financieros derivados con propósitosde especulación.
La Entidad reconoce todos los activos o pasivos que surgen de las operaciones con instrumentos financieros derivados en el balancegeneral a valor razonable, independientemente del propósito de su tenencia. La Entidad decidió dar el tratamiento contable de negociación a susinstrumentos financieros derivados, por lo que las ganancias o pérdidas resultantes de la valuación a valor razonable son reconocidasinmediatamente en los resultados del período. El valor razonable se determina con base en precios de mercados reconocidos o provistos porcontrapartes y determinados con base en técnicas de valuación aceptadas en el ámbito financiero.
e. Cartera de crédito - Representa el saldo de los montos efectivamente entregados a los acreditados más los intereses devengados nocobrados. La estimación preventiva para riesgos crediticios se presenta deduciendo de los saldos de cartera.
El saldo insoluto de los créditos se registra como cartera vencida cuando cumpla con las siguientes características:
1. Créditos con pago único de principal e intereses al vencimiento presenten 30 o más días naturales de vencidos;
2. Créditos con pagos periódicos parciales de principal e intereses presentan 90 o más días naturales de vencidos;
3. Cuando se tiene evidencia de que el cliente ha sido declarado en concurso mercantil.
Los intereses se reconocen como ingresos en el momento en que se devengan. La acumulación de intereses se suspende al momento en que elcrédito se traspasa a cartera vencida, y a partir de ese momento se controlan en cuentas de orden.
Los intereses ordinarios devengados durante el periodo en que el crédito se consideró cartera vencida se reconocen como ingresos en el momentoen que se cobran.
La Entidad aplica anualmente contra la estimación preventiva para riesgos crediticios los créditos que considera incobrables de la cartera venciday con antigüedad mayor a un año.
La cartera que ha sido otorgada como garantía de los préstamos obtenidos por la Entidad, es designada como cartera restringida.
La cartera bursátil está siendo administrada por la Entidad debido a que corresponde a cartera cedida con recurso.
f. Estimación preventiva para riesgos crediticios - Se mantiene una estimación para riesgos crediticios, la cual a juicio de laAdministración, es suficiente para cubrir cualquier pérdida que pudiera surgir tanto de los préstamos incluidos en su cartera de créditos, como deotros riesgos crediticios. A continuación se establece la metodología para determinar esta estimación.
Reserva de cartera consumo – Las reservas de la cartera de consumo no revolvente, se determinan evaluando la probabilidad de incumplimiento,la severidad de la pérdida y la exposición al incumplimiento, crédito por crédito, considerando los datos históricos de dicha cartera.
Reserva de cartera comercial – La reserva de la cartera comercial se determina con base al artículo 110 de la Circular Única de Bancos (CUB).Hasta 2013, para calificar la cartera comercial y reconocer la reserva respectiva, se utilizaba la metodología establecida en las Disposiciones, queconsideraba la situación financiera, el entorno económico, la fuente e historial de pago, la calidad de la información y las garantías. Dichacalificación se realizaba individualmente excepto por los créditos a cargo de un mismo deudor cuyo saldo era menor a un importe equivalente a 4millones de Unidades de Inversión (UDIS), los cuales eran evaluados de forma paramétrica atendiendo a los meses transcurridos a partir delprimer incumplimiento y asignando porcentajes de reserva diferentes según se tratara de cartera reestructurada o no reestructurada.

El 24 de junio de 2013, la Comisión emitió cambios a las Disposiciones en materia de calificación de cartera crediticia comercial aplicables alejercicio 2013, adicionando los anexos 21 y 22 al artículo 110 de la Circular Única de Bancos (CUB), los cuales señalan que para ladeterminación de la calificación de cartera, se debe de considerar la probabilidad de incumplimiento, severidad de la pérdida y exposición alincumplimiento, considerando lo señalado más adelante en esta sección.
Las reservas de la cartera comercial se determinan mediante la evaluación del puntaje crediticio total para créditos a cargo de Personas Morales yPersonas Físicas con Actividad Empresarial, haciendo la separación de aquellos con ingresos netos o ventas netas anuales menores al equivalenteen moneda nacional a 14 millones de UDIS de conformidad con los anexos mencionados.
El porcentaje requerido de estimación preventiva para la cartera, se determina en función del grado de riesgo asignado, como se muestra acontinuación:
Grados de riesgo
Cartera de consumo Carteracomercial
A-1 0 a 2.0 0 a 0.9A-2 2.01 a 3.0 0.901 a 1.5B-1 3.01 a 4.0 1.501 a 2.0B-2 4.01 a 5.0 2.001 a 2.50B-3 5.01 a 6.0 2.501 a 5.0C-1 6.01 a 8.0 5.001 a 10.0C-2 8.01 a 15.0 10.001 a 15.5D 15.01 a 35.0 15.501 a 45.0E 35.01 a 100.0 Mayor a 45.0
Los intereses devengados no cobrados, considerados como cartera vencida, se reservan en su totalidad al momento del traspaso a dicha cartera.
Los créditos calificados como irrecuperables se cancelan contra la estimación preventiva cuando se determina la imposibilidad práctica derecuperación. Adicionalmente, por los créditos comerciales que se encuentren en cartera vencida y reservados en su totalidad, la Administraciónevalúa periódicamente si éstos deben ser aplicados contra la estimación preventiva.
Cualquier recuperación derivada de los créditos previamente castigados, se reconoce en los resultados del ejercicio.
Durante 2016, 2015 y 2014 se constituyeron reservas por $851,005, $481,891 y $326,466, respectivamente, mismas que fueron registradas en elrubro de estimación preventiva para riesgos crediticios en el estado de resultados.
Descripción General de las Metodologías Regulatorias establecidas por la Comisión - Las metodologías regulatorias para calificar la cartera deconsumo y la cartera comercial establecen que la reserva de dichas carteras se determina con en base en la estimación de la pérdida esperadaregulatoria de los créditos para los siguientes doce meses.
Dichas metodologías estipulan que en la estimación de dicha pérdida esperada se evalúan la probabilidad de incumplimiento, la severidad de lapérdida y la exposición al incumplimiento, y que el resultado de la multiplicación de estos tres factores es la estimación de la pérdida esperadaque es igual al monto de reservas que se requieren constituir para enfrentar el riesgo de crédito.
Dependiendo del tipo de cartera, la probabilidad de incumplimiento, la severidad de la pérdida y la exposición al incumplimiento en lasmetodologías regulatorias se determinan considerando lo siguiente:
– Probabilidad de Incumplimiento:
Consumo no revolvente - toma en cuenta la morosidad actual, los pagos que se realizan respecto al saldo de los últimos exigibles, las veces que sepaga el valor original del bien, el tipo de crédito, el plazo remanente, entre otros.
Comercial - considerando según el tipo de acreditado, los factores de experiencia de pago, experiencia de pago INFONAVIT, evaluación de lasagencias calificadoras, riesgo financiero, riesgo socio-económico, fortaleza financiera, riesgo país y de la industria, posicionamiento del mercado,transparencia y estándares y gobierno corporativo y competencia de la administración.
– Severidad de la Pérdida:
Consumo no revolvente - de acuerdo con el número de pagos incumplidos.

Comercial - considerando garantías reales financieras y no financieras y garantías personales.
– Exposición al Incumplimiento:
Consumo no revolvente - considera el saldo del crédito a la fecha de la calificación.
Comercial - para créditos revocables se considera el saldo del crédito a la fecha de la calificación. Para créditos irrevocables se toma en cuenta elnivel actual de utilización de la línea para estimar en cuanto aumentaría el uso de dicha línea en caso de incumplimiento.
g. Concentración de riesgo crediticio - Los instrumentos financieros que potencialmente exponen al riesgo de crédito a la Entidad,consisten en cuentas por cobrar a clientes. Para reducir el riesgo de crédito, la Entidad realiza evaluaciones en forma periódica respecto a lasituación financiera de sus clientes y les requiere garantías específicas. La Entidad considera que su concentración de riesgos de crédito esmínima dado el gran número de clientes y su dispersión geográfica. Adicionalmente, la Entidad considera que su riesgo de crédito potencial estáadecuadamente cubierto con la estimación preventiva para riesgos crediticios que ha constituido para tal fin.
h. Mobiliario y equipo, neto - Las adiciones de mobiliario y equipo, así como los gastos de instalación, se registran a su costo deadquisición. Los saldos que provienen de adquisiciones realizadas entre el 1 de enero de 1997 y hasta el 31 de diciembre de 2007 se actualizaronaplicando factores derivados del INPC hasta esa fecha. La depreciación se calcula conforme al método de línea recta con base en la vida útilremanente de los activos, como sigue:
%Equipo de transporte 33.33Equipo de oficina 20.00Equipo de cómputo 33.33Mejoras a locales arrendados 20.00Automóviles otorgados en arrendamiento operativo 20.00
i. Intereses y comisiones cobradas y pagadas - Los ingresos y gastos financieros provenientes de las inversiones, créditos recibidos ycomisiones, se reconocen en resultados conforme se devengan, incluyendo los derivados de contratos de menudeo con mensualidades vencidas,tal como lo indica el inciso e) de esta nota. Los intereses moratorios se registran en resultados hasta el momento en que se cobran.
Las comisiones cobradas por el otorgamiento inicial de créditos se registran como un crédito diferido, el cual se reconoce conforme se devengaen los resultados del ejercicio como un ingreso por intereses, durante la vida del crédito.
Las comisiones pagadas por la colocación de contratos de menudeo se registran dentro del rubro de Pagos anticipados y otros, y se amortizan enresultados conforme se devengan, en el rubro de Comisiones pagadas.
j. Transacciones en moneda extranjera - Las operaciones en moneda extranjera se registran al tipo de cambio vigente en la fecha dela operación. Los activos y pasivos en moneda extranjera se valúan en moneda nacional al tipo de cambio vigente a la fecha de los estadosfinancieros, las fluctuaciones cambiarias se registran en los resultados.
k. Bienes adjudicados - A través de peritos son considerados los precios de mercado sobre bienes similares en condiciones de usonormal y las condiciones de mercado que han imperado en bienes similares dentro del propio mercado por lo que el valor de bienes adjudicadosse reconocen a su costo o valor razonable deducido de los costos y gastos estrictamente indispensables que se eroguen en su adjudicación, el quesea menor. El perito determina el valor y lo presenta ante el juzgado basado en el estudio que realizó observando ciertas consideraciones como elvalor de bienes similares nuevos que imperan en el mercado, se validan los valores de reposición nuevos que existen en el mercado sobre bienessimilares, y dada la inmaterialidad en cifras y en volumen durante el año consideramos que otras revelaciones requeridas se consideran pocoimportantes. El monto de bienes adjudicados en 2016, 2015 y 2014 ascendió a $57, $100 y $0 respectivamente.
l. Provisiones - Se reconocen cuando se tiene una obligación presente como resultado de un evento pasado, que probablementeresulte en la salida de recursos económicos y que pueda ser estimada razonablemente.
m. Impuestos a la utilidad - El impuesto sobre la renta (ISR) se registra en los resultados del año en que se causan. Para reconocer elimpuesto diferido se determina si, con base en proyecciones financieras, la Entidad causará ISR y reconoce el impuesto diferido que corresponde.El impuesto diferido se reconoce aplicando la tasa correspondiente a las diferencias temporales que resultan de la comparación de los valorescontables y fiscales de los activos y pasivos, y en su caso, se incluyen los beneficios de las pérdidas fiscales por amortizar y de algunos créditosfiscales. El impuesto diferido activo se registra sólo cuando existe alta probabilidad de que pueda recuperarse.

n. Ingresos por intereses - Los ingresos por intereses se reconocen cuando es probable que los beneficios económicos fluyan hacia laEntidad y el importe de los ingresos pueda ser valuado confiablemente. Los ingresos por intereses se registran sobre una base periódica, conreferencia al saldo insoluto y a la tasa de interés efectiva aplicable, la cual es la tasa que exactamente descuenta los flujos de efectivo estimados arecibir a lo largo de la vida esperada del activo financiero y lo iguala con el importe neto en libros del activo financiero en su reconocimientoinicial.
o. Cuentas de orden - Representan los intereses devengados no cobrados de la cartera vencida, en tanto los créditos relativos semantengan en dicha cartera, el monto de las líneas de crédito autorizadas por la Entidad y no utilizados por el cliente y a partir del 2016 las rentasdevengadas no pagadas con mayor antigüedad a 30 días.
En las cuentas de orden se registran activos o compromisos que no forman parte del balance general de la Entidad ya que no se adquieren losderechos de los mismos o dichos compromisos no se reconocen como pasivo de la Entidad en tanto dichas eventualidades no se materialicen,respectivamente. Los importes acumulados en las cuentas de orden solo han sido sujetos a pruebas de auditoría cuando de su información sederiva un registro contable.

GM FINANCIAL DE MÉXICO, S.A. DE C. V.SOCIEDAD FINANCIERA DE OBJETO MULTIPLE, E.R.
(Millones de pesos al 31 de diciembre de 2016)
INFORME DE COMENTARIOS Y ANALISIS DE LA ADMINISTRACION
A) RESULTADOS DE OPERACIÓN TRIMESTRAL
Ingresos por intereses
Los rendimientos generados por financiamientos otorgados a mayoreo y menudeo, sedescriben y analizan a continuación:
Conceptos 31-dic-15 31-dic-16
Ingresos por intereses comercial $787 $943 $156 19.82%Ingresos por intereses al consumo $2,361 $3,648 $1,287 54.51%Otros ingresos por intereses $227 $322 $95 41.85%Ingresos por intereses $3,375 $4,913 $1,538 45.57%
Periodos VariacionesDec 15 / Dec 16
El aumento del 45.57% al cuarto trimestre de 2016 en relación al cuarto trimestre de2015 se debe principalmente a que los ingresos por intereses al consumo tuvieron unaumento del 54.51% en gran medida por el incremento de volumen de unidadesfinanciadas durante el 2016.
Gastos por intereses
Los gastos por intereses por préstamos de bancos y de otros organismos, se comparany analizan a continuación:
Conceptos 31-dic-15 31-dic-16
Gastos por intereses $1,026 $1,925 $899 87.62%
Gastos por intereses $1,026 $1,925 $899 87.62%
Periodos VariacionesDec 15 / Dec 16
Los gastos por intereses mostraron un incremento neto del 87.62% al cuarto trimestrede 2016 con respecto al cuarto trimestre de 2015. Esto se debe principalmente alincremento del balance de la deuda con respecto al mismo periodo de 2015 parasoportar el crecimiento de activos, principalmente de crédito al consumo.
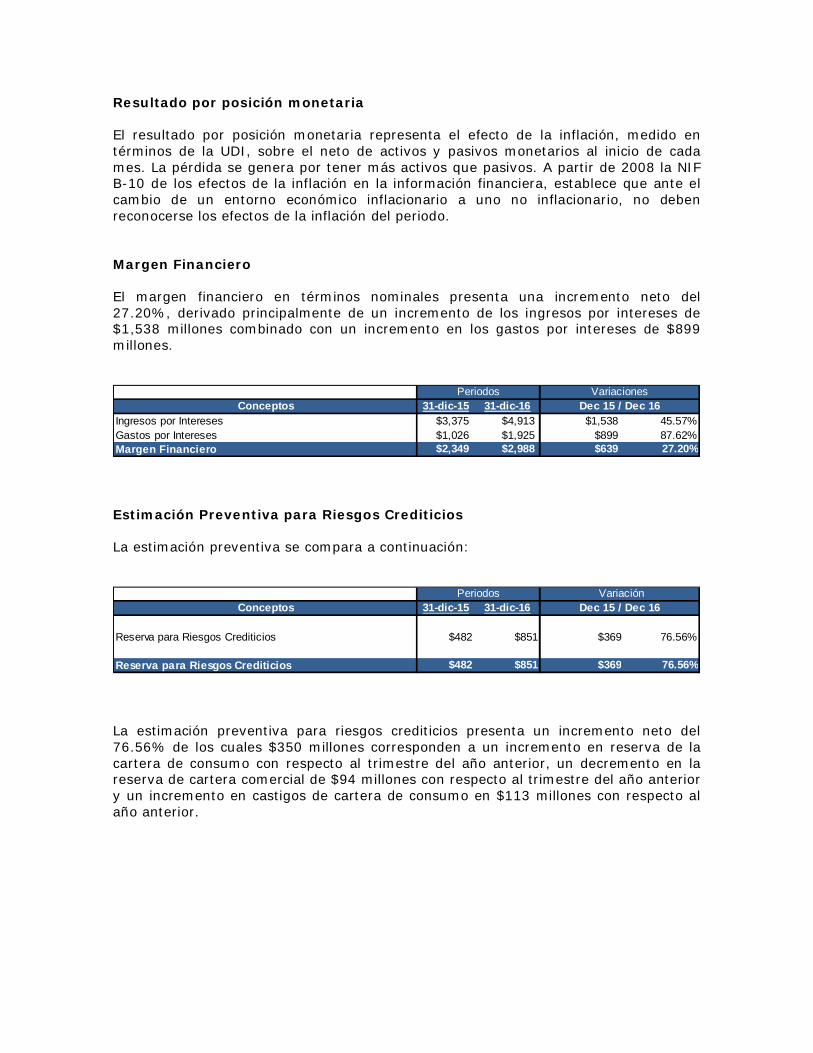
Resultado por posición monetaria
El resultado por posición monetaria representa el efecto de la inflación, medido entérminos de la UDI, sobre el neto de activos y pasivos monetarios al inicio de cadames. La pérdida se genera por tener más activos que pasivos. A partir de 2008 la NIFB-10 de los efectos de la inflación en la información financiera, establece que ante elcambio de un entorno económico inflacionario a uno no inflacionario, no debenreconocerse los efectos de la inflación del periodo.
Margen Financiero
El margen financiero en términos nominales presenta una incremento neto del27.20%, derivado principalmente de un incremento de los ingresos por intereses de$1,538 millones combinado con un incremento en los gastos por intereses de $899millones.
Conceptos 31-dic-15 31-dic-16Ingresos por Intereses $3,375 $4,913 $1,538 45.57%Gastos por Intereses $1,026 $1,925 $899 87.62%Margen Financiero $2,349 $2,988 $639 27.20%
Periodos VariacionesDec 15 / Dec 16
Estimación Preventiva para Riesgos Crediticios
La estimación preventiva se compara a continuación:
Conceptos 31-dic-15 31-dic-16
Reserva para Riesgos Crediticios $482 $851 $369 76.56%
Reserva para Riesgos Crediticios $482 $851 $369 76.56%
Dec 15 / Dec 16 Periodos Variación
La estimación preventiva para riesgos crediticios presenta un incremento neto del76.56% de los cuales $350 millones corresponden a un incremento en reserva de lacartera de consumo con respecto al trimestre del año anterior, un decremento en lareserva de cartera comercial de $94 millones con respecto al trimestre del año anteriory un incremento en castigos de cartera de consumo en $113 millones con respecto alaño anterior.
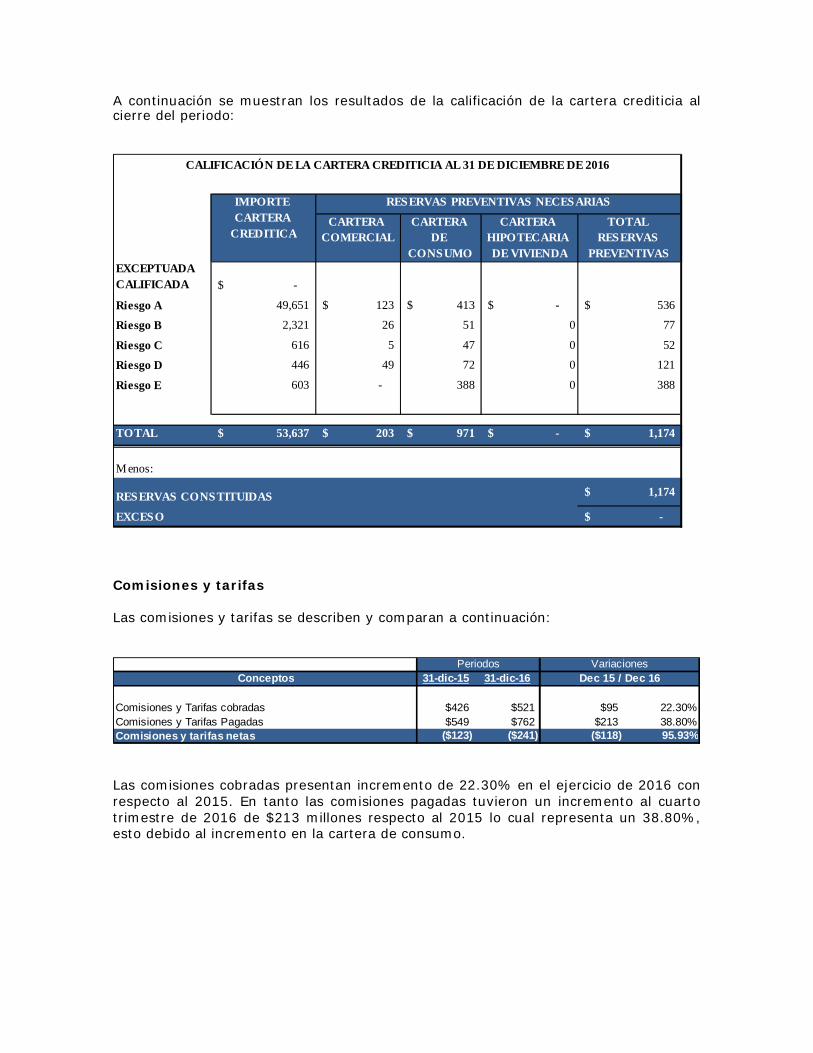
A continuación se muestran los resultados de la calificación de la cartera crediticia alcierre del periodo:
CARTERACOMERCIAL
CARTERADE
CONSUMO
CARTERAHIPOTECARIADE VIVIENDA
TOTALRESERVAS
PREVENTIVASEXCEPTUADACALIFICADA -$
Riesgo A 49,651 123$ 413$ -$ 536$
Riesgo B 2,321 26 51 0 77
Riesgo C 616 5 47 0 52
Riesgo D 446 49 72 0 121
Riesgo E 603 - 388 0 388
TOTAL 53,637$ 203$ 971$ -$ 1,174$
Menos:
RESERVAS CONSTITUIDAS 1,174$
EXCESO -$
CALIFICACIÓN DE LA CARTERA CREDITICIA AL 31 DE DICIEMBRE DE 2016
IMPORTECARTERA
CREDITICA
RESERVAS PREVENTIVAS NECESARIAS
Comisiones y tarifas
Las comisiones y tarifas se describen y comparan a continuación:
Conceptos 31-dic-15 31-dic-16
Comisiones y Tarifas cobradas $426 $521 $95 22.30%Comisiones y Tarifas Pagadas $549 $762 $213 38.80%Comisiones y tarifas netas ($123) ($241) ($118) 95.93%
Periodos VariacionesDec 15 / Dec 16
Las comisiones cobradas presentan incremento de 22.30% en el ejercicio de 2016 conrespecto al 2015. En tanto las comisiones pagadas tuvieron un incremento al cuartotrimestre de 2016 de $213 millones respecto al 2015 lo cual representa un 38.80%,esto debido al incremento en la cartera de consumo.

Gastos de Administración
La integración y análisis de los gastos de administración se muestran a continuación:
Conceptos 31-dic-15 31-dic-16
Remuneraciones $250 $279 $29 11.60%Honorarios $249 $388 $139 55.82%Rentas $14 $15 $1 7.14%Gastos de Promoción $16 $19 $3 18.75%Impuestos y derechos diversos $12 $33 $21 100.00%Otros gastos $262 $279 $17 6.49%Depreciación $15 $14 ($1) -6.67%Gastos de administración $818 $1,027 $209 25.55%
VariaciónDec 15 / Dec 16
Periodos
Los gastos de administración reflejan un incremento de 25.67% al cuarto trimestre de2016 en relación con el cuarto trimestre de 2015, este aumento es atribuidoprincipalmente a incremento en cargo corporativo y en remuneraciones.
Impuestos Causados y Diferidos
La comparación y análisis de los impuestos causados se muestran en la siguientetabla:
Conceptos 31-dic-15 31-dic-16
Impuesto Causado $399 $824 $425 106.52%Impuesto Diferido ($126) ($496) ($370) 293.65%Impuestos $273 $328 $55 20.15%
Periodos VariaciónDec 15 / Dec 16
El impuesto a la utilidad causado se determina mediante la aplicación de la legislaciónfiscal vigente sobre los ingresos gravables y deducciones autorizadas del ejercicio. Elimpuesto anual determinado se presenta como un pasivo a corto plazo neto de losanticipos efectuados durante el año, o como un activo en el caso de que los anticipossean superiores al impuesto anual determinado.
El impuesto a la utilidad diferido se determina aplicando el método de activos ypasivos. Bajo este método, a todas las diferencias que surgen entre los valorescontables y fiscales de los activos y pasivos, se les aplica la tasa del impuesto sobre larenta (ISR), vigente a la fecha de los estados financieros, o bien, aquellas tasasaprobadas a esa fecha y que estarán vigentes al momento en que se estima que losactivos y pasivos por impuesto a la utilidad diferido se recuperarán o se liquidarán. LaCompañía evalúa periódicamente la recuperabilidad de los activos por impuestodiferido, creando en su caso, una estimación sobre aquellos montos en los que noexiste una alta probabilidad de recuperación.
El impuesto causado y diferido es reconocido como un gasto en los resultados delejercicio, excepto cuando haya surgido de una transacción o suceso que se reconocefuera del resultado del ejercicio como otro resultado integral o una partida reconocidadirectamente en el capital contable.
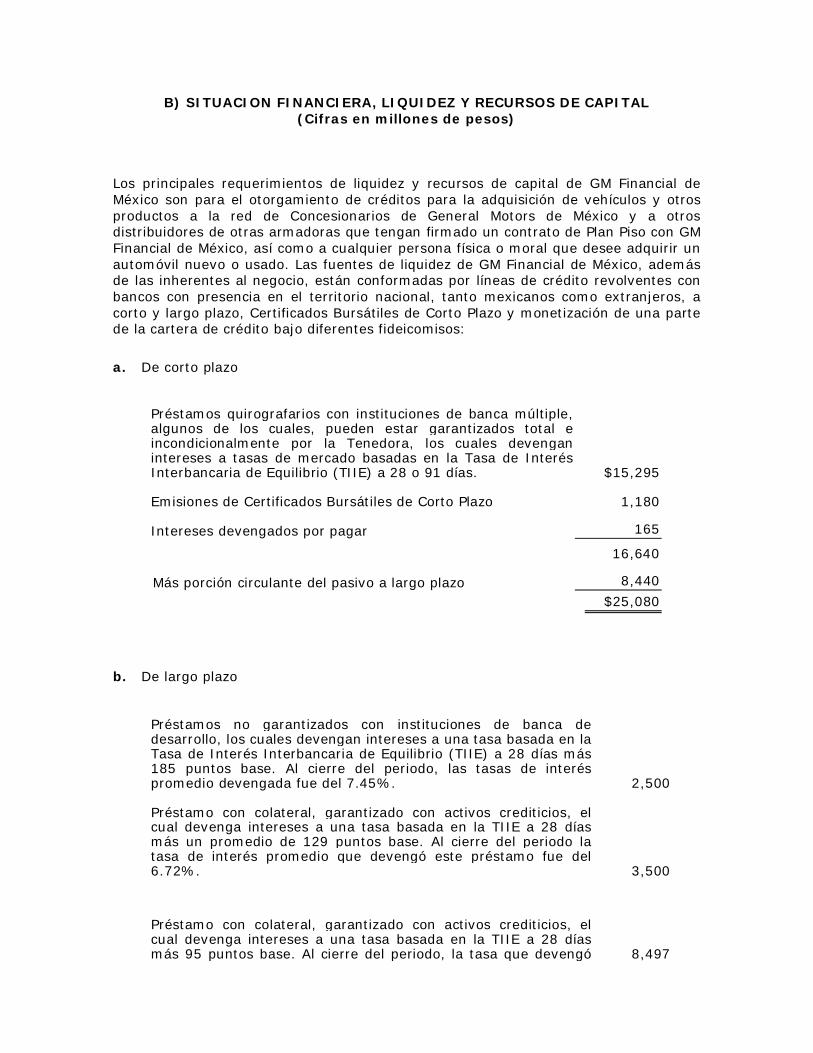
B) SITUACION FINANCIERA, LIQUIDEZ Y RECURSOS DE CAPITAL(Cifras en millones de pesos)
Los principales requerimientos de liquidez y recursos de capital de GM Financial deMéxico son para el otorgamiento de créditos para la adquisición de vehículos y otrosproductos a la red de Concesionarios de General Motors de México y a otrosdistribuidores de otras armadoras que tengan firmado un contrato de Plan Piso con GMFinancial de México, así como a cualquier persona física o moral que desee adquirir unautomóvil nuevo o usado. Las fuentes de liquidez de GM Financial de México, ademásde las inherentes al negocio, están conformadas por líneas de crédito revolventes conbancos con presencia en el territorio nacional, tanto mexicanos como extranjeros, acorto y largo plazo, Certificados Bursátiles de Corto Plazo y monetización de una partede la cartera de crédito bajo diferentes fideicomisos:
a. De corto plazo
Préstamos quirografarios con instituciones de banca múltiple,algunos de los cuales, pueden estar garantizados total eincondicionalmente por la Tenedora, los cuales devenganintereses a tasas de mercado basadas en la Tasa de InterésInterbancaria de Equilibrio (TIIE) a 28 o 91 días. $15,295
Emisiones de Certificados Bursátiles de Corto Plazo 1,180
Intereses devengados por pagar 165
16,640
Más porción circulante del pasivo a largo plazo 8,440$25,080
b. De largo plazo
Préstamos no garantizados con instituciones de banca dedesarrollo, los cuales devengan intereses a una tasa basada en laTasa de Interés Interbancaria de Equilibrio (TIIE) a 28 días más185 puntos base. Al cierre del periodo, las tasas de interéspromedio devengada fue del 7.45%. 2,500
Préstamo con colateral, garantizado con activos crediticios, elcual devenga intereses a una tasa basada en la TIIE a 28 díasmás un promedio de 129 puntos base. Al cierre del periodo latasa de interés promedio que devengó este préstamo fue del6.72%. 3,500
Préstamo con colateral, garantizado con activos crediticios, elcual devenga intereses a una tasa basada en la TIIE a 28 díasmás 95 puntos base. Al cierre del periodo, la tasa que devengó 8,497
este préstamo fue del 6.49%.
Préstamo garantizado con activos crediticios, el cual devengaintereses a una tasa basada en la TIIE a 28 días más 90 puntosbase. Al cierre del periodo, la tasa que devengó este préstamofue del 6.73%.
5,995Préstamo garantizado con activos crediticios, el cual al cierre delperiodo, la tasa que devengó fue del 6.42%
2,796
Pasivo a largo plazo 23,288
Menos - Porción circulante 8,440$14,848
El valor contable de los préstamos bancarios de corto plazo a cargo de la Compañía seaproxima a su valor razonable, y no se tienen intenciones de pagarlosanticipadamente. En relación a algunos préstamos de largo plazo con colateral, laCompañía puede estar obligada a mantener saldos de efectivo en garantía de estasoperaciones. Dicho efectivo genera intereses a favor de la Compañía a una tasa deinterés de mercado. Al cierre del periodo, dicho efectivo restringido generó ingresospor $51 millones los cuales se incluyen en el rubro Otros ingresos de la operación.
c. Los vencimientos de la porción a largo plazo de este pasivo al 31 de diciembre de2016, son:
2018 5,8802019 7,1742020 1,6952021 942022 5
$14,848
Se han contratado instrumentos financieros derivados para cubrir los riesgos de tasade interés de algunos de estos préstamos.Al cierre del periodo la Compañía mantiene una capacidad disponible, aun nodispuesta, tanto en sus líneas de crédito revolvente como para monetización decartera, por un monto de $1,016.
Al cierre del periodo, hemos aportado, en calidad de fideicomitentes, cierto porcentajede nuestra cartera a efecto de celebrar los siguientes contratos de fideicomiso:
(i) Contrato de Fideicomiso Maestro Irrevocable número F/804, celebrado el 24 deseptiembre de 2008 entre el Emisor, en su carácter de fideicomitente, BancoInvex, S.A., Institución de Banca Múltiple, Invex Grupo Financiero, Fiduciario,en su carácter de fiduciario, y Monex Casa de Bolsa, S.A. de C.V., Monex GrupoFinanciero, como representante común de los tenedores. En términosgenerales, en virtud de dicho fideicomiso se implementó un mecanismo parabursatilizar ciertas cuentas por cobrar aportadas al patrimonio de dichoFideicomiso F/804 por el Emisor.
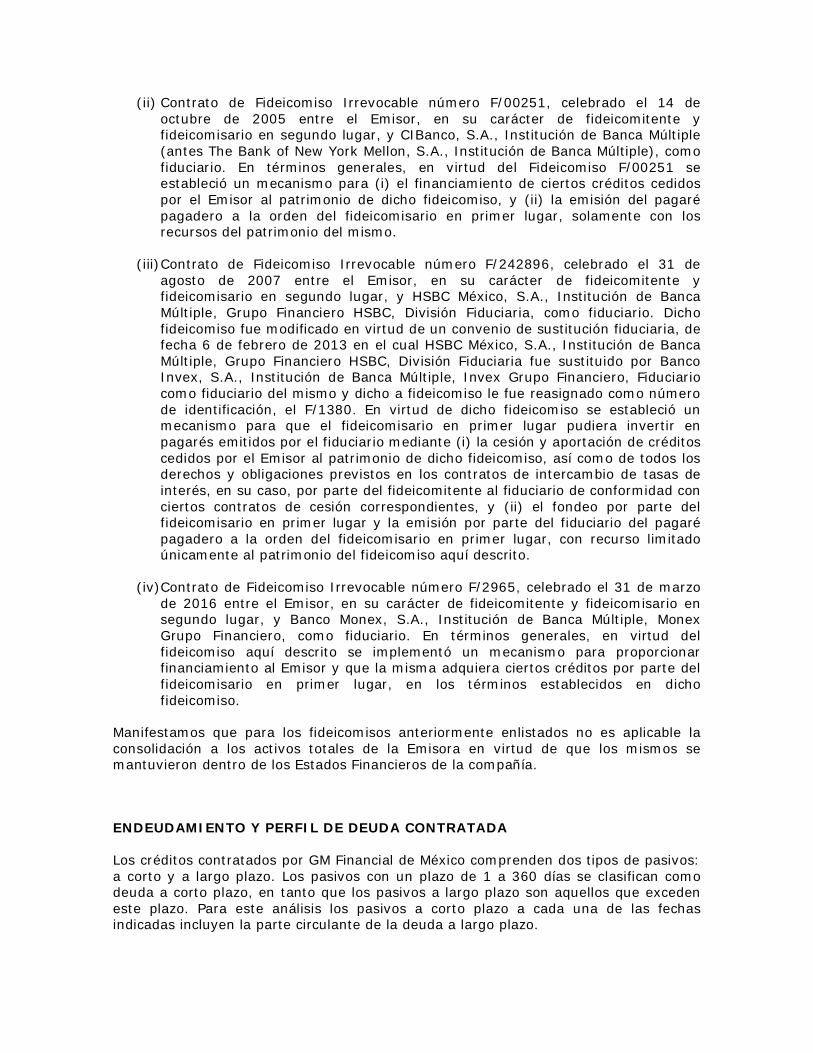
(ii) Contrato de Fideicomiso Irrevocable número F/00251, celebrado el 14 deoctubre de 2005 entre el Emisor, en su carácter de fideicomitente yfideicomisario en segundo lugar, y CIBanco, S.A., Institución de Banca Múltiple(antes The Bank of New York Mellon, S.A., Institución de Banca Múltiple), comofiduciario. En términos generales, en virtud del Fideicomiso F/00251 seestableció un mecanismo para (i) el financiamiento de ciertos créditos cedidospor el Emisor al patrimonio de dicho fideicomiso, y (ii) la emisión del pagarépagadero a la orden del fideicomisario en primer lugar, solamente con losrecursos del patrimonio del mismo.
(iii)Contrato de Fideicomiso Irrevocable número F/242896, celebrado el 31 deagosto de 2007 entre el Emisor, en su carácter de fideicomitente yfideicomisario en segundo lugar, y HSBC México, S.A., Institución de BancaMúltiple, Grupo Financiero HSBC, División Fiduciaria, como fiduciario. Dichofideicomiso fue modificado en virtud de un convenio de sustitución fiduciaria, defecha 6 de febrero de 2013 en el cual HSBC México, S.A., Institución de BancaMúltiple, Grupo Financiero HSBC, División Fiduciaria fue sustituido por BancoInvex, S.A., Institución de Banca Múltiple, Invex Grupo Financiero, Fiduciariocomo fiduciario del mismo y dicho a fideicomiso le fue reasignado como númerode identificación, el F/1380. En virtud de dicho fideicomiso se estableció unmecanismo para que el fideicomisario en primer lugar pudiera invertir enpagarés emitidos por el fiduciario mediante (i) la cesión y aportación de créditoscedidos por el Emisor al patrimonio de dicho fideicomiso, así como de todos losderechos y obligaciones previstos en los contratos de intercambio de tasas deinterés, en su caso, por parte del fideicomitente al fiduciario de conformidad conciertos contratos de cesión correspondientes, y (ii) el fondeo por parte delfideicomisario en primer lugar y la emisión por parte del fiduciario del pagarépagadero a la orden del fideicomisario en primer lugar, con recurso limitadoúnicamente al patrimonio del fideicomiso aquí descrito.
(iv)Contrato de Fideicomiso Irrevocable número F/2965, celebrado el 31 de marzode 2016 entre el Emisor, en su carácter de fideicomitente y fideicomisario ensegundo lugar, y Banco Monex, S.A., Institución de Banca Múltiple, MonexGrupo Financiero, como fiduciario. En términos generales, en virtud delfideicomiso aquí descrito se implementó un mecanismo para proporcionarfinanciamiento al Emisor y que la misma adquiera ciertos créditos por parte delfideicomisario en primer lugar, en los términos establecidos en dichofideicomiso.
Manifestamos que para los fideicomisos anteriormente enlistados no es aplicable laconsolidación a los activos totales de la Emisora en virtud de que los mismos semantuvieron dentro de los Estados Financieros de la compañía.
ENDEUDAMIENTO Y PERFIL DE DEUDA CONTRATADA
Los créditos contratados por GM Financial de México comprenden dos tipos de pasivos:a corto y a largo plazo. Los pasivos con un plazo de 1 a 360 días se clasifican comodeuda a corto plazo, en tanto que los pasivos a largo plazo son aquellos que excedeneste plazo. Para este análisis los pasivos a corto plazo a cada una de las fechasindicadas incluyen la parte circulante de la deuda a largo plazo.
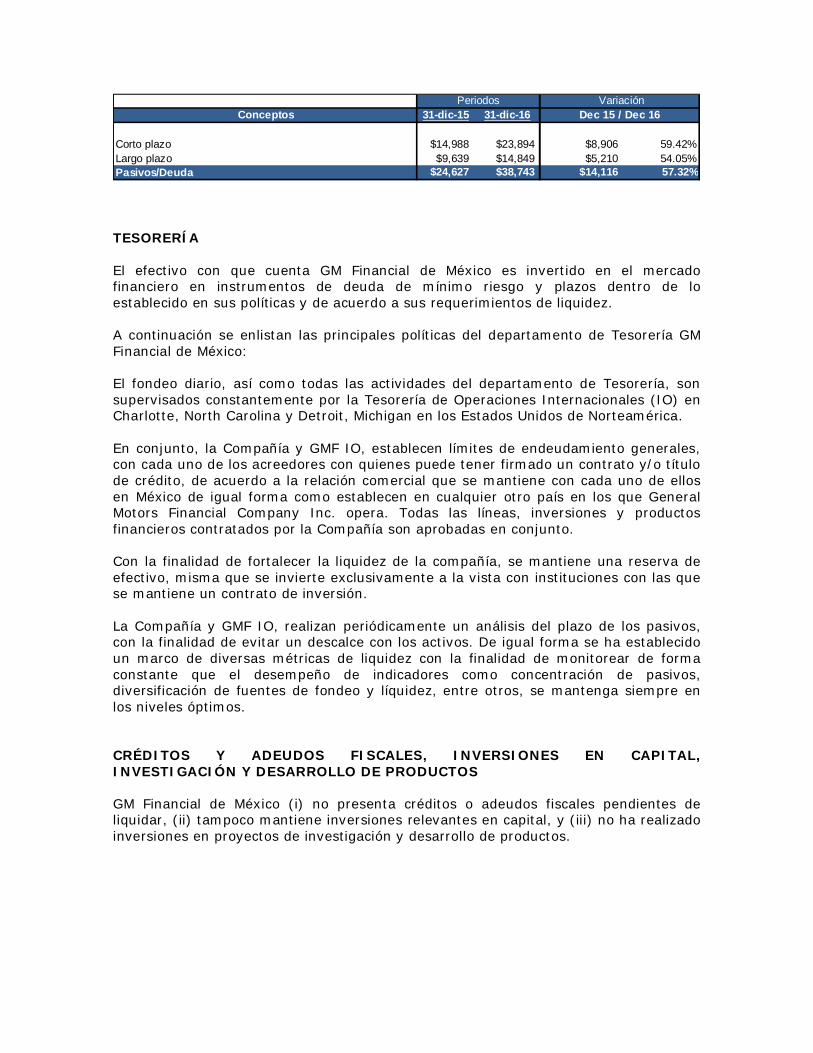
Conceptos 31-dic-15 31-dic-16
Corto plazo $14,988 $23,894 $8,906 59.42%Largo plazo $9,639 $14,849 $5,210 54.05%Pasivos/Deuda $24,627 $38,743 $14,116 57.32%
Dec 15 / Dec 16 Periodos Variación
TESORERÍA
El efectivo con que cuenta GM Financial de México es invertido en el mercadofinanciero en instrumentos de deuda de mínimo riesgo y plazos dentro de loestablecido en sus políticas y de acuerdo a sus requerimientos de liquidez.
A continuación se enlistan las principales políticas del departamento de Tesorería GMFinancial de México:
El fondeo diario, así como todas las actividades del departamento de Tesorería, sonsupervisados constantemente por la Tesorería de Operaciones Internacionales (IO) enCharlotte, North Carolina y Detroit, Michigan en los Estados Unidos de Norteamérica.
En conjunto, la Compañía y GMF IO, establecen límites de endeudamiento generales,con cada uno de los acreedores con quienes puede tener firmado un contrato y/o títulode crédito, de acuerdo a la relación comercial que se mantiene con cada uno de ellosen México de igual forma como establecen en cualquier otro país en los que GeneralMotors Financial Company Inc. opera. Todas las líneas, inversiones y productosfinancieros contratados por la Compañía son aprobadas en conjunto.
Con la finalidad de fortalecer la liquidez de la compañía, se mantiene una reserva deefectivo, misma que se invierte exclusivamente a la vista con instituciones con las quese mantiene un contrato de inversión.
La Compañía y GMF IO, realizan periódicamente un análisis del plazo de los pasivos,con la finalidad de evitar un descalce con los activos. De igual forma se ha establecidoun marco de diversas métricas de liquidez con la finalidad de monitorear de formaconstante que el desempeño de indicadores como concentración de pasivos,diversificación de fuentes de fondeo y líquidez, entre otros, se mantenga siempre enlos niveles óptimos.
CRÉDITOS Y ADEUDOS FISCALES, INVERSIONES EN CAPITAL,INVESTIGACIÓN Y DESARROLLO DE PRODUCTOS
GM Financial de México (i) no presenta créditos o adeudos fiscales pendientes deliquidar, (ii) tampoco mantiene inversiones relevantes en capital, y (iii) no ha realizadoinversiones en proyectos de investigación y desarrollo de productos.

C) DESCRIPCIÓN DEL SISTEMA DE CONTROL INTERNO
Las políticas de General Motors Financial Company Inc. y los controles internos de cadadepartamento están diseñados para asegurar el cumplimiento de las regulacionesaplicables en cada país en donde opera.
GM Financial de México cuenta con un departamento de control interno, el cual tiene asu cargo vigilar, a través de pruebas aleatorias, un buen funcionamiento en cuestiónde procesos operativos y elaboración de Estados Financieros con el fin de obtener unacerteza razonable en cuanto al ambiente de control que prevalece en la misma.
Por otro lado, GM Financial de México cuenta con los procedimientos y manuales quedescriben la autoridad, responsabilidad, así como métodos para supervisar y darcumplimiento a las políticas y procedimientos, incluyendo la función de auditoríainterna.
Adicionalmente, GMF cuenta con el soporte de auditores externos y auditoresinternos corporativos de GMF a nivel internacional, que validan una seguridadrazonable a los controles internos de la compañía.

INFORMACIÓN FINANCIERATRIMESTRAL DE GENERAL MOTORS
FINANCIAL COMPANY, INC.

GENERAL MOTORS FINANCIAL COMPANY, INC.
REPORT OF INDEPENDENT REGISTERED PUBLIC ACCOUNTING FIRM
To the Board of Directors and Shareholder of
General Motors Financial Company, Inc.:
We have audited the accompanying consolidated balance sheets of General Motors Financial Company, Inc. and subsidiaries (the"Company") as of December 31, 2016 and 2015, and the related consolidated statements of income and comprehensive income,shareholder's equity, and cash flows for each of the three years in the period ended December 31, 2016. These financial statements arethe responsibility of the Company's management. Our responsibility is to express an opinion on these financial statements based onour audits.
We conducted our audits in accordance with the standards of the Public Company Accounting Oversight Board (United States). Thosestandards require that we plan and perform the audit to obtain reasonable assurance about whether the financial statements are free ofmaterial misstatement. The Company is not required to have, nor were we engaged to perform, an audit of its internal control overfinancial reporting. Our audits included consideration of internal control over financial reporting as a basis for designing auditprocedures that are appropriate in the circumstances, but not for the purpose of expressing an opinion on the effectiveness of theCompany's internal control over financial reporting. Accordingly, we express no such opinion. An audit also includes examining, on atest basis, evidence supporting the amounts and disclosures in the financial statements, assessing the accounting principles used andsignificant estimates made by management, as well as evaluating the overall financial statement presentation. We believe that ouraudits provide a reasonable basis for our opinion.
In our opinion, such consolidated financial statements present fairly, in all material respects, the financial position of General MotorsFinancial Company, Inc. and subsidiaries at December 31, 2016 and 2015, and the results of their operations and their cash flows foreach of the three years in the period ended December 31, 2016, in conformity with accounting principles generally accepted in theUnited States of America.
/s/ Deloitte & Touche LLPFort Worth, TexasFebruary 7, 2017

GENERAL MOTORS FINANCIAL COMPANY, INC.
Item 8. Financial Statements and Supplementary Data
CONSOLIDATED BALANCE SHEETS(dollars in millions)
December 31, 2016 December 31, 2015
ASSETSCash and cash equivalents
$ 3,201 $ 3,061Finance receivables, net (Note 4; Note 9 VIEs)
43,190 36,781Leased vehicles, net (Note 5; Note 9 VIEs)
34,526 20,172Goodwill (Note 6)
1,196 1,189Equity in net assets of non-consolidated affiliates (Note 7)
944 986Property and equipment, net of accumulated depreciation of $127 and $91
279 219Deferred income taxes (Note 14)
274 231Related party receivables (Note 2)
510 573Other assets (Note 9 VIEs)
3,645 2,692Total assets
$ 87,765 $ 65,904LIABILITIES AND SHAREHOLDER'S EQUITYLiabilities
Secured debt (Note 8; Note 9 VIEs)$ 39,270 $ 30,689
Unsecured debt (Note 8)34,606 23,657
Accounts payable and accrued expenses1,474 1,218
Deferred income2,365 1,454
Deferred income taxes (Note 14)220 129
Related party payables (Note 2)400 362
Other liabilities737 343
Total liabilities79,072 57,852
Commitments and contingencies (Note 11)Shareholder's equityCommon stock, $1.00 par value per share, 1,000 shares authorized and 505 shares
issued — —Additional paid-in capital
6,505 6,484Accumulated other comprehensive loss (Note 17) (1,238) (1,104)Retained earnings
3,426 2,672Total shareholder's equity
8,693 8,052Total liabilities and shareholder's equity
$ 87,765 $ 65,904
The accompanying notes are an integral part of these consolidated financial statements.

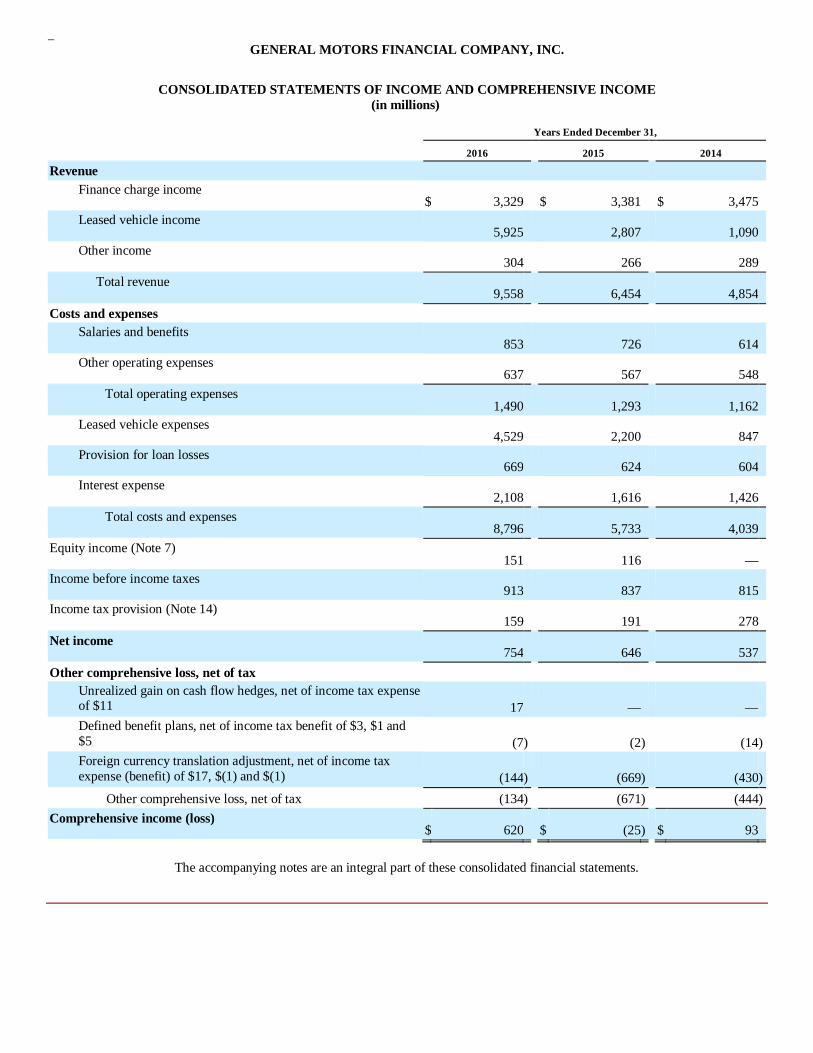
GENERAL MOTORS FINANCIAL COMPANY, INC.
CONSOLIDATED STATEMENTS OF INCOME AND COMPREHENSIVE INCOME(in millions)
Years Ended December 31,
2016 2015 2014
RevenueFinance charge income
$ 3,329 $ 3,381 $ 3,475Leased vehicle income
5,925 2,807 1,090Other income
304 266 289Total revenue
9,558 6,454 4,854Costs and expenses
Salaries and benefits853 726 614
Other operating expenses637 567 548
Total operating expenses1,490 1,293 1,162
Leased vehicle expenses4,529 2,200 847
Provision for loan losses669 624 604
Interest expense2,108 1,616 1,426
Total costs and expenses8,796 5,733 4,039
Equity income (Note 7)151 116 —
Income before income taxes913 837 815
Income tax provision (Note 14)159 191 278
Net income754 646 537
Other comprehensive loss, net of taxUnrealized gain on cash flow hedges, net of income tax expenseof $11 17 — —Defined benefit plans, net of income tax benefit of $3, $1 and$5 (7) (2) (14)Foreign currency translation adjustment, net of income taxexpense (benefit) of $17, $(1) and $(1) (144) (669) (430)
Other comprehensive loss, net of tax (134) (671) (444)Comprehensive income (loss)
$ 620 $ (25) $ 93
The accompanying notes are an integral part of these consolidated financial statements.

GENERAL MOTORS FINANCIAL COMPANY, INC.
CONSOLIDATED STATEMENTS OF SHAREHOLDER'S EQUITY(dollars in millions)
Years Ended December 31,
2016 2015 2014
Common stock sharesBalance at the beginning of period
505 505 502Common stock issued
— — 3Balance at the end of period
505 505 505Common stock amount
Balance at the beginning of period$ — $ — $ —
Common stock issued— — —
Balance at the end of period$ — $ — $ —
Additional paid-in capitalBalance at the beginning of period
$ 6,484 $ 5,799 $ 4,785Stock-based compensation expense
21 35 18Capital contributions from related party
— 649 996Differences between tax payments due under consolidated return
and separate return basis — 1 —Balance at the end of period
$ 6,505 $ 6,484 $ 5,799Accumulated other comprehensive loss
Balance at the beginning of period$ (1,104) $ (433) $ 11
Other comprehensive loss, net of tax (134) (671) (444)Balance at the end of period $ (1,238) $ (1,104) $ (433)
Retained earningsBalance at the beginning of period
$ 2,672 $ 2,026 $ 1,489Net income
754 646 537Balance at the end of period
$ 3,426 $ 2,672 $ 2,026
The accompanying notes are an integral part of these consolidated financial statements.

GENERAL MOTORS FINANCIAL COMPANY, INC.
CONSOLIDATED STATEMENTS OF CASH FLOWS(in millions)
Years Ended December 31,
2016 2015 2014Cash flows from operating activities
Net income$ 754 $ 646 $ 537
Adjustments to reconcile net income to net cash provided by operating activities
Depreciation and amortization4,839 2,403 992
Accretion and amortization of loan and leasing fees (1,172) (609) (363)Amortization of carrying value adjustment (29) (149) (234)Undistributed earnings of non-consolidated affiliates, net
(22) (116) —Provision for loan losses
669 624 604Deferred income taxes
42 132 (83)Stock-based compensation expense
25 36 19Other operating activities
1 (37) 182Changes in assets and liabilities, net of assets and liabilities acquired:
Other assets (443) (375) (85)Accounts payable and accrued expenses
214 282 133Taxes payable (2) (20) (63)Related party taxes payable
— (636) (7)Related party payables
5 (13) 5Net cash provided by operating activities
4,881 2,168 1,637Cash flows from investing activities
Purchases of retail finance receivables, net (17,796) (17,517) (14,749)Principal collections and recoveries on retail finance receivables
13,172 11,726 10,860Net funding of commercial finance receivables (2,981) (1,017) (1,898)Purchases of leased vehicles, net (19,612) (15,337) (4,882)Proceeds from termination of leased vehicles
2,557 1,096 533Acquisition of international operations
— (1,049) (46)Disposition of equity interest
— 125 —
Purchases of property and equipment (107) (90) (52)Other investing activities
(7) 30 (2)Net cash used in investing activities (24,774) (22,033) (10,236)Cash flows from financing activities
Net change in debt (original maturities less than three months)780 1,147 470
Borrowings and issuance of secured debt29,421 22,385 21,080
Payments on secured debt (20,266) (15,178) (16,890)Borrowings and issuance of unsecured debt
13,282 12,977 7,174Payments on unsecured debt (2,837) (1,709) (1,889)Borrowings on related party line of credit
418 — —Payments on related party line of credit
(418) — —

Capital contributions— 649 996
Debt issuance costs (146) (155) (127)Other
— 1 —Net cash provided by financing activities
20,234 20,117 10,814Net increase in cash, cash equivalents and restricted cash
341 252 2,215Effect of foreign exchange rate changes on cash, cash equivalents and restricted cash (41) (295) (201)Cash, cash equivalents and restricted cash at beginning of period
5,002 5,045 3,031Cash, cash equivalents and restricted cash at end of period
$ 5,302 $ 5,002 $ 5,045
The following table provides a reconciliation of cash, cash equivalents and restricted cash reported within the consolidated balancesheet:
December 31, 2016 December 31, 2015
Cash and cash equivalents $ 3,201 $ 3,061
Restricted cash included in other assets 2,101 1,941
Total cash, cash equivalents and restricted cash as presented in the consolidated statements of cash flows $ 5,302 $ 5,002
The accompanying notes are an integral part of these consolidated financial statements.

GENERAL MOTORS FINANCIAL COMPANY, INC.
NOTES TO CONSOLIDATED FINANCIAL STATEMENTS
Note 1. Summary of Significant Accounting Policies
History and OperationsWe were formed on August 1, 1986 and have been a wholly-owned subsidiary of GM since October 2010.We acquired Ally Financial's auto finance and financial services operations in Europe and Latin America in 2013. Additionally, onJanuary 2, 2015, we acquired an equity interest in SAIC-GMAC, a joint venture that conducts business in China, from Ally Financial.
Basis of PresentationThe consolidated financial statements include our accounts and the accounts of our wholly-owned subsidiaries,including certain special-purpose financing entities utilized in secured financing transactions, which are considered VIEs. Allintercompany transactions and accounts have been eliminated in consolidation. Except as otherwise specified, dollar amountspresented within tables are stated in millions.
The preparation of financial statements in conformity with U.S. GAAP requires management to make estimates and assumptionswhich affect the reported amounts of assets and liabilities and the disclosures of contingent assets and liabilities as of the date of thefinancial statements and the amount of revenue and expenses during the reporting periods. Actual results could differ from thoseestimates and those differences may be material. These estimates include, among other things, the determination of the allowance forloan losses on finance receivables, estimated residual value of leased vehicles, goodwill and income taxes.
Generally, the financial statements of entities that operate outside of the U.S. are measured using the local currency as thefunctional currency. All assets and liabilities of the foreign subsidiaries are translated into U.S. dollars at period-end exchange ratesand the results of operations and cash flows are determined using approximate weighted-average exchange rates for the period.Translation adjustments are related to the foreign subsidiaries using local currency as their functional currency and are reported as aseparate component of accumulated other comprehensive income/loss. Foreign currency transaction gains or losses are recordeddirectly to the consolidated statements of income and comprehensive income, regardless of whether such amounts are realized orunrealized. We may enter into foreign currency derivatives to mitigate our exposure to changes in foreign currency exchange rates.
Net Presentation of Cash Flows on Commercial Finance Receivables and Related DebtOur commercial finance receivables areprimarily comprised of floorplan financing, which are loans to dealers to finance vehicle inventory, also known as wholesale orinventory financing. In our experience, these loans are typically repaid in less than 90 days of when the credit is extended.Furthermore, we typically have the unilateral ability to call the loans and receive payment within 60 days of the call. Therefore, thepresentation of the cash flows related to commercial finance receivables are reflected on the consolidated statements of cash flows as"Net funding of commercial finance receivables."
We have revolving debt agreements to finance our commercial lending activities. The revolving period of these agreementsranges from 6 to 24 months; however, the terms of these financing agreements require that a borrowing base of eligible floorplanreceivables, within certain concentration limits, must be maintained in sufficient amounts to support advances. When a dealer repaysa floorplan receivable to us, either the amount advanced against such receivables must be repaid by us or else the equivalent amount innew receivables must be added to the borrowing base. Despite the revolving term exceeding 90 days, the actual term for repayment ofadvances under these agreements is when we receive repayment from the dealers, which is typically within 90 days of when the creditis extended. Therefore, the cash flows related to these revolving debt agreements are reflected on the consolidated statements of cashflows as “Net change in debt (original maturities less than three months).”
Cash EquivalentsCash equivalents are defined as short-term, highly liquid securities with original maturities of 90 days or less.
Retail Finance Receivables and the Allowance for Loan Losses Our retail finance receivables portfolio consists of smaller-balance,homogeneous loans which are carried at amortized cost, net of allowance for loan losses. These loans are divided among pools basedon common risk characteristics, such as internal credit score, origination period, delinquent status and geography. An internal creditscore, of which FICO is an input in North America, is created by using algorithms or statistical models contained in originationscorecards. The scorecards are used to evaluate a consumer’s ability to pay based on statistical modeling of their prior credit usage,structure of the loan and other information. The output of the scorecards rank-order consumers from those that are most likely to payto those that are least likely to pay. By further dividing the portfolio into pools based on internal credit scores we are better able todistinguish expected credit performance for different credit risks. These pools are collectively evaluated for impairment based on astatistical calculation, which is supplemented by management judgment. The allowance is aggregated for each of the pools. Provisionsfor loan losses are charged to operations in amounts sufficient to maintain the allowance for loan losses at levels considered adequateto cover probable losses inherent in our finance receivables.

GENERAL MOTORS FINANCIAL COMPANY, INC.
NOTES TO CONSOLIDATED FINANCIAL STATEMENTS - (Continued)
We use a combination of forecasting methodologies to determine the allowance for loan losses, including roll rate modeling andstatic pool modeling techniques. A roll rate model is generally used to project near term losses and static pool models are generallyused to project losses over the remaining life. Probable losses are estimated for groups of accounts aggregated by past-due status andorigination month. Generally, loss experience over the last 10 years is evaluated. Recent performance is more heavily weighted whendetermining the allowance to result in an estimate that is more reflective of the current internal and external environments. Factors thatare considered when estimating the allowance include historical delinquency migration to loss, probability of default ("PD") and lossgiven default ("LGD"). PD and LGD are specifically estimated for each monthly vintage (i.e., group of originations) in cases wherevintage models are used. PD is estimated based on expectations that are aligned with internal credit scores. LGD is projected based onhistorical trends experienced over the last 10 years, weighted toward more recent performance in order to consider recent marketsupply and demand factors that impact wholesale used vehicle pricing. While forecasted probable losses are quantitatively derived, weassess the recent internal operating and external environments and may qualitatively adjust certain assumptions to result in anallowance that is more reflective of losses that are expected to occur in the current environment.
We also use historical charge-off experience to determine a loss confirmation period ("LCP"). The LCP is a key assumptionwithin our models and represents the average amount of time between when a loss event first occurs to when the receivable ischarged-off. This LCP is the basis of our allowance and is applied to the forecasted probable credit losses to determine the amount oflosses we believe exist at the balance sheet date.
We believe these factors are relevant in estimating incurred losses and also consider an evaluation of overall portfolio creditquality based on indicators such as changes in our credit evaluation, underwriting and collection management policies, changes in thelegal and regulatory environment, general economic conditions and business trends and uncertainties in forecasting and modelingtechniques used in estimating our allowance. We update our retail loss forecast models and portfolio indicators on a quarterly basis toincorporate information reflective of the current economic environment.
Assumptions regarding credit losses and LCPs are reviewed periodically and may be impacted by actual performance of financereceivables and changes in any of the factors discussed above. Should the credit loss assumption or LCP increase, there would be anincrease in the amount of allowance for loan losses required, which would decrease the net carrying value of finance receivables andincrease the amount of provision for loan losses.
Finance receivables that are considered impaired, including troubled debt restructurings ("TDRs") are individually evaluated forimpairment. In assessing the risk of individually impaired loans such as TDRs, among the factors we consider are the financialcondition of the borrower, geography, collateral performance, historical loss experience, and industry-specific information thatmanagement believes is relevant in determining the occurrence of a loss event and measuring impairment. These factors are based onan evaluation of historical and current information, and involve subjective assessment and interpretation.
Commercial Finance Receivables and the Allowance for Loan LossesOur commercial lending offerings consist of floorplanfinancing as well as dealer loans, which are loans to finance improvements to dealership facilities, to provide working capital, and topurchase and/or finance dealership real estate.
Commercial finance receivables are carried at amortized cost, net of allowance for loan losses. Provisions for loan losses arecharged to operations in amounts sufficient to maintain the allowance for loan losses at levels considered adequate to cover probablecredit losses inherent in the commercial finance receivables. For the International Segment, we established the allowance for loanlosses based on historical loss experience. Since we began offering commercial lending in the North America Segment in 2012, wehave performed an analysis of the experience of comparable commercial lenders in order to estimate probable credit losses inherent inour portfolio. The commercial finance receivables are aggregated into loan-risk pools, which are determined based on ourinternally-developed risk rating system. Based upon our risk ratings, we also determine if any specific dealer loan is consideredimpaired. If impaired loans are identified, specific reserves are established, as appropriate, and the loan is segregated for separatemonitoring.
Charge-off PolicyOur policy is to charge off a retail account in the month in which the account becomes 120 days contractuallydelinquent if we have not yet recorded a repossession charge-off. In the North America Segment, we charge off accounts inrepossession when the automobile is repossessed and legally available for disposition. In the International Segment, we charge offaccounts when the repossession process is started.
Commercial finance receivables are individually evaluated and, where collectability of the recorded balance is in doubt, arewritten down to the fair value of the collateral less costs to sell. Commercial receivables are charged off at the earlier of when they aredeemed uncollectible or reach 360 days past due.
GENERAL MOTORS FINANCIAL COMPANY, INC.
NOTES TO CONSOLIDATED FINANCIAL STATEMENTS - (Continued)
Troubled Debt RestructuringsIn evaluating whether a loan modification constitutes a TDR, our policy for retail loans is that both ofthe following must exist: (i) the modification constitutes a concession; and (ii) the debtor is experiencing financial difficulties. Inaccordance with our policies and guidelines, we, at times, offer payment deferrals to customers. Each deferral allows the consumer tomove up to two delinquent monthly payments to the end of the loan generally by paying a fee (approximately the interest portion ofthe payment deferred, except where state law provides for a lesser amount). A loan that is deferred two or more times would beconsidered significantly delayed and therefore meets the definition of a concession. A loan currently in payment default as the resultof being delinquent would also represent a debtor experiencing financial difficulties. Therefore, considering these two factors, we havedetermined that the second deferment granted by us on a retail loan will be considered a TDR and the loan impaired. Accounts inChapter 13 bankruptcy that have an interest rate or principal adjustment as part of a confirmed bankruptcy plan would also beconsidered TDRs. Retail finance receivables that become classified as TDRs are separately assessed for impairment. A specificallowance is estimated based on the present value of expected cash flows of the receivable discounted at the loan's original effectiveinterest rate.
Commercial receivables subject to forbearance, moratoriums, extension agreements, or other actions intended to minimizeeconomic loss and to avoid foreclosure or repossession of collateral are classified as TDRs. We do not grant concessions on theprincipal balance of dealer loans.
Variable Interest Entities – Securitizations and Credit FacilitiesWe finance our loan and lease origination volume through the useof our credit facilities and execution of securitization transactions, which both utilize special purpose entities ("SPEs"). In our creditfacilities, we transfer finance receivables or lease-related assets to special purpose finance subsidiaries. These subsidiaries, in turn,issue notes to the agents, collateralized by such assets and cash. The agents provide funding under the notes to the subsidiariespursuant to an advance formula, and the subsidiaries forward the funds to us in consideration for the transfer of the assets.
In our securitizations, we transfer finance receivables or lease-related assets to SPEs structured as securitization trusts ("Trusts"),which issue one or more classes of asset-backed securities. The asset-backed securities are in turn sold to investors.
Our continuing involvement with the credit facilities and Trusts consist of servicing assets held by the SPEs and holding residualinterests in the SPEs. These transactions are structured without recourse. The SPEs are considered VIEs under U.S. GAAP and areconsolidated because we have: (i) power over the significant activities of the entities and (ii) an obligation to absorb losses or the rightto receive benefits from the VIEs which could be significant to the VIEs. Accordingly, we are the primary beneficiary of the VIEs andthe finance receivables, leasing related assets, borrowings under our credit facilities and, following a securitization, the relatedsecuritization notes payable remain on the consolidated balance sheets. Refer toNote 4 - "Finance Receivables,"Note 8 - "Debt"andNote 9 - "Variable Interest Entities" to our consolidated financial statements for further information.
We are not required, and do not currently intend, to provide any additional financial support to SPEs. While these subsidiaries areincluded in our consolidated financial statements, these subsidiaries are separate legal entities and the finance receivables and otherassets held by these subsidiaries are legally owned by them and are not available to our creditors or creditors of our other subsidiaries.
We recognize finance charge, lease vehicle and fee income on the securitized assets and interest expense on the secured debtissued in securitization transactions, and record a provision for loan losses to recognize probable loan losses inherent in the securitizedassets. Cash pledged to support securitization transactions is deposited to a restricted account and recorded on our consolidatedbalance sheets as restricted cash, which is invested in highly liquid securities with original maturities of 90 days or less.
Property and Equipment Property and equipment additions are carried at amortized cost. Depreciation is generally provided on astraight-line basis over the estimated useful lives of the assets, which ranges from 1 to 30 years. The basis of assets sold or retired andthe related accumulated depreciation are removed from the accounts at the time of disposition and any resulting gain or loss isincluded in operations. Maintenance, repairs and minor replacements are charged to operations as incurred; major replacements andimprovements are capitalized.
Leased Vehicles Leased vehicles consist of automobiles leased to customers and are carried at amortized cost less manufacturersubvention payments, which are received up front. Depreciation expense is recorded on a straight-line basis over the term of the leaseagreement. Manufacturer subvention is recognized on a straight-line basis as a reduction to depreciation expense. Leased vehicles aredepreciated to the estimated residual value at the end of the lease term. Under the accounting for impairment or disposal of long-livedassets, residual values of operating leases are evaluated individually for impairment when indicators of impairment exist. Whenindicators of impairment exist and aggregate future cash flows from the operating lease, including the expected realizable fair value ofthe leased asset at the end of the lease, are less than the book value of the lease, an immediate impairment
GENERAL MOTORS FINANCIAL COMPANY, INC.
NOTES TO CONSOLIDATED FINANCIAL STATEMENTS - (Continued)
write-down is recognized if the difference is deemed not recoverable. Otherwise, reductions in the expected residual value result inadditional depreciation of the leased asset over the remaining term of the lease. Upon disposition, a gain or loss is recorded for anydifference between the net book value of the lease and the proceeds from the disposition of the asset, including any insuranceproceeds.
GoodwillThe excess of the purchase price of the merger with GM over the fair value of the net assets acquired was recorded asgoodwill, and was attributed to the North America reporting unit, which was our only reporting unit at that time. With the acquisitionof the international operations, we added two additional reporting units: Latin America and Europe. The excess of the purchase priceof the acquisition of the international operations over the fair value of the net assets acquired was all attributed to the Latin Americareporting unit. We performed our annual goodwill impairment testing as of October 1, 2016 for each reporting unit.
For the North America reporting unit, which represents 92% of our goodwill balance, we determined the fair value withconsideration to valuations under the income approach, weighted 75%, and the market approach, weighted 25%. The income approachevaluates the cash flow of the reporting unit over a specified time, discounted at an appropriate market rate to arrive at an indication ofthe most probable selling price. Factors contributing to the determination of the reporting unit's operating performance were historicalperformance and management's estimates of future performance. The market approach considers trading prices of securities issued bycomparable companies as multiples of historical earnings and forecast earnings. The results of the first step of the impairment testindicated that the fair value exceeded the carrying value; therefore, it was not necessary to perform the second step analysis.
If actual market conditions are less favorable than those we and the industry have projected, or if events occur or circumstanceschange that would reduce the fair value of our goodwill below the amount reflected in the balance sheet, we may be required toconduct an interim test and possibly recognize impairment charges, which could be material, in future periods.
Derivative Financial Instruments We recognize all of our derivative financial instruments as either assets or liabilities on ourconsolidated balance sheets at fair value. We do not use derivative financial instruments for trading or speculative purposes.
Interest Rate Swap AgreementsWe utilize interest rate swap agreements to convert certain floating rate exposures to fixed rate orcertain fixed-rate exposures to floating rate in order to manage our interest rate exposure. Cash flows from derivatives used to manageinterest rate risk are classified as operating activities.
We designate certain pay-fixed, receive-floating interest rate swaps as cash flow hedges of variable rate debt. The risk beinghedged is the risk of variability in interest payments attributable to changes in interest rates. If the hedge relationship is deemed to behighly effective, we record the effective portion of changes in the fair value of the hedge in accumulated other comprehensiveincome/loss. When the hedged cash flows affect earnings, we reclassify these amounts to interest expense. Any ineffective portion of acash flow hedge is recorded to interest expense immediately.
We designate certain receive-fixed, pay-floating interest rate swaps as fair value hedges of fixed-rate debt. The risk beinghedged is the risk of changes in the fair value of the hedged debt attributable to changes in the benchmark interest rate. If the hedgerelationship is deemed to be highly effective, we record the changes in the fair value of the hedged debt related to the risk beinghedged in interest expense. The change in fair value of the related derivative (excluding accrued interest) is also recorded in interestexpense.
Interest Rate Cap and Floor AgreementsWe may purchase interest rate cap and floor agreements to limit floating rate exposuresin our credit facilities. As part of our interest rate risk management strategy and when economically feasible, we may simultaneouslysell a corresponding interest rate cap or floor agreement in order to offset the premium paid to purchase the interest rate cap or flooragreement and thus retain the interest rate risk. Because the interest rate cap and floor agreements entered into by us or our specialpurpose finance subsidiaries do not qualify for hedge accounting, changes in the fair value of interest rate cap and floor agreementspurchased by the special purpose finance subsidiaries and interest rate cap and floor agreements sold by us are recorded in interestexpense.
Interest rate risk management contracts are generally expressed in notional principal or contract amounts that are much largerthan the amounts potentially at risk for nonpayment by counterparties. Therefore, in the event of nonperformance by thecounterparties, our credit exposure is limited to the uncollected interest and the market value related to the contracts that have becomefavorable to us. We manage the credit risk of such contracts by using highly rated counterparties, establishing risk limits andmonitoring the credit ratings of the counterparties.
We maintain a policy of requiring that all derivative contracts be governed by an International Swaps and DerivativesAssociation Master Agreement. We enter into arrangements with individual counterparties that we believe are creditworthy and


GENERAL MOTORS FINANCIAL COMPANY, INC.
NOTES TO CONSOLIDATED FINANCIAL STATEMENTS - (Continued)
generally settle on a net basis. In addition, we perform a quarterly assessment of our counterparty credit risk, including a review ofcredit ratings, credit default swap rates and potential nonperformance of the counterparty.
Foreign Currency SwapsOur policy is to minimize exposure to changes in currency exchange rates. To meet funding objectives,we borrow in a variety of currencies. We face exposure to currency exchange rates when the currency of our earning assets differsfrom the currency of the debt funding those assets. When possible, we fund earning assets with debt in the same currency, minimizingexposure to exchange rate movements. When a different currency is used, we may use foreign currency swaps to convert our debtobligations to the local currency of the earning assets.
We designate certain cross-currency swaps as cash flow hedges of foreign currency-denominated debt. The risk being hedged isthe variability in the cash flows for the payments of both principal and interest attributable to changes in foreign currency exchangerates. If the hedge relationship is deemed to be highly effective, we record the effective portion of changes in the fair value of the swapin accumulated other comprehensive income/loss. When the hedged cash flows affect earnings via principal remeasurement or accrualof interest expense, we reclassify these amounts to other operating expenses or interest expense. Any ineffective portion of a cash flowhedge is recorded to interest expense immediately.
Fair Value Financial instruments are considered Level 1 when quoted prices are available in active markets for identical assets orliabilities as of the reporting date. Active markets are those in which transactions for the asset or liability occur in sufficient frequencyand volume to provide pricing information on an ongoing basis.
Financial instruments are considered Level 2 when inputs other than quoted prices are observable for the asset or liability, eitherdirectly or indirectly. These include quoted prices for similar assets or liabilities in active markets and quoted prices for identical orsimilar assets or liabilities in markets that are not active.
Financial instruments are considered Level 3 when their values are determined using price models, discounted cash flowmethodologies or similar techniques and at least one significant model assumption or input is unobservable. Level 3 financialinstruments also include those for which the determination of fair value requires significant management judgment or estimation.
Income TaxesWe account for income taxes on a separate return basis using an asset and liability method which requires therecognition of deferred tax assets and liabilities for the expected future tax consequences attributable to differences between thefinancial statement carrying amounts of existing assets and liabilities and their respective tax basis, net operating loss and tax creditcarryforwards. A valuation allowance is recognized if it is more likely than not that some portion or the entire deferred tax asset willnot be realized.
We record uncertain tax positions on the basis of a two-step process whereby: (i) we determine whether it is more likely than notthat the tax positions will be sustained based on the technical merits of the position; and (ii) for those tax positions that meet the morelikely than not recognition, we recognize the largest amount of tax benefit that is greater than 50% likely to be realized upon ultimatesettlement with the related tax authority. We record interest and penalties on uncertain tax positions in income tax provision (benefit).
Revenue RecognitionFinance charge income related to retail finance receivables is recognized using the effective interest method.Fees and commissions received and direct costs of originating loans are generally deferred and amortized over the term of the relatedfinance receivables using the effective interest method and are removed from the consolidated balance sheets when the related financereceivables are sold, charged off or paid in full. Accrual of finance charge income is suspended on accounts that are more than 60 daysdelinquent, accounts in bankruptcy and accounts in repossession. Payments received on non-accrual loans are first applied to any feesdue, then to any interest due and, finally, any remaining amounts received are recorded to principal. Interest accrual resumes once anaccount has received payments bringing the delinquency status to less than 60 days past due or, for TDRs, when repayment isreasonably assured based on the modified terms of the loan.
Finance charge income related to commercial finance receivables is recognized using the effective interest method. Accrual offinance charge income is generally suspended on accounts that are more than 90 days delinquent, upon receipt of a bankruptcy noticefrom a borrower, or where reasonable doubt about the full collectability of contractually agreed upon principal and interest exist.Payments received on non-accrual loans are first applied to principal. Interest accrual resumes once an account has received paymentsbringing the delinquency status fully current and collection of contractual principal and interest is reasonably expected (includingamounts previously charged off).
Operating lease rental income for leased vehicles is recognized on a straight-line basis over the lease term. Net deferredorigination fees or costs are amortized on a straight-line basis over the term of the lease agreement.


GENERAL MOTORS FINANCIAL COMPANY, INC.
NOTES TO CONSOLIDATED FINANCIAL STATEMENTS - (Continued)
Parent Company Stock-Based CompensationWe measure and record compensation expense for parent company stock-basedcompensation awards based on the award's estimated fair value. We record compensation expense over the applicable vesting periodof an award.
Refer toNote 12 - "Parent Company Stock-Based Compensation" to our consolidated financial statements for further information.
Recently Adopted Accounting Standards In November 2016 the Financial Accounting Standards Board ("FASB") issuedAccounting Standard Update 2016-18, "Statement of Cash Flows (Topic 230): Restricted Cash" (ASU 2016-18), which clarifies thepresentation of restricted cash and restricted cash equivalents in the statements of cash flows. Under ASU 2016-18 restricted cash andrestricted cash equivalents are included with cash and cash equivalents when reconciling the beginning-of-period and end-of-periodtotal amounts presented on the statements of cash flows. We adopted ASU 2016-18 during the three months ended December 31, 2016on a retrospective basis. As a result net cash provided by operating activities decreased by $271 million in 2015 and increased by aninsignificant amount in 2014. Net cash used in investing activities decreased by $264 million and $232 million in 2015 and 2014 andbeginning-of-period cash, cash equivalents and restricted cash increased by $1.9 billion, $2.1 billion and $2.0 billion as of December31, 2016, 2015 and 2014.
Recently Issued Accounting Standards Not Yet AdoptedIn May 2014 the FASB issued ASU 2014-09, “Revenue from Contractswith Customers” (ASU 2014-09), which requires us to recognize revenue when a customer obtains control rather than when we havetransferred substantially all risks and rewards of a good or service and requires expanded disclosures. ASU 2014-09 is effective forannual reporting periods beginning on or after December 15, 2017 with early adoption permitted for reporting periods beginning on orafter December 15, 2016. The adoption of ASU 2014-09 will not have a significant impact on our consolidated financial statements.
In February 2016 the FASB issued ASU 2016-02, “Leases” (ASU 2016-02), which requires the lessee to recognize most leases on thebalance sheet thereby resulting in the recognition of lease assets and liabilities for those leases currently classified as operating leases.The accounting for lessors is largely unchanged. ASU 2016-02 is effective for annual reporting periods beginning after December 15,2018 with early adoption permitted. While we are currently assessing the impact ASU 2016-02 will have on our consolidated financialstatements, we expect the primary impact to our consolidated financial position upon adoption will be the recognition, on a discountedbasis, of our minimum commitments under noncancelable operating leases on our consolidated balance sheets resulting in therecording of right of use assets and lease obligations. Our current minimum commitments under noncancelable operating leases aredisclosed inNote 11.
In June 2016 the FASB issued ASU 2016-13, "Financial Instruments - Credit Losses (Topic 326): Measurement of Credit Losseson Financial Instruments" (ASU 2016-13), which requires entities to use a new impairment model based on expected losses. Underthis new model an entity would recognize an impairment allowance equal to its current estimate of credit losses on financial assetsmeasured at amortized cost. ASU 2016-13 is effective for us beginning January 1, 2020 with early adoption permitted January 1,2019. Credit losses under the new model will consider relevant information about past events, current conditions and reasonable andsupportable forecasts, resulting in recognition of lifetime expected credit losses upon loan origination as compared to our currentaccounting that recognizes credit losses as incurred. Adoption of ASU 2016-13 will increase the allowance for credit losses with thecumulative effect upon adoption resulting in a negative adjustment to retained earnings. We are currently evaluating new processes tocalculate credit losses in accordance with ASU 2016-13 that, once completed, will determine the impact on our consolidated financialstatements which at the date of adoption will increase the allowance for credit losses with a resulting negative adjustment to retainedearnings.
Note 2. Related Party Transactions
We offer loan and lease finance products through GM-franchised dealers to customers purchasing new and certain used vehiclesmanufactured by GM and make commercial loans directly to GM-franchised dealers and their affiliates. We also offer commercialloans to dealers that are consolidated by GM and those balances are included in our finance receivables, net.
Under subvention programs, GM makes cash payments to us for offering incentivized rates and structures on retail loan and leasefinance products. In addition, GM makes payments to us to cover certain interest payments on commercial loans. We also providefunding under lines of credit to GM, which are included in our net funding of commercial finance receivables on the consolidatedstatements of cash flows. During 2016, we advanced $456 million under a new line of credit to GM subsidiary Adam Opel AG, whichwas repaid with interest during 2016.
36
GENERAL MOTORS FINANCIAL COMPANY, INC.
NOTES TO CONSOLIDATED FINANCIAL STATEMENTS - (Continued)
We have related party payables due to GM, primarily for commercial finance receivables originated but not yet funded. Thesepayables typically settle within 30 days. The following tables present related party transactions:
Balance Sheet Data December 31, 2016 December 31, 2015
Commercial finance receivables, net due from dealers consolidated by GM(a) $ 401 $ 229
Advances drawn on lines of credit due from GM(b) $ 137 $ 190
Subvention receivable(c) $ 373 $ 383
Commercial loan funding payable(d) $ 389 $ 351
Income Statement Data Years Ended December 31,
2016 2015 2014
Interest subvention earned on retail finance receivables and leases (e) $ 443 $ 313 $ 248
Interest subvention earned on commercial finance receivables(e) $ 169 $ 175 $ 195
Leased vehicle subvention earned(f) $ 2,238 $ 1,001 $ 311_________________
Included in financereceivables, net.
Included in related partyreceivables.
(c) Included in related party receivables. We received subvention payments from GM of $4.4 billion, $3.6 billion and $1.2 billionduring 2016, 2015 and 2014.
Included in related partypayables.
Included in finance chargeincome.
f)
Included as a reduction to leased vehicleexpenses.
Under our support agreement with GM (the “Support Agreement”), if our earning assets leverage ratio at the end of any calendarquarter exceeds the applicable threshold set in the Support Agreement, we may require GM to provide funding sufficient to bring ourearning assets leverage ratio to within the applicable threshold. In determining our earning assets leverage ratio (net earning assetsdivided by adjusted equity) under the Support Agreement, net earning assets means our finance receivables, net, plus leased vehicles,net, and adjusted equity means our equity, net of goodwill and inclusive of outstanding junior subordinated debt, as each may beadjusted for derivative accounting from time to time.
Additionally, the Support Agreement provides that GM will own all of our outstanding voting shares as long as we have anyunsecured debt securities outstanding and that GM will use its commercially reasonable efforts to ensure that we will continue to bedesignated as a subsidiary borrower of up to $4.0 billion under GM’s corporate revolving credit facilities, which were amended inMay 2016. These amendments increased GM's borrowing capacity on its corporate revolving credit facilities from $12.5 billion to$14.5 billion. We have the ability to borrow up to $1.0 billion under GM's three-year, $4.0 billion unsecured revolving credit facilityand $3.0 billion under GM's five-year, $10.5 billion unsecured revolving credit facility, subject to available capacity. GM also agreedto certain provisions in the Support Agreement intended to ensure that we maintain adequate access to liquidity. Pursuant to theseprovisions, GM provided us with a $1.0 billion junior subordinated unsecured intercompany revolving credit facility (the "JuniorSubordinated Revolving Credit Facility"). In September 2016, we borrowed $415 million on the Junior Revolving Credit Facility,

which we repaid with interest in December 2016.
Since October 1, 2010, we have been included in GM's consolidated U.S. federal income tax returns. For taxable income werecognize in any period beginning on or after October 1, 2010, we are obligated to pay GM for our share of the consolidated U.S.federal and certain state tax liabilities. Amounts owed to GM for income taxes are accrued and recorded as a related party payable. AtDecember 31, 2016 and December 31, 2015, there are no related party taxes payable to GM due to our taxable loss position.
Note 3. Acquisition of Equity Interest
On January 2, 2015, we completed the acquisition of Ally Financial's 40% equity interest in SAIC-GMAC. The aggregatepurchase price was $1.0 billion. Also on January 2, 2015, we sold a 5% equity interest in SAIC-GMAC to SAIC FC, a currentshareholder of SAIC-GMAC, for proceeds of $125 million. As a result of these transactions, we own a 35% equity interest inSAIC-GMAC. We account for our ownership interest in SAIC-GMAC using the equity method of accounting. The difference betweenthe carrying amount of our investment and our share of the underlying net assets of SAIC-GMAC at the time of acquisition was $371million, which was primarily related to goodwill. We determined the acquisition date fair values of the identifiable assets acquired andliabilities assumed in accordance with ASC 805, "Business Combinations" ("ASC 805").

GENERAL MOTORS FINANCIAL COMPANY, INC.
NOTES TO CONSOLIDATED FINANCIAL STATEMENTS - (Continued)
Income resulting from the equity investment in SAIC-GMAC is included in our results beginning January 2, 2015. Equity incomefrom SAIC-GMAC recorded during 2016 and 2015 was $151 million and $116 million. If the acquisition had occurred on January 1,2014, our unaudited pro forma net income for 2014 would have increased by $107 million to $644 million.
Note 4. Finance Receivables
December 31, 2016 December 31, 2015
Retail finance receivablesRetail finance receivables, collectively evaluated for impairment, net of fees(a)
$ 30,989 $ 27,512Retail finance receivables, individually evaluated for impairment, net of fees
1,921 1,612Total retail finance receivables(b)
32,910 29,124Less: allowance for loan losses - collective (517) (515)Less: allowance for loan losses - specific (276) (220)Total retail finance receivables, net
32,117 28,389Commercial finance receivablesCommercial finance receivables, collectively evaluated for impairment, net of fees
11,053 8,357Commercial finance receivables, individually evaluated for impairment, net of fees
70 82Total commercial finance receivables
11,123 8,439Less: allowance for loan losses - collective (43) (38)Less: allowance for loan losses - specific (7) (9)Total commercial finance receivables, net
11,073 8,392Total finance receivables, net
$ 43,190 $ 36,781
Fair value of finance receivables $ 43,140 $ 36,937________________
(a)Includes $1.3 billion and $1.1 billion of direct-financing leases at December 31, 2016 and 2015.
(b) Net of unearned income, unamortized premiums and discounts, and deferred fees and costs of $191 million and $179 millionat December 31, 2016 and 2015.
We estimate the fair value of retail finance receivables using observable and unobservable Level 3 inputs within a cash flowmodel. The inputs reflect assumptions regarding expected prepayments, deferrals, delinquencies, recoveries and charge-offs of theloans within the portfolio. The cash flow model produces an estimated amortization schedule of the finance receivables. The projectedcash flows are then discounted to derive the fair value of the portfolio. Macroeconomic factors could affect the credit performance ofthe portfolio and, therefore, could potentially affect the assumptions used in our cash flow model. A substantial majority of ourcommercial finance receivables have variable interest rates and maturities of one year or less. Therefore, the carrying amount, a Level2 input, is considered to be a reasonable estimate of fair value.
Retail Finance Receivables Years ended December 31,
2016 2015 2014
Retail finance receivables beginning balance$ 29,124 $ 25,623 $ 23,130
Purchases of retail finance receivables18,054 17,537 15,085
Principal collections and other (12,633) (10,968) (10,234)Charge-offs (1,171) (996) (914)
Foreign currency translation (464) (2,072) (1,444)Retail finance receivables ending balance
$ 32,910 $ 29,124 $ 25,623
38
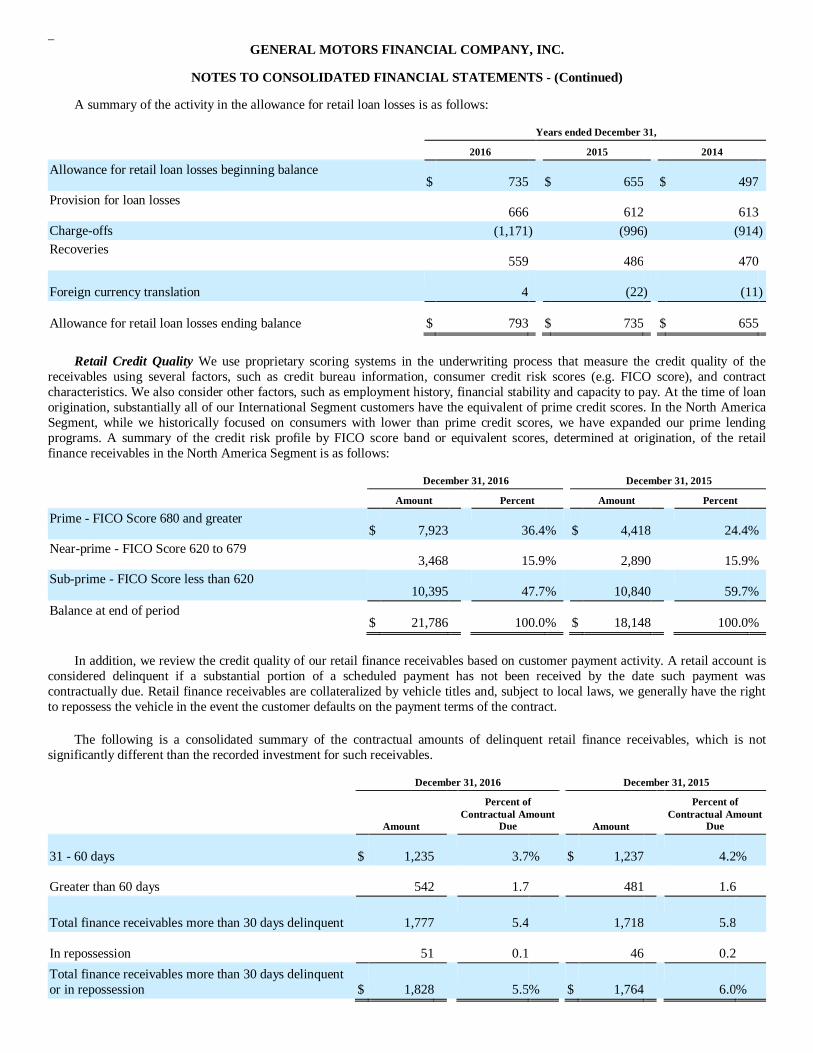
GENERAL MOTORS FINANCIAL COMPANY, INC.
NOTES TO CONSOLIDATED FINANCIAL STATEMENTS - (Continued)
A summary of the activity in the allowance for retail loan losses is as follows:
Years ended December 31,
2016 2015 2014
Allowance for retail loan losses beginning balance$ 735 $ 655 $ 497
Provision for loan losses666 612 613
Charge-offs (1,171) (996) (914)Recoveries
559 486 470
Foreign currency translation 4 (22) (11)
Allowance for retail loan losses ending balance $ 793 $ 735 $ 655
Retail Credit Quality We use proprietary scoring systems in the underwriting process that measure the credit quality of thereceivables using several factors, such as credit bureau information, consumer credit risk scores (e.g. FICO score), and contractcharacteristics. We also consider other factors, such as employment history, financial stability and capacity to pay. At the time of loanorigination, substantially all of our International Segment customers have the equivalent of prime credit scores. In the North AmericaSegment, while we historically focused on consumers with lower than prime credit scores, we have expanded our prime lendingprograms. A summary of the credit risk profile by FICO score band or equivalent scores, determined at origination, of the retailfinance receivables in the North America Segment is as follows:
December 31, 2016 December 31, 2015
Amount Percent Amount Percent
Prime - FICO Score 680 and greater$ 7,923 36.4% $ 4,418 24.4%
Near-prime - FICO Score 620 to 6793,468 15.9% 2,890 15.9%
Sub-prime - FICO Score less than 62010,395 47.7% 10,840 59.7%
Balance at end of period$ 21,786 100.0% $ 18,148 100.0%
In addition, we review the credit quality of our retail finance receivables based on customer payment activity. A retail account isconsidered delinquent if a substantial portion of a scheduled payment has not been received by the date such payment wascontractually due. Retail finance receivables are collateralized by vehicle titles and, subject to local laws, we generally have the rightto repossess the vehicle in the event the customer defaults on the payment terms of the contract.
The following is a consolidated summary of the contractual amounts of delinquent retail finance receivables, which is notsignificantly different than the recorded investment for such receivables.
December 31, 2016 December 31, 2015
Amount
Percent ofContractual Amount
Due Amount
Percent ofContractual Amount
Due
31 - 60 days $ 1,235 3.7% $ 1,237 4.2%
Greater than 60 days 542 1.7 481 1.6
Total finance receivables more than 30 days delinquent 1,777 5.4 1,718 5.8
In repossession 51 0.1 46 0.2Total finance receivables more than 30 days delinquentor in repossession $ 1,828 5.5% $ 1,764 6.0%

At December 31, 2016 and 2015, the accrual of finance charge income had been suspended on retail finance receivables withcontractual amounts due of $807 million and $778 million.

GENERAL MOTORS FINANCIAL COMPANY, INC.
NOTES TO CONSOLIDATED FINANCIAL STATEMENTS - (Continued)
Impaired Retail Finance Receivables - TDRs Retail finance receivables that become classified as troubled debt restructurings("TDRs") are separately assessed for impairment. A specific allowance is estimated based on the present value of the expected futurecash flows of the receivable discounted at the loan's original effective interest rate. Accounts that become classified as TDRs becauseof a payment deferral accrue interest at the contractual rate and an additional fee is collected (where permitted) at each time of deferraland recorded as a reduction of accrued interest. No interest or fees are forgiven on a payment deferral to a customer; therefore, thereare no additional financial effects of deferred loans becoming classified as TDRs. Accounts in the U.S. in Chapter 13 bankruptcywould have already been placed on non-accrual; therefore, there are no additional financial effects from these loans becomingclassified as TDRs. Finance charge income from loans classified as TDRs is accounted for in the same manner as other accruing loans.Cash collections on these loans are allocated according to the same payment hierarchy methodology applied to loans that are notclassified as TDRs.
At December 31, 2016 and 2015, the outstanding balance of retail finance receivables in the International Segment determined tobe TDRs was insignificant; therefore, the following information is presented with regard to the TDRs in the North America Segmentonly. The outstanding recorded investment for retail finance receivables that are considered to be TDRs and the related allowance ispresented below:
December 31, 2016 December 31, 2015
Outstanding recorded investment $ 1,920 $ 1,612Less: allowance for loan losses (276) (220)
Outstanding recorded investment, net of allowance $ 1,644 $ 1,392Unpaid principal balance
$ 1,967 $ 1,642
Additional information about loans classified as TDRs is presented below:
Years Ended December 31,
2016 2015 2014
Average outstanding recorded investment $ 1,766 $ 1,455 $ 996
Finance charge income recognized $ 205 $ 164 $ 123
Number of loans classified as TDRs during the period 66,926 58,012 49,490
Recorded investment of loans classified as TDRs during the period $ 1,148 $ 982 $ 794
A redefault is when an account meets the requirements for evaluation under our charge-off policy. The unpaid principal balance,net of recoveries, of loans that redefaulted during the reporting period and were within 12 months of being modified as a TDR were$26 million, $20 million and $25 million for 2016, 2015 and 2014.
Commercial Finance Receivables Years Ended December 31,
2016 2015 2014
Commercial finance receivables beginning balance$ 8,439 $ 8,072 $ 6,700
Net funding3,017 984 1,889
Charge-offs(2) (3) —
Foreign currency translation (331) (614) (517)Commercial finance receivables ending balance
$ 11,123 $ 8,439 $ 8,072
Commercial Credit Quality We extend wholesale credit to dealers primarily in the form of approved lines of credit to purchasenew vehicles as well as used vehicles. Each commercial lending request is evaluated, taking into consideration the borrower's financialcondition and the underlying collateral for the loan. We use proprietary models to assign each dealer a risk rating. These models usehistorical performance data to identify key factors about a dealer that we consider significant in predicting a dealer's ability to meet its

financial obligations. We also consider numerous other financial and qualitative factors including, but not limited to, capitalization andleverage, liquidity and cash flow, profitability and credit history.
We regularly review our models to confirm the continued business significance and statistical predictability of the factors andupdate the models to incorporate new factors or other information that improves statistical predictability. In addition, we verify theexistence of the assets collateralizing the receivables by physical audits of vehicle inventories, which are performed with increasedfrequency for higher risk dealers (i.e., Groups III, IV, V and VI). We perform a credit review of each dealer at least
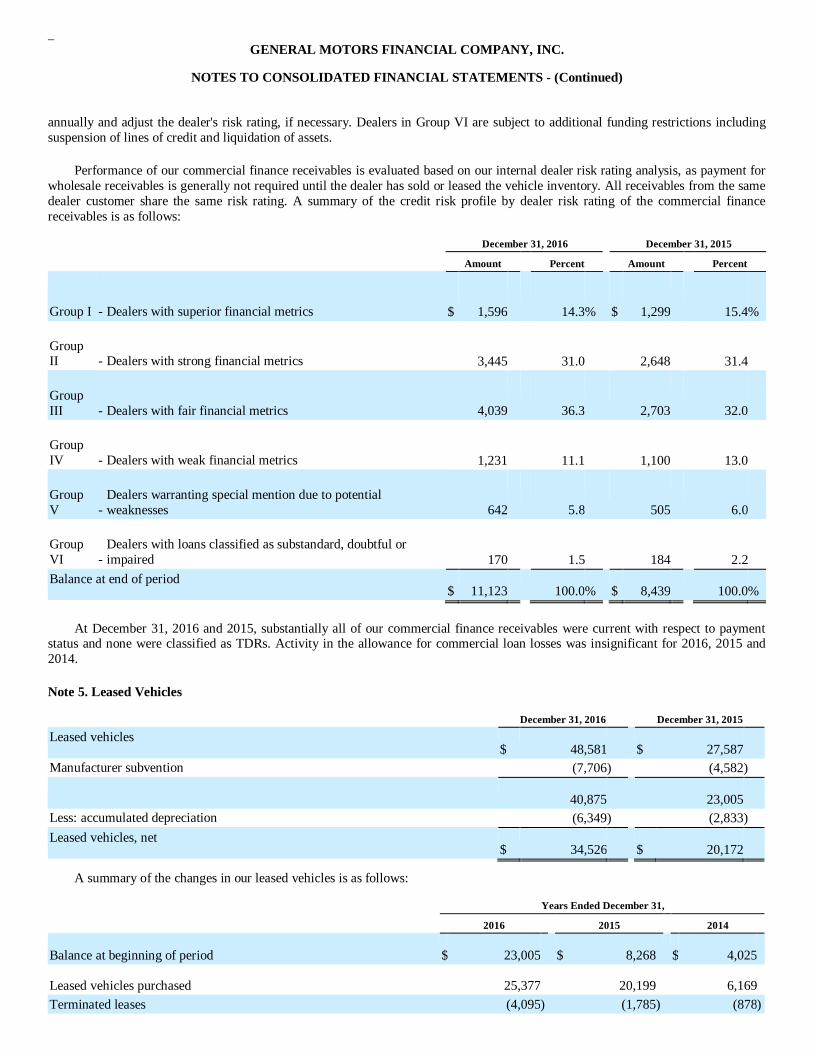
GENERAL MOTORS FINANCIAL COMPANY, INC.
NOTES TO CONSOLIDATED FINANCIAL STATEMENTS - (Continued)
annually and adjust the dealer's risk rating, if necessary. Dealers in Group VI are subject to additional funding restrictions includingsuspension of lines of credit and liquidation of assets.
Performance of our commercial finance receivables is evaluated based on our internal dealer risk rating analysis, as payment forwholesale receivables is generally not required until the dealer has sold or leased the vehicle inventory. All receivables from the samedealer customer share the same risk rating. A summary of the credit risk profile by dealer risk rating of the commercial financereceivables is as follows:
December 31, 2016 December 31, 2015
Amount Percent Amount Percent
Group I - Dealers with superior financial metrics $ 1,596 14.3% $ 1,299 15.4%
GroupII - Dealers with strong financial metrics 3,445 31.0 2,648 31.4
GroupIII - Dealers with fair financial metrics 4,039 36.3 2,703 32.0
GroupIV - Dealers with weak financial metrics 1,231 11.1 1,100 13.0
GroupV -
Dealers warranting special mention due to potentialweaknesses 642 5.8 505 6.0
GroupVI -
Dealers with loans classified as substandard, doubtful orimpaired 170 1.5 184 2.2
Balance at end of period$ 11,123 100.0% $ 8,439 100.0%
At December 31, 2016 and 2015, substantially all of our commercial finance receivables were current with respect to paymentstatus and none were classified as TDRs. Activity in the allowance for commercial loan losses was insignificant for 2016, 2015 and2014.
Note 5. Leased Vehicles
December 31, 2016 December 31, 2015
Leased vehicles$ 48,581 $ 27,587
Manufacturer subvention (7,706) (4,582)
40,875 23,005Less: accumulated depreciation (6,349) (2,833)Leased vehicles, net
$ 34,526 $ 20,172
A summary of the changes in our leased vehicles is as follows:
Years Ended December 31,
2016 2015 2014
Balance at beginning of period $ 23,005 $ 8,268 $ 4,025
Leased vehicles purchased 25,377 20,199 6,169Terminated leases (4,095) (1,785) (878)

Leased vehicles returned - default (358) (120) (58)Manufacturer subvention (3,111) (3,169) (844)
Foreign currency translation 57 (388) (146)
Balance at end of period $ 40,875 $ 23,005 $ 8,268
The following table summarizes minimum rental payments due to us as lessor under operating leases:
Years Ending December 31,
2017 2018 2019 2020 2021 Total
Minimum rental payments under operating leases $ 5,649 $ 4,176 $ 1,869 $ 180 $ 4 $ 11,878
41

GENERAL MOTORS FINANCIAL COMPANY, INC.
NOTES TO CONSOLIDATED FINANCIAL STATEMENTS - (Continued)
Note 6. Goodwill
The following table summarizes the changes in the carrying amounts of goodwill by segment:
Years Ended December 31,
2016 2015 2014
NorthAmerica International Total
NorthAmerica International Total
NorthAmerica International Total
Beginningbalance $ 1,105 $ 84 $ 1,189 $ 1,106 $ 138 $ 1,244 $ 1,108 $ 132 $ 1,240
Acquisition— — — — — — — 6 6
Foreigncurrencytranslation — 7 7 (1) (54) (55) (2) — (2)
Ending balance$ 1,105 $ 91 $ 1,196 $ 1,105 $ 84 $ 1,189 $ 1,106 $ 138 $ 1,244
Note 7. Equity in Net Assets of Non-consolidated Affiliates
We use the equity method to account for our equity interest in SAIC-GMAC Automotive Finance Company Limited("SAIC-GMAC"), a joint venture that conducts auto finance operations in China. The income of SAIC-GMAC is not consolidated intoour financial statements; rather, our proportionate share of the earnings is reflected as equity income.
We received cash dividends from SAIC-GMAC of $129 million in 2016. There were no cash dividends received in 2015. AtDecember 31, 2016 and 2015, we had undistributed earnings of $142 million and $121 million related to SAIC-GMAC. The followingtables present summarized financial data of SAIC-GMAC:
Summarized Balance Sheet Data(a): December 31, 2016 December 31, 2015
Finance receivables, net$ 10,408 $ 9,617
Total assets$ 11,089 $ 9,802
Debt$ 6,681 $ 5,789
Total liabilities$ 9,330 $ 7,973
Years Ended December 31,
Summarized Operating Data(a): 2016 2015
Finance charge income$ 940 $ 971
Provision for loan losses$ 18 $ 45
Interest expense$ 257 $ 338
Income before income taxes$ 570 $ 463
Net income$ 428 $ 347
_________________(a)
This data represents that of the entire entity and not our 35% proportionateshare.
42


GENERAL MOTORS FINANCIAL COMPANY, INC.
NOTES TO CONSOLIDATED FINANCIAL STATEMENTS - (Continued)
Note 8. Debt
December 31, 2016 December 31, 2015
Carrying Amount Fair Value Carrying Amount Fair Value
Secured debt
Revolving credit facilities $ 9,817 $ 9,812 $ 7,548 $ 7,494
Securitization notes payable 29,453 29,545 23,141 23,177
Total secured debt $ 39,270 $ 39,357 $ 30,689 $ 30,671
Unsecured debt
Senior notes $ 28,577 $ 29,182 $ 18,973 $ 19,045
Credit facilities 3,354 3,354 2,759 2,753
Retail customer deposits 1,895 1,902 1,260 1,262
Other unsecured debt 780 782 665 666
Total unsecured debt $ 34,606 $ 35,220 $ 23,657 $ 23,726
Total Secured and Unsecured debt $ 73,876 $ 74,577 $ 54,346 $ 54,397
Fair value utilizing Level 2 inputs $ 69,990 $ 48,716
Fair value utilizing Level 3 inputs $ 4,587 $ 5,681
The fair value of our debt measured utilizing Level 2 inputs was based on quoted market prices for identical instruments and ifunavailable, quoted market prices of similar instruments. For debt that has terms of one year or less or has been priced within the lastsix months, the carrying amount or par value is considered to be a reasonable estimate of fair value. The fair value of our debtmeasured utilizing Level 3 inputs was based on the discounted future net cash flows expected to be settled using current risk-adjustedrates.
Secured DebtMost of the secured debt was issued by variable interest entities, as further discussed inNote 9 - "Variable InterestEntities." This debt is repayable only from proceeds related to the underlying pledged assets.
The weighted average interest rate on secured debt was 2.09% at December 31, 2016. Issuance costs on the secured debt of $89million as of December 31, 2016 and $76 million as of December 31, 2015 are amortized to interest expense over the expected term ofthe secured debt.
The terms of our revolving credit facilities provide for a revolving period and subsequent amortization period, and are expectedto be repaid over periods ranging up to six years. During 2016, we entered into new credit facilities or renewed credit facilities with atotal net additional borrowing capacity of $4.0 billion.
Securitization notes payable at December 31, 2016 are due beginning in 2018 through 2024. During 2016, we issuedsecuritization notes payable of $16.9 billion with a weighted-average interest rate of 1.7%.
Unsecured Debt
Senior Notes At December 31, 2016, we had $29.0 billion par value outstanding in senior notes that mature from 2017 through2026 and have a weighted average interest rate of 3.33%. Issuance costs on senior notes of $115 million as of December 31, 2016 and$107 million as of December 31, 2015 are amortized to interest expense over the term of the notes.
During 2016, our top-tier holding company issued $10.3 billion in senior notes comprised of $9.6 billion of fixed rate notes with

a weighted average coupon of 3.38% and $650 million in floating rate notes. These notes mature beginning in May 2019 throughOctober 2026. All of these notes are guaranteed by AmeriCredit Financial Services, Inc. ("AFSI").
In May 2016, one of our European subsidiaries issued €500 million of 1.168% notes under our Euro medium term notes program.These notes are due in May 2020 and are guaranteed by our top-tier holding company and AFSI.
In November 2016, one of our European subsidiaries issued €100 million in floating rate notes under our Euro medium termnotes program. These notes are due in December 2017 and are guaranteed by our top-tier holding company and AFSI.
43

GENERAL MOTORS FINANCIAL COMPANY, INC.
NOTES TO CONSOLIDATED FINANCIAL STATEMENTS - (Continued)
Subsequent to December 31, 2016, our top-tier holding company issued $2.5 billion in senior notes comprised of $1.25 billion of3.45% notes due in January 2022, $750 million of 4.35% notes due in January 2027 and $500 million of floating rate notes due inJanuary 2022. All of these notes are guaranteed solely by AFSI.
Senior notes issued by our top-tier holding company are guaranteed solely by AFSI; none of our other subsidiaries are guarantors ofour senior notes. Refer toNote 20 - "Guarantor Consolidating Financial Statements" to our consolidated financial statements forfurther discussion.
Credit Facilities and Other Unsecured Debt We use unsecured credit facilities with banks as well as non-bank instruments asfunding sources, primarily in the International Segment. During 2016, we increased net borrowing capacity on unsecured committedcredit facilities by $22 million.
The terms of advances under our unsecured credit facilities are determined and agreed to by us and the lender on the borrowingdate for each advance and can have maturities up to five years. The weighted average interest rate on credit facilities and otherunsecured debt was 7.50% at December 31, 2016.
Retail Customer Deposits During 2015, we began accepting deposits from retail banking customers in Germany. Following issummarized information for our deposits at December 31, 2016 and 2015:
December 31, 2016 December 31, 2015
Outstanding BalanceWeighted Average
Interest Rate Outstanding BalanceWeighted Average
Interest Rate
Overnight deposits $ 799 0.50% $ 555 1.00%
Term deposits -12 months 423 0.93% 337 1.32%
Term deposits - 24 months 281 1.26% 123 1.44%
Term deposits - 36 months 392 1.48% 245 1.65%
Total deposits $ 1,895 0.91% $ 1,260 1.25%
Contractual Debt ObligationsThe following table presents the expected scheduled principal and interest payments under ourcontractual debt obligations:
Years Ending December 31,
2017 2018 2019 2020 2021 Thereafter Total
Secured debt $ 21,268 $ 11,573 $ 4,880 $ 1,264 $ 348 $ — $ 39,333
Unsecured debt 7,328 4,167 6,351 4,650 4,750 7,791 35,037
Interest payments 1,624 1,204 799 573 376 793 5,369
$ 30,220 $ 16,944 $ 12,030 $ 6,487 $ 5,474 $ 8,584 $ 79,739
Compliance with Debt Covenants Several of our revolving credit facilities require compliance with certain financial and operationalcovenants as well as regular reporting to lenders, including providing certain subsidiary financial statements. Certain of our secureddebt agreements also contain various covenants, including maintaining portfolio performance ratios as well as limits on defermentlevels. Our unsecured senior notes contain covenants including limitations on our ability to incur certain liens. At December 31, 2016,we were in compliance with these debt covenants.
44

GENERAL MOTORS FINANCIAL COMPANY, INC.
NOTES TO CONSOLIDATED FINANCIAL STATEMENTS - (Continued)
Note 9. Variable Interest Entities
Securitizations and credit facilities
The following table summarizes the assets and liabilities related to our consolidated VIEs:
December 31,
2016 2015
Restricted cash(a) $ 2,067 $ 1,876
Finance receivables, net of fees $ 29,661 $ 24,942
Lease related assets $ 19,341 $ 11,684
Secured debt $ 38,244 $ 29,386_______________
(a) Included in other assets in the consolidated balance sheets.
These amounts are related to securitization and credit facilities held by consolidated VIEs. Our continuing involvement withthese VIEs consists of servicing assets held by the entities and holding residual interests in the entities. We have determined that weare the primary beneficiary of each VIE because we hold both (i) the power to direct the activities of the VIEs that most significantlyimpact the VIEs' economic performance and (ii) the obligation to absorb losses from and the right to receive benefits of the VIEs thatcould potentially be significant to the VIEs. We are not required, and do not currently intend, to provide any additional financialsupport to these VIEs. Liabilities recognized as a result of consolidating these entities generally do not represent claims against us orour other subsidiaries and assets recognized generally are for the benefit of these entities operations and cannot be used to satisfy ouror our subsidiaries obligations.
Other VIEsWe consolidate certain operating entities that provide auto finance and financial services, which we do not controlthrough a majority voting interest. We manage these entities and maintain a controlling financial interest in them and are exposed tothe risks of ownership through contractual arrangements. The majority voting interests in these entities are indirectly wholly-owned byour parent, GM. The amounts presented below are stated prior to intercompany eliminations and include amounts related tosecuritizations and credit facilities held by consolidated VIEs. The following table summarizes the assets and liabilities of these VIEs:
December 31,
2016 2015
Assets(a) $ 4,251 $ 3,652
Liabilities(b) $ 3,559 $ 2,941_______________
(a) Comprised primarily of finance receivables, net of $3.5 billion and $3.2 billion at December 31, 2016 and 2015.
(b)
Comprised primarily of debt of $3.0 billion and $2.6 billion at December 31, 2016 and2015.
The following table summarizes the revenue and net income of these VIEs:
Years Ended December 31,
2016 2015 2014
Total revenue $ 210 $ 191 $ 192
Net income $ 29 $ 29 $ 28
Other transfers of finance receivablesUnder certain debt agreements, we transfer finance receivables to entities which we do notcontrol through majority voting interest or through contractual arrangements. These transfers do not meet the criteria to be consideredsales under U.S. GAAP; therefore, the finance receivables and the related debt are included in our consolidated financial statements,

similar to the treatment of finance receivables and related debt of our consolidated VIEs. Any collections received on the transferredreceivables are available only for the repayment of the related debt. At December 31, 2016 and 2015, $1.2 billion and $1.5 billion infinance receivables had been transferred in secured funding arrangements to third-party banks, to which $1.1 billion and $1.4 billion insecured debt was outstanding.
45
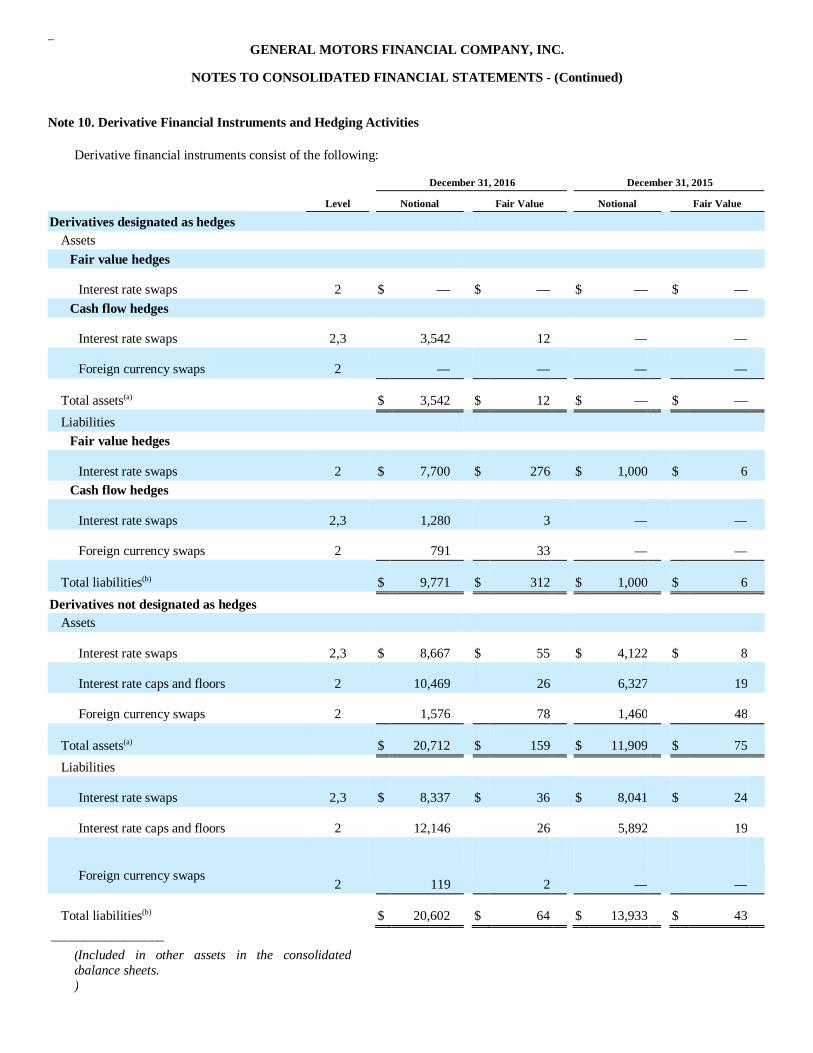
GENERAL MOTORS FINANCIAL COMPANY, INC.
NOTES TO CONSOLIDATED FINANCIAL STATEMENTS - (Continued)
Note 10. Derivative Financial Instruments and Hedging Activities
Derivative financial instruments consist of the following:
December 31, 2016 December 31, 2015
Level Notional Fair Value Notional Fair Value
Derivatives designated as hedgesAssets
Fair value hedges
Interest rate swaps 2 $ — $ — $ — $ —Cash flow hedges
Interest rate swaps 2,3 3,542 12 — —
Foreign currency swaps 2 — — — —
Total assets(a) $ 3,542 $ 12 $ — $ —Liabilities
Fair value hedges
Interest rate swaps 2 $ 7,700 $ 276 $ 1,000 $ 6Cash flow hedges
Interest rate swaps 2,3 1,280 3 — —
Foreign currency swaps 2 791 33 — —
Total liabilities(b) $ 9,771 $ 312 $ 1,000 $ 6
Derivatives not designated as hedgesAssets
Interest rate swaps 2,3 $ 8,667 $ 55 $ 4,122 $ 8
Interest rate caps and floors 2 10,469 26 6,327 19
Foreign currency swaps 2 1,576 78 1,460 48
Total assets(a) $ 20,712 $ 159 $ 11,909 $ 75Liabilities
Interest rate swaps 2,3 $ 8,337 $ 36 $ 8,041 $ 24
Interest rate caps and floors 2 12,146 26 5,892 19
Foreign currency swaps2 119 2 — —
Total liabilities(b) $ 20,602 $ 64 $ 13,933 $ 43_________________
(a)
Included in other assets in the consolidatedbalance sheets.

(b) Included in other liabilities in the consolidated balance sheets. Amounts accrued for interest payments in a netreceivable position are included in other assets in the consolidated balance sheets.
The fair value for Level 2 instruments was derived using the market approach based on observable market inputs includingquoted prices of similar instruments and foreign exchange and interest rate forward curves. The fair value for Level 3 instrumentswas derived using the income approach based on a discounted cash flow model, in which expected cash flows are discounted usingcurrent risk-adjusted rates. The activity for interest rate swap agreements measured at fair value on a recurring basis using significantunobservable inputs (Level 3) was insignificant for 2016, 2015 and 2014.
46

GENERAL MOTORS FINANCIAL COMPANY, INC.
NOTES TO CONSOLIDATED FINANCIAL STATEMENTS - (Continued)
The following table presents information on the gains (losses) on derivative instruments included in the consolidated statementsof income and comprehensive income:
Income (Losses) Recognized In Income
Years Ended December 31,
2016 2015 2014
Fair value hedges
Interest rate contracts(a)(b) $ (7) $ 1 $ —Cash flow hedges
Interest rate contracts(a) (4) — —
Foreign currency contracts(c) 39 — —Derivatives not designated as hedges
Interest rate contracts(a) 14 (15) (51)
Foreign currency derivatives(c)(d) 109 42 163Total
$ 151 $ 28 $ 112
Gains (Losses) Recognized InAccumulated Other Comprehensive Loss
Years Ended December 31,
2016 2015 2014
Cash flow hedges
Interest rate contracts $ 4 $ — $ —
Foreign currency contracts (20) — —
Total $ (16) $ — $ —
Gains Reclassified FromAccumulated Other Comprehensive Loss Into Income
Years Ended December 31,
2016 2015 2014
Cash flow hedges
Interest rate contracts $ 2 $ — $ —
Foreign currency contracts 31 — —
Total $ 33 $ — $ —_________________
)
Recognized in earnings as interestexpense.
(b) Includes hedge ineffectiveness which reflects the net change in the fair value of interest rate contracts of $322 million offsetby the change in fair value of hedged debt attributable to the hedged risk of $287 million.
(c
Recognized in earnings as other operating expenses and interestexpense.

)
(d) Activity is offset by translation activity (included in other operating expenses) related to foreign currency-denominated loans.

GENERAL MOTORS FINANCIAL COMPANY, INC.
NOTES TO CONSOLIDATED FINANCIAL STATEMENTS - (Continued)
Note 11. Commitments and Contingencies
LeasesWe lease space for our operating facilities and administrative offices under leases with terms up to 10 years with renewaloptions. Certain leases contain lease escalation clauses for real estate taxes and other operating expenses and renewal option clausescalling for increased rents. A summary of lease expense and operating lease commitments are as follows:
Years Ended December 31,
2016 2015 2014
Lease expense$ 30 $ 28 $ 28
Years Ending December 31,
2017 2018 2019 2020 2021 Thereafter Total
Operating lease commitments $ 38 $ 45 $ 41 $ 37 $ 35 $ 161 $ 357
Concentrations of Credit RiskFinancial instruments which potentially subject us to concentrations of credit risk are primarily cashequivalents, restricted cash, derivative financial instruments and retail finance receivables. Our cash equivalents and restricted cashrepresent investments in highly rated securities placed through various major financial institutions. The counterparties to ourderivative financial instruments are various major financial institutions.
Retail finance receivables in the North America Segment represent contracts with customers residing throughout the U.S. andCanada, with borrowers located in Texas accounting for 16.0% of the portfolio as of December 31, 2016. No other state accounted formore than 10% of retail finance receivables. Retail finance receivables in the International Segment represent contracts with customersresiding throughout Europe and Latin America. Borrowers located in the U.K., Germany, Brazil and Mexico accounted for 25.3%,20.6%, 20.1%, and 16.4% of the international retail finance receivables as of December 31, 2016. No other country accounted formore than 10% of retail finance receivables.
At December 31, 2016, substantially all of our commercial finance receivables represent loans to GM-franchised dealerships andtheir affiliates.
Guarantees of Indebtedness The payments of principal and interest on senior notes issued by our top-tier holding company, ourprimary Canadian operating subsidiary and a European subsidiary are guaranteed by our primary U.S. operating subsidiary, AFSI. AtDecember 31, 2016, the par value of our senior notes was $29.0 billion. Refer toNote 20 - "Guarantor Consolidating FinancialStatements" to our consolidated financial statement in this Form 10-K for further discussion.
Legal Proceedings As a retail finance company, we are subject to various customer claims and litigation seeking damages andstatutory penalties, based upon, among other things, usury, disclosure inaccuracies, wrongful repossession, violations of bankruptcystay provisions, certificate of title disputes, fraud, breach of contract and discriminatory treatment of credit applicants. Some litigationagainst us could take the form of class action complaints by customers and certain legal actions include claims for substantialcompensatory and/or punitive damages or claims for indeterminate amounts of damages. We establish reserves for legal claims whenpayments associated with the claims become probable and the payments can be reasonably estimated. Given the inherent difficulty ofpredicting the outcome of litigation and regulatory matters, it is generally very difficult to predict what the eventual outcome will be,and when the matter will be resolved. The actual costs of resolving legal claims may be higher or lower than any amounts reserved forthe claims. At December 31, 2016, we estimated our reasonably possible legal exposure for unfavorable outcomes of up to $96million, and have accrued $35 million.
In July 2014, we were served with a subpoena by the U.S. Department of Justice directing us to produce certain documentsrelating to our and our subsidiaries’ and affiliates’ origination and securitization of sub-prime automobile loans since 2007 inconnection with an investigation by the U.S. Department of Justice in contemplation of a civil proceeding for potential violations ofthe Financial Institutions Reform, Recovery, and Enforcement Act of 1989. Among other matters, the subpoena requests informationrelating to the underwriting criteria used to originate these automobile loans and the representations and warranties relating to thoseunderwriting criteria that were made in connection with the securitization of the automobile loans. We have subsequently been servedwith additional investigative subpoenas to produce documents from state attorneys general and other governmental offices relating toour retail auto loan business and securitization of auto loans. These investigations are ongoing and could in the future result in theimposition of damages, fines or civil or criminal claims and/or penalties. No assurance can be given that the ultimate outcome of theinvestigations or any resulting proceedings would not materially and adversely affect us or any of our subsidiaries and affiliates.


GENERAL MOTORS FINANCIAL COMPANY, INC.
NOTES TO CONSOLIDATED FINANCIAL STATEMENTS - (Continued)
Other Administrative Tax Matters We accrue non-income tax liabilities for contingencies when management believes that a loss isprobable and the amounts can be reasonably estimated, while contingent gains are recognized only when realized. In the event anylosses are sustained in excess of accruals, they will be charged against income at that time.
In evaluating indirect tax matters, we take into consideration factors such as our historical experience with matters of similarnature, specific facts and circumstances, and the likelihood of prevailing. We reevaluate and update our accruals as matters progressover time. Where there is a reasonable possibility that losses exceeding amounts already recognized may be incurred, our estimate ofthe additional range of loss is up to $35 million.
Note 12. Parent Company Stock-Based Compensation
GM grants to certain employees and key executive officers Restricted Stock Units (“RSUs”), Performance-based Share Units(“PSUs”) and stock options. Shares awarded under the plans are subject to forfeiture if the participant leaves the company for reasonsother than those permitted under the plans, such as retirement, death or disability.
RSU awards granted either cliff vest or ratably vest generally over a three-year service period, as defined in the terms for eachaward. PSU awards generally vest at the end of a three-year performance period based on performance criteria determined by theExecutive Compensation Committee of the GM Board of Directors at the time of award. The number of shares earned may equal,exceed or be less than the targeted number of shares depending on whether the performance criteria are met, surpassed or not met.
The following table summarizes information about RSU, PSUs and stock options granted to our employees and key executiveofficers under GM's stock-based compensation programs (units in thousands):
Year Ended December 31, 2016
SharesWeighted-Average Grant Date
Fair Value
Weighted-AverageRemaining
Contractual Term(years)
Units outstanding at January 1, 2016 2,302 $ 34.61 1.3
Granted 1,057 $ 31.50
Settled (501) $ 34.95
Forfeited or expired (31) $ 33.93
Units outstanding at December 31, 2016 2,827 $ 32.89 1.1
Units unvested and expected to vest at December 31, 2016 1,926 $ 33.05 1.1
Units vested and payable at December 31, 2016 821 $ 32.51
The following table summarizes compensation expense recorded for stock-based incentive plans:
Years Ended December 31,
2016 2015 2014
Compensation expense $ 48 $ 36 $ 19
Income tax benefit 19 13 8
Compensation expense, net of tax $ 29 $ 23 $ 11
At December 31, 2016, total unrecognized compensation expense for nonvested equity awards granted was $42 million. Thisexpense is expected to be recorded over a weighted-average period of 1.1 years. The total fair value of RSUs and PSUs vested in2016, 2015, and 2014 was $16 million, $13 million and $9 million.
In 2016, 2015, and 2014, total payments for 49,000, 254,000 and 359,000 RSUs settled in cash under stock incentive plans were

$2 million, $9 million and $13 million.

GENERAL MOTORS FINANCIAL COMPANY, INC.
NOTES TO CONSOLIDATED FINANCIAL STATEMENTS - (Continued)
Note 13. Employee Benefit Plans
We have defined contribution retirement plans covering substantially all employees in the North America Segment as well as inBrazil and the U.K. We recognized $20 million, $17 million and $12 million in compensation expense for 2016, 2015, and 2014related to these plans. Contributions to the plans were made in cash.
Certain employees in the International Segment are eligible to participate in plans that provide for pension payments uponretirement based on factors such as length of service and salary. The associated liability was $118 million and $109 million atDecember 31, 2016 and 2015. We recognized $6 million in net periodic pension expense in each of 2016, 2015, and 2014.
Note 14. Income Taxes
The following table summarizes income before income taxes and equity income:
Years Ended December 31,
2016 2015 2014
U.S. income $ 336 $ 362 $ 481
Non-U.S. income 426 359 334
Income before income taxes and equity income $ 762 $ 721 $ 815
Income Tax Expense Years Ended December 31,
2016 2015 2014
Current income tax expense
U.S. federal $ (1) $ 13 $ 284
U.S. state and local — (5) 14
Non-U.S. 118 51 63
Total current 117 59 361
Deferred income tax expense
U.S. federal 20 95 (87)
U.S. state and local 13 6 (5)
Non-U.S. 9 31 9
Total deferred 42 132 (83)
Total income tax provision $ 159 $ 191 $ 278
Provisions are made for estimated U.S. and non-U.S. income taxes, less available tax credits and deductions, which may beincurred on the remittance of our basis differences in investments in foreign subsidiaries not deemed to be indefinitely reinvested.Taxes have not been provided on basis differences in investments as a result of earnings in foreign subsidiaries which are deemedindefinitely reinvested of $5 million and $21 million at December 31, 2016 and 2015. Quantification of the deferred tax liability, ifany, associated with indefinitely reinvested basis differences is not practicable.
The following table summarizes a reconciliation of income tax expense (benefit) compared with the amounts at the U.S. federalstatutory income tax rate:

Years Ended December 31,
2016 2015 2014
U.S. statutory tax rate35.0% 35.0% 35.0 %
Non-U.S. income taxed at other than 35% (2.6) (3.2) (2.2)State and local income taxes
2.0 0.9 1.2U.S. tax on non-U.S. earnings
(10.7) (3.2) 7.2Valuation allowance
7.4 7.1 (4.9)Tax credits and incentives (9.9) (6.6) (0.8)Other (0.3) (3.5) (1.5)
Effective tax rate 20.9% 26.5% 34.0 %

GENERAL MOTORS FINANCIAL COMPANY, INC.
NOTES TO CONSOLIDATED FINANCIAL STATEMENTS - (Continued)
Deferred Income Tax Assets and LiabilitiesDeferred income tax assets and liabilities at December 31, 2016 and 2015 reflect theeffect of temporary differences between amounts of assets, liabilities and equity for financial reporting purposes and the basis of suchassets, liabilities and equity as measured by tax laws, as well as tax loss and tax credit carryforwards. The following table summarizesthe components of temporary differences and carryforwards that give rise to deferred tax assets and liabilities:
December 31, 2016 December 31, 2015
Deferred tax assetsNet operating loss carryforward - U.S.(a)
$ 1,049 $ 409Net operating loss carryforward - Non-U.S.(b)
202 189Market value difference of loan portfolio
105 166Accruals
135 107Tax Credits(c)
388 131Other
113 113
Total deferred tax assets before valuation allowance 1,992 1,115Less: valuation allowance (166) (104)
Total deferred tax assets1,826 1,011
Deferred tax liabilitiesDepreciable assets
1,470 645Deferred acquisition costs
183 116Other
119 148Total deferred tax liabilities
1,772 909Net deferred tax asset
$ 54 $ 102_________________
(a)
Includes tax-effected operating losses of $1.0 billion expiring through 2037 at December 31, 2016.
(b) Includes tax-effected operating losses of $105 million expiring through 2037 and $97 million that may be carried forwardindefinitely at December 31, 2016.
(c)
Includes tax credits of $388 million expiring through 2037 at December 31,2016.
We are included in GM’s consolidated U.S. federal income tax return and certain states’ income tax returns. Net operating lossesand certain tax credits generated by us have been utilized by GM; however, income tax expense and deferred tax balances arepresented in these financial statements as if we filed our own tax returns in each jurisdiction. As of December 31, 2016, we have $22million in valuation allowances against deferred tax assets in non-U.S. jurisdictions and $144 million in valuation allowances againstdeferred tax assets in U.S. jurisdictions. The increase in our valuation allowance of $62 million is primarily related to 2016 U.S.foreign tax credits of $91 million that we do not expect to utilize within the carryforward period partially offset by the release of a $19million valuation allowance on deferred tax assets in Italy. During 2016 we concluded it was more likely than not that our futureearnings in Italy will be sufficient to realize the deferred tax asset so a full valuation allowance is no longer needed. Accordingly wereversed the Italy valuation allowance and recorded an income tax benefit.
Uncertain Tax Positions Years Ended December 31,
2016 2015 2014
Beginning balance $ 61 $ 95 $ 130

Additions to prior years' tax positions 4 — 1Reductions to prior years' tax positions (6) (7) (12)
Additions to current year tax positions 2 1 7Reductions in tax positions due to lapse of statutory limitations (5) (16) (6)
Settlements — (2) (20)
Foreign currency translation 3 (10) (5)Ending balance
$ 59 $ 61 $ 95
At December 31, 2016, 2015, and 2014, there were $38 million, $35 million and $71 million of net unrecognized tax benefitsthat, if recognized, would favorably affect the effective tax rate.

GENERAL MOTORS FINANCIAL COMPANY, INC.
NOTES TO CONSOLIDATED FINANCIAL STATEMENTS - (Continued)
We recognize accrued interest and penalties associated with uncertain tax positions as a component of the income tax provision.Accrued interest and penalties are included within the related tax liability line on the consolidated balance sheets.
During 2014, we recorded income tax related interest benefit and penalties of $12 million. The amounts recorded in 2015 and2016 were insignificant. At December 31, 2016 and 2015 we had liabilities of $83 million and $75 million for income tax-relatedinterest and penalties.
At December 31, 2016, it is not possible to reasonably estimate the expected change to the total amount of unrecognized taxbenefits in the next twelve months.
Periodically, we make deposits to taxing jurisdictions which reduce our unrecognized tax benefit balance, but are not reflected inthe reconciliation above. The amounts of deposits that reduce our unrecognized tax benefit liability in the consolidated balance sheetswere $15 million and $12 million at December 31, 2016 and 2015.
Other MattersSince October 1, 2010, we have been included in GM's consolidated U.S. federal income tax returns. For taxableincome we recognize in any period beginning on or after October 1, 2010, we are obligated to pay GM for our share of theconsolidated U.S. federal and certain state tax liabilities. Amounts owed to GM for income taxes are accrued and recorded as a relatedparty payable. Under our tax sharing arrangement with GM, payments related to our U.S. operations for the tax years 2010 through2014 were deferred for four years from their original due date. During 2015, the outstanding balance was converted to and treated as acapital contribution. At December 31, 2016 and 2015, there were no related party taxes payable due to GM due to our taxable lossposition.
Income tax returns are filed in multiple jurisdictions and are subject to examination by taxing authorities throughout the world.We have open tax years from 2010 to 2016 with various tax jurisdictions. These open years contain matters that could be subject todiffering interpretations of applicable tax laws and regulations as they relate to the amount, character, timing or inclusion of revenueand/or recognition of expenses, or the sustainability of income tax credits. Certain of our state and foreign tax returns are currentlyunder examination in various jurisdictions.
Note 15. Supplemental Cash Flow Information
Cash payments for interest costs and income taxes consist of the following:
Years Ended December 31,
2016 2015 2014
Interest costs (none capitalized)$ 1,857 $ 1,295 $ 1,120
Income taxes$ 120 $ 84 $ 127
Non-cash investing items consist of the following:
Years Ended December 31,
2016 2015 2014
Subvention receivable from GM$ 373 $ 383 $ 189
Commercial loan funding payable to GM$ 389 $ 351 $ 427

GENERAL MOTORS FINANCIAL COMPANY, INC.
NOTES TO CONSOLIDATED FINANCIAL STATEMENTS - (Continued)
Note 16. Segment Reporting and Geographic Information
We offer substantially similar products and services throughout many different regions, subject to local regulations and marketconditions. We evaluate our business in two operating segments: the North America Segment and the International Segment. TheNorth America Segment includes our operations in the U.S. and Canada. The International Segment includes our operations in allother countries. Our chief operating decision maker evaluates the operating results and performance of our business based on theseoperating segments. The management of each segment is responsible for executing our strategies.
For segment reporting purposes only, interest expense related to the senior notes has been allocated based on targeted leveragefor each segment. Interest expense in excess of the targeted overall leverage is reflected in the "Corporate" column below. In addition,the interest income on intercompany loans provided to the international operations is presented in the "Corporate" column as revenue.Key operating data for our operating segments were as follows:
Year Ended December 31, 2016North
America International Corporate Eliminations Total
Total revenue $ 7,948 $ 1,610 $ (1) $ 1 $ 9,558
Operating expenses 891 599 — — 1,490
Leased vehicle expenses 4,499 30 — — 4,529
Provision for loan losses 566 103 — — 669
Interest expense 1,481 626 — 1 2,108
Equity income — 151 — — 151
Income (loss) before income taxes $ 511 $ 403 $ (1) $ — $ 913
Year Ended December 31, 2015North
America International Corporate Eliminations Total
Total revenue $ 4,777 $ 1,677 $ 13 $ (13) $ 6,454
Operating expenses 735 558 — — 1,293
Leased vehicle expenses 2,190 10 — — 2,200
Provision for loan losses 466 158 — — 624
Interest expense 833 722 74 (13) 1,616
Equity income — 116 — — 116
Income (loss) before income taxes $ 553 $ 345 $ (61) $ — $ 837
Year Ended December 31, 2014North
America International Corporate Eliminations Total
Total revenue $ 2,909 $ 1,945 $ 56 $ (56) $ 4,854
Operating expenses 542 620 — — 1,162Leased vehicle expenses 843 4 — — 847
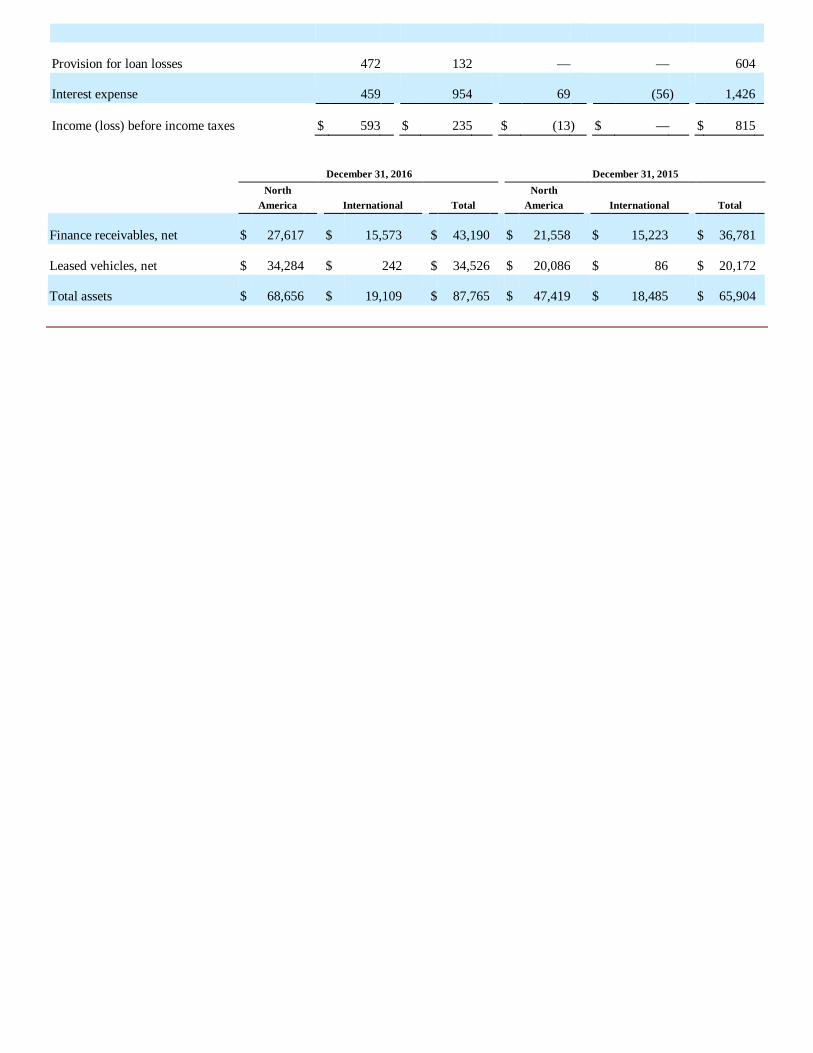
Provision for loan losses 472 132 — — 604
Interest expense 459 954 69 (56) 1,426
Income (loss) before income taxes $ 593 $ 235 $ (13) $ — $ 815
December 31, 2016 December 31, 2015North
America International TotalNorth
America International Total
Finance receivables, net $ 27,617 $ 15,573 $ 43,190 $ 21,558 $ 15,223 $ 36,781
Leased vehicles, net $ 34,284 $ 242 $ 34,526 $ 20,086 $ 86 $ 20,172
Total assets $ 68,656 $ 19,109 $ 87,765 $ 47,419 $ 18,485 $ 65,904

GENERAL MOTORS FINANCIAL COMPANY, INC.
NOTES TO CONSOLIDATED FINANCIAL STATEMENTS - (Continued)
GeographicInformation At and For the Years Ended December 31,
2016 2015 2014
Revenue Long-Lived Assets(a) Revenue Long-Lived Assets(a) Revenue Long-Lived Assets(a)
U.S. $ 7,440 $ 32,506 $ 4,324 $ 18,501 $ 2,552 $ 5,477
Canada 508 1,982 453 1,731 357 1,635
Brazil 652 3 757 3 964 4
Other countries(b) 958 314 920 156 981 116
Total consolidated $ 9,558 $ 34,805 $ 6,454 $ 20,391 $ 4,854 $ 7,232_________________
(a) Long-lived assets includes $34.5 billion, $20.2 billion and $7.1 billion of vehicles on operating leases at December 31, 2016,2015, and 2014.
(b)
No individual country represents more than 10% of our total revenue or long-livedassets.
Note 17. Accumulated Other Comprehensive Loss
Years Ended December 31,
2016 2015 2014
Unrealized gain on cash flow hedgesBeginning balance
$ — $ — $ —
Change in value of cash flow hedges, net of tax 17 — —Ending balance
17 — —Defined benefit plans
Beginning balance(13) (11) 3
Unrealized loss on subsidiary pension, net of tax (7) (2) (14)Ending balance (20) (13) (11)
Foreign currency translation adjustmentBeginning balance
(1,091) (422) 8Translation loss, net of tax (144) (669) (430)
Ending balance (1,235) (1,091) (422)Total accumulated other comprehensive loss $ (1,238) $ (1,104) $ (433)
Note 18. Regulatory Capital and Other Regulatory Matters
We are required to comply with a wide variety of laws and regulations. The International Segment includes the operations ofcertain stand-alone entities that operate in local markets as either banks or regulated finance companies and are subject to regulatoryrestrictions. These regulatory restrictions, among other things, require that these entities meet certain minimum capital requirementsand may restrict dividend distributions and ownership of certain assets. We were in compliance with all regulatory capitalrequirements as most recently reported. The following table lists the most recently reported minimum statutory capital requirementsand the actual statutory capital for our significant regulated international banks by country:
Minimum CapitalRequirement Actual Capital
Germany 8.6% 17.2%

Brazil 11.0% 16.9%
Total assets of our regulated international banks and finance companies were approximately $12.6 billion and $11.1 billion atDecember 31, 2016 and 2015.

GENERAL MOTORS FINANCIAL COMPANY, INC.
NOTES TO CONSOLIDATED FINANCIAL STATEMENTS - (Continued)
Note 19. Quarterly Financial Data (unaudited)
The following tables summarize supplementary quarterly financial information:
FirstQuarter
SecondQuarter
ThirdQuarter
FourthQuarter
2016Total revenue
$ 2,075 $ 2,292 $ 2,499 $ 2,692Income before income taxes
$ 225 $ 266 $ 228 $ 194Net income
$ 164 $ 189 $ 147 $ 254
2015Total revenue
$ 1,354 $ 1,515 $ 1,707 $ 1,878Income before income taxes
$ 214 $ 225 $ 231 $ 167Net income
$ 150 $ 186 $ 179 $ 131
Note 20. Guarantor Consolidating Financial Statements
The payment of principal and interest on senior notes issued by our top-tier holding company is currently guaranteed solely byAFSI (the "Guarantor") and none of our other subsidiaries (the "Non-Guarantor Subsidiaries"). The Guarantor is a 100% ownedconsolidated subsidiary and is unconditionally liable for the obligations represented by the senior notes. The Guarantor’s guaranteemay be released only upon customary circumstances, the terms of which vary by issuance. Customary circumstances include the saleor disposition of all of the Guarantor’s assets or capital stock, the achievement of investment grade rating of the senior notes and legalor covenant defeasance.
The consolidating financial statements present consolidating financial data for (i) General Motors Financial Company, Inc. (on aparent-only basis), (ii) the Guarantor, (iii) the combined Non-Guarantor Subsidiaries and (iv) the parent company and our subsidiarieson a consolidated basis at December 31, 2016 and December 31, 2015 and for the years ended December 31, 2016, 2015, and 2014(after the elimination of intercompany balances and transactions).
Investments in subsidiaries are accounted for by the parent company using the equity method for purposes of this presentation.Results of operations of subsidiaries are therefore reflected in the parent company's investment accounts and earnings. The principalelimination entries set forth below eliminate investments in subsidiaries and intercompany balances and transactions.

GENERAL MOTORS FINANCIAL COMPANY, INC.
NOTES TO CONSOLIDATED FINANCIAL STATEMENTS - (Continued)
CONSOLIDATING BALANCE SHEETDecember 31, 2016
GeneralMotors
FinancialCompany, Inc. Guarantor
Non-Guarantors Eliminations Consolidated
ASSETSCash and cash equivalents
$ — $ 2,284 $ 917 $ — $ 3,201Finance receivables, net
— 4,969 38,221 — 43,190Leased vehicles, net
— — 34,526 — 34,526Goodwill
1,095 — 101 — 1,196Equity in net assets of non-consolidated
affiliates — — 944 — 944Property and equipment, net
— 152 127 — 279Deferred income taxes
502 89 274 (591) 274Related party receivables
— 25 485 — 510Other assets
4 643 3,167 (169) 3,645Due from affiliates
24,548 16,065 — (40,613) —Investment in affiliates
8,986 6,445 — (15,431) —Total assets
$ 35,135 $ 30,672 $ 78,762 $ (56,804) $ 87,765
LIABILITIES AND SHAREHOLDER'SEQUITYLiabilities
Secured debt$ — $ — $ 39,439 $ (169) $ 39,270
Unsecured debt26,076 — 8,530 — 34,606
Accounts payable and accrued expenses302 273 899 — 1,474
Deferred income— — 2,365 — 2,365
Deferred income taxes— — 811 (591) 220
Related party payables1 — 399 — 400
Other liabilities63 417 257 — 737
Due to affiliates— 24,437 16,176 (40,613) —
Total liabilities26,442 25,127 68,876 (41,373) 79,072
Shareholder's equityCommon stock
— — 698 (698) —Additional paid-in capital
6,505 79 5,345 (5,424) 6,505Accumulated other comprehensive loss
(1,238) (161) (1,223) 1,384 (1,238)Retained earnings
3,426 5,627 5,066 (10,693) 3,426

Total shareholder's equity8,693 5,545 9,886 (15,431) 8,693
Total liabilities and shareholder's equity$ 35,135 $ 30,672 $ 78,762 $ (56,804) $ 87,765

GENERAL MOTORS FINANCIAL COMPANY, INC.
NOTES TO CONSOLIDATED FINANCIAL STATEMENTS - (Continued)
CONSOLIDATING BALANCE SHEETDecember 31, 2015
GeneralMotors
FinancialCompany, Inc. Guarantor
Non-Guarantors Eliminations Consolidated
ASSETSCash and cash equivalents
$ — $ 2,259 $ 802 $ — $ 3,061Finance receivables, net
— 4,808 31,973 — 36,781Leased vehicles, net
— — 20,172 — 20,172Goodwill
1,095 — 94 — 1,189Equity in net assets of non-consolidated
affiliates — — 986 — 986Property and equipment, net
— 41 178 — 219Deferred income taxes
212 — 179 (160) 231Related party receivables
— 27 546 — 573Other assets
32 92 2,568 — 2,692Due from affiliates
15,573 7,556 — (23,129) —Investment in affiliates
8,476 6,425 — (14,901) —Total assets
$ 25,388 $ 21,208 $ 57,498 $ (38,190) $ 65,904
LIABILITIES AND SHAREHOLDER'SEQUITYLiabilities
Secured debt$ — $ — $ 30,689 $ — $ 30,689
Unsecured debt17,087 — 6,570 — 23,657
Accounts payable and accrued expenses181 717 320 — 1,218
Deferred income— — 1,454 — 1,454
Deferred income taxes— 289 — (160) 129
Related party payables— — 362 — 362
Other liabilities68 34 241 — 343
Due to affiliates— 15,495 7,634 (23,129) —
Total liabilities17,336 16,535 47,270 (23,289) 57,852
Shareholder's equityCommon stock
— — 698 (698) —Additional paid-in capital
6,484 79 6,490 (6,569) 6,484Accumulated other comprehensive loss
(1,104) (175) (1,095) 1,270 (1,104)Retained earnings
2,672 4,769 4,135 (8,904) 2,672

Total shareholder's equity8,052 4,673 10,228 (14,901) 8,052
Total liabilities and shareholder's equity$ 25,388 $ 21,208 $ 57,498 $ (38,190) $ 65,904

GENERAL MOTORS FINANCIAL COMPANY, INC.
NOTES TO CONSOLIDATED FINANCIAL STATEMENTS - (Continued)
CONSOLIDATING STATEMENT OF INCOMEYear Ended December 31, 2016
GeneralMotors
FinancialCompany, Inc. Guarantor
Non-Guarantors Eliminations Consolidated
RevenueFinance charge income
$ — $ 432 $ 2,897 $ — $ 3,329Leased vehicle income
— — 5,925 — 5,925Other income
(1) 883 97 (675) 304Total revenue
(1) 1,315 8,919 (675) 9,558Costs and expenses
Salaries and benefits— 597 256 — 853
Other operating expenses2 200 837 (402) 637
Total operating expenses2 797 1,093 (402) 1,490
Leased vehicle expenses— — 4,529 — 4,529
Provision for loan losses— 378 291 — 669
Interest expense557 296 1,528 (273) 2,108
Total costs and expenses559 1,471 7,441 (675) 8,796
Equity income 994 771 151 (1,765) 151Income before income taxes
434 615 1,629 (1,765) 913Income tax (benefit) provision
(320) (89) 568 — 159Net income
$ 754 $ 704 $ 1,061 $ (1,765) $ 754
Comprehensive income$ 620 $ 718 $ 933 $ (1,651) $ 620

GENERAL MOTORS FINANCIAL COMPANY, INC.
NOTES TO CONSOLIDATED FINANCIAL STATEMENTS - (Continued)
CONSOLIDATING STATEMENT OF INCOMEYear Ended December 31, 2015
GeneralMotors
FinancialCompany, Inc. Guarantor
Non-Guarantors Eliminations Consolidated
RevenueFinance charge income
$ — $ 403 $ 2,978 $ — $ 3,381Leased vehicle income
— — 2,807 — 2,807Other income
13 505 139 (391) 266Total revenue
13 908 5,924 (391) 6,454Costs and expenses
Salaries and benefits— 332 394 — 726
Other operating expenses64 105 649 (251) 567
Total operating expenses64 437 1,043 (251) 1,293
Leased vehicle expenses— — 2,200 — 2,200
Provision for loan losses— 398 226 — 624
Interest expense488 18 1,250 (140) 1,616
Total costs and expenses552 853 4,719 (391) 5,733
Equity income 941 579 116 (1,520) 116Income before income taxes
402 634 1,321 (1,520) 837Income tax (benefit) provision
(244) 25 410 — 191Net income
$ 646 $ 609 $ 911 $ (1,520) $ 646
Comprehensive (loss) income$ (25) $ 498 $ 225 $ (723) $ (25)

GENERAL MOTORS FINANCIAL COMPANY, INC.
NOTES TO CONSOLIDATED FINANCIAL STATEMENTS - (Continued)
CONSOLIDATING STATEMENT OF INCOMEYear Ended December 31, 2014
GeneralMotors
FinancialCompany, Inc. Guarantor
Non-Guarantors Eliminations Consolidated
RevenueFinance charge income
$ — $ 194 $ 3,281 $ — $ 3,475Leased vehicle income
— — 1,090 — 1,090Other income
68 432 178 (389) 289Total revenue
68 626 4,549 (389) 4,854Costs and expenses
Salaries and benefits— 249 365 — 614
Other operating expenses159 (17) 657 (251) 548
Total operating expenses159 232 1,022 (251) 1,162
Leased vehicle expenses— — 847 — 847
Provision for loan losses— 334 270 — 604
Interest expense232 23 1,309 (138) 1,426
Total costs and expenses391 589 3,448 (389) 4,039
Equity income 757 523 — (1,280) —Income before income taxes
434 560 1,101 (1,280) 815Income tax (benefit) provision
(103) 12 369 — 278Net income
$ 537 $ 548 $ 732 $ (1,280) $ 537
Comprehensive income$ 93 $ 491 $ 298 $ (789) $ 93

GENERAL MOTORS FINANCIAL COMPANY, INC.
NOTES TO CONSOLIDATED FINANCIAL STATEMENTS - (Continued)
CONSOLIDATING STATEMENT OF CASH FLOWSYear Ended December 31, 2016
GeneralMotors
FinancialCompany, Inc. Guarantor
Non-Guarantors Eliminations Consolidated
Cash flows from operating activities
Net income $ 754 $ 704 $ 1,061 $ (1,765) $ 754Adjustments to reconcile net income to net cash (used in)
provided by operating activities
Depreciation and amortization 37 26 4,776 — 4,839Accretion and amortization of loan and leasingfees — 17 (1,189) — (1,172)
Amortization of carrying value adjustment — (3) (26) — (29)Undistributed earnings of non-consolidatedaffiliates, net (994) (771) (22) 1,765 (22)
Provision for loan losses — 378 291 — 669
Deferred income taxes (313) (390) 745 — 42
Stock-based compensation expense 24 — 1 — 25
Other operating activities (299) 289 11 — 1
Changes in assets and liabilities:
Other assets 18 (347) (114) — (443)
Accounts payable and accrued expenses 117 (438) 535 — 214
Taxes payable (1) — (1) — (2)
Related party payables — — 5 — 5
Net cash (used in) provided by operating activities (657) (535) 6,073 — 4,881
Cash flows from investing activities
Purchases of retail finance receivables, net — (15,847) (20,080) 18,131 (17,796)Principal collections and recoveries on retail finance
receivables — 1,542 11,630 — 13,172Proceeds from transfer of retail finance receivables,net — 13,897 4,234 (18,131) —
Net funding of commercial finance receivables — (191) (2,790) — (2,981)
Purchases of leased vehicles, net — — (19,612) — (19,612)
Proceeds from termination of leased vehicles — — 2,557 — 2,557
Purchases of property and equipment — (82) (25) — (107)
Other investing activities — (169) (7) 169 (7)
Net change in due from affiliates (8,966) (8,508) — 17,474 —
Net change in investment in affiliates 339 787 — (1,126) —
Net cash used in investing activities (8,627) (8,571) (24,093) 16,517 (24,774)
Cash flows from financing activitiesNet change in debt (original maturities less than threemonths) 8 — 772 — 780
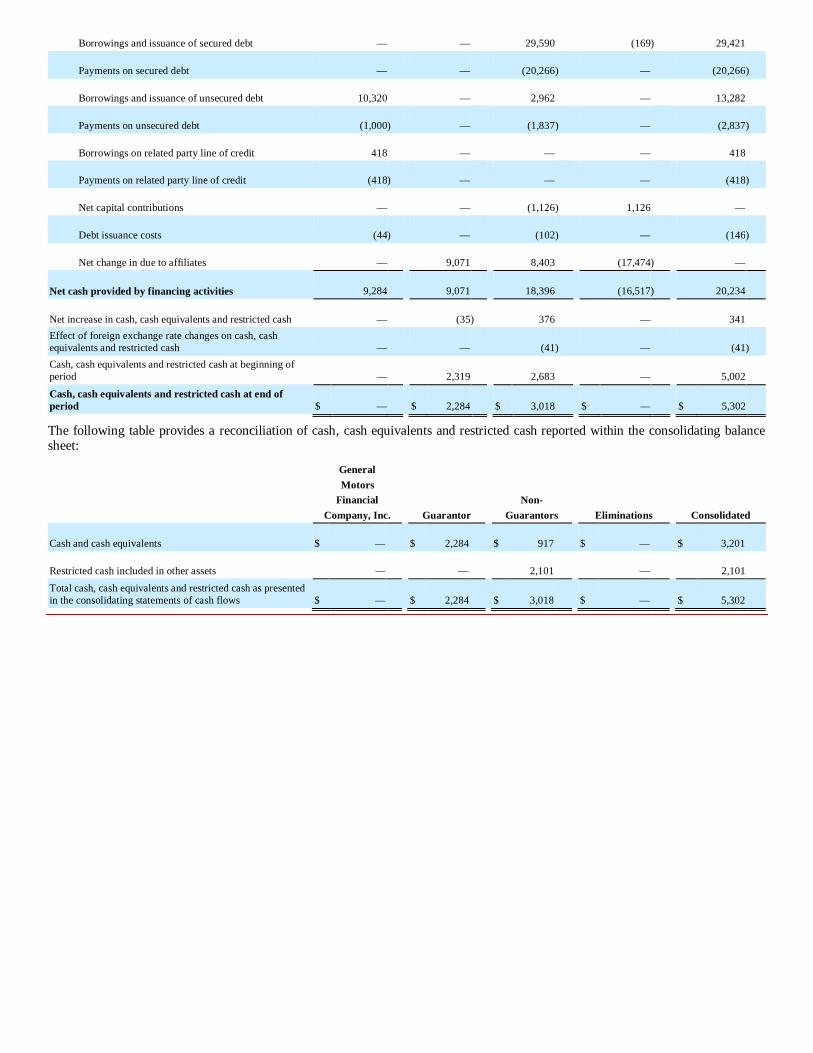
Borrowings and issuance of secured debt — — 29,590 (169) 29,421
Payments on secured debt — — (20,266) — (20,266)
Borrowings and issuance of unsecured debt 10,320 — 2,962 — 13,282
Payments on unsecured debt (1,000) — (1,837) — (2,837)
Borrowings on related party line of credit 418 — — — 418
Payments on related party line of credit (418) — — — (418)
Net capital contributions — — (1,126) 1,126 —
Debt issuance costs (44) — (102) — (146)
Net change in due to affiliates — 9,071 8,403 (17,474) —
Net cash provided by financing activities 9,284 9,071 18,396 (16,517) 20,234
Net increase in cash, cash equivalents and restricted cash — (35) 376 — 341Effect of foreign exchange rate changes on cash, cashequivalents and restricted cash — — (41) — (41)Cash, cash equivalents and restricted cash at beginning ofperiod — 2,319 2,683 — 5,002
Cash, cash equivalents and restricted cash at end ofperiod $ — $ 2,284 $ 3,018 $ — $ 5,302
The following table provides a reconciliation of cash, cash equivalents and restricted cash reported within the consolidating balancesheet:
GeneralMotors
FinancialCompany, Inc. Guarantor
Non-Guarantors Eliminations Consolidated
Cash and cash equivalents $ — $ 2,284 $ 917 $ — $ 3,201
Restricted cash included in other assets — — 2,101 — 2,101Total cash, cash equivalents and restricted cash as presentedin the consolidating statements of cash flows $ — $ 2,284 $ 3,018 $ — $ 5,302

GENERAL MOTORS FINANCIAL COMPANY, INC.
NOTES TO CONSOLIDATED FINANCIAL STATEMENTS - (Continued)
CONSOLIDATING STATEMENT OF CASH FLOWSYear Ended December 31, 2015
GeneralMotors
FinancialCompany, Inc. Guarantor
Non-Guarantors Eliminations Consolidated
Cash flows from operating activities
Net income $ 646 $ 609 $ 911 $ (1,520) $ 646Adjustments to reconcile net income to net cash (used in)
provided by operating activities
Depreciation and amortization 28 3 2,372 — 2,403Accretion and amortization of loan and leasingfees — 25 (634) — (609)
Amortization of carrying value adjustment — (14) (135) — (149)Undistributed earnings of non-consolidatedaffiliates, net (941) (579) (116) 1,520 (116)
Provision for loan losses — 398 226 — 624
Deferred income taxes (189) 2 319 — 132
Stock-based compensation expense 33 — 3 — 36
Other operating activities 32 (5) (64) — (37)
Changes in assets and liabilities:
Other assets (3) 25 (397) — (375)
Accounts payable and accrued expenses 100 531 (349) — 282
Taxes payable (12) 1 (9) — (20)
Related party taxes payable (636) — — — (636)
Related party payables 1 — (14) — (13)
Net cash (used in) provided by operating activities (941) 996 2,113 — 2,168
Cash flows from investing activities
Purchases of retail finance receivables, net — (13,997) (16,981) 13,461 (17,517)Principal collections and recoveries on retail finance
receivables — 755 10,971 — 11,726Proceeds from transfer of retail finance receivables,net — 10,428 3,033 (13,461) —
Net funding of commercial finance receivables — 6 (1,023) — (1,017)
Purchases of leased vehicles, net — — (15,337) — (15,337)
Proceeds from termination of leased vehicles — — 1,096 — 1,096
Acquisition of international operations (513) (536) — — (1,049)
Disposition of equity interest — 125 — — 125
Purchases of property and equipment — (21) (69) — (90)
Other investing activities — — 30 — 30
Net change in due from affiliates (8,819) (5,593) — 14,412 —
Net change in investment in affiliates (6) (1,893) — 1,899 —

Net cash used in investing activities (9,338) (10,726) (18,280) 16,311 (22,033)
Cash flows from financing activitiesNet change in debt (original maturities less than threemonths) — — 1,147 — 1,147
Borrowings and issuance of secured debt — — 22,385 — 22,385
Payments on secured debt — — (15,178) — (15,178)
Borrowings and issuance of unsecured debt 9,687 — 3,290 — 12,977
Payments on unsecured debt — — (1,709) — (1,709)
Net capital contributions 649 — 1,899 (1,899) 649
Debt issuance costs (58) — (97) — (155)
Other 1 — — — 1
Net change in due to affiliates — 9,766 4,646 (14,412) —
Net cash provided by financing activities 10,279 9,766 16,383 (16,311) 20,117
Net increase in cash, cash equivalents and restricted cash — 36 216 — 252Effect of foreign exchange rate changes on cash, cashequivalents and restricted cash — — (295) — (295)Cash, cash equivalents and restricted cash at beginning ofperiod — 2,283 2,762 — 5,045
Cash, cash equivalents and restricted cash at end ofperiod $ — $ 2,319 $ 2,683 $ — $ 5,002
The following table provides a reconciliation of cash, cash equivalents and restricted cash reported within the consolidating balancesheet:
GeneralMotors
FinancialCompany, Inc. Guarantor
Non-Guarantors Eliminations Consolidated
Cash and cash equivalents $ — $ 2,259 $ 802 $ — $ 3,061
Restricted cash included in other assets — 60 1,881 — 1,941Total cash, cash equivalents and restricted cash as presentedin the consolidating statements of cash flows $ — $ 2,319 $ 2,683 $ — $ 5,002

GENERAL MOTORS FINANCIAL COMPANY, INC.
NOTES TO CONSOLIDATED FINANCIAL STATEMENTS - (Continued)
CONSOLIDATING STATEMENT OF CASH FLOWSYear Ended December 31, 2014
GeneralMotors
FinancialCompany, Inc. Guarantor
Non-Guarantors Eliminations Consolidated
Cash flows from operating activities
Net income $ 537 $ 548 $ 732 $ (1,280) $ 537Adjustments to reconcile net income to net cash (used in)
provided by operating activities
Depreciation and amortization 14 2 976 — 992Accretion and amortization of loan and leasingfees — 4 (367) — (363)
Amortization of carrying value adjustment — (4) (230) — (234)Undistributed earnings of non-consolidatedaffiliates, net (757) (523) — 1,280 —
Provision for loan losses — 334 270 — 604
Deferred income taxes 1 127 (211) — (83)
Stock-based compensation expense 18 — 1 — 19
Other operating activities 137 (2) 47 — 182Changes in assets and liabilities, net of assets and liabilities
acquired:
Other assets (18) (14) (53) — (85)
Accounts payable and accrued expenses 36 (25) 122 — 133
Taxes payable (3) — (60) — (63)
Related party taxes payable (7) — — — (7)
Related party payable — — 5 — 5
Net cash (used in) provided by operating activities (42) 447 1,232 — 1,637
Cash flows from investing activities
Purchases of retail finance receivables, net — (8,220) (14,321) 7,792 (14,749)Principal collections and recoveries on retail financereceivables — (99) 10,959 — 10,860Proceeds from transfer of retail finance receivables,net — 6,369 1,423 (7,792) —
Net funding of commercial finance receivables — (128) (1,770) — (1,898)
Purchases of leased vehicles, net — — (4,882) — (4,882)
Proceeds from termination of leased vehicles — — 533 — 533
Acquisition of international operations (46) — — — (46)
Purchases of property and equipment — (20) (32) — (52)
Other investing activities — — (2) — (2)
Net change in due from affiliates (3,149) (443) (400) 3,992 —
Net change in investment in affiliates (357) (27) — 384 —

Net cash used in investing activities (3,552) (2,568) (8,492) 4,376 (10,236)
Cash flows from financing activitiesNet change in debt (original maturities less than threemonths) — — 470 — 470
Borrowings and issuance of secured debt — — 21,080 — 21,080
Payments on secured debt — — (16,890) — (16,890)
Borrowings and issuance of unsecured debt 3,500 — 3,674 — 7,174
Payments on unsecured debt — — (1,889) — (1,889)
Net capital contribution 996 — 382 (382) 996
Debt issuance costs (39) — (88) — (127)
Net change in due to affiliates (863) 3,989 866 (3,992) —
Net cash provided by financing activities 3,594 3,989 7,605 (4,374) 10,814
Net increase in cash, cash equivalents and restricted cash — 1,868 345 2 2,215Effect of foreign exchange rate changes on cash, cashequivalents and restricted cash — — (199) (2) (201)Cash, cash equivalents and restricted cash at beginning ofperiod — 415 2,616 — 3,031Cash, cash equivalents and restricted cash at end ofperiod $ — $ 2,283 $ 2,762 $ — $ 5,045