
GLX Holding - Glamox...2019/04/30 · GLX HOLDING AS org.nr. 919 505 281 Board of Directors Annual...
68
GLX Holding Annual Report 2018 General information GLX Holding AS (parent company) GLX Holding AS is a special purpose vehicle incorporated 14 th August 2017 by Triton to acquire Glamox AS which is the parent company of the Glamox Group. GLX Holding holds 76.16% of the shares in Glamox AS. GLX Holding consolidates 100% of the Glamox Group in its financial accounts from 11 th December 2017. 1
Transcript of GLX Holding - Glamox...2019/04/30 · GLX HOLDING AS org.nr. 919 505 281 Board of Directors Annual...

GLX Holding Annual Report 2018
General information GLX Holding AS (parent company) GLX Holding AS is a special purpose vehicle incorporated 14th August 2017 by Triton to acquire Glamox AS which is the parent company of the Glamox Group. GLX Holding holds 76.16% of the shares in Glamox AS. GLX Holding consolidates 100% of the Glamox Group in its financial accounts from 11th December 2017.
1

Highlights [Financial figures for 2017 disclosed on this page are Glamox Group financial figures only]
• Order intake1 reached NOK 2 935m, up 11% from NOK 2 653m in 2017.
• Total revenues reached NOK 2 773m, up 6% from NOK 2 615m in 2017.
• EBITDA2/margin of NOK 328m/11.8% compared to NOK 369m/14.1% in 2017.
• Adjusted EBITDA3/margin of NOK 420m/15.2% compared to NOK 393m/15.1% in 2017.
• EBITA4/margin of NOK 275m/9.9% compared to NOK 325m/12.4% in 2017.
• Adjusted EBITA5/margin of NOK 367m/13.3% compared to NOK 350m/13.5% in 2017.
• The EBITA result is charged with NOK 92m as net special items6 in 2018. Last year included NOK24m as net special items.
• Profit for the year of NOK 66m compared to NOK 258m in 2017.
• Compared to Glamox Group’s 2017 result, increased net financial expenses and amortizationsare impacting the profit for the year negatively. The increased net financial expense is related tothe bond issued in Q4-2017, while increased amortization cost is an effect of GLX Holding AS’acquisition of Glamox AS.
• Operating cash flow was NOK 215m compared to NOK 197m in 2017.
• Acquired Küttel AG a leading lighting company in Switzerland on the 1st April 2018.
Key figures 2018 20177
Order intake1 2 935 2 653 Total revenues 2 773 2 615 EBITDA2 328 369
EBITDA margin 11.8 % 14.1 % Adjusted EBITDA2 420 393
Adjusted EBITDA margin 15.2 % 15.1 % Profit (loss) for the year 66 258 Net cash from operations 215 197 Net interest-bearing debt8 (1 288) (29)
1 Order intake: Orders received measured at gross value before deduction of commissions and other sales reductions 2 EBITDA: Earnings before interest, tax, depreciation, amortization 3 Adjusted EBITDA: Earnings before interest, tax, depreciation, amortization and special items 4 EBITA: Earnings before interest, tax, amortization 5 Adjusted EBITA: Earnings before interest, tax, amortization, and special items 6 Special Items: Any items (positive or negative) of a one off, non-recurring, unusual, non-operational or exceptional nature
including restructuring expenses 7 Glamox Group financial figures only 8 Excluding restricted cash
2

GLX HOLDING AS
org.nr. 919 505 281
Board of Directors Annual Report 2018
1. The company's businessThe company was formed August 14, 2017 and registered in the Register of Business Enterprises,September 7, 2017.
The company's business is to own shares in Glamox AS. The company’s operations are run from the Oslo municipality. At December 11, 2017, GLX Holding AS became parent company of Glamox AS with a 75.16% ownership. During 2018 GLX Holding AS has increased its ownership in Glamox AS to 76.16%. Glamox AS registered address is in Molde, Norway. Headquarter is located in Oslo. Glamox AS has subsidiaries in 15 countries in Europe, Asia, North- and South-America.
Glamox is a Norwegian industrial group that develops, manufactures and distributes professional lighting solutions for the global market. Glamox operates two business areas, Professional Building Solutions (PBS) and Global Marine and Offshore (GMO). The two business areas, PBS and GMO, have to a large extent different products and solutions they provide to their markets. Further they operate in strategically different markets and therefore have different sales channels, marketing strategies and risk. The PBS business area provides total lighting solutions to the professional building market. The most important markets served by this division are Central and Northern Europe, as well as the United States for arm-based table and illuminated magnifier lamps. The level of activity in the new construction, restoration and modernisation within the professional building sectors drives developments in the individual markets. The GMO business area delivers professional lighting solutions to the global marine and offshore markets. The activity level within new-build, rebuilding and refurbishment of all types of maritime vessels and offshore installations controls market growth for this business.
For further information about Glamox AS's operations, see Glamox AS's annual report.
The company does not own shares in any other companies.
2. Continued operationIn accordance with Section 3-3a of the Norwegian Accounting Act, cf. § 4-5, it is confirmed that theassumption of continuation of operations has been used in the preparation of the accounts.
3. Statement of the financial statementsThe profit for the year for the company shows a loss of NOK 100.3 million. The company's equitycapital per. December 31, 2018 was NOK 1 447 million (51.9%) compared with NOK 1 547 million(52.8%) per December 31, 2017.
The operating profit in 2018 for the consolidated accounts was NOK 193.0 million compared to NOK -50.1 million in 2017. Last year only included operating profit from Glamox in the owner period (11.12.2017-31.12.2017). The accounts for the year were charged with NOK 91.6 million in net special items including NOK 44 million related to restructuring costs in GMO where the Group discontinued the metal production and outsourced warehouse service in Bremen, a provision of NOK 41 million for claim costs related to one product sold to the energy segment over several years, an extraordinary bonus to all employees of NOK 8 million and an income from the reversal of a cost provision of NOK 3 million as well as some other smaller items. Adjusted for these special items and provisions, the adjusted operating profit for the year was NOK 284.6 million and adjusted EBITDA NOK 419,7 million. The profit for the year in the consolidated accounts was NOK 66.5 million. The consolidated equity capital per. December 31, 2018 was NOK 1 966 million (43.3%) compared to NOK 1 919 million (44.7%) in December 31, 2017.
The Group directly expensed NOK 35.6 million related to research and development activities and capitalised NOK 3.3m related to development cost in 2018.
The consolidated cash flow of GLX Holding in 2018 show a negative cash flow of NOK 0.4 million in 2018. Net cash flows from operating activities amounts to NOK 214.8 million in 2018 compared to kr. -0.1 in 2017. Last year only included profit from Glamox for the owner period (11.12.2017-
3
31.12.2017). Profit before tax adjusted for depreciation and amortisation was NOK 230.5 million, taxes paid was NOK -82.2 million while the effect of working capital and other operating changes was NOK 66.4 million. Net cash flow from investing activities was NOK -192.2m while net cash flow from financing activities amounts to NOK -22.9m
The Board believes the company's equity and liquidity as of 31.12.2018 to be satisfactory.
In the opinion of the Board, the presented income statement and balance sheet and accompanying notes for the company and the consolidated accounts provide a satisfactory statement of earnings in 2018 and the financial position at year-end.
4. Financial risk managementThe Group is exposed to credit risk, interest risk and exchange risk in its day-to-day businessoperations and aims to keep risk at an acceptable level in these areas. The underlying loancontracts are instrumental for managing interest risk. Currency risk is managed through internalinvoicing rules, matching income against expenses in the same currency and loans against equityin the same currency, as well as the use of financial instruments.
In June 2018 GLX Holding AS entered into a 3-year floating-to-fixed interest rate swap with DNB and Danske Bank for the nominal amount of NOK 1 350 in order to remove interest rate risk on its senior secured notes. For more detailed information, see note 5.5 in the Annual Accounts.
5. Development by business areasProfessional Building Solutions (PBS) is a leading supplier of lighting solutions to the European non-residential building market. PBS develop complete solutions for educational and healthcareinstitutions, commercial and industrial buildings. PBS achieved an order intake of NOK 2 125m(NOK 1 870m) in 2018, an increase of 13.6 % compared to 2017. In the same period, turnoverwas NOK 2 024m (NOK 1 859m), an increase of 8.9 % from 2017. The business area achieved anadjusted EBITDA result in 2018 of NOK 360m (17.8%) compared to NOK 321m (17.3%) in 2017.The increase in profitability is driven by the growth in volume and economies of scale in the wholevalue chain.
Global Marine & Offshore (GMO) provides lighting solutions for the maritime and offshore-related markets, plus onshore energy and petrochemical industry. GMO achieved an order intake of NOK 802m (NOK 778m), an increase of 3.1 %. In the same period, turnover was NOK 745m (NOK 738m), an increase of 1.0 %. The adjusted EBITDA result in 2018 was NOK 65m (8.7%) compared to NOK 72m (9.8%) in 2017. Increased investments in sales capacity and product development is the main reason for the reduced profitability level.
6. Proposal for allocation of profitThe Board of directors proposes that the year's profit of NOK 66 462 million is allocated to otherequity capital.
7. Acquisition of KüttelAs a step in the acquisition strategy the Group acquired the company Küttel AG in 2018. Küttel AGis a leading company in the Swiss market for commercial lighting solutions with a widely-recognized and well-respected brand. With this acquisition the Group has increased the marketpresence in central Europe and established a leading position in Switzerland.
The acquisition was closed on 1st April 2018 and Küttel AG is consolidated in the Group’s accounts from the 2nd quarter 2018. Küttel AG operates as a separate business unit in the Professional Building Solutions (PBS) division.
8. Corporate governanceThe Board of directors considers corporate governance to be a prerequisite for long-term valuecreation and growth. The Board of Directors has decided that the GLX Holding AS will comply withthe Norwegian Code of Practice for Corporate governance (which is available at www.nues.no).
Further information on GLX Holding AS’ corporate governance can be found under “Investor Relations / GLX Holding AS” on the Glamox corporate website.
9. Code of conductOn the 30th August 2018 the Board of Directors of Glamox AS approved a Code of Conduct that allemployees and Board members are required to comply with.
4
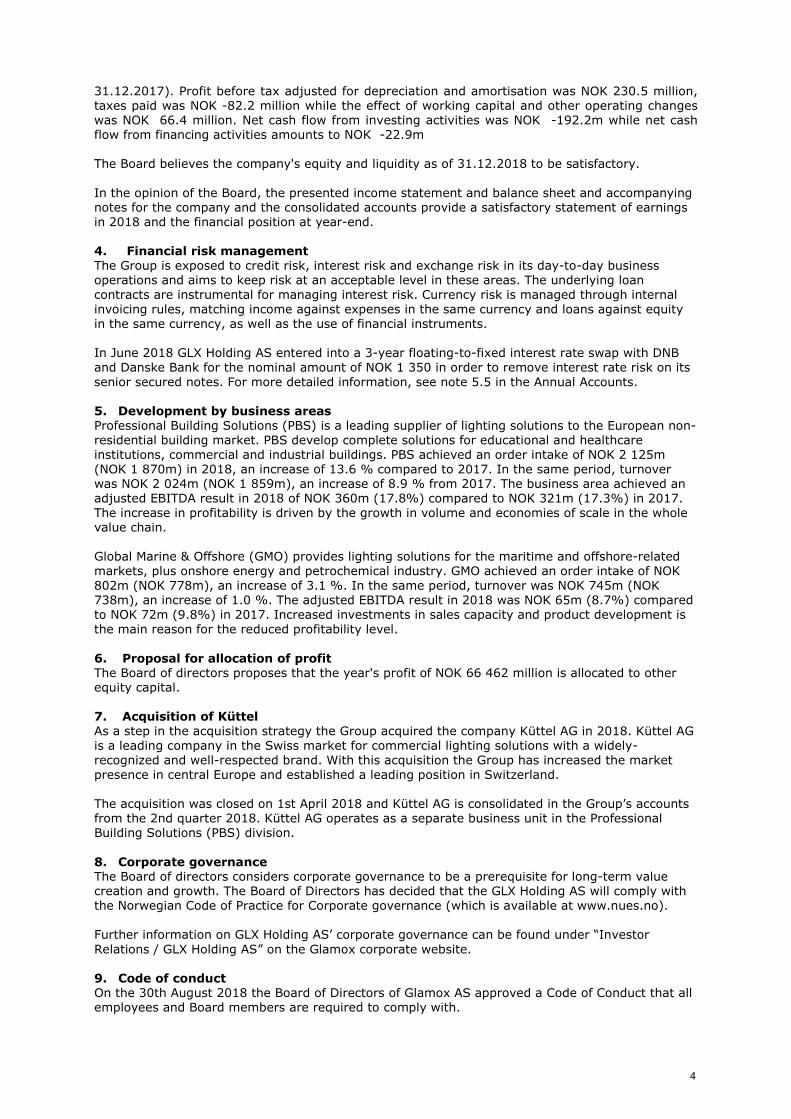
The purpose of the Code of Conduct is to create a transparent, sound corporate culture and to preserve the integrity of Glamox by helping employees to promote standards of good business practice. The Code of Conduct incorporates the long existing Group’s core values and its policy for Corporate Social Responsibility.
As a result of Tritons ownership, the Glamox Group has increased its focus on further developing and implementing a Compliance Management System. It includes a range of policies including a Responsible Business Partner policy, Whistleblowing policy, Crisis management policy and a Health Safety and Environmental (HSE) policy. These policies were approved by the Glamox’ Group Management Team in November 2018.
10. Responsible business partnerThe Group is committed to responsible business practices and conducting business with the highestethical standards. Glamox wants to maintain stable and honest business relationships with all itsbusiness partners, including but not limited to, suppliers, advisers, agents and clients.
The Group want all our business partners to view us as their preferred business partner. As such, we strive to achieve a positive reputation in all aspects of our business. We respect the laws, cultures, dignity and rights of individuals in all countries where we operate. Compliance with national, regional and international rules, laws and conventions is compulsory and business ethics extend beyond simple compliance. We conduct our business with integrity which makes our employees and business partners proud to work for, and with, us.
11. External environmentThe Group’s goal is to produce energy-efficient products, manufactured through energy-efficientand environmental-friendly processes. The company supports a precautionary approach toenvironmental challenges, undertakes initiatives to promote greater environmental responsibility,and encourages the development of environmental-friendly technologies. The Group’s businessactivities do not impact the external environment particularly.
The environmental aspects are an important part of our product development. Through energy-effective products and solutions, we aim to make the most of market opportunities, such as the EU energy directive for the construction industry. A broad range of products enables the Group to offer high-quality and energy-efficient lighting solutions within the majority of application areas.
The Group's production units at Molde, Kirkenær, Sweden and Estonia are certified in accordance with EN ISO 14001.
12. Human resources and working environmentThe company has no employees. The board consists of three people, all men.
The number of full-time employees (FTEs) on Group level was 1,318 at the end of 2018, up from 1,282 at the end of 2017. The main reason for the increase in FTEs is the acquisition of Küttel AG which had 53 FTEs employed at the end of 2018. In Glamox AS the number of full-time employees decreased from 446 at year-end 2017 to 416 at the end of 2018.
The Group’s policy is that the same skills and length of service are rewarded on an equal basis regardless of gender. Women and men in all job categories are given the same opportunities to qualify for all types of assignments and promotion prospects. Female employees made up 40.4% of the Group’s workforce at the end of 2018.
Four accidents that led to days of absence were reported in the Group in 2018. Three of the four accidents were reported in Glamox AS, compared to two in 2017. This gave an accident ratio in Glamox AS (H-value) of 4.0 accidents per 1 million worked hours compared to 2.6 in 2017. The Group has the ambition that this ratio is zero and focus on a safe working environment is a continuous process.
13. Equal opportunitiesThe Group is committed to an inclusive work culture and shall provide equal opportunities and treatall employees fairly. Glamox does not accept any form of harassment or discrimination on the basisof race, colour, religion, gender, sexual orientation, national origin, age, disability, or veteranstatus.
5

At present, Glamox AS has employees originating from many nationalities. At the end of 2018, the company had employees originating from 38 countries. The company strongly believes in providing the opportunity to qualify for all types of work and opportunities for promotion regardless of ethnic background.
14. Other conditionsTo the Boards knowledge there has been no events after the end of the financial year that has animpact on the company's position and result.
15. OutlookGlamox is the main asset of the group.
The demand for lighting solutions in PBS’ markets has slowed down somewhat in 2018, and Glamox expects the demand to remain on the same level in 2019. The LED share in PBS is now above 92%. However, the installed base of LED solutions in non-residential buildings is still very low. PBS is continuing its investments in new products and systems, as well as increasing the capacity and competence in the organisation in order to make the Glamox lighting solutions even more competitive.
For GMO Glamox expects orders for new build commercial vessels worldwide has dropped further in 2018 and is expected to stay at the same level in 2019. The global offshore energy segment is estimated to have reached bottom in 2018 and we expect this market to improve slightly in 2019. We also expect the positive development within Navy and Cruise & Ferry to continue in 2019.
The lighting industry continues to go through changes as a result of changes in LED technology and Light Management Systems. The Glamox Group has developed a healthy position in the lighting market over the years. We will continue to strengthen and improve this position and through our strong application knowledge we will develop and supply new solutions for our customers globally.
The Glamox Group’s long-term strategy continues to focus on growth and financial strength.
16. Responsibility StatementWe, the Board of Directors reviewed and approved the Board of Directors’ Report and theconsolidated and annual financial statements for GLX Holding AS as of 31 December 2018 (annualreport 2018).
To the best of our knowledge; - the consolidated financial statements and financial statement are prepared in accordance with
IFRS and IFRIC as adopted by the EU and additional Norwegian disclosure requirements in theNorwegian Accounting act that were effective as of 31 December 2018.
- the consolidated and annual financial statements give a true and fair view of the assets,liabilities, financial position and profit as a whole as of 31 December 2018 for the Group andthe Parent Company.
- the Board of Directors’ Report for the Group and the Parent Company includes a true and fairview of;
- the development and performance of the business and the position of the Group and theParent Company.
- the principal risks and uncertainties the Group and the Parent Company face.
Oslo, April 29, 2019
_______________________ Gustaf Erik David Backemar
Styreleder
_______________________ Joachim Solbakken Espen
Styremedlem
_______________________ Carl Johan Jörgen Ulf Renvall
Styremedlem
6

GLX Holding GroupAnnual financial statements
2018
7

Content
Consolidated statement of profit and lossConsolidated statement of other comprehensive incomeConsolidated statement of financial position Consolidated statements of cash flowsConsolidated statement of equity
Section 1 - Overview Section 6 - Tax6.1 Taxes1.1 Corporate information
1.2 Basis of preparation1.3 Estimation uncertainty, judgments and assumptions1.4 Adjusted profit and special items
Section 7 - Remuneration and post-employment benefits7.1 Management remuneration
Section 2 - Operating performance
7.2 Post-employment benefits
2.1 Segment information2.2 Revenues from contracts with customers
Section 8 - Group companies
2.3 Inventories
8.1 Interests in subsidiaries
2.4 Employee benefit expenses
8.2 Business Combinations
2.5 Other operating expenses Section 9 - Other disclosure requirements
Section 3 - Non-current assets
9.1 Earnings per share
3.1 Property, plant and equipment
9.2 Related party transactions
3.2 Goodwill
9.3 Events after the reporting period
3.3 Product development and other intangible assets Section 10 - Accounting policies
Section 4 - Provisions and commitments
10.1 Significant accounting policies
4.1 Provisions and other liabilities
10.2 Changes in accounting policies
4.2 Leasing commitments
10.3 Standards issued but not yet effective
Section 5 - Financial instruments, capital structure and equity5.1 Financial instruments5.2 Interest bearing liabilities5.3 Ageing of financial liabilities5.4 Fair value measurement5.5 Financial risk management5.6 Capital management5.7 Equity and shareholders5.8 Cash and cash equivalents5.9 Trade and other receivables
5.10 Trade and other payables5.11 Financial income and expenses
Section 2 - Operating performance
8

GLX Holding AS - Group
Consolidated statement of profit and loss
For the years ended 31 December
NOK 1000 Notes 201814.08 -
31.12.2017Revenue 2.1, 2.2 2 731 296 87 320 Other operating income 2.2 41 422 1 812
Total revenues 2 772 718 89 132 Raw materials and consumables used 1 285 180 39 158 Payroll and related costs 2.4 879 380 36 741 Depreciation and amortisation 3.1, 3.3 135 086 5 833 Other operating expenses 2.5 280 025 57 545 Total operating expenses 2 579 670 139 276
Operating profit 193 048 -50 144 Financial income 5.11 31 478 1 094 Financial expenses 5.11 129 098 9 081 Net financial items 97 620 7 987
Profit before tax 95 428 -58 131 Taxes 6.1 28 967 -1 666
Profit for the year 66 462 -56 465
Profit/loss attributable to equity holders of the parent 25 558 -55 676 Profit/loss attributable to non controlling interests 40 903 -789
Other comprehensive income
Profit for the year 66 462 -56 465
Items that subsequently will not be reclassified to profit or loss:Gain/loss from remeasurement on defined benefit plans 7.2 -781 - Tax effect on remeasurements on defined benefit plans 7.2 -244 - Total items that subsequently will not be reclassified to profit or loss -1 025 -
Items that subsequently may be reclassified to profit or loss:Currency translation differences 19 556 - Net gain/loss on hedge of foreign subsidiaries 5.5 -18 963 - Tax effect from hedge of foreign subsidiaries 6.1 4 361 - Total items that subsequently may be reclassified to profit or loss 4 954 -
Other comprehensive income for the period 3 929 -
Total comprehensive income for the period 70 390 -56 465
Total comprehensive income attributable to equity holders of the parent 28 550 -55 676 Total comprehensive income attributable to non controlling interests 41 840 -789
Earnings per share attributable to equity holders of the parentWeighted average number of ordinary shares outstanding (in thousands):
Basic 1 000 1 000Diluted 1 000 1 000
Per ordinary share in NOK:Basic 25,56 -55,68 Diluted 25,56 -55,68
1.4
1.4
9

GLX Holding AS - Group
Consolidated statement of financial position
NOK 1000 Notes 31.12.2018 31.12.2017ASSETSIntangible non-current assets
Goodwill 3.2 1 643 911 1 678 591 Intangible assets 3.3 1 287 296 1 175 691
Total intangible non-current assets 2 931 207 2 854 282
Tangible non-current assetsLand, buildings and other property 3.1 174 595 161 992 Machinery and plant 3.1 97 972 96 558 Fixtures and fittings, tools, office equipment etc. 3.1 51 834 50 524
Total tangible non-current assets 324 402 309 074
Deferred tax assets 6.1 48 898 15 775 Other non-current assets 3 669 2 998
Total non-current assets 3 308 176 3 182 129
Current assetsInventories 2.3 462 384 389 128Trade receivables 5.9 371 126 358 803Other receivables 5.9 79 962 53 627Cash and cash equivalents 5.8 318 346 307 064
Total current assets 1 231 817 1 108 622TOTAL ASSETS 4 539 993 4 290 751
EQUITY AND LIABILITIESEquity
Share capital 5.7 1 000 1 000 Share premium reserve 1 599 346 1 599 346
Paid in capital 1 600 346 1 600 346
Retained earnings -27 125 -55 675 Non-controlling interests 392 585 374 323
Total equity 1 965 804 1 918 994
Non-current liabilitiesPension liabilities 7.2 50 327 19 985 Bond 5.1, 5.2 1 331 871 1 328 215 Interest bearing liabilities to financial institutions 5.1, 5.2 230 274 111 625 Other long-term loans 5.1 6 085 5 972 Deferred tax liabilities 6.1 344 627 332 009 Provisions and other liabilities 4.1 36 098 39 017
Total non-current liabilities 1 999 280 1 836 822
Current liabilitiesTrade payables 5.10 203 949 176 775 Income tax payable 6.1 35 847 34 302 Other payables 5.10 95 653 82 889 Provisions and other liabilities 4.1, 5.1 239 460 240 968
Total current liabilities 574 909 534 935
Total liabilities 2 574 188 2 371 757 TOTAL EQUITY AND LIABILITIES 4 539 993 4 290 751
Oslo, 29 April 2019
Gustaf Erik David BackemarChairman of the Board
Joachim Solbakken EspenBoard member
Carl Johan Jörgen Ulf RenvallBoard member
10
GLX Holding AS - Group
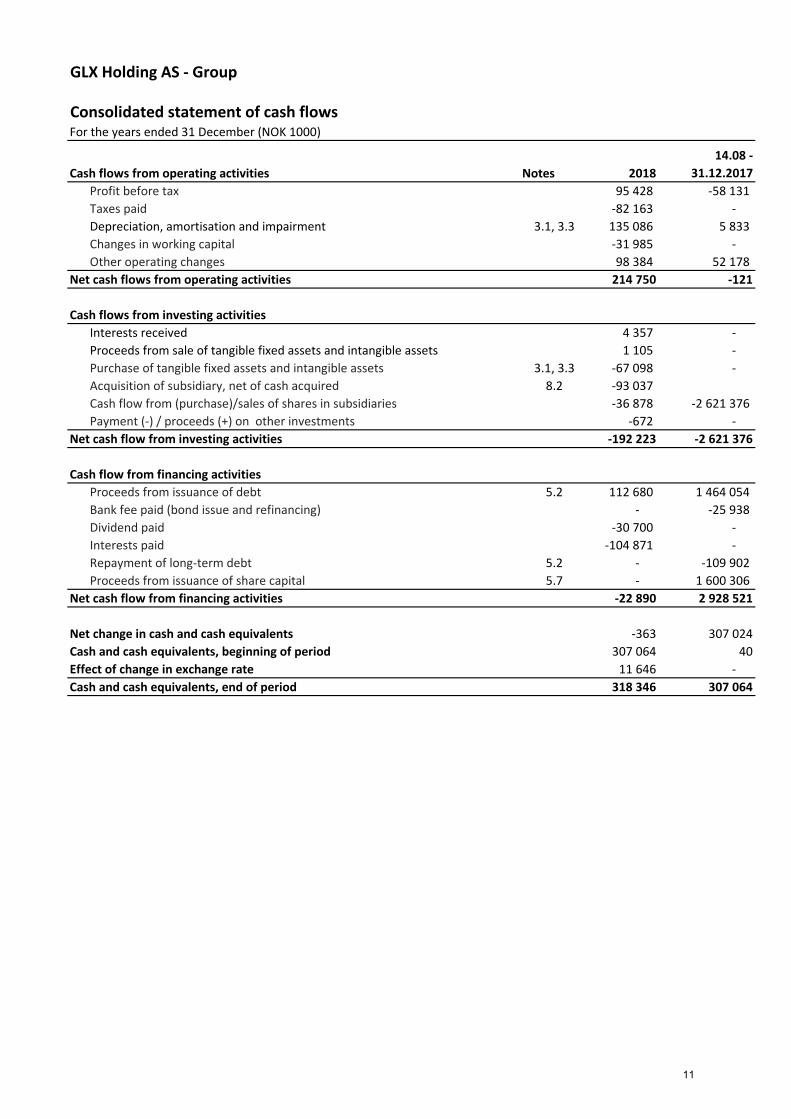
Consolidated statement of cash flows For the years ended 31 December (NOK 1000)
Cash flows from operating activities Notes 201814.08 -
31.12.2017Profit before tax 95 428 -58 131 Taxes paid -82 163 - Depreciation, amortisation and impairment 3.1, 3.3 135 086 5 833 Changes in working capital -31 985 - Other operating changes 98 384 52 178
Net cash flows from operating activities 214 750 -121
Cash flows from investing activitiesInterests received 4 357 - Proceeds from sale of tangible fixed assets and intangible assets 1 105 - Purchase of tangible fixed assets and intangible assets 3.1, 3.3 -67 098 - Acquisition of subsidiary, net of cash acquired 8.2 -93 037 Cash flow from (purchase)/sales of shares in subsidiaries -36 878 -2 621 376 Payment (-) / proceeds (+) on other investments -672 -
Net cash flow from investing activities -192 223 -2 621 376
Cash flow from financing activitiesProceeds from issuance of debt 5.2 112 680 1 464 054 Bank fee paid (bond issue and refinancing) - -25 938Dividend paid -30 700 - Interests paid -104 871 - Repayment of long-term debt 5.2 - -109 902Proceeds from issuance of share capital 5.7 - 1 600 306
Net cash flow from financing activities -22 890 2 928 521
Net change in cash and cash equivalents -363 307 024Cash and cash equivalents, beginning of period 307 064 40Effect of change in exchange rate 11 646 - Cash and cash equivalents, end of period 318 346 307 064
11

GLX Holding AS - Group
Consolidated statement of changes in equity
NOK 1000 Share capital Share premium Other equityTotal
shareholders equity
Non-controlling
interestsTotal equity
Balance as of 14 August 2017 30 10 40 - 40
Profit (loss) for the year -55 676 -55 676 -789 -56 465 Other comprehensive incomeTotal comprehensive income - -55 676 -55 676 -789 -56 465 Capital increase 970 1 599 336 1 600 306 1 600 306 Acquisition of subsidiary with NCI - 375 113 375 113 Dividends - - Balance as of 31 December 2017 1 000 1 599 346 -55 676 1 544 670 374 323 1 918 994 Profit (loss) for the year 25 558 25 558 40 903 66 462 Other comprehensive income 2 992 2 992 937 3 929 Total comprehensive income - 28 550 28 550 41 840 70 390 Capital increase - - Acquisition of subsidiary with NCI - -16 033 -16 033 Movement in non-controlling interests 23 155 23 155 Dividends - -30 700 -30 700 Balance as of 31 December 2018 1 000 1 599 346 -27 125 1 573 220 392 585 1 965 804
12

1.1 Corporate information
GLX holding AS was established in 2017, with the purpose to own shares in Glamox AS.
At 11 of December 2017, GLX Holding AS became the parent company of Glamox AS, with a 75,16% ownership. End of 2018 the ownership is 76,16%. GLX Holding AS is a holding company and have no other activities or investments, than the ownership of Glamox AS. GLX Holding AS is a Norwegian company and the registred adress is c/o Triton Advisors (Norway) AS, Kronprinsesse Märthas plass 1, 0161 OSLO. The ultimate parent of GLX Holding AS is Triton Fund IV, which is located at Jersey.
Glamox AS is a leading lighting supplier to the world's marine and offshore markets, and a significant supplier to the professional building market in Europe. The registered office is located in Molde, Norway. Glamox operates with two different business areas, Professional Building Solution (PBS) and Global Marine & Offshore (GMO). These two business areas have to a lagre extent different products and solutions they provide to their markets. Further they operate in strategically different markets and therefore havedifferent sales channels, marketing strategies and risk. To be able to monitor and follow up the profitability of the complete value chain of these two business areas, Glamox has an operating segment reporting where PBS and GMO each represents a complete value chain, please see note 2.1 for more information.
13
1.2 Basis of preparation
The consolidated financial statements of GLX Holding AS comprise of consolidated statements of profit and loss, other comprehensive income, financial position, cash flows, changes in equity, and related notes. The consolidated financial statements have been prepared in accordance with International Financial Reporting Standards (IFRS) as adopted by The European Union (EU).
The consolidated financial statements have been prepared on a historical cost basis, except for derivative financial instruments that have been measured at fair value. Further, the financial statements are prepared based on the going concern assumption.
The consolidated financial statements are presented in Norwegian kroner (NOK), which is also the functional currency of the parentcompany. All figures are rounded to the nearest thousand (000), except when otherwise indicated. For each entity, the Group determines the functional currency and items included in the financial statements of each entity are measured using that functional currency.
For presentation purposes, balance sheet items are translated from functional currency to presentation currency by using exchange rates at the reporting date. Items within total comprehensive income are translated from functional currency to presentation currency by applying monthly average exchange rates. If currency rates are fluctuating significantly, daily exchange rates are applied for significant transactions.
Basis of consolidationThe consolidated financial statements comprise the financial statements of GLX Holding AS its subsidiaries as at 31 December 2018. The subsidiaries are consolidated when control is achieved, that is, when the Group is exposed, or has rights, to variable returns from its involvement with an investee and has the ability to affect those returns through its power over the investee. Specifically, the Group controls an investee if, and only if, the Group has:• Power over the investee (i.e., existing rights that give it the current ability to direct the relevant activities of the investee)• Exposure, or rights, to variable returns from its involvement with the investee• The ability to use its power over the investee to affect its returns
Generally, GLX Holding' presumption is that a majority of voting rights results in control. The Group re-assesses whether or not it controls an investee if facts and circumstances indicate that there are changes to one or more of the three elements of control. Consolidation of a subsidiary begins when the Group obtains control over the subsidiary and ceases when the Group loses control of the subsidiary. Assets, liabilities, income and expenses of a subsidiary acquired or disposed of during the year are included in the consolidated financial statements from the date the Group gains control until the date the Group ceases to control the subsidiary.
Profit or loss and each component of Other Comprehensive Income (OCI) are attributed to the equity holders of the parent and to the non-controlling interests, even if this results in the non-controlling interests having a deficit balance. Uniform accounting policies are applied to all group companies. All intra-group assets and liabilities, equity, income, expenses and cash flows relating to transactions between members of the Group are eliminated in full on consolidation.
14

1.3 Estimation uncertainty, judgments and assumptions
The preparation of the consolidated financial statements in accordance with IFRS and applying the chosen accounting policies requires management to make judgments, estimates and assumptions that affect the reported amounts of assets, liabilities, revenues and expenses. The estimates and associated assumptions are based on historical experience and various other factors that are believed to be reasonable under the circumstances. Actual results may differ from these estimates. The estimates and the underlying assumptions are reviewed on an ongoing basis. The accounting policies applied by the Group in which judgments, estimates and assumptions may significantly differ from actual results are discussed below.
Sources of estimation uncertainty
Impairment of GoodwillDetermining whether goodwill is impaired requires an estimation of the value in use of the cash-generating units to which goodwill has been allocated. The value in use calculation requires management to estimate the future cash flows expected to arise from the cash-generating units using a suitable discount rate in order to calculate present value. Details of recognised goodwill are provided in note 3.2, including sensitivity disclosures.
Economic life of property, plant and equipment and intangible assetsThe useful life of each item, which is assessed at least annually, is determined as the period over which the asset is expected to be available for use.
Changes in the expected useful life or the expected pattern of consumption of future economic benefits embodied in the asset areconsidered to modify the amortisation period or method, as appropriate, and are treated as changes in accounting estimates. The depreciation or amortisation expense on assets with finite lives is recognised in the statement of comprehensive income.
1.4 Adjusted profit and special items
2018 2017*2 772 718 2 614 5352 769 718 2 596 853
328 134 368 54311,8 % 14,1 %
419 706 392 83815,2 % 15,1 %
193 048 292 7367,0 % 11,2 %
284 620 336 99210,3 % 13,0 %
328 134 368 543
43 821 13 71441 005
15 6428 000 14 800
-17 682
Total revenuesTotal revenues - Adjusted
EBITDA 1
EBITDA marginAdjusted EBITDA 2
Adjusted EBITDA margin
Operating profit (EBIT)Operating profit (EBIT) marginAdjusted Operating profit (EBIT)Adjusted Operating profit (EBIT) margin
EBITDA
Special items:Restructuring costClaim cost related to one productIPO-processBonusProfit from sale of assetsReversal of provisionOther
-3 0001 746
-3 000821
Total Special items excluding impairment of non-current assets 91 572 24 295
Adjusted EBITDA 419 706 392 838
Impairment of non-current assets 19 961Total Special items 91 572 44 256
Adjusted Operating profit (EBIT) 284 620 336 992
* Only Glamox Group figures1 Operating profit/loss before income taxes, net financial items, depreciation, amortisation and impairment charges.2 Operating profit/loss before income taxes, net financial items, depreciation, amortisation and impairment
charges adjusted for special items.
15

2.1 Segment information
Year ended 31 December 2018
Professional Building
Solutions (PBS)Global Marine & Offshore (GMO) Other Total
Revenues 2 024 361 745 356 3 000 2 772 718 EBITDA 359 983 65 162 -97 012 328 134 in % 17,8 % 8,7 % 11,8 %
Year ended 31 December 2017
Professional Building
Solutions (PBS)Global Marine & Offshore (GMO) Other Total
Revenues 63 808 25 324 89 132 EBITDA 3 723 836 -48 872 -44 312 in % 5,8 % 3,3 % -49,7 %
Other items in 2018 refers to operating expenses related to GLX Holding and special items related to Glamox Group. See note 2.2, 2.4 and 2.5 for further information about special items.
GLX Holding Group was established at 11.12.2017. Only profit provided from Glamox Group during the owner period is included in the GLX Holding Group accounts of 2017. Other items in 2017 relates to expenses in GLX Holding AS regarding the acqusition of Glamox and issue of bond.
Reconciliation of profit 2018 2017EBITDA 328 134 -44 312 Depreciation and amortisation 135 086 5 833 Operating profit 193 048 -50 145
Geographic information 2018 2017Revenues from external customersNordics 1 512 660 49 785 Europe, excl. Nordics 957 505 26 458 North America 117 441 4 755 Asia 152 159 7 019 Other 32 952 1 114 Total 2 772 718 89 132
The geographic split is based on the location of the customer.
* The Group's definition of EBITDA may differ from other definitions of EBITDA in certain other jurisdictions.
Operating segments within the GroupGlamox has two operating segments (business areas);
- Professional Building Solutions (PBS)- Global Marine & Offshore (GMO)
Each of these two segments represents a complete value change, implying that all cost of goods sold (COGS) and administration cost of the SPL division is distributed between the two operating segments, based on the products sold. Group functions are also distributed between the two operation segments, based on allocation keys.
These two segments offer different products, operatein strategically different markets and therefore have different sales channels and marketing strategies, including risks. PBS offers products to office, industry, health, education, retail, hotels and resturants mainly in Europe. Their main sales channels are direct to installers and wholesalers. GMO offers its products in the global market within commercial marine, energy (offshore and onshore), navy, recreational, cruise and ferry. The customer base of GMO consist of vessel owners, yards, electrical installers, engineering companies and oil companies.
Segment performance is evaluated based on EBITDA (operating profit /loss before income taxes, net financial items, depreciation, amortisation and impairment charges)*. Management believes this information is the most relevant in evaluating the results of the respective segments. Reconciliation from EBITDA to operating profit according to the statement of total comprehensive income is shown below. The Group’s financing activities (including finance costs and finance income) and income tax expense are managed on a Group basis and are not allocated to the operating segments.
The internal managment reporting of operating segments does not include any balance sheet items. Consequently, the overview of financial information per operating segment does not include assets and liabilites.
16
2.2 Revenues from contracts with customers
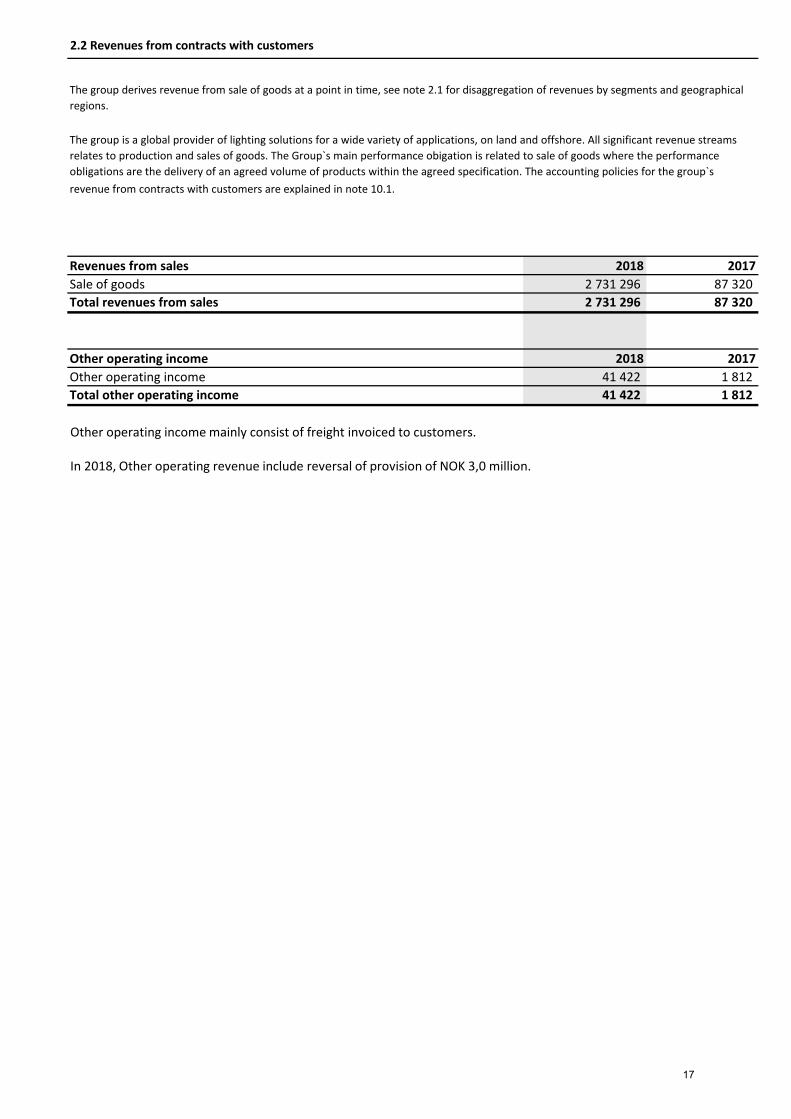
Revenues from sales 2018 2017Sale of goods 2 731 296 87 320 Total revenues from sales 2 731 296 87 320
Other operating income 2018 2017Other operating income 41 422 1 812 Total other operating income 41 422 1 812
The group derives revenue from sale of goods at a point in time, see note 2.1 for disaggregation of revenues by segments and geographical regions.
The group is a global provider of lighting solutions for a wide variety of applications, on land and offshore. All significant revenue streams relates to production and sales of goods. The Group`s main performance obigation is related to sale of goods where the performance obligations are the delivery of an agreed volume of products within the agreed specification. The accounting policies for the group`s revenue from contracts with customers are explained in note 10.1.
Other operating income mainly consist of freight invoiced to customers.
In 2018, Other operating revenue include reversal of provision of NOK 3,0 million.
17
2.3 Inventories
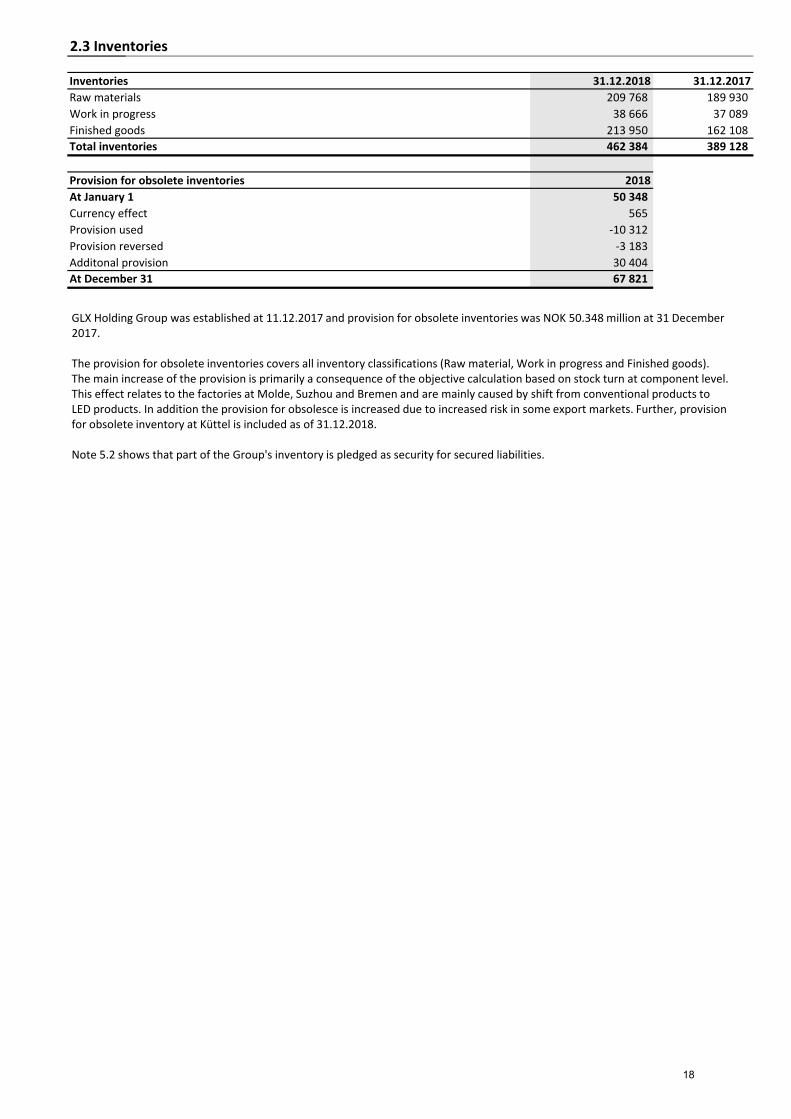
Inventories 31.12.2018 31.12.2017Raw materials 209 768 189 930 Work in progress 38 666 37 089 Finished goods 213 950 162 108 Total inventories 462 384 389 128
Provision for obsolete inventories 2018At January 1 50 348 Currency effect 565 Provision used -10 312 Provision reversed -3 183 Additonal provision 30 404 At December 31 67 821
GLX Holding Group was established at 11.12.2017 and provision for obsolete inventories was NOK 50.348 million at 31 December 2017.
The provision for obsolete inventories covers all inventory classifications (Raw material, Work in progress and Finished goods).The main increase of the provision is primarily a consequence of the objective calculation based on stock turn at component level. This effect relates to the factories at Molde, Suzhou and Bremen and are mainly caused by shift from conventional products toLED products. In addition the provision for obsolesce is increased due to increased risk in some export markets. Further, provision for obsolete inventory at Küttel is included as of 31.12.2018.
Note 5.2 shows that part of the Group's inventory is pledged as security for secured liabilities.
18

2.4 Employee benefit expenses
Payroll and related costs 2018 2017Salaries 692 418 28 430 National insurance 115 295 5 234 Pension costs 35 205 1 475 Other remuneration 28 462 924 Bonus to all employees* 8 000 677 Total payroll and related costs 879 380 36 741
Average number of Full Time Employee (FTE) 1 344 1 300
In 2018, salaries and national insurance include items of NOK 36,1 million related to restructuring.
* The Board of Glamox AS has decided to pay out a one-off bonus to all employees in Glamox Group based on the achievedresult of 2018. Glamox AS covers all cost relating to the bonus, including bonuses that are paid to employees outsideGlamox AS.
See note 7.1 for management remuneration.
19

2.5 Other operating expenses
Other operating expenses 2018 2017Sales and marketing expenses 32 205 970 Energi and housing 49 411 - Repair and maintenance 22 181 - Travel and transport 49 414 - Claim 24 970 - Consultancy fee 3 514 39 263 Legal fee 1 081 8 905 Bad debts -919 - Other 98 167 8 406 Total other operating expenses 280 025 57 545
Auditor 2018 2017Fee for statutory audit 3 097 3 005Audit-related fees 2 019 3 876Tax compliance services 753 920Other fees 232 364Total 6 100 8 165
Special itemsOther operating expenses for 2018 includes items of NOK 6,9 million related to restructuring. Claim expenses include NOK 14,0 million related to one claim.
Some of the transactions included in Other operating expenses are towards related parties, see note 9.2.
20

3.1 Property, plant and equipment
Land/ Buildings MachineryFixtures and
Fittings TotalAcquisition cost 14.08.2017 - - - - Additions - Disposals - Additions through acquisition of subsidiary 162 391 97 543 51 178 311 112 Currency translation effects - Acquisition cost 31.12.2017 162 391 97 543 51 178 311 112 Additions 833 25 164 15 017 41 014 Disposals - -480 -91 -571 Additions through acquisition of sub-subsidiary (1) 24 408 525 828 25 760 Reclassifications 2 526 -3 889 1 345 -17 Currency translation effects 2 564 -1 267 523 1 819 Acquisition cost 31.12.2018 192 722 117 596 68 800 379 118
Accumulated depreciation and impairment 14.08.2017 - - - - Depreciation for the year 399 985 654 2 038 Impairment for the year - Disposals - Currency translation effects - Accumulated depreciation and impairment 31.12.2017 399 985 654 2 038 Depreciation for the year 17 728 18 639 16 312 52 679 Impairment for the year - - - - Disposals - - - - Reclassifications - - - - Currency translation effects - - - - Accumulated depreciation and impairment 31.12.2018 18 127 19 624 16 966 54 717
Carrying amount 31.12.2017 161 992 96 558 50 524 309 074Carrying amount 31.12.2018 174 595 97 972 51 834 324 402
Economic life Up to 20 yrs. Up to 10 yrs. Up to 10 yrs.Depreciation plan Straight-line Straight-line Straight-line
1) Relates to Glamox's acquisition of O. Küttel AG.
The Group assesses, at each reporting date, whether there is an indication that property, plant and equipment may be impaired. No indicators for impairment of property, plant and equipment were identified in 2018 or 2017. Furthermore, an assessment is made at each reporting date to determine whether there is an indication that previously recognised impairment losses no longer exist or have decreased. No such indicators were identified in 2018 or 2017 for property, plant and equipment.
21

3.2 Goodwill
GoodwillAcquisition cost 14.08.2017 - AcquisitionsAdditions through acquisition of subsidiary 1 678 591 Currency translation effectsAcquisition cost 31.12.2017 1 678 591 Additions through acquisition of sub-subsidiary 33 547 Currency translation effects 2 976 Adjustment of purchase price allocation -92 061 Effect of increased owner share in Glamox 20 858 Acquisition cost 31.12.2018 1 643 911
Accumulated Impairment 14.08.2017 - Impairment for the year 2017 - Accumulated Impairment 31.12.2017 - Impairment for the year 2018 - Accumulated Impairment 31.12.2018 -
Carrying amount 31.12.2017 1 678 591 Carrying amount 31.12.2018 1 643 911
Carrying amount of goodwill allocated to the cash-generating units GoodwillProfessional Building Solution (PBS) segment 1 260 855Global Marine & Offshore (GMO) segment 346 607O. Küttel AG 36 450
1 643 911Total goodwill - carrying amount 31.12.2018
Impairment of Goodwill
The Group tests goodwill for impairment annually or more frequently if there are indications that goodwill is impaired. Recognised goodwill in the Group as of 31st of December 2018 is NOK 1.643.911 thousand and is derived from acquiring of Glamox AS in 2017 and Glamox's acquisition of Küttel in 2018. The recoverable amounts of the CGUs have been determined based on value-in-use calculations.
For the 2018 impairment testing, the cash flows in the calculations are based on budgets for 2019 and assumption used in the strategy plan for the periode 2019 to 2022, both approved by the Group Management. Cash flows after year 2022 have been extrapolated using a long-term growth rate. The calculations of terminal value are based on Gordon’s formula.
Key assumptions used in value in use calculations Based on an overall assessment, Glamox has identified the following assumtions as most sensitive to the value in use calculations:
Growth rateThe historical sales growth rate in Glamox differ between the two segments , PBS and GMO. And within these two segments the growth rate differ between the sectors. In the strategy plan the growth rates are based on published industry research with management adjustments. In prediction of cash flow, management has utilized a conservative approach. The growth rate applied in the impairment test is equal to the rate utilized in the strategy plan.
Operating profit Future operating profit is dependent on a number of factors, but primarily volume growth, cost of production and operating expenses. In the impairment test, Glamox has estimated operating profit using an operating profit rate that is based on managment's experience.
Discount ratesThe discounts rates are based on the Weighted Average Cost of Capital (WACC) formula derived from the CAPM model. The discount rate is set individually for each CGU and is post-tax between 9.0% and 9.5%.
22

Fair value at acqusition date: 2017-estimates Adjustments FinalAssets
Goodwill 1 678 591 -92 061 1 586 530Other intangible non-current assets 1 179 486 149 630 1 329 116Tangible non-currenct assets 311 112 311 112Other tangible non-current assets 18 773 18 773Inventories 389 128 389 128Trade and other receivables 411 440 411 440Cash and cash equivalents 170 433 170 433
Total assets 4 158 963 57 569 4 216 532
LiabilitiesDeferred tax 333 675 34 415 368 090Other non-current liabilities 179 585 179 585Total current liabilities 478 781 478 781
Total liabilities 992 041 34 415 1 026 456
Total identifiable net assets at fair value 3 166 922 3 190 076NCI measured at fair value of net identified assets 375 113 23 155 398 268Total consideration for the shares 2 791 809 23 155 2 791 809
Cash generating units and assessments made by managementGoodwill related to the acquisition of Glamox AS is allocated to the two operating segments; - Proffesional building solutions ("PBS")- Global Marine and Offshore ("GMO")
PBSIn the impairment test calculation, the terminal growth rate is assumed to be 2.0% and a WACC of 9.0% has been utilized. The sensitivity analysis show that an increase in WACC of 1 % would lead to an impairment loss. A decrease in revenues of 2 % thefirst five years and 0,5 % in the last five years would lead to an impairment loss.
GMOIn the impairment test calculation, the terminal growth rate is assumed to be 2.0% and a WACC of 9.5% has been utilized. The sensitivity analysis show that an increase in WACC of 1 % would lead to an impairment loss. A decrease in revenues of 2 % thefirst five years and 0,5 % in the last five years would lead to an impairment loss.
O. Küttel AGKüttel AG was aquired by Glamox AS in 2018. See note 8.2 Business combination for further information.
Acquisition of Glamox Group and adjustments of the purchase price allocationOn December 11, 2017 GLX Holding AS acquired 75,16% of the shares of Glamox AS, witch is the parent company of the Glamox Group. The total purchase consideration was NOK 2.791,8 millions all paid by cash.
The process of identifying the fair value of assets acquired was performed in 2017 and completed during 2018. The provisionally estimated fair value of assets and liabilities as well as final amounts are included in the table below. Adjustments relates to completed valuation of intangible non-current assets, like Brand, Customer relationship and Product development. The value of deferred tax and goodwill have been updated following adjustments to valuation of other items. The change had minor effects on depreciation and amortisation.
23
3.3 Product development and other intangible assets
Other Product intangible
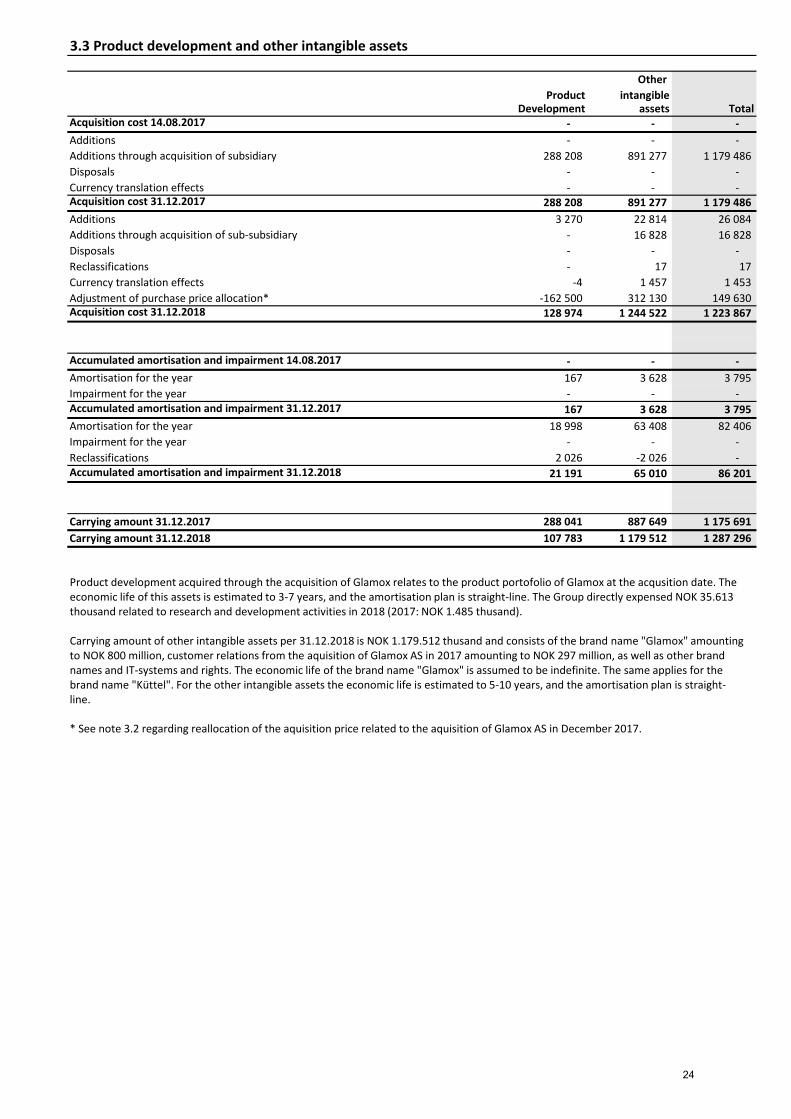
Development assets TotalAcquisition cost 14.08.2017 - - - Additions - - - Additions through acquisition of subsidiary 288 208 891 277 1 179 486 Disposals - - - Currency translation effects - - - Acquisition cost 31.12.2017 288 208 891 277 1 179 486 Additions 3 270 22 814 26 084 Additions through acquisition of sub-subsidiary - 16 828 16 828 Disposals - - - Reclassifications - 17 17 Currency translation effects -4 1 457 1 453 Adjustment of purchase price allocation* -162 500 312 130 149 630 Acquisition cost 31.12.2018 128 974 1 244 522 1 223 867
Accumulated amortisation and impairment 14.08.2017 - - - Amortisation for the year 167 3 628 3 795 Impairment for the year - - - Accumulated amortisation and impairment 31.12.2017 167 3 628 3 795 Amortisation for the year 18 998 63 408 82 406 Impairment for the year - - - Reclassifications 2 026 -2 026 - Accumulated amortisation and impairment 31.12.2018 21 191 65 010 86 201
Carrying amount 31.12.2017 288 041 887 649 1 175 691 Carrying amount 31.12.2018 107 783 1 179 512 1 287 296
Product development acquired through the acquisition of Glamox relates to the product portofolio of Glamox at the acqusition date. The economic life of this assets is estimated to 3-7 years, and the amortisation plan is straight-line. The Group directly expensed NOK 35.613 thousand related to research and development activities in 2018 (2017: NOK 1.485 thusand).
Carrying amount of other intangible assets per 31.12.2018 is NOK 1.179.512 thusand and consists of the brand name "Glamox" amounting to NOK 800 million, customer relations from the aquisition of Glamox AS in 2017 amounting to NOK 297 million, as well as other brand names and IT-systems and rights. The economic life of the brand name "Glamox" is assumed to be indefinite. The same applies for the brand name "Küttel". For the other intangible assets the economic life is estimated to 5-10 years, and the amortisation plan is straight-line.
* See note 3.2 regarding reallocation of the aquisition price related to the aquisition of Glamox AS in December 2017.
24

4.1 Provisions and other liabilities
Provisions and other liabilities 31.12.2018 31.12.2017
Non-current provisions and other liabilitiesWarranties 36 098 39 017Total non-current provisions and other liabilities 36 098 39 017
Current provisions and other liabilitiesDerivatives 853 4 920Prepayments from customers 18 218 21 739Restructuring/Severence payment 19 544 15 113Accruals for employee benefits 92 848 97 816Product claim 46 416 Accrued consultancy fee 2 852 39 263Accrued legal fee 956 8 905Accrued interest 5 452 4 296Other liabilities 52 320 45 930Total current provisions and other liabilities 239 460 237 983
Warranties relates to product warrenty obligations to customers. Standard warrenty time is between 2-5 years. The warrenty time differs among the different markets that Glamox operates in, and between the different products sold.
Accruals for restructuring and severance payment is related to discontinued metal production and outsourcing of warehouse service at the production site in Bremen, Germany.
Product claim relates to one product sold to the energy area (GMO segment) over several years. The provision is expected to cover cost involved in rectifying received and potential claims.
Other liabilities contains accrued fee, general accrued expenses and a potential liability related to discontinued businesses.
25
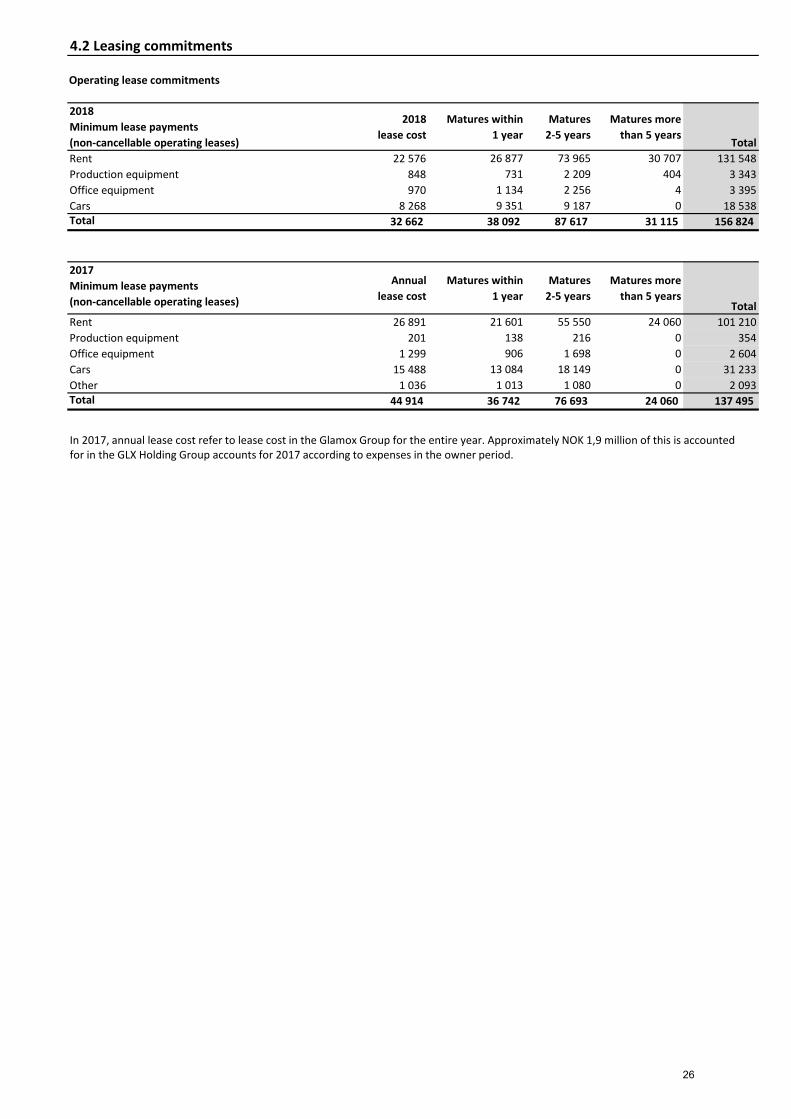
4.2 Leasing commitments
2018Minimum lease payments (non-cancellable operating leases)
2018lease cost
Matures within 1 year
Matures 2-5 years
Matures more than 5 years
TotalRent 22 576 26 877 73 965 30 707 131 548Production equipment 848 731 2 209 404 3 343Office equipment 970 1 134 2 256 4 3 395Cars 8 268 9 351 9 187 0 18 538Total 32 662 38 092 87 617 31 115 156 824
2017Minimum lease payments (non-cancellable operating leases)
Annuallease cost
Matures within 1 year
Matures 2-5 years
Matures more than 5 years
TotalRent 26 891 21 601 55 550 24 060 101 210Production equipment 201 138 216 0 354Office equipment 1 299 906 1 698 0 2 604Cars 15 488 13 084 18 149 0 31 233Other 1 036 1 013 1 080 0 2 093Total 44 914 36 742 76 693 24 060 137 495
Operating lease commitments
In 2017, annual lease cost refer to lease cost in the Glamox Group for the entire year. Approximately NOK 1,9 million of this is accounted for in the GLX Holding Group accounts for 2017 according to expenses in the owner period.
26

5.1 Financial instruments
31.12.2018 Amortised cost
Fair value through profit or loss
(FVTPL) TotalAssetsTrade receivables (note 5.9) 371 126 371 126 Other receivables (note 5.9) 79 962 79 962 Cash and cash equivalents (note 5.8) 318 346 318 346 Total financial assets 769 434 769 434
LiabilitiesDerivatives 853 853 Bond 1 350 000 1 350 000 Interest bearing liabilities to financial institutions (note 5.2) 234 363 234 363 Other long-term loans (including current part) 9 128 9 128 Trade and other payables (note 5.10) 203 949 203 949 Total financial liabilities 1 797 440 853 1 798 293
31.12.2017 Note
Original classification under IAS 39
New classification under IFRS 9 Total
Assets
Trade receivables (note 5.9) (a)
Loans and receivables Amortised cost 358 803
Other receivables (note 5.9) (a)
Loans and receivables Amortised cost 53 627
Cash and cash equivalents (note 5.8) (a)
Loans and receivables Amortised cost 307 064
The Group has the following financial instruments:
Financial assets/liabilities at amortised cost: Financial assets: Trade receivables, other current receivables (notes: 5.9) and cash and cash equivalents (note 5.8)Financial liabilities: Includes most of the Group’s financial liabilities including debt to credit institutions, trade payables and other current and non-current financial liabilities (notes: 5.2 and 5.10).
Financial assets/liabilities at fair value through profit and loss (FVPL): Derivative instruments – Forward contracts (see below)
Derivates and hedgingThe Group applies hedge accounting related to its hedges of net investments in foreign subsidiaries. Loans and bank overdrafts in the same currency as the underlying investments are designated as hedging instruments. As of 31 December 2018 NOK 218.9 millions of the interest bearing liabilities have been designated as hedging instrument (2017: 100.1 MNOK). In the Group accounts, the underlying currency effects related to the hedging instruments are presented in the statement of OCI, to the extent that the hedging relationship is effective. At the end of the period, the hedging relationship is effective.
Furthermore, the Group holds forward contracts to secure its sales and purchases in foreign currency. Hedge accounting is not applied related to these arrangements, and the derivatives are measured at fair value through profit and loss.
For further information, see note 5.5 and 10.1.
The table below shows the various financial assets and liabilities, grouped in the different categories of financial instruments according to IFRS 9.
Changes in significant accounting policies - IFRS 9 Financial instrumentsIFRS 9 contains three principal classification categories for financial assets: measured at amortised cost, FVOCI and FVTPL. The classification of financial assets under IFRS 9 is generally based on the business model in which a financial asset is managed and its contractual cash flow characteristics. IFRS 9 eliminates the previous IAS 39 categories of held to maturity, loans and receivables and available for sale.
IFRS 9 largely retains the existing requirements in IAS 39 for the classification and measurement of financial liabilities.
The following table and the accompanying notes below explain the original measurement categories under IAS 39 and the new measurement categories under IFRS 9 for each class of the Group`s financial assets and financial liabilities as at 1 January 2018.
27
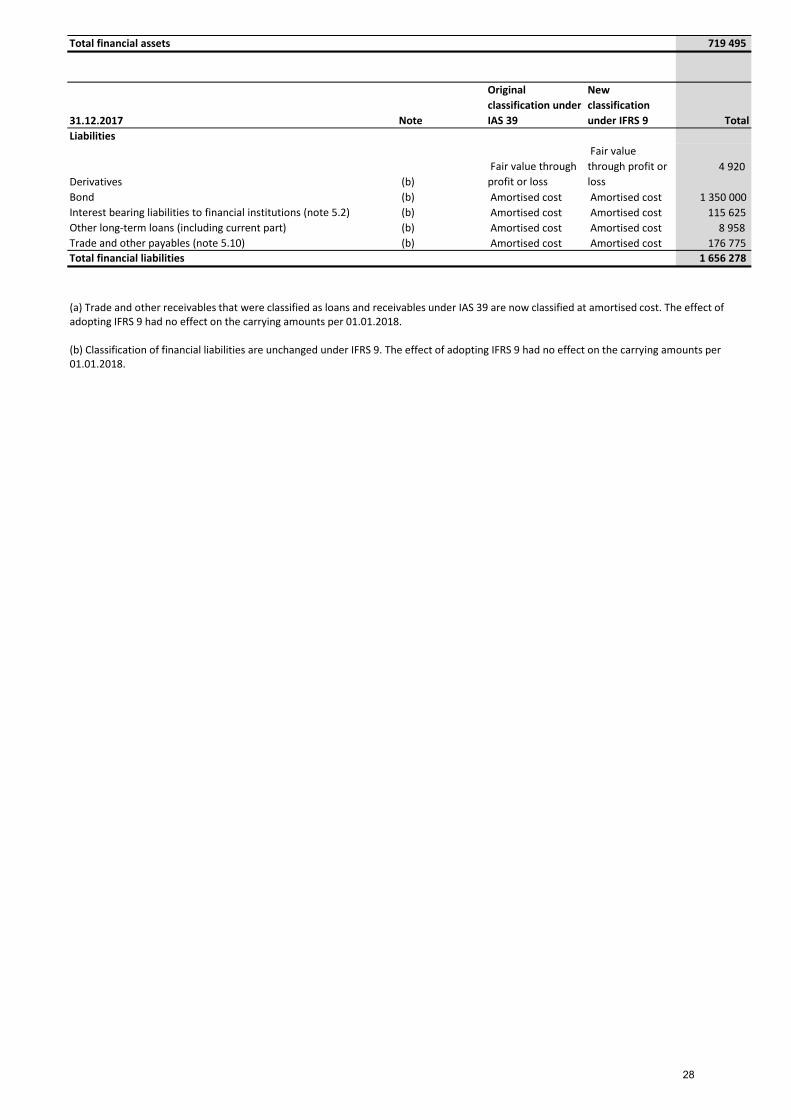
Total financial assets 719 495
31.12.2017 Note
Original classification under IAS 39
New classification under IFRS 9 Total
Liabilities
Derivatives (b) Fair value through profit or loss
Fair value through profit or loss
4 920
Bond (b) Amortised cost Amortised cost 1 350 000 Interest bearing liabilities to financial institutions (note 5.2) (b) Amortised cost Amortised cost 115 625 Other long-term loans (including current part) (b) Amortised cost Amortised cost 8 958 Trade and other payables (note 5.10) (b) Amortised cost Amortised cost 176 775 Total financial liabilities 1 656 278
(a) Trade and other receivables that were classified as loans and receivables under IAS 39 are now classified at amortised cost. The effect of adopting IFRS 9 had no effect on the carrying amounts per 01.01.2018.
(b) Classification of financial liabilities are unchanged under IFRS 9. The effect of adopting IFRS 9 had no effect on the carrying amounts per 01.01.2018.
28

5.2 Interest bearing liabilities
Non-current Interest bearing loans and borrowings Company Interest rate Maturity 31.12.2018 31.12.2017Callable Open Bond GLX Holding AS NIBOR + margin 2023 1 350 000 1 350 000 Revolving facility - utilised amount (NOK) Glamox AS NIBOR + margin 2022 15 500 15 500 Revolving facility - utilised amount (EUR) Glamox AS EURIBOR + margin 2022 218 863 100 125 Total non-current interest bearing loans and borrowings 1 584 363 1 465 625
Revolving facility 2018 2017Opening balance 115 625 - Proceeds from issuing of debt - 116 620 Increase of utilised amount 112 680 - Repayment - - Effect of changes in foreign exchange rates 6 057 -995 Closing balance 234 363 115 625
Revolving facility - assets pledged as security and guarantee liabilities31.12.2018 31.12.2017
Secured balance sheet liabilities:Interest bearing liabilities to financial institutions 1 584 363 1 465 625 Secured pension liability 13 820 13 820
Balance sheet value of assets pledged as security for secured liabilities:Land, buildings and other property 41 157 46 621 Machinery and plant 45 459 43 976 Fixtures and fittings, tools, office equipment etc. 19 947 19 856 Inventories 142 595 137 543 Account receivable 208 262 224 340 Total 457 421 472 336
Glamox AS has issued a parent guarantee in relation to a credit facility of SGD 2.0 millions. The credit facility is towards a subsidiary. The same applies for 2017.
Revolving facilityGlamox holds a revolving facility. In June 2018, the utilized amount was increased by EUR 11.8 million. In July 2018, the credit limit of the revolving facility was increased by NOK 200 million, up to NOK 1.000 million.
An arrangement fee related to the financing, is booked against non-current interest bearing liablities and will be expensed over the availability period of the facility.
Revolving facility - Covenant requirements:Glamox' loan agreements includes the following financial covenants requirements:- Equity ratio minimum 20%- Net interest bearing debt (NIBD)/EBITDA (Last Twelve Months) less than 4,0
There have been no breaches of covenants in 2018 or 2017.
Bond GLX Holding AS issued a Bond on the 8 December 2017. The initial issued amount is NOK 1.350 million and the maximum issued amount of the bond is NOK 2.000 million. The initial nominal amount on each bond is NOK 500.000. The bond has an interest margin of 5,25%. The interest period is 8 March, 8 June, 8 September and 8 December. The maturity date is 08.12.2023. The Outstanding Bonds will mature in full on the Maturity Date and shall be redeemed by the Issuer on the Maturity Date at a price equal to 100 per cent of the Nominal Amount. The Bond has a Call Option that may be exercised by the Issuer by written notice to the Bond Trustee and the Bondholders at least 10 Business Days prior to the proposed Call Option Repayment Date for the call.
An arrangement fee of NOK 18.1 millions related to the refinancing, is booked against the bond. The arrangement fee is expensed over the availability period of the facility.
The Bond was listed at Oslo Stock Exchange during second quarter 2018.
Callable Open Bond - Covenant requirement: Financial covenants requirement for the bond is Net interest bearing debt (NIBD)/ EBITDA (Last Twelve Monts) less than 4.5.
Bond - assets pledged as securityThe shares in both GLX Holding AS and Glamox AS is pledged as security for the Bond.
29

5.3 Ageing of financial liabilities
31.12.2018Derivatives 853 853 Callable Open Bond* 93 420 186 840 1 536 840 1 817 100 Interest bearing liabilities to financial institutions* 3 714 7 428 238 076 249 218 Other long-term loans 3 043 6 085 9 128 Trade and other payables (note 5.10) 203 949 203 949 Totals 304 979 200 353 1 774 916 2 280 248
31.12.2017Derivatives 4 920 4 920 Callable Open Bond* 81 405 162 810 1 594 215 1 838 430 Interest bearing liabilities to financial institutions* 2 160 4 320 119 945 126 424 Other long-term loans 2 986 5 972 8 958 Trade and other payables (note 5.10) 176 775 176 775 Totals 268 246 173 102 1 714 160 2 155 508
TotalLess than 12
months 1 to 3 years Over 3 years
TotalLess than 12
months 1 to 3 years Over 3 years
* figures inclued estimated interest payable.
30
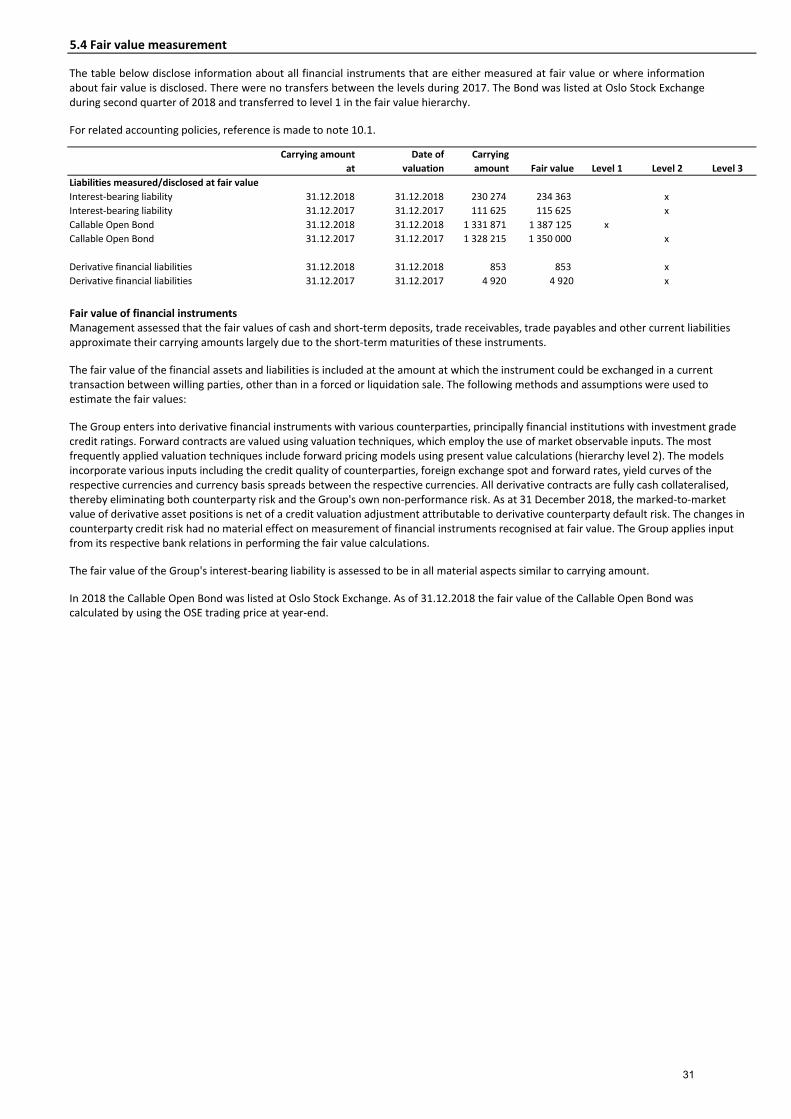
5.4 Fair value measurement
Carrying amount at
Date of valuation
Carrying amount Fair value Level 1 Level 2 Level 3
Liabilities measured/disclosed at fair valueInterest-bearing liability 31.12.2018 31.12.2018 230 274 234 363 xInterest-bearing liability 31.12.2017 31.12.2017 111 625 115 625 xCallable Open Bond 31.12.2018 31.12.2018 1 331 871 1 387 125 xCallable Open Bond 31.12.2017 31.12.2017 1 328 215 1 350 000 x
Derivative financial liabilities 31.12.2018 31.12.2018 853 853 xDerivative financial liabilities 31.12.2017 31.12.2017 4 920 4 920 x
The table below disclose information about all financial instruments that are either measured at fair value or where information about fair value is disclosed. There were no transfers between the levels during 2017. The Bond was listed at Oslo Stock Exchange during second quarter of 2018 and transferred to level 1 in the fair value hierarchy.
For related accounting policies, reference is made to note 10.1.
Fair value of financial instrumentsManagement assessed that the fair values of cash and short-term deposits, trade receivables, trade payables and other current liabilities approximate their carrying amounts largely due to the short-term maturities of these instruments.
The fair value of the financial assets and liabilities is included at the amount at which the instrument could be exchanged in a current transaction between willing parties, other than in a forced or liquidation sale. The following methods and assumptions were used to estimate the fair values:
The Group enters into derivative financial instruments with various counterparties, principally financial institutions with investment grade credit ratings. Forward contracts are valued using valuation techniques, which employ the use of market observable inputs. The most frequently applied valuation techniques include forward pricing models using present value calculations (hierarchy level 2). The models incorporate various inputs including the credit quality of counterparties, foreign exchange spot and forward rates, yield curves of the respective currencies and currency basis spreads between the respective currencies. All derivative contracts are fully cash collateralised, thereby eliminating both counterparty risk and the Group's own non-performance risk. As at 31 December 2018, the marked-to-market value of derivative asset positions is net of a credit valuation adjustment attributable to derivative counterparty default risk. The changes in counterparty credit risk had no material effect on measurement of financial instruments recognised at fair value. The Group applies input from its respective bank relations in performing the fair value calculations.
The fair value of the Group's interest-bearing liability is assessed to be in all material aspects similar to carrying amount.
In 2018 the Callable Open Bond was listed at Oslo Stock Exchange. As of 31.12.2018 the fair value of the Callable Open Bond was calculated by using the OSE trading price at year-end.
31
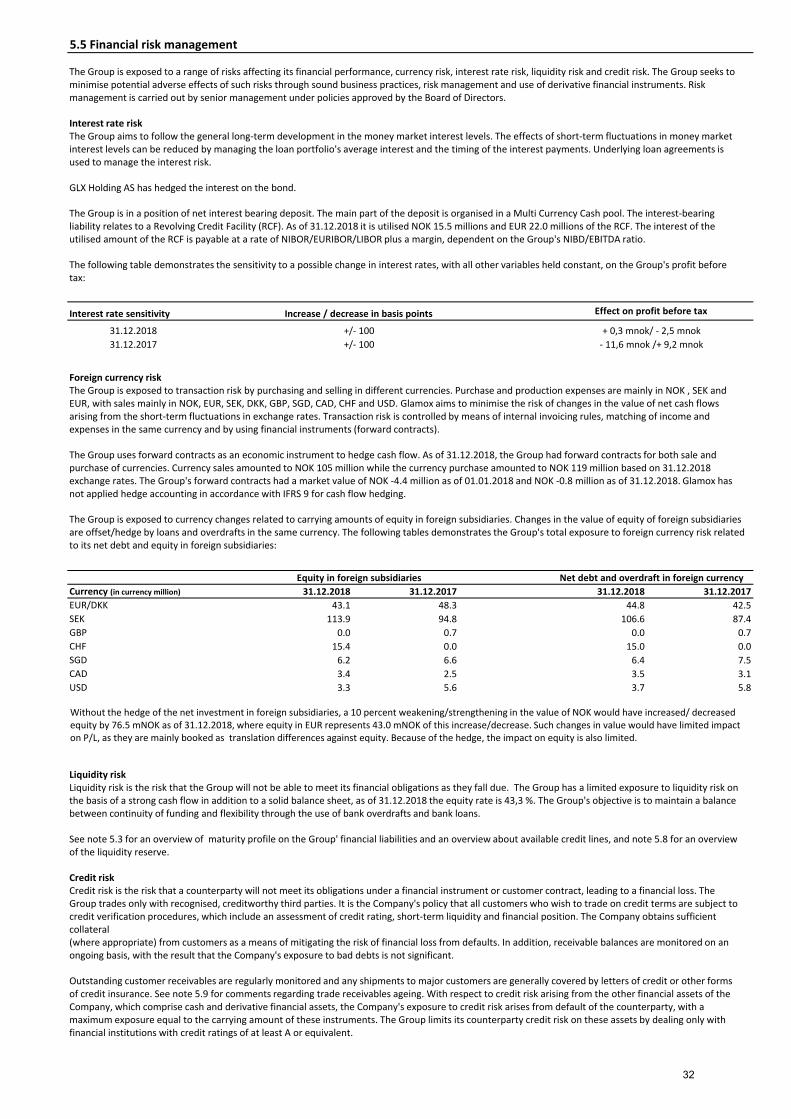
5.5 Financial risk management
Interest rate sensitivity
31.12.201831.12.2017
Currency (in currency million) 31.12.2018 31.12.2017 31.12.2018 31.12.2017EUR/DKK 43.1 48.3 44.8 42.5SEK 113.9 94.8 106.6 87.4GBP 0.0 0.7 0.0 0.7CHF 15.4 0.0 15.0 0.0SGD 6.2 6.6 6.4 7.5CAD 3.4 2.5 3.5 3.1USD 3.3 5.6 3.7 5.8
Net debt and overdraft in foreign currencyEquity in foreign subsidiaries
Increase / decrease in basis points
+/- 100
Effect on profit before tax
- 11,6 mnok /+ 9,2 mnok+/- 100 + 0,3 mnok/ - 2,5 mnok
The Group is exposed to a range of risks affecting its financial performance, currency risk, interest rate risk, liquidity risk and credit risk. The Group seeks to minimise potential adverse effects of such risks through sound business practices, risk management and use of derivative financial instruments. Risk management is carried out by senior management under policies approved by the Board of Directors.
Interest rate riskThe Group aims to follow the general long-term development in the money market interest levels. The effects of short-term fluctuations in money market interest levels can be reduced by managing the loan portfolio's average interest and the timing of the interest payments. Underlying loan agreements is used to manage the interest risk.
GLX Holding AS has hedged the interest on the bond.
The Group is in a position of net interest bearing deposit. The main part of the deposit is organised in a Multi Currency Cash pool. The interest-bearing liability relates to a Revolving Credit Facility (RCF). As of 31.12.2018 it is utilised NOK 15.5 millions and EUR 22.0 millions of the RCF. The interest of the utilised amount of the RCF is payable at a rate of NIBOR/EURIBOR/LIBOR plus a margin, dependent on the Group's NIBD/EBITDA ratio.
The following table demonstrates the sensitivity to a possible change in interest rates, with all other variables held constant, on the Group's profit before tax:
Without the hedge of the net investment in foreign subsidiaries, a 10 percent weakening/strengthening in the value of NOK would have increased/ decreased equity by 76.5 mNOK as of 31.12.2018, where equity in EUR represents 43.0 mNOK of this increase/decrease. Such changes in value would have limited impact on P/L, as they are mainly booked as translation differences against equity. Because of the hedge, the impact on equity is also limited.
Foreign currency riskThe Group is exposed to transaction risk by purchasing and selling in different currencies. Purchase and production expenses are mainly in NOK , SEK and EUR, with sales mainly in NOK, EUR, SEK, DKK, GBP, SGD, CAD, CHF and USD. Glamox aims to minimise the risk of changes in the value of net cash flows arising from the short-term fluctuations in exchange rates. Transaction risk is controlled by means of internal invoicing rules, matching of income and expenses in the same currency and by using financial instruments (forward contracts).
The Group uses forward contracts as an economic instrument to hedge cash flow. As of 31.12.2018, the Group had forward contracts for both sale and purchase of currencies. Currency sales amounted to NOK 105 million while the currency purchase amounted to NOK 119 million based on 31.12.2018 exchange rates. The Group's forward contracts had a market value of NOK -4.4 million as of 01.01.2018 and NOK -0.8 million as of 31.12.2018. Glamox has not applied hedge accounting in accordance with IFRS 9 for cash flow hedging.
The Group is exposed to currency changes related to carrying amounts of equity in foreign subsidiaries. Changes in the value of equity of foreign subsidiaries are offset/hedge by loans and overdrafts in the same currency. The following tables demonstrates the Group's total exposure to foreign currency risk related to its net debt and equity in foreign subsidiaries:
Liquidity riskLiquidity risk is the risk that the Group will not be able to meet its financial obligations as they fall due. The Group has a limited exposure to liquidity risk on the basis of a strong cash flow in addition to a solid balance sheet, as of 31.12.2018 the equity rate is 43,3 %. The Group's objective is to maintain a balance between continuity of funding and flexibility through the use of bank overdrafts and bank loans.
See note 5.3 for an overview of maturity profile on the Group' financial liabilities and an overview about available credit lines, and note 5.8 for an overview of the liquidity reserve.
Credit riskCredit risk is the risk that a counterparty will not meet its obligations under a financial instrument or customer contract, leading to a financial loss. The Group trades only with recognised, creditworthy third parties. It is the Company's policy that all customers who wish to trade on credit terms are subject to credit verification procedures, which include an assessment of credit rating, short-term liquidity and financial position. The Company obtains sufficient collateral (where appropriate) from customers as a means of mitigating the risk of financial loss from defaults. In addition, receivable balances are monitored on an ongoing basis, with the result that the Company's exposure to bad debts is not significant.
Outstanding customer receivables are regularly monitored and any shipments to major customers are generally covered by letters of credit or other forms of credit insurance. See note 5.9 for comments regarding trade receivables ageing. With respect to credit risk arising from the other financial assets of the Company, which comprise cash and derivative financial assets, the Company's exposure to credit risk arises from default of the counterparty, with a maximum exposure equal to the carrying amount of these instruments. The Group limits its counterparty credit risk on these assets by dealing only with financial institutions with credit ratings of at least A or equivalent.
32

5.6 Capital management
31.12.2018 31.12.2017Interest bearing liabilities 1 568 230 1 445 812 Less: cash and bank deposit excl. restricted cash -305 179 -290 320 Net interest bearing debt 1 263 051 1 155 493
Total Assets 4 539 993 4 290 751Total Equity 1 965 804 1 918 994 Equity ratio 43 % 45 %
For the purpose of the Group's capital management, capital includes issued capital and all other equity reserves attributable to the equity holders of the parent. The primary objective of GLX Holding' capital management is to ensure that it maintains a healthy capital ratios in order to support its business and maximise shareholder value.
The Group manages its capital structure and makes adjustments in light of changes in economic conditions and the requirements of the financial covenants. To maintain or adjust the capital structure, the Company may adjust the dividend payment to shareholders, return capital to shareholders or issue new shares.
In order to achieve this overall objective, the Group’s capital management, amongst other things, aims to ensure that it meets financial covenants related to the interest-bearing financial liabilities in the Glamox Group. Breaches in meeting the financial covenants would permit the bank to immediately call loans and borrowings towards Glamox. There have been no breaches of the financial covenants of any interest bearing loans and borrowing in the current period. Reference is made to note 5.2 for disclosed information regarding interest bearing liabilities and financial covenants.
33

5.7 Equity and shareholders
Share capital in GLX Holding AS at 31.12.2018 Number Nominal Value Balance SheetShares NOK 1 000 1 000 1 000 000Total NOK 1 000 1 000 1 000 000All shares have the same voting rights.
Reconciliation of equity is shown in the statement of changes in equity.
There have been no changes in the number of shares in 2016 or 2015. Holders of these shares are entitled to dividend and to one vote per share at general meetings of the Company. There have been no changes in the number of shares in 2018 or 2017. GLX Holding AS is a 100% owned subsidiary of Glace Holdco AS.
There has been no distribution of dividend during 2018 or 2017.
34

5.8 Cash and cash equivalents
Cash and cash equivalents 31.12.2018 31.12.2017Bank deposits, unrestricted 305 179 290 320 Bank deposit, restricted, employee taxes in Glamox AS 13 167 16 745 Total cash and cash equivalents 318 346 307 064
Liquidity reserve 1 057 447 974 695
The liquidity reserve is the total overdraft and revolving facilites of all Group companies, minus all utilised overdraft and revolving facilities, and added all cash on hand and deposits. The liquidity reserve for the Glamox Group is organised in a revolving facility and a Multi Currency Cash pool. In addition GLX Holding AS has bank deposit.
The bond may be extended by additional NOK 650 million. This is not included in the liquidity reserve.
Legally, the parent company of the Glamox Group, Glamox AS, is the counter party towards the Bank regarding the Multi Currency Cash pool within the Glamox Group. The net position of the cash pool is presented as cash and cash equivalents.
Restricted deposits in Glamox AS and the Group amounted to NOK 13,2 million in 2018.
35

5.9 Trade and other receivables
Trade and other receivables 31.12.2018 31.12.2017
Trade receivablesTrade receivables 371 126 358 803 Trade receivables from related parties - - Total trade receivables 371 126 358 803
Other receivablesPrepaid rent 3 203 2 519 Prepaid other expenses 10 776 10 101 Prepaid VAT 4 395 3 427 Other - Retention fees due 5 858 7 996 Withholding tax 29 387 - Other 26 344 29 584 Total other receivables 79 962 53 627
Provision for impairment of receivables 2018At January 1 17 351 Currency effect 123 This years loss -1 031 Payments received against previous losses 13 Provision this year 1 985 At December 31 18 440
Ageing analysis of trade receivables Total < 30 days 31-60 days 61-90 days > 90 days2018 371 126 292 904 66 696 8 330 429 2 767 2017 358 803 283 506 62 255 12 433 610 -
Neither past due nor impaired
Past due but not impaired
GLX Holding Group was established at 11.12.2017 and provision for impairment of receivables was NOK 17.35 million at 31 December 2017.
As at 31 December the ageing analysis of trade receivables is, as follows:
For details regarding the Group's procedures on managing credit risk, reference is made to note 5.5.
36

5.10 Trade and other payables
Trade and other payables 31.12.2018 31.12.2017
Trade payablesTrade payables 203 949 176 775Trade payables to related parties - - Total trade payables 203 949 176 775
Other payablesPublic duties payables 95 653 82 889 Total other payables 95 653 82 889
For trade and other payables ageing analysis, refererence is made to note 5.3. For trade and other payables ageing analysis, refererence is made to note 5.3.
37

5.11 Financial income and expenses
Financial income and expenses 2018 2017
Financial incomeCurrency gain 14 742 941 Interest income 5 421 102 Unrealised gain financial derivates 4 067 - Realised gain financial derivates 7 096 - Other financial income 152 52 Total financial income 31 478 1 094
Financial expensesCurrency loss 16 257 2 043 Interest expenses 106 026 5 095 Other financial expenses 6 815 1 943 Financial expenses 129 098 9 081
The Group applies hedge accounting on net investments in foreign subsidiaries. Loans and bank overdrafts are applied as hedging instruments (see note 5.1). Currency effects from hedging instruments are presented in the statement of OCI, to the extent that the hedging is effective.
38

6.1 Taxes
2018 2017Current income tax expense:Tax payable 73 071 - Change deferred tax/deferred tax assets (ex. OCI effects) -54 159 -1 666 Currency effects -583 - Tax effect on net gain/loss on hedge of foreign subsidiaries 4 361 - Tax related to previous years 6 277 - Withholding tax - Total income tax expense 28 967 -1 666 Effect of changed tax rate (in Norway) -10 846
Deferred tax related to items recognised in OCI during the year:Net gain/loss on hedge of foreign subsidiaries -4 361 - Tax effect on remeasurements on defined benefit plans 244 - Deferred tax charged to OCI -4 117 -
Total tax for the year on group level:Norwegian companies 3 008 -1 666 Foreign companies 25 958 - Total tax for the year 28 966 -1 666
Current tax liabilities consist of:Current tax liability - effect from acqusition of Glamox Group 73 071 34 302- of which paid in fiscal year -38 546- withholding tax 1 322
Current tax liabilities 31.12 35 847 34 302
Deferred tax liabilities (assets): 31.12.2018 31.12.2017Property, plant and equipment 42 331 45 212Intangible assets 1 260 662 1 168 648Other current assets -25 249 -13 035Liabilities -27 622 -20 289Net pension reserves/commitments -45 706 -16 102Derivates -853 -4 920Losses carried forward (including tax credit) -245 300 -38 832 Untaxed profit 260 248 236 018 Basis for deferred tax liabilities (assets): 1 218 509 1 356 700
Calculated deferred tax assets 83 694 25 291- Deferred tax assets not recognised -34 796 -9 516Net deferred tax assets recognised in balance sheet 48 898 15 775
Deferred tax liabilities recognised in balance sheet 344 627 332 009
39

7.1 Management remuneration
Remuneration to CEO SalaryPerformance- related bonus
Extra compensation Pension
Other remuneration
Rune Marthinussen - CEO 2018 3 134 1 269 - 49 178
Rune Marthinussen - CEO 2017 2 849 1 413 2 849 48 178
GLX Holding ASGLX Holding AS has no employees, and there has been no remuneration to board members during 2018.
Glamox The CEO of Glamox is a part of a defined contribution pension scheme for salaries up to 12G (approx 1,1 mnok). In addition, the CEO is entitled to a salary compensation of 23,95% of fixed salary for amounts exceeding 12G. The CEO also has a performance based bonus agreement.
The CEO of Glamox has a performance related bonus agreement which can give up to seven months’ additional salary. The financial statements of 2018 are charged with 1.269 TNOK related to the performance related bonus agreement.
2017 figurs for remuneration to the CEO refer to salary related cost for the entire year. Upon
termination from the company, the CEO is entitled to 12 months severence pay.
40
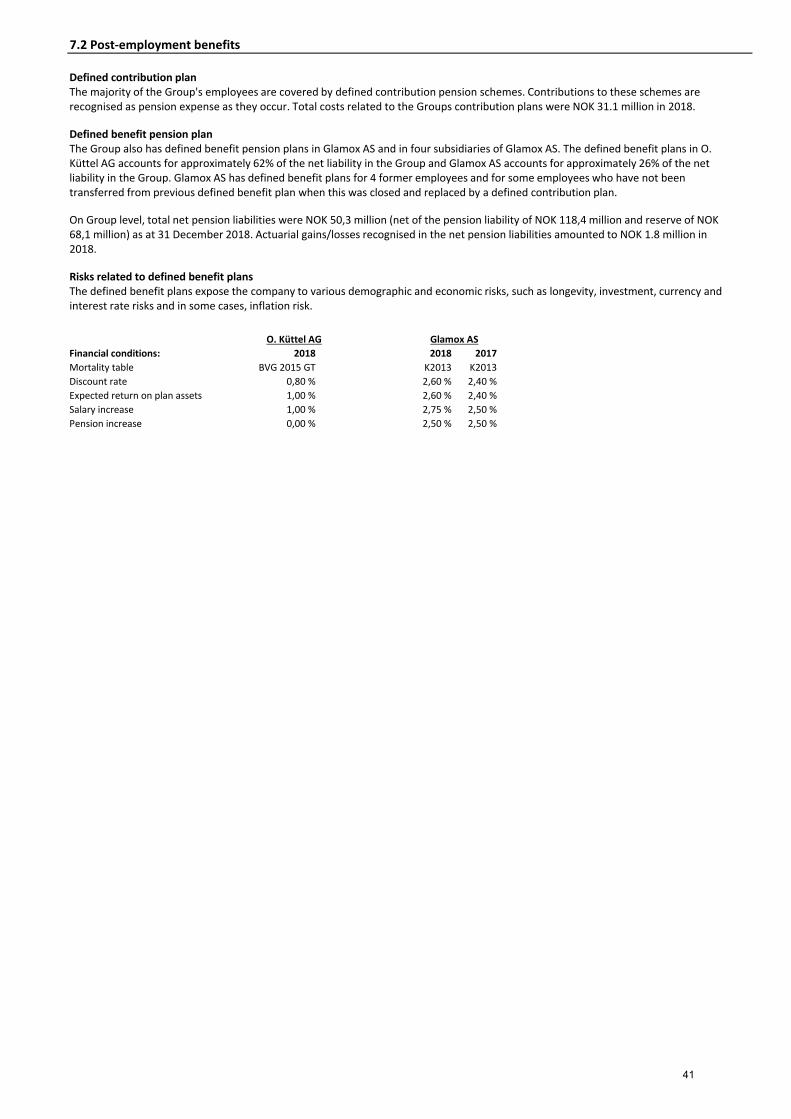
7.2 Post-employment benefits
Financial conditions: 2018 2018 2017Mortality table BVG 2015 GT K2013 K2013Discount rate 0,80 % 2,60 % 2,40 %Expected return on plan assets 1,00 % 2,60 % 2,40 %Salary increase 1,00 % 2,75 % 2,50 %Pension increase 0,00 % 2,50 % 2,50 %
O. Küttel AG Glamox AS
Defined contribution plan The majority of the Group's employees are covered by defined contribution pension schemes. Contributions to these schemes are recognised as pension expense as they occur. Total costs related to the Groups contribution plans were NOK 31.1 million in 2018.
Defined benefit pension planThe Group also has defined benefit pension plans in Glamox AS and in four subsidiaries of Glamox AS. The defined benefit plans in O. Küttel AG accounts for approximately 62% of the net liability in the Group and Glamox AS accounts for approximately 26% of the net liability in the Group. Glamox AS has defined benefit plans for 4 former employees and for some employees who have not been transferred from previous defined benefit plan when this was closed and replaced by a defined contribution plan.
On Group level, total net pension liabilities were NOK 50,3 million (net of the pension liability of NOK 118,4 million and reserve of NOK 68,1 million) as at 31 December 2018. Actuarial gains/losses recognised in the net pension liabilities amounted to NOK 1.8 million in 2018.
Risks related to defined benefit plans The defined benefit plans expose the company to various demographic and economic risks, such as longevity, investment, currency and interest rate risks and in some cases, inflation risk.
41

8.1 Interests in subsidiaries
Name of company Office CUR Share CapitalShareholding in
Glamox ASCarrying amount
in Glamox AS
Glamox Group's voting ownership
shareGlamox A/S Denmark DKK 4 900 100,0% 8 045 100,0%Glamox AB Sweden SEK 600 100,0% 1 681 100,0%Glamox Oy Finland EUR 100 100,0% 6 082 100,0%Glamox Ltd. England GBP 4 100,0% 680 100,0%Glamox Ireland Ltd. Ireland EUR 169 100,0% 1 787 100,0%Glamox GmbH Germany EUR 683 25,0% 21 570 100,0%AS Glamox HE Estonia EUR 166 100,0% 6 345 100,0% 5)Glamox Aqua Signal GmbH Germany EUR 3 860 5,1% 6 344 100,0%Glamox Production GmbH & Co. KG Germany EUR 5 845 0,0% 0 100,0%GPG Verwaltungsgesellschaft mbH Germany EUR 25 0,0% 0 100,0%Glamox B.V. The Netherlands EUR 18 100,0% 20 346 100,0%LINKSrechts GmbH Germany EUR 27 100,0% 58 259 100,0%Glamox Aqua Signal Corporation USA USD 100 100,0% 443 100,0%Glamox Inc. Canada CAD 2 208 100,0% 0 100,0%Glamox Pte Ltd. Singapore SGD 6 100 98,7% 23 666 98,7% 1)Glamox (Suzhou) Lighting Co. Ltd China CNY 20 388 100,0% 4 050 100,0%Suzhou Glamox Trade Co. Ltd China CNY 500 0,0% 0 100,0%Glamox Co. Ltd. South Korea KRW 775 020 100,0% 4 483 100,0%Luxo AS Norway NOK 1 759 100,0% 19 039 100,0% 3)Luxo Corporation USA USD 0 100,0% 0 100,0%Glamox Brasil Iluminacao LTDA Brazil BRL 50 100,0% 130 100,0% 2)Birger Hatlebakks veg 15 AS Norway NOK 100 100,0% 1 373 100,0%O. Küttel AG Switzerland CHF 200 100,0% 122 142 100,0% 4)Total carrying amount in Glamox AS of shares in subsidiaries 306 465
1) Non-controlling interests in Glamox Pte Ltd is 1.27%. Dividends paid to non-controlling interest in 2018 amounts to NOK 0.00 million (2017: NOK 0.047 million).2) Non-controlling interests in Glamox Brasil Iluminacao LTDA owns 1 share of totally 50 000 shares, corresponding to 0.002%. 3) Glamox AS has given a group contribution to Luxo AS of NOK 770 thousand (after tax deduction) in 2018 (2017: NOK 731 thousand).4) In 2018 Glamox AS has bought 100% of the shares in O. Küttel AG. 5) In 2018 AS Glamox HE has become a 100% direct owned subsidiary of Glamox AS.
All subsidiaries are included in the consolidated statement of financial position.
GLX Holding AS owns 76,16% of the shares in Glamox AS, this also equals the voting share. The head office of Glamox is in Norway. Share capital of Glamox AS is NOK 66 million. Carrying amount of Glamox shares in the GLX Holding accounts is NOK 2.735,3 million.
Glamox AS has following subsidiaries:
42

8.2 Business combinations
All figures in tNOK Book value Gaap_Adj Fair value_Adj Fair valueAssets
Goodwill 33 547 33 547 Other intangible non-current assets 16 828 16 828 Deferred tax asset 3 680 3 680 Tangible non-current assets 16 823 8 938 25 761 Inventories 11 838 11 838 Trade and other receivables 39 764 39 764 Cash and cash equivalents 26 804 26 804
Total assets 95 229 3 680 59 312 158 222
LiabilitiesDeferred tax 3 607 3 607 Pension liabilities 26 287 26 287 Current liabilities 8 483 8 483
Total liabilities 8 483 26 287 3 607 38 376
Total identifiable net assets at fair value 86 747 -22 606 55 705 119 846
Purchase considerationCash consideration paid 119 844
Analysis of cash flows on acquisitionCash consideration paid -119 844 Net cash acquired with the subsidiary (included in the cash flows from investing activities) 26 804 Net cash flow on acquisition -93 037
O. Küttel AGIn 2018, Glamox AS acquired 100% of the shares of O. Küttel AG from Regent Bleuchtungsköper. The date of aquisition was 01.04.2018.
Küttel is a leading Swiss provider of lighting for the professional building market in Switzerland. From the date of acquisition, Küttel has contributed CHF 16.1million (NOK 132.4 million) of revenue and CHF 0.6 million (NOK 5.1 million) of profit before interest and tax to the group's result. In the financial year 2017 the company had a revenue of CHF 21.4 million (NOK 175.9 million) and a profit before interest and tax of CHF 0.8 million (NOK 6.6 million) with accounting principal according to local Swiss gaap.
The total purchase consideration was CHF 14.75 million (NOK 119.8 million) all paid by cash.
Total transaction costs related to the acquistion was CHF 0.3 million (NOK 2.5 million), and was expensed as Other operating expenses.
Before the acquisition, Küttel reported financial figures according to local Swiss gaap. Swiss GAAP FER 16 states that a company does not have to report any pension liability from Swiss pension plans in the balance sheet, as the statutory coverage ratio of the pension foundation is guaranteed to always be 100%. However, there is a theoretical risk that the employer will have to spend more on pension premiums as the term and conditions of the affiliation contract could change. This risk trigger the defined benefit categorization of all Swiss pension plans accoring to IAS 19. Consequently, the pension plans of Küttel also has to be valued and recognised according to IAS 19.
The acquisition cost is allocated to identifiable assets and liabilities at fair value on the acquisition date. The excess amount is recognised as Goodwill. The below table illustrates the fair values of the identifiable assets and liabilities at acquisition.
The acquired goodwill is assumed to mainly relate to positive market development, possibilities for efficiency improvements and opportunities related to strategic growth. The acquired Other intangible non-current assets relates to Trademark and Customer relationship.
If the acquisition of Küttel had occured 1 January 2018, revenues in 2018 for the Glamox Group would have been approximately CHF 5.3 million (NOK 43.6 million) higher and Profit before interest and tax would have been approximately CHF 0.5 million (NOK 4.1 million) higher.
43

9.1 Earnings per share
2018 2017Attribution of profit for the yearTotal profit for the year attributable to equity holders of the parent 25 558 -55 676
Total profit for the year attributable to equity holders of the parent for basic earnings 25 558 -55 676
Earnings per ordinary share attributable to shareholders:Weighted average number of ordinary shares outstanding used for calculation: 1 000 1 000
Earnings per share in NOK (basic) 25,56 -55,68
9.2 Related party transactions
9.3 Events after the reporting period
Basic EPS is calculated by dividing the profit for the year attributable to ordinary equity holders of the parent by the weighted average number of ordinary shares outstanding during the year.
Diluted EPS is calculated by dividing the profit attributable to ordinary equity holders of the parent (after adjusting for interest on the convertible preference shares) by the weighted average number of ordinary shares outstanding during the year plus the weighted average number of ordinary shares that would be issued on conversion of all the dilutive potential ordinary shares into ordinary shares.
As GLX Holding AS does not have any share options or convertible preference shares as of 31 December 2018 there are no differences between basic and diluted EPS.
The following table reflects the income and share data used in the basic and diluted EPS computations:
Related parties are Group companies, major shareholders, board and senior management in the parent company and the group subsidiaries. Note 8.1 provides information about the Group’s structure, including details of the subsidiaries and the holding company. The agreements on remuneration for CEO appear in note 7.1
All transactions within the Group or with other related parties are based on the principle of arm's length.
The company has agreements with Triton Advisers Limited and Triton Investment Management Limited for counseling and success fee related to the acquisition of businesses respectively. Expenses during 2018 were NOK 3.8 million (2017: 41.5 million).
DividendsAfter the reporting date, the board of Glamox AS has proposed a dividend distribution amounting to NOK 141.1 million. GLX Holding AS will receive NOK 107.4 million of this distribution.
Other than this there have been no significant events subsequent to the reporting date.
44

10.1 Significant accounting policies
Revenue recognitionThe IASB has issued a new standard for recognition of revenue. This has replaced IAS 18 which covers revenue from sale of goods and rendering of services and IAS 11 which covers revenue and costs from construction contracts. The new standard is based on the principle that revenue is recognized when control of a goods or service transfers to a customer – so the notion of control replaces the existing notion of risks and rewards. A new five-step process must be applied before revenue can be recognised:
- identify contracts with customers- identify the separate performance obligation - determine the transaction price of the contract- allocate the transaction price to each of the separate performance obligations, and- recognise the revenue as each performance obligation is satisfied.
The group is a global provider of lighting solutions for a wide variety of applications, on land and offshore. Revenue is recognised to the extent that it is probable that the economic benefits will flow to the Group and the revenue can be reliably measured, regardless of when the payment is received. Revenue is measured at the fair value of the consideration received or receivable, taking into account contractually defined terms of payment and excluding taxes or duty.
All significant revenue streams relates to production and sales of goods. The Group`s main performance obigation is related to sale of goods where the performance obligations are the delivery of an agreed volume of products within the agreed specification. Linksrechts is the only company in the group that produces and delivers installations that are tailored through engineering and design. For each project, management assess if the projects consist of several distinct performance obligations and when the performance obligation(s) are satisfied. The company did not have any ongoing projects at implementation date (01.01.2018) or at year-end with material effect on the timing of the revenue recognition.
Sale of goodsRevenue are recognised when control of the products has transferred, being when the products are delivered to the customer and there is no unfulfilled obligation that could affect the customer´s acceptance of the product. Delivery occurs when the products have been shipped to the specific location, the risks of obsolescence and loss have been transferred to the customer, and either the customer has accepted the products in accordance with the sales contract, the acceptance provisions have lapsed, or the group has objective evidence that all criteria for acceptance have been satisfied. Standard delivery terms for customers within the PBS segment is Delivered Duty Paid (DDP). DDP delivery terms inplies that delivery is completed when the goods are made available to the buyer at a specified location. Standard delivery terms to customers within the GMO segment is Ex Works (EXW). EXW delivery terms implies that delivery is completed when the goods are made available, suitably packaged at a specified loaction, often at the Group`s factory or depot.
In some cases, the Group offer to deliver freight as a service to the customer. In such cases, freight are considered to be a fullfilment of the delivery and not considered to be a distinct performance obilagtion. Freight and delivery of goods are therefore considered as a common performance obligation and recognised when control of the products has transferred to the customer.
No element of financing is deemed present as the sales are made with a credit term up to 60 days, which is consistent with market practice. A receivable is recognised when the goods are delivered as this is the point in time that the consideration is unconditional because only the passage of time is required before the payment is due.
Revenue from the sale of goods is measured at the fair value of the consideration received or receivable, net of returns and allowances, trade discounts and volume rebates. The goods are normally sold with standard warranties that the goods comply with the agreed-upon specifications. These standard warranties are accounted for using IAS 37 Provisions, see note 4.1 for more information. The Group does not have any other significant obligations for returns or refunds.
InventoriesInventories are valued at the lower of cost and net realisable value. Costs incurred in bringing each product to its present location and condition are accounted for, as follows:
• Raw materials: purchase cost on a first-in/first-out basis• Finished goods and work in progress: cost of direct materials and labour and a proportion of manufacturing overheads based on the
normal operating capacity, but excluding borrowing costs
Raw material mainly consist of metal parts, LED components, plastic modules, cables, electronic parts and packaging. The basic calculation of inventory is based on standard cost. The standard cost is re-calculated by year end. The effect of the re-calculations is booked through profit and loss.
Net realisable value is the estimated selling price in the ordinary course of business, less estimated costs of completion and the estimated costs necessary to make the sale.
A provision for obsolescence is included in the inventory when necessary. The criteria for assessing the needs and level of the provision are based on objective calculations and management judgements. Turnover of the goods is the base of the objective calculation. Depending on the turnover rate (3 months, 6 months or 12 months) the Group has set specific obsolesce rates to be used.
45

Current versus non-current classificationThe Group presents assets and liabilities in the statement of financial position based on current/non-current classification. An asset is current when it is:
• Expected to be realised or intended to be sold or consumed in the normal operating cycle,• Held primarily for the purpose of trading,• Expected to be realised within twelve months after the reporting period, or• Cash or cash equivalent unless restricted from being exchanged or used to settle a liability for at
All other assets are classified as non-current.
A liability is current when:
• It is expected to be settled in the normal operating cycle, • It is held primarily for the purpose of trading, • It is due to be settled within twelve months after the reporting period, or• There is no unconditional right to defer the settlement of the liability for at least twelve months after the reporting period
The Group classifies all other liabilities as non-current. Deferred tax assets and liabilities are classified as non-current assets and liabilities.
Property, plant and equipmentTangible fixed assets such as plant and equipment are stated at cost, net of accumulated depreciation and accumulated impairment losses, if any. When significant parts of plant and equipment are required to be replaced at intervals, the Group depreciates them separately based on their specific useful lives. Likewise, when a major inspection is performed, its cost is recognised in the carrying amount of the plant and equipment as a replacement if the recognition criteria are satisfied. All other repair and maintenance costs are recognised in profit or loss as incurred.
The group considers equipment used in operations to be a tangible fixed asset if it has an economic life of more than three years.
Depreciation is calculated on a straight-line basis over the estimated useful lives of the assets, reference is made to note 3.1 for further guidance related to useful lives.
Business combinations and goodwillBusiness combinations are accounted for using the acquisition method. The cost of an acquisition is measured as the aggregate of the consideration transferred, which is measured at acquisition date fair value, and the amount of any non-controlling interests in the acquiree. For each business combination, the Group elects whether to measure the non-controlling interests in the acquiree at fair value or at the proportionate share of the acquiree’s identifiable net assets. Acquisition-related costs are expensed as incurred and included in administrative expenses.
When the Group acquires a business, it assesses the financial assets and liabilities assumed for appropriate classification and designation in accordance with the contractual terms, economic circumstances and pertinent conditions as at the acquisition date.
Any contingent consideration to be transferred by the acquirer will be recognised at fair value at the acquisition date. Contingent consideration classified as an asset or liability that is a financial instrument and within the scope of IFRS 9 Financial Instruments: Recognition and Measurement, is measured at fair value with the changes in fair value recognised in the statement of profit or loss.
Goodwill is initially measured at cost (being the excess of the aggregate of the consideration transferred and the amount recognised for non-controlling interests and any previous interest held over the net identifiable assets acquired and liabilities assumed). After initial recognition, goodwill is measured at cost less any accumulated impairment losses. For the purpose of impairment testing, goodwill is allocated to each of the CGU's that are expected to benefit from the combination, irrespective of whether other assets or liabilities of the acquiree are assigned to those units. Reference is made to note 3.2 for an overview over goodwill, allocation of goodwill per CGU and impairment testing.
Intangible assetsIntangible assets acquired separately are measured on initial recognition at cost. The cost of intangible assets acquired in a business combination is their fair value at the date of acquisition. Following initial recognition, intangible assets are carried at cost less any accumulated amortisation and accumulated impairment losses. Internally generated intangibles, excluding capitalised development costs, are not capitalised and the related expenditure is reflected in profit or loss in the period in which the expenditure is incurred.
The useful lives of intangible assets are assessed as either finite or indefinite. The group has no assets with indefinite useful lives.
Intangible assets are amortised over the useful economic life and assessed for impairment whenever there is an indication that the intangible asset may be impaired. The amortisation period and the amortisation method for an intangible asset with a finite useful life are reviewed at least at the end of each reporting period. Changes in the expected useful life or the expected pattern of consumption of future economic benefits embodied in the asset are considered to modify the amortisation period or method, as appropriate, and are treated as changes in accounting estimates. The amortisation expense related to the intangible assets is recognised in the statement of profit or loss.
i 46

Research and development costsResearch costs are expensed as incurred. Development expenditures on an individual project, which represents new applications/technology, are recognised as an intangible asset when the Group can demonstrate:
• The technical feasibility of completing the intangible asset so that the asset will be available for use or sale• Its intention to complete and its ability and intention to use or sell the asset• How the asset will generate future economic benefits• The availability of resources to complete the asset• The ability to measure reliably the expenditure during development
Following initial recognition of the development expenditure as an asset, the asset is carried at cost less any accumulated amortisation and accumulated impairment losses. Amortisation of the asset begins when development is complete and the asset is available for use. It is amortised over the period of expected future benefit. During the period of development, the asset is tested for impairment annually.
Impairment of non-financial assetsFurther disclosures relating to impairment of non-financial assets are also provided in the following notes:Property, plant and equipment - Note 3.1Goodwill - Note 3.2Other Intangible assets - Note 3.3
At each reporting date, the Group assesseswhether there is an indication that an asset may be impaired. If any indication exists, or when annual impairment testing for an asset is required, the Group estimates the asset’s recoverable amount. An asset’s recoverable amount is the higher of an asset’s or CGU’s fair value less costs of disposal and its value in use. The recoverable amount is determined for an individual asset, unless the asset does not generate cash inflows that are largely independent of those from other assets or groups of assets. When the carrying amount of an asset or CGU exceeds its recoverable amount, the asset is considered impaired and is written down to its recoverable amount.
In assessing value in use, the estimated future cash flows are discounted to their present value using a pre-tax discount rate that reflects current market assessments of the time value of money and the risks specific to the asset. In determining fair value less costs of disposal, recent market transactions are taken into account. If no such transactions can be identified, an appropriate valuation model is used. These calculations are corroborated by valuation multiples, quoted share prices for publicly traded companies or other available fair value indicators.
The Group bases its impairment calculation on detailed budgets and forecast calculations, which are prepared separately for each of the Group’s CGUs to which the individual assets are allocated. These budgets and forecast calculations generally cover a period of five years. A long-term growth rate is calculated and applied to project future cash flows after the fifth year.
Impairment losses of continuing operations are recognised in the statement of profit or loss in expense categories consistent with the function of the impaired asset.
For assets excluding goodwill, an assessment is made at each reporting date to determine whether there is an indication that previously recognised impairment losses no longer exist or have decreased. If such indication exists, the Group estimates the asset’s or CGU’s recoverable amount. A previously recognised impairment loss is reversed only if there has been a change in the assumptions used to determine the asset’s recoverable amount since the last impairment loss was recognised. The reversal is limited so that the carrying amount of the asset does not exceed its recoverable amount, nor exceed the carrying amount that would have been determined, net of depreciation, had no impairment loss been recognised for the asset in prior years. Such reversal is recognised in the statement of profit or loss.
Goodwill is tested for impairment annually and when circumstances indicate that the carrying value may be impaired. Impairment is determined for goodwill by assessing the recoverable amount of each CGU (or group of CGUs) to which the goodwill relates. When the recoverable amount of the CGU is less than its carrying amount, an impairment loss is recognised. Impairment losses relating to goodwill cannot be reversed in future periods.
Intangible assets with indefinite useful lives are tested for impairment annually at the CGU level, as appropriate, and when circumstances indicate that the carrying value may be impaired.
Provisions
GeneralProvisions are recognised when the Group has a present obligation (legal or constructive) as a result of a past event, it is probable that an outflow of resources embodying economic benefits will be required to settle the obligation and a reliable estimate can be made of the amount of the obligation. When the Group expects some or all of a provision to be reimbursed, for example, under an insurance contract, the reimbursement is recognised as a separate asset, but only when the reimbursement is virtually certain. The expense relating to a provision is presented in the statement of profit or loss net of any reimbursement.
If the effect of the time value of money is material, provisions are discounted using a current pre-tax rate that reflects, when appropriate, the risks specific to the liability. When discounting is used, the increase in the provision due to the passage of time is recognised as a finance cost.
47

The classification is dependent on the type of instrument and the purpose for which the investments were acquired or originated.
Fair value through profit or loss is the classification of instruments that are held for trading or for which the entity`s business model is to manage the financial assets on a fair value basis i.e. to realise the asset through sales as opposed to holding the asset to collect contractual cash flows.
Amortised cost applied to instruments for which an entity has a business model to hold the financial asset to collect the contractual cash flows. The characteristics of the contractual cash flows are that of solely payments of the principal amount and interest.
Financial assets and liabilities measured at amortised cost is the category most relevant to the Group. This category generally applies to trade and other receivables, interest-bearing loans, trade payables and other financial liabilities.
The Group has the following financial instruments:
FVTPL:
Financial assets (AC):
Financial liabilities (AC):
Derivative instruments – Forward contracts (notes: 5.1)
Trade receivables and other current receivables (notes: 5.1 and 5.9)
Includes most of the Group’s financial liabilities including debt to credit institutions, trade
payables and other current and non-current financial liabilities. (notes: 5.1, 5.2 and 5.10)
Warranty provisionsProvisions for warranty-related costs are recognised when the product is sold to the customer. Initial recognition of the warrenty provision is based on previous years turnover and management judgment. The length of the warrenty time may differ between the markets. The initial estimate of warranty-related costs is revised annually. Reference is also made to note 1.3 and 4.1 for further details.
Restructuring provisionsRestructuring provisions are recognised only when the Group has a constructive obligation, which is when a detailed formal plan identifies the business or part of the business concerned, the location and number of employees affected, a detailed estimate of the associated costs, and an appropriate timeline, and the employees affected have been notified of the plan’s main features. Reference is also made to note 4.1 for further details.
LeasesThe determination of whether an arrangement is (or contains) a lease is based on the substance of the arrangement at the inception of the lease. The arrangement is, or contains, a lease if fulfilment of the arrangement is dependent on the use of a specific asset (or assets) and the arrangement conveys a right to use the asset (or assets), even if that asset is (or those assets are) not explicitly specified in an arrangement.
Group as a lesseeA lease is classified at the inception date as a finance lease or an operating lease. A lease that transfers substantially all the risks and rewards incidental to ownership to the Group is classified as a finance lease.
An operating lease is a lease other than a finance lease. Operating lease payments are recognised as an operating expense in the statement of profit or loss on a straight-line basis over the lease term.
Dividend distribution to shareholdersThe Group recognises a liability to make distributions to equity holders of the parent when the distribution is authorised and the distribution is no longer at the discretion of the Company. As per the corporate laws of Norway, a distribution is authorised when it is approved by the shareholders. A corresponding amount is recognised directly in equity.
Financial instruments A financial instrument is any contract that gives rise to a financial asset of one entity and a financial liability or equity instrument of another entity.
Classification of financial instrumentsThe Groups' financial instruments are grouped in the following categories:
- Fair value with changes in value through profit or loss (FVPL)- Amortised cost (AC)
48

Initial recognition and subsequent measurement
FVTPL: Financial derivatives that are not designated as hedging instruments are categorized as held for trading and initially measured at their fair value. Subsequent changes in the fair value are recognised in the profit or loss (financial income or expense).
Financial assets (AC): These assets are measured at the amount recognised at initial recognition minus principal repayments, plus or minus the cumulative amortisation of any difference between that initial amount and the maturity amount, and any loss allowance. Interest income is calculated using the effective interest method (EIR) and is recognised in profit and loss. Amortised cost is calculated by taking into account any discount or premium on acquisition and fees or costs that are an integral part of the EIR.
Financial liabilities (AC): These liabilities are measured at the amount recognised at initial recognition minus principal repayments, plus or minus the cumulative amortisation of any difference between that initial amount and the maturity amount. Interest income is calculated using the effective interest method (EIR) and is recognised in profit and loss. Amortised cost is calculated by taking into account any discount or premium on acquisition and fees or costs that are an integral part of the EIR.
Impairment of financial assetsUnder IFRS 9, financial assets valued at amortised cost are impaired based on the "Expected credit losses (ECL)" model. Expected credit losses are calculated by (a) identifying scenarios in which a loan or receivable defaults; (b) estimating the cash shortfall that would be incurred in each scenario if a default were to happen; (c) multiplying that loss by the probability of the default happening; and (d) summing the results of all such possible default events.
The Group recognised loss allowances for ECLs on financial assets measured at amortised cost. Furthermore, the Group measures loss allowances at an amount equal to lifetime ECLs for all financial assets.
Credit- impaired fianancial assetsAt each reporting date, the Group assesses whether financial assets carried at amortised cost are credit-impaired. A financial asset is credit-impaired when one or more events that have a detrimental impact on the estimated future cash flows of the financial assets have occured.
Evidence that a financial asses is credit-impaired includes the following observable data:
- significant financial difficulty of the customer; or- it is probable that the customer will enter bankruptcy or other financial reorganisation- the customer is unlikely to pay its credit obligations to the Group in full, without recourse by the Group to actions such as realising security (if any is held); or- the financial asset is more than 180 days past due.
Loss allowances for financial assets measured at amortised cost are deducted from the gross carrying amount of the assets.
Write offThe gross carrying amount of a financial asset is written off when the Group has no reasonable expectations of recovering a financial asset in its entirety or a portion thereof. The Group individually makes an assessment with respect to the timing and amount of write-off based on whether there is a reasonable expectation of recovery. The Group expects no significant recovery from the amount written off. However, financial assets that are written off could still be subject to enforcement activities in order to comply with the Group’s procedures for recovery of amounts due.
Derecognition of financial instrumentsA financial asset is derecognized when the rights to receive cash flows from the asset have expired; or the Group has transferred its rights to receive cash flows from the asset and either (i) the Group has transferred substantially all the risks and rewards relating to the instrument, or (ii) the Group has neither transferred nor retained substantially all the risks and rewards relating to the instrument, but has transferred control of the asset.
A financial liability is derecognised when the obligation under the liability is discharged, cancelled or expires. When an existing financial liability is replaced by another from the same lender on substantially different terms, or the terms of an existing liability are substantially modified, this is treated as derecognition of the original liability and recognition of a new liability. The difference in the respective carrying amounts is recognised in the income statement.
Offsetting of financial instrumentsFinancial assets and financial liabilities are offset and the net amount is reported in the consolidated statement of financial position if there is a currently enforceable legal right to offset the recognised amounts and there is an intention to settle on a net basis, to realise the assets and settle the liabilities simultaneously.
49

Derivative financial instruments and hedge accounting
The Group uses derivative financial instruments, such as forward currency contracts, to hedge its foreign currency risks. Such derivative financial instruments are initially recognised at fair value on the date on which a derivative contract is entered into and are subsequently remeasured at fair value. Derivatives are carried as financial assets when the fair value is positive and as financial liabilities when the fair value is negative. Any gains or losses arising from changes in the fair value of currency derivatives are recognised in the statement of comprehensive income as financial income or financial expense. The Group does not apply hedge accounting related to its forward currency contracts.
Hedge of net investment in foreign operationsThe Group aims to hedge its net investments in foreign subsidiaries due to the risk of fluctuations in exchange rates. The net investments consist of equity and some group internal loans. The Group uses its overdraft facilities and long term debt in foreign currency as hedging instrument to hedge its exposure. Gains or losses on the hedging instrument relating to the effective portion of the hedge are recognised as OCI while any gains or losses relating to the ineffective portion are recognised in the statement of profit or loss. On disposal of the foreign operation, the cumulative value of any such gains or losses recorded in equity is transferred to the statement of profit or loss. Reference is made to note 5.1 and 5.5 for more details.
At the inception of a hedge relationship, the Group formally designates and documents the hedge relationship to which it wishes to apply hedge accounting and the risk management objective and strategy for undertaking the hedge. The documentation includes identification of the hedging instrument, the hedged item or transaction, the nature of the risk being hedged and how the entity will assess the effectiveness of changes in the hedging instrument’s fair value in offsetting the exposure to changes in the hedged item’s fair value or cash flows attributable to the hedged risk. Such hedges are expected to be highly effective in achieving offsetting changes in fair value or cash flows and are assessed on an ongoing basis to determine that they actually have been highly effective throughout the financial reporting periods for which they were designated.
Cash and short-term depositsCash and short-term deposits in the statement of financial position comprise cash at banks and on hand and short-term deposits with an original maturity of three months or less, which are subject to an insignificant risk of changes in value. For the purpose of the consolidated statement of cash flows, cash and cash equivalents consist of cash and short-term deposits, as defined above, net of outstanding bank overdrafts as they are considered an integral part of the Group’s cash management.
Fair value measurementThe Group measures financial instruments such as derivatives at fair value at each balance sheet date. Fair value is the price that would be received to sell an asset or paid to transfer a liability in an orderly transaction between market participants at the measurement date. The fair value measurement is based on the presumption that the transaction to sell the asset or transfer the liability takes place either:
• In the principal market for the asset or liability, or• In the absence of a principal market, in the most advantageous market for the asset or liability
The principal or the most advantageous market must be accessible by the Group.
The fair value of an asset or a liability is measured using the assumptions that market participants would use when pricing the asset or liability, assuming that market participants act in their economic best interest. A fair value measurement of a non-financial asset takes into account a market participant's ability to generate economic benefits by using the asset in its highest and best use or by selling it to another market participant that would use the asset in its highest and best use.
The Group uses valuation techniques that are appropriate in the circumstances and for which sufficient data are available to measure fair value, maximising the use of relevant observable inputs and minimising the use of unobservable inputs.
All assets and liabilities for which fair value is measured or disclosed in the financial statements are categorised within the fair value hierarchy, described as follows, based on the lowest level input that is significant to the fair value measurement as a whole:
• Level 1 — Quoted (unadjusted) market prices in active markets for identical assets or liabilities• Level 2 — Valuation techniques for which the lowest level input that is significant to the fair value measurement is directly or
indirectly observable• Level 3 — Valuation techniques for which the lowest level input that is significant to the fair value measurement is unobservable
External valuers are involved for valuation of derivate financial instruments. Involvement of external valuers is decided upon annually. For the purpose of fair value disclosures, the Group has determined classes of assets and liabilities based on the nature, characteristics and risks of the asset or liability and the level of the fair value hierarchy, as explained above.
Fair-value related disclosures for financial instruments and non-financial assets that are measured at fair value or where fair values are disclosed are summarised in note 5.3 Fair value measurement.
50

Deferred tax assets and liabilities are measured at the tax rates that are expected to apply in the year when the asset is realised or the liability is settled, based on tax rates (and tax laws) that have been enacted or substantively enacted at the reporting date.
Deferred tax relating to items recognised outside profit or loss is recognised outside profit or loss. Deferred tax items are recognised in correlation to the underlying transaction either in OCI or directly in equity. Deferred tax assets and deferred tax liabilities are offset if a legally enforceable right exists to set off current tax assets against current tax liabilities and the deferred taxes relate to the same taxable entity and the same taxation authority.
Pensions and other post-employment benefitsRemeasurements, comprising of actuarial gains and losses, are recognised immediately in the statement of financial position with a corresponding debit or credit to retained earnings through OCI in the period in which they occur. Remeasurements are not reclassified to profit or loss in subsequent periods.
Consolidated statements of cash flowThe consolidated statements of cash flows are prepared using the indirect method. Cash flows in foreign currencies have been translated into NOK using the exchange rate at the cash flow date.
TaxesCurrent income taxCurrent income tax assets and liabilities are measured at the amount expected to be recovered from or paid to the taxation authorities. The tax rates and tax laws used to compute the amount are those that are enacted or substantively enacted at the reporting date in the countries where the Group operates and generates taxable income.
Current income tax relating to items recognised directly in equity is recognised in equity (OCI) and not in the statement of profit or loss.
Deferred taxDeferred tax is provided using the liability method on temporary differences between the tax bases of assets and liabilities and their carrying amounts for financial reporting purposes at the reporting date. Deferred tax liabilities are recognised for all taxable temporary differences, except:
• When the deferred tax liability arises from the initial recognition of goodwill or an asset or liability in a transaction that is not abusiness combination and, at the time of the transaction, affects neither the accounting profit nor taxable profit or loss
• In respect of taxable temporary differences associated with investments in subsidiaries, associates and interests in joint arrangements, when the timing of the reversal of the temporary differences can be controlled and it is probable that the temporary differences will not reverse in the foreseeable future
Deferred tax assets are recognised for all deductible temporary differences, the carry forward of unused tax credits and any unused tax losses. Deferred tax assets are recognised to the extent that it is probable that taxable profit will be available against which the deductible temporary differences, and the carry forward of unused tax credits and unused tax losses can be utilised, except:
• When the deferred tax asset relating to the deductible temporary difference arises from the initial recognition of an asset or liability in a transaction that is not a business combination and, at the time of the transaction, affects neither the accounting profit nor taxable profit or loss
• In respect of deductible temporary differences associated with investments in subsidiaries, associates and interests in joint arrangements, deferred tax assets are recognised only to the extent that it is probable that the temporary differences will reversein the foreseeable future and taxable profit will be available against which the temporary differences can be utilised
The carrying amount of deferred tax assets is reviewed at each reporting date and reduced to the extent that it is no longer probable that sufficient taxable profit will be available to allow all or part of the deferred tax asset to be utilised. Unrecognised deferred tax assets are re-assessed at each reporting date and are recognised to the extent that it has become probable that future taxable profits will allow the deferred tax asset to be recovered.
51

10.2 Changes in accounting policies
The future consolidated financial statements will be affected by new and amended IFRS standards and iterpretations which have been published but are not effective as of 31 December 2018. The effect of new and amended IFRS standards and interpertations which may have a significant impact on the Group have been summarized below:
IFRS 16 Leases (effective for annual periods beginning on or after 1 January 2019).
IFRS 16 replaces existing IFRS leases requirements, IAS 17. IFRS 16 sets out the principles for the recognition, measurement, presentation and disclosure of leases for both parties to a contract, i.e. the customer (‘lessee’) and the supplier (‘lessor’). The new leases standard requires lessees to recognise assets and liabilities for all leases unless the lease term is 12 months or less, or the underlying assets has a low values.
The Group will adopt the standard on January 1, 2019 by using the modified retrospective method. Glamox has elected to use the two exemptions for leases with lease term of 12 months or less and the underlying asset has a low value (USD 5.000).
The Group has performed an assessment of the impact on its consolidated financial statements. The impact of IFRS 16 is a recognition of a lease liability of approximately NOK 128 million, and a corresponding right of use asset of approximately NOK 128 million. In addition the presentation of expenses related to those leases will now change as IFRS 16 replaces the ordinary operating lease expense with a depreciation charge, and interest expense on lease liabilities.
The implementation of IFRS 16 does not affect the covenants calculations, as the loan agreement only take into account existing IFRS standards at the time of entering the loan agreement.
The Group does not intend to apply the practical expedient in IFRS 16.15 which allows lessees to combine non-lease and lease components in lease arrangements and account for the total arrangement as a lease. As such, non-lease components will be identified and accounted for separately from the lease components in all arrangements.
Options should be taken into account if management is reasonable certain to exercise the option. All options in the future are assessed by management to not be reasonable certain for exercise as of 1 January 2019. For the vast majority of the options the exercise date of an option term is many years down the line. As such, management has limited insight and they are not reasonable certain to exercise and no options has been included in the lease term.
The Group applied its incremental borrowing rate at the time of initial application. The Group has assessed the general guidance on portfolio accounting and the practical expedient upon transition as discussed above. The Group has decided that we will not utilize the portfolio approach, and instead we will determine separate discount rate for each lease.
The group have used interest rates from the cash pool faciliity and intercompany loans for determining the incremental borrowing rate for each subsidiary. The length of the agreement is an additional element that has been taken into consideration when calculating the IBR for a specific lease.
This note explains the impact of the adoption of IFRS 9 Financial Instruments and IFRS 15 Revenue from Contracts with Customers on the group´s financial statements.
IFRS 9 Financial InstrumentsThe group has adopted IFRS 9 Financial Instruments from 1 January 2018. The new standard sets out requirements for classification and measurement, impairment and hedge accounting. The standard replaces IAS 39 Financial Instruments: Recognition and Measurement. Financial assets shall be classified and subsequently measured at amortised cost, fair value through profit or loss or fair value through other comprehensive income, based on both the use of the assets within the entity's business model and the nature of the cash flows. A financial asset is derecognised when expired or when the entity no longer has control of the cash flows related to the assets. Financial liabilities are classified and subsequently measured at amortised cost, except for financial liabilities (including derivatives) which are classified at fair value.
The adoption of the new standard have not impacted the financial statement significantly.
IFRS 15 Revenue from Contracts with customersThe group has adopted IFRS 15 Revenue from Contracts with Customers from 1 January 2018. The group has adopted the new rules retrospectively with the cumulative effect of initially applying the standard recognized directly to equity at the implementation.
The adoption of the new standard did not result in any adjustments to the amounts recognized in the financial statement.
10.3 Standards issued but not yet effective
52

GLX Holding ASAnnual financial statements
2018
53

GLX Holding AS
Statement of profit and loss
For the years ended 31 December
NOK 1000 Notes 31.12.2018 14.08 - 31.12.2017RevenueOther operating income
Total revenues - - Raw materials and consumables usedPayroll and related costsDepreciation and amortisationOther operating expenses 1 5 447 48 871 Total operating expenses 5 447 48 871
Operating profit -5 447 -48 871 Net Financial income 8 -94 867 -4 417
Profit before tax -100 314 -53 288 Taxes 9 - -
Profit for the year -100 314 -53 288
Other comprehensive income
Profit for the year -100 314 -53 288
Other comprehensive income for the period - -
Total comprehensive income for the period -100 314 -53 288
54

GLX Holding AS
Statement of financial position
NOK 1000 Notes 31.12.2018 31.12.2017ASSETS
Shares in Subsidiary 11 2 735 329 2 791 809 Total non-current assets 2 735 329 2 791 809
Current assetsCash and cash equivalents 7 52 792 136 631
Total current assets 52 792 136 631TOTAL ASSETS 2 788 121 2 928 440
EQUITY AND LIABILITIESEquity
Share capital 6 1 000 1 000 Share premium 6 1 599 346 1 599 346 Retained earnings 6 -153 602 -53 288
Total equity 1 446 744 1 547 058
Non-current liabilitiesInterest bearing liabilities 3/4/5 1 331 871 1 328 215
Total non-current liabilities 1 331 871 1 328 215
Current liabilitiesOther short term liabilities 2 9 506 53 167
Total current liabilities 9 506 53 167
Total liabilities 1 341 377 1 381 382 TOTAL EQUITY AND LIABILITIES 2 788 121 2 928 440
Oslo, 29 April 2019
Gustaf Erik David BackemarChairman of the Board
Carl Johan Jörgen Ulf RenvallBoard member
Joachim Solbakken EspenBoard member
55

GLX Holding AS
Statement of cash flows For the years ended 31 DecemberCash flows from operating activities Notes 31.12.2018 14.08 - 31.12.2017
Profit before tax -100 314 -53 288 Net financial items 90 061 - Changes in other balance sheet items -40 005 53 167
Net cash flows from operating activities -50 259 -120
Cash flows from investing activitiesPurchase of shares in subsidiaries 11 -36 878 -2 791 809 Dividend received 93 358 -
Net cash flow from investing activities 56 480 -2 791 809
Cash flow from financing activitiesProceeds from issuance of debt 3 - 1 328 215 Interests paid 8 -90 061 - Proceeds from issuance of equity - 1 600 306 Payment of dividends to shareholders - -
Net cash flow from financing activities -90 061 2 928 521
Net change in cash and cash equivalents -83 839 136 591Cash and cash equivalents, beginning of period 136 631 40Cash and cash equivalents, end of period 52 792 136 631
Statement of changes in equity
NOK 1000 Share capital Share premium Retained earnings Total equity
Balance as of 14 August 2017 30 10 40
Profit (loss) for the year -53 288 -53 288
Other comprehensive incomeTotal comprehensive income -53 288 -53 288
Issue of equity 970 1 599 336 1 600 306 DividendsBalance as of 31 December 2017 1 000 1 599 346 -53 288 1 547 058 Profit (loss) for the year -100 314 -100 314 Other comprehensive income 0Total comprehensive income -100 314 -100 314 Issue of equity - DividendsBalance as of 31 December 2018 1 000 1 599 346 -153 602 1 446 744
56

Note 1 - Other operating expenses
Other operating expenses 2018 2017Consultancy 3 514 39 263 Legal 1 081 8 905 Audit 431 - Travel 315 606 Other 106 97 Total other operating expenses 5 447 48 871
Auditor 2018 2017Fee for statutory audit 275 - Audit-related fees 610 - Tax compliance services - - Other fees - - Total 885 0
Note 2 - Other short term liabilities
Balance 31.12.2018 Balance 31.12.2017
48 871Accrued interest cost 5 452 4 296Other accrued cost 4 054 - Total other short term liabilities 9 506 53 167
Note 3 - Interest bearing liabilities
Non-current Interest bearing loans and borrowings Interest rate Maturity 31.12.2018 31.12.2017Callable Open Bond NIBOR + margin 2023 1 350 000 1 350 000 Bank fee related to the bond issue -18 129 -21 785 Total non-current interest bearing loans and borrowings 1 331 871 1 328 215
31.12.2018
Callable Open Bond* 93 420 186 840 1 536 840 1 817 100Totals 93 420 186 840 1 536 840 1 817 100
31.12.2017
Callable Open Bond* 81 405 162 810 1 594 215 1 838 430
Totals 81 405 162 810 1 594 215 1 838 430
* figures include estimated interest payable.
Accrued transaction cost related to the acquisition of Glamox
Less than 12 months 1 to 3 years Over 3 years Total
Less than 12 months 1 to 3 years Over 3 years Total
AuditorIn 2017, the accounts of GLX Holding AS had not been charged with audit fee.
Bond GLX Holding AS issued a Bond on the 8 December 2017. The initial issued amount is NOK 1.350 million and the maximum issued amount of the bond is NOK 2.000 million. The initial nominal amount on each bond is NOK 500.000. The bond has an interest margin of 5,25%. The interest period is 8 March, 8 June, 8 September and 8 December. The maturity date is 08.12.2023. The Outstanding Bonds will mature in full on the Maturity Date and shall be redeemed by the Issuer on the Maturity Date at a price equal to 100 per cent. of the Nominal Amount. The Bond has a Call Option that may be exercised by the Issuer by written notice to the Bond Trustee and the Bondholders at least 10 Business Days prior to the proposed Call Option Repayment Date for the call.
An arrangement fee of NOK 18,1 millions related to the refinancing, is booked against the bond. Face value of the bond is NOK 1.350 million, while the book value is 1.331,9 million. The difference between face value of the bond and book value is due to the arrangement fee. The arrangement fee is expensed over the availability period of the facility.
Callable Open Bond - Covenant requirement: Financial covenants requirement for the bond is Net interest bearing debt (NIBD)/ EBITDA (Last Twelve Monts) less than 4.5.
Bond - assets pledged as securityThe shares in both GLX Holding AS and Glamox AS is pledged as security for the Bond.
Note 4 - Aging of financial liabilities
57
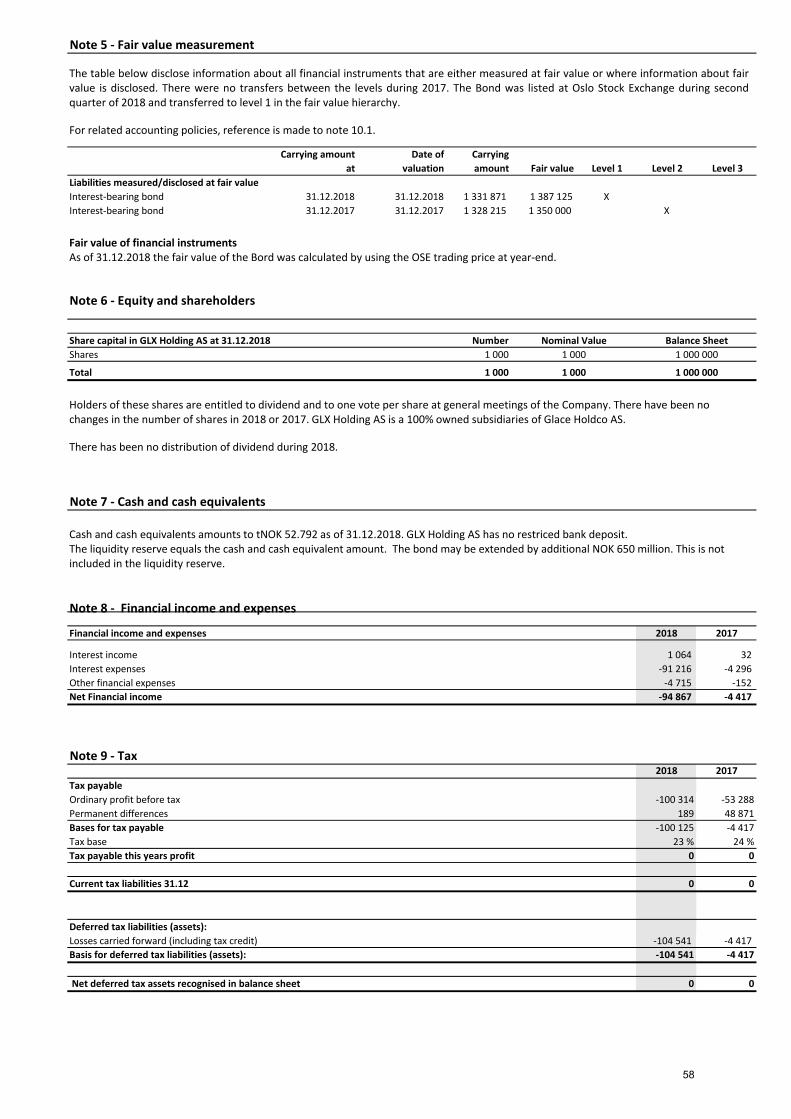
Note 5 - Fair value measurement
Carrying amount at
Date of valuation
Carrying amount Fair value Level 1 Level 2 Level 3
Liabilities measured/disclosed at fair valueInterest-bearing bond 31.12.2018 31.12.2018 1 331 871 1 387 125 XInterest-bearing bond 31.12.2017 31.12.2017 1 328 215 1 350 000 X
Share capital in GLX Holding AS at 31.12.2018 NumberShares 1 000
Total 1 000
Note 7 - Cash and cash equivalents
Financial income and expenses 2018 2017
Interest income 1 064 32 Interest expenses -91 216 -4 296 Other financial expenses -4 715 -152 Net Financial income -94 867 -4 417
Note 9 - Tax2018 2017
Tax payableOrdinary profit before tax -100 314 -53 288Permanent differences 189 48 871Bases for tax payable -100 125 -4 417Tax base 23 % 24 %Tax payable this years profit 0 0
Current tax liabilities 31.12 0 0
Deferred tax liabilities (assets):Losses carried forward (including tax credit) -104 541 -4 417 Basis for deferred tax liabilities (assets): -104 541 -4 417
Net deferred tax assets recognised in balance sheet 0 0
Nominal Value Balance Sheet1 000 1 000 000
1 000 1 000 000
The table below disclose information about all financial instruments that are either measured at fair value or where information about fair value is disclosed. There were no transfers between the levels during 2017. The Bond was listed at Oslo Stock Exchange during second quarter of 2018 and transferred to level 1 in the fair value hierarchy.
For related accounting policies, reference is made to note 10.1.
Fair value of financial instrumentsAs of 31.12.2018 the fair value of the Bord was calculated by using the OSE trading price at year-end.
Note 6 - Equity and shareholders
Holders of these shares are entitled to dividend and to one vote per share at general meetings of the Company. There have been no changes in the number of shares in 2018 or 2017. GLX Holding AS is a 100% owned subsidiaries of Glace Holdco AS.
There has been no distribution of dividend during 2018.
Cash and cash equivalents amounts to tNOK 52.792 as of 31.12.2018. GLX Holding AS has no restriced bank deposit. The liquidity reserve equals the cash and cash equivalent amount. The bond may be extended by additional NOK 650 million. This is not included in the liquidity reserve.
Note 8 - Financial income and expenses
58

Note 10 - Management remuneration
Note 11 - Interest in subsidiaries
Note 12 - Events after the reporting period
GLX Holding AS has no employees.
There has been no remuneration to board members during 2018 or 2017.
GLX Holding AS acquired 75,16% of the shares in Glamox AS from Arendal Fossekompani ASA on the 11 December 2017. In 2018, GLX Holding has increased their ownership in Glamox AS to 76,16 %.
Glamox AS is a leading lighting supplier to the world's marine and offshore markets, and a significant supplier to the professional building market in Europe. Glamox AS is the parent company of Glamox Group. Glamox AS registered adress is Birger Hatlebaks veg 15 in Molde, Norway. Glamox AS has 23 subsidiaries located in Europe, Asia and America. Total revenue of Glamox Group in 2018 is NOK 2.772,7 million (2017: NOK 2.614,5 million). Operating profit in 2018 is NOK 273,1 million (2017: NOK 292,7 million). For 2018 the Glamox Group has had average number of full time employee of 1.344 (2017: 1300).
As of 31.12.2018 GLX Holding AS owns 76,16% of the shares in Glamox AS, which also represents the voting share.
The book value of the Glamox shares is tNOK 2.735.329 as of 31.12.2018. The total Share capital in Glamox AS is tNOK 65.989 as of 31.12.2018.
DividendsAfter the reporting date, the board of Glamox AS has proposed a dividend distribution amounting to NOK 141,1 million. GLX Holding AS will receive NOK 107,4 million of this distribution.
Other than this there have been no significant events subsequent to the reporting date.
13 Related party transactions
Related parties are Group companies, major shareholders, board and senior management in the parent company and the group subsidiaries. Note 11 provides information about the Group’s subsidiary.
All transactions within the Group or with other related parties are based on the principle of arm's length.
The company has agreements with Triton Advisers Limited and Triton Investment Management Limited for counseling and success fee related to the acquisition of businesses respectively. Expenses during 2018 were NOK 3,8 million (2017: 41,5 million).
59

Note 14 - Significant accounting policies
GLX Holding AS is a company incorporated and domiciled in Norway. GLX Holding AS was established in 2017, with the purpose to own shares in Glamox AS. Kronprinsesse Märthas plass 1, 0161 OSLO. The parent company is Glace HoldCo AS. The ultimate parent of GLX Holding AS is Triton Fund IV, which is located at Jersey.
The financial statements of the company comprise of statements of profit and loss, other comprehensive income, financial position, cash flows, changes in equity, and related notes. The financial statements have been prepared in accordance with International Financial Reporting Standards (IFRS) as adopted by The European Union (EU). The financial statements have been prepared on a historical cost basis, and the financial statements are prepared based on the going concern assumption.
Subsidiaries in parent company‘Subsidiaries’ refers to companies in which GLX Holding normally has a shareholding of more than 50%, and in which the company has a controlling interest. Investments in subsidiaries are accounted for using the cost method. The investments are valued at cost less impairment losses. Investments in subsidiaries are reviewed for impairment whenever events or changes in circumstances indicate that the carrying amount may exceed the fair value of investment"
Current versus non-current classificationThe Company presents assets and liabilities in the statement of financial position based on current/non-current classification. An asset is current when it is:
• Expected to be realised or intended to be sold or consumed in the normal operating cycle,• Held primarily for the purpose of trading,• Expected to be realised within twelve months after the reporting period, or• Cash or cash equivalent unless restricted from being exchanged or used to settle a liability for at least twelve months after the
reporting period
All other assets are classified as non-current. A liability is current when:
• It is expected to be settled in the normal operating cycle, • It is held primarily for the purpose of trading, • It is due to be settled within twelve months after the reporting period, or• There is no unconditional right to defer the settlement of the liability for at least twelve months after the reporting period
ProvisionsProvisions are recognised when the Group has a present obligation (legal or constructive) as a result of a past event, it is probable that an outflow of resources embodying economic benefits will be required to settle the obligation and a reliable estimate can be made of the amount of the obligation.
Dividend distribution to shareholdersGLX Holding AS recognises a liability to make distributions to equity holders when the distribution is authorised and the distribution is no longer at the discretion of the Company. As per the corporate laws of Norway, a distribution is authorised when it is approved by the shareholders. A corresponding amount is recognised directly in equity.
Financial instruments A financial instrument is any contract that gives rise to a financial asset of one entity and a financial liability or equity instrument of another entity.
Classification of financial instrumentsThe Company`s financial instruments are grouped in the following categories:
- Fair value with changes in value through profit or loss (FVPL)- Amortised cost (AC)
The classification is dependent on the type of instrument and the purpose for which the investments were acquired or originated.
Fair value through profit or loss is the classification of instruments that are held for trading or for which the entity`s business model is to manage the financial assets on a fair value basis i.e. to realise the asset through sales as opposed to holding the asset to collect contractual cash flows.
Amortised cost applied to instruments for which an entity has a business model to hold the financial asset to collect the contractual cash flows. The characteristics of the contractual cash flows are that of solely payments of the principal amount and interest.
60

- In the principal market for the asset or liability, or- In the absence of a principal market, in the most advantageous market for the asset or liability
The principal or the most advantageous market must be accessible by the Company.
The fair value of an asset or a liability is measured using the assumptions that market participants would use when pricing the asset or liability, assuming that market participants act in their economic best interest. A fair value measurement of a non-financial asset takes into account a market participant's ability to generate economic benefits by using the asset in its highest and best use or by selling it to another market participant that would use the asset in its highest and best use.
The Company uses valuation techniques that are appropriate in the circumstances and for which sufficient data are available to measure fair value, maximising the use of relevant observable inputs and minimising the use of unobservable inputs.
All assets and liabilities for which fair value is measured or disclosed in the financial statements are categorised within the fair value hierarchy, described as follows, based on the lowest level input that is significant to the fair value measurement as a whole:Level 1 — Quoted (unadjusted) market prices in active markets for identical assets or liabilitiesLevel 2 — Valuation techniques for which the lowest level input that is significant to the fair value measurement is directly or indirectly observable Level 3 — Valuation techniques for which the lowest level input that is significant to the fair value measurement is unobservable
External valuers are involved for valuation of derivate financial instruments. Involvement of external valuers is decided upon annually. For the purpose of fair value disclosures, the Company has determined classes of assets and liabilities based on the nature, characteristics and risks of the asset or liability and the level of the fair value hierarchy, as explained above.
Fair-value related disclosures for financial instruments and non-financial assets that are measured at fair value or where fair values are disclosed are summarised in note 5 Fair value measurement.
Financial assets and liabilities measured at amortised cost is the category most relevant to the company. This category generally applies to interest-bearing loans and other financial liabilities. The company has the following financial instruments: Financial liabilities (AC): Includes the company`s other non-current interest bearing liabilities (notes: 3,4 and 5) and current non- financial liabilities (notes: 2).
Initial recognition and subsequent measurement Financial liabilities (AC): These liabilities are measured at the amount recognised at initial recognition minus principal repayments, plus or minus the cumulative amortisation of any difference between that initial amount and the maturity amount. Interest income is calculated using the effective interest method (EIR) and is recognised in profit and loss. Amortised cost is calculated by taking into account any discount or premium on acquisition and fees or costs that are an integral part of the EIR.
Derecognition of financial instrumentsA financial liability is derecognised when the obligation under the liability is discharged, cancelled or expires. When an existing financial liability is replaced by another from the same lender on substantially different terms, or the terms of an existing liability are substantially modified, this is treated as derecognition of the original liability and recognition of a new liability. The difference in the respective carrying amounts is recognised in the income statement. Cash and short-term depositsCash and short-term deposits in the statement of financial position comprise cash at banks and on hand and short-term deposits with an original maturity of three months or less, which are subject to an insignificant risk of changes in value.
Fair value measurementThe Company measures financial instruments such as derivatives at fair value at each balance sheet date. Fair value is the price that would be received to sell an asset or paid to transfer a liability in an orderly transaction between market participants at the measurement date. The fair value measurement is based on the presumption that the transaction to sell the asset or transfer the liability takes place either:
61

Note 15 - Changes in accounting policies
IFRS 16 Leases (effective for annual periods beginning on or after 1 January 2019).
This new standard will not effect GLX Holding AS per 01.01.2019, as the company has not entered into any leasing contracts.
This note explains the impact of the adoption of IFRS 9 Financial Instruments and IFRS 15 Revenue from Contracts with Customers on the company`s financial statements.
IFRS 9 Financial InstrumentsThe company has adopted IFRS 9 Financial Instruments from 1 January 2018. The new standard sets out requirements for classification and measurement, impairment and hedge accounting. The standard replaces IAS 39 Financial Instruments: Recognition and Measurement. Financial assets shall be classified and subsequently measured at amortised cost, fair value through profit or loss or fair value through other comprehensive income, based on both the use of the assets within the entity's business model and the nature of the cash flows. A financial asset is derecognised when expired or when the entity no longer has control of the cash flows related to the assets. Financial liabilities are classified and subsequently measured at amortised cost, except for financial liabilities (including derivatives) which are classified at fair value.
The adoption of the new standard has not any significant effects on the financial statement.
IFRS 15 Revenue from Contracts with customersGLX Holding AS has no revenues arising from contracts with customers, so this new standard will not effect GLX Holding AS.
Note 16 - Standards issued but not yet effective
TaxesCurrent income taxCurrent income tax assets and liabilities are measured at the amount expected to be recovered from or paid to the taxation authorities. Current income tax relating to items recognised directly in equity is recognised in equity (OCI) and not in the statement of profit or loss.
Deferred taxDeferred tax is provided using the liability method on temporary differences between the tax bases of assets and liabilities and their carrying amounts for financial reporting purposes at the reporting date. Deferred tax liabilities are recognised for all taxable temporary differences.
Deferred tax assets are recognised for all deductible temporary differences, the carry forward of unused tax credits and any unused tax losses. Deferred tax assets are recognised to the extent that it is probable that taxable profit will be available against which the deductible temporary differences, and the carry forward of unused tax credits and unused tax losses can be utilised.
The carrying amount of deferred tax assets is reviewed at each reporting date and reduced to the extent that it is no longer probable that sufficient taxable profit will be available to allow all or part of the deferred tax asset to be utilised. Unrecognised deferred tax assets are re-assessed at each reporting date and are recognised to the extent that it has become probable that future taxable profits will allow the deferred tax asset to be recovered.
Deferred tax assets and liabilities are measured at the tax rates that are expected to apply in the year when the asset is realised or the liability is settled, based on tax rates (and tax laws) that have been enacted or substantively enacted at the reporting date.
Statements of cash flowThe consolidated statements of cash flows are prepared using the indirect method.
62
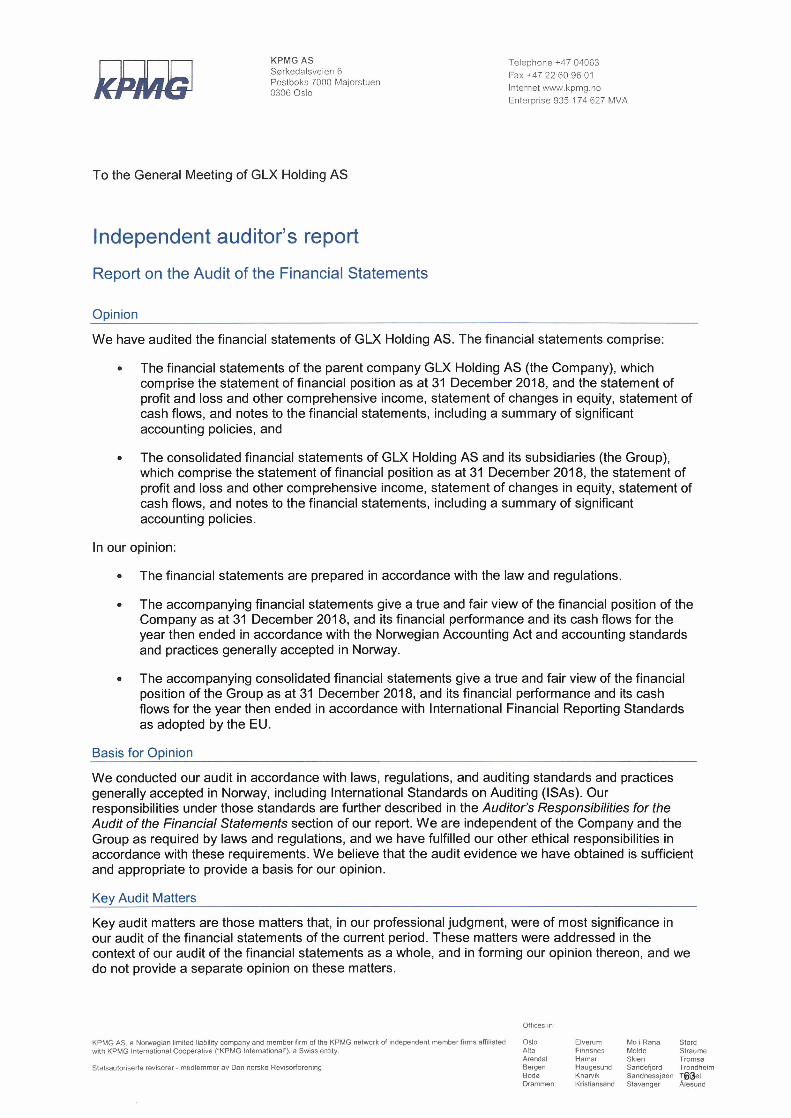
63

64

65

66

67