Gluten-Free Beer via Hydrodynamic Cavitation … hydrodynamic cavitation greatly reduces gluten...
30
Gluten-Free Beer via Hydrodynamic Cavitation Assisted Brewing of Barley Malts Lorenzo Albanese, 1 Rosaria Ciriminna, 2 Francesco Meneguzzo, 1* Mario Pagliaro 2* 1 Istituto di Biometeorologia, CNR, via G. Caproni 8, 50145 Firenze, Italy; 2 Istituto per lo Studio dei Materiali Nanostrutturati, CNR, via U. La Malfa 153, 90146 Palermo, Italy Abstract We provide evidence that novel brewing technology based on controlled hydrodynamic cavitation greatly reduces gluten concentration in wort and finished beer. We advance the hypothesis that the degradation of proline, the most recalcitrant among gluten constituents, leads to gluten concentration reduction in the unfermented as well as in the fermenting wort and later during maturation. These findings are significant as the new cavitation- assisted technology could provide coeliac patients and gluten- intolerant people with gluten-free beer of high quality, offering an alternative to existing methods to lower the gluten concentration, which are detrimental to flavor and taste. Keywords: beer; brewing; gluten-free; hydrodynamic cavitation; proline. *Corresponding Authors Dr. F. Meneguzzo Istituto di Biometeorologia, CNR via G. Caproni 8 50145 Firenze FI (Italy) E-mail: [email protected] Dr. M. Pagliaro, Istituto per lo Studio dei Materiali Nanostrutturati, CNR via U. La Malfa 153 90146 Palermo PA (Italy) E-mail: [email protected] . CC-BY-NC-ND 4.0 International license not peer-reviewed) is the author/funder. It is made available under a The copyright holder for this preprint (which was . http://dx.doi.org/10.1101/089482 doi: bioRxiv preprint first posted online Nov. 25, 2016;
Transcript of Gluten-Free Beer via Hydrodynamic Cavitation … hydrodynamic cavitation greatly reduces gluten...
Gluten-Free Beer via Hydrodynamic Cavitation Assisted Brewing of Barley Malts Lorenzo Albanese,1 Rosaria Ciriminna,2 Francesco Meneguzzo,1* Mario Pagliaro2* 1Istituto di Biometeorologia, CNR, via G. Caproni 8, 50145 Firenze, Italy; 2Istituto per lo Studio dei Materiali Nanostrutturati, CNR, via U. La Malfa 153, 90146 Palermo, Italy
Abstract We provide evidence that novel brewing technology based on controlled hydrodynamic cavitation greatly reduces gluten concentration in wort and finished beer. We advance the hypothesis that the degradation of proline, the most recalcitrant among gluten constituents, leads to gluten concentration reduction in the unfermented as well as in the fermenting wort and later during maturation. These findings are significant as the new cavitation-assisted technology could provide coeliac patients and gluten-intolerant people with gluten-free beer of high quality, offering an alternative to existing methods to lower the gluten concentration, which are detrimental to flavor and taste. Keywords: beer; brewing; gluten-free; hydrodynamic cavitation; proline. *Corresponding Authors Dr. F. Meneguzzo Istituto di Biometeorologia, CNR via G. Caproni 8 50145 Firenze FI (Italy) E-mail: [email protected] Dr. M. Pagliaro, Istituto per lo Studio dei Materiali Nanostrutturati, CNR via U. La Malfa 153 90146 Palermo PA (Italy) E-mail: [email protected]
.CC-BY-NC-ND 4.0 International licensenot peer-reviewed) is the author/funder. It is made available under aThe copyright holder for this preprint (which was. http://dx.doi.org/10.1101/089482doi: bioRxiv preprint first posted online Nov. 25, 2016;
2
1. Introduction
With nearly 200 billion liters per year (Amienyo & Azapagic, 2016), beer is the
alcoholic beverage most widely consumed around the world. Both its basic
ingredients, i.e. water, malt or grains, hops and yeasts, and production methods
have barely changed over centuries beyond obvious technological improvements
and minor ingredients diversification (Ambrosi, Cardozo, & Tessaro, 2014; Pires &
Brányik, 2015). Knowledge of the microbiological processes involved in brewing, on
the other hand, has steadily grown over the last decades (Bokulich & Bamforth,
2013).
An open and serious issue in today’s huge beer market is gluten, whose
presence in beer arises from barley and wheat malts and grains from which most
beers are produced, making beer unsuitable for consumption by coeliac disease
patients (Hager, Taylor, Waters, & Arendt, 2014). Production and marketing of
“very low gluten content” (concentration < 100 mg/L) or “gluten-free” (< 20 mg/L)
beers has been increasingly motivated by the growing awareness about coeliac
pathology and milder gluten intolerance.
Contrary to most inflammatory disorders, both genetic precursors and
exogenous environmental factors trigger the coeliac disease (Sollid, 2002), which
develops in susceptible patients because of their intolerance to ingested wheat
gluten or related proteins from rye and barley. In particular, the gluten epitopes
that are recognized by the immune system in the human intestine are generally
very rich in amino acids and gluten components proline and glutamine residues.
Most mammalian peptidases/proteases cannot hydrolyze amide bonds when they
are adjacent to proline residues.
Fermentation, usually lasting several days, is the most important brewing
step for the gluten reduction in traditional beers. It begins with the pitching of
yeasts in the quickly cooled and aerated wort, usually from the strain
Saccharomyces cerevisiae (Albanese, Ciriminna, Meneguzzo, & Pagliaro, 2015),
.CC-BY-NC-ND 4.0 International licensenot peer-reviewed) is the author/funder. It is made available under aThe copyright holder for this preprint (which was. http://dx.doi.org/10.1101/089482doi: bioRxiv preprint first posted online Nov. 25, 2016;
3
whit initial yeast concentration generally between 15 and 20 million cells per mL.
In today’s most used cylinder-conical, closed and thermostatically controlled
fermenters, early assimilation of fermentable sugars, amino acids, minerals and
other nutrients occurs along with metabolic production of ethanol, CO2, higher
alcohols, esters and other substances (Bokulich & Bamforth, 2013). Such
fermentation products, while often toxic to yeasts at high concentration, are
desirable for the quality of the certain beer styles as well contribute to their
aromatic bouquet (Pires & Brányik, 2015). Among them, several esters providing
characteristic beer aromas are synthesized via a biochemical pathway involving
ethanol and higher alcohols (Landaud, Latrille, & Corrieu, 2001).
Few attempts aimed at modeling the complex fermentation processes,
despite encouraging results (Albanese et al., 2015), are intrinsically limited by the
extreme dependency on few factors hardly generalizable such as yeast strain,
aeration and CO2 concentration occurring in the full beer brewing environment
(Brown & Hammond, 2003). In general, effective fermentation is particularly
relevant for the degradation of amino acids accumulated in the fermenting wort,
supplying nearly all the nitrogen needed by the yeasts’ cellular biosynthesis in the
form of free amino-nitrogen (FAN), as well as affecting bitterness, flavor and foam
stability (Choi, Ahn, Kim, Han, & Kim, 2015).
The most important FAN is glutamine – an amino acid and gluten
component – along with other amino acids belonging to the so called “Group A”
which undergo the fastest assimilation by yeast cells at a rate depending on the
specific yeast strain (Pires & Brányik, 2015). Once Group A amino acids are
assimilated, other ones belonging to Groups B and C are more gradually and slowly
assimilated until nitrogen-deprived residuals from original amino acids are turned
into higher (fusel) alcohols and esters, strongly impacting beers’ flavor. Only one
amino acid belongs to Group D, namely proline – another basic gluten component –
whose assimilation by yeast cells was deemed negligible until few years ago
.CC-BY-NC-ND 4.0 International licensenot peer-reviewed) is the author/funder. It is made available under aThe copyright holder for this preprint (which was. http://dx.doi.org/10.1101/089482doi: bioRxiv preprint first posted online Nov. 25, 2016;
4
(Lekkas, Stewart, Hill, Taidi, & Hodgson, 2005).
Most if not all production of gluten-free beers foresees the use of at least a
fraction of malts derived from cereals and pseudo-cereals not containing gluten or
its precursors, such as sorghum, buckwheat, quinoa, amaranth (Meo et al., 2011;
Wijngaard & Arendt, 2006), maize and oat (Yeo & Liu, 2014). However, the
respective brewing techniques for cereals different from barley are not yet well
established. Recently, encouraging results were achieved with rice malt brewing in
a pilot plant, affording an alcoholic product with a sensory profile similar to a
barley malt beer in aroma, taste and mouthfeel, though flatter and featuring
rapidly collapsing foam (Mayer et al., 2016).
In alternative, complex and costly filtration and enzymatic techniques are
used, to condition the malts in order to boost processes leading to the precipitation
of proteins, during mashing, fermentation and stabilization (Dostálek, Hochel,
Méndez, Hernando, & Gabrovská, 2006; Hager et al., 2014). Another alternative
technique consists in the use of silica gel (SG) in the fermentation stage of the
brewing process to selectively remove proteins without practically affecting both
valuable yeast nutrients such as free amino-nitrogen (FAN) and foam-causing
proteins, leading to gluten reduction in the subsequent stabilization stage (Benítez,
Acquisgrana, Peruchena, Sosa, & Lozano, 2016). Although silica is generally
recognized as a safe (GRAS) food additive both in US and Europe, its use adds to
cost and process complexity. Beyond uncertainties, complexity and costs, the
resulting finished beers most often have different aroma and flavor when compared
to conventional beers.
Now, we show the first evidence of the potential for brewing of conventional
barley malt assisted by controlled hydrodynamic cavitation (CHC) to reduce the
gluten concentration in beer by means of suitable cavitation regimes and
operational parameters, i.e. by purely electro-mechanical means, without either
changing ingredients or using additives as well as any other chemical or
.CC-BY-NC-ND 4.0 International licensenot peer-reviewed) is the author/funder. It is made available under aThe copyright holder for this preprint (which was. http://dx.doi.org/10.1101/089482doi: bioRxiv preprint first posted online Nov. 25, 2016;
5
biochemical solution. The CHC process, including the oxidation processes triggered
by hydrodynamic cavitation, is the one we recently developed and tested with a
real-scale experimental demonstration device, finding significant advantages
including i) dramatic reduction of saccharification temperature; ii) increased and
accelerated peak starch extraction; iii) significant reduction of operational time
eliminating traditional stages such as dry milling and boiling; iv) relevant energy
saving; v) shorter cleaning time; vi) volumetric heating which prevents
caramelization; and vii) overall simplification of both structural setup and
operational management of brewing processes (Albanese, Ciriminna, Meneguzzo, &
Pagliaro, 2016).
2. Materials and methods
2.1. Brewing units
Among controlled hydrodynamic cavitation devices in which hydrocavitation
regimes can be controlled and tuned so as to avoid damage to the equipment,
Venturi-type stationary reactors are the most appealing candidates for industrial-
scale applications due to their cheapness as well as intrinsic ease of construction,
scale-up, and reduced risk of obstruction from solid particles and other viscous
substances such as those found in brewing (Albanese et al., 2015). Hence, a
dedicated equipment was built from known or commonly available commercial
components, in order to investigate the effects of hydrodynamic cavitation
processes upon gluten concentration.
.CC-BY-NC-ND 4.0 International licensenot peer-reviewed) is the author/funder. It is made available under aThe copyright holder for this preprint (which was. http://dx.doi.org/10.1101/089482doi: bioRxiv preprint first posted online Nov. 25, 2016;
6
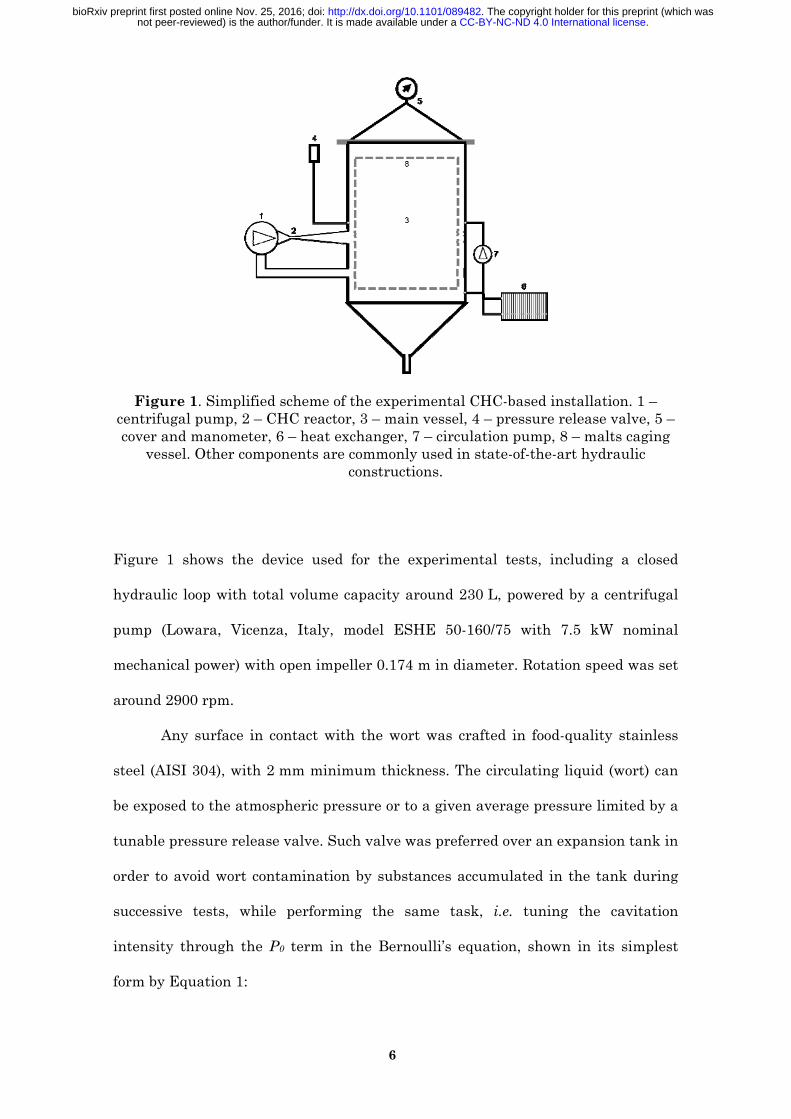
Figure 1. Simplified scheme of the experimental CHC-based installation. 1 – centrifugal pump, 2 – CHC reactor, 3 – main vessel, 4 – pressure release valve, 5 – cover and manometer, 6 – heat exchanger, 7 – circulation pump, 8 – malts caging
vessel. Other components are commonly used in state-of-the-art hydraulic constructions.
Figure 1 shows the device used for the experimental tests, including a closed
hydraulic loop with total volume capacity around 230 L, powered by a centrifugal
pump (Lowara, Vicenza, Italy, model ESHE 50-160/75 with 7.5 kW nominal
mechanical power) with open impeller 0.174 m in diameter. Rotation speed was set
around 2900 rpm.
Any surface in contact with the wort was crafted in food-quality stainless
steel (AISI 304), with 2 mm minimum thickness. The circulating liquid (wort) can
be exposed to the atmospheric pressure or to a given average pressure limited by a
tunable pressure release valve. Such valve was preferred over an expansion tank in
order to avoid wort contamination by substances accumulated in the tank during
successive tests, while performing the same task, i.e. tuning the cavitation
intensity through the P0 term in the Bernoulli’s equation, shown in its simplest
form by Equation 1:
.CC-BY-NC-ND 4.0 International licensenot peer-reviewed) is the author/funder. It is made available under aThe copyright holder for this preprint (which was. http://dx.doi.org/10.1101/089482doi: bioRxiv preprint first posted online Nov. 25, 2016;
7
σ = (P0-Pv) / (0.5⋅ρ⋅u2) (1)
where σ is the cavitation number (also indicated as CN), P0 (Nm-2) is the average
pressure downstream of a cavitation reactor such as a Venturi tube or an orifice
plate in which the cavitation bubbles collapse, Pv (Nm-2) is the liquid vapor
pressure (a function of the average temperature for any given liquid), ρ (kgm-3) is
the liquid density, and u (ms-1) is the flow velocity through the nozzle of the
cavitation reactor.
Different CHC regimes are practically achieved according to the values
assumed by the cavitation number in one of the three intervals, corresponding to
broad cavitational regimes, identified by Gogate (Bagal & Gogate, 2014; Gogate,
2002), ideally, without impurities and dissolved gases, cavities would be generated
for values of σ < 1. For σ < 0.1 values, the cavities are no longer able to collapse and
the CHC regime turns to chocked cavitation or supercavitation. For σ > 1, lesser
and lesser cavities are generated, while their collapse becomes ever more violent.
For the scope of this study, only the developed cavitation with 0.1<σ<1 will be
considered.
Volumetric liquid heating occurs during circulation due to the conversion of
impeller’s mechanical energy into thermal energy, particularly downstream the
cavitation reactor nested into the hydraulic loop, due to the vigorous internal
friction associated with the cavitation process. As a closed hydraulic circuit, no
change of potential energy is involved, therefore all the mechanical energy turns
into heat.
A Venturi tube, whose geometry was described in a previous study
(Albanese et al., 2015), was used as the cavitation reactor and preferred over an
orifice plate since orifices are quickly obstructed by the circulating solid particles.
Moreover, a smaller circulation pump (Rover pompe, Padova, Italy, model NOVAX
20 B, power 340 W, working temperature up to 95°C, capacity up to 28 L min-1),
.CC-BY-NC-ND 4.0 International licensenot peer-reviewed) is the author/funder. It is made available under aThe copyright holder for this preprint (which was. http://dx.doi.org/10.1101/089482doi: bioRxiv preprint first posted online Nov. 25, 2016;
8
drives a secondary recirculation loop through an ordinary plate heat exchanger (20
stainless steel plates, each with a 0.043 m2 surface area), allowing for isothermal
stages when required in the course of the brewing process, depending on specific
brewing recipes. The latter pump was used as well both to cool the wort after
brewing and to convey it to the fermenters. Onboard sensors included a manometer
and few digital thermometers (not shown), hydraulic pressure and temperature
being the main physical parameters monitored and actually used to manage the
brewing processes.
The installation was designed to perform the mashing and hopping stages of
brewing, while fermentation was generally performed in common 200 L stainless
steel cylinder-conical fermenters after receiving the wort from the main unit.
Though, a few tests were performed without wort removal, using the installation
shown in Figure 1 as the fermenter.
All but one of the tests designed to study the CHC effects upon the gluten
concentration were run in brew in the bag (BIAB) mode, thus using the malts
caging vessel in Figure 1. In one test, the vessel was absent and malts were
allowed circulating. Water, before being conveyed to the brewing unit, is passed
through a mechanical filter made up of a 20 μm polypropylene wire to remove solid
particles down to 50 μm in size. An active carbon filter reduces chlorine
concentration, attenuates odors and flavors, and removes other impurities down to
70 μm in size. The pH is usually lowered from about 7 to about 5.5 by adding 80
wt% lactic acid (70-80 mL). For the purpose of comparison, traditional brewing was
performed by means of a Braumeister (Ofterdingen, Germany) model 50 L brewer,
equipped with a cooling serpentine (model Speidel stainless steel wort chiller for
50-liter Braumeister) and fully automatic brewing control (temperature, time and
recirculation pumps). Finally, after fermentation, bottling was performed via an
ordinary depression pump (Tenco, Genova, Italy, model Enolmatic, with capacity
around 200 bottles per hour).
.CC-BY-NC-ND 4.0 International licensenot peer-reviewed) is the author/funder. It is made available under aThe copyright holder for this preprint (which was. http://dx.doi.org/10.1101/089482doi: bioRxiv preprint first posted online Nov. 25, 2016;
9
2.2. Analytical instruments and methods
Along with thermometer and manometer sensors onboard the main production
unit, few specialized off-line instruments were used to measure the chemical and
physiological properties of wort and beer. The acidity was measured by means of
pH-meter (Hanna Instruments, Padova, Italy, model HI 99151) with automatic pH
calibration and temperature compensation. The sugar concentration in the wort
during mashing and before fermentation was measured in Brix percentage degrees
by means of a refractometer (Hanna Instruments, Padova, Italy, model HI 96811,
scaled from 0% to 50% Brix, resolution 0.1%, precision ±0.2% in the 0-80°C
temperature range, and automatic temperature compensation in the 0-40°C range).
Brix readings were then converted to starch extraction efficiency (Bohačenko,
Chmelík, & Psota, 2006).
The specific sugar content of any used malt was multiplied by its mass in
the wort to produce the overall sugar content, which is in turn directly related to
the peak theoretical apparent specific gravity (ratio of the weight of a volume of the
substance to the weight of an equal volume of water) at 20°C according to widely
available data tables. The real specific gravity was computed from the Brix reading
(again at 20°C), with starch extraction efficiency represented by the ratio of the
latter to the peak theoretical apparent specific gravity.
Physico-chemical and physiological parameters of fermenting wort and
finished beer were measured by means of a 6-channel photometric device (CDR,
Firenze, Italy, model BeerLab Touch). Relevant to this study were fermentable
sugars (0.1 to 150 g/L of maltose, resolution 0.01 g/L), free amino-nitrogen, or FAN
(30 to 300 mg/L, resolution 1 mg/L), alcohol content (0-10% in volume, resolution
0.1%). All reagents were of analytical grade. The gluten concentration
measurement method was RIDASCREEN Gliadin competitive, i.e. the official
standard method for gluten determination according to the Codex Alimentarius
(Hager et al., 2014; Rallabhandi, Sharma, Pereira, & Williams, 2015). The results
.CC-BY-NC-ND 4.0 International licensenot peer-reviewed) is the author/funder. It is made available under aThe copyright holder for this preprint (which was. http://dx.doi.org/10.1101/089482doi: bioRxiv preprint first posted online Nov. 25, 2016;
10
were in units mg/L with an upper limit at 270 mg/L and the measurement
uncertainties, as declared by the accredited laboratory in charge of the analyses,
were equal to 6.7% for results above 150 mg/L, as low as 2.4% below such
threshold.
The microbiological measurement, i.e. the counting of the living yeast cells,
was performed according to the method explained in the Appendix to our previous
study (Albanese et al., 2015). Electricity consumption and power absorption by the
centrifugal pump were measured by means of a commercial digital power meter.
Once the water flow was set, its speed through the Venturi’s nozzle was computed
from straightforward division by its section, hence the cavitation number as per
Equation (1). Water density (103 kg/m3) was used throughout all calculations,
which may lead to a small underestimation of the CN (malt and starch are less
dense than water).
2.3. Brewing ingredients
Pilsner or Pale were used as the base barley malts in all experiments, along with
smaller fractions of Cara Pils, Cara Hell and Weizen. Among the hops, different
combinations of pelletized German Perle, Saaz and German Hersbrucker were
used. In the course of few tests, candied brown sugar was added to the wort before
fermentation, while regular white sugar was added to the fermented wort before
bottling and maturation, aimed at carbonation. Finally, fermentation was activated
by means of the dry yeast strain Safale US-05, requiring temperature between
15°C and 24°C and maximum alcohol content 9.2%, used in any test in the
identical proportion of 67 g per 100 L. As a relevant exception, test B2 was carried
out with 47 g of yeast, namely in the proportion of 94 g per 100 L (40% greater
than in other tests).
.CC-BY-NC-ND 4.0 International licensenot peer-reviewed) is the author/funder. It is made available under aThe copyright holder for this preprint (which was. http://dx.doi.org/10.1101/089482doi: bioRxiv preprint first posted online Nov. 25, 2016;
11
2.4. Production tests
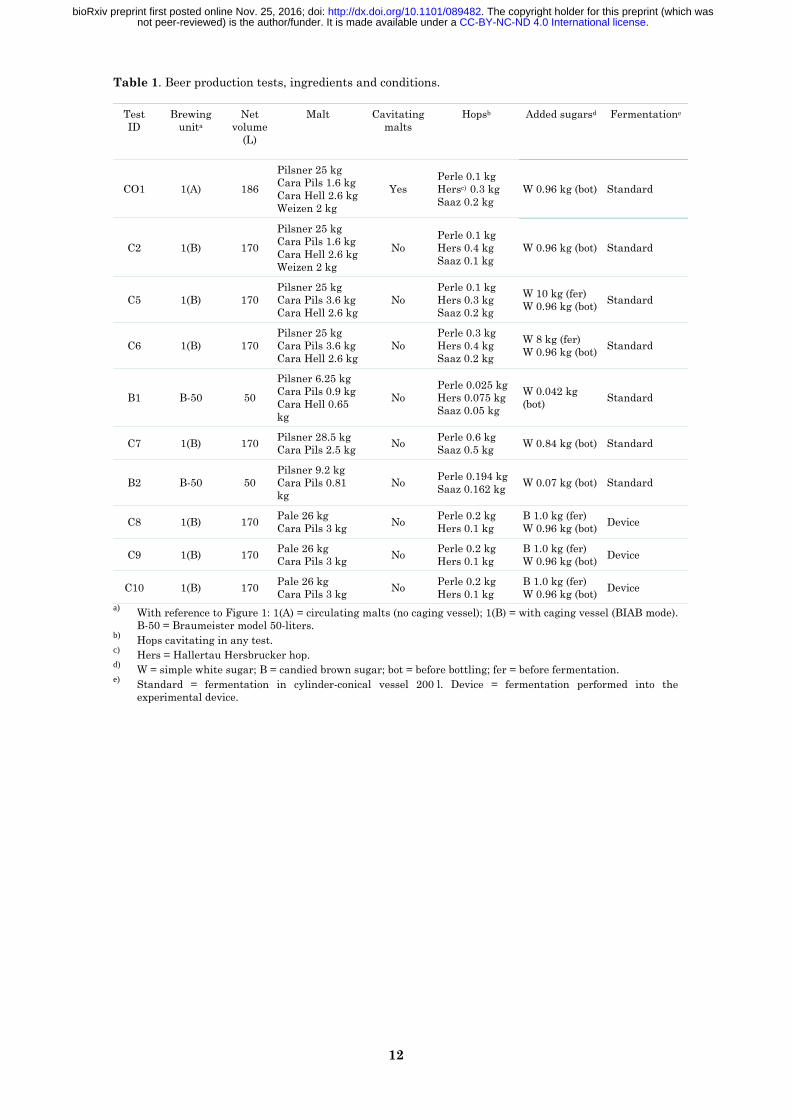
Table 1 summarizes few basic features of the brewing tests reported in this study.
No simple sugar was added during the mashing stage in any test. For three of
such tests (C8, C9 and C10) sharing the same ingredients, the fermentation step
was performed in the device. Finally, two tests (B1 and B2) were performed with a
traditional equipment.
.CC-BY-NC-ND 4.0 International licensenot peer-reviewed) is the author/funder. It is made available under aThe copyright holder for this preprint (which was. http://dx.doi.org/10.1101/089482doi: bioRxiv preprint first posted online Nov. 25, 2016;
12
Table 1. Beer production tests, ingredients and conditions.
Test ID
Brewing unita
Net volume
(L)
Malt Cavitating malts
Hopsb Added sugarsd Fermentatione
CO1 1(A) 186
Pilsner 25 kg Cara Pils 1.6 kg Cara Hell 2.6 kg Weizen 2 kg
Yes Perle 0.1 kg Hersc) 0.3 kg Saaz 0.2 kg
W 0.96 kg (bot) Standard
C2 1(B) 170
Pilsner 25 kg Cara Pils 1.6 kg Cara Hell 2.6 kg Weizen 2 kg
No Perle 0.1 kg Hers 0.4 kg Saaz 0.1 kg
W 0.96 kg (bot) Standard
C5 1(B) 170 Pilsner 25 kg Cara Pils 3.6 kg Cara Hell 2.6 kg
No Perle 0.1 kg Hers 0.3 kg Saaz 0.2 kg
W 10 kg (fer) W 0.96 kg (bot) Standard
C6 1(B) 170 Pilsner 25 kg Cara Pils 3.6 kg Cara Hell 2.6 kg
No Perle 0.3 kg Hers 0.4 kg Saaz 0.2 kg
W 8 kg (fer) W 0.96 kg (bot) Standard
B1 B-50 50
Pilsner 6.25 kg Cara Pils 0.9 kg Cara Hell 0.65 kg
No Perle 0.025 kg Hers 0.075 kg Saaz 0.05 kg
W 0.042 kg (bot) Standard
C7 1(B) 170 Pilsner 28.5 kg Cara Pils 2.5 kg No Perle 0.6 kg
Saaz 0.5 kg W 0.84 kg (bot) Standard
B2 B-50 50 Pilsner 9.2 kg Cara Pils 0.81 kg
No Perle 0.194 kg Saaz 0.162 kg W 0.07 kg (bot) Standard
C8 1(B) 170 Pale 26 kg Cara Pils 3 kg No Perle 0.2 kg
Hers 0.1 kg B 1.0 kg (fer) W 0.96 kg (bot) Device
C9 1(B) 170 Pale 26 kg Cara Pils 3 kg No Perle 0.2 kg
Hers 0.1 kg B 1.0 kg (fer) W 0.96 kg (bot) Device
C10 1(B) 170 Pale 26 kg Cara Pils 3 kg No Perle 0.2 kg
Hers 0.1 kg B 1.0 kg (fer) W 0.96 kg (bot) Device
a) With reference to Figure 1: 1(A) = circulating malts (no caging vessel); 1(B) = with caging vessel (BIAB mode). B-50 = Braumeister model 50-liters.
b) Hops cavitating in any test. c) Hers = Hallertau Hersbrucker hop. d) W = simple white sugar; B = candied brown sugar; bot = before bottling; fer = before fermentation. e) Standard = fermentation in cylinder-conical vessel 200 l. Device = fermentation performed into the
experimental device.
.CC-BY-NC-ND 4.0 International licensenot peer-reviewed) is the author/funder. It is made available under aThe copyright holder for this preprint (which was. http://dx.doi.org/10.1101/089482doi: bioRxiv preprint first posted online Nov. 25, 2016;
13
3. Results and Discussion
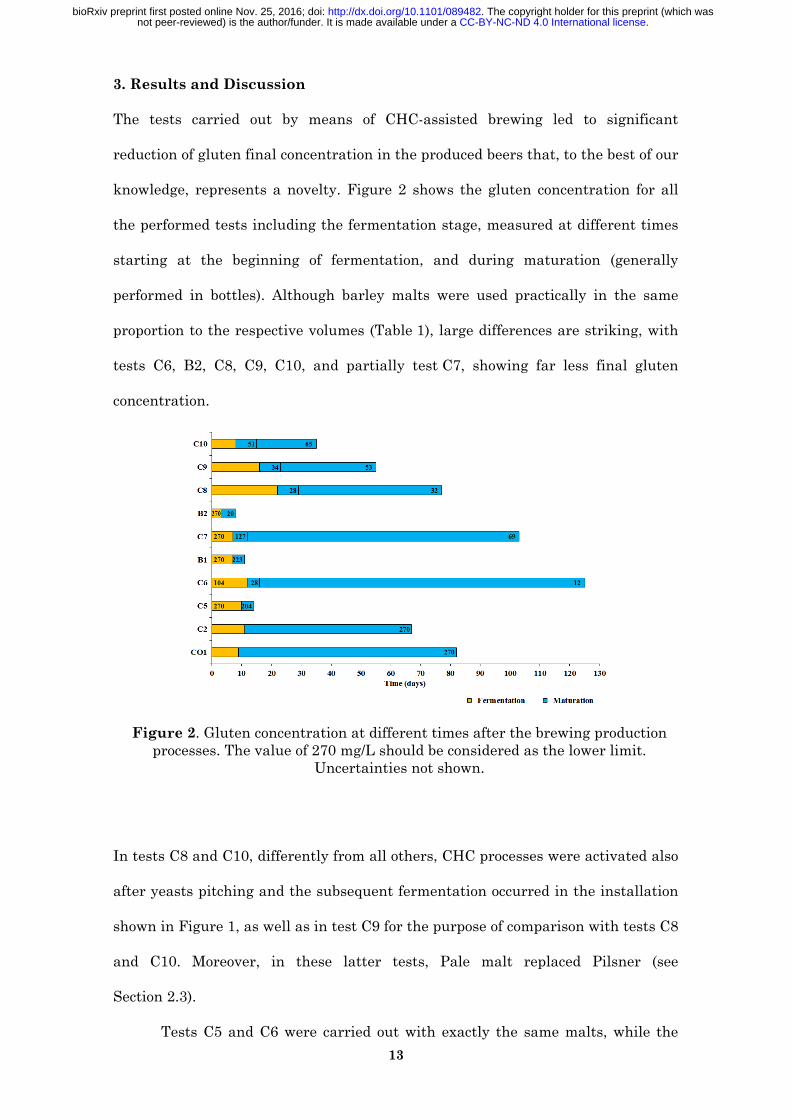
The tests carried out by means of CHC-assisted brewing led to significant
reduction of gluten final concentration in the produced beers that, to the best of our
knowledge, represents a novelty. Figure 2 shows the gluten concentration for all
the performed tests including the fermentation stage, measured at different times
starting at the beginning of fermentation, and during maturation (generally
performed in bottles). Although barley malts were used practically in the same
proportion to the respective volumes (Table 1), large differences are striking, with
tests C6, B2, C8, C9, C10, and partially test C7, showing far less final gluten
concentration.
Figure 2. Gluten concentration at different times after the brewing production processes. The value of 270 mg/L should be considered as the lower limit.
Uncertainties not shown.
In tests C8 and C10, differently from all others, CHC processes were activated also
after yeasts pitching and the subsequent fermentation occurred in the installation
shown in Figure 1, as well as in test C9 for the purpose of comparison with tests C8
and C10. Moreover, in these latter tests, Pale malt replaced Pilsner (see
Section 2.3).
Tests C5 and C6 were carried out with exactly the same malts, while the
.CC-BY-NC-ND 4.0 International licensenot peer-reviewed) is the author/funder. It is made available under aThe copyright holder for this preprint (which was. http://dx.doi.org/10.1101/089482doi: bioRxiv preprint first posted online Nov. 25, 2016;
14
net process times before fermentation were different resulting in electricity
consumptions equal to 84 kWh and 108 kWh, respectively, far greater than in tests
CO1 (60 kWh) and C2 (28 kWh, terminated at the temperature of 78°C). Starch
extraction efficiencies in tests C5 and C6 were nearly identical too, i.e. 57% and
56%, respectively (see Figure 4 in Albanese et al., 2016), as well as the
fermentation times (10 and 12 days, respectively), while yeast strains and their
respective quantities were identical. Nevertheless, test C6 showed a gluten
concentration far lower than test C5 at any time: 104±2.5 mg/L vs >270±18 mg/L at
the beginning of fermentation, and 28 mg/L (i.e. just above the gluten-free
threshold) vs. 204 mg/L after approximately the same time after test (14 and 16
days, respectively).
Eventually, 125 days after brewing (excluding fermentation), beer produced
by means of test C6 fell well below the gluten-free threshold, down at a mere
12±0.3 mg/L concentration.
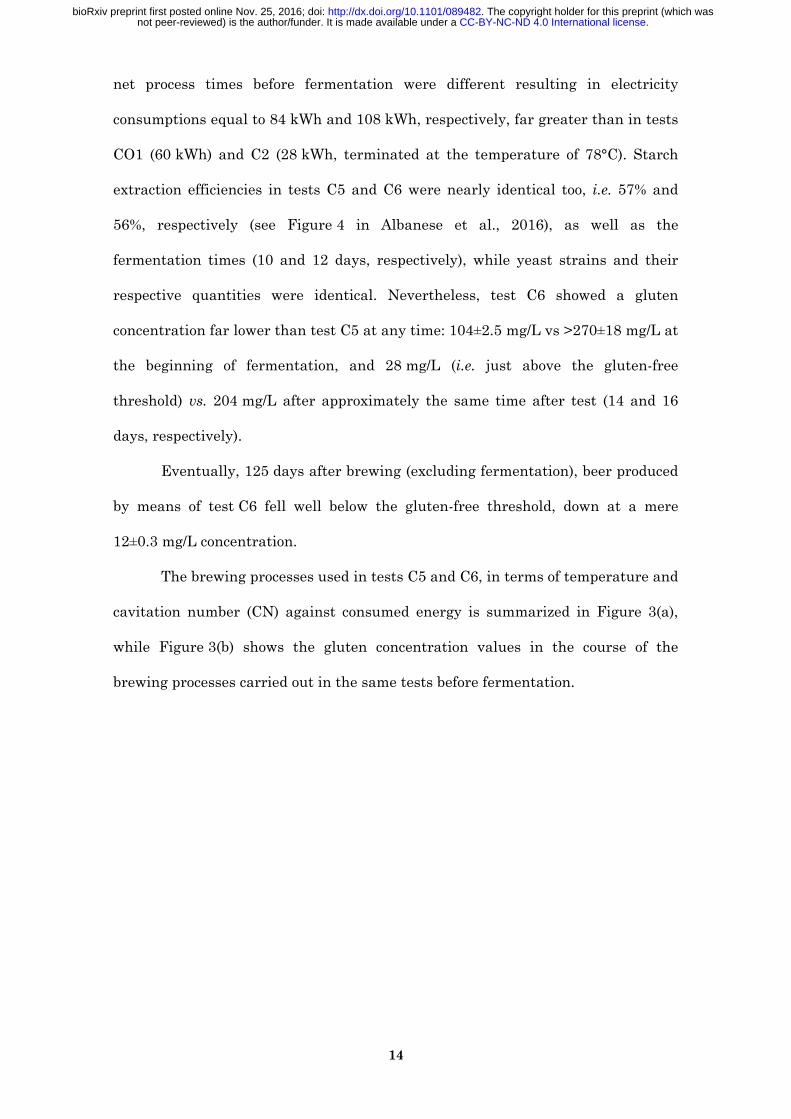
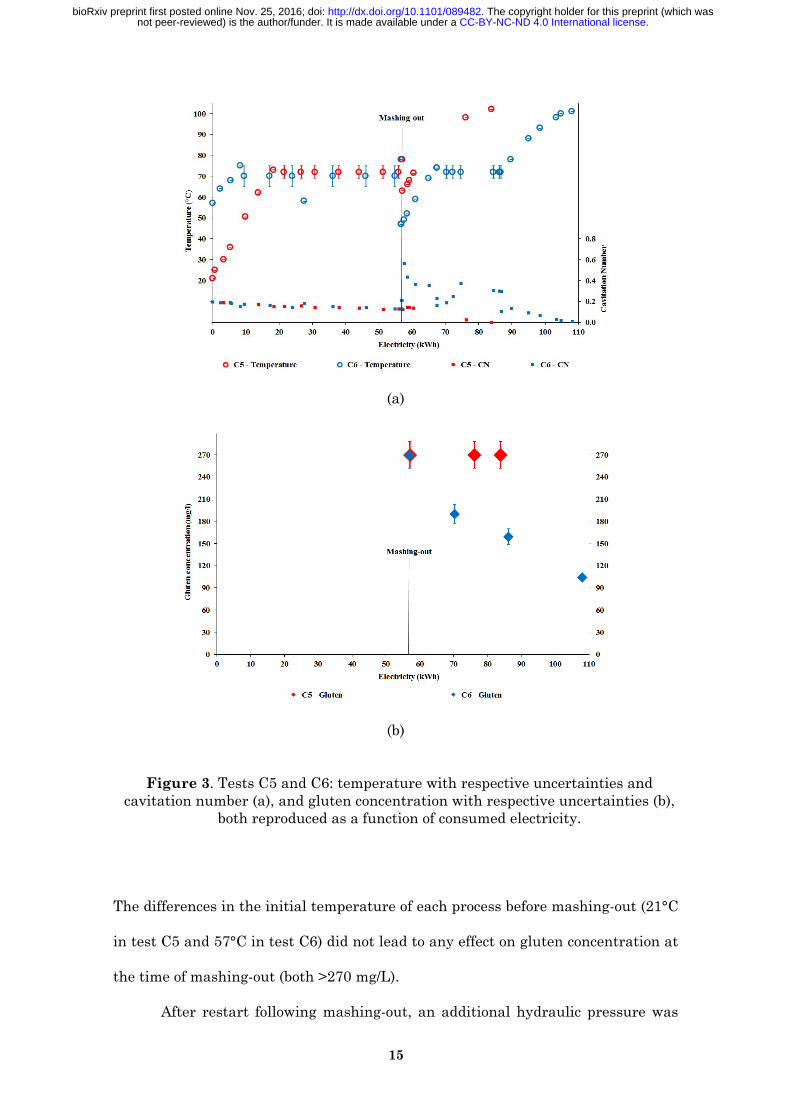
The brewing processes used in tests C5 and C6, in terms of temperature and
cavitation number (CN) against consumed energy is summarized in Figure 3(a),
while Figure 3(b) shows the gluten concentration values in the course of the
brewing processes carried out in the same tests before fermentation.
.CC-BY-NC-ND 4.0 International licensenot peer-reviewed) is the author/funder. It is made available under aThe copyright holder for this preprint (which was. http://dx.doi.org/10.1101/089482doi: bioRxiv preprint first posted online Nov. 25, 2016;
15
(a)
(b)
Figure 3. Tests C5 and C6: temperature with respective uncertainties and
cavitation number (a), and gluten concentration with respective uncertainties (b), both reproduced as a function of consumed electricity.
The differences in the initial temperature of each process before mashing-out (21°C
in test C5 and 57°C in test C6) did not lead to any effect on gluten concentration at
the time of mashing-out (both >270 mg/L).
After restart following mashing-out, an additional hydraulic pressure was
.CC-BY-NC-ND 4.0 International licensenot peer-reviewed) is the author/funder. It is made available under aThe copyright holder for this preprint (which was. http://dx.doi.org/10.1101/089482doi: bioRxiv preprint first posted online Nov. 25, 2016;
16
readily imposed in C6 process, oscillating between 0.5 atm and 2 atm and
averaging 1.5 atm, with approximately 30 kWh energy consumed during the
overpressure stage, keeping the temperature at around 72°C (almost 20 kWh of
consumed electricity). This resulted in far greater CN values for test C6, more than
double the values at similar temperatures before the activation of the additional
pressure, hinting to a more violent hydraulic cavitation regime. Rather
surprisingly, Figure 3(b) shows that the gluten concentration for test C6 fell far
below the values observed for test C5 at the same energy consumption (always
>270±18 mg/L for test C5, while in test C6 it decreased to about 160±11 mg/L at
the energy consumption of about 84 kWh). Eventually, the gluten concentration in
test C6 was only 104±2.5 mg/L before fermentation, with overall energy
consumption amounting to 108 kWh.
In tests CO1 and C2, with type and quantities of malts very similar to tests
C5 and C6, no additional pressure was applied and the net process times were
significantly smaller than in tests C5 and C6. Figure 2 shows that the gluten
concentrations in the respective beers were > 270±18 mg/L after 60 to 80 days since
the beginning of fermentation.
Test C7 involved the use of a marginally different dosage of malts, but the
same overall quantity as in tests C5 and C6, as shown in Table 1. Moreover, since
the mashing efficiency was far greater in test C7 (71%) than in tests C5 and C6
(Albanese et al., 2016), one would expect that – all else being equal – the gluten
concentration in the finished beer resulting from test C7 will be higher. No
additional hydraulic pressure was ever applied, so that cavitation numbers were
very close to those assessed during brewing in test C5. Actually, the gluten
concentration in test C7 was always >270±18 mg/L during brewing before
fermentation, similar to test C5. Moreover, the fermentation time in test C7 was
equal to 7 days, shorter than in both tests C5 (10 days) and C6 (12 days). One
might therefore wonder why the gluten concentration in the beer from test C7,
.CC-BY-NC-ND 4.0 International licensenot peer-reviewed) is the author/funder. It is made available under aThe copyright holder for this preprint (which was. http://dx.doi.org/10.1101/089482doi: bioRxiv preprint first posted online Nov. 25, 2016;
17
measured during maturation, was far lower than in test C5 just 5 days (C7) and 4
days (C5) after the end of fermentation, i.e. 127±3 mg/L against 204±14 mg/L.
Eventually, 103 days after brewing, beer produced by means of test C7 fell well
below the very low gluten content threshold, at just 69±2 mg/L.
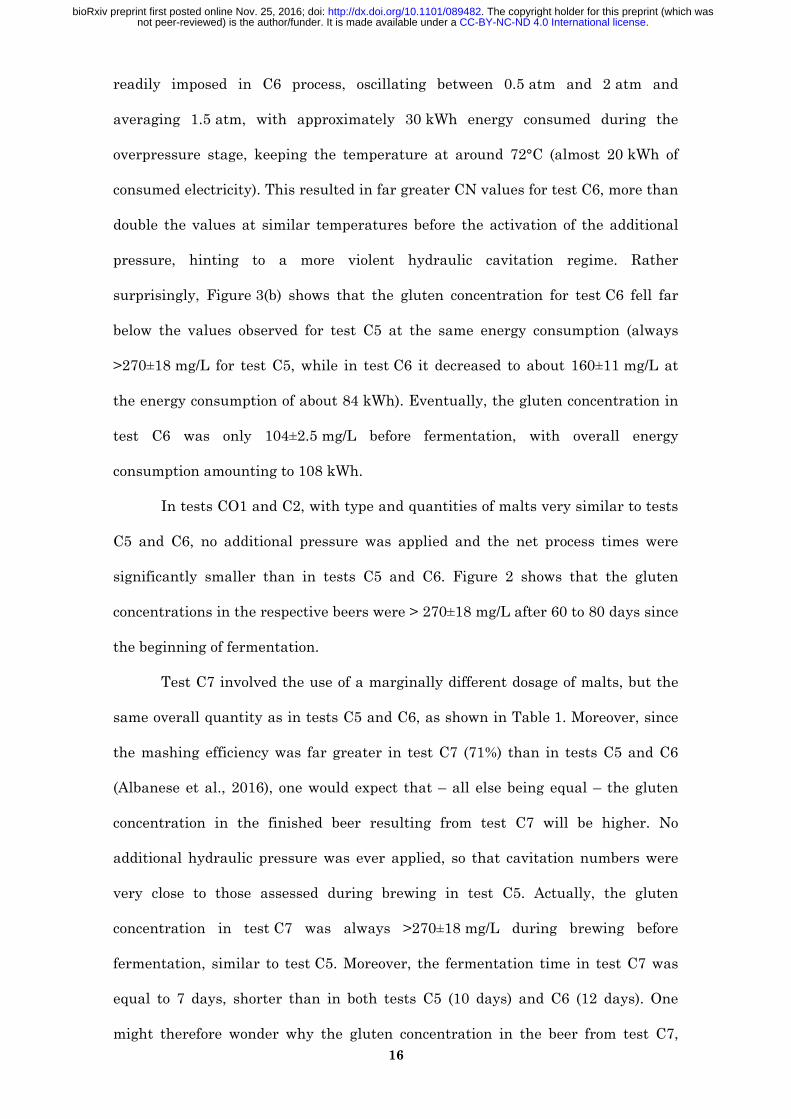
Figure 4. Same as Figure 3(a), for test C7.
Figure 4 shows the brewing processes used in test C7, again in terms of
temperature and cavitation number (CN), against consumed energy. While the
overall process time before fermentation was similar to tests C5 and C6, the starch
extraction is now far more efficient, resulting in mashing-out performed in
correspondence of an energy consumption equal to 27 kWh, against about 57 kWh
for tests C5 and C6.
This translates into less than half time elapsed from process beginning.
Therefore, a much larger fraction of the overall process time occurs after mashing-
out, i.e. with all the starch and the gluten content being available in the wort and
undergoing the hydraulic cavitation processes.
The main hypothesis we advance to explain the above results involves the
.CC-BY-NC-ND 4.0 International licensenot peer-reviewed) is the author/funder. It is made available under aThe copyright holder for this preprint (which was. http://dx.doi.org/10.1101/089482doi: bioRxiv preprint first posted online Nov. 25, 2016;
18
generation of molecular oxygen by means of the water splitting reactions triggered
by hydrodynamic cavitation (Ciriminna, Albanese, Meneguzzo, & Pagliaro, 2016b),
represented by Equations 2-7:
Н2О → Н· + ·OH (2)
Н· + Н· → Н2 (3)
·OH + ·OH → Н2О2 (4)
·OH + Н2О2 → НО2· + Н2О (5)
·OH + НО2· → Н2О + О2 (6)
НО2· + Н2О2 → ·OH + Н2О + О2 (7)
Contrary to acoustic cavitation in which the formation, growth, and implosive
collapse of cavitation bubbles is caused by the propagation of ultrasonic waves
(Mason & Peters, 2002), in hydrodynamic cavitation the same phenomena are
produced by the motion of fluid, with all the liquid being forced through an aptly
developed cavitation reactor (Venturi tube, orifice plate, rotor-stator and others).
Constrictions and nozzles, resulting in acceleration and local depressurization,
alter the flow geometry. If the pressure falls below the boiling point, water
vaporizes and vapor bubbles are generated, whose collapse in vena contracta
downstream the nozzle generates local hot spots with extreme temperature
(>5000 K), pressure (>200 atm) and hydraulic jets (>150 m/s), as well as splitting of
the water molecules into H2, O2, and hydroxyl radicals (⋅OH) (Yasui, Tuziuti,
Sivakumar, & Iida, 2004).
Equation (6) and equation (7) are especially important in this context. The
О2 generation occurring during cavitation may activate the enzyme oxidase
(Schnitzenbaumer & Arendt, 2014) in the course of mashing, whereas its
persistence in the fermenting wort does the same later with yeast oxidase (Procopio
et al., 2013). Furthermore, the proline molecules might be degraded or at least
.CC-BY-NC-ND 4.0 International licensenot peer-reviewed) is the author/funder. It is made available under aThe copyright holder for this preprint (which was. http://dx.doi.org/10.1101/089482doi: bioRxiv preprint first posted online Nov. 25, 2016;
19
partially destroyed by the extreme thermo-mechanical events triggered under
violent cavitation regimes such as those activated in test C6, as well as by milder
cavitation regimes, i.e. occurring at atmospheric pressure, provided that such
regimes are enabled for a sufficient time interval, such as in test C7.
Based on the performed tests and the above hypotheses, CN > 0.3 during a
sufficient time seems to be required for the destruction of proline molecules,
whereas data in Figure 3(a) suggest an upper limit to such time sufficient to obtain
gluten-free beer, in terms of specific consumed energy, of about 0.17 kWh/L
(resulting from about 30 kWh divided by 170 liters). While the identification of a
lower limit to achieve gluten-free beer will require further tests, it is conceivable
that such limit could be significantly lower, as Figure 2 shows that the later gluten
concentration in test C6, 125 days after brewing (excluding fermentation), was just
12±0.3 mg/L.
Concerning milder cavitation regimes (test C7), data in Figure 4 shows that
a similar upper limit to their activation time, in terms of specific consumed energy
and sufficient to obtain very low gluten content beer, of about 0.29 kWh/L
(resulting from about 50 kWh divided by 170 liters). Again, the identification of a
lower limit to achieve very low gluten content beer will require further tests,
though it is conceivable that such limit could be significantly lower, as Figure 2
shows that the later gluten concentration in test C7, 103 days after brewing
(excluding fermentation), was just 69±2 mg/L.
The observed sustained decline of gluten concentration during maturation
in tests C6 and C7 shown in Figure 2, along with the consideration that no
filtration was performed and most food and nutrients for yeasts remained
available, might imply that the yeasts remain active and assimilating proline
during maturation and that molecular oxygen persists in the fermenting wort.
Whatever the underlying mechanisms triggered by the hydrodynamic
cavitation, the effect in terms of reduced gluten concentration is similar to complex
.CC-BY-NC-ND 4.0 International licensenot peer-reviewed) is the author/funder. It is made available under aThe copyright holder for this preprint (which was. http://dx.doi.org/10.1101/089482doi: bioRxiv preprint first posted online Nov. 25, 2016;
20
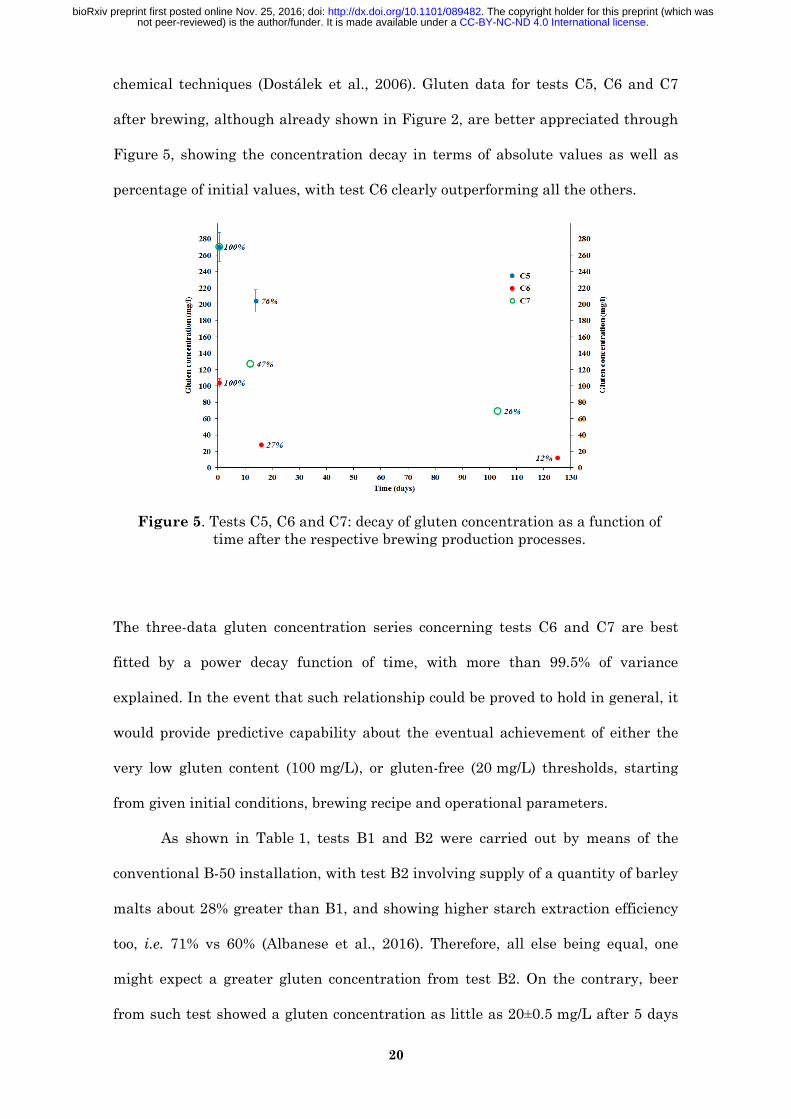
chemical techniques (Dostálek et al., 2006). Gluten data for tests C5, C6 and C7
after brewing, although already shown in Figure 2, are better appreciated through
Figure 5, showing the concentration decay in terms of absolute values as well as
percentage of initial values, with test C6 clearly outperforming all the others.
Figure 5. Tests C5, C6 and C7: decay of gluten concentration as a function of time after the respective brewing production processes.
The three-data gluten concentration series concerning tests C6 and C7 are best
fitted by a power decay function of time, with more than 99.5% of variance
explained. In the event that such relationship could be proved to hold in general, it
would provide predictive capability about the eventual achievement of either the
very low gluten content (100 mg/L), or gluten-free (20 mg/L) thresholds, starting
from given initial conditions, brewing recipe and operational parameters.
As shown in Table 1, tests B1 and B2 were carried out by means of the
conventional B-50 installation, with test B2 involving supply of a quantity of barley
malts about 28% greater than B1, and showing higher starch extraction efficiency
too, i.e. 71% vs 60% (Albanese et al., 2016). Therefore, all else being equal, one
might expect a greater gluten concentration from test B2. On the contrary, beer
from such test showed a gluten concentration as little as 20±0.5 mg/L after 5 days
.CC-BY-NC-ND 4.0 International licensenot peer-reviewed) is the author/funder. It is made available under aThe copyright holder for this preprint (which was. http://dx.doi.org/10.1101/089482doi: bioRxiv preprint first posted online Nov. 25, 2016;
21
of maturation following a mere 3-days fermentation, against 223±15 mg/L for test
B1 after 7 days of fermentation followed by 4 days of maturation.
The achievement of the above-mentioned very low gluten concentration in
test B2 was most likely a consequence of the far greater yeast concentration
supplied to the fermentation stage when compared to test B1. The feasibility of
such method for gluten reduction would be anyway undermined by the significant
harm to the beer taste, flavor and aroma produced by the greater yeast supply, as
was indeed subjectively observed for the beer resulting from test B2, let alone the
greatly increased process time and energy consumption.
Turning to tests C8, C9 and C10, Figure 2 shows that the respective gluten
concentrations are relatively low, which is especially relevant for test C9 when no
additional cavitation process was activated after yeast pitching, thereby confirming
the expectations based upon the use of Pale malt in place of Pilsner one (see
Section 2.3). Recalling that those tests were carried out with exactly the same
ingredients, Figure 6 shows that the brewing processes up to mashing-out were
practically identical in terms of energy consumption in both tests C8 and C9 and
(4 kWh less consumed energy) in test C10. Up to the yeast pitching, the consumed
energy in those tests was far lower than in tests C5, C6 and C7. Moreover, all three
tests were carried out at atmospheric pressure, producing the same cavitation
numbers at the corresponding temperatures.
.CC-BY-NC-ND 4.0 International licensenot peer-reviewed) is the author/funder. It is made available under aThe copyright holder for this preprint (which was. http://dx.doi.org/10.1101/089482doi: bioRxiv preprint first posted online Nov. 25, 2016;
22
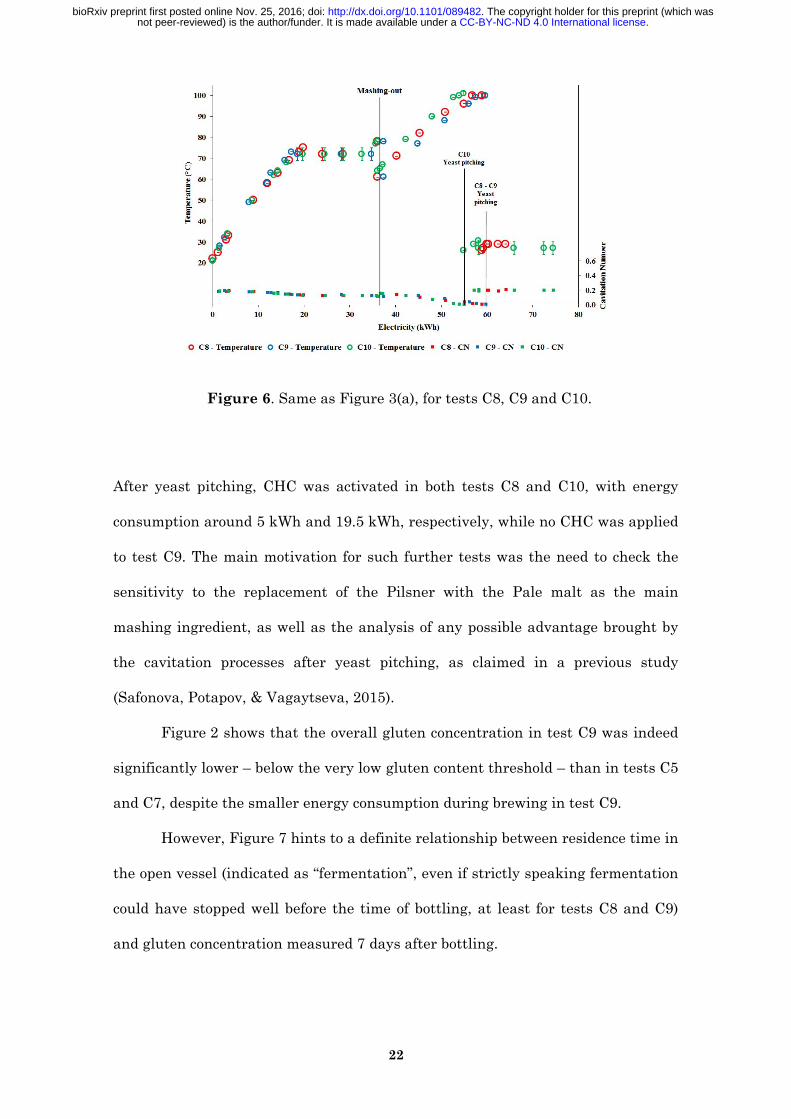
Figure 6. Same as Figure 3(a), for tests C8, C9 and C10.
After yeast pitching, CHC was activated in both tests C8 and C10, with energy
consumption around 5 kWh and 19.5 kWh, respectively, while no CHC was applied
to test C9. The main motivation for such further tests was the need to check the
sensitivity to the replacement of the Pilsner with the Pale malt as the main
mashing ingredient, as well as the analysis of any possible advantage brought by
the cavitation processes after yeast pitching, as claimed in a previous study
(Safonova, Potapov, & Vagaytseva, 2015).
Figure 2 shows that the overall gluten concentration in test C9 was indeed
significantly lower – below the very low gluten content threshold – than in tests C5
and C7, despite the smaller energy consumption during brewing in test C9.
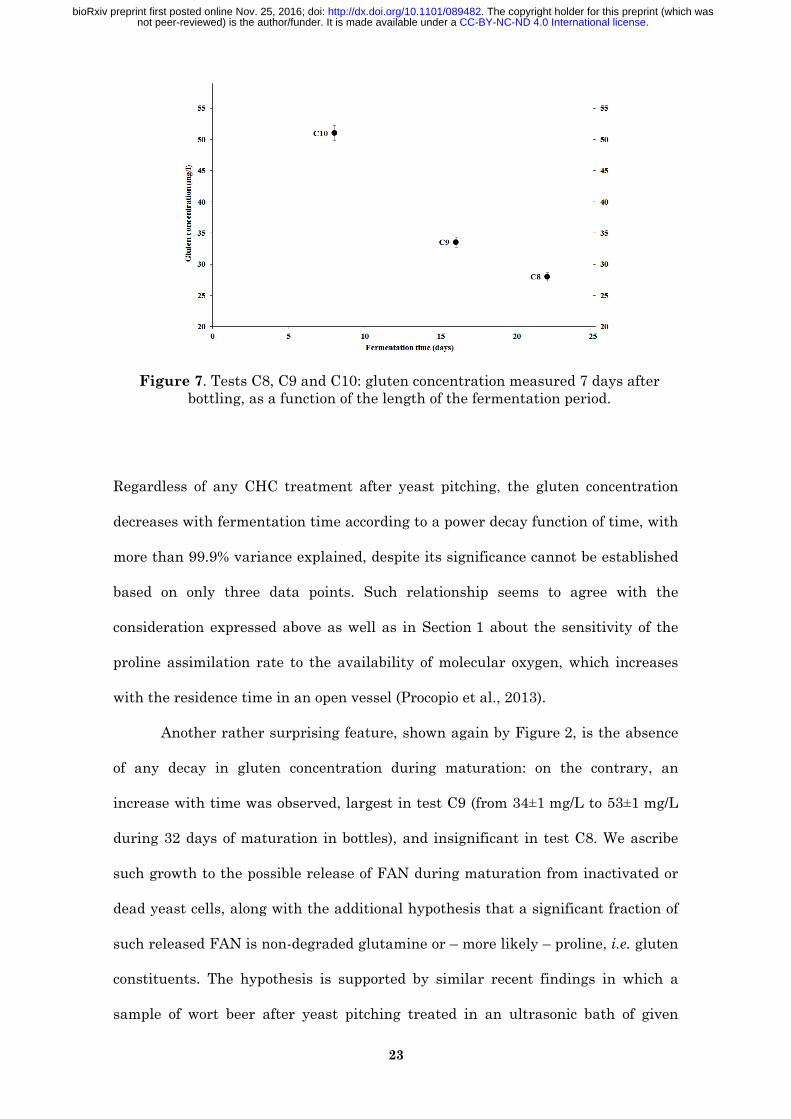
However, Figure 7 hints to a definite relationship between residence time in
the open vessel (indicated as “fermentation”, even if strictly speaking fermentation
could have stopped well before the time of bottling, at least for tests C8 and C9)
and gluten concentration measured 7 days after bottling.
.CC-BY-NC-ND 4.0 International licensenot peer-reviewed) is the author/funder. It is made available under aThe copyright holder for this preprint (which was. http://dx.doi.org/10.1101/089482doi: bioRxiv preprint first posted online Nov. 25, 2016;
23
Figure 7. Tests C8, C9 and C10: gluten concentration measured 7 days after bottling, as a function of the length of the fermentation period.
Regardless of any CHC treatment after yeast pitching, the gluten concentration
decreases with fermentation time according to a power decay function of time, with
more than 99.9% variance explained, despite its significance cannot be established
based on only three data points. Such relationship seems to agree with the
consideration expressed above as well as in Section 1 about the sensitivity of the
proline assimilation rate to the availability of molecular oxygen, which increases
with the residence time in an open vessel (Procopio et al., 2013).
Another rather surprising feature, shown again by Figure 2, is the absence
of any decay in gluten concentration during maturation: on the contrary, an
increase with time was observed, largest in test C9 (from 34±1 mg/L to 53±1 mg/L
during 32 days of maturation in bottles), and insignificant in test C8. We ascribe
such growth to the possible release of FAN during maturation from inactivated or
dead yeast cells, along with the additional hypothesis that a significant fraction of
such released FAN is non-degraded glutamine or – more likely – proline, i.e. gluten
constituents. The hypothesis is supported by similar recent findings in which a
sample of wort beer after yeast pitching treated in an ultrasonic bath of given
.CC-BY-NC-ND 4.0 International licensenot peer-reviewed) is the author/funder. It is made available under aThe copyright holder for this preprint (which was. http://dx.doi.org/10.1101/089482doi: bioRxiv preprint first posted online Nov. 25, 2016;
24
frequency and variable power (Choi et al., 2015) led to acceleration of FAN
utilization by yeasts (in its turn improving the beer’s organoleptic and
physiological properties).
While it remains unclear why the same phenomenon is not shown in any
other test, given that yeasts did not undergo any cavitation process in test C9, the
larger increase of gluten concentration in test C9 in comparison with tests C8 and
C10 could hint to a relevant role of yeast cells “activation” by CHC processes.
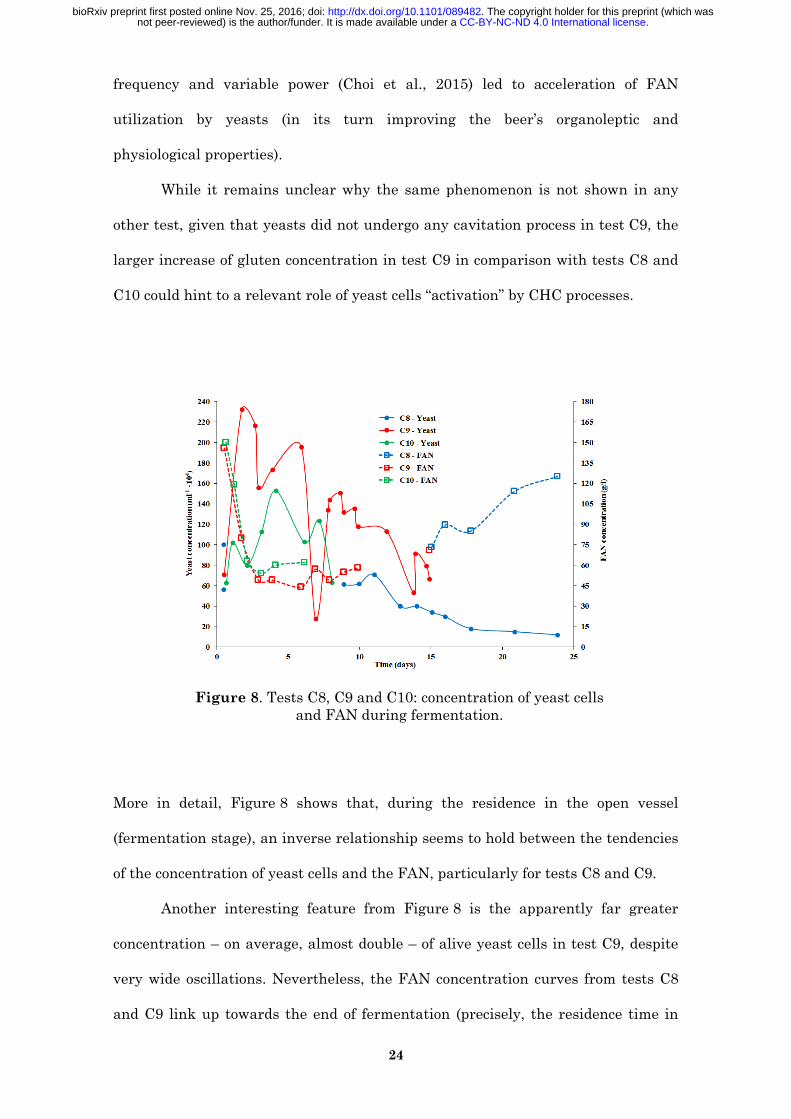
Figure 8. Tests C8, C9 and C10: concentration of yeast cells and FAN during fermentation.
More in detail, Figure 8 shows that, during the residence in the open vessel
(fermentation stage), an inverse relationship seems to hold between the tendencies
of the concentration of yeast cells and the FAN, particularly for tests C8 and C9.
Another interesting feature from Figure 8 is the apparently far greater
concentration – on average, almost double – of alive yeast cells in test C9, despite
very wide oscillations. Nevertheless, the FAN concentration curves from tests C8
and C9 link up towards the end of fermentation (precisely, the residence time in
.CC-BY-NC-ND 4.0 International licensenot peer-reviewed) is the author/funder. It is made available under aThe copyright holder for this preprint (which was. http://dx.doi.org/10.1101/089482doi: bioRxiv preprint first posted online Nov. 25, 2016;
25
the open vessel) in test C9, i.e. about 15 days after yeast pitching. First, thus, yeast
cells are partially inactivated by CHC processes in tests C8 and C10, which agrees
with previous work by the authors (Albanese et al., 2015), with no apparent
increase of lethality produced by the almost four-times longer treatment applied in
test C10. Second, yeast cells in test C8, having been “activated” by the CHC process
after their pitching, are more efficient in proline assimilation and irreversible
degradation via the oxidase process, in comparison with test C9, so much that the
simultaneously occurring effects of the reduction of alive yeast cells concentration
and the activation of the survived ones compensate each other with respect to the
impact on the FAN concentration. An hypothesis which agrees with the large
difference in gluten concentration recovery during maturation shown in Figure 2
for tests C8 and C9, as well as with the observation that fermentation in test C8
started at least an hour earlier than in any other test.
Finally, it should be noted that the safe preservation of the beer wort in an
open vessel well beyond the ordinary fermentation times, such as in test C8, is not
just a trivial task, that is now achieved thanks to the CHC sterilization capabilities
(Albanese et al., 2015, 2016). Similarly, it is remarkable that taste, aroma, flavor
and foam stability of the finished beers from tests C8 and C10 do not appear to be
adversely affected by the CHC treatment after yeast pitching, in agreement with
what lately reported by Safonova and co-workers (Safonova et al., 2015).
In summary, what arises from tests C8, C9 and C10 is that the CHC
treatment of the beer wort after yeast pitching for the purpose of gluten
concentration reduction should be short enough (e.g. < 1 h) to avoid inactivation of
a too large fraction of the yeast cells, while still generating much needed molecular
oxygen. Furthermore, the CHC treatment will be coupled to longer than normal
residence time in an open vessel (e.g. more than 20 days).
.CC-BY-NC-ND 4.0 International licensenot peer-reviewed) is the author/funder. It is made available under aThe copyright holder for this preprint (which was. http://dx.doi.org/10.1101/089482doi: bioRxiv preprint first posted online Nov. 25, 2016;
26
4. Conclusions
The new controlled hydrocavitation-assisted beer brewing technique (Albanese et
al., 2016) provides another important advantage over conventional brewing
technology, affording greatly reduced gluten concentration in the resulting beers.
Eventually, in correspondence of suitable cavitation regimes identified in this
study for barley malts, the amount of gluten found in beer is lower than the
“gluten-free” threshold (20 mg/L). The relevance of this new route to gluten
reduction arises from the fact that it allows to retain the same ingredients and
recipes of standard beers, without the involvement of any chemical additives or
proprietary techniques (such as filtration, ultrafiltration or enzymatic compounds),
while preserving taste, flavor and aroma of the best craft beers. Moreover, all this
comes without oxidation even after the most intense and prolonged cavitation
processes as, within the range of CHC regimes used in the field of food
applications, oxidation processes that are generally undesirable in liquid foods
processing (Ngadi, Latheef, & Kassama, 2012) play a marginal role (Yusaf & Al-
Juboori, 2014). Indeed, only the use of specific additives such as hydrogen peroxide
allows achieving the needed extent of organics oxidation in applications such as
water disinfection and remediation (Ciriminna, Albanese, Meneguzzo, & Pagliaro,
2016a).
Proline and its high levels in the hordein protein fraction of the barley grain
(Deželak, Zarnkow, Becker, & Košir, 2014) is a key player for the gluten toxicity to
coeliac patients or to the growing number of more mildly gluten-intolerant people
(Benítez et al., 2016; Hager et al., 2014; Sollid, 2002; Uhde et al., 2016). Therefore,
its possible assimilation, degradation and further reduction during fermentation
and maturation will be very beneficial to the food safety of the finished beers.
Hydrodynamic cavitation was shown to be effective both during mashing
and at the beginning of fermentation, i.e. after yeast pitching, with early
operational guidance provided for both brewing stages. We ascribe this newly
.CC-BY-NC-ND 4.0 International licensenot peer-reviewed) is the author/funder. It is made available under aThe copyright holder for this preprint (which was. http://dx.doi.org/10.1101/089482doi: bioRxiv preprint first posted online Nov. 25, 2016;
27
observed phenomenon to the formation of oxygen in the fermentation mixture
becoming available to allow oxidase agents, such as enzymes (Schnitzenbaumer &
Arendt, 2014) and yeasts (Procopio et al., 2013), to degrade proline. Supporting this
insight, is the very recent finding that proline, whose concentration in the
fermenting wort can be quite high, leading to the formation of fusel alcohols
(Procopio, Krause, Hofmann, & Becker, 2013), shows an assimilation rate by yeast
strains that increases in high-stress conditions due to the shortage of more easily
assimilated amino acids, as well as with the increased availability of molecular
oxygen, which is a scarce resource during anaerobic fermentation. Future
developmental research will concern the measurement of proline, along with
molecular oxygen at any relevant brewing stage, as well as the extension of the
range of cavitation regimes, with identification of the operational parameters as
function of brewing recipes. In the meanwhile, the first evidence of effective gluten
reduction in some CHC-assisted beer brewing processes has been discovered and
reported.
.CC-BY-NC-ND 4.0 International licensenot peer-reviewed) is the author/funder. It is made available under aThe copyright holder for this preprint (which was. http://dx.doi.org/10.1101/089482doi: bioRxiv preprint first posted online Nov. 25, 2016;
28
Acknowledgements
We thank F. Martelli (CNR-IBIMET) and C. Capriolo (CNR-ICVBC) for continuous
support in project management and technical help, respectively. L.A. and F.M.
were partially funded by Tuscany regional Government under the project T.I.L.A.
(Innovative Technology for Liquid Foods, Grant N°. 0001276 signed on April 30,
2014). The research was carried out under a cooperation between CNR-IBIMET
and the company Bysea S.r.l. Joint international patent application No.
PCT/IT/2016/000194, submitted on August 9, 2016, pending.
Abbreviations
BIAB = Brew In the Bag
CN = Cavitation Number
FAN = Free Amino-Nitrogen
CHC = Controlled Hydrodynamic Cavitation
SG = Silica Gel
GRAS = Generally Recognized as Safe
.CC-BY-NC-ND 4.0 International licensenot peer-reviewed) is the author/funder. It is made available under aThe copyright holder for this preprint (which was. http://dx.doi.org/10.1101/089482doi: bioRxiv preprint first posted online Nov. 25, 2016;
29
5. References
Albanese, L., Ciriminna, R., Meneguzzo, F., & Pagliaro, M. (2015). Energy efficient inactivation of Saccharomyces cerevisiae via controlled hydrodynamic cavitation. Energy Science & Engineering, 3(3), 221–238. https://doi.org/10.1002/ese3.62
Albanese, L., Ciriminna, R., Meneguzzo, F., & Pagliaro, M. (2016). A novel brewing process via controlled hydrodynamic cavitation. Eprint arXiv:1609.06629, 26.
Ambrosi, A., Cardozo, N. S. M., & Tessaro, I. C. (2014). Membrane Separation Processes for the Beer Industry: a Review and State of the Art. Food and Bioprocess Technology, 7(4), 921–936. https://doi.org/10.1007/s11947-014-1275-0
Amienyo, D., & Azapagic, A. (2016). Life cycle environmental impacts and costs of beer production and consumption in the UK. The International Journal of Life Cycle Assessment, 21(4), 492–509. https://doi.org/10.1007/s11367-016-1028-6
Bagal, M. V, & Gogate, P. R. (2014). Wastewater treatment using hybrid treatment schemes based on cavitation and Fenton chemistry: a review. Ultrasonics Sonochemistry, 21(1), 1–14. https://doi.org/10.1016/j.ultsonch.2013.07.009
Benítez, E. I., Acquisgrana, M. R., Peruchena, N. M., Sosa, G. L., & Lozano, J. E. (2016). Effects of silica gel on reduction in gluten during several beer brewing stages. International Journal of Food Science & Technology, 51(4), 920–928. https://doi.org/10.1111/ijfs.13053
Bohačenko, I., Chmelík, J., & Psota, V. (2006). Determination of the contents of A- and B-starches in barley using Low Angle Laser Light Scattering. Czech Journal of Food Sciences, 24(1), 11–18.
Bokulich, N. A., & Bamforth, C. W. (2013). The microbiology of malting and brewing. Microbiology and Molecular Biology Reviews : MMBR, 77(2), 157–72. https://doi.org/10.1128/MMBR.00060-12
Brown, A. K., & Hammond, J. R. M. (2003). Flavour Control in Small-Scale Beer Fermentations. Food and Bioproducts Processing, 81(1), 40–49. https://doi.org/10.1205/096030803765208652
Choi, E. J., Ahn, H., Kim, M., Han, H., & Kim, W. J. (2015). Effect of ultrasonication on fermentation kinetics of beer using six-row barley cultivated in Korea. Journal of the Institute of Brewing, 121(4), 510–517. https://doi.org/10.1002/jib.262
Ciriminna, R., Albanese, L., Meneguzzo, F., & Pagliaro, M. (2016a). Hydrogen Peroxide: A Key Chemical for Tomorrow’s Sustainable Development. ChemSusChem. https://doi.org/10.1002/cssc.201600895
Ciriminna, R., Albanese, L., Meneguzzo, F., & Pagliaro, M. (2016b). Wastewater remediation via controlled hydrocavitation. Environmental Reviews. https://doi.org/10.1139/er-2016-0064
Deželak, M., Zarnkow, M., Becker, T., & Košir, I. J. (2014). Processing of bottom-fermented gluten-free beer-like beverages based on buckwheat and quinoa malt with chemical and sensory characterization. Journal of the Institute of Brewing, 120(4), 360–370. https://doi.org/10.1002/jib.166
Dostálek, P., Hochel, I., Méndez, E., Hernando, A., & Gabrovská, D. (2006). Immunochemical determination of gluten in malts and beers. Food Additives and Contaminants, 23(11), 1074–8. https://doi.org/10.1080/02652030600740637
Gogate, P. R. (2002). Cavitation: an auxiliary technique in wastewater treatment schemes. Advances in Environmental Research, 6(3), 335–358. https://doi.org/10.1016/S1093-0191(01)00067-3
Hager, A.-S., Taylor, J. P., Waters, D. M., & Arendt, E. K. (2014). Gluten free beer – A review. Trends in Food Science & Technology, 36(1), 44–54. https://doi.org/10.1016/j.tifs.2014.01.001
Landaud, S., Latrille, E., & Corrieu, G. (2001). Top Pressure and Temperature Control the Fusel Alcohol/Ester Ratio through Yeast Growth in Beer Fermentation. Journal of the Institute of Brewing, 107(2), 107–117. https://doi.org/10.1002/j.2050-0416.2001.tb00083.x
Lekkas, C., Stewart, G. G., Hill, A., Taidi, B., & Hodgson, J. (2005). The Importance of Free Amino Nitrogen in Wort and Beer. MBAA Technical Quarterly, 42(2), 113–116. https://doi.org/10.1094/TQ-42-0113
Mason, T. J., & Peters, D. (2002). Practical Sonochemistry: Power Ultrasound Uses and
.CC-BY-NC-ND 4.0 International licensenot peer-reviewed) is the author/funder. It is made available under aThe copyright holder for this preprint (which was. http://dx.doi.org/10.1101/089482doi: bioRxiv preprint first posted online Nov. 25, 2016;
30
Applications (2nd ed.). Cambridge (UK): Woodhead Publishing. Mayer, H., Ceccaroni, D., Marconi, O., Sileoni, V., Perretti, G., & Fantozzi, P. (2016).
Development of an all rice malt beer: A gluten free alternative. LWT - Food Science and Technology, 67, 67–73. https://doi.org/10.1016/j.lwt.2015.11.037
Meo, B., Freeman, G., Marconi, O., Booer, C., Perretti, G., & Fantozzi, P. (2011). Behaviour of Malted Cereals and Pseudo-Cereals for Gluten-Free Beer Production. Journal of the Institute of Brewing, 117(4), 541–546. https://doi.org/10.1002/j.2050-0416.2011.tb00502.x
Ngadi, M. O., Latheef, M. Bin, & Kassama, L. (2012). Emerging technologies for microbial control in food processing. In J. I. Boye & Y. Arcand (Eds.), Green technologies in food production and processing (pp. 363–411). Boston, MA: Springer US. https://doi.org/10.1007/978-1-4614-1587-9_14
Pires, E., & Brányik, T. (2015). Biochemistry of Beer Fermentation. Springer International Publishing AG Switzerland. https://doi.org/10.1007/978-3-319-15189-2
Procopio, S., Krause, D., Hofmann, T., & Becker, T. (2013). Significant amino acids in aroma compound profiling during yeast fermentation analyzed by PLS regression. LWT - Food Science and Technology, 51(2), 423–432. https://doi.org/10.1016/j.lwt.2012.11.022
Rallabhandi, P., Sharma, G. M., Pereira, M., & Williams, K. M. (2015). Immunological characterization of the gluten fractions and their hydrolysates from wheat, Rye and barley. Journal of Agricultural and Food Chemistry, 63(6), 1825–1832. https://doi.org/10.1021/jf505716p
Safonova, E. A., Potapov, A. N., & Vagaytseva, E. A. (2015). Intensification of technological processes of beer production using rotary-pulsation apparatus. Food Processing: Techniques & Technology, 36(1), 74–81 (in Russian).
Schnitzenbaumer, B., & Arendt, E. K. (2014). Brewing with up to 40% unmalted oats (Avena sativa) and sorghum (Sorghum bicolor): A review. Journal of the Institute of Brewing, 120(4), 315–330. https://doi.org/10.1002/jib.152
Sollid, L. M. (2002). Coeliac disease: dissecting a complex inflammatory disorder. Nature Reviews Immunology, 2(9), 647–655. https://doi.org/10.1038/nri885
Uhde, M., Ajamian, M., Caio, G., De Giorgio, R., Indart, A., Green, P. H., … Alaedini, A. (2016). Intestinal cell damage and systemic immune activation in individuals reporting sensitivity to wheat in the absence of coeliac disease. Gut, gutjnl-2016-311964. https://doi.org/10.1136/gutjnl-2016-311964
Wijngaard, H. H., & Arendt, E. K. (2006). Optimisation of a Mashing Program for 100% Malted Buckwheat. Journal of the Institute of Brewing, 112(1), 57–65. https://doi.org/10.1002/j.2050-0416.2006.tb00708.x
Yasui, K., Tuziuti, T., Sivakumar, M., & Iida, Y. (2004). Sonoluminescence. Applied Spectroscopy Reviews, 39(3), 399–436. https://doi.org/10.1081/ASR-200030202
Yeo, H. Q., & Liu, S.-Q. (2014). An overview of selected specialty beers: developments, challenges and prospects. International Journal of Food Science & Technology, 49(7), 1607–1618. https://doi.org/10.1111/ijfs.12488
Yusaf, T., & Al-Juboori, R. a. (2014). Alternative methods of microorganism disruption for agricultural applications. Applied Energy, 114, 909–923. https://doi.org/10.1016/j.apenergy.2013.08.085
.CC-BY-NC-ND 4.0 International licensenot peer-reviewed) is the author/funder. It is made available under aThe copyright holder for this preprint (which was. http://dx.doi.org/10.1101/089482doi: bioRxiv preprint first posted online Nov. 25, 2016;