Globus Maritime Limited · Globus Maritime Limited December 8th, 2014 . Disclaimer Page 1 This...
21
Quarter and nine months ended September 30 th 2014 Globus Maritime Limited December 8 th , 2014
Transcript of Globus Maritime Limited · Globus Maritime Limited December 8th, 2014 . Disclaimer Page 1 This...

Quarter and nine months ended September 30th 2014
Globus Maritime Limited
December 8th , 2014

Disclaimer
Page 1
This presentation (and oral statements made regarding the subjects of this presentation) includes statements that are, or may be deemed to be, “forward-looking statements” as defined under U.S. federal securities laws. These forward-looking statements reflect the current views, forecasts, expectations, beliefs and projections of Globus Maritime Limited (the “Company”) with respect to future events and financial performance and may include plans, objectives, intentions and other statements concerning, among other things, results of operations, financial condition, liquidity, prospects, growth, strategies and the industry in which the Company operates, all of which are not historical facts. The forward-looking statements in this presentation are based on various assumptions, including without limitation, management’s examination of historical operating trends, data from the Company’s records and other data available from third parties. Because these assumptions are inherently subject to significant uncertainties and contingencies which are difficult or impossible to predict and are beyond the Company’s control, the Company cannot assure you that it will achieve or accomplish these forecasts, beliefs or projections. Past performance, trends or activities of the Company or its shares cannot be relied on as a guide to future performance, trends or activities. The Company’s actual results could differ materially from those anticipated in forward-looking statements for many reasons specifically as described in the Company’s filings with the Securities and Exchange Commission (the “SEC”). Accordingly, you should not unduly rely on these forward-looking statements, which speak only as of the date of this communication. The Company does not assume and expressly disclaims any obligation to update these forward looking statements or to reflect the occurrence or non-occurrence of any events. You should, however, review the factors and risks the Company describes in the reports it will file from time to time with the SEC after the date of this communication. The financial information and data contained in this communication is unaudited and does not conform to the SEC Regulation S-X. Accordingly, such information and data may not be included in, may be adjusted in or may be presented differently in, the Company’s filings with the SEC. This communication includes certain financial information that is not derived in accordance with generally accepted accounting principles (“GAAP”), and which may be deemed to be non-GAAP financial measures within the meaning of Regulation G promulgated by the SEC. The Company believes that the presentation of these non-GAAP financial measures serves to enhance the understanding of the financial performance of the Company. However, these non-GAAP financial measures should be considered in addition to and not as substitutes for, or superior to, financial measures of financial performance prepared in accordance with GAAP. Please refer to the Company’s filings with the Securities and Exchange Commission for a discussion of these non-GAAP financial measures.
Forward Looking Statement

Company Update Report
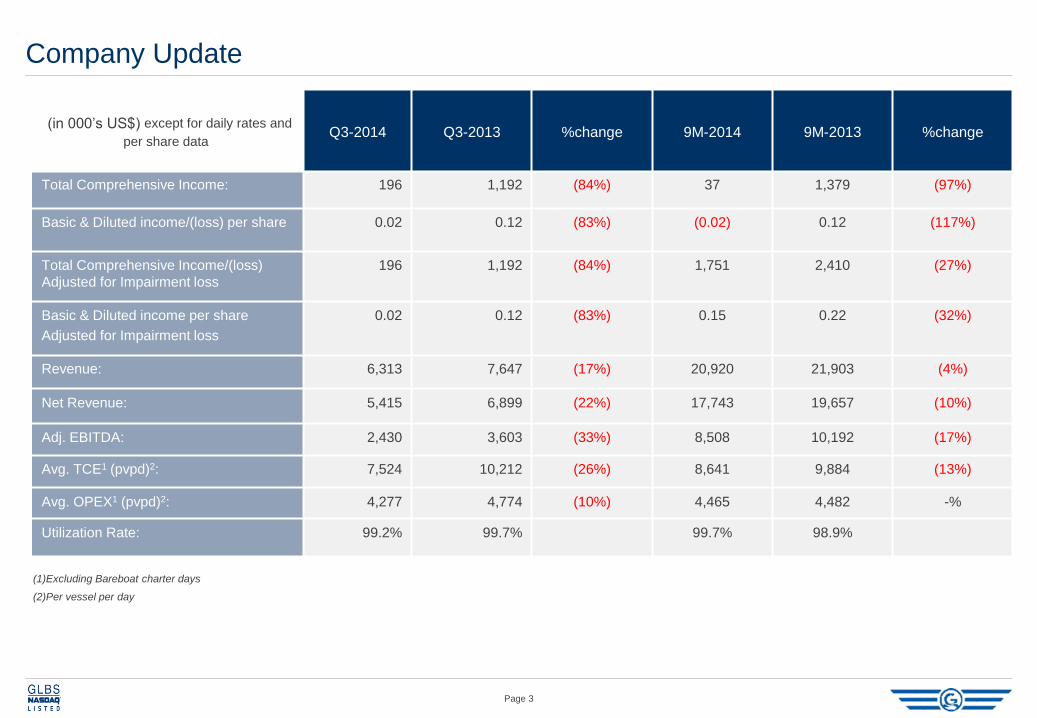
Company Update
Page 3
(in 000’s US$) except for daily rates and
per share data Q3-2014 Q3-2013 %change 9M-2014 9M-2013 %change
Total Comprehensive Income: 196 1,192 (84%) 37 1,379 (97%)
Basic & Diluted income/(loss) per share 0.02 0.12 (83%) (0.02) 0.12 (117%)
Total Comprehensive Income/(loss)
Adjusted for Impairment loss
196 1,192 (84%) 1,751 2,410 (27%)
Basic & Diluted income per share
Adjusted for Impairment loss
0.02 0.12 (83%) 0.15 0.22 (32%)
Revenue: 6,313 7,647 (17%) 20,920 21,903 (4%)
Net Revenue: 5,415 6,899 (22%) 17,743 19,657 (10%)
Adj. EBITDA: 2,430 3,603 (33%) 8,508 10,192 (17%)
Avg. TCE1 (pvpd)2: 7,524 10,212 (26%) 8,641 9,884 (13%)
Avg. OPEX1 (pvpd)2: 4,277 4,774 (10%) 4,465 4,482 -%
Utilization Rate: 99.2% 99.7% 99.7% 98.9%
(1)Excluding Bareboat charter days
(2)Per vessel per day

Operating Highlights
Page 4
Q3-2014 Q3-2013 9M-2014 9M-2013
Ownership Days 644 644 1,911 1,911
Available Days 644 644 1,893 1,883
Operating Days 639 642 1,887 1,862
Bareboat Charter Days 92 92 273 273
Average No. of Vessels 7.0 7.0 7.0 7.0
Fleet Utilization 99.2% 99.7% 99.7% 98.9%
Avg. TCE1 (pvpd)2: 7,524 10,212 8,641 9,884
Avg. OPEX1 (pvpd)2: 4,277 4,774 4,465 4,482
(1)Excluding Bareboat charter days
(2)Per vessel per day

Fleet & Employment Profile
Page 5
As of December 4th, 2014
Vessel Name Type Year Built DWT Daily Charter Rate (1) Earliest Expected
Charter Expiration Charterer
Tiara Globe Panamax 1998 72,928 SPOT - -
Moon Globe Panamax 2005 74,432 $7,425 Mid Jan. Ark Shipping S.A.
Sun Globe Supramax 2007 58,790 16,000 Jan 2015 Cosco Qingdao
River Globe Supramax 2007 53,627 $7,850 Mid Dec. Norvik Shipping NA
Sky Globe Supramax 2009 56,855 $7,250 first 65 days
$10,000 thereafter Mid Feb. Pan Ocean Co. Ltd.
Star Globe Supramax 2010 56,867 $8,000 End Dec. Mina Shipping DMCC
Jin Star Kamsarmax 2010 79,387 $14,250 (2) Jan 2015 Eastern Media &
Far Eastern
452,886
Weighted Average Age 7.8 Years at 30/09/2014
(1) All rates are gross and include brokers' commission but exclude any ballasting and/or idle periods
(2) Jin Star rate is on a bareboat charter
(3) Red = spot trading or short term TC. Black = period charter > 12 months
6
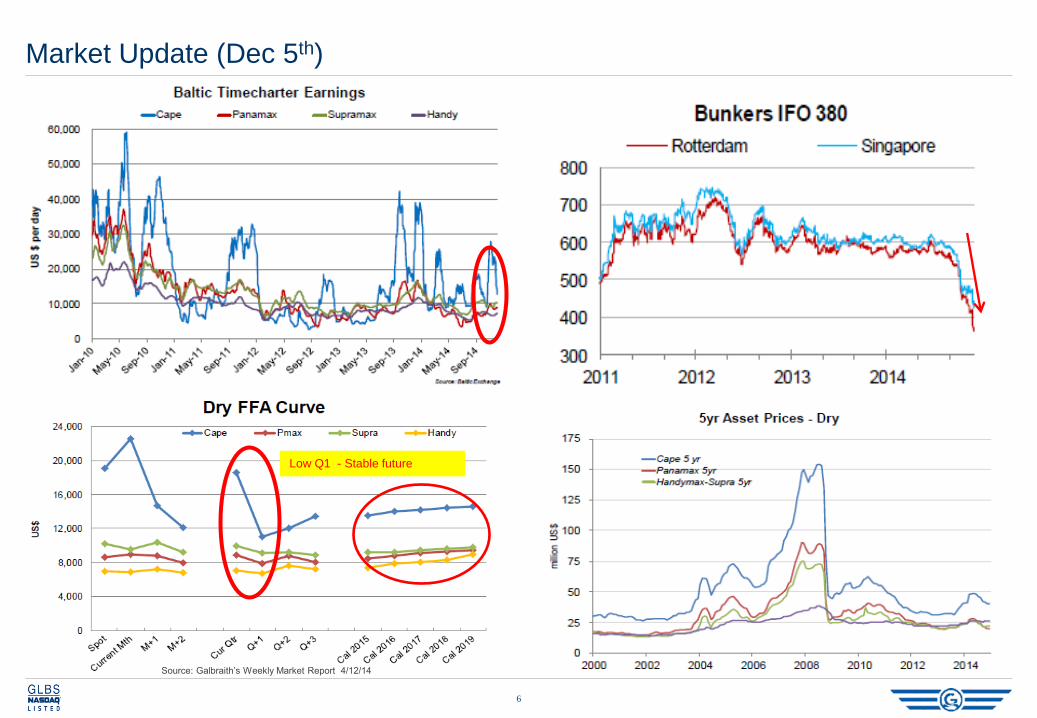
Market Update (Dec 5th)
Low Q1 - Stable future
Source: Galbraith’s Weekly Market Report 4/12/14

Fundamentals
7
Source: CLARKSONS Dry Bulk Analysis 4 Dec 2014

Forward Looking
8
Chinese coal imports China & India Coal Imports Chinese iron ore imports
Source: DNB Markets. Dry Bulk 27 Nov 14 Source: Howe Robinson 4 Dec 2014
Source: Arrow Shipbroking Group 2014

Spot & TC rates vs recent history
9
Source: Lorentzen & Stemoco Weekly Dry Bulk Report
49

Financials

Statement of Comprehensive income
Page 11
(in 000’s US$) Q3-2014 Q3-2013 9M-2014 9M-2013
Revenue 6,313 7,647 20,920 21,903
Voyage expenses (898) (748) (3,177) (2,246)
Net revenue 5,415 6,899 17,743 19,657
Vessel operating expenses (2,361) (2,635) (7,314) (7,341)
Admin expenses1 (630) (677) (1,884) (2,103)
Other income/(expenses), net 6 16 (37) (21)
Adjusted EBITDA 2,430 3,603 8,508 10,192
Gain on SWAPs - 150 - 604
Depreciation & amortization2 (1,768) (1,688) (5,160) (5,628)
Impairment loss - - (1,714) (1,031)
Interest expense and finance costs (500) (878) (1,634) (2,771)
Interest income 3 10 10 38
FX gain/(loss) 31 (5) 27 (25)
Total comprehensive income 196 1,192 37 1,379
Total comprehensive income/(loss) adjusted for impairment loss
196 1,192 1,751 2,410
(1)This data appears as (i) administrative expenses, (ii) administrative expenses to related parties, and (iii) share-based payments;
(2)This data appears as (i) Depreciation, (ii) Depreciation of dry docking costs, and (iii) Amortization of fair value of time charter attached to vessels

Income for the quarter and nine month period ended September 30, 2014 vs 2013 (000’s $US)
Page 12
3Q2014 vs 3Q2013
9M2014 vs 9M2013

Statement of Financial Position
Page 13
(in 000’s US$) As of September 30, 2014 As of December 31, 2013
Cash 3,955 3,889
Restricted cash/ L-T Time Deposits(1) 2,000 2,000
Other Current Assets 4,102 4,700
Non-Current assets held for sale 9,652 11,366
Non-Current Assets 129,362 133,707
Total Assets 149,071 155,662
Total Debt, net of unamortized discount 84,019 91,210
Deferred Revenue 772 534
Other Liabilities 4,081 3,578
Accumulated Deficit (49,690) (49,504)
Share Capital & Share Premium 109,889 109,844
Total Liabilities & Equity 149,071 155,662
(1) refers to restricted cash and time deposits with maturities garter than three months

Statement of Cash Flows
Page 14
(in 000’s US$) Q3-2014 Q3-2013 9M-2014 9M-2013
Net income 196 1,192 37 1,379
Non Cash/operating items 2,278 2,466 8,543 8,957
Dry Docking cost - - (808) (835)
Working Capital movement (480) (1,245) 1,515 (562)
Cash from operations 1,994 2,413 9,287 8,939
Other fixed asset acquisitions-Improvements (2) (3) (7) (38)
Interest received 3 10 9 39
Cash from investing activities 1 7 2 1
Proceeds from Shareholders’ facility, net (400) - (200) -
Repayment of Debt (855) (856) (7,069) (11,069)
Dividends paid on preferred shares - (163) (390) (163)
Interest paid (473) (779) (1,564) (2,610)
Cash used in financing activities (1,728) (1,798) (9,223) (13,842)
Increase/(decrease) in cash 267 622 66 (4,902)
Effect of FX on Cash 2 6 - 19
Cash at the beginning of the period 3,686 4,142 3,889 9,653
Cash at the end of the period 3,955 4,770 3,955 4,770

Liquidity position
Page 15
(in millions US$) As of September
30, 2014
As of December
31, 2013
As of March
31, 2013
Total Cash(1) 6.0 5.9 12.8
Debt(2) 84.2 91.5 104.6
Shareholders Equity(3) 60.2 60.3 56.6
Total Capitalization(3) 144.4 151.8 161.2
Net Debt / Total Capitalization
54.16% 56.39% 56.95%
(1) Includes cash and cash equivalents, deposits on pledge and time deposits with original maturities longer
than three months
(2) Debt refers to our loan and credit facilities and is presented gross of unamortized debt discount
(3) in book values
54.16%
56.39%
56.95%
50.00%
51.00%
52.00%
53.00%
54.00%
55.00%
56.00%
57.00%
58.00%
0
20
40
60
80
100
120
140
160
30.9.14 31.12.13 31.3.13
Shareholders equityNet debt (Debt-Cash)CashNet Debt/ Total Capitalization

Net Debt (Debt(1) – Total Cash)
Page 16
(in 000’s US$) Six months ended June 30,
2014
Six months ended December
31, 2013
Six months ended June 30,
2013
Cash From operations 7,293 5,831 6,526
Interest and finance costs paid, net (1,085) (1,691) (1,802)
Asset acquisitions-Improvements (5) (23) (35)
Free cash 6,203 4,117 4,689
Non Cash adjustments (2) 5 13
Dividends paid (common/preferred) (390) (163) -
Decrease in net debt 5,811 3,959 4,702
Net debt in the beginning of the period (85,615) (89,574) (94,276)
Net debt at the end of the period (79,804) (85,615) (89,574)
Total Cash Debt Net Debt
Balance as of March 31, 2013 12,815 (104,572) (91,757)
Cash flows, net (6,948) 13,068 6,120
Effect of foreign exchange on Cash 22 - 22
Balance as of December 31, 2013 5,889 (91,504) (85,615)
Cash flows, net 66 7,269 7,335
Balance as of September 30, 2014 5,955 (84,235) (78,280)
(1) Debt: refers to our loan and credit facilities and is presented gross of unamortized discount

Reconciliation of Net Debt (Debt(1) – Total Cash) to cash from operations
Page 17
(in 000’s US$) Nine months ended September
30, 2014
Nine months ended December
31, 2013
Cash from operations 9,287 9,008
Interest and finance costs paid, net (1,555) (2,667)
Other fixed asset acquisitions-Improvements (7) (58)
Free cash flow 7,725 6,283
Non Cash adjustments - 22
Dividends paid on preferred shares (390) (163)
Decrease in net debt 7,335 6,142
Net debt at the beginning of the period (85,615) (91,757)
Net debt at the end of the period (78,280) (85,615)
(1) Debt gross of unamortized discount

Appendix

Co-founder, Chief Executive Officer since September 2006
22 years shipping experience (10 years of which involved public company experience)
• Projects engineer for Kassos Maritime Enterprises from 1990-1992
• Director and Corporate Secretary for the NYSE listed Stelmar Shipping Limited from 1992-2004. During his time at Stelmar
Shipping Limited, Mr. Karageorgiou assisted with both vessel acquisitions, financings and strategy
Mr. Karageorgiou holds a BE in Mechanical Engineering and an ME in Ocean Engineering from Stevens Institute of
Technology and an MSc in Shipping Trade and Finance from CASS Business School
Our Financial Controller since July 2007
In 2001 he joined PricewaterhouseCoopers (PwC) where he served as an external auditor specializing in shipping
companies until July 2007
Mr. Kalapotharakos holds a BSc with Honours in Economics and Social studies in Economics from University of
Wales, Aberystwyth UK and an MSc in Financial and Business Economics from the University of Essex UK
Executive Team
Page 19
Nikos Kalapotharakos, Financial Controller
George Karageorgiou, Chief Executive Officer

Page 20
Contacts
Globus Maritime Limited
George Karageorgiou
President & CEO
Tel: +30 210 960 8300
www.globusmaritime.gr
Capital Link – New York
Nicolas Bornozis
Paul Lampoutis
+1 212 661 7566