GlobalFood Discussion Papers - uni-goettingen.de fileaCorresponding author, Research Associate,...
24
RTG 1666 GlobalFood ⋅ Heinrich Düker Weg 12 ⋅ 37073 Göttingen ⋅ Germany www.uni-goettingen.de/globalfood ISSN (2192-3248) www.uni-goettingen.de/globalfood RTG 1666 GlobalFood Transformation of Global Agri-Food Systems: Trends, Driving Forces, and Implications for Developing Countries Georg-August-University of Göttingen GlobalFood Discussion Papers No. 84 Protecting Health or Protecting Imports? Evidence from EU Non-Tariff Barriers Fatima Olanike Kareem Inmaculada Martinez-Zarzoso Bernhard Brümmer July 2016
Transcript of GlobalFood Discussion Papers - uni-goettingen.de fileaCorresponding author, Research Associate,...

RTG 1666 GlobalFood ⋅ Heinrich Düker Weg 12 ⋅ 37073 Göttingen ⋅ Germany www.uni-goettingen.de/globalfood
ISSN (2192-3248)
www.uni-goettingen.de/globalfood
RTG 1666 GlobalFood
Transformation of Global Agri-Food Systems:
Trends, Driving Forces, and Implications for Developing Countries
Georg-August-University of Göttingen
GlobalFood Discussion Papers
No. 84
Protecting Health or Protecting Imports?
Evidence from EU Non-Tariff Barriers
Fatima Olanike Kareem Inmaculada Martinez-Zarzoso
Bernhard Brümmer
July 2016

Suggested Citation:
Kareem, F.O., I. Martinez-Zarzoso, B. Brümmer (2016). Protecting Health or Protecting
Imports? Evidence from EU Non-Tariff Barriers. GlobalFood Discussion Paper 84, University
of Göttingen. http://www.uni-goettingen.de/de/213486.html.

1
Protecting Health or Protecting Imports? Evidence from EU Non-Tariff
Barriers
Fatima Olanike Kareema
Inmaculada Martinez-Zarzosob
Bernhard Brümmerc
aCorresponding author, Research Associate, GlobalFood Research Training Group 1666, Heinrich Duker Weg 12,
37073 Goettingen, University of Goettingen, Germany. Email: [email protected] Phone: +49 152
185 44042
bProfessor, Department of Economics and Center for Statistics, University of Goettingen, Platz der Goettinger
Sieben 3, 37073 Goettingen, Germany and Institute of International Economics, University Jaume I, Spain. Email:
cProfessor, Department of Agricultural Economics, University of Goettingen, Platz der Goettinger Sieben 5, D-
37073 Goettingen, Germany.Email: [email protected]
Abstract
Non-tariff measures such as food safety standards are used to achieve the non-trade objective
of protecting consumers’ health and safety. However, they can also be used as a trade protection
tool to drive a price wedge between domestic and foreign producers. This study investigates the
protectionist intent of EU food safety standards using a sample of EU food imported from
African countries with a specific focus on tomatoes and citrus fruits. We formalize what
protectionism is by comparing EU standards to the internationally scientific referenced
benchmarks regulated jointly by both the Food and Agricultural Organization and the World
Health Organization. Our results show that the EU tomato sector is less dependent on imports
and is overprotected by more stringent standards relative to the international benchmarks.
Conversely, we find that the EU orange and lime and lemon sectors are heavily import
dependent and are under-protected relative to the international standards. These results largely
support the hypothesis that heavily import dependent sectors are less protected.
Keywords: Trade Protectionism, Non-tariff barriers, Food Safety Standards, Food exports
JEL Classifications: F13 F14 L15 P16 Q17 Q18

2
1 INTRODUCTION
Trade protectionism involving the deliberate use of government regulations to limit the
importation of goods and services from third countries has been a popular facet of international
trade. Prior to the General Agreement on Tariffs and Trade (GATT) and its subsequent
revisions, extensions, and rounds, protectionism has been attained with the use of overly high
tariffs on exported goods. However, as a results of the GATT1 agreement, this kind of
protectionism has lost its ground following a decrease in the use of tariffs and the consequent
rise of non-tariff measures (NTMs) by many countries who shift towards using them as trade
barriers (Baldwin, 1970). NTMs take many different forms ranging from traditional barriers,
such as quotas and subsidies, to more sophisticated and complex ones, including voluntary
sanitary and phyto-sanitary barriers, mandatory technical regulations, and minimum entry price
controls. However, protectionist intent is not usually glaring in NTMs as it often is with tariffs
since they are frequently less transparent than tariffs and are, at times, linked to non-trade policy
objectives2 such as consumer protection. Consequently, protectionist intent is more difficult to
detect. Such non-trade objectives include the legitimate concern for the welfare of the citizenry,
in which case the government is mandated to protect consumers’ health and the environment
by ascertaining that the NTMs guarantying a certain health and safety concern is observed.
However, such NTMs could also be used as a potential barrier to protect domestic producers
and drive out foreign producers by using stringent trade protectionism as a tool to drive a wedge
between domestic and foreign producers (Baldwin, 1970, 2000). This is the case with many
food products in which the government seeks to achieve a non-trade objective of maximizing
consumers’ health and safety, but at the same time sets much more stringent food safety
standards than would be required by international benchmarks. Indeed, the proliferation and
continuous use of some food safety standards as protectionist tools has been found to inhibit
the expansion of exports in global markets for many developing countries, particularly in Africa
(Otsuki et al., 2001; Shepherd and Wilson, 2013). Consequently, this may jeopardize the
developmental progress of the continent since deep trade integration is widely viewed as the
most promising avenue to achieving economic growth (Nicita and Rollo, 2015).
The protectionist use of NTMs and their implication for exporting countries is not yet
completely understood. Studies investigating if the use of NTMs has protectionist intent are
rare; this can be largely attributed to the difficulty of differentiating their non- trade policy
objectives from their trade policy objectives and a lack of a globally accepted benchmark for
doing this (Xiong and Beghin, 2014). Our study therefore contributes to the literature by
ascertaining the protectionist intent of NTMs with a specific focus on sanitary and physio-
sanitary standards. We posit that standards are a good case study given the fact that they are
primarily enacted due to a legitimate concern for consumers’ health and safety (the non-trade
objective). However, they can also be used as a protectionist tool by importing countries that
set overly restrictive standards so as to attain a certain level of protectionism (the trade
objective). This provides a basis for determining whether or not the chosen level of standards
1 GATT agreements and the subsequent post-war GATT rounds (such as the Uruguay and Tokyo rounds) and the need to substantially
reduce the pervasive protectionism of the 1930’s and expand world trade resulted into increased success in the reduction of visible tariff. Rivera-Batiz and Danyang (1992). 2Such non-trade objective includes achieving certain minimum health and safety level.

3
is indeed protective. Moreover, out of all NTMs, our interest in standards stems from the fact
that a significant share of traded food products are subject to standards regulated by many
importing countries and thus provide an important NTM to be studied.
While the World Trade Organization (WTO) agreements on sanitary and phyto-sanitary
measures (SPS) and technical barriers to trade (TBT) recommend that international standards
should be used, the agreements also recognize that countries could resort to the usage of
domestic standards provided they have scientific justification. This clause has been extensively
exploited to the advantage of many developed standard-setting countries to the extent that some
standards have generated a number of disputes, due to the accusation that they are being used
as disguised protectionism. For instance, there have been a significant number of disputes
among several OECD countries and a number of these have been brought to the WTO after its
dispute settling procedure was established in 1995 (Dee and Ferrantino, 2005).
Given that countries have a free hand to make standards that deviate from the international
norm, one may pronounce domestic standards that exceed the international socially optimal
benchmark with a non-trade objective as being overly stringent, suboptimal, perhaps
protectionist in nature, and therefore more trade distorting (Fisher and Serra, 2000; Grandal and
Shy, 2001; Marette and Beghin, 2010). Likewise, domestic standards that are lower than the
international socially optimal benchmark can be said to be less trade distorting or perhaps trade
enhancing, but also suboptimal and non-protectionist. However, empirical investigations of
trade effects of such ‘suboptimal standards’ are rare due to the difficulty of distinguishing
standards with legitimate intent from those with protectionist intent (Li and Beghin, 2014).
Thus, this study fills this research gap by estimating the protectionism extent of EU standards
relative to a globally acceptable benchmark and how this affects the potential of African food
exporters to establish trade relations with the European Union (EU). The closest measure in this
sense is that of Li and Beghin (2014), albeit still with significant differences. Firstly, the focus
of their study was on the United States rather than the EU. Secondly, their study utilized a cross-
section of minimum residual limits (MRLs) of pesticides and veterinary drug standards to
panels of trade flows. As a result, this study misses an important part of heterogeneity in
standards. We use the newly available time series from the EU database of MRLs to estimate
the impact on African exports. Our study is an improvement on previous literature in a number
of ways as we are able to control for unobserved heterogeneity with the use of panel data.
Furthermore, to our knowledge, this represents the first study of its kind on African exports.
We investigate the protectionist intent of EU food safety standards using a sample of EU food
imports from African countries with a specific focus on tomatoes and citrus fruits. These
products provide a good case study to analyse standard protectionism with an explicit focus on
African countries due to a number of reasons. First, the EU is the largest importer of these
products. As a consequence, this may spur interest groups to lobby the EU food standard setting
process so as to protect domestic consumers and their economies of scale, being a marginal
producer of tropical fruits. Second, the EU remains the top destination for many African
countries; top exporters of these products tend to originate from African countries due to the
favourable climatic conditions which give them a comparative advantage in the production of
these products. This has therefore necessitated our focus on African exporters. Third, these

4
products are an easy target for protectionist non-tariff barriers relating to standards concerns
due to their perishable nature and suitability for direct consumption.
This study is motivated by recent literature on firm heterogeneity which reveals that the growth
of developing countries’ trade was predominantly due to the expansion of trade along the
extensive margin rather than due to growth in the volume of trade (Reis and Farole, 2012; Nicita
and Roll, 2015). In spite of this assertion, we argue that the ability of developing countries to
initiate or penetrate new markets might be ultimately constrained by the stringent market
conditions of importing countries. Thus, the analysis of the impact of the aforementioned EU
market conditions in the food sector on Africa’s extensive margin is crucial to understanding
the process of entries and exits in the export markets and identifying which factor may be the
biggest constraint to Africa’s export competiveness. For instance, studies that look at the impact
of EU market conditions in the food sector on Africa’s exports have predominantly focused on
the intensive margin (Otsuki, et al., 2001; Grebrehewit et al., 2007). However, the implications
of EU food regulations have received less attention when it comes to market access at the
extensive margin of trade. Having a better understanding of the effects of this EU market access
conditions in the food sector and their effect on potential exporters is important from a policy
perspective.
The rest of the study is organized as follows: Section 2 briefly reviews the literature and also
presents a simple model of trade protectionism. In section 3, we describe the data and develop
a protectionist index of standards. Section 4 provides the empirical analysis. Section 5 discusses
the results and the final section concludes.
2.0 LITERATURE REVIEW
The literature on standards and international trade flows has primarily focused on examining
the effect of minimum quality standards and compatibility standards on trade flows (Grandal
and Shy, 2001; Otsuki et al., 2001; Disdier et al, 2008; Ferro et al., 2015; Fontagne´et al., 2015;
etc). However, recent contributions have examined how standards can be used as a tool of
regulatory protectionism. While the literature on the protectionist use of food safety standards
is scarce, there are a few theoretical works available in contrast to the very limited empirical
literature. On the theoretical side, early studies in this area have qualified protectionism to occur
when the welfare maximizing standards of the domestic country are higher than those of the
social planner, and vice versa for anti-protectionism. They demonstrated that domestic policy
makers set a number of standards in order to maximize both producer and consumer welfare
along with the welfare of some interest groups. These domestic standards are then compared to
a globally acceptable international standard that a social planner would have implemented,
seeking only to maximize social welfare inclusive of foreign profits (Fisher and Serra, 2000;
Marette and Beghin, 2010).
The major conclusion that emerges from these theoretical literature publications is that
standards are being used as tools of disguised protectionism to protect domestic producers from
competition (Anderson et al., 2004; Fischer and Serra, 2000; Sturm, 2006; Sheldon, 2012).
Nevertheless, extensive theoretical underpinning of some other authors has pointed to the fact

5
that standards are not necessarily protectionist, and might at times be anti-protectionist
(Maertens and Swinnen, 2007; Marette and Beghin, 2010; Swinnen and Vandemoortele, 2011;
Tian, 2003). However, the empirical validation of these theoretical predictions are rare, a gap
which this study attempts to fill. The divergent nature of these theoretical assertions indicates
the need for standards to be empirically analyzed product by product before ultimately
categorizing them as protectionist tools – an indication that empirical analyses are of paramount
importance.
2.1 The Political Economy of Government Standards
Theoretical studies on this issue usually rely on the famous protection for sales model that was
first developed by Grossman and Helpman (1994) to analyse the political economy of trade
protection. This political economy model allows for interest groups to influence a government’s
decisions and is essential to understanding the process of standard setting. Thus, to explain
standard protectionism, we also rely on a simple model of protection for sales to compare
government public standards with international standards.
2.1.1 The Protection for Sales Model
We draw from the Grossman and Helpman (1994) model of trade to provide a political economy
explanation for standard protectionism by the government. In the protection for sales model
(summarized here for expository purposes), we assume a two-country world with agricultural
trade interactions between a small food exporting country (foreign) and a large food importing
country (home). We assume that the former is a price taker and also standards taker as they have
limited resources to initiate the setting of standards. However, the latter is a standard setter and
imposes its standards on the small country’s food exports; this same set of standards is also
applied on domestic producers. Following Grossman and Helpman (1994), we restrict the set
of policy instruments available to the government to standards only. By setting the standards,
we assume that government care about protecting consumers’ health and safety, and so the
government’s main objective is to maximize social welfare.
Although by setting standards governments aim to maximize social welfare, this objective is
also being influenced by lobbyists (both producers and consumers) who seek to influence
government policies. Producer lobbyists look to achieve a desired level of protection for
domestic producers against international competition and consumer lobbyists aim to influence
government policy to receive higher quality or safety. As such, it is assumed that the
government cares about social welfare and wants to maximize social welfare but nevertheless
also cares about political contributions from these interest groups and consequently seeks to
maximize their welfare. Since government values both the weighted sum of the total level of
political contributions from the interest group and also the social well-being of the people, the
total government objective function is given as the summation of social welfare and
contributions from each of these lobbyist groups. The government objective function with
political economy concerns for the domestic interest groups is given below.
)()()( 21 sCasWasG p
Lp
G
0, 21 aa (1)

6
Here, 1a is the strength of the political effectiveness of the interest group(s) on a specific food
product p which they seek to lobby the government about; L is the set of the politically
organized sectors, S is the standard, 2a is the weight the government attaches to general welfare
GW . )(sCpis the political contribution by the organized food sector p. It is assumed that there
is truthfulness in the contribution such that the government is given higher contributions if the
standards stimulate higher producers’ surpluses, and vice versa. Maximizing the government
welfare function, the first order condition with respect to the standard gives the politically
optimal standards (s’):
0
)'()'(21
s
sCa
s
sWa
p
Lp
G
(2)
The politically optimal condition in equation (2) is posited to depend on the political
effectiveness of the lobby groups and the associated relative benefits of the standards for the
groups, the producers’ compliance costs, and consumers’ preferences. According to Swinnen
and Vandemoortele, (2012), these factors might increase or decrease the optimal standards as
exposited below. Firstly, ceteris paribus, a higher effectiveness leads to a higher standard if the
lobby group stands to gain from the imposition of a higher standard, and vice versa. Secondly,
higher compliance costs for domestic producers lead to lobbying for lower standards as
producers have incentives to give less lobby contributions to the government. Higher
compliance costs also imply larger prices which result in a lower consumer surplus and
increases lobbying for a lower standard. Higher compliance costs for foreign producers relative
to domestic producers may motivate producers to give more lobby contributions to the
government so as to achieve economies of scale and increased competition. Thirdly, a shift in
the consumers’ preferences for quality and safety can also lead to an implementation of a higher
standard by the government, and vice versa, assuming that the consumers are well-organized.
Alongside the government, we assume a social planner exists whose objective is solely to
maximize global social welfare. This, for instance, can be the case with international
organizations such as the Food and Agriculture Organization (FAO) and the World Health
Organization (WHO) who jointly make standards with the sole aim of maximizing international
social welfare and whose agenda is void of any protective motive. Likewise, the socially
optimal standards are obtained by the first order condition that maximizes social welfare.
0
*)(1
s
sWa
subject to 0*s (3)
Equation (3) thus gives a socially optimal standard(s*), which is the globally acceptable
benchmark. Similar to the analysis of tariff in the traditional trade model, the politically chosen
trade policy is also compared to the socially optimal trade policy in order to clarify what
protectionism is (Swinnen and Vandemoortele, 2011). The comparison is made on the basis of
equations (2) and (3). Here, the chosen government standard is said to be suboptimal when the
politically optimal standard is different from the socially optimal standards set by the social
planner in the international context. The divergence between these two standards is said to

7
depend on a number of factors including the political effectiveness of the lobby groups,
producers’ implementation costs, and consumers’ preference (Swinnen and Vandemoortele,
2011; 2012).
Interest groups may lobby either in favour of or against standards, subsequently increasing or
decreasing the politically optimal standard. In the EU, this is the case for organized retailers
who seek to influence the standard setting process. In recent times, (NGOs) such as ‘Friends of
the Earth Europe’, Greenpeace, Compassion in World Farming, Ecoropa, and Green League
have taken an interest in standard setting and implementation and, more generally, in the politics
of food; their influence is especially pervasive in the area of anti-genetically modified organism
and pro-organic food campaigns. Thus, on the one hand, lobby groups can lobby for the increase
in stringency and proliferation of standards, thereby making the politically optimal standards
rise above the socially optimal standards that would be implemented by a social planner - the
case of over-standardization. On the other hand, producers can also lobby for negative
protection and the reduction of standards such that the politically optimal standards might fall
below the socially optimal standards – a case of under-standardization. In other words, two
suboptimal cases may occur when the socially optimal is less than or greater than the politically
optimal standards, which describes over- and under- standardization respectively.
On the one hand, interest groups (producers) might lobby for over-standardization if their cost
of complying with the standards is relatively low, and they want to enjoy economies of scale
and increase the foreign producers’ cost of complying with standards, thereby giving them
diseconomies of scale. A higher effectiveness of consumer’s interest groups might also result
in over-standardization if they value the quality of the product. On the other hand, domestic
producers might lobby for under-standardization or a reduction in standardization if the
standards are too costly to comply with for them. In addition, for net importers and heavily
depend on foreign exported goods for production inputs, their relative preference to the
producer lobbyist groups to lobby the government for a higher standard might be weaker,
depending on the consumers’ preference for safety and quality.
The protection for sales model thus yields three straightforward implications and testable
predictions. (1) The politically optimal standards might coincide with the socially optimal
standards when all lobby groups can attain their maximum surplus income at the social
optimum. In this case, optimality implies that exporters would not be hurt when politically
optimal standards are equal to socially optimal standards, even if the latter are trade enhancing
or trade inhibiting. (2) Under-standardization: for cases in which the politically optimal
standards are higher than the socially optimal set, both domestic and foreign producers benefit
from this under-standardization. The negative impacts of standards on trade are reduced such
that the level of protection will be directly related to the value of exports. Thus, although under-
standardization is suboptimal, it is not protectionist from this point of view. (3) Over-
standardization: for cases in which the politically optimal standards are higher than the socially
optimal set. The higher the level of over-standardization, the harder it becomes for exporters
particularly those from “small countries" to comply with the importing country’s standards.
Thus, in the case of a small country, over-standardization will distort trade and give rise to a

8
higher surplus income for domestic producers while foreign producers lose out. As a result, for
protected industries (if the sector or good is protected), then the level of protection will be
inversely related to the export value.
3 Data and Descriptive Statistics
In this section, we provide a protectionism index of EU standards alongside some descriptive
statistics of EU pesticide standards vis à vis those set by the Codex Alimentarius Commission.
In addition, we provide an insight into the structure of EU production and trade for each of the
three products considered in this study with a view to understanding the need to protect or not
protect the sector.
3.3.1 Measuring Protectionism – a Protectionism Index of Standards
In this paper, our measure of standards is based on quantifiable pesticide standards regulated
by the importing countries; the standards are represented in the form of a maximum residual
level (MRL) of pesticides that is scientifically permitted for consumption. To avoid using
standards as a protectionist tool, the WTO obliged its members to employ internationally
scientific based standards, such as the Codex3 Alimentarious Commission (hereafter Codex)
standards, wherever possible. We define protectionism as the fraction of a country’s standards
that are more stringent than the standards internationally recognized by the WTO. Following
Li and Beghin (2014), using MRLs of pesticides standards, we formalize what protectionism is
by developing an index of protectionism which we define as the differences in the stringency
of a country’s standards to internationally acceptable science based standards. Thus, our
measure of protectionism is constructed by measuring the differences in EU standards against
an international benchmark. One may pronounce standards that exceed the internationally
accepted set as being overly stringent, ‘excessive standards’, and protectionist in nature and
therefore more trade distorting.
We employ Codex standards as the ‘socially optimal’ scientifically based benchmark. We
developed a simple criterion for protectionism: EU pesticide standards that exceed those set by
Codex are taken to be protectionist, while those that are laxer than those set by Codex are
defined to be anti-protectionist. Our product level protectionism index for pesticide standards
is given as:
n
k MRL
MRLMRL
ijkt
ikt
iktikt
Codex
EUCodex
nP
1
exp1
(4)
Here,ijkrP measures the extent of protectionism of pesticide standards aggregated over pesticide
k, imposed on country j exports at time t; iktMRLEU denotes the maximum residual limits of EU
pesticide standards at time t;iktMRLCodex is the maximum residual limit of the international
scientific reference pesticide standard at time t. The upper part of the index,
3The Codex Alimentarius Commission (CAC) is a joint Food and Agriculture Organization and World Health Organization commission.
Codex is established to develop internationally standards using scientific knowledge, with the aim of protecting consumers’ health and the environment as well as avoiding unnecessary obstacle to trade.

9
iktikt MRLMRL EUCodex , measures the protectionism of the standard; it was thereafter scaled by
Codex standards so as to make the index invariant to differences in pesticide limits between the
EU and Codex.
Equation (4) results in an index that is lower and upper bounded by zero and 718.2e ,
respectively, with the index normalized at one when both EU and Codex standards are the same.
The lower the EU MRL standards (and the higher the stringency) are relative to the international
Codex standards, the higher the index. The higher the EU standards (and the lower the
stringency) are relative to the international Codex standards, the lower the index. In other
words, the index is normalized at one when both EU and Codex standards are the same,
describing the equilibrium condition; an index above one indicates more stringent EU standards
relative to those of Codex and describes protectionism; finally, an index below one indicates
lower stringency of EU standards relative to those of Codex – anti-protectionism. Thus, the
higher the index is, the higher its stringency, and the harder it becomes for exporters to comply
with EU standards relative to Codex standards; this consequently implies lower exports and
vice versa. As a result, the coefficient on the protectionism index is expected to be negative if
the EU pesticide standards are protectionist relative to those of Codex, and vice versa.
There are some issues that were encountered when working with both the EU and Codex
pesticide standards. The foremost issue is that of unestablished pesticide standards. Appendix
III of EU Directive 396/2005 stipulates that a default MRL of 0.01 should be applied to products
for which no pesticide standards are established. So, we substitute this default MRL value for
non-established pesticide standards in the EU. Codex also has some rare cases where certain
pesticides who were not initially given an MRL value were later assigned one in later years. As
a result, we are faced with the problem of missing MRLs; this is exacerbated by the fact that
Codex does not use a default MRL value. In order to solve this issue, we posit that African
countries exporting to the EU still have to face EU default standards even when the EU uses
standards set by Codex. We therefore substitute these missing values with default EU values.
Fortunately, such cases are rare and we concur that they will not significantly distort our results.
A second issue is that Codex has only established rules on a subset of standards that are
regulated by the EU. For example, in 2013 it established about 72 pesticide standards on
tomatoes which is in stark contrast to the EU which established around 462 standards in the
same period. To solve this issue when calculating the protectionism index, we were forced to
consider only pesticide standards that are regulated by both the EU and Codex. This is done to
allow us to produce a consistent list of pesticides regulated by both bodies and allow for ease
of comparison of their MRLs. We keep this caveat in mind when interpreting our results.
3.2 Overview of EU and FAO/WHO Pesticide Safety Standards
Standards on pesticides are specified in terms of maximum residual limits (MRL) and the
intensity and stringency of the standard is provided by the maximum residual limit of the
pesticide on or in food. The stringency of pesticide standards is measured in parts per million
(indexed as mg/kg). The higher the MRL, the lower the stringency of the pesticide standard,
and a decrease in the MRL signals an increase in its stringency level. The EU coverage of

10
regulated pesticides is high in contrast to Codex who only establish rules on a subset of
standards regulated by the EU. So, for ease of comparison, we limited ourselves to only consider
the pesticide standards that are regulated by both the EU and Codex. Figures 1, 2, and 3 display
the average stringency levels of the subsets of pesticides regulated by the EU and Codex
between 2008 and 2013 based on the index formulated in equation (4).
Figure 1: Tomatoes MRLs Figure: Oranges MRLs
Source: Europa and Codex Databases Source: Europa and Codex
Figure 3: Lime and Lemon MRLs Figure 4: Trend in Protectionism Index
Source: Europa and Codex Databases Source: Author’s Computation
0.0
0.5
1.0
1.5
2.0
2.5
200820092010201120122013
MR
Ls o
f P
est
icid
es
Years
EUToma CodexToma
0.0
0.5
1.0
1.5
2.0
2.5
3.0
3.5
2008 2009 2010 2011 2012 2013
MR
Ls o
f P
est
icid
es
Years
EU Codex
0.0
1.0
2.0
3.0
4.0
2008 2009 2010 2011 2012 2013
Axi
s Ti
tle
Years
EU Codex
0.0
0.2
0.4
0.6
0.8
1.0
1.2
1.4
1.6
2008 2009 2010 2011 2012 2013
Pro
tect
ion
ism
Ind
ex
Years
Tomatoes OrangesLime and Lemon

11
In the case of tomatoes, Figure 1 shows that the regulated MRL of EU standards is consistently
below those of Codex for all years, indicating that the EU set lower (stricter) pesticide standards
on tomatoes relative to the international benchmark set by Codex. This is an indication of over-
standardization and protective standards relative to the international standards. However, in the
case of oranges, and limes and lemons, as shown in Figures 2 and 3, the EU standards are only
more stringent than those of Codex in 2011 and 2013. There is a significant presence of under-
standardization as the stringency is below that of Codex in the other years. In other words, there
are indications of protectionism in 2011 and 2013 and anti-protectionism in other years. Thus,
the overall impact is an empirical one.
Finally, in Figure 4, we depict the protectionism index as formulated in equation (1). As noted
earlier, the index is bounded between 0 and 0.278 with an index above one indicating more
stringent EU standards relative to those of Codex; an index below one indicates lower
stringency of EU standards relative to those of Codex. Clearly, for both oranges, and limes and
lemons, the index always lies below one with the exception of 2013, indicating evidence of
anti-protectionism for all years apart from 2013. However, in the case of tomatoes, the index
lies above the one for all years which might be an indication of protectionism. Whether or not
these assertions are true will be empirically ascertained in the next sections.
3.3 Structure of EU Production and Trade in the Selected Products.
The EU is an important importer of fresh fruits and vegetables. It is a net exporter, recording a
constant trade deficit in fresh and processed fruits and vegetables since 1999 with the deficit
increasing from a value of 8.7 billion euros in 1999 to 11.9 billion in 2011 (EC, 2014). However,
trade balance is revealed to be worsening in the fruit sector while it is more or less constant and,
at times, slightly improving in the vegetable and processed fruit sectors. This deficit is due to
the growth of imports which are uncompensated by EU exports due to the fact that the EU is a
marginal producer of tropical fruits and vegetables.
Tables 1 and 2 show the trend in the production and trade of the products focused on in this
study. With regard to citrus, there is a high reliance on imports due to the fact that citrus fruit
production in the EU is restricted by unfavourable climatic conditions. However, the vast
volume of citrus fruit production originates in Spain, amounting to around 59.8% (EC, 2014).
In terms of composition, citrus, particularly oranges constitute a top import product for the EU
with the top exporters being South Africa, Egypt, and Morroco. South Africa is one of the major
suppliers of oranges to the EU, supplying the EU market from June until October when the
harvest starts in the Northern Hemisphere (Gain, 2015). However, in 2014, there was an 11.5%
decrease in imports from South Africa since May 27, 2014. This followed the European
Commission’s (EC) increased control measures on South Africa’s citrus imports due to the
perceived health risks relating to black spot diseases by the European EC. This resulted in
decreased orange imports from South Africa. On the side of production, Table 2 shows that
between 2008 and 2013, a yearly average of around 6629.8 thousand tonnes of oranges were
produced, with Spain, Italy, and Greece accounting for about 96% of the total production with
a share of 46.7, 36.4% and 13.2% respectively (Table 1). During this period, 4% of production
was exported to third countries amounting to around 933 million euros; meanwhile the total
import cumulated to a value of about 3007.1 million euro.

12
Table 1: Structure of Production of the Selected EU Products, averaged 2008 to 2013
Oranges Limes and Lemons Tomatoes
Tonnes
(‘000)
Share in
EU (%)
Tonnes
(‘000)
Share in
EU (%)
Tonnes
(‘000)
Share in
EU (%)
Belgium 0.0 0.0 0.0 0.0 231.0 1.5
Bulgaria 0.0 0.0 0.0 0.0 111.3 0.7
Czech Republic 0.0 0.0 0.0 0.0 11.5 0.1
Denmark 0.0 0.0 0.0 0.0 9.0 0.1
Germany 0.0 0.0 0.0 0.0 68.7 0.5
Estonia 0.0 0.0 0.0 0.0 1.2 0.0
Ireland 0.0 0.0 0.0 0.0 3.1 0.0
Greece 878.4 13.2 48.3 3.9 1275.0 8.5
Spain 3098.2 46.7 712.2 57.0 4099.5 27.3
France 3.3 0.1 2.8 0.2 651.2 4.3
Croatia 0.3 0.0 0.0 0.0 20.7 0.1
Italy 2410.6 36.4 458.7 36.7 5800.7 38.6
Cyprus 35.9 0.5 12.9 1.0 18.1 0.1
Latvia 0.0 0.0 0.0 0.0 3.6 0.0
Lithuania 0.0 0.0 0.0 0.0 9.0 0.1
Luxembourg 0.0 0.0 0.0 0.0 0.1 0.0
Hungary 0.0 0.0 0.0 0.0 156.8 1.0
Malta 1.2 0.0 0.5 0.0 13.2 0.1
Netherlands 0.0 0.0 0.0 0.0 795.0 5.3
Austria 0.0 0.0 0.0 0.0 47.3 0.3
Poland 0.0 0.0 0.0 0.0 500.9 3.3
Portugal 201.8 3.0 12.9 1.0 638.1 4.2
Romania 0.0 0.0 0.0 0.0 495.7 3.3
Slovenia 0.0 0.0 0.0 0.0 4.3 0.0
Slovakia 0.0 0.0 0.0 0.0 18.3 0.1
Finland 0.0 0.0 0.0 0.0 39.2 0.3
Sweden 0.0 0.0 0.0 0.0 7.5 0.0
United Kingdom 0.0 0.0 0.0 0.0 0.0 0.0
EU 28 6629.8 100.0 1248.4 100.0 15030.0 100.0
Source: Eurostat
Similar trends also occur for limes and lemons. Between 2008 and 2013, yearly production of
limes and lemons totalled an average of 1248.4 thousand tonnes (Table 2) with 96% of total
production concentrated in Spain (57%), Italy (36.7%) and Greece (3.9%). 5.7% of the total
production of limes and lemons were exported to extra EU countries, representing a yearly
value of 59.7 million Euros. Meanwhile, imports were relatively higher at a yearly average
value of 380.3 million Euros, amounting to an average yearly trade deficit of 320.6 million
Euros. The scenarios for both limes and lemons, and oranges two products depict the EU as a
net importer with a significant trade deficit in each product as the EU relies extensively on
imports to satisfy domestic demand. Thus, our hypothesis is that the sector might be less
protected. In other words, the EU’s heavy dependence on third countries for domestic
consumption might undermine the relative influence of lobbyists on the government, and or
prompt the government to lower its standards and allow more imports.

13
Table 2: Structure of Trade with Extra EU countries, 2008 to 2013
Oranges Limes & Lemons Tomatoes
Sum Average Sum Average Sum Average
Production (‘000 tons) 39778.7 6629.8 7490.2 1248.4 90179.
8
15,030
Volume Exported (‘000 tons) 1590.1 256.0 426.1 71.0 1364.1 227.3
% of Production Exported 4.0 4.0 5.69 5.69 1.5 1.5
Imports (Value million EUR) 3007.1 501.2 2282.1 380.3 2247.3 374.5
Exports (Value million EUR) 933.0 155.5 358.4 59.7 1668.3 278.0
Trade Balance (Value million
EUR)
2074.1 345.7 1923.7 320.6 579 96.5
Source: Eurostat
The case of tomatoes is somewhat different. It remains the EU’s top imported vegetable,
constituting the highest share of its fresh vegetables imports, amounting to around one fifth of
its vegetable imports (EC, 2014). The EU exports of fresh vegetables is also dominated by
tomatoes, however, this is not enough to achieve a trade balance. According to the Eurostat
data, major exporters to the EU are Morocco and Egypt, with Morocco supplying about 80%
of EU imports of the product. Unlike citrus products which are mainly tropical fruits, tomatoes
are cultivated en masse by some Southern EU countries due to the favorable weather conditions.
This is complemented by production from all season greenhouses in countries such as Belgium
and the Netherlands, reducing an overreliance on imports in contrast to what that seen in the
cases of oranges, and limes and lemons. The total production between 2008 and 2013 amounts
to 90179 thousand tones with major producers accounting for 91% of production; major
producing countries include Italy (38.6%), Spain (27.3), Greece (8.5%), France (4.3%), the
Netherlands (5.3%), Portugal (4.2%), and Romania (3.3%). Tomato production is more than
twice as large as both orange production, and lime and lemon production with only 1.5% of it
being exported and the rest being consumed domestically. The huge domestic production of
tomatoes relative to the other citrus products reduces the need for excessive imports and might
explain why the sectors’ total trade deficit between 2008 and 2013 of 579 million Euros is far
below the deficits for oranges and limes and lemons of 2074 and 1923 million Euros,
respectively.
Thus, unlike citrus, the EU is not overdependent on imports to satisfy tomato consumption; as
a result, they may yield more to lobbyists who seeks to influence the EC to set stringent
standards so as to increase exporters’ implementation costs and therefore erode their market
competitiveness. However, in the case of food safety standards, it is not clear if stringent MRLs
set by the EU since 2008 are influenced by lobbyists due to the difficulty of differentiating
standards’ trade and non-trade objectives. Thus, a testable hypothesis in this study is that
protectionism decreases or vanishes altogether with overdependence on imports and vice versa.
In other words, for products where the EU heavily (lightly) depends on foreign exported goods
for its domestic consumption, under-standardization (over-standardization) can result as the
relative influence of lobbyist groups may be weaker (stronger). Thus, we hypothesized that the
two selected citrus fruit sectors are under protected due to the heavy import dependence; the

14
tomato sector is hypothesized to be over-protected due to relatively less reliance on imports.
4 EMPIRICAL ANALYSIS
To investigate the protectionist intent of EU food safety standards, we employ the gravity model
of trade which predicts that bilateral export between two countries is explained by exporters’
and importers’ economic masses; which are a proxy for their income and geographical distance
between the country-pairs as well as some trade factors that increase or inhibit trade (Pöyhönen,
1962; Anderson, 1979; Anderson and Wincoop, 2003).
4.1 Model Specification
Our empirical strategy is to measure the extent of using standards as a protectionist tool on the
probability to export to the EU. The theoretical model for our analysis is based on firm
heterogeneity behavior; this shows that due to the heterogeneous behavior of firms, a small
fraction of firms finds it profitable to export while others choose not to as they are less
productive (Melitz, 2003; Helpman et al., 2008). Thus, this makes the trade matrix contain both
positive and zero trade flows. The intuition is that EU market conditions on food might affect
the probability of African countries exporting to the EU, with productive firms exporting and
non-productive firms choosing not to export. Our empirical strategy is therefore to measure the
effect of EU food regulations on Africa’s probability to export. Our model is similar to that of
Nicita and Rollo (2015) which analyzed the impact of tariffs on the extensive margin of trade
for sub-Saharan exports. Similarly, we employ a probabilistic model to explore the implications
of the EU entry price system and food safety standards on the probability of exporting.
Moreover, our bilateral export data contain many zeros, thus allowing us to exploit the presence
of zero trade flows along the extensive margin. A probit model is specified in log-linear form
as follows:
)ln
_lnln()|1(
7654
3210
ijtijtijijijt
ijtjtitijtijtijt
RTALamgDistPM
StatusInitialYYxTP
(5)
Equation (5) is a probabilistic model which determines the binary decision of whether to trade
or not. The subscripts tji ,, denote exporter, importer and time respectively, while ln is the
logarithm. The dependent variable ij is the probability that country i exports to country j ,
conditional on the observed variables; ijtT is a binary variable which is equal to one if country
i exports to country j )1( ijtT and zero when it does not )0( ijtT , where itY and jtY are the
exporting and importing countries’ nominal GDP respectively, measured in US dollars and
obtained from the World Bank’s World Development Indicators (WDI) . ijtPM describes the
average MRLs capturing the extent of protectionism of EU standards relative to Codex
standards; this information was obtained from the Europa and Codex Alimentarius Commission
websites which estimate separately for tomato, lime and lemon, and orange exports at the 6
digit Harmonized System (HS) level. ijDist is the geographical distance between countries i and
j, obtained from the Centre d’Etudes Prospectives et d’Informations Internationales (CEPII)

15
database. Lang, Col, and RTA are dummy variables that take the value of one when the
exporting and importing countries share a common language, have colonial ties, or belong to
similar trade agreement arrangements, respectively, they take a value of zero otherwise; ijt is
the idiosyncratic error term which is assumed to be well-behaved. Similar to Nicita and Rollo
(2015), we include a proxy of initial export status of the product (initial_status) which is a
dummy given the value of one when the export product was successfully exported in the initial
period of 2008 (the start of the harmonization of EU food regulations), and zero otherwise. The
intuition is that products already exported in the year 2008 have a high probability of being
exported in subsequent years. The list of countries included in the analysis is provided in the
appendix.
To obtain consistent estimates, we also control for multilateral trade resistance terms,
theoretically modelled by Anderson and van Wincoop (2003), using the Baier and Bergstrand4
(2010) first order Taylor series approximation of bilateral trade costs using simple averages.
For each trade cost variable, the first order Taylor series is expanded and all the newly
demeaned bilateral trade cost variables are transformed using the following approximation:
N
j
N
j
ijt
N
i
ijtijtPPijt xN
xN
xxji
1 112
1
2
11)(
(6)
Where ji PP is the MRT, ji PxP is the contribution of x to ji PP , N is the number of bilateral
observations on exports, and x stands for any of the variables associated with coefficients 3
to 7 in equation (5). The first term on the right hand side is the simple average of gross trade
costs facing exporter i across all importers j . The second term on the right hand side denotes
the simple average of all trade costs faced by importer j across all exporters.
4.5 RESULTS AND DISCUSSION
Table 3 presents the marginal effects of the probability of exporting to the EU. For all products,
each gravity variable has the expected sign with the exception of language which is not
statistically significant for tomato exports. Sharing the same language and membership in
regional trade agreements with the EU increases Africa’s exports at the extensive margin; while
physical distance – a proxy of trade costs - inhibits export potential. In addition, for all products,
our results point out that the decision whether or not to export to the EU largely depends on if
the product was already exported in the initial period (initial_status). In other words, products
already exported in 2008 have a high probability of being exported in subsequent years, whether
or not the standard is overprotective.
Our variable of interest – which measures the protectionism of pesticide standards, is differently
signed across products indicating that the decision to protect a product can be product specific.
In the case of tomato exports, the coefficient on protectionism index is negative and statistically
significant; this points to the evidence that EU pesticide standards on tomatoes are actually
4Their approach also produces estimates similar to the Anderson and van Wincoop (2003) structurally iterated least squares method.

16
protectionist as they are more stringent than the international benchmark stipulated by Codex.
In essence, the negative coefficient reinforces the fact that they have demand inhibiting effects
on potential African exporters, preventing them from establishing trade relationships with the
EU and from taking advantage of the preferential access the EU is usually granted to Africa’s
exports. Thus, the EU might have set very stringent and low pesticide residue limits on tomatoes
due to lobbying from consumer groups in a bid to safeguard consumers who do not want to buy
organic varieties.
Table 3: Protectionist Extent of EU Standards Relative to International Benchmarks
(1) (2) (3)
VARIABLES Tomatoes Limes and Lemons Oranges
Exporter GDP 0.179* 0.282** 0.112
0.101 0.110 0.091
Importer GDP 0.270** 0.660*** 0.621***
0.131 0.203 0.128
Protectionism Measure -1.720*** 0.750*** 0.464**
0.545 0.188 0.181
Initial_Status 1.004*** 0.514** 0.556***
0.247 0.252 0.185
Distance -3.881** -2.980** -3.219***
1.593 1.395 0.908
Language 2.207*** 2.354*** 3.689***
0.717 0.804 0.632
RTA 6.434*** 0.966 1.509**
2.351 1.208 0.593
Constant -14.525*** -27.756*** -21.369***
4.010 5.669 4.438
AIC 585.955 551.224 668.921
BIC 631.584 597.388 713.529
Observations 1176 1248 1050 *** p<0.01, ** p<0.05, * p<0.1 clustered robust standard errors in parentheses, clustered by importer, exporter and year
While the tomato sector is relatively less import dependent and is revealed to be over-protected,
the case for oranges and limes and lemons is somewhat different. The coefficients on the
protectionism index are positive and significant, denoting that EU standards do not have
protectionist intent. These EU standards have a demand enhancing effect; they are capable of
stimulating new trade relations with the potential to enhance trade for new and potential African
exporters targeting EU markets. Given the set of Codex standards considered in this study, the
corresponding EU standards seem to be less stringent relative to those regulated by Codex.
Thus, for these two products, EU pesticide regulations represent legitimate concerns for
consumers’ health and safety and do not necessarily imply protectionism against imports.
Similar results were reported by Xiong and Beghin, (2014) for US standards. One important
explanation for this result was provided by Marette and Beghin (2010) who posited that such
anti-protectionism behavior might occur if producers and exporters from exporting countries
are more cost efficient in complying with standards than domestic producers. However, in the
case of African countries, this explanation is less tenable as many of them cannot meet selected
standards set by the EU due to a lack of financial, technical and qualified labor (Henson and

17
Wilson, 2005). A much more reasonable explanation for this result is that domestic
policymakers in the EU may choose a relatively lower standard than an international social
planner; this could serve to explain in part the observed results. For instance, compared to
tomatoes, the EU are heavily dependent on third countries’ citrus fruits for domestic
consumption and processing. Due to the large numbers of imports and heavy dependence on
foreign exported citrus for domestic juice production, the relative influence of lobbyists might
be weaker on the government such that the government might be prompted to lower standards
to allow more imports.
Thus, our results support the hypothesis that protectionism decreases or altogether vanishes
with overdependence on imports and vice versa. In other words, unlike tomatoes, the EU does
not have comparative advantage in the production of citrus due to unfavorable weather
conditions; instead they depend heavily on imports to satisfy the domestic consumption of these
fruits and thus, might be less yielding to lobbyists who seek to influence the EC to set stringent
standards. This might even give rise to under-standardization in order to allow more imports.
As a further step, we investigate the assertions that many developed countries resorted to using
protectionist NTMs both during and after the financial crisis (Bown, 2011; Datt et al., 2011;
OECD, 2010). Thus, to ascertain if this is true in the case of standards, we have split our dataset
into the crisis period (2008 to 2009) and the post-crisis period (2010 to 2013). Table 4 presents
the estimates from both the financial and post-financial crisis periods. For the financial period,
our estimated results as reported in the first three columns of Table 4 refute the claim that
standards on tomatoes and two selected citrus fruits were used as protectionist tools during the
financial crisis. Indeed, the positive coefficients on the protectionism index indicate that more
of these export products have been allowed access into the EU market during the financial crisis.
This result supports that of the WTO report of 2009 which finds that none of its Member states
have retreated into the widespread use of trade protectionism or trade restrictions; furthermore,
there was no evidence of any significant occurrences of trade retaliation (WTO, 2009) during
the global financial crisis. However, during the period of the post-financial crisis, the last three
columns of Table 4 show the estimates of the protectionism measure to be negatively signed,
inferring that food safety standards were more protective in the post financial period.
Table 4: Extent of Protectionism during and after the 2008/2009 Financial Crisis.
Crisis Period Post Crisis Period
Tomatoes Limes
and
Lemons
Oranges Tomatoes Limes
and
Lemons
Oranges
(1) (2) (3) (5) (6) (7)
Exporter GDP 0.051 0.508* -0.028 0.118 0.269** 0.076
(0.294) (0.268) (0.137) (0.101) (0.117) (0.097)
Importer GDP -0.067 1.179*** 0.680*** 0.298** 0.786*** 0.668***
(0.248) (0.455) (0.256) (0.141) (0.268) (0.150)
Protectionism
Measure
4.165 11.153*** 4.636* -1.741*** 0.563*** 0.173
(2.769) (3.395) (2.480) (0.533) (0.218) (0.196)
Initial_Status 4.769*** 3.981*** 2.996*** 0.443 -0.237 -0.103
18
(1.463) (0.361) (0.647) (0.289) (0.352) (0.254)
Distance -7.726 -4.856** -3.886** -4.352** -4.749* -3.490***
(4.954) (2.021) (1.658) (1.720) (2.737) (0.935)
Language 7.103 2.931* 4.683*** 2.024*** 2.925*** 3.851***
(4.625) (1.599) (1.286) (0.708) (1.105) (0.721)
RTA 0.104 -0.053 -0.011 -4.277 3.277* 4.507
(0.640) (1.601) (0.575) (3.892) (1.934) (6.451)
Constant -5.694 -47.358*** -19.974** -13.354*** -31.530*** -21.724***
(5.764) (11.127) (8.052) (4.000) (7.852) (4.992)
AIC 157.364 160.647 208.740 472.893 424.425 504.660
BIC 193.105 196.924 243.462 514.873 466.939 545.620
Observations 392 416 350 784 832 700 Clustered robust standard errors are in brackets and * p<0.10; ** p<0.05; *** p<0.01
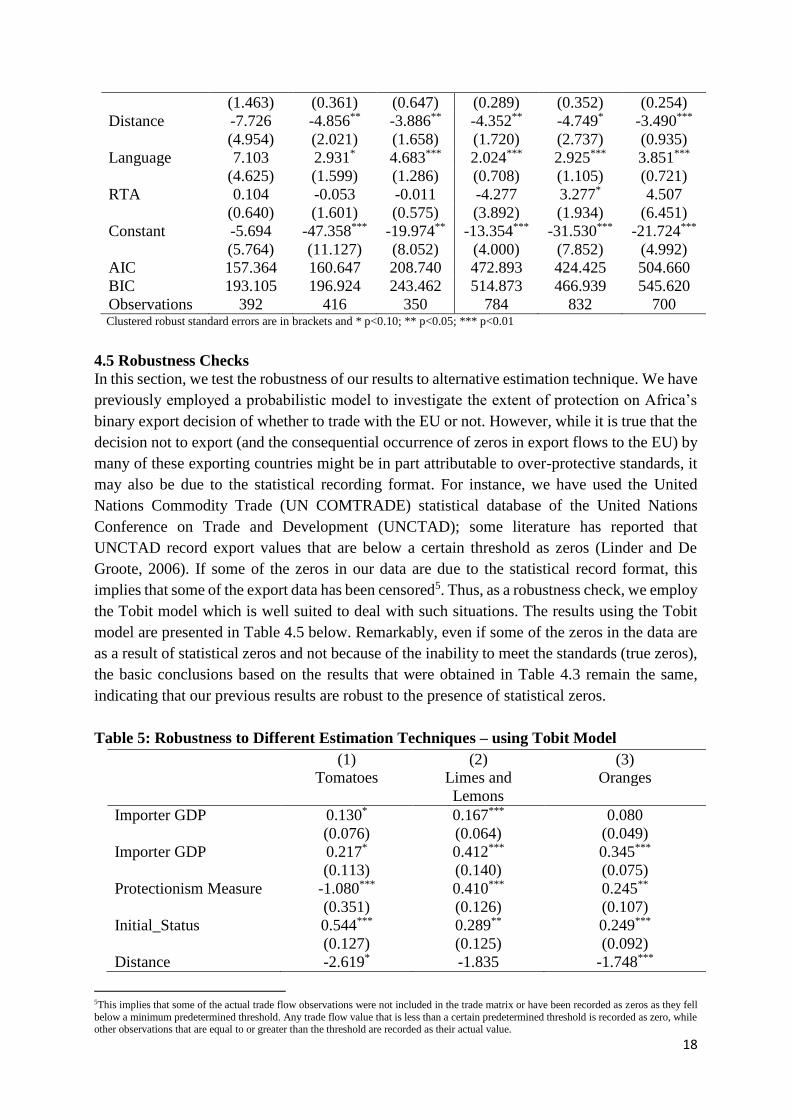
4.5 Robustness Checks
In this section, we test the robustness of our results to alternative estimation technique. We have
previously employed a probabilistic model to investigate the extent of protection on Africa’s
binary export decision of whether to trade with the EU or not. However, while it is true that the
decision not to export (and the consequential occurrence of zeros in export flows to the EU) by
many of these exporting countries might be in part attributable to over-protective standards, it
may also be due to the statistical recording format. For instance, we have used the United
Nations Commodity Trade (UN COMTRADE) statistical database of the United Nations
Conference on Trade and Development (UNCTAD); some literature has reported that
UNCTAD record export values that are below a certain threshold as zeros (Linder and De
Groote, 2006). If some of the zeros in our data are due to the statistical record format, this
implies that some of the export data has been censored5. Thus, as a robustness check, we employ
the Tobit model which is well suited to deal with such situations. The results using the Tobit
model are presented in Table 4.5 below. Remarkably, even if some of the zeros in the data are
as a result of statistical zeros and not because of the inability to meet the standards (true zeros),
the basic conclusions based on the results that were obtained in Table 4.3 remain the same,
indicating that our previous results are robust to the presence of statistical zeros.
Table 5: Robustness to Different Estimation Techniques – using Tobit Model
(1) (2) (3)
Tomatoes Limes and
Lemons
Oranges
Importer GDP 0.130* 0.167*** 0.080
(0.076) (0.064) (0.049)
Importer GDP 0.217* 0.412*** 0.345***
(0.113) (0.140) (0.075)
Protectionism Measure -1.080*** 0.410*** 0.245**
(0.351) (0.126) (0.107)
Initial_Status 0.544*** 0.289** 0.249***
(0.127) (0.125) (0.092)
Distance -2.619* -1.835 -1.748***
5This implies that some of the actual trade flow observations were not included in the trade matrix or have been recorded as zeros as they fell
below a minimum predetermined threshold. Any trade flow value that is less than a certain predetermined threshold is recorded as zero, while other observations that are equal to or greater than the threshold are recorded as their actual value.

19
(1.374) (1.184) (0.664)
Language 1.375*** 1.427*** 1.875***
(0.457) (0.516) (0.239)
RTA 5.732*** 0.590 0.560
(1.720) (1.812) (1.345)
Constant -10.970*** -17.087*** -12.275***
(3.455) (3.553) (2.416)
AIC 855.295 816.519 1050.102
BIC 905.994 867.812 1099.668
Observations 1176 1248 1050 Clustered robust standard errors are in brackets and * p<0.10; ** p<0.05; *** p<0.
5 CONCLUSION
This study provided some of the first empirical evidence on the extent of protectionist intent of
EU standards relative to Codex standards which serve as the international benchmark
recommended by the WHO and FAO. Using a sample of African countries, EU tomato
standards are found to exhibit protectionist tendencies as they are more stringent than their
Codex counterpart. However, in the case of oranges, and limes and lemons, these fruits exhibit
anti-protectionist tendencies on firms’ decisions to export; this points to the indication that EU
pesticide regulations may be aimed solely at addressing legitimate concerns for human health
and safety and do not necessarily address protectionist concerns. Our results show that tomatoes
represent a relatively less import dependent sector which is over-protected; meanwhile oranges
and limes and lemons represent a heavily import dependent sector which is under-protected.
Thus, our results support the hypothesis that protectionism vanishes with overdependence on
imports and vice versa. The implication of our findings highlights the fact that importing
countries’ standards are not always protectionist and can at times be anti-protectionist relative
to internationally acceptable standards. In other words, standards are not necessarily always
problematic or protectionist as widely portrayed in the literature. The protectionist intent of a
standard is product specific, indicating that the decision is either based on a will to protect
health or is sector specific.
Despite the fact that the EU sets one of the strictest collection of standards in the world and
international standards like Codex have been posited as those that maximize global social
welfare, EU standards are not always the more stringent of the two nor is it always the case that
they are trade inhibiting. Thus, a caveat is worth mentioning: although we found international
standards to at times have a weaker trade enhancing effect than domestic standards, this is not
to say that countries should refrain from the usage of globally acceptable standards as
recommended by the WTO. Clearly more research is needed in this direction with extensions
to other product lines and importing countries.
Conclusively, from a policy point of view, an important policy implication of our findings is
that overly protective standards can have huge trade inhibiting effects on developing countries.
Although many African countries are in RTAs with the EU, standards make market access
penetration conditional, as most of the existing RTAs are negotiated on the basis of reduced
tariffs and not on the transfer of technical or financial resources to increase conformity to
standards. Thus, increased capacity building and transfer of technology would be a welcome

20
policy if the numerous RTAs that the EU has with Africa are to help in achieving the continent’s
developmental goals. Consequently, even if standards are used as a protectionist tool, the effect
might be dampened for these countries.
REFERENCES
Anderson, J. (1979). A theoretical foundation for the gravity equation. The American Economic
Review, 69(1), 106-116.
Anderson, J., and Van Wincoop, E. (2003). Gravity with gravitas: A solution to the border
puzzle. American Economic Review, 93(1), 170 - 192.
Anderson, K., Damania, R., and Jackson, L. (2004). Trade, standards, and the political economy
of genetically modified food (No. 3395). World Bank Policy Research Working Paper.
Baier, S. L., and Bergstrand, J. H. (2010). Approximating general equilibrium impacts of trade
liberalizations using the gravity equation. In P. A. G. van Bergeijk and S. Barkman (Eds.),
The gravity model in international trade. advances and applications (1st ed., pp. 88-134).
Cambridge: Cambridge University Press.
Baldwin, R. (1970). Nontariff distortions of international trade. Washington, DC: Brookings
Institution.
Baldwin, R. (2000). Regulatory protectionism, developing nations and a two-tier world trading
system. (S. Collins and D. Rodrik, Eds.) Brookings Trade Forum. Washington, DC:
Brookings Institution.
Bown, C. P. (2011). The great recession and import protection: the role of temporary trade
barriers. London: Centre for Economic Policy Research and the World Bank.
Datt, M., Hoekman, B., and Malouche, M. (2011). Taking stock of trade protectionism since
2008. Economic Premise, 72, 1-9
Dee, P. S., and Ferrantino, M. J. (2005). Quantitative methods for assessing the effects of non-
tariff measures and trade facilitation (Vol. 54). APEC Secretariat.
Disdier, A.-C., Fontagné, L., and Mimouni, M. (2008). The impact of regulations on agricultural
trade: Evidence from the SPS and TBT agreements. American Journal of Agricultural
Economics, 90(2), 336-350.
Ferro, E., Otsuki, T., and Wilson, J. S. (2015). The effect of product standards on agricultural
exports. Food Policy, 50, 68-79.
Fischer, R., and Serra, P. (2000). Standards and protection. Journal of International Economics,
52(2), 377-400.
Fontagné, L., Orefice, G., Piermartini, R., and Rocha, N. (2015). Product standards and margins
of trade: Firm-level evidence. Journal of International Economics, 97(1), 29-44.
Gandal, N., and Shy, O. (2001). Standardization policy and international trade. Journal of
International Economics, 53(2), 363-383.
Gebrehiwet, Y., Ngqangweni, S., and Kirsten, J. F. (2007). Quantifying the trade effect of
sanitary and phytosanitary regulations of OECD Countries on South African food exports.
Agrekon, 46(1), 1-17.
Grossman, G. M., and Helpman, E. (1994). Protection for sale. American Economic Review,
84(4), 833-850.
Helpman, E., Melitz, M., and Rubinstein, Y. (2008). Estimating trade flows: trading partners
and trading volumes. Quarterly Journal of Economics, 123(2), 441-487.

21
Henson, S., and Wilson, J. S. (2005). The WTO and technical barriers to trade. Edward Elgar
Publishing.
Li, Y., and Beghin, J. C. (2014). Protectionism indices for non-tariff measures: An application
to maximum residue levels. Food Policy, 45, 57-68.
Linders, G.-J. M., and De Groot, H. L. F. (2006). Estimation of the gravity equation in the
presence of zero flows. Mimeo, 1-26.
Maertens, M., and Swinnen, J. (2007). Standards as barriers and catalysts for trade, growth, and
poverty reduction. Journal of International Agricultural Trade and Development, 4(1),
47-61.
Marette, S., and Beghin, J. (2010). Are standards always protectionist? Review of International
Economics, 18(1), 179-192.
Melitz, M. J. (2003). The impact of trade on intra-industry reallocation and aggregate industry
productivity: A comment. Econometrica, 71(6), 1695-1725.
Nicita, A., and Rollo, V. (2015). Market access conditions and sub-Saharan Africa’s exports
diversification. World Development, 68, 254-263.
Otsuki, T., Wilson, J. S., and Sewadeh, M. (2001). Saving two in a billion: quantifying the trade
effect of European food safety standards on African exports. Food Policy, 26(5), 495-
514.
Pöyhönen, P. (1963). A Tentative Model for the Volume of Trade between Countries.
Weltwirtschaftliches Archiv, 90, 93-100.
Reis, J. G., and Farole, T. (2012). Trade competitiveness diagnostic toolkit. The World Bank
(Vol. 1). World Bank Publications. Washington, DC: World Bank. Retrieved from
https://openknowledge. worldbank.org/handle/10986/2248, [Accessed September,
2015].
Sheldon, I. M. (2013). North-South trade and standards: What can general equilibrium analysis
tell us? World Trade Review 11(3), 376-89.
Shepherd, B., and Wilson, N. L. W. (2013). Product standards and developing country
agricultural exports: The case of the European Union. Food Policy, 42, 1-10.
Sturm, D. M. (2006). Product standards, trade disputes, and protectionism. Canadian Journal
of Economics, 39(2), 564-581.
Swinnen, J. F. M., and Vandemoortele, T. (2011). Trade and the political economy of food
standards. Journal of Agricultural Economics, 62(2), 259-280.
——- (2012). Trade and the political economy of standards. World Trade Review, 11(3), 390-
400.
Tian, H. (2003). Eco-labelling scheme, environmental protection, and protectionism. Canadian
Journal of Economics/Revue Canadienne d`Economique, 36(3), 608-633.
WTO. (2009). Overview of developments in the international trading environment. Annual
report by the Director-General - Trade Policy Review Body. (Geneva).
Xiong, B., and Beghin, J. (2014). Disentangling demand-enhancing and trade-cost effects of
maximum residue regulations. Economic Inquiry, 52(3), 1190-1203.

22
Appendix
Table A4.1: List of Countries in the Tomato Dataset
Country Groups Members
Importers (EU) Belgium, France, Germany, Luxembourg, Netherlands, Portugal, Spain
Exporters (Africa) Algeria, Angola, Cape Verde, Comoros, Democratic Republic of Congo, Côte
d’Ivoire, Egypt Arab Republic, Equatorial Guinea, Gabon, The Gambia,
Ghana, Guinea-Bissau, Kenya, Liberia, Mauritania, Morocco, Nigeria, Sao
Tome and Principe, Senegal, Sierra Leone, South Africa, Togo.
Table A4.2: List of Countries in the Lime and Lemon Dataset
Country Groups Members
Importers (EU) France, Italy, Luxembourg, Netherlands, Poland, Portugal, Spain
Exporters (Africa) Algeria, Angola, Benin, Cape Verde, Congo Republic, Côte d’Ivoire,
Djibouti, Equatorial Guinea, Gabon, Ghana, Liberia, Madagascar,
Mauritania, Morocco, Nigeria, Sao Tome and Principe, Senegal, Sierra
Leone, South Africa
Table A4.3: List of Countries in the Oranges Dataset
Country Groups Members
Importers (EU) Belgium, France, Italy, Malta, Netherlands, Portugal, Spain
Exporters (Africa) Algeria, Angola, Benin, Cape Verde, Chad, Democratic Republic of Congo,
Congo Republic, Côte d’Ivoire, Egypt Arab Republic, Equatorial Guinea,
Gabon, The Gambia, Ghana, Guinea-Bissau, Liberia, Madagascar, Mali,
Mauritania, Morocco, Nigeria, Sao Tome and Principe, Senegal, Sierra Leone,
South Africa, Togo.