GLOBAL WIND TURBINE OPERATIONS & MAINTENANCE … · reference code gdae1098mar | publication date...
23
REFERENCE CODE GDAE1098MAR | PUBLICATION DATE MARCH 2015 GLOBAL WIND TURBINE OPERATIONS & MAINTENANCE MARKET, UPDATE 2015 – MARKET SIZE, MAJOR CONTENDERS, TRENDS, AND ANALYSIS TO 2020
Transcript of GLOBAL WIND TURBINE OPERATIONS & MAINTENANCE … · reference code gdae1098mar | publication date...

REFERENCE CODE GDAE1098MAR | PUBLICATION DATE MARCH 2015
GLOBAL WIND TURBINE OPERATIONS & MAINTENANCE MARKET, UPDATE 2015 – MARKET
SIZE, MAJOR CONTENDERS, TRENDS, AND ANALYSIS TO 2020
Global Wind Turbine Operations & Maintenance Market, Update 2015 – Market Size, Major Contenders, Trends, and Analysis to 2020 2 © GlobalData. This report is a licensed product and is not to be copied, reproduced, shared or resold in any form.
GLOBAL WIND TURBINE OPERATIONS & MAINTENANCE MARKET, UPDATE 2015 – MARKET SIZE, MAJOR CONTENDERS,
TRENDS, AND ANALYSIS TO 2020
Executive Summary
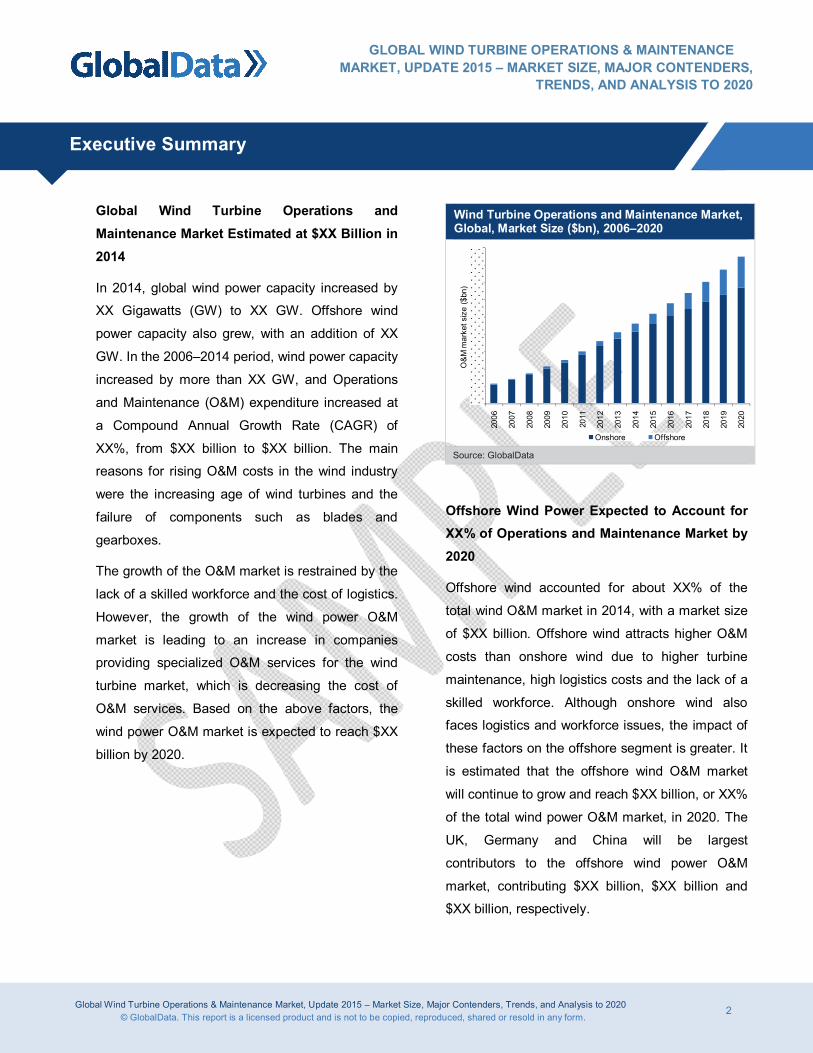
Global Wind Turbine Operations and Maintenance Market Estimated at $XX Billion in 2014
In 2014, global wind power capacity increased by
XX Gigawatts (GW) to XX GW. Offshore wind
power capacity also grew, with an addition of XX
GW. In the 2006–2014 period, wind power capacity
increased by more than XX GW, and Operations
and Maintenance (O&M) expenditure increased at
a Compound Annual Growth Rate (CAGR) of
XX%, from $XX billion to $XX billion. The main
reasons for rising O&M costs in the wind industry
were the increasing age of wind turbines and the
failure of components such as blades and
gearboxes.
The growth of the O&M market is restrained by the
lack of a skilled workforce and the cost of logistics.
However, the growth of the wind power O&M
market is leading to an increase in companies
providing specialized O&M services for the wind
turbine market, which is decreasing the cost of
O&M services. Based on the above factors, the
wind power O&M market is expected to reach $XX
billion by 2020.
Wind Turbine Operations and Maintenance Market, Global, Market Size ($bn), 2006–2020
2006
2007
2008
2009
2010
2011
2012
2013
2014
2015
2016
2017
2018
2019
2020
O&
M m
arke
t siz
e ($
bn)
Onshore Offshore Source: GlobalData
Offshore Wind Power Expected to Account for XX% of Operations and Maintenance Market by 2020
Offshore wind accounted for about XX% of the
total wind O&M market in 2014, with a market size
of $XX billion. Offshore wind attracts higher O&M
costs than onshore wind due to higher turbine
maintenance, high logistics costs and the lack of a
skilled workforce. Although onshore wind also
faces logistics and workforce issues, the impact of
these factors on the offshore segment is greater. It
is estimated that the offshore wind O&M market
will continue to grow and reach $XX billion, or XX%
of the total wind power O&M market, in 2020. The
UK, Germany and China will be largest
contributors to the offshore wind power O&M
market, contributing $XX billion, $XX billion and
$XX billion, respectively.
Global Wind Turbine Operations & Maintenance Market, Update 2015 – Market Size, Major Contenders, Trends, and Analysis to 2020 5 © GlobalData. This report is a licensed product and is not to be copied, reproduced, shared or resold in any form.
Table of Contents
GLOBAL WIND TURBINE OPERATIONS & MAINTENANCE MARKET, UPDATE 2015 – MARKET SIZE, MAJOR CONTENDERS,
TRENDS, AND ANALYSIS TO 2020
1 Table of Contents
1 Table of Contents ....................................................................................................................... 5
1.1 List of Tables .................................................................................................................... 10
1.2 List of Figures ................................................................................................................... 13
2 Introduction ............................................................................................................................... 16
2.1 Wind Power, Technology Definition ................................................................................... 16
2.2 Wind Power, Value Chain ................................................................................................. 16
2.3 Wind Power Operations and Maintenance, Cost Overview ............................................... 17
2.3.1 Wind Turbine Operations and Maintenance, Importance ............................................... 19
2.4 GlobalData Report Guidance ............................................................................................ 20
3 Wind Power Market, Global ...................................................................................................... 21
3.1 Wind Power Market, Global, Overview .............................................................................. 21
3.2 Wind Power Market, Global, Installed Capacity, 2006–2020 ............................................. 23
3.3 Wind Power Market, Global, Installed Capacity, Share by Country, 2014 .......................... 25
3.3.1 Wind Power Market, Global, Onshore Installed Capacity, Share by Country, 2014 ....... 25
3.3.2 Wind Power Market, Global, Offshore Installed Capacity, Share by Country, 2014 ....... 27
3.4 Wind Power Market, Global, Electricity Generation, 2006–2020 ....................................... 28
3.5 Wind Power Market, Global, Average Turbine Size, 2006–2020 ....................................... 30
3.6 Wind Power Market, Global, Turbine Market Share, 2014 ................................................. 32
3.6.1 Wind Power Market, Global, Onshore Turbine Market Share, 2014 .............................. 32
3.6.2 Wind Power Market, Global, Offshore Turbine Market Share, 2014 .............................. 34
3.7 Wind Power Market, Global, Major Market Trends and Forecasts ..................................... 35

Global Wind Turbine Operations & Maintenance Market, Update 2015 – Market Size, Major Contenders, Trends, and Analysis to 2020 6 © GlobalData. This report is a licensed product and is not to be copied, reproduced, shared or resold in any form.
Table of Contents
GLOBAL WIND TURBINE OPERATIONS & MAINTENANCE MARKET, UPDATE 2015 – MARKET SIZE, MAJOR CONTENDERS,
TRENDS, AND ANALYSIS TO 2020
3.7.1 Global Wind Power Market Consolidation Activity to Increase ....................................... 35
3.7.2 Growing Preference for Large Installations .................................................................... 35
3.7.3 Offshore Wind Market Development to Gain Momentum during Forecast Period .......... 36
3.8 Offshore Wind Power Market, Global, Key Drivers ............................................................ 37
3.9 Offshore Wind Power Market, Global, Key Barriers to Growth .......................................... 38
4 Wind Turbine Operations and Maintenance Market, Global ...................................................... 39
4.1 Wind Turbine Operations and Maintenance Market, Global, Overview .............................. 39
4.2 Wind Turbine Operations and Maintenance Market, Global, Market Size, 2006–2020 ...... 40
4.3 Wind Turbine Operations and Maintenance Market, Global, Share by Market Segment,
2014 and 2020 .................................................................................................................. 41
4.4 Wind Turbine Operations and Maintenance Market, Global, Share of Major Countries, 2014
and 2020 ........................................................................................................................... 42
4.5 Wind Turbine Operations and Maintenance Market, Analysis of Major Components ......... 44
4.5.1 Wind Turbine Operations and Maintenance Market, Inspection Aspects in Major
Components ................................................................................................................. 44
4.5.2 Wind Turbine Operations and Maintenance Market, Causes for Failure of Major
Components ................................................................................................................. 45
4.6 Wind Turbine Operations and Maintenance Market, Global, Number of Repairs, 2006–
2020 .................................................................................................................................. 46
4.7 Wind Turbine Operations and Maintenance Market, Global, Market Forces Analysis ........ 48
4.7.1 Wind Turbine Operations and Maintenance Market, Global, Key Drivers ...................... 48
4.7.2 Wind Turbine Operations and Maintenance Market, Global, Major Restraints and
Challenges ................................................................................................................... 52
4.8 Wind Turbine Operations and Maintenance Market, Global, Market Trends ...................... 53

Global Wind Turbine Operations & Maintenance Market, Update 2015 – Market Size, Major Contenders, Trends, and Analysis to 2020 7 © GlobalData. This report is a licensed product and is not to be copied, reproduced, shared or resold in any form.
Table of Contents
GLOBAL WIND TURBINE OPERATIONS & MAINTENANCE MARKET, UPDATE 2015 – MARKET SIZE, MAJOR CONTENDERS,
TRENDS, AND ANALYSIS TO 2020
4.8.1 Independent Service Providers are Gaining Market Share in Wind O&M Market ........... 53
4.8.2 Innovation in Components to Reduce Wind O&M Cost ................................................. 54
4.8.3 Long-Term O&M Contracts Gaining Momentum ............................................................ 55
4.8.4 Predictive Maintenance through Condition Monitoring System Improves Turbine
Availability .................................................................................................................... 55
4.8.5 Independent Service Providers Entering New Markets and Regions ............................. 56
5 Wind Turbine Operations and Maintenance Market, US ........................................................... 57
5.1 Wind Power Market, US, Overview ................................................................................... 57
5.2 Wind Power Market, US, Installed Capacity, 2006–2020 .................................................. 58
5.3 Wind Power Market, US, Power Generation, 2006–2020 .................................................. 62
5.4 Wind Power Market, US, Average Turbine Size, 2006–2020 ............................................ 64
5.5 Wind Turbine Operations and Maintenance Market, US, Market Size, 2006–2020 ........... 66
5.6 Wind Turbine Operations and Maintenance Market, US, Number of Repairs, 2006–2020 68
5.7 Wind Turbine Operations and Maintenance Market, US, Company Profiles of Major
Operations and Maintenance Service Providers ................................................................ 70
6 Wind Turbine Operations and Maintenance Market, Germany .................................................. 72
6.1 Wind Power Market, Germany, Overview .......................................................................... 72
6.2 Wind Power Market, Germany, Installed Capacity, 2006–2020 ......................................... 73
6.3 Wind Power Market, Germany, Generation, 2006–2020 ................................................... 77
6.4 Wind Power Market, Germany, Average Turbine Size, 2006–2020 ................................... 78
6.5 Wind Turbine Operations and Maintenance Market, Germany, Market Size, 2006–2020 .. 80
6.6 Wind Turbine Operations and Maintenance Market, Germany, Number of Repairs, 2006–
2020 .................................................................................................................................. 83
Global Wind Turbine Operations & Maintenance Market, Update 2015 – Market Size, Major Contenders, Trends, and Analysis to 2020 8 © GlobalData. This report is a licensed product and is not to be copied, reproduced, shared or resold in any form.
Table of Contents
GLOBAL WIND TURBINE OPERATIONS & MAINTENANCE MARKET, UPDATE 2015 – MARKET SIZE, MAJOR CONTENDERS,
TRENDS, AND ANALYSIS TO 2020
6.7 Wind Turbine Operations and Maintenance Market, Germany, Company Profiles of Major
Operations and Maintenance Service Providers ................................................................ 85
7 Wind Turbine Operations and Maintenance Market, Spain ....................................................... 86
7.1 Wind Power Market, Spain, Overview ............................................................................... 86
7.2 Wind Power Market, Spain, Installed Capacity, 2006–2020 .............................................. 87
7.3 Wind Power Market, Spain, Generation, 2006–2020 ......................................................... 91
7.4 Wind Power Market, Spain, Average Turbine Size, 2006–2020 ........................................ 93
7.5 Wind Turbine Operations and Maintenance Market, Spain, Market Size, 2006–2020 ....... 95
7.6 Wind Turbine Operations and Maintenance Market, Spain, Number of Repairs, 2006–2020
....................................................................................................................................... 97
7.7 Wind Turbine Operations and Maintenance Market, Spain, Company Profiles of Major
Operations and Maintenance Service Providers ................................................................ 99
8 Wind Turbine Operations and Maintenance Market, UK ......................................................... 101
8.1 Wind Power Market, UK, Overview ................................................................................. 101
8.2 Wind Power Market, UK, Installed Capacity, 2006–2020 ................................................ 102
8.3 Wind Power Market, UK, Generation, 2006–2020 ........................................................... 106
8.4 Wind Power Market, UK, Average Turbine Size, 2006–2020 .......................................... 107
8.5 Wind Turbine Operations and Maintenance Market, UK, Market Size, 2006–2020 ......... 109
8.6 Wind Turbine Operations and Maintenance Market, UK, Number of Repairs, 2006–2020 ....
..................................................................................................................................... 112
8.7 Wind Turbine Operations and Maintenance Market, UK, Company Profiles of Major
Operations and Maintenance Service Providers .............................................................. 114
9 Wind Turbine Operations and Maintenance Market, China ..................................................... 116
9.1 Wind Power Market, China, Overview ............................................................................. 116

Global Wind Turbine Operations & Maintenance Market, Update 2015 – Market Size, Major Contenders, Trends, and Analysis to 2020 9 © GlobalData. This report is a licensed product and is not to be copied, reproduced, shared or resold in any form.
Table of Contents
GLOBAL WIND TURBINE OPERATIONS & MAINTENANCE MARKET, UPDATE 2015 – MARKET SIZE, MAJOR CONTENDERS,
TRENDS, AND ANALYSIS TO 2020
9.2 Wind Power Market, China, Installed Capacity, 2006–2020 ............................................ 117
9.3 Wind Power Market, China, Generation, 2006–2020....................................................... 121
9.4 Wind Power Market, China, Average Turbine Size, 2006–2020 ...................................... 122
9.5 Wind Turbine Operations and Maintenance Market, China, Market Size, 2006–2020 ..... 124
9.6 Wind Turbine Operations and Maintenance Market, China, Number of Repairs, 2006–2020
..................................................................................................................................... 127
9.7 Wind Turbine Operations and Maintenance Market, China, Company Profiles of Major
Operations and Maintenance Service Providers .............................................................. 129
10 Wind Turbine Operations and Maintenance Market, India ....................................................... 130
10.1 Wind Power Market, India, Overview .............................................................................. 130
10.2 Wind Power Market, India, Installed Capacity, 2006–2020 .............................................. 131
10.3 Wind Power Market, India, Generation, 2006–2020 ........................................................ 135
10.4 Wind Power Market, India, Average Turbine Size, 2006–2020 ........................................ 137
10.5 Wind Turbine Operations and Maintenance Market, India, Market Size, 2006–2020 ....... 139
10.6 Wind Turbine Operations and Maintenance Market, India, Number of Repairs, 2006–2020 ..
..................................................................................................................................... 141
10.7 Wind Turbine Operations and Maintenance Market, India, Company Profiles of Major
Operations and Maintenance Service Providers .............................................................. 143
11 Appendix................................................................................................................................. 145
11.1 Abbreviations .................................................................................................................. 145
11.2 Bibliography .................................................................................................................... 146
11.3 Market Definitions ........................................................................................................... 146
11.4 Methodology ................................................................................................................... 146
11.4.1 Assumptions................................................................................................................ 147

Global Wind Turbine Operations & Maintenance Market, Update 2015 – Market Size, Major Contenders, Trends, and Analysis to 2020 10 © GlobalData. This report is a licensed product and is not to be copied, reproduced, shared or resold in any form.
Table of Contents
GLOBAL WIND TURBINE OPERATIONS & MAINTENANCE MARKET, UPDATE 2015 – MARKET SIZE, MAJOR CONTENDERS,
TRENDS, AND ANALYSIS TO 2020
11.4.2 Coverage .................................................................................................................... 148
11.4.3 Secondary Research ................................................................................................... 148
11.4.4 Primary Research ....................................................................................................... 149
11.5 Disclaimer ....................................................................................................................... 149
1.1 List of Tables
Table 1: Wind Power Market, Global, Installed Capacity (GW), 2006–2020 ............................................... 25
Table 2: Wind Power Market, Global, Onshore Cumulative Installed Capacity, Share by Country (%), 2014
................................................................................................................................................... 26
Table 3: Wind Power Market, Global, Offshore Cumulative Installed Capacity, Share by Country (%), 2014
................................................................................................................................................... 28
Table 4: Wind Power Market, Global, Generation (TWh), 2006–2020 ........................................................ 30
Table 5: Wind Power Market, Global, Average Turbine Size (MW), 2006–2020 ......................................... 32
Table 6: Wind Power Market, Global, Onshore Turbine Market Share (%), 2014 ....................................... 33
Table 7: Wind Power Market, Global, Offshore Turbine Market Share (%), 2014 ....................................... 34
Table 8: Wind Power Market, Global, Share of Offshore Wind in Cumulative Capacity (%), 2012–2020 ..... 37
Table 9: Wind Turbine Operations and Maintenance Market, Global, Market Size ($bn), 2006–2020 ......... 41
Table 10: Wind Turbine Operations and Maintenance Market, Global, Share by Market Segment (%), 2014
and 2020 ..................................................................................................................................... 42
Table 11: Wind Turbine Operations and Maintenance Market, Global, Share by Major Country (%), 2014 and
2020............................................................................................................................................ 43
Table 12: Wind Turbine Operations and Maintenance Market, Inspection Aspects in Major Components .... 44
Table 13: Wind Turbine Operations and Maintenance Market, Cause of Failure .......................................... 45
Table 14: Wind Turbine Operations and Maintenance Market, Global, Number of Repairs, 2006–2020 ....... 48
Table 15: Wind Turbine Operations and Maintenance Market, Global, Component Annual Failure Rate ...... 51

Global Wind Turbine Operations & Maintenance Market, Update 2015 – Market Size, Major Contenders, Trends, and Analysis to 2020 11 © GlobalData. This report is a licensed product and is not to be copied, reproduced, shared or resold in any form.
Table of Contents
GLOBAL WIND TURBINE OPERATIONS & MAINTENANCE MARKET, UPDATE 2015 – MARKET SIZE, MAJOR CONTENDERS,
TRENDS, AND ANALYSIS TO 2020
Table 16: Wind Repairs Market, Global, Major Independent Service Providers ............................................ 54
Table 17: Wind Power Market, US, Installed Capacity (GW), 2006–2020 .................................................... 61
Table 18: Wind Power Market, US, Electricity Generation (TWh), 2006–2020 ............................................. 63
Table 19: Wind Power Market, US, Average Turbine Size (MW), 2006–2020 .............................................. 65
Table 20: Wind Turbine Operations and Maintenance Market, US, Market Size ($bn), 2006–2020 .............. 67
Table 21: Wind Turbine Operations and Maintenance Market, US, Number of Repairs, 2006–2020 ............ 69
Table 22: Wind Turbine Operations and Maintenance Market, US, Company Profiles of Major Operations
and Maintenance Service Providers ............................................................................................ 70
Table 23: Wind Power Market, Germany, Installed Capacity (GW), 2006–2020 ........................................... 76
Table 24: Wind Power Market, Germany, Electricity Generation (TWh), 2006–2020 .................................... 78
Table 25: Wind Power Market, Germany, Average Turbine Size (MW), 2006–2020 ..................................... 80
Table 26: Wind Turbine Operations and Maintenance Market, Germany, Market Size ($bn), 2006–2020 ..... 82
Table 27: Wind Repairs Market, Germany, Market Volume of Rotor Blades, Gearboxes and Generators
(GW), 2006–2020 ........................................................................................................................ 84
Table 28: Wind Turbine Operations and Maintenance Market, Germany, Company Profiles of Major
Operations and Maintenance Service Providers........................................................................... 85
Table 29: Wind Power Market, Spain, Installed Capacity (GW), 2006–2020 ................................................ 90
Table 30: Wind Power Market, Spain, Electricity Generation (TWh), 2006–2020 ......................................... 92
Table 31: Wind Power Market, Spain, Average Turbine Size (MW), 2006–2020 .......................................... 94
Table 32: Wind Turbine Operations and Maintenance Market, Spain, Market Size ($m), 2006–2020 ........... 96
Table 33: Wind Repairs Market, Spain, Market Volume of Rotor Blades, Gearboxes and Generators (GW),
2006–2020 .................................................................................................................................. 98
Table 34: Wind Turbine Operations and Maintenance Market, Spain, Company Profiles of Major Operations
and Maintenance Service Providers ............................................................................................ 99
Table 35: Wind Power Market, UK, Installed Capacity (GW), 2006–2020 .................................................. 105
Table 36: Wind Power Market, UK, Electricity Generation (TWh), 2006–2020 ........................................... 107

Global Wind Turbine Operations & Maintenance Market, Update 2015 – Market Size, Major Contenders, Trends, and Analysis to 2020 12 © GlobalData. This report is a licensed product and is not to be copied, reproduced, shared or resold in any form.
Table of Contents
GLOBAL WIND TURBINE OPERATIONS & MAINTENANCE MARKET, UPDATE 2015 – MARKET SIZE, MAJOR CONTENDERS,
TRENDS, AND ANALYSIS TO 2020
Table 37: Wind Power Market, UK, Average Turbine Size (MW), 2006–2020 ............................................ 109
Table 38: Wind Turbine Operations and Maintenance Market, UK, Market Size ($bn), 2006–2020 ............ 111
Table 39: Wind Repairs Market, UK, Market Volume of Rotor Blades, Gearboxes and Generators (MW),
2006–2020 ................................................................................................................................ 113
Table 40: Wind Turbine Operations and Maintenance Market, UK, Company Profiles of Major Operations
and Maintenance Service Providers .......................................................................................... 114
Table 41: Wind Power Market, China, Installed Capacity (GW), 2006–2020 .............................................. 120
Table 42: Wind Power Market, China, Electricity Generation (TWh), 2006–2020 ....................................... 122
Table 43: Wind Power Market, China, Average Turbine Size (MW), 2006–2020 ........................................ 124
Table 44: Wind Turbine Operations and Maintenance Market, China, Market Size ($bn), 2006–2020 ........ 126
Table 45: Wind Repairs Market, China, Market Volume of Rotor Blades, Gearboxes and Generators (GW),
2006–2020 ................................................................................................................................ 128
Table 46: Wind Turbine Operations and Maintenance Market, China, Company Profiles of Major Operations
and Maintenance Service Providers .......................................................................................... 129
Table 47: Wind Power Market, India, Onshore Installed Capacity (GW), 2006–2020 ................................. 134
Table 48: Wind Power Market, India, Electricity Generation (TWh), 2006–2020 ......................................... 136
Table 49: Wind Power Market, India, Average Turbine Size (MW), 2006–2020 ......................................... 138
Table 50: Wind Turbine Operations and Maintenance Market, India, Market Size ($bn), 2006–2020 ......... 140
Table 51: Wind Repairs Market, India, Market Volume of Rotor Blades, Gearboxes and Generators (GW),
2006–2020 ................................................................................................................................ 142
Table 52: Wind Turbine Operations and Maintenance Market, India, Company Profiles of Major Operations
and Maintenance Service Providers .......................................................................................... 143
Table 53: Abbreviations ............................................................................................................................ 145
Global Wind Turbine Operations & Maintenance Market, Update 2015 – Market Size, Major Contenders, Trends, and Analysis to 2020 13 © GlobalData. This report is a licensed product and is not to be copied, reproduced, shared or resold in any form.
Table of Contents
GLOBAL WIND TURBINE OPERATIONS & MAINTENANCE MARKET, UPDATE 2015 – MARKET SIZE, MAJOR CONTENDERS,
TRENDS, AND ANALYSIS TO 2020
1.2 List of Figures
Figure 1: Wind Power Market, Value Chain ................................................................................................ 17
Figure 2: Wind Turbine Operations and Maintenance Market, Global, Wind Farm Operation and
Maintenance Costs...................................................................................................................... 18
Figure 3: Wind Power, Project Life ............................................................................................................. 19
Figure 4: Wind Power Market, Global, Cumulative Installed Capacity (GW), 2006–2020 ............................. 23
Figure 5: Wind Power Market, Global, Annual Installed Capacity (GW), 2006–2020 ................................... 24
Figure 6: Wind Power Market, Global, Onshore Cumulative Installed Capacity, Share by Country (%), 2014
................................................................................................................................................... 26
Figure 7: Wind Power Market, Global, Offshore Cumulative Installed Capacity, Share by Country (%), 2014
................................................................................................................................................... 27
Figure 8: Wind Power Market, Global, Electricity Generation (TWh), 2006–2020 ........................................ 29
Figure 9: Wind Power Market, Global, Average Turbine Size (MW), 2006–2020 ......................................... 31
Figure 10: Wind Power Market, Global, Onshore Turbine Market Share (%), 2014 ....................................... 33
Figure 11: Wind Power Market, Global, Offshore Turbine Market Share (%), 2014 ....................................... 34
Figure 12: Wind Power Market, Global, Share of Offshore Wind in Cumulative Capacity (%), 2012–2020 ..... 36
Figure 13: Wind Turbine Operations and Maintenance Market, Global, Market Size ($bn), 2006–2020 ......... 40
Figure 14: Wind Turbine Operations and Maintenance Market, Global, Share by Market Segment (%), 2014
and 2020 ..................................................................................................................................... 42
Figure 15: Wind Turbine Operations and Maintenance Market, Global, Share by Major Country (%), 2014 and
2020............................................................................................................................................ 43
Figure 16: Wind Turbine Operations and Maintenance Market, Global, Number of Repairs, 2006–2020 ....... 47
Figure 17: Wind Turbine Operations and Maintenance Market, Global, Component Annual Failure Rate ...... 50
Figure 18: Wind Power Market, US, Cumulative Installed Capacity (GW), 2006–2020 .................................. 59
Figure 19: Wind Power Market, US, Annual Installed Capacity (GW), 2006–2020......................................... 60
Figure 20: Wind Power Market, US, Electricity Generation (TWh), 2006–2020 ............................................. 62

Global Wind Turbine Operations & Maintenance Market, Update 2015 – Market Size, Major Contenders, Trends, and Analysis to 2020 14 © GlobalData. This report is a licensed product and is not to be copied, reproduced, shared or resold in any form.
Table of Contents
GLOBAL WIND TURBINE OPERATIONS & MAINTENANCE MARKET, UPDATE 2015 – MARKET SIZE, MAJOR CONTENDERS,
TRENDS, AND ANALYSIS TO 2020
Figure 21: Wind Power Market, US, Average Turbine Size (MW), 2006–2020 .............................................. 64
Figure 22: Wind Turbine Operations and Maintenance Market, US, Market Size ($bn), 2006–2020 .............. 66
Figure 23: Wind Turbine Operations and Maintenance Market, US, Number of Repairs, 2006–2020 ............ 68
Figure 24: Wind Power Market, Germany, Cumulative Installed Capacity (GW), 2006–2020......................... 74
Figure 25: Wind Power Market, Germany, Annual Installed Capacity (GW), 2006–2020 ............................... 75
Figure 26: Wind Power Market, Germany, Electricity Generation (TWh), 2006–2020 .................................... 77
Figure 27: Wind Power Market, Germany, Average Turbine Size (MW), 2006–2020 ..................................... 79
Figure 28: Wind Turbine Operations and Maintenance Market, Germany, Market Size ($bn), 2006–2020 ..... 81
Figure 29: Wind Turbine Operations and Maintenance Market, Germany, Number of Repairs, 2006–2020 ... 83
Figure 30: Wind Power Market, Spain, Cumulative Installed Capacity (GW), 2006–2020 .............................. 88
Figure 31: Wind Power Market, Spain, Annual Installed Capacity (GW), 2006–2020..................................... 89
Figure 32: Wind Power Market, Spain, Electricity Generation (TWh), 2006–2020 ......................................... 91
Figure 33: Wind Power Market, Spain, Average Turbine Size (MW), 2006–2020 .......................................... 93
Figure 34: Wind Turbine Operations and Maintenance Market, Spain, Market Size ($bn), 2006–2020 .......... 95
Figure 35: Wind Turbine Operations and Maintenance Market, Spain, Number of Repairs, 2006–2020 ........ 97
Figure 36: Wind Power Market, UK, Cumulative Installed Capacity (GW), 2006–2020 ................................ 103
Figure 37: Wind Power Market, UK, Annual Installed Capacity (GW), 2006–2020....................................... 104
Figure 38: Wind Power Market, UK, Electricity Generation (TWh), 2006–2020 ........................................... 106
Figure 39: Wind Power Market, UK, Average Turbine Size (MW), 2006–2020 ............................................ 108
Figure 40: Wind Turbine Operations and Maintenance Market, UK, Market Size ($bn), 2006–2020 ............ 110
Figure 41: Wind Turbine Operations and Maintenance Market, UK, Number of Repairs, 2006–2020 .......... 112
Figure 42: Wind Power Market, China, Cumulative Installed Capacity (GW), 2006–2020 ............................ 118
Figure 43: Wind Power Market, China, Annual Installed Capacity (GW), 2006–2020 .................................. 119
Figure 44: Wind Power Market, China, Electricity Generation (TWh), 2006–2020 ....................................... 121

Global Wind Turbine Operations & Maintenance Market, Update 2015 – Market Size, Major Contenders, Trends, and Analysis to 2020 15 © GlobalData. This report is a licensed product and is not to be copied, reproduced, shared or resold in any form.
Table of Contents
GLOBAL WIND TURBINE OPERATIONS & MAINTENANCE MARKET, UPDATE 2015 – MARKET SIZE, MAJOR CONTENDERS,
TRENDS, AND ANALYSIS TO 2020
Figure 45: Wind Power Market, China, Average Turbine Size (MW), 2006–2020 ........................................ 123
Figure 46: Wind Turbine Operations and Maintenance Market, China, Market Size ($bn), 2006–2020 ........ 125
Figure 47: Wind Turbine Operations and Maintenance Market, China, Number of Repairs, 2006–2020 ...... 127
Figure 48: Wind Power Market, India, Cumulative Installed Capacity (GW), 2006–2020 ............................. 132
Figure 49: Wind Power Market, India, Annual Installed Capacity (GW), 2006–2020 .................................... 133
Figure 50: Wind Power Market, India, Electricity Generation (TWh), 2006–2020 ......................................... 135
Figure 51: Wind Power Market, India, Average Turbine Size (MW), 2006–2020 ......................................... 137
Figure 52: Wind Turbine Operations and Maintenance Market, India, Market Size ($bn), 2006–2020 ......... 139
Figure 53: Wind Turbine Operations and Maintenance Market, India, Number of Repairs, 2006–2020 ........ 141

Global Wind Turbine Operations & Maintenance Market, Update 2015 – Market Size, Major Contenders, Trends, and Analysis to 2020 16 © GlobalData. This report is a licensed product and is not to be copied, reproduced, shared or resold in any form.
GLOBAL WIND TURBINE OPERATIONS & MAINTENANCE MARKET, UPDATE 2015 – MARKET SIZE, MAJOR CONTENDERS,
TRENDS, AND ANALYSIS TO 2020
Introduction
2 Introduction
2.1 Wind Power, Technology Definition
Wind energy is the conversion of wind flow into a useful form of energy, such as power production,
through turbines, water pumping, and windmills. A wind turbine gathers kinetic energy and converts
it into electricity for residential, commercial and industrial purposes. Wind power is a clean source
of energy, as it does not emit carbon dioxide (CO2). It is classified into onshore and offshore.
Onshore wind is the market segment where wind turbines are erected on land, and offshore wind is
the market segment where wind turbines are erected in the sea or ocean on a foundation.
2.2 Wind Power, Value Chain
The key factors that govern wind power project economics are the purchase of raw materials and
components; manufacturing and assembly; project development; financing; Engineering,
Procurement and Construction (EPC); and Operations and Maintenance (O&M). These activities
include various non-recurring expenses such as preparatory costs, the purchase of wind turbines,
the construction of civil and electrical infrastructure, initial investment for site assessment,
environmental studies and government approval. Other recurring expenses include the service,
maintenance and operation of wind farms, insurance and warranty, local taxes and daily
management. The following figure shows the components of the wind power value chain.

Global Wind Turbine Operations & Maintenance Market, Update 2015 – Market Size, Major Contenders, Trends, and Analysis to 2020 20 © GlobalData. This report is a licensed product and is not to be copied, reproduced, shared or resold in any form.
GLOBAL WIND TURBINE OPERATIONS & MAINTENANCE MARKET, UPDATE 2015 – MARKET SIZE, MAJOR CONTENDERS,
TRENDS, AND ANALYSIS TO 2020
Introduction
2.4 GlobalData Report Guidance
The report begins with an executive summary, which provides a snapshot of the key indicators
in the global wind O&M market.
The “Introduction” section gives an overview of wind power technology, the value chain and
wind O&M.
The “Wind Power Market, Global” section details global wind power developments (onshore
and offshore) from 2006 to 2014 and the expected market trends from 2015 to 2020. The
chapter includes a global wind overview and covers installed capacity, installed capacity share
by major country, and turbine market share. The section also highlights present and future
market trends in the global wind power market.
The “Wind Turbine O&M Market, Global” section provides a detailed analysis of the global wind
O&M market from 2006 to 2014 and the expected market trends from 2015 to 2020. The
chapter includes a global market overview and covers market size, share by market segment
(onshore and offshore), and the key drivers, restraints and challenges in the global wind O&M
market. The section also highlights major current and future market trends in the global wind
O&M market.
The next consecutive sections provide detailed analysis of the six major global wind O&M
markets: the US, Germany, Spain, the UK, China and India. Each section provides an overview
of the wind power market and covers installed capacity trends from 2006 to 2020, the average
size of turbines, and O&M market size. They also calculate the market for repairing wind
turbine components, during the 2006–2020 period.

Global Wind Turbine Operations & Maintenance Market, Update 2015 – Market Size, Major Contenders, Trends, and Analysis to 2020 40 © GlobalData. This report is a licensed product and is not to be copied, reproduced, shared or resold in any form.
GLOBAL WIND TURBINE OPERATIONS & MAINTENANCE MARKET, UPDATE 2015 – MARKET SIZE, MAJOR CONTENDERS,
TRENDS, AND ANALYSIS TO 2020
Wind Turbine Operations and Maintenance Market, Global
4.2 Wind Turbine Operations and Maintenance Market, Global, Market Size, 2006–2020
The global wind O&M market grew at a CAGR of XX% between 2006 and 2014, from $XX billion to
$XX billion. Aging wind turbines and increasing turbine installations owing to financial incentives,
capital subsidies and tax rebates, as well as the failure of components, were the major drivers of
the increase. On the other hand, growth was restrained by the lack of a skilled workforce and the
cost of logistics. Against this backdrop, the global wind O&M market is estimated to reach $XX
billion in 2020, registering a CAGR of XX%.
The onshore wind O&M market grew from an estimated $XX billion in 2006 to $XX billion in 2014.
Although there will be a drop in the share of the global onshore wind O&M market, it will rise to $XX
billion in 2020 at a forecast CAGR of XX%. The offshore wind market will grow from an estimated
$XX billion in 2014 to $XX billion in 2020, at a CAGR of XX%.
Figure 13: Wind Turbine Operations and Maintenance Market, Global, Market Size ($bn), 2006–2020
2006 2007 2008 2009 2010 2011 2012 2013 2014 2015 2016 2017 2018 2019 2020
O&
M m
arke
t siz
e ($
bn)
Onshore Offshore
Source: GlobalData

Global Wind Turbine Operations & Maintenance Market, Update 2015 – Market Size, Major Contenders, Trends, and Analysis to 2020 68 © GlobalData. This report is a licensed product and is not to be copied, reproduced, shared or resold in any form.
Wind Turbine Operations and Maintenance Market, US
GLOBAL WIND TURBINE OPERATIONS & MAINTENANCE MARKET, UPDATE 2015 – MARKET SIZE, MAJOR CONTENDERS,
TRENDS, AND ANALYSIS TO 2020
5.6 Wind Turbine Operations and Maintenance Market, US, Number of Repairs, 2006–2020
Failure rates vary among wind turbine components, meaning that the number of repairs required
fluctuates depending on capacity additions and on a specific component’s failure rate. The
following chart shows the estimated number of repairs needed by the major components, namely
generators, gearboxes, and rotor blades, in the US during the 2006–2020 period.
Figure 23: Wind Turbine Operations and Maintenance Market, US, Number of Repairs, 2006–2020
2006 2007 2008 2009 2010 2011 2012 2013 2014 2015 2016 2017 2018 2019 2020
Num
ber o
f rep
airs
Generators Gearboxes Rotor blades
Source: GlobalData

Global Wind Turbine Operations & Maintenance Market, Update 2015 – Market Size, Major Contenders, Trends, and Analysis to 2020 69 © GlobalData. This report is a licensed product and is not to be copied, reproduced, shared or resold in any form.
Wind Turbine Operations and Maintenance Market, US
GLOBAL WIND TURBINE OPERATIONS & MAINTENANCE MARKET, UPDATE 2015 – MARKET SIZE, MAJOR CONTENDERS,
TRENDS, AND ANALYSIS TO 2020
Table 21: Wind Turbine Operations and Maintenance Market, US, Number of Repairs, 2006–2020
Year Generators Gearboxes Rotor blades
2006
2007
2008
2009
2010
2011
2012
2013
2014
2015
2016
2017
2018
2019
2020
Source: GlobalData

Global Wind Turbine Operations & Maintenance Market, Update 2015 – Market Size, Major Contenders, Trends, and Analysis to 2020 145 © GlobalData. This report is a licensed product and is not to be copied, reproduced, shared or resold in any form.
Appendix
GLOBAL WIND TURBINE OPERATIONS & MAINTENANCE MARKET, UPDATE 2015 – MARKET SIZE, MAJOR CONTENDERS,
TRENDS, AND ANALYSIS TO 2020
11 Appendix
11.1 Abbreviations
Table 53: Abbreviations CAGR Compound Annual Growth Rate
CMS Condition Monitoring System
CO2 carbon dioxide
DDT Direct Drive Train
EEG German Renewable Energy Sources Act (Erneuerbare Energie Gesetz)
EPC Engineering, Procurement and Construction
FiT Feed-in Tariff
FTC Federal Tax Credits
GBI Generation-Based Incentive
GES Global Energy Services
GW Gigawatt
ISP Independent Service Provider
kWh kilowatt hour
M&A Mergers and Acquisitions
MIIT Ministry of Industry and Information Technology
MW Megawatt
MWh Megawatt hours
O&M Operations and Maintenance
OEM Original Equipment Manufacturer
PTC Production Tax Credits
R&D Research and Development
ROC Renewable Obligation Certificates
RPS Renewable Portfolio Standards
SCADA Supervisory Control and Data Acquisition
Source: GlobalData

Global Wind Turbine Operations & Maintenance Market, Update 2015 – Market Size, Major Contenders, Trends, and Analysis to 2020 146 © GlobalData. This report is a licensed product and is not to be copied, reproduced, shared or resold in any form.
Appendix
GLOBAL WIND TURBINE OPERATIONS & MAINTENANCE MARKET, UPDATE 2015 – MARKET SIZE, MAJOR CONTENDERS,
TRENDS, AND ANALYSIS TO 2020
11.2 Bibliography
AWEA (2011). Wind Turbine Operation and Maintenance. American Wind Energy Association.
Available from: http://dev.awea.org/learnabout/publications/upload/O-M-PPR_1-pager-3.pdf
ISET (2009). Wind Energy Report 2008. Institut für Solare Energieversorgungstechnik.
Available from:
http://windmonitor.iwes.fraunhofer.de/wind/download/Windenergie_Report_2008_en.pdf
11.3 Market Definitions
Historical period: 2006–2014
Base year: 2014
Forecast period: 2015–2020
Global: The countries included in the GlobalData capacity and generations database. These
countries constitute more than 99% of global wind power capacity.
Others: Includes countries other than the US, China, India, Germany, Spain and the UK.
11.4 Methodology
GlobalData’s dedicated research and analysis teams consist of experienced professionals with
advanced statistical expertise and marketing, market research and consulting backgrounds in the
energy industry.
GlobalData adheres to the codes of practice of the Market Research Society (www.mrs.org.uk) and
Strategic and Competitive Intelligence Professionals (www.scip.org).
All of GlobalData’s databases are continuously updated and revised. The following methodology
has been followed for the collection and analysis of data presented in this report.

Global Wind Turbine Operations & Maintenance Market, Update 2015 – Market Size, Major Contenders, Trends, and Analysis to 2020 147 © GlobalData. This report is a licensed product and is not to be copied, reproduced, shared or resold in any form.
Appendix
GLOBAL WIND TURBINE OPERATIONS & MAINTENANCE MARKET, UPDATE 2015 – MARKET SIZE, MAJOR CONTENDERS,
TRENDS, AND ANALYSIS TO 2020
11.4.1 Assumptions
The average turbine size (MW) trend is analyzed by studying a sample of around 21,000 wind
farm assets covered in the Power Database.
The total wind power project cost has been calculated based on the weighted average of
onshore and offshore annual capacity and the assumption that the share of onshore turbine
cost is 70% of the total project cost and the share of offshore turbine cost is 40% of the total
project cost.
11.4.1.1 To Calculate Capacity Available for O&M Contracts
The duration of short-term, medium-term and long-term contracts are two years, five years and
10 years respectively.
50% of the wind farms will opt for a medium-term O&M contract and 50% will opt for a long-
term O&M contact after the initial warranty expires.
Wind farms with O&M contracts that end when the turbines are aged 10–15 years will have a
medium-term contract of five years. Wind farms with O&M contracts that end after the turbines
reach 15 years of age will have an O&M contract until the end of their life.
11.4.1.2 To Calculate the Capacity of Turbines Requiring Component Repairs
The life span of a wind turbine is taken as 25 years.
The annual frequency of failure for rotor blades is taken as 0.2, for gearboxes as 0.14 and for
generators as 0.125.
The frequency of failure for wind turbine components is considered the same for onshore and
offshore turbines.

Global Wind Turbine Operations & Maintenance Market, Update 2015 – Market Size, Major Contenders, Trends, and Analysis to 2020 148 © GlobalData. This report is a licensed product and is not to be copied, reproduced, shared or resold in any form.
Appendix
GLOBAL WIND TURBINE OPERATIONS & MAINTENANCE MARKET, UPDATE 2015 – MARKET SIZE, MAJOR CONTENDERS,
TRENDS, AND ANALYSIS TO 2020
11.4.2 Coverage
The objective of updating GlobalData’s coverage is to ensure that it represents the most up-to-date
vision of the industry possible.
Changes to the industry taxonomy are built on the basis of extensive research of company,
association and competitor sources.
Company coverage is based on three key factors: market capitalization; revenues; and media
attention and innovation and market potential.
The estimated revenues of all major companies, including private and governmental, are gathered
and used to prioritize coverage.
Companies which are making the news, or which are of particular interest due to their innovative
approach, are prioritized.
GlobalData aims to cover all major news events and deals in the alternative energy industry,
updated on a daily basis.
11.4.3 Secondary Research
The research process begins with exhaustive secondary research using internal and external
sources to obtain qualitative and quantitative information relating to each market. The secondary
research sources that are typically referred to include, but are not limited to:
Company websites, annual reports, financial reports, broker reports and investor presentations
Industry trade journals and other literature
Internal and external proprietary databases
National government documents, statistical databases and market reports
News articles, press releases and web-casts specific to the companies operating in the market

Global Wind Turbine Operations & Maintenance Market, Update 2015 – Market Size, Major Contenders, Trends, and Analysis to 2020 149 © GlobalData. This report is a licensed product and is not to be copied, reproduced, shared or resold in any form.
Appendix
GLOBAL WIND TURBINE OPERATIONS & MAINTENANCE MARKET, UPDATE 2015 – MARKET SIZE, MAJOR CONTENDERS,
TRENDS, AND ANALYSIS TO 2020
11.4.4 Primary Research
GlobalData conducts hundreds of primary interviews a year with industry participants and
commentators in order to validate its data and analysis.
A typical research interview fulfills the following functions:
Provides first-hand information on the market size, market trends, growth trends, competitive
landscape and future outlook
Validates and strengthens secondary research findings
Further develops the analysis team’s expertise and market understanding
Primary research involves email interactions and telephone interviews as well as face-to-face
interviews for each market, category, segment and sub-segment across geographies. The
participants who typically take part in such a process include, but are not limited to:
Industry participants: VPs, business development managers, market intelligence managers
and national sales managers
Outside experts: Valuation experts, research analysts and key opinion leaders specializing in
the alternative energy industry
11.5 Disclaimer
All Rights Reserved.
No part of this publication may be reproduced, stored in a retrieval system or transmitted in any
form by any means, electronic, mechanical, photocopying, recording or otherwise without the prior
permission of the publisher, GlobalData.