Global Warming Science - InSight Cruises · 2017-12-20 · Global Warming: State of the Science...
58
Global Warming: State of the Science Richard Wolfson Benjamin F. Wissler Professor of Physics Professor, Environmental Studies Middlebury College Insight Cruises/Scientific American January 19, 2012
Transcript of Global Warming Science - InSight Cruises · 2017-12-20 · Global Warming: State of the Science...

Global Warming:
State of the Science
Richard Wolfson
Benjamin F. Wissler Professor of Physics
Professor, Environmental Studies
Middlebury College
Insight Cruises/Scientific American
January 19, 2012

Climate Change - Ancient History !! 19th Century: Fourier, Tyndall, Langley
"!Greenhouse gases warm Earth
!! 1896: Arrhenius
"!5-6˚C rise for CO2 doubling
!! 1970s: Which way will it go?
"!Global cooling?
"!Nuclear Winter?
!! 1980s: Summer of 1988
"!Hansen testifies
"!End of Nature (McKibben), Global Warming:
Are We Entering the Greenhouse Century? (Schneider)

Climate Change: IPCC* Era !! 1991 IPCC First Assessment Report (FAR): observed
climate !broadly consistent" with anthropogenic greenhouse effect
!! 1996 IPCC SAR: !discernible human influence on global climate"
!! 2001 IPCC TAR: !most of the warming observed over the last 50 years is attributable to human activities"
!! 2007 IPCC AR4: !Warming of the climate system is unequivocal…Most of the observed increase in globally averaged temperatures since the mid-20th century is very likely due to the observed increase in anthropogenic greenhouse gas concentrations…"
*Intergovernmental Panel on Climate Change

What is this IPCC?
!! Intergovernmental Panel on Climate Change
!!Established 1988 by "!World Meteorological Organization
"!United Nations Environment Program
!!Major assessment reports every ~six years "!Summarize climate research
!!Three Working Groups "!Science, Impacts, Mitigation
!!Hundreds of scientists & policymakers "!AR4 WG1 (Science): ~600 authors, 620 expert
reviewers, representatives from 113 governments
!!AR5 due 2014
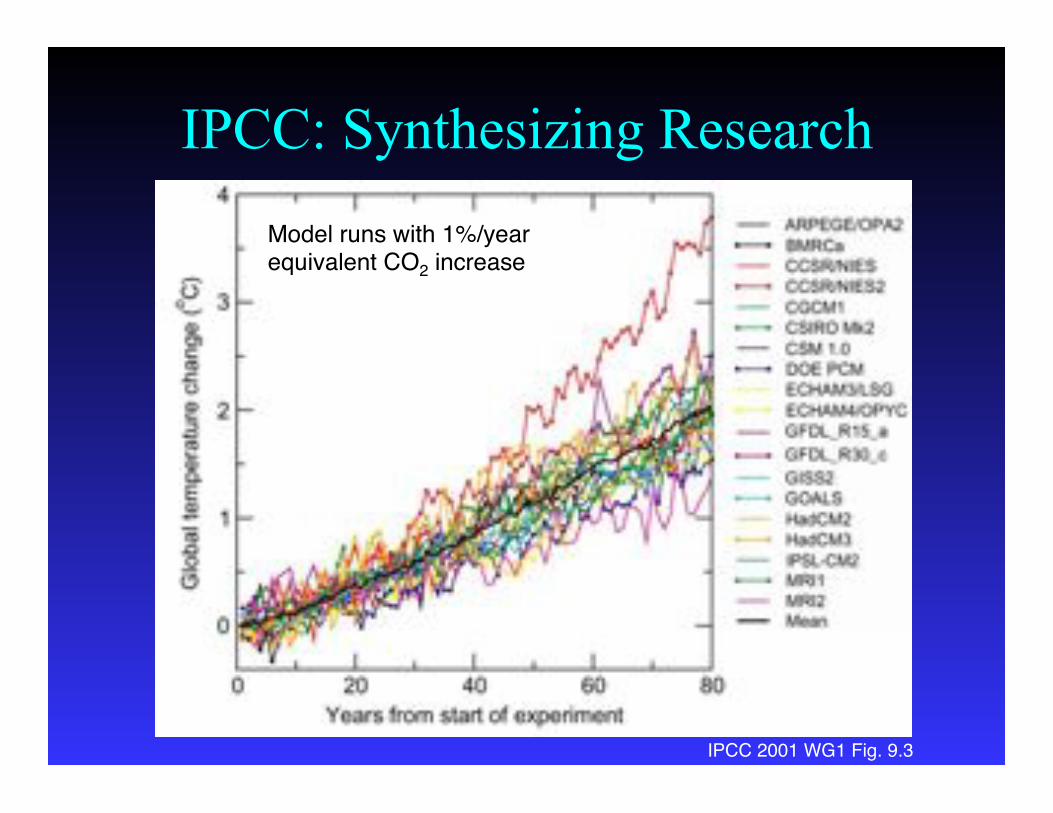
IPCC: Synthesizing Research
Model runs with 1%/year"equivalent CO2 increase#
IPCC 2001 WG1 Fig. 9.3#

!!Generally confirms IPCC TAR findings "!But with greater certainty
#!90-95% probability that we#re the cause of warming
#!Probable global average temperature rise by 2100: 1.7 - 4˚C (3-7˚F) [A1B; all scenarios 1.1 - 6.4˚C]
"!Other changes
#!More heat waves (90-95% likelihood)
#!More intense tropical storms (60-90% likelihood)
#!Estimates of sea-level rise lowered (21-48 cm; A1B scenario)
Highlights of IPCC AR4

Since IPCC AR4
!!Acceleration of Greenland ice melt "! Higher estimates of projected sea-level rise (~1 meter)
!!Record low Arctic sea-ice extents "! Ice-free North Pole in several decades?
!! Feedbacks in the carbon cycle "! Reduced ability of land and oceans to absorb CO2
!!New criteria for “dangerous anthropogenic interference in the climate system” "! 2˚C maximum global temperature rise
"! “350” movement
!! “Even higher confidence that human-induced causes dominate observed warming” "! Huber & Knutti, Nature Geoscience 4 December 2011

-0.8
-0.6
-0.4
-0.2
0
0.2
0.4
0.6
1850 1875 1900 1925 1950 1975 2000
Year
Tem
per
ature
dev
iati
on, °C
Climate Change: Is it Happening?
Source: University of East Anglia, Climatic Research Unit, updated 1/2012
http://www.cru.uea.ac.uk/cru/data/temperature/hadcrut3vgl.txt

20 Hottest Years on Record University of East Anglia Climatic Research Unit, HadCRUT3vGL, 1/2012
!!Top 10
"!1998
"!2005
"!2010
"!2003
"!2002
"!2004
"!2009
"!2006
"!2001
"!2007
!!Next 10 "!1997
"!2011
"!2008
"!1999
"!2000
"!1995
"!1990
"!1991
"!1987
"!1988

Taking Earth#s Temperature?
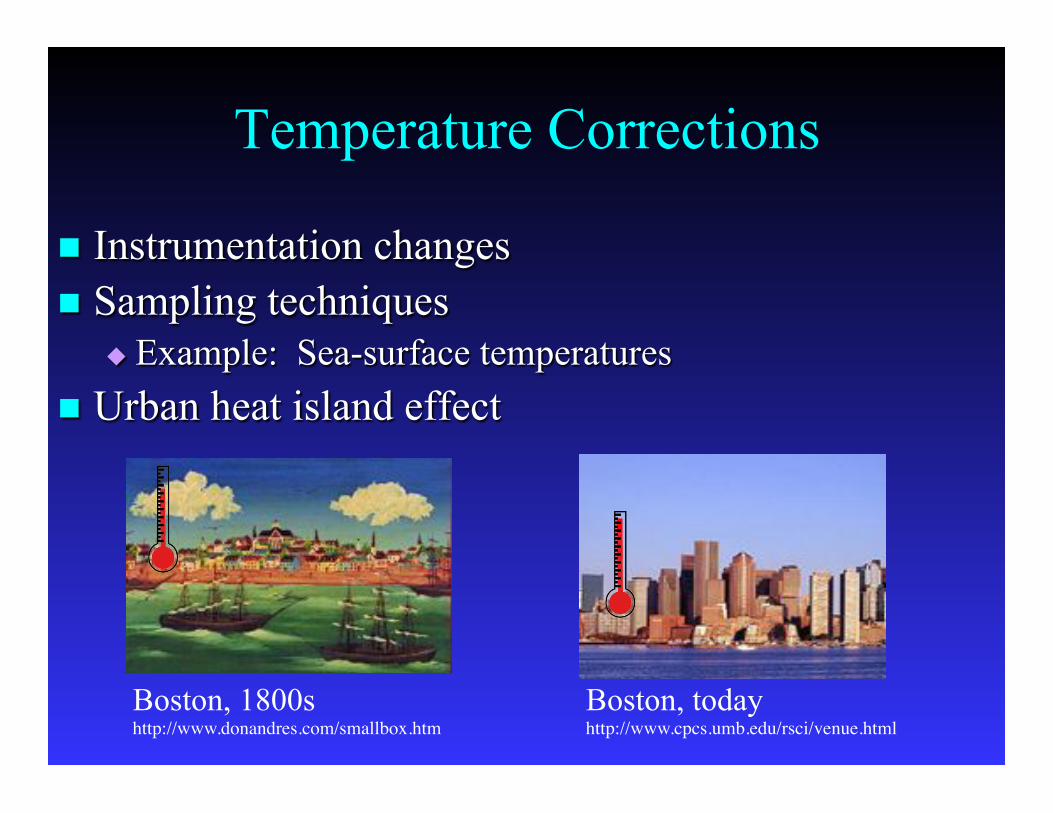
Temperature Corrections
!! Instrumentation changes
!! Sampling techniques
"!Example: Sea-surface temperatures
!!Urban heat island effect
Boston, 1800s http://www.donandres.com/smallbox.htm!
Boston, today http://www.cpcs.umb.edu/rsci/venue.html!

How Well Do We Know Earth#s Temperature?
!!Quick answer:
"!Today: Within about 0.05˚C
"!1850: Within about 0.2˚C
!!Detailed answer:
Red: Instrument uncertainties
Green: Limited coverage
Blue: Sampling bias
From Fig. 10 in Brohan, P., J.J. Kennedy, I. Haris, S.F.B. Tett and P.D. Jones, 2006:
Uncertainty estimates in regional and global observed temperature changes: a new dataset from 1850. J. Geophysical Research 111, D12106

Patterns of Temperature Change Nov 2010 – Oct 2011 versus 1951-1980 average

Other Indicators of Recent Change
!! Ice and snow "!40% decrease in arctic ice thickness in recent decades
"!40% decrease in arctic ice extent since 1950
"!10% decrease in global snow cover area since 1960s
"!Widespread retreat of non-polar glaciers
!!El Niño events "!More frequent, persistent, and intense past 30 years
!!Biological indicators "!Growing season increasing 1-4 days/decade
"!Plant and animal ranges shifting poleward 6 km/decade
"!Coral reefs bleaching

Glacier Retreat Cascade Mountains, Washington
1928! 2000!
U.S. Geological Survey South Cascade Glacier 1928 - 2000; http://nsidc.org/sotc/glacier_balance.html
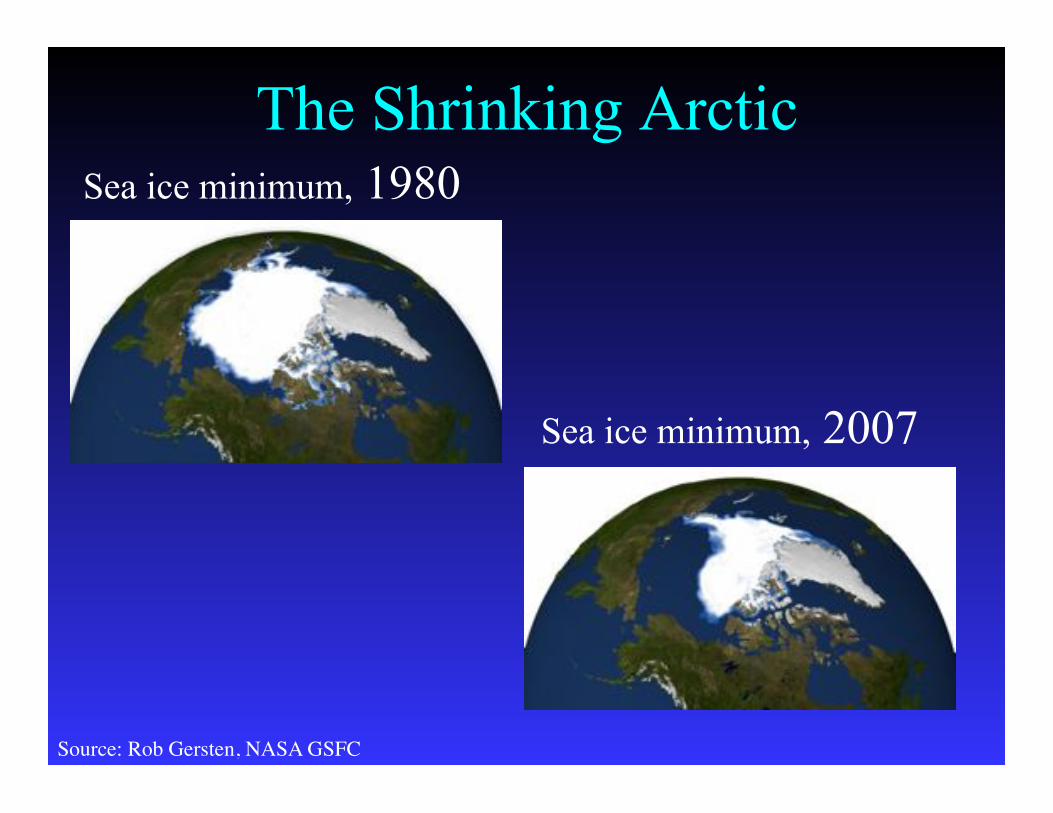
The Shrinking Arctic
Sea ice minimum, 2007
Source: Rob Gersten, NASA GSFC!
Sea ice minimum, 1980

The Shrinking Arctic
4
5
6
7
8
1980 1985 1990 1995 2000 2005 2010
Sea
-ice
are
a
(mil
lion s
quar
e kil
om
eter
s)
Year!
Data source: National Snow and Ice Data Center; 2012

Going Further Back . . .
Source: Mann et al., !Northern Hemisphere Millennial Temperature Reconstruction,""
Geophys. Res. Let., 26, 759, 1999 as reproduced in IPCC 2001 WG1!
The !Hockey Stick"
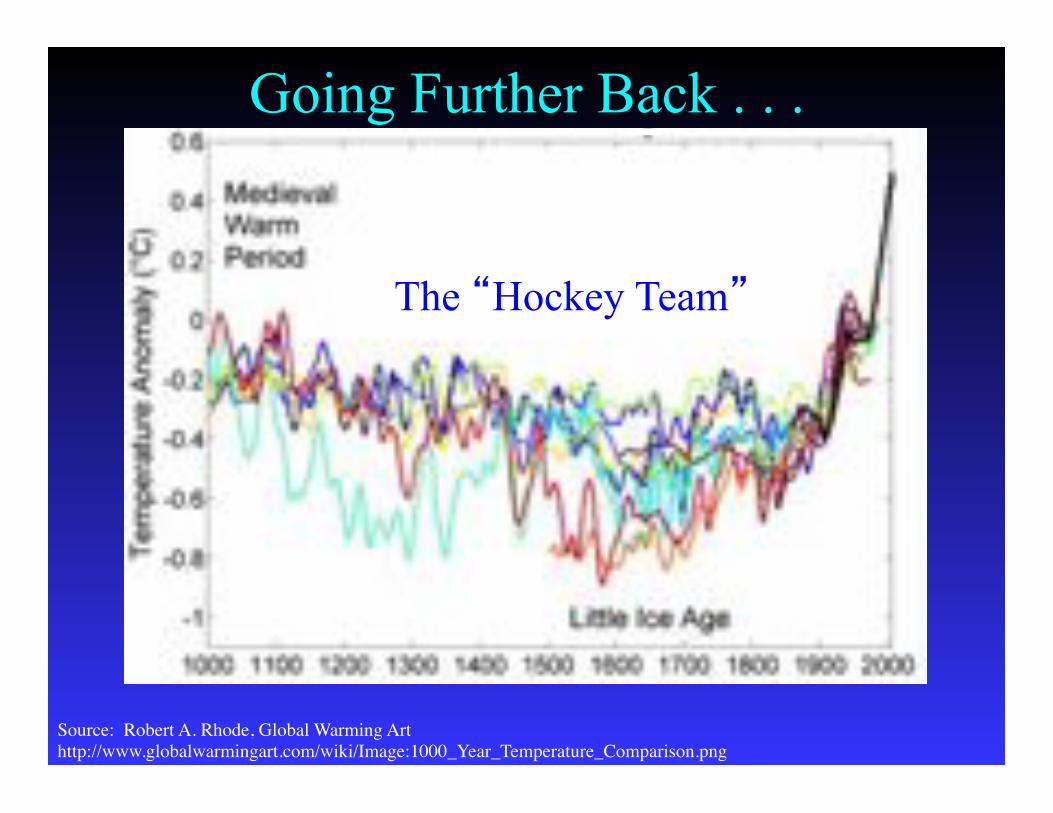
Going Further Back . . .
Source: Robert A. Rhode, Global Warming Art"
http://www.globalwarmingart.com/wiki/Image:1000_Year_Temperature_Comparison.png!
The !Hockey Team"

Millennial Temperature Reconstructions
!!Use multiple proxies to reconstruct 1000-year temperature record "!Up to 112 indicators (tree rings,
ice cores, ice melt, solar activity, sediment cores, coral reefs, etc)
"!Recent warming unprecedented in past millennium
"!Solar variability and volcanism are dominant influences on climate before 20th century
"!Anthropogenic greenhouse gases are dominant 20th century influence
"!Provides independent confirmation of human influence on climate
Tree ring photo from http://web.utk.edu/~grissino/images/small%20red%20pine.jpg
Graph from http://en.wikipedia.org/wiki/Image:Solar_Activity_Proxies.png"
Coring photo from http://serc.carleton.edu/microbelife/topics/proxies/paleoclimate.html!

Measuring Ancient Climates: Isotopes
!! Isotopes are versions of the same element
that differ in the number of neutrons in their
nuclei
"!Therefore they have different masses
Hydrogen (H-1)!
Deuterium (H-2)!
Oxygen-16!
Oxygen-18!
Proton: ! Neutron:!
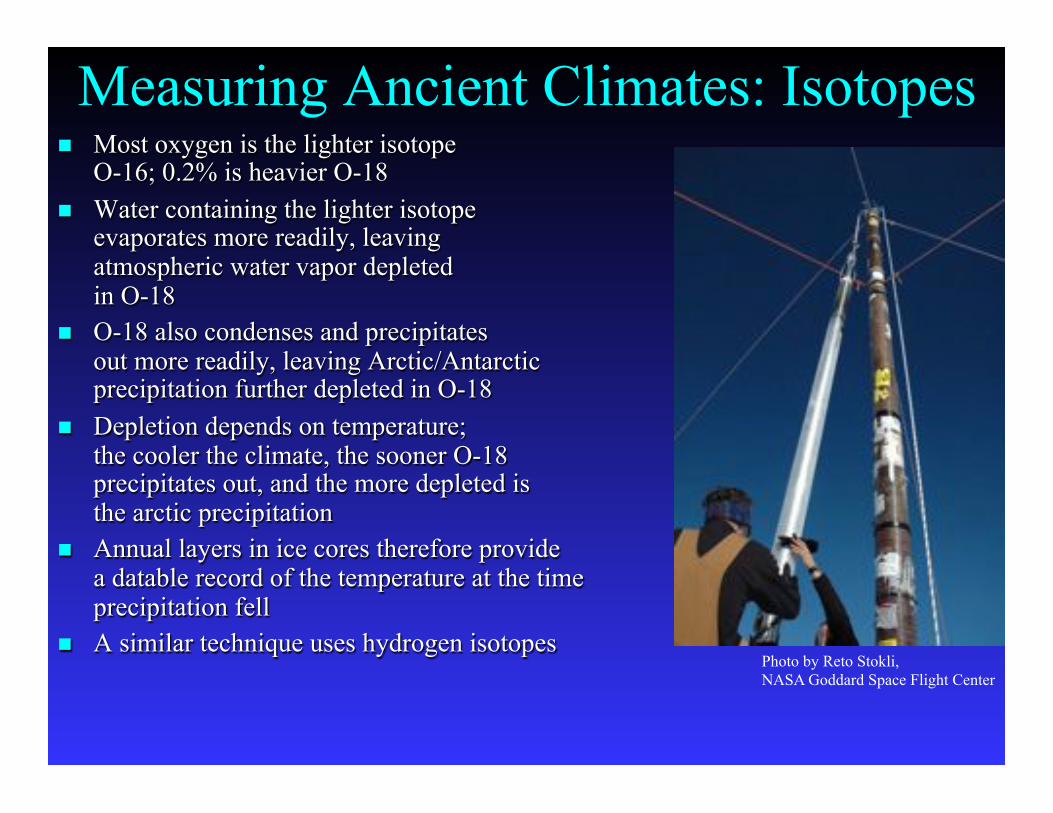
Measuring Ancient Climates: Isotopes !! Most oxygen is the lighter isotope
O-16; 0.2% is heavier O-18
!! Water containing the lighter isotope evaporates more readily, leaving atmospheric water vapor depleted in O-18
!! O-18 also condenses and precipitates out more readily, leaving Arctic/Antarctic precipitation further depleted in O-18
!! Depletion depends on temperature; the cooler the climate, the sooner O-18 precipitates out, and the more depleted is the arctic precipitation
!! Annual layers in ice cores therefore provide a datable record of the temperature at the time precipitation fell
!! A similar technique uses hydrogen isotopes Photo by Reto Stokli,
NASA Goddard Space Flight Center

Going Back Further Still… .#
-12
-10-8
-6
-4-2
0
24
6
-500 -400 -300 -200 -100 0
Thousands of years before present
Tem
per
atu
re d
evia
tio
n
(°C
)
Interglacials#
Ice Ages#
~6˚C#

Climate Science: Quick Summary
Incoming sunlight#
Outgoing infrared#

Incoming sunlight
Outgoing infrared
Sunlight in: 240 watts/m2
Infrared out: !T4
Result: T=255 K
(–18°C, 0°F)
Climate Science: Quick Summary

The Greenhouse Effect
Incoming sunlight
Outgoing infrared
Infrared re-radiated
by greenhouse gases
Result:
surface warmer
by 33°C
(Natural
greenhouse
effect)
Taverage=15˚C

A Tale of Three Planets
Planet Calc.
Temp
Actual
Temp
Venus 50 500
Earth –18 15
Mars –60 –50
Temperatures in ˚C

Greenhouse: A More Sophisticated Look
Atmosphere
Surface
IR from
atmosphere
to space
IR from
surface
IR absorbed
by GHGs
IR from
surface
to space
Verbal math: IR to space =
IR from atmosphere
+ IR from surface
– IR absorbed by GHGs
Rearrange:
IR from surface
+ (IR from atmosphere
– IR absorbed)
IR to space =

Greenhouse: A More Sophisticated Look
Atmosphere
Surface
IR from
atmosphere
to space
IR from
surface
IR absorbed
by GHGs
IR from
surface
to space
Verbal math: IR to space =
IR from surface
+ (IR from atmosphere
– IR absorbed)

Greenhouse: A More Sophisticated Look
Atmosphere
Surface
IR from
atmosphere
to space
IR from
surface
IR absorbed
by GHGs
IR from
surface
to space Physics fact:
IR to space =
IR from surface
+ (IR from atmosphere
– IR absorbed)
IR from atmosphere
depends on atmospheric
temperature
IR absorbed depends on
surface temperature
They’re equal if
temperatures are equal

Greenhouse: A More Sophisticated Look
Atmosphere
Surface
IR from
atmosphere
to space
IR from
surface
IR absorbed
by GHGs
IR from
surface
to space
IR to space =
IR from surface
+ (IR from atmosphere
– IR absorbed)
Yellow term is zero if
temperatures are equal
Yellow term is negative
if atmosphere is cooler
than surface

Greenhouse: A More Sophisticated Look
Atmosphere
Surface
IR from
atmosphere
to space
IR from
surface
IR absorbed
by GHGs
IR from
surface
to space
IR to space =
IR from surface
+ (IR from atmosphere
– IR absorbed)
Yellow term is negative
if atmosphere is cooler
than surface
Energy balance:
IR to space =
solar energy input
Conclusion: cooler
atmosphere requires
surface to be warmer
than it would be without
greenhouse gases
Incoming
sunlight

…and a Greenhouse !Fingerprint"
Adapted from
IPCC AR4 Fig 3.17

Earth#s Energy Balance: Details
Source: Trenberth, Fasullo, & Kiehl, 2009, Bull. Am. Met. Soc., 90, 311, March 2009; DOI:10.1175/2008BAMS2634.1

Earth#s Energy (im)Balance
Source: Trenberth, Fasullo, & Kiehl, 2009, Bull. Am. Met. Soc., 90, 311, March 2009; DOI:10.1175/2008BAMS2634.1
Outgoing: 101.9 + 238.5 = 340.4 Incoming: 341.3 Imbalance: 0.9 W/m2

A Human Influence? Causes of temperature change, 1850s to 2000s
Source: Huber & Knutti, Nature Geoscience 4 December 2011; DOI 10.1038/NGEO1327
CO2

13.0
13.5
14.0
14.5
1850 1900 1950 2000
250
275
300
325
350
375
400
CO
2 (
par
ts p
er m
illi
on)
Focus on CO2
Year
Sources: Temperature: University of East Anglia Climate Research Unit, updated 1/12; CO2: Through 1953 - Siple Station, Antarctica; Friedli et al. 1986 Nature 324, 237;
1959 – NOAA at ftp://ftp.cmdl.noaa.gov/ccg/co2/trends/
!
Glo
bal
aver
age
tem
p, °C
310!
320!
330!
340!
350!
360!
370!
380!
390!
400!
1960! 1980! 2000!
CO
2 (ppm
)

250
275
300
325
350
375
400
1000 1250 1500 1750 2000
CO
2 (
par
ts p
er m
illi
on)
Year
CO2 Over the Millennium

How do we know we’ve caused the
recent CO2 increase? !! Fossil fuels are commercial commodities
"! We track their consumption; it’s consistent with increases in atmospheric CO2
!! The atmosphere is becoming depleted in radioactive carbon-14 (t1/2=5700 years) and in stable carbon-13
"! C-14 depletion means new carbon has been out of contact with the atmosphere for a long time
"! Plants take up C-12 preferentially over C-13, so C-13 depletion suggests new carbon originated in plant biomass
"! Fossil fuels have been buried for hundreds of millions of years, and they come from plants
!! Oxygen content of the atmosphere is decreasing, consistent with fossil fuel combustion
"! O2 combining with carbon to make CO2

and Temperature
150
200
250
300
350
400
-400 -350 -300 -250 -200 -150 -100 -50 0
Thousands of Years Before Present
CO
2 C
on
cen
trati
on
(p
pm
)400,000 Years of CO2
Today:
392 ppm

Climate Models: Projecting Future Climate
!!A contemporary
climate model:
HadGEM2-ES
"!>1 million atmosphere
cells
"!40 ocean levels
"!9 types of vegetation
"!Carbon & sulfur cycles
"!Atmospheric chemistry
"!1 hour computer time =
1 month’s climate
Source: Ruddiman, Earth’s Climate: Past and Future

Why Believe Climate Models?
The Pinatubo !Experiment"
Source: IPCC 1996 WG1 p. 33

Why Believe Climate Models? They reproduce observed patterns, and not just temperature:
Source: IPCC AR4 WG1 Fig 8.5
Annual mean precipitation
Observed
Simulation,
multi-model mean

Why Believe Climate Models?
Source: Caspar Ammann, National Center for Atmospheric Research
They explain recent climate change:

IPCC Climate Projections
!!Depend on human behavior
!! IPCC Emissions Scenarios (SRES)
Economic
emphasis
Environmental
emphasis Global Regional
A1
B2
A2
B1
FI: fossil intensive
B: balanced
T: new technologies
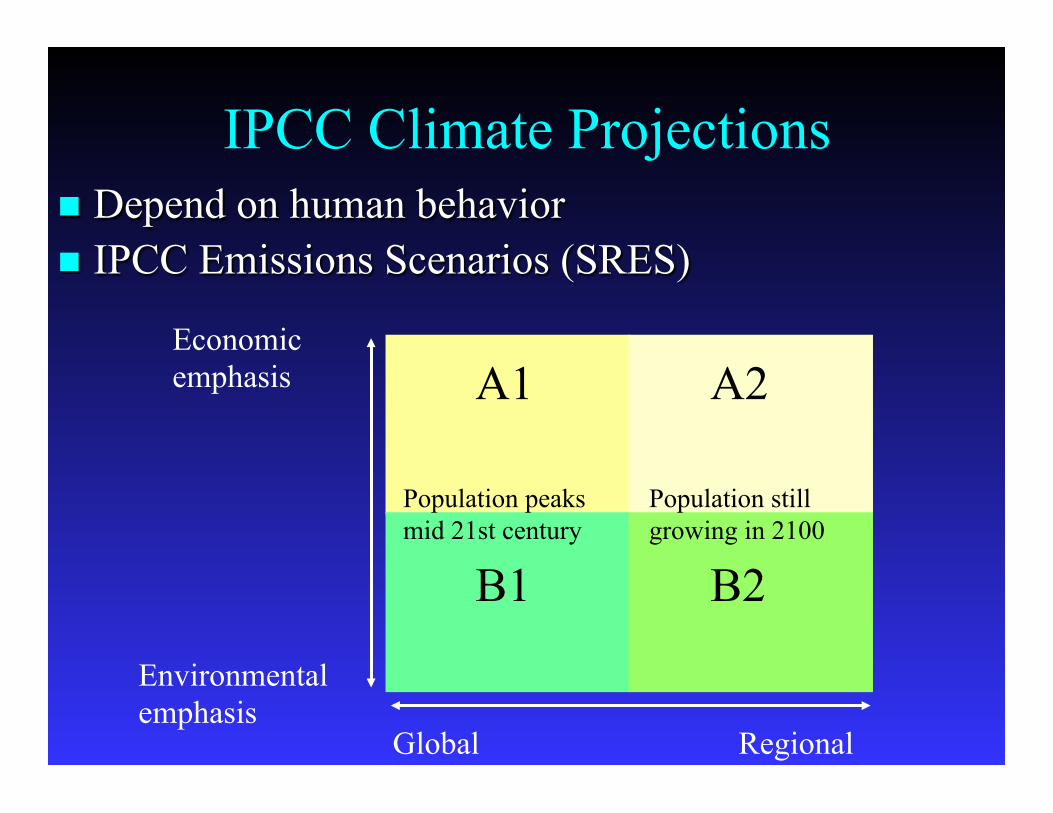
IPCC Climate Projections
!!Depend on human behavior
!! IPCC Emissions Scenarios (SRES)
Economic
emphasis
Environmental
emphasis Global Regional
A1
B2
A2
B1
Population peaks
mid 21st century Population still
growing in 2100

CO2 Emissions in the IPCC Scenarios
Source: IPCC 2001 WG1 TS Fig 17

Source: IPCC 2001 WG1 TS Fig 17
CO2 Concentration Scenarios
400
600
800
1000
2020 2040 2060 2080 2100 2000
Year
CO
2 c
once
ntr
atio
n (
ppm
)
2 $ pre-industrial
350

Temperature Scenarios
Source: IPCC AR4 WG1 Fig. SPM-5

Projected Temperature Increases
Source: IPCC 2007 WG1 Fig SPM-6
Temperature increase, ˚C
A1B scenario
2020-2029
A1B scenario
2090-2099

Why Do a Few Degrees Matter?
!! That#s a global average; many areas will warm a lot more
(previous slide)
!! A few degrees is climatological significant;
~6˚ separates us
from the last ice age
!! A small rise in the mean
temperature greatly
increases the probability
of extreme events Temperature
Pro
bab
ilit
y

Other Impacts !! Precipitation changes
"!More overall precipitation
"!More intense precipitation events - more floods
"!Drier continental interiors - more droughts
!! Increased tropical storm intensity "!Storm frequency uncertain
!! Sea-level rise "!Melting land ice
"!Thermal expansion
"!~1 meter by 2100
!!Ocean acidification "!CO2 + H2O ! H2CO3
27
27.5
28
28.5
29
1960 1970 1980 1990 2000 2010 2020
Hu
rric
an
e en
ergy
Sea
su
rfac
e te
mp
erat
ure
(˚C
)
Year

http://www.thedayaftertomorrow.com/!
Climate Surprises? !! Shutdown of thermohaline circulation
"!Much variability in THC; no coherent trends
"!Major changes unlikely before 2100
"!Probability of surprises rises after 2100

It Doesn’t Stop at 2100
Source: IPCC 2001 Synthesis Report Fig SPM-5

21st Century Warming: A Millennial Perspective
3˚C
~600 ppm CO2
2100
21st century temperature rise
IPCC mid-range projection
Copenhagen, Cancun goal:
Limit temperature rise to
2˚C above preindustrial

350: The Science Behind the Number
Forcing
Global temperature
change
CO2 450 ppm!CO2 450 ppm!CO2 450 ppm!
The Argument for 350 Hansen et al., “Target Atmospheric CO2:
Where Should Humanity Aim?”
The Open Atmospheric Science Journal,
2008, 2, 217-231

Climate Change: Sound and Sight Bites
!! Global temperature rising
!! Arctic ice disappearing
!! Why? Anthropogenic greenhouse gas emissions
!! CO2 levels 40% higher than in past 20 million years
!! The future "! Substantial warming
"! Significant impacts
!! Soundbites "! IPCC 2007: !warming is unequivocal…due to anthropogenic greenhouse
gas[es]"
"! Nature Geoscience 2011: “Even higher confidence that human-induced causes dominate observed warming”