Global Warming Debate Devin MacGoy 2012. Introduction Irregular Weather Patterns Increasing Global...
35
Global Warming Debate Devin MacGoy 2012
-
Upload
bonnie-wilkins -
Category
Documents
-
view
219 -
download
2
Transcript of Global Warming Debate Devin MacGoy 2012. Introduction Irregular Weather Patterns Increasing Global...
Global Warming DebateDevin MacGoy
2012

•Introduction
•Irregular Weather Patterns
•Increasing Global Temperatures
•Worsening Human Health?
•Changing animal populations and changing animal behavior
•People and Groups who agree that Global Warming Exists

Global warming, also called climate change, is a severe consequence of air pollution, according to most scientists. According to the scientific theory, the burning of fossil fuels causes an excess of carbon dioxide in the air. This dense layer of gas blankets the planet and holds in hot air, producing what scientists call the “greenhouse effect.” As a result, Earth’s average temperature is rising. Not only does this mean hotter summers, but the polar ice caps are quickly melting as well. As these massive bodies of ice drip into the ocean, sea levels rise and threaten to flood low-lying coastal areas. Earth’s temperature has, historically, changed and shifted throughout its long history; however, the speed of the climate shift currently underway has led the large majority of the world’s scientists to conclude that human activity is causing the climate change.
When nothing is done about the air pollution, it remains in the air thus increasing the greenhouse effect and making the earth’s temperature rise.
An atmosphere with natural levels of greenhouse gases (left) compared to an atmosphere of increased greenhouse effect (right).
http://ic.galegroup.com/ic/scic/ImagesDetailsPage/ImagesDetailsWindow?displayGroupName=Images&total=&currPage=1&query=&action=e&windowstate=normal&catId=GALE%7C00000000MU84&view=docDisplay&documentId=GALE%7CCV2210053070&mode=view

http://go.galegroup.com/ps/retrieve.do?sgHitCountType=None&sort=RELEVANCE&inPS=true&prodId=ITOF&userGroupName=loudoun_main&tabID=Images&searchId=R2&resultListType=RESULT_LIST&contentSegment=&searchType=BasicSearchForm¤tPosition=20&contentSet=GALE%7CCT3294260022&&docId=GALE|CT3294260022&docType=GALE&role=
http://go.galegroup.com/ps/retrieve.do?sgHitCountType=None&sort=RELEVANCE&inPS=true&prodId=ITOF&userGroupName=loudoun_main&tabID=Images&searchId=R2&resultListType=RESULT_LIST&contentSegment=&searchType=BasicSearchForm¤tPosition=4&contentSet=GALE%7CCT3294211378&&docId=GALE|CT3294211378&docType=GALE&role=

http://go.galegroup.com/ps/retrieve.do?sgHitCountType=None&sort=RELEVANCE&inPS=true&prodId=ITOF&userGroupName=loudoun_main&tabID=Images&searchId=R2&resultListType=RESULT_LIST&contentSegment=&searchType=BasicSearchForm¤tPosition=11&contentSet=GALE%7CCT3294260139&&docId=GALE|CT3294260139&docType=GALE&role=
http://go.galegroup.com/ps/retrieve.do?sgHitCountType=None&sort=RELEVANCE&inPS=true&prodId=ITOF&userGroupName=loudoun_main&tabID=Images&searchId=R2&resultListType=RESULT_LIST&contentSegment=&searchType=BasicSearchForm¤tPosition=18&contentSet=GALE%7CCT3294260147&&docId=GALE|CT3294260147&docType=GALE&role=
http://go.galegroup.com/ps/retrieve.do?sgHitCountType=None&sort=RELEVANCE&inPS=true&prodId=ITOF&userGroupName=loudoun_main&tabID=Images&searchId=R2&resultListType=RESULT_LIST&contentSegment=&searchType=BasicSearchForm¤tPosition=19&contentSet=GALE%7CCT3294260627&&docId=GALE|CT3294260627&docType=GALE&role=

http://go.galegroup.com/ps/retrieve.do?sgHitCountType=None&sort=RELEVANCE&inPS=true&prodId=ITOF&userGroupName=loudoun_main&tabID=Images&searchId=R2&resultListType=RESULT_LIST&contentSegment=&searchType=BasicSearchForm¤tPosition=28&contentSet=GALE%7CCT3294260592&&docId=GALE|CT3294260592&docType=GALE&role=
The Earth could warm another 2 to 11.5°F this century if we fail to reduce emissions from burning fossil fuels and deforestation—devastating our livelihoods and the natural world we cherish.

Thinning ice, rising seasRising seas are one of the most certain effects of global warming as warming ocean waters expand and melting glaciers, ice caps and ice sheets add more water to the oceans. The IPCC estimates that melting ice caps and glaciers—which are some of our most visible indicators of climate change—accounted for about 25% of sea level rise from 1993 to 2003.Arctic sea ice is shrinking Satellite images show that the extent of Arctic summer sea ice has decreased by almost 9% per decade since 1979. The Arctic summer could be ice-free by mid-century, according to a study by the National Oceanic and Atmospheric Administration.
Sea Level RiseDuring the 20th century, sea level rose an average of 7 inches after 2,000 years of relatively little change. The2007 IPCC report conservatively predicts that sea levels could rise 10 to 23 inches by 2100 if current warming patterns continue.In the U.S., roughly 100 million people live in coastal areas within 3 feet of mean sea level. Low-lying cities such as Boston, Miami and New York are vulnerable.The U.S. Geological Survey, EPA and NOAA issued a joint report in 2009 warning that most mid-Atlantic coastal wetlands from New York to North Carolina will be lost with a sea level rise of 3 feet or more. North Carolina's barrier islands would be significantly breached and flooding would destroy the Florida Everglades.Melting glaciersA 2005 survey of 442 glaciers from the World Glacier Monitoring Service found that 90% of the world's glaciers are shrinking as the planet warms.Glacier National Park now has only 25 glaciers, versus 150 in 1910. At the current rate of retreat, the glaciers in Glacier National Park could be gone in a matter of decades, according to some scientists.
Side by side comparisons of sea ice from 1979 and 2003.
http://www.nasa.gov/centers/goddard/news/topstory/2003/1023esuice.html
http://data.giss.nasa.gov/gistemp/graphs_v3/
http://data.giss.nasa.gov/gistemp/2011/ - very important temperature graphs!!!

Glaciers are melting, sea levels are rising, cloud forests are drying, and wildlife is scrambling to keep pace. It's becoming clear that humans have caused most of the past century's warming by releasing heat-trapping gases as we power our modern lives. Called greenhouse gases, their levels are higher now than in the last 650,000 years.We call the result global warming, but it is causing a set of changes to the Earth's climate, or long-term weather patterns, that varies from place to place. As the Earth spins each day, the new heat swirls with it, picking up moisture over the oceans, rising here, settling there. It's changing the rhythms of climate that all living things have come to rely upon.What will we do to slow this warming? How will we cope with the changes we've already set into motion? While we struggle to figure it all out, the face of the Earth as we know it—coasts, forests, farms and snow-capped mountains—hangs in the balance.

Greenhouse effectThe "greenhouse effect" is the warming that happens when certain gases in Earth's atmosphere trap heat. These gases let in light but keep heat from escaping, like the glass walls of a greenhouse.First, sunlight shines onto the Earth's surface, where it is absorbed and then radiates back into the atmosphere as heat. In the atmosphere, “greenhouse” gases trap some of this heat, and the rest escapes into space. The more greenhouse gases are in the atmosphere, the more heat gets trapped.Scientists have known about the greenhouse effect since 1824, when Joseph Fourier calculated that the Earth would be much colder if it had no atmosphere. This greenhouse effect is what keeps the Earth's climate livable. Without it, the Earth's surface would be an average of about 60 degrees Fahrenheit cooler. In 1895, the Swedish chemist Svante Arrhenius discovered that humans could enhance the greenhouse effect by making carbon dioxide, a greenhouse gas. He kicked off 100 years of climate research that has given us a sophisticated understanding of global warming.Levels of greenhouse gases (GHGs) have gone up and down over the Earth's history, but they have been fairly constant for the past few thousand years. Global average temperatures have stayed fairly constant over that time as well, until recently. Through the burning of fossil fuels and other GHG emissions, humans are enhancing the greenhouse effect and warming Earth.Scientists often use the term "climate change" instead of global warming. This is because as the Earth's average temperature climbs, winds and ocean currents move heat around the globe in ways that can cool some areas, warm others, and change the amount of rain and snow falling. As a result, the climate changes differently in different areas.
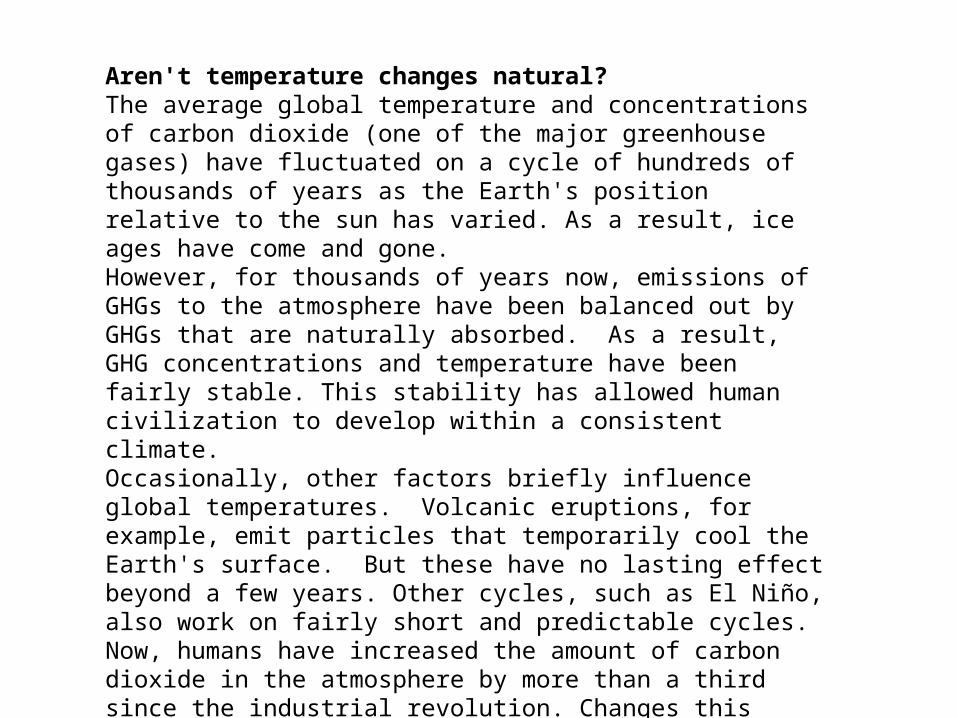
Aren't temperature changes natural?The average global temperature and concentrations of carbon dioxide (one of the major greenhouse gases) have fluctuated on a cycle of hundreds of thousands of years as the Earth's position relative to the sun has varied. As a result, ice ages have come and gone.However, for thousands of years now, emissions of GHGs to the atmosphere have been balanced out by GHGs that are naturally absorbed. As a result, GHG concentrations and temperature have been fairly stable. This stability has allowed human civilization to develop within a consistent climate.Occasionally, other factors briefly influence global temperatures. Volcanic eruptions, for example, emit particles that temporarily cool the Earth's surface. But these have no lasting effect beyond a few years. Other cycles, such as El Niño, also work on fairly short and predictable cycles.Now, humans have increased the amount of carbon dioxide in the atmosphere by more than a third since the industrial revolution. Changes this large have historically taken thousands of years, but are now happening over the course of decades.

Why is this a concern?The rapid rise in greenhouse gases is a problem because it is changing the climate faster than some living things may be able to adapt. Also, a new and more unpredictable climate poses unique challenges to all life.Historically, Earth's climate has regularly shifted back and forth between temperatures like those we see today and temperatures cold enough that large sheets of ice covered much of North America and Europe. The difference between average global temperatures today and during those ice ages is only about 5 degrees Celsius (9 degrees Fahrenheit), and these swings happen slowly, over hundreds of thousands of years.Now, with concentrations of greenhouse gases rising, Earth's remaining ice sheets (such as Greenland and Antarctica) are starting to melt too. The extra water could potentially raise sea levels significantly.As the mercury rises, the climate can change in unexpected ways. In addition to sea levels rising, weather can become more extreme. This means more intense major storms, more rain followed by longer and drier droughts (a challenge for growing crops), changes in the ranges in which plants and animals can live, and loss of water supplies that have historically come from glaciers.Scientists are already seeing some of these changes occurring more quickly than they had expected. According to the Intergovernmental Panel on Climate Change, eleven of the twelve hottest years since thermometer readings became available occurred between 1995 and 2006.
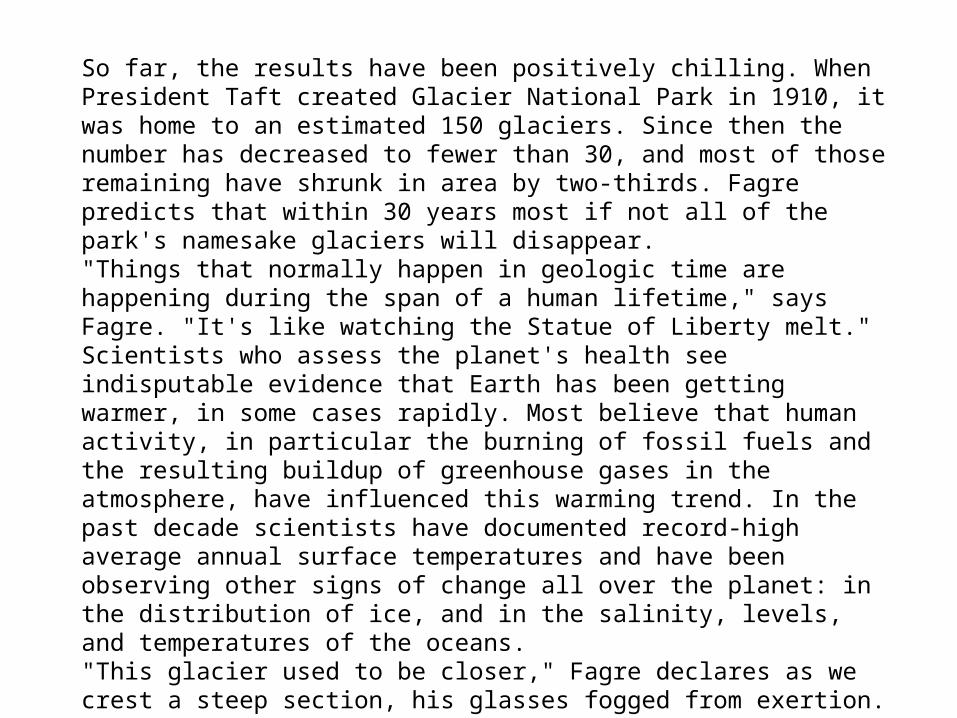
So far, the results have been positively chilling. When President Taft created Glacier National Park in 1910, it was home to an estimated 150 glaciers. Since then the number has decreased to fewer than 30, and most of those remaining have shrunk in area by two-thirds. Fagre predicts that within 30 years most if not all of the park's namesake glaciers will disappear."Things that normally happen in geologic time are happening during the span of a human lifetime," says Fagre. "It's like watching the Statue of Liberty melt."Scientists who assess the planet's health see indisputable evidence that Earth has been getting warmer, in some cases rapidly. Most believe that human activity, in particular the burning of fossil fuels and the resulting buildup of greenhouse gases in the atmosphere, have influenced this warming trend. In the past decade scientists have documented record-high average annual surface temperatures and have been observing other signs of change all over the planet: in the distribution of ice, and in the salinity, levels, and temperatures of the oceans."This glacier used to be closer," Fagre declares as we crest a steep section, his glasses fogged from exertion. He's only half joking. A trailside sign notes that since 1901, Sperry Glacier has shrunk from more than 800 acres (320 hectares) to 300 acres (120 hectares). "That's out of date," Fagre says, stopping to catch his breath. "It's now less than 250 acres (100 hectares)."

Everywhere on Earth ice is changing. The famed snows of Kilimanjaro have melted more than 80 percent since 1912. Glaciers in the Garhwal Himalaya in India are retreating so fast that researchers believe that most central and eastern Himalayan glaciers could virtually disappear by 2035. Arctic sea ice has thinned significantly over the past half century, and its extent has declined by about 10 percent in the past 30 years. NASA's repeated laser altimeter readings show the edges of Greenland's ice sheet shrinking. Spring freshwater ice breakup in the Northern Hemisphere now occurs nine days earlier than it did 150 years ago, and autumn freeze-up ten days later. Thawing permafrost has caused the ground to subside more than 15 feet (4.6 meters) in parts of Alaska. From the Arctic to Peru, from Switzerland to the equatorial glaciers of Man Jaya in Indonesia, massive ice fields, monstrous glaciers, and sea ice are disappearing, fast.

NASA Finds 2011 Ninth Warmest Year on RecordJan. 19, 2012The global average surface temperature in 2011 was the ninth warmest since 1880, according to NASA scientists. The finding continues a trend in which nine of the 10 warmest years in the modern meteorological record have occurred since the year 2000.NASA's Goddard Institute for Space Studies (GISS) in New York, which monitors global surface temperatures on an ongoing basis, released an updated analysis that shows temperatures around the globe in 2011 compared to the average global temperature from the mid-20th century. The comparison shows how Earth continues to experience warmer temperatures than several decades ago. The average temperature around the globe in 2011 was 0.92°F (0.51°C) warmer than the mid-20th century baseline.As greenhouse gas emissions from energy production, industry and vehicles have increased, temperatures have climbed, most notably since the late 1970s.http://www.giss.nasa.gov/research/news/20120119/

"We know the planet is absorbing more energy than it is emitting," said GISS director James E. Hansen. "So we are continuing to see a trend toward higher temperatures. Even with the cooling effects of a strong La Niña influence and low solar activity for the past several years, 2011 was one of the 10 warmest years on record."The difference between 2011 and the warmest year in the GISS record (2010) is 0.22°F (0.12°C). This underscores the emphasis scientists put on the long-term trend of global temperature rise. Because of the large natural variability of climate, scientists do not expect temperatures to rise consistently year after year. However, they do expect a continuing temperature rise over decades.The first 11 years of the 21st century experienced notably higher temperatures compared to the middle and late 20th century, Hansen said. The only year from the 20th century in the top 10 warmest years on record is 1998.

Higher temperatures today are largely sustained by increased atmospheric concentrations of greenhouse gases, especially carbon dioxide. These gases absorb infrared radiation emitted by Earth and release that energy into the atmosphere rather than allowing it to escape to space. As their atmospheric concentration has increased, the amount of energy "trapped" by these gases has led to higher temperatures.While average global temperature will still fluctuate from year to year, scientists focus on the decadal trend. Nine of the 10 warmest years since 1880 have occurred since the year 2000, as the Earth has experienced sustained higher temperatures than in any decade during the 20th century. As greenhouse gas emissions and atmospheric carbon dioxide levels continue to rise, scientists expect the long-term temperature increase to continue as well. (Data source: NASA Goddard Institute for Space Studies. Image credit: NASA Earth Observatory, Robert Simmon)

The carbon dioxide level in the atmosphere was about 285 parts per million in 1880, when the GISS global temperature record begins. By 1960, the average concentration had risen to about 315 parts per million. Today it exceeds 390 parts per million and continues to rise at an accelerating pace.The temperature analysis produced at GISS is compiled from weather data from more than 1,000 meteorological stations around the world, satellite observations of sea surface temperature and Antarctic research station measurements. A publicly available computer program is used to calculate the difference between surface temperature in a given month and the average temperature for the same place during 1951 to 1980. This three-decade period functions as a baseline for the analysis.

The Earth's atmosphere has already warmed by 1.5 degrees Fahrenheit since 1900. This warming signal is also found in ocean temperatures, soil temperatures, melting glaciers and melting polar ice caps. Since the Industrial Revolution, the burning of coal, oil and natural gas has emitted roughly 500 billion tons of CO2, about half of which remains in the atmosphere. ~According to the National Wildlife Federation http://www.nasa.gov/topics/earth/features/coldweather-2009.htmlThe number of vehicles on the road has increased over the years, so it makes total sense that there are more carbon dioxide emissions in the atmosphere, thus contributing to the greenhouse effect. Number of Vehicles on the Road:http://www.bts.gov/publications/national_transportation_statistics/2002/html/table_01_11.html Ice is melting worldwide, especially at the Earth’s poles. This includes mountain glaciers, ice sheets covering West Antarctica and Greenland, and Arctic sea ice.Researcher Bill Fraser has tracked the decline of the Adélie penguins on Antarctica, where their numbers have fallen from 32,000 breeding pairs to 11,000 in 30 years.http://www.wunderground.com/blog/JeffMasters/comment.html?entrynum=1831

Satellite documents thinning ice shelfBy the CNN Wire Staffupdated 5:26 PM EDT, Thu April 5, 2012
Satellite images from 2002, left, and 2012 reveal the disintegration of the Antarctic ice shelf.

STORY HIGHLIGHTS
•The Larsen B ice shelf has decreased dramatically since March 2002
•The European Space Agency blames it on warmer temperatures
•Another Larsen ice shelf disintegrated and a third is stable
(CNN) -- A European satellite has observed a rapid retreat of one of Antarctica's ice shelves, which is half the size it was 10 years ago, the European Space Agency said Thursday.The agency's Envisat satellite shows part of the Larsen Ice Shelf, which lies on a peninsula south of Chile, has decreased from 3,463 square kilometers (1,337 square miles) in March 2002 to 1,670 square kilometers (645 square miles) today, a change the European Space Agency blames on warmer temperatures."Ice shelves are sensitive to atmospheric warming and to changes in ocean currents and temperatures," Helmut Rott from the University of Innsbruck said in an statement from the space agency. "The northern Antarctic Peninsula has been subject to atmospheric warming of about 2.5 degrees Celsius (36.5 degrees Fahrenheit) over the last 50 years -- a much stronger warming trend than on global average, causing retreat and disintegration of ice shelves."The waning is happening on the Larsen B ice shelf, one of three shelves that make up the Larsen Ice Shelf.Larsen A disintegrated in January 1995. Larsen C has so far been stable, the space agency said, though satellites have observed some recent thinning and melting.Larsen B measured 11,512 square kilometers in January 1995. It went down to 6,664 square kilometers in February 2002 after several parts broke off, and a month later Larsen B was down to 3,463 square kilometers.The space agency says the satellite's observations confirm the vulnerability of the ice shelves to climatic warming.

Irregular Weather Patterns and the Joplin Tornado (me)http://www.popsci.com/science/article/2012-01/did-global-warming-destroy-my-hometown-0?page=all In the phony scandal called Climategate, in which skeptics used out-of-context bits from stolen e-mails to make it sound as if researchers were engaged in some great conspiracy.
On May 22, 2011, a geostationary satellite 22,300 miles overhead recorded a large collection of cloud lines drifting over southeastern Kansas. At around 2 p.m., one of the cloud lines exploded, like a cartographic-scale dry-ice bomb. Over the next five hours the National Oceanic and Atmospheric Administration monitored the growing super cell thunderstorm as it drifted toward a city in south western Missouri called Joplin. Just after 5 p.m., two storm chasers driving toward the western edge of Joplin, Missouri, spotted a translucent set of tendrils reaching down from the storm’s low black thunderhead. Almost as quickly as they formed, the tendrils disappeared. And then things took a turn. A dark blob half a mile wide congealed and dropped from the clouds. As it touched the ground, it filled with sparks from ruptured power lines, like a jar of fireflies.

The tornado intensified as it strafed the roofs and treetops of Joplin’s western suburbs. By the time it reached the city limits, where 49,000 people lived, it had evolved into an EF-5, the most destructive type of tornado on the Enhanced Fujita scale. Unlike EF-4s, which are merely “devastating,” EF-5s produce “incredible” damage. An EF-4 is powerful enough to scrape civilization off the planet in a matter of minutes. An EF-5 is more powerful still. When the storm hit Joplin, the winds inside the funnel were spinning faster than 200 mph—yet the whole column was crawling forward at less than 10 mph, giving it time to wood-chip everything beneath it. The tornado produced a good deal of incredible, EF-5-worthy damage in the office park that surrounded St. John’s Hospital, one of the region’s major medical centers. In 45 seconds, it shifted the nine-story structure four inches off its foundation.

By then, the tornado was three quarters of a mile wide. As it tacked slightly to the north, it flattened a downtrodden swath of old Main Street. After gnawing through half a dozen intervening residential blocks, the tornado hit Joplin High School, a recently refurbished brick complex at the town’s middle-class core. Security cameras intended to monitor lunch-hour skippers now recorded surges of water that rendered the parking lot indistinguishable from a harbor in a hurricane. Inside, chairs and papers swarmed as the walls began to collapse.
The tornado churned on to the east, tagging its path with bizarre signatures—wood piercing asphalt, rubber piercing wood. It shaved away the neighborhood just east of the high school, including the little white one-story house where I spent my teenage years. It continued toward the main thoroughfare, Range Line Road, and destroyed a Home Depot, an Academy Sports & Outdoors, a Wal-Mart and a Pizza Hut, shot gunning shoppers with glass and metal and wood, burying some beneath cinder blocks, and needling others with blades of grass.

Meteorologists watching radar screens at a safe remove now saw a white-pink blob representing the tornado’s swirl of debris swing through the rest of the city like a wrecking ball. But when it reached the open pasture at Joplin’s eastern edge, the tornado—as if it had been fueled by manmade structures and was now depleted—delivered a few dying spasms and vanished. By the time the tornado was finished, it had destroyed 20 percent of the property in Joplin, killed 161 people, and injured 1,150 more, all in a town with just 49,000 residents. It’s very hard to prove whether global warming is the cause of extreme weather, but it is easy to see the disturbing correlation.Was this extremely devastating, once-in-a-lifetime tornado caused by global warming? We can’t tell for sure, but the facts are there.
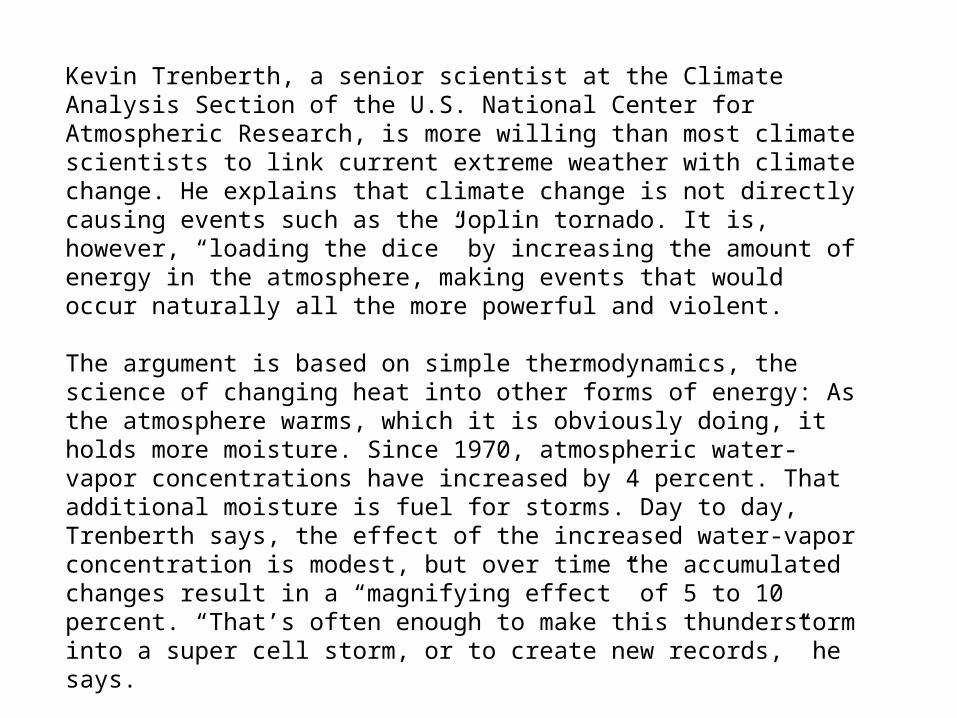
Kevin Trenberth, a senior scientist at the Climate Analysis Section of the U.S. National Center for Atmospheric Research, is more willing than most climate scientists to link current extreme weather with climate change. He explains that climate change is not directly causing events such as the Joplin tornado. It is, however, “loading the dice” by increasing the amount of energy in the atmosphere, making events that would occur naturally all the more powerful and violent. The argument is based on simple thermodynamics, the science of changing heat into other forms of energy: As the atmosphere warms, which it is obviously doing, it holds more moisture. Since 1970, atmospheric water-vapor concentrations have increased by 4 percent. That additional moisture is fuel for storms. Day to day, Trenberth says, the effect of the increased water-vapor concentration is modest, but over time the accumulated changes result in a “magnifying effect” of 5 to 10 percent. “That’s often enough to make this thunderstorm into a super cell storm, or to create new records,” he says.

But the Joplin tornado is not the only extreme weather happening recently. 70-degree days in January; droughts followed by floods followed by droughts; ice storms causing power outages not seen in the area since the advent of electricity; Texas experiencing its driest year in history; Illinois, Indiana, Kentucky, Ohio, Pennsylvania, and West Virginia all recording their wettest April in 116 years; and the Mississippi River flooding three million acres in three states. According to meteorologist Jeff Masters, “Any one of the extreme weather events of 2010”—a year whose litany of disasters reads much like last year’s—“or 2011 could have occurred naturally sometime during the past 1,000 years. But it is highly improbable that the remarkable extreme weather events of 2010 and 2011 could have all happened in such a short period of time without some powerful climate-altering force at work.”
Despite all of this, a Pew poll conducted in 2010 found that just 59 percent of Americans think there is solid evidence that the planet is warming—and that’s down from 79 percent in 2006. Only 27 percent of Americans surveyed in a different poll said climate change was their greatest environmental concern.

The highest “safe” concentration of carbon dioxide in the atmosphere is 350 parts per million. The current level is 387 parts per million, and it is increasing by 2 parts per million annually. There’s no reason to believe that trend will reverse or even slow down anytime soon. In 2010, as the weather became increasingly catastrophic, carbon-dioxide emissions increased by the largest percentage ever recorded. What about Snowmageddon, you might ask? How could lots of really cold weather and tons of snow be a sign of global warming? Shouldn’t it be a sign that the earth is actually getting cooler? Well, I’m glad you asked. Scientists have long pointed out that warmer global temperatures have been increasing the rate of evaporation from the oceans, putting significantly more moisture into the atmosphere — thus causing heavier downfalls of both rain and snow in particular regions, including the Northeastern United States. This explains the unworldly amount on snow we got in the winter of 2009 and 2010.

Jeff Masters says on his blog: Every year extraordinary weather events rock the Earth. Records that have stood centuries are broken. Great floods, droughts, and storms affect millions of people, and truly exceptional weather events unprecedented in human history may occur. But the wild roller-coaster ride of incredible weather events during 2010, in my mind, makes that year the planet's most extraordinary year for extreme weather since reliable global upper-air data began in the late 1940s. Never in my 30 years as a meteorologist have I witnessed a year like 2010--the astonishing number of weather disasters and unprecedented wild swings in Earth's atmospheric circulation were like nothing I've seen. The pace of incredible extreme weather events in the U.S. over the past few months have kept me so busy that I've been unable to write-up a retrospective look at the weather events of 2010. But I've finally managed to finish, so fasten your seat belts for a tour through the top twenty most remarkable weather events of 2010. At the end, I'll reflect on what the wild weather events of 2010 and 2011 imply for our future.

Unprecedented heat scorched the Earth's surface in 2010, tying 2005 for the warmest year since accurate records began in the late 1800s. Temperatures in Earth's lower atmosphere also tied for warmest year on record, according to independent satellite measurements. Earth's 2010 record warmth was unusual because it occurred during the deepest solar energy minimum since satellite measurements of the sun began in the 1970s. Unofficially, nineteen nation set all-time extreme heat records in 2010. This includes Asia's hottest reliably measured temperature of all-time, the remarkable 128.3°F in Pakistan in May 2010. This measurement is also the hottest undisputed temperature anywhere on the planet except for in Death Valley, California. The countries that experienced all-time extreme highs in 2010 constituted over 20% of Earth's land surface area In Joplin, a common explanation for abnormal weather is “It’s all cyclical.” These things have happened before, and they will happen again. But this explanation ignores an uncontestable fact: The world is different now than it was when the Tri-State tornado hit, or when the Great Plains became a dust bowl. We’re the ones who changed it. The process we’ve set in motion is unpredictable enough that we can’t know for certain what kind of world we’ll have in 20 or 50 or 100 years. But we won’t be able to say we couldn’t have seen it coming.
•What is global warming?
•What is the Greenhouse Effect?
•How the greenhouse effect works
•Touch on increasing global temperatures and irregular weather patterns Irregular Weather Patterns, increasing global temperatures, worsening human health- all substantial evidence for global warming. Global warming is a very real problem that affects us all, and there is plenty of evidence for its existence.

Possible Arguments for the other side and how to combat them •"In the last 1.6 million years there have been 63 alternations between warm and cold climates, and no indication that any of them were caused by changes in carbon dioxide levels."
How can you explain the fact that as cities grow, the human race increases its size, more cars are on the road, and more products are being produced and consumed than ever before, can we not have more carbon dioxide levels in the atmosphere?
•Human-made emissions are insignificant when compared to the carbon output of natural sources that have always been beyond human control.
Look up how many tons of carbon dioxide humans and human-made objects produce and how much nature produces naturally!
•In any case, global cooling has been evident for more than a single year. Global temperature has declined since 1998
How then, did the first decade of the 20th century have the hottest years on record?
•Recent Cold Temperatures

Most extreme winter Arctic atmospheric circulation on record; "Snowmageddon" results
The atmospheric circulation in the Arctic took on its most extreme configuration in 145 years of record keeping during the winter of 2009 - 2010. The Arctic is normally dominated by low pressure in winter, and a "Polar Vortex" of counter-clockwise circulating winds develops surrounding the North Pole. However, during the winter of 2009 - 2010, high pressure replaced low pressure over the Arctic, and the Polar Vortex weakened and even reversed at times, with a clockwise flow of air replacing the usual counter-clockwise flow of air. This unusual flow pattern allowed cold air to spill southwards and be replaced by warm air moving poleward. Like leaving the refrigerator door ajar, the Arctic "refrigerator" warmed, and cold Arctic air spilled out into "living room" where people live. A natural climate pattern called the North Atlantic Oscillation (NAO), and its close cousin, the Arctic Oscillation (AO) were responsible. Both of these patterns experienced their strongest-on-record negative phase, when measured as the pressure difference between the Icelandic Low and Azores High.

Key points
Climate change is neither proven nor disproven by individual warming or cooling spells. It’s the longer-term trends, of a decade or more, which place less emphasis on single-year variability, that count.The past couple of months have seen a particularly cold winter in parts of the U.S. and elsewhere.This has been the result of the “Arctic oscillation” -- a see-sawing pressure system over the North pole -- that has driven cold air into more southern latitudes.These cold spells, and other weather changes that are a result of naturally occurring patterns, are still consistent with a globally warming world. So, what has been going on out there these past two months? As for the Arctic winter weather, it is exactly that -- Arctic. A pattern of high sea-level pressure over the Arctic has led to weaker westerly winds that typically pin cold air closer to the North pole. According to John M. Wallace, an atmospheric sciences professor at the University of Washington, the weakened jet stream has allowed cold Arctic air to creep into more southern latitudes over the U.S., Canada, Europe and Asia.The 2009 global temperature analysis released by NASA’s Goddard Institute for Space Studies (GISS) shows that, globally, 2009 was tied for the second hottest year on record. This comes as news reports and blogs question whether global warming is even occurring, given local weather conditions and the fact that warming did not occur at the same rate in the past 10 years as it did during the ‘80s and ‘90s. But here is the key: While the rate of warming slowed, the decade ending Dec. 31, 2009 was also the warmest since accurate records began in 1880, according to GISS.