Global tropospheric hydroxyl distribution, budget and ... tropospheric hydroxyl ... We used the...
17
Atmos. Chem. Phys., 16, 12477–12493, 2016 www.atmos-chem-phys.net/16/12477/2016/ doi:10.5194/acp-16-12477-2016 © Author(s) 2016. CC Attribution 3.0 License. Global tropospheric hydroxyl distribution, budget and reactivity Jos Lelieveld, Sergey Gromov, Andrea Pozzer, and Domenico Taraborrelli Max Planck Institute for Chemistry, Atmospheric Chemistry Department, P.O. Box 3060, 55020 Mainz, Germany Correspondence to: Jos Lelieveld ([email protected]) Received: 29 February 2016 – Published in Atmos. Chem. Phys. Discuss.: 11 March 2016 Revised: 27 August 2016 – Accepted: 18 September 2016 – Published: 5 October 2016 Abstract. The self-cleaning or oxidation capacity of the at- mosphere is principally controlled by hydroxyl (OH) radicals in the troposphere. Hydroxyl has primary (P ) and secondary (S ) sources, the former mainly through the photodissocia- tion of ozone, the latter through OH recycling in radical reac- tion chains. We used the recent Mainz Organics Mechanism (MOM) to advance volatile organic carbon (VOC) chemistry in the general circulation model EMAC (ECHAM/MESSy Atmospheric Chemistry) and show that S is larger than pre- viously assumed. By including emissions of a large number of primary VOC, and accounting for their complete break- down and intermediate products, MOM is mass-conserving and calculates substantially higher OH reactivity from VOC oxidation compared to predecessor models. Whereas pre- viously P and S were found to be of similar magnitude, the present work indicates that S may be twice as large, mostly due to OH recycling in the free troposphere. Fur- ther, we find that nighttime OH formation may be signifi- cant in the polluted subtropical boundary layer in summer. With a mean OH recycling probability of about 67 %, global OH is buffered and not sensitive to perturbations by natu- ral or anthropogenic emission changes. Complementary pri- mary and secondary OH formation mechanisms in pristine and polluted environments in the continental and marine tro- posphere, connected through long-range transport of O 3 , can maintain stable global OH levels. 1 Introduction The removal of most natural and anthropogenic gases from the atmosphere – important for air quality, the ozone layer and climate – takes place through their oxidation by hydroxyl (OH) radicals in the troposphere. The central role of tropo- spheric OH in the atmospheric oxidation capacity (or effi- ciency) has been recognized since the early 1970s (Levy II, 1971; Crutzen, 1973; Logan et al., 1981, Ehhalt et al., 1991). The primary OH formation rate (P ) depends on the photodis- sociation of ozone (O 3 ) by ultraviolet (UV) sunlight – with a wavelength of the photon (hv) shorter than 330 nm – in the presence of water vapor: O 3 + hv (λ < 330 nm) → O( 1 D) + O 2 , (R1) O( 1 D) + H 2 O → 2OH. (R2) (Note that the formal notation of hydroxyl is HO·, indicat- ing one unpaired electron on the oxygen atom. For brevity we omit the dot and use the notation OH, and similarly for other radicals.) Since the stratospheric ozone layer in the tropics is relatively thin, UV radiation is less strongly attenuated compared to the extratropics; additionally, because the so- lar zenith angle and water vapor concentrations are relatively high, zonal OH is highest at low latitudes in the lower to middle troposphere (Crutzen and Zimmermann, 1991; Spi- vakovsky et al., 2000). The OH radicals attack reduced and partly oxidized gases such as methane (CH 4 ), non-methane volatile organic com- pounds (VOCs) and carbon monoxide (CO), so that these gases only occur in trace amounts, e.g., CO + OH → CO 2 + H, (R3) H + O 2 (+M) → HO 2 (+M), (R4) where M is an air molecule that removes excess energy from reaction intermediates by collisional dissipation. Be- cause OH is highly reactive, it has an average tropospheric lifetime of about 1–2 s. After the initial OH reaction (Reac- tion R3) peroxy radicals are produced (Reaction R4), which can combine to form peroxides: HO 2 + HO 2 → H 2 O 2 + O 2 , (R5) Published by Copernicus Publications on behalf of the European Geosciences Union.
Transcript of Global tropospheric hydroxyl distribution, budget and ... tropospheric hydroxyl ... We used the...

Atmos. Chem. Phys., 16, 12477–12493, 2016www.atmos-chem-phys.net/16/12477/2016/doi:10.5194/acp-16-12477-2016© Author(s) 2016. CC Attribution 3.0 License.
Global tropospheric hydroxyl distribution, budget and reactivityJos Lelieveld, Sergey Gromov, Andrea Pozzer, and Domenico TaraborrelliMax Planck Institute for Chemistry, Atmospheric Chemistry Department, P.O. Box 3060, 55020 Mainz, Germany
Correspondence to: Jos Lelieveld ([email protected])
Received: 29 February 2016 – Published in Atmos. Chem. Phys. Discuss.: 11 March 2016Revised: 27 August 2016 – Accepted: 18 September 2016 – Published: 5 October 2016
Abstract. The self-cleaning or oxidation capacity of the at-mosphere is principally controlled by hydroxyl (OH) radicalsin the troposphere. Hydroxyl has primary (P ) and secondary(S) sources, the former mainly through the photodissocia-tion of ozone, the latter through OH recycling in radical reac-tion chains. We used the recent Mainz Organics Mechanism(MOM) to advance volatile organic carbon (VOC) chemistryin the general circulation model EMAC (ECHAM/MESSyAtmospheric Chemistry) and show that S is larger than pre-viously assumed. By including emissions of a large numberof primary VOC, and accounting for their complete break-down and intermediate products, MOM is mass-conservingand calculates substantially higher OH reactivity from VOCoxidation compared to predecessor models. Whereas pre-viously P and S were found to be of similar magnitude,the present work indicates that S may be twice as large,mostly due to OH recycling in the free troposphere. Fur-ther, we find that nighttime OH formation may be signifi-cant in the polluted subtropical boundary layer in summer.With a mean OH recycling probability of about 67 %, globalOH is buffered and not sensitive to perturbations by natu-ral or anthropogenic emission changes. Complementary pri-mary and secondary OH formation mechanisms in pristineand polluted environments in the continental and marine tro-posphere, connected through long-range transport of O3, canmaintain stable global OH levels.
1 Introduction
The removal of most natural and anthropogenic gases fromthe atmosphere – important for air quality, the ozone layerand climate – takes place through their oxidation by hydroxyl(OH) radicals in the troposphere. The central role of tropo-spheric OH in the atmospheric oxidation capacity (or effi-
ciency) has been recognized since the early 1970s (Levy II,1971; Crutzen, 1973; Logan et al., 1981, Ehhalt et al., 1991).The primary OH formation rate (P ) depends on the photodis-sociation of ozone (O3) by ultraviolet (UV) sunlight – witha wavelength of the photon (hv) shorter than 330 nm – in thepresence of water vapor:
O3+hv (λ < 330nm)→ O(1D)+O2, (R1)
O(1D)+H2O→ 2OH. (R2)
(Note that the formal notation of hydroxyl is HO·, indicat-ing one unpaired electron on the oxygen atom. For brevity weomit the dot and use the notation OH, and similarly for otherradicals.) Since the stratospheric ozone layer in the tropicsis relatively thin, UV radiation is less strongly attenuatedcompared to the extratropics; additionally, because the so-lar zenith angle and water vapor concentrations are relativelyhigh, zonal OH is highest at low latitudes in the lower tomiddle troposphere (Crutzen and Zimmermann, 1991; Spi-vakovsky et al., 2000).
The OH radicals attack reduced and partly oxidized gasessuch as methane (CH4), non-methane volatile organic com-pounds (VOCs) and carbon monoxide (CO), so that thesegases only occur in trace amounts, e.g.,
CO+OH→ CO2+H, (R3)H+O2(+M)→ HO2(+M), (R4)
where M is an air molecule that removes excess energyfrom reaction intermediates by collisional dissipation. Be-cause OH is highly reactive, it has an average troposphericlifetime of about 1–2 s. After the initial OH reaction (Reac-tion R3) peroxy radicals are produced (Reaction R4), whichcan combine to form peroxides:
HO2+HO2→ H2O2+O2, (R5)
Published by Copernicus Publications on behalf of the European Geosciences Union.

12478 J. Lelieveld et al.: Global tropospheric hydroxyl distribution, budget and reactivity
RO2+HO2→ ROOH+O2, (R6a)→ RO+O2+OH, (R6b)→ ROH+O3. (R6c)
RH is a VOC from which OH can abstract the hydrogento form water and an alkyl radical, which reacts with O2 toform a peroxy radical, RO2. After peroxide formation (Re-actions R5, R6a) the reaction chains can either propagate orterminate, the latter by deposition. Propagation of the chainleads to higher-generation reaction products and secondaryOH formation (S), which can be understood as OH recycling.For example, the photolysis of ROOH leads to OH produc-tion. In air that is directly influenced by pollution emissions Sis largely controlled by nitrogen oxides (NO+NO2 =NOx):
NO+HO2→ NO2+OH. (R7)
This reaction, referred to as the NOx recycling mechanismof OH, also leads to ozone production through photodissoci-ation of NO2 by ultraviolet and visible light:
NO2+hv (λ < 430 nm)→ NO+O(3P), (R8)
O(3P)+O2(+M)→ O3(+M). (R9)
However, in strongly polluted air NO2 can locally be alarge OH sink, and in such environments the net effect ofNOx on OH is self-limiting through the reaction
NO2+OH(+M)→ HNO3(+M). (R10)
Conversely, under low-NOx conditions, mostly in pristineair, secondary OH formation by other mechanisms is impor-tant:
O3+HO2→ 2O2+OH, (R11)H2O2+hv (λ < 550nm)→ OH+OH. (R12)
These reactions are referred to as the Ox recycling mech-anism of OH. In prior work we suggested that the stronggrowth of air pollution since industrialization, especially inthe 20th century, has drastically changed OH production andloss rates but that globally the balance between P and Schanged little (Lelieveld et al., 2002). This is associated witha relatively constant OH recycling probability r , defined asr = 1−P/G, in whichG is gross OH formation (G= P+S);P , S andG have unit moles yr−1. We computed that globallyr has changed little since preindustrial times, remaining atabout 50 %. Thus, in the past centuryG (the atmospheric ox-idation power) kept pace with the growing OH sink related tothe emissions of reduced and partly oxidized pollution gases.Lelieveld et al. (2002) performed perturbation simulations,applying pulse emissions of NOx and CH4, to compute theimpact on OH. This showed that, at an OH recycling proba-bility of 60 % or higher, these perturbations have negligible
influence on OH (their Fig. 6). Therefore, at r > 60 % the at-mospheric chemical system can be considered to be buffered.
While globally r has remained approximately constant, themean tropospheric OH concentration and the lifetime of CH4(τCH4) have also changed comparatively little, for examplewithin a spread of about 15 % calculated by a 17-memberensemble of atmospheric chemistry-transport models (Naiket al., 2013). Despite substantial differences in OH concen-trations and τCH4 among the models, simulations of emissionscenarios according to several representative concentrationpathways (RCPs) indicate that future OH changes will prob-ably also be small, i.e., well within 10 % (Voulgarakis et al.,2013). We interpret the relative constancy of r , mean OH andτCH4 as an indication that global OH is buffered against per-turbations. This is corroborated by studies based on obser-vations of methyl chloroform, with known sources and OHreaction as the main sink, showing small interannual vari-ability of global OH and small interhemispheric differencein OH (Krol and Lelieveld, 2003; Montzka et al., 2011; Patraet al., 2014).
For our previous estimates of P and S we used achemistry-transport model with the Carbon Bond Mech-anism (CBM) to represent non-hydrocarbon chemistry(Houweling et al., 1998). This mechanism aggregates or-ganic compounds into categories of species according tomolecular groups and has been successfully used to simu-late ozone concentrations with air quality models (Stockwellet al., 2012). However, such chemical schemes are not mass-conserving, e.g., for carbon, and are optimized for conditionsin which NOx dominates r , while in low-NOx environmentsother mechanisms may be important, for example throughthe chemistry of non-methane VOCs emitted by vegetation(Lelieveld et al., 2008), as reviewed by Vereecken and Fran-cisco (2012), Stone et al. (2012) and Monks et al. (2015). Alimitation of the CBM and other, similar mechanisms is thatsecond- and higher-generation reaction products are lumpedor ignored for computational efficiency, whereas they cancontribute importantly to OH recycling and ozone chemistry(Butler et al., 2011; Taraborrelli et al., 2012).
Here we apply the Mainz Organics Mechanism (MOM),which accounts for recent developments in atmospheric VOCchemistry. MOM is a further development of the Mainz Iso-prene Mechanism (Taraborrelli et al., 2009, 2012). In ad-dition to isoprene, MOM computes the chemistry of satu-rated and unsaturated hydrocarbons, including terpenes andaromatics (Cabrera-Perez et al., 2016). We use it to esti-mate the role of radical production through reactions of oxi-dized VOC, referred to as the OVOC recycling mechanism ofOH, being contrasted with the NOx and Ox recycling mech-anisms of OH. Based on this scheme, implemented in theECHAM/MESSy Atmospheric Chemistry general circula-tion model (EMAC), we provide an update of global OH cal-culations, sources, sinks, tropospheric distributions, OH re-activity, and the lifetime of CH4 and CO, and we discuss im-plications for atmospheric chemistry. We contrast the bound-
Atmos. Chem. Phys., 16, 12477–12493, 2016 www.atmos-chem-phys.net/16/12477/2016/

J. Lelieveld et al.: Global tropospheric hydroxyl distribution, budget and reactivity 12479
ary layer and free troposphere (BL and FT), the Northern andSouthern Hemisphere (NH and SH) and the tropics and ex-tratropics. We show that complementary OH recycling mech-anisms in terrestrial, marine, pristine and polluted environ-ments, interconnected through atmospheric transport, sustainstable levels of hydroxyl in the global troposphere.
2 VOC chemistry and model description
To reconcile observations of high OH concentrations overthe Amazon rainforest with models that predicted low OHconcentrations, we have proposed that the chemistry of iso-prene recycle OH, e.g., involving organic peroxy radicals(Lelieveld et al., 2008). Progress on such reactions was re-ported by Taraborrelli et al. (2012) and incorporated intoa predecessor version of the present chemistry scheme.Laboratory experimental results by Groß et al. (2014a, b)provided additional evidence and insight into this type ofchemistry, indicating that OH formation via Reaction (R6b)(RO2+HO2) had previously been underestimated signifi-cantly. While in polluted air, peroxy radicals preferentiallyreact with NO; in pristine, low-NOx conditions over the rain-forest, e.g., in the Amazon, isoprene degradation leads to hy-droxyhydroperoxides, which can reform OH upon further ox-idation (Paulot et al., 2009).
An important pathway in isoprene chemistry, basic tothe recycling of OH, is isomerization through H migrationwithin oxygenated reaction products, leading to photolabilehydroperoxyaldehydes (HPALD), as reviewed by Vereeckenand Francisco (2012). While a high rate of 1,5-H shifts thatwe have assumed previously (Taraborrelli et al., 2012) wasnot confirmed experimentally, these and especially 1,4-H and1,6-H shifts have nevertheless been shown to be key interme-diaries in OH recycling (Crounse et al., 2012, 2013; Fuchset al., 2014; Peeters et al., 2014). When the OH concentra-tion is low, its formation is maintained by photodissociationof HPALD, while at high OH concentration its sink reac-tion with HPALD gains importance. Next to HPALD, un-saturated hydroperoxyaldehydes, e.g., peroxyacylaldehydes(PACALD), were shown to be relevant (Peeters et al., 2014).Higher-generation reaction products include several organicperoxides that produce OH upon photodissociation, whichneed to be accounted for in atmospheric chemistry models toreproduce field and reaction chamber observations (Nölscheret al., 2014).
These reactions have been included in MOM, being anextension and update of the Mainz Isoprene Mechanism,v.2 (Taraborrelli et al., 2009, 2012). The scheme, which ac-counts for about 630 compounds and 1630 reactions, makesuse of rate constant estimation methods similarly to theMaster Chemical Mechanism by Jenkin et al. (2015) (http://mcm.leeds.ac.uk/MCM) and recommendations by the TaskGroup on Atmospheric Chemical Kinetic Data Evaluation(http://iupac.pole-ether.fr), in addition to our own evalua-
tion of the recent literature. For the present work we appliedthe full scheme, also used by Cabrera-Perez et al. (2016),which is computationally demanding and precludes us ap-plying high spatial resolution of the model for extended timeperiods. For computational efficiency in global and regionalmodels, the scheme will be condensed in the future. In con-trast to some previous chemistry mechanisms in atmosphericmodels, MOM accounts for higher-generation reaction prod-ucts and is mass-conserving (notably for carbon-containingreaction products from VOC oxidation).
MOM has been included in the EMAC general circulationmodel. The core atmospheric general circulation model isECHAM5 (Roeckner et al., 2006), coupled with the ModularEarth Submodel System, of which we have applied MESSy2version 2.42 (Jöckel et al., 2010). For this study EMAC wasused in a chemical-transport model (CTM mode) (Deck-ert et al. 2011), i.e., by disabling feedbacks between photo-chemistry and dynamics. EMAC submodels represent tropo-spheric and stratospheric processes and their interaction withoceans, land and human influences, and they describe emis-sions, radiative processes, atmospheric multiphase chem-istry, aerosol and deposition mechanisms (Jöckel et al., 2005,2006; Sander et al., 2005, 2011, 2014; Kerkweg et al., 2006;Tost et al., 2006, 2007a; Pozzer et al., 2007, 2011; Pringle etal., 2010). We applied the EMAC model at T42/L31 spatialresolution, i.e., at a spherical spectral truncation of T42 anda quadratic Gaussian grid spacing of about 2.8◦ latitude andlongitude, and 31 hybrid terrain-following pressure levels upto 10 hPa.
Results have been evaluated against observations (Pozzeret al., 2010, 2012; de Meij et al., 2012; Christoudias andLelieveld, 2013; Elshorbany et al., 2014; Yoon and Pozzer,2014; Cabrera-Perez et al., 2016; for additional references,see http://www.messy-interface.org). Here we present re-sults based on emission fluxes and meteorology representa-tive of the year 2013, mostly annual means unless specifi-cally mentioned otherwise. Tests of the present model ver-sion indicate minor changes, e.g., in intermediately longlived compounds such as O3 and CO, compared to previ-ous versions. N2O and CH4 concentrations have been pre-scribed at the surface based on observations. Anthropogenicemissions have been based on the RCP8.5 emission sce-nario (Riahi et al., 2007; van Vuuren et al., 2011; Mein-shausen et al., 2011). The scenario was tested by Granier etal. (2011), indicating that it realistically represents the sourcestrengths of pollutants after the year 2000. The RCP8.5 sce-nario was also applied by Cabrera-Perez et al. (2016), inwhich the emissions and chemistry of aromatic compoundswas described. Natural emissions of higher VOCs are inter-actively calculated, amounting to 760 TgC yr−1, with a 4-year range of 747–789 TgC yr−1 (including about 73 %, or546–578 TgC yr−1, of isoprene) (Guenther et al., 2012), andanthropogenic emissions of saturated, unsaturated and aro-matic compounds amount to 105 TgC yr−1. These flux inte-grals are in carbon equivalent. It should be mentioned that in
www.atmos-chem-phys.net/16/12477/2016/ Atmos. Chem. Phys., 16, 12477–12493, 2016

12480 J. Lelieveld et al.: Global tropospheric hydroxyl distribution, budget and reactivity
previous-generation atmospheric chemistry-transport modelsVOC emissions have been artificially reduced to prevent thecollapse of OH concentrations in regions of strong naturalsources, i.e., at high-VOC and low-NOx conditions (Arnethet al., 2010).
To analyze model production and sink pathways of OHand HO2, including multiple radical recycling, and computefluxes of reactants and intermediate products, we used the ki-netic chemistry tagging technique of Gromov et al. (2010).The scheme computes detailed turnover rates of selectedtracers, in this case OH, HO2, O3, CO, aldehydes, perox-ides and others, in various parts of the MOM chemistryscheme within EMAC. With limited additional computa-tional load the extensive budgeting allows characterizationof OH sources and sinks, while the diagnostic calculationsare decoupled from the regular chemistry scheme.
Here we present a selection of results, focusing on an-nual and large-scale averages to characterize global OH. TheSupplement presents supporting tables and figures for theinterested reader. Pages S1–S14 illustrate time sequences(Hovmöller plots), seasonal differences and results for dif-ferent atmospheric environments and reservoirs such as theBL and FT, to distinguish continental from marine bound-ary layers (CBLs and MBLs), the lower troposphere fromthe tropopause region and the lower stratosphere. These sup-plementary results focus on distributions of OH and HO2 aswell as lifetimes of different species – notably OH, HO2, COand CH4 – and include figures of global OH reactivity whichare relevant for the discussion in Sect. 5. Page S15 presentsdetails on the global OH budget, relevant for Sect. 6. TheSupplement also includes scatterplots between observationsand model results of CO and O3 at the surface for the year2013 (p. S16); a table with details of VOC emission fluxesapplied in EMAC (p. S17); and the complete mechanism ofMOM, including a list of all chemical species (p. S18 andfollowing). Model-calculated global datasets of OH concen-trations and other trace gases are available upon request.
3 Global OH distribution
In agreement with previous studies our model calcu-lations show highest OH concentrations in the tropi-cal troposphere (Fig. 1). Globally, mean troposphericOH is 11.3× 10⁵ molecules cm−3, close to the multi-model mean of 11.1± 1.6× 10⁵ molecules cm−3 derivedby Naik et al. (2013) for the year 2000. Note thatthese are volume-weighted means. Following the recom-mendation by Lawrence et al. (2001), we also calculatedthe air-mass-weighted (11.1× 10⁵ molecules cm−3), CH4-weighted (12.4× 10⁵ molecules cm−3) and methyl chloro-form (MCF)-weighted means (12.3× 10⁵ molecules cm−3),though henceforth we primarily report volume-weightedmean values.
The calculated tropical tropospheric average is14.6× 105 molecules cm−3 (between the tropics of Cancerand Capricorn), with the NH and SH extratropical averagesbeing 9.1 and 6.6× 10⁵ molecules cm−3, respectively. Ourmodel indicates more OH north of the Equator compared tothe south of it, 12.1× 10⁵ and 10.1× 10⁵ molecules cm−3,respectively. Hence the NH /SH ratio is 1.20, being towardsthe low end of the multimodel estimate of 1.28± 0.10 byNaik et al. (2013), though deviating from interhemisphericparity derived by Patra et al. (2014) based on the analysis ofMCF (CH3CCl3) measurements.
For the air-mass-, CH4- and MCF-weighted means we findNH /SH ratios of 1.25, 1.30 and 1.25, respectively. Part ofthe discrepancy with Patra et al. (2014) may be related to theseasonally varying position of the Intertropical ConvergenceZone (ITCZ), which effectively separates the meteorologicalNH from the SH. The position of the ITCZ, on average a fewdegrees north of the Equator in the region of highest OH, caninfluence these calculations, both in models and MCF analy-ses. If we correct for this, the volume-weighted NH / SH ra-tio of OH decreases from 1.20 to 1.13. In the extratropics ourmodel calculates 28 % less OH in the SH compared to theNH, which is the main reason for the model-calculated in-terhemispheric OH difference. The asymmetry is larger be-tween the Arctic and Antarctic regions (defined by the polarcircles), as the calculated mean OH concentration is 50 %lower in the latter. However, if we also include the lowerstratosphere (up to 10 hPa), we find near-interhemisphericparity of OH, i.e., 5 % more in the NH and only 2 % morebased on the ITCZ metric. Considering the importance ofthe stratosphere as an MCF reservoir to the troposphere inrecent years (Krol and Lelieveld, 2003), and possible inter-hemispheric differences in the age of air in the middle at-mosphere, these aspects should be investigated further witha model version that accounts for the atmosphere from thesurface to the mesosphere, to investigate the importance forMCF analyses and inferred OH distributions.
Figure 1 illustrates that high OH concentrations in thetropics can extend up to the tropopause, with a main OHmaximum below 300–400 hPa and a second maximum be-tween 200 and 150 hPa. Note that the tropopause in the trop-ics is defined using temperature and in the extratropics usingpotential vorticity gradients (2 PV units). The oxidative con-ditions throughout the tropical troposphere limit the flux ofreduced and partly oxidized gases (e.g., reactive halocarbons,sulfur and nitrogen gases) into the stratosphere through theirchemical conversion into products that are removed by depo-sition processes. Near the cold tropical tropopause, reactionproducts, such as low-volatility acids, can be removed by ad-sorption to sedimenting ice particles that also dehydrate theair that ascends into the stratosphere (Lelieveld et al., 2007).Due to the slow ascent rates of air parcels in the tropicaltropopause region (tropical transition layer), pollutant gasesare extensively exposed to oxidation by OH for several weeksto months. This mechanism protects the ozone layer from
Atmos. Chem. Phys., 16, 12477–12493, 2016 www.atmos-chem-phys.net/16/12477/2016/

J. Lelieveld et al.: Global tropospheric hydroxyl distribution, budget and reactivity 12481
Unit: 10 molecules cm 2–- OH5 3
-
Figure 1. Global OH in 105 molecules cm−3. Left: tropospheric, annual mean. Right: zonal annual mean up to 10 hPa. The lower solidline indicates the average boundary layer height, the upper dashed line the mean tropopause and the solid lines the annual minimum andmaximum tropopause height.
O3-depleting substances that could be transported from thetroposphere, at least to the extent that they react with OH.
In the global troposphere, annual column average OHranges from 1.0× 10⁵ to 22.0× 10⁵ molecules cm−3, i.e.,between high and low latitudes, respectively (Fig. 1). Thisrange is determined by the meridional OH gradient in the FT,since about 85 % of tropospheric OH formation takes place inthe FT, which thus dominates the global OH distribution (de-tailed below). In the BL the range is much larger, 0.3× 10⁵ to44.0× 105 molecules cm−3, as OH is more strongly affectedby variable surface emissions. The subordinate role of the BLin the global OH load and distribution is conspicuous, for ex-ample from the OH maximum in the BL over the Middle Eastand OH minima over the central African and Amazon forests(Fig. S1 of the Supplement), which do not appear in the tro-pospheric column average OH concentrations, as the latterfollow the OH distribution in the FT (Fig. 1).
In the BL over tropical forests OH concentrations are com-paratively low, about 10× 105 to 20× 105 molecules cm−3,in agreement with OH measurements in South America andsoutheastern Asia (Kubistin et al., 2010; Pugh et al., 2010;Whalley et al., 2011), while in the FT in these regions OHconcentrations are several times higher. The relatively highOH in the tropical FT is related to the combination of emis-sions from vegetation with NOx from lightning in deep thun-derstorm clouds. This is most prominent over central Africa,where deep convection and lightning are relatively intense(Fig. 1, left panel). The latter was corroborated by comparingour model with lightning observations (Tost et al., 2007b).The chemical mechanisms that control OH in the BL and FTare connected through vertical transport and mixing, whichbalance formation and loss in the column; i.e., near the sur-face VOCs are a net sink of OH, while their reaction productsare a net OH source aloft.
In the NH extratropics mean OH in the MBL approxi-mately equals that in the CBL, i.e., in the zonal direction.As shown previously, this is related to the transport and mix-
ing of oxidants (primarily O3) and precursor gases (e.g.,NOx and partially oxidized volatile organic compounds)from polluted regions across the Atlantic and Pacific oceans(Lelieveld et al., 2002). In the SH, on the other hand, whereanthropogenic NOx sources and related transports are muchweaker, mean OH in the CBL is about 15 % higher comparedto the MBL. In the extratropical troposphere as a whole,OH gradients in the longitudinal direction are typically small(Fig. 1), related to relatively rapid exchanges by zonal windsin transient synoptic weather systems.
While primary OH formation (Reactions R1, R2) duringdaytime is controlled by photodissociation of O3, there areadditional sources that can be relevant at night. This includesreactions of O3 with unsaturated hydrocarbons and aromaticcompounds in polluted air and with terpenes emitted by veg-etation. Figure 2 shows nighttime OH in the boundary layerduring January and July to illustrate the strong seasonal de-pendency. While the color coding is the same as Fig. 1, theconcentrations are scaled by a factor of 20. On a global scale,OH concentrations in the BL at night are nearly 2 ordersof magnitude lower than during the day, and in the FT dieldifferences are even larger. Therefore, nighttime OH doesnot significantly influence the atmospheric oxidation capac-ity and the lifetimes of CH4 and CO. Nevertheless, Fig. 2shows several hot spots, mostly in the subtropical BL inthe NH during summer, where nighttime OH can exceed105 molecules cm−3 and could contribute to chemical pro-cesses, such as new particle formation. These regions includethe western USA, the Mediterranean and Middle East, theIndo-Gangetic Plain and eastern China.
4 Global HOx distribution
Since conversions between HO2 and OH play a key role inOH recycling, we address the budget of HOx (OH+HO2),which is dominated by HO2. Field and laboratory measure-ments often address both OH and HO2. Figure 3 shows
www.atmos-chem-phys.net/16/12477/2016/ Atmos. Chem. Phys., 16, 12477–12493, 2016

12482 J. Lelieveld et al.: Global tropospheric hydroxyl distribution, budget and reactivity
Unit: 0.05x10 molecules cm OH5 3 -
Figure 2. Nighttime OH in the boundary layer in January (top) andJuly (bottom). Color coding is the same as Fig. 1, but concentrationsare scaled by a factor of 20 (×0.05× 10⁵ molecules cm−3).
the annual HO2 concentration distribution, the counterpartof OH in Fig. 1. We find that in the BL annual meanHO2 ranges from 0.1 to 6.4× 10⁸ molecules cm−3 glob-ally, whereas in the FT as a whole this is only 0.2 to1.1× 108 molecules cm−3. Even though the mean lifetimeof HO2 in the troposphere of 1.5 min is much longer thanof OH (factor of 60), both OH and HO2 are locally con-trolled by chemistry. Transport processes influence HOxthrough longer-lived precursor and reservoir species suchas O3 and OVOCs. Whereas OH in the BL over the trop-ical forests is relatively low, HO2 is relatively high, about5× 108 molecules cm−3, i.e., 2 to 3 orders of magnitudehigher than OH, consistent with observations (Kubistin etal., 2010). Our results suggest that from a global perspec-tive HOx is highest over the tropical forests, where photo-chemistry is very active and OH sources and sinks are large.Localized HOx maxima are also found in the polluted CBL,where reactive VOC and NOx emissions are strong, e.g., bythe petroleum industry north of the Mexican Gulf and nearthe Persian Gulf (Ren et al., 2013; Lelieveld et al., 2009).
On a global scale the tropospheric production of HOx isdominated by that in the FT. In the FT HOx is subject tolong-range transport of relatively long lived source and sinkgases such as O3 and CO, whereby the latter redistributes OHinto HO2 within HOx , whereas in the BL local emissions ofshort-lived VOCs and NOx are more relevant. The efficientatmospheric transport of longer-lived gases, such as O3 fromboth the stratosphere and photochemically polluted regions,helps buffer the OH formation in regions where oxidant isdepleted, such as the MBL (Lelieveld and Dentener, 2000; de
Laat and Lelieveld, 2000). Within the tropospheric column,convection and entrainment of O3-rich air from the FT intothe BL play a key role in the exchange of oxidant, whichreduces vertical gradients, and balances HOx production andloss processes across altitudes.
We calculate a global tropospheric average HO2 concen-tration of 0.6× 10⁸ molecules cm−3. We find roughly thesame average concentrations in the tropical and NH extra-tropical troposphere, and slightly less in the SH extratrop-ics (0.5× 10⁸ molecules cm−3). Thus the mean troposphericHO2 (and HOx) concentrations in these tropical and extra-tropical reservoirs are very similar. Nevertheless, in the SHthe mean HO2 concentration in the CBL is about a factor of2 higher compared to the MBL, associated with strong VOCemissions by vegetation subject to intense photochemistry.In the NH mean HO2 is comparable between the MBL andCBL, due to the widespread impact of air pollution, as ex-plained above. The seasonal differences in tropospheric HOxat middle and high latitudes can be large though, i.e., aboutan order of magnitude between summer and winter. The sea-sonality of primary OH formation, which is proportional tosolar radiation intensity, is even larger. In Sect. 6 we discussthat the low primary formation in winter is partly compen-sated for by secondary OH formation, being less dependenton sunlight, which reduces latitudinal and seasonal OH con-trasts.
5 Trace gas lifetimes and OH reactivity
The average tropospheric lifetime of OH (τOH) is 1.5 s, calcu-lated by dividing the annual averages of the volume-weightedOH burden and the total photochemical sink rate. Figure 4presents the spatial distribution of τOH. Unlike the OH con-centration, τOH does not exhibit a strong seasonal cycle, be-ing nearly absent in the tropics and the FT. Only in the CBLover Siberia, around 60◦ N, can seasonal differences reach afactor of 5, related to the annual variability of VOC emissionsby boreal forest (Siberian taiga). The tropospheric mean τOHin the NH is 1.4 s, and in the SH 1.6 s. In the MBL meanτOH is about 0.7 s, in the CBL about 0.3 s. The longest τOH isfound near the tropical tropopause (10–20 s), where OH re-activity (the inverse of τOH) is thus below 0.1 s−1. While thisis largely related to low temperatures and reduced reactionrates, it also indicates that air masses that traverse the trop-ical transition layer into the stratosphere are cleansed fromreactive compounds that are removed by OH, which is impor-tant for organohalogen compounds, for example, that coulddamage the ozone layer. In the NH mean tropospheric OHreactivity is 0.7 s−1, and in the SH 0.6 s−1. The seasonalityof τHO2 is more pronounced than that of τOH; τHO2 is longestin the cold season and over Antarctica, up to 10 min. In theMBL τHO2 is on average 1.3 min, in the CBL 0.5 and in theFT 1.7 min.
Atmos. Chem. Phys., 16, 12477–12493, 2016 www.atmos-chem-phys.net/16/12477/2016/

J. Lelieveld et al.: Global tropospheric hydroxyl distribution, budget and reactivity 12483
Unit: 10 molecules cm HO8 3 2-
Figure 3. As Fig. 1 but for HO2 in 108 molecules cm−3 in the troposphere (left) and up to 10 hPa (right).
τ in sOH
Figure 4. As Fig. 1 but for the OH lifetime (τOH, seconds) in the troposphere (left) and up to 10 hPa (right).
We find that τOH is generally shortest over the tropical for-est, followed by the boreal forest, coincident with the spatialdistribution of total OH reactivity, i.e., the inverse of τOH,shown in Fig. 5. Near the Earth’s surface the OH reactiv-ity varies from about 0.5 s−1 over Antarctica, due to reactionof OH with CH4 and CO in clean and cold air, to approx-imately 100 s−1 over the Amazon rainforest in the dry sea-son due to relatively strong isoprene sources, complementedby biomass burning emissions. This modeled OH reactivityrange seems realistic in comparison to observations, whereasprevious models – as well as measurement techniques – thatdid not account for all VOC reaction products and intermedi-ates strongly underestimated OH reactivity, i.e., up to a factorof 10 (Whalley et al., 2011; Mogensen et al., 2015; Nölscheret al., 2016). This topic will be studied in greater detail in afollow-up publication where we address the reactive carbonbudget in different environments, evaluated against measure-ments, where we also include secondary organic aerosols asdescribed by Tsimpidi et al. (2016).
Our estimate of the mean lifetime of CH4 due to oxidationby tropospheric OH (τCH4) is 8.5 years, which is within themultimodel-calculated 1σ standard deviation of the mean of9.7± 1.5 years presented by Naik et al. (2013), albeit towardsthe lower end of the range. Notice that this figure does notinclude uptake of CH4 by soils and stratospheric loss by OH,
O(1D) and chlorine radicals, which together make up about10 % of the total CH4 sink. The 17 models that participated inthe model intercomparison by Naik et al. (2013) show a rangeof 7.1–14.0 years, while the multimodel mean of 9.7 yearswas considered to be 5–10 % higher than observation-derivedestimates.
One reason for our τCH4 estimate being toward the lowerend of the range may be that Naik et al. (2013) refer tothe year 2000, whereas we applied an emission inventoryfor the year 2010, i.e., after a period when NOx concentra-tions increased particularly rapidly in Asia (Schneider andvan der A, 2012) and CO concentrations decreased, most sig-nificantly in the Northern Hemisphere (Worden et al., 2013;Yoon and Pozzer, 2014). These trends in NOx and CO mayhave contributed to a shift within HOx from HO2 to OH. Fur-ther, Naik et al. (2013) defined the tropospheric domain asextending from the surface up to 200 hPa, whereas we diag-nose the tropopause height. In effect Naik et al. include partof the extratropical lower stratosphere, where τCH4 is about acentury. Another reason is that our MOM mechanism moreefficiently recycles OH than other VOC chemistry schemesapplied in global models. This is supported by our calcula-tion of the MCF lifetime of 5.1 years, which compares with5.7± 0.9 years by Naik et al. (2013), based on a range of4.1–8.4 years among the 17 participating models.
www.atmos-chem-phys.net/16/12477/2016/ Atmos. Chem. Phys., 16, 12477–12493, 2016

12484 J. Lelieveld et al.: Global tropospheric hydroxyl distribution, budget and reactivity
OH reactivity in s-1
Figure 5. Annual mean OH reactivity near the Earth’s surface in s−1.
We calculate that at the tropopause and the poles τCH4 islongest, about a century. The mean τCH4 in the extratropicsis 13.8 years, and in the inner tropics 6.1 years. The meanτCH4 in the BL is 4.9, and in the FT 9.1 years. The effectiverange in the mean OH concentration and τCH4 between thehigh- and the low-latitude troposphere is about a factor of10, which is close to the OH and HO2 range between thesummer and winter at high latitudes. This is much smallerthan the low-to-high-latitude gradients and the seasonal cycleof primary OH formation, indicative of the important role ofsecondary formation (Sect. 6). The NH /SH ratio of τCH4 is0.77. Similar differences and latitude contrasts are found forthe lifetime of tropospheric CO (τCO) due to reaction withOH. τCO is on average about 38 days in the tropics, 65 daysin the NH extratropics and 86 days in the SH extratropics,and the NH /SH ratio of τCO is 0.87.
6 Radical budget and recycling probability
Figure 6 presents a summary of global annual mean HOxproduction terms in the troposphere, also listed in Table 1,which gives an overview of sources and sinks. Primary OHformation by Reactions (R1) and (R2) (P , purple) amountsto 84 Tmol yr−1, of which about 85 % takes place in theFT. We find that gross OH formation (G) and HO2 pro-duction in the FT also account for about 85 % of the tro-pospheric total. Secondary OH formation (S) in the tropo-sphere adds up to 167 Tmol yr−1, i.e., 67 % of G, the latterbeing 251 Tmol yr−1. S is subdivided into contributions bythe NOx mechanism (Reaction R7, blue); the Ox mechanism(Reactions R11 and R12; green and yellow, respectively);and the OH recycling in VOC chemistry, the OVOC mecha-nism (red). The result that r > 60 % indicates that global OHis buffered, i.e., not sensitive to chemical perturbations. Fig-ure 6 illustrates that the fractional contributions by the differ-ent production terms in the FT equal those in the troposphereas a whole. It is not surprising that the FT is the dominantreservoir in atmospheric oxidation as it contains 6–7 timesmore mass than the BL, though it shows that OH formation
Table 1. Global, annual mean tropospheric source and sink fluxesof OH (Tmol yr−1). Sources and sinks are also specified for theboundary layer and free troposphere.
Sources/sinks BL FT Troposphere
O(1D)+H2O 12.5 71.5 84.0 (33 %)NO+HO2 10.4 66.2 76.6 (30 %)O3+HO2 3.5 30.9 34.4 (14 %)H2O2+hv 2.3 22.5 24.8 (10 %)OVOCs, ROOH+hv 6.6 24.8 31.4 (13 %)
Total OH sources 35.3 215.9 251.2
OH+HO1y 4.8 41.4 46.2 (18 %)
OH+NO2y 0.8 3.3 4.1 (1.5 %)
OH+CH4 4.1 25.7 29.8 (12 %)OH+CO 9.6 88.2 97.8 (39 %)OH+other C1VOC3 5.7 31.3 37.0 (15 %)OH+C2+VOC4 10.3 24.4 34.7 (14 %)Rest 0.4 1.2 1.6 (0.5 %)
Total OH sinks 35.7 215.5 251.2
1 H2, O3, H2O2, radical–radical reactions. 2 NO, NO2, HNO2, HNO3,HNO4, ammonia, N-reaction products. 3 VOC with one C atom (excl.CH4), incl. CH3OH, C1-reaction products. 4 VOC with ≥ 2 C atoms,C2+-reaction products.
is rather evenly distributed between different environmentswithin the troposphere, in spite of differences in precursorsspecies and pollution levels.
On a global scale, the relative magnitudes of differentOH production terms in the BL and FT are similar (Fig. 6),though the OVOC mechanism (red) is somewhat larger andthe Ox mechanism (green and yellow) somewhat smallerthan in the FT. The contribution by the NOx mechanism, i.e.,Reaction (R7) (NO+HO2, blue), is marginally smaller in theBL (30 %) than the FT (31 %), in spite of large areas in theBL being more directly influenced by anthropogenic NOxemissions. As explained above, the contribution of NOx toOH recycling can be locally self-limiting, e.g., in the stronglypolluted BL, while some NOx – partly as reservoir gases
Atmos. Chem. Phys., 16, 12477–12493, 2016 www.atmos-chem-phys.net/16/12477/2016/

J. Lelieveld et al.: Global tropospheric hydroxyl distribution, budget and reactivity 12485
33 %
30 %
14 %
10 %13 %
Troposphere: 251.2 Tmol yr
33 %
31 %
14 %
10 %
12 %
FT: 215.9 Tmol yr (86 %) BL: 35.3 Tmol yr (14 %)
O(1D) + H O
NO + HO
O + HO
H O + hv
OVOCs incl. ROOH+hv
2
2
23
2 2
35 %
30 %
10 %6 %19 %
–1
–1
–1
Figure 6. Main production terms of OH (Tmol yr−1) in the tropo-sphere (top right), free troposphere (bottom left) and boundary layer(bottom right). The sizes of the lower two graphs are proportional tothe upper right graph, reflecting the percentages of G in parenthe-ses. We distinguish P (purple) from S, the latter being made up ofthe NOx mechanism (blue), the Ox mechanism (yellow and green)and the OVOC mechanism (red).
like organic nitrates – can escape to the FT, where relativelylower concentrations can be effective in OH production. Ex-amples of NOx reservoir gases in MOM are alkyl nitrateswith carbonyls, e.g., nitro-oxyacetone (NOA) and the nitrateof methyl ethyl ketone.
By comparing gross OH formationG between different re-gions, we find that it is about twice as high in the tropics as inthe extratropics and 16 % lower in the SH than the NH. Theupper panel of Fig. 7 presents G in ppbv day−1 (the lowerpanels P and S), with a global annual average in the tropo-sphere of 4.8 ppbv day−1. At low latitudes G is much higherover continents than oceans, related to strong OH recycling,while at high latitudes longitudinal gradients are small, alsobetween oceans and continents in the NH (Fig. 7). Sinceemissions that affect OH largely occur on land, the latter un-derscores that on a large scale OH is buffered through pro-cesses in the FT. Regional maxima of G are found over theAmazon, central Africa and southeastern Asia, and smallerareas north of the Mexican Gulf in the USA, central Americaand Indonesia (Fig. 7). Over the Amazon and central Africawe find a relatively high G up to the tropopause, related todeep convection and lightning NOx over regions that are richin natural VOCs. Within the BL G can vary greatly, e.g., be-ing on average more than 3 times larger in the CBL than inthe MBL. Comparing P between different regions, we findthat it is 37 % higher in the tropics compared to the subtrop-ics, while on average it is the same over oceans and conti-nents.
Consequently, average S is also the same over oceans andcontinents, though below we underscore that the underlying
chemical mechanisms can be very different. In the SH extra-tropics P is about 40 % lower than in the NH, mostly associ-ated with the lower abundance of tropospheric O3 in the SH.This interhemispheric asymmetry is manifest in the middlepanels of Fig. 7. Comparison of the middle and lower pan-els in Fig. 7 shows that spatial gradients of P and S can berather different, e.g., towards high latitudes with P falling offwith solar radiation and water vapor, while P also declineswith altitude. In these regions gradients of S are weaker thanthose of P . This actually contributes to OH buffering, as therelatively low rate of P is partly compensated for by S. Thismechanism also acts seasonally; i.e., S is more important inwinter.
Rohrer and Berresheim (2006) and Rohrer et al. (2014)emphasized the tight linear relationship between tropo-spheric OH and UV radiation in Germany and China, ex-pressed by measurements of OH and the photodissociationfrequency of O3 (J (O1D)). While the relationship with sun-light is also evident from our results, the interpretation is notstraightforward because P also depends on O3 and H2O, andS additionally depends on other factors. For example, in thetropics P has a maximum in the lower troposphere and aminimum in the upper troposphere, where the UV intensity ishigher, related to dependencies of the J (O1D) quantum yieldand H2O on temperature. Hence the slope of the regressionis different. Furthermore, S is not contingent on J (O1D) andis generally less strongly dependent on solar radiation.
This is illustrated by Fig. 8, indicating that sometimes atight linear relationship with J (O1D) is found, e.g., for Pin the BL, but that the relationship with S in the BL is lesscompact, while in the FT S can deviate from linearity at lowUV intensity. Based on a global sample size of 1.45 millionpairs from our model calculations, we find a high correlation(R2= 0.94) between P and J (O1D) and a lower correlation
(R2= 0.80) between S and J (O1D). While the mean slope
for P is 0.99 (intercept close to 0), it is 0.46 for S (inter-cept of about 0.3). Therefore, there is no unique relationshipbetween OH and UV radiation as it depends on the relativeimportance of P , S and the different mechanisms that con-tribute to S.
Figure 9 illustrates the efficiency at which OH is recycled,i.e., the recycling probability r = 1−P/G. We find relativelylarge differences between tropospheric reservoirs, e.g., be-tween the CBL and MBL, and also between the tropics andextratropics. When S is smaller than P , r is below 50 % (yel-low). However, if we consider the troposphere as a whole, Sexceeds P everywhere due to the predominance of OH recy-cling in the FT. In the low-latitude MBL r is lowest, indica-tive of a relatively high sensitivity to perturbations such aslarge-scale variations and trends in CH4 and CO. This is notthe case in the continental troposphere, where natural VOCsplay an important role in OH recycling. Figure 9 shows thatr is larger in the extratropics than in the tropics and largest athigh latitudes.
www.atmos-chem-phys.net/16/12477/2016/ Atmos. Chem. Phys., 16, 12477–12493, 2016

12486 J. Lelieveld et al.: Global tropospheric hydroxyl distribution, budget and reactivity
G
P
S
Unit: ppbv OH/day
Figure 7. Annual mean OH formation in the troposphere (left) and up to 10 hPa (right). The top panels show total (G), the middle panelsprimary (P ) and the bottom panels secondary (S) OH formation (in ppbv day−1).
The chemical buffering mechanisms include the dominantthough self-limiting effect of NOx on OH formation in pol-luted air, the latter through Reaction (R10), which is an im-portant sink of both NO2 and OH when concentrations arehigh (NOx mechanism; blue in Fig. 6). In unpolluted, low-NOx conditions the OVOC mechanism acts through com-petition of unsaturated peroxide and carbonyl sinks, e.g.,HPALD in isoprene chemistry (red in Fig. 6). When OHis high, HPALD reacts with OH, whereas at low OH pho-todissociation takes the upper hand through the formation ofPACALD, which produces OH. Over land OH is generallybuffered by the NOx and OVOC mechanisms, illustrated byvalues of r well over 50 % (Fig. 9). However, remote fromNOx and VOC sources in the BL over the tropical and sub-tropical oceans r can be below 40 %. In these environmentsOH recycling depends on the Ox mechanism (green plus yel-low in Fig. 6), which has limited efficiency because Reac-tion (R11) (O3+HO2) is a net oxidant sink. Hence the Ox
mechanism depends on replenishment of O3 through trans-port in the FT and subsequent mixing into the BL.
Differences in S between tropospheric reservoirs – e.g.,the CBL, MBL, tropics and extratropics – are associated withthese three principal OH recycling mechanisms, to variousdegrees related to natural and anthropogenic VOC and NOxemissions. Figure 10 illustrates how OH is buffered both onlocal and global scales. It shows the fractional contributionsof the NOx , Ox and OVOC mechanisms to the overall re-cycling probability r , and it indicates that the three mecha-nisms are complementary. The NOx mechanism dominatesin the NH, especially in polluted air at middle latitudes, andmost strongly over the continents. In the SH over the con-tinents, in low-NOx air, the OVOC mechanism dominates.In the marine environment – except the pollution outflow re-gions over the Atlantic and Pacific oceans – the Ox mech-anism predominates. Seasonal complementarity of the threemechanisms is most significant at high latitudes, especially
Atmos. Chem. Phys., 16, 12477–12493, 2016 www.atmos-chem-phys.net/16/12477/2016/

J. Lelieveld et al.: Global tropospheric hydroxyl distribution, budget and reactivity 12487
Figure 8. Correlation diagrams, showing P and S on the y axes as a function of the photodissociation rate of O3 by Reaction (R1), J (O1D),on the x axes. Please notice the log–log scale. P is shown in the left panels and S in the right panels, in the troposphere (top), FT (middle)and BL (bottom).
in the BL. Whereas in summer the Ox mechanism is mostefficient, and to a lesser degree also the NOx mechanism, inwinter the OVOC mechanism maintains OH formation, beingleast dependent on solar radiation.
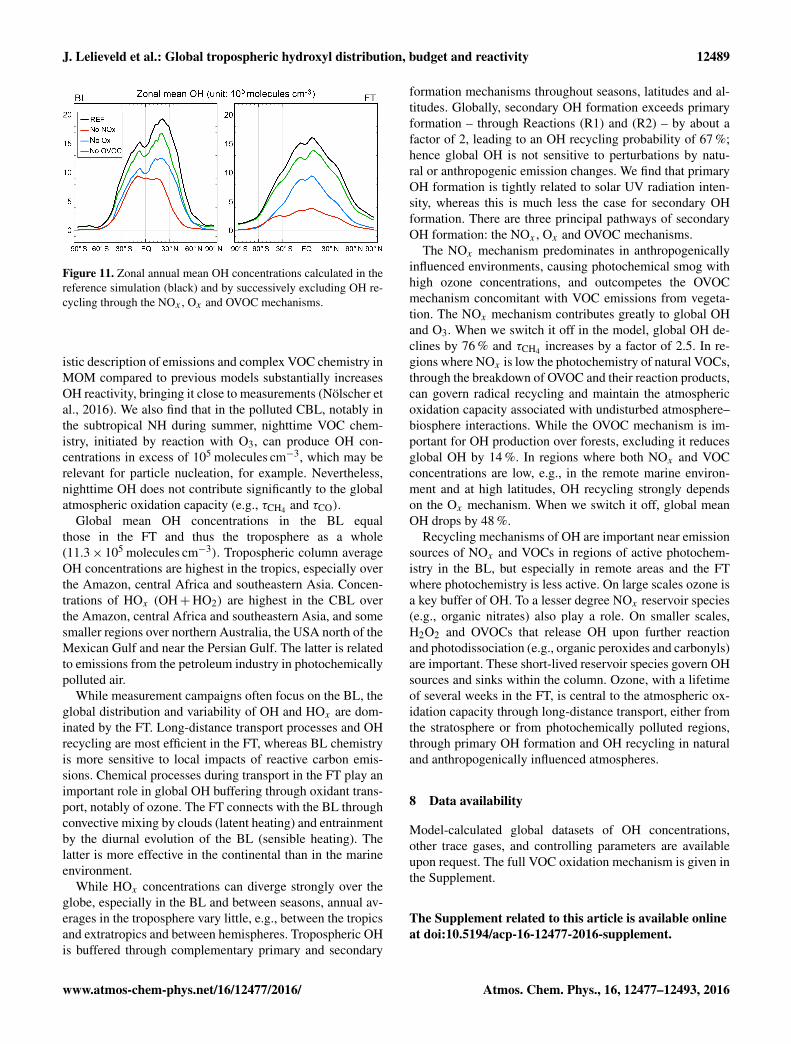
To estimate the contributions of the three recyclingmechanisms (NOx , Ox , OVOC) to global OH and r ,we performed sensitivity simulations, switching them offone by one. By excluding OH recycling by NOx , theglobal mean OH concentration declines from 11.3× 10⁵ to2.7× 105 molecules cm−3, i.e., a reduction by 76 %, whileτCH4 increases from 8.5 to 21.6 years, r reduces from 67to 42 % and the global mean production of OH drops from
4.8 to 2.8 ppbv day−1. This result corroborates the great im-portance of this mechanism and the sensitivity of globalOH to NOx abundance. The latter is illustrated by Fig. 11,which shows zonal mean OH concentrations by the refer-ence simulation and by excluding the three OH recyclingmechanisms one by one. The NOx mechanism clearly hasthe largest impact on global OH, i.e., through the partitioningbetween OH and HO2 and through the formation of O3. Fig-ure 11 also shows that model-calculated OH exhibits near-interhemispheric parity in the FT, while the NOx mechanismleads to more OH in the NH, primarily in the subtropicalboundary layer.
www.atmos-chem-phys.net/16/12477/2016/ Atmos. Chem. Phys., 16, 12477–12493, 2016

12488 J. Lelieveld et al.: Global tropospheric hydroxyl distribution, budget and reactivity
Unit: %
Figure 9. Annual mean OH recycling probability (r in %) in thetroposphere (top) and the BL (bottom).
The strength of the Ox mechanism comes second in mag-nitude, as its omission leads to a drop in global OH from11.3× 105 to 5.9× 10⁵ molecules cm−3, i.e., a reduction by48 %, while τCH4 increases from 8.5 to 15.0 years, r reducesfrom 67 to 52 % and the global mean production of OH de-creases from 4.8 to 3.4 ppbv day−1. The overall strength ofthe OVOC mechanism is the weakest of the three. Whenwe switch it off, global OH decreases from 11.3× 10⁵ to9.7× 105 molecules cm−3, i.e., a reduction by 14 %, whileτCH4 increases from 8.5 to 9.7 years, r reduces from 67 to61 % and the global mean production of OH decreases from4.8 to 4.2 ppbv day−1. Note that in the latter sensitivity sim-ulation we include OH recycling from HO2 that is producedthrough OVOC chemistry, which would otherwise contributeto the NOx and Ox mechanisms. The OH formation throughHO2, produced in the breakdown of VOC, accounts for abouthalf the OH recycling by the OVOC mechanism.
NOX
OX
OVOC
Unit: %
Figure 10. Fractional contributions to the OH recycling probabil-ity (% of r) in the troposphere by the NOx (top), Ox (middle) andOVOC (bottom) mechanisms (the sum of all three panels is 100 %).
7 Conclusions
The atmospheric oxidation capacity is generally not sensi-tive to perturbations that may arise from variations or trendsin emissions of natural and anthropogenic origin. This is il-lustrated by global OH calculations with a large number ofchemistry-transport models (Naik et al., 2013; Voulgarakis etal., 2013), where differences between models are larger thanbetween preindustrial, present and future emission scenar-ios calculated by the same models. This suggests that modelphysics and chemistry formulations have a greater impact oncalculations of global OH than applying different emissionscenarios of source and sink gases. Results from the EMACgeneral circulation model illustrate how a combination of tro-pospheric chemistry and transport mechanisms buffer OH ona range of scales.
The EMAC model includes the recent Mainz OrganicsMechanism to comprehensively account for VOC chemistry,including higher-generation reaction products, leading to aclosed atmospheric budget of reactive carbon. The more real-
Atmos. Chem. Phys., 16, 12477–12493, 2016 www.atmos-chem-phys.net/16/12477/2016/
J. Lelieveld et al.: Global tropospheric hydroxyl distribution, budget and reactivity 12489
Figure 11. Zonal annual mean OH concentrations calculated in thereference simulation (black) and by successively excluding OH re-cycling through the NOx , Ox and OVOC mechanisms.
istic description of emissions and complex VOC chemistry inMOM compared to previous models substantially increasesOH reactivity, bringing it close to measurements (Nölscher etal., 2016). We also find that in the polluted CBL, notably inthe subtropical NH during summer, nighttime VOC chem-istry, initiated by reaction with O3, can produce OH con-centrations in excess of 105 molecules cm−3, which may berelevant for particle nucleation, for example. Nevertheless,nighttime OH does not contribute significantly to the globalatmospheric oxidation capacity (e.g., τCH4 and τCO).
Global mean OH concentrations in the BL equalthose in the FT and thus the troposphere as a whole(11.3× 10⁵ molecules cm−3). Tropospheric column averageOH concentrations are highest in the tropics, especially overthe Amazon, central Africa and southeastern Asia. Concen-trations of HOx (OH+HO2) are highest in the CBL overthe Amazon, central Africa and southeastern Asia, and somesmaller regions over northern Australia, the USA north of theMexican Gulf and near the Persian Gulf. The latter is relatedto emissions from the petroleum industry in photochemicallypolluted air.
While measurement campaigns often focus on the BL, theglobal distribution and variability of OH and HOx are dom-inated by the FT. Long-distance transport processes and OHrecycling are most efficient in the FT, whereas BL chemistryis more sensitive to local impacts of reactive carbon emis-sions. Chemical processes during transport in the FT play animportant role in global OH buffering through oxidant trans-port, notably of ozone. The FT connects with the BL throughconvective mixing by clouds (latent heating) and entrainmentby the diurnal evolution of the BL (sensible heating). Thelatter is more effective in the continental than in the marineenvironment.
While HOx concentrations can diverge strongly over theglobe, especially in the BL and between seasons, annual av-erages in the troposphere vary little, e.g., between the tropicsand extratropics and between hemispheres. Tropospheric OHis buffered through complementary primary and secondary
formation mechanisms throughout seasons, latitudes and al-titudes. Globally, secondary OH formation exceeds primaryformation – through Reactions (R1) and (R2) – by about afactor of 2, leading to an OH recycling probability of 67 %;hence global OH is not sensitive to perturbations by natu-ral or anthropogenic emission changes. We find that primaryOH formation is tightly related to solar UV radiation inten-sity, whereas this is much less the case for secondary OHformation. There are three principal pathways of secondaryOH formation: the NOx , Ox and OVOC mechanisms.
The NOx mechanism predominates in anthropogenicallyinfluenced environments, causing photochemical smog withhigh ozone concentrations, and outcompetes the OVOCmechanism concomitant with VOC emissions from vegeta-tion. The NOx mechanism contributes greatly to global OHand O3. When we switch it off in the model, global OH de-clines by 76 % and τCH4 increases by a factor of 2.5. In re-gions where NOx is low the photochemistry of natural VOCs,through the breakdown of OVOC and their reaction products,can govern radical recycling and maintain the atmosphericoxidation capacity associated with undisturbed atmosphere–biosphere interactions. While the OVOC mechanism is im-portant for OH production over forests, excluding it reducesglobal OH by 14 %. In regions where both NOx and VOCconcentrations are low, e.g., in the remote marine environ-ment and at high latitudes, OH recycling strongly dependson the Ox mechanism. When we switch it off, global meanOH drops by 48 %.
Recycling mechanisms of OH are important near emissionsources of NOx and VOCs in regions of active photochem-istry in the BL, but especially in remote areas and the FTwhere photochemistry is less active. On large scales ozone isa key buffer of OH. To a lesser degree NOx reservoir species(e.g., organic nitrates) also play a role. On smaller scales,H2O2 and OVOCs that release OH upon further reactionand photodissociation (e.g., organic peroxides and carbonyls)are important. These short-lived reservoir species govern OHsources and sinks within the column. Ozone, with a lifetimeof several weeks in the FT, is central to the atmospheric ox-idation capacity through long-distance transport, either fromthe stratosphere or from photochemically polluted regions,through primary OH formation and OH recycling in naturaland anthropogenically influenced atmospheres.
8 Data availability
Model-calculated global datasets of OH concentrations,other trace gases, and controlling parameters are availableupon request. The full VOC oxidation mechanism is given inthe Supplement.
The Supplement related to this article is available onlineat doi:10.5194/acp-16-12477-2016-supplement.
www.atmos-chem-phys.net/16/12477/2016/ Atmos. Chem. Phys., 16, 12477–12493, 2016

12490 J. Lelieveld et al.: Global tropospheric hydroxyl distribution, budget and reactivity
The article processing charges for this open-accesspublication were covered by the Max Planck Society.
Edited by: M. KanakidouReviewed by: four anonymous referees
References
Arneth, A., Harrison, S. P., Zaehle, S., Tsigaridis, K., Menon, S.,Bartlein, P. J., Feichter, J., Korhola, A., Kulmala, M., O’Donnell,D., Schurgers, G., Sorvari, S., and Vesala, T.: Terrestrial biogeo-chemical feedbacks in the climate system, Nat. Geosci., 3, 525–532, 2010.
Butler, T. M., Lawrence, M. G., Taraborrelli, D., and Lelieveld, J.:Tagged ozone production potential (TOPP) of volatile organiccompounds, Atmos. Environ., 45, 4082–4090, 2011.
Cabrera-Perez, D., Taraborrelli, D., Sander, R., and Pozzer, A.:Global atmospheric budget of simple monocyclic aromatic com-pounds, Atmos. Chem. Phys., 16, 6931–6947, doi:10.5194/acp-16-6931-2016, 2016.
Christoudias, T. and Lelieveld, J.: Modelling the global atmospherictransport and deposition of radionuclides from the FukushimaDai-ichi nuclear accident, Atmos. Chem. Phys., 13, 1425–1438,doi:10.5194/acp-13-1425-2013, 2013.
Crounse, J. D., Knap, H. C., Ørnsø, K. B., Jørgensen, S., Paulot,F., Kjaergaard, G. G., and Wennberg, P. O.: Atmospheric fate ofmethacrolein. 1. Peroxy radical isomerization following additionof OH and O2, J. Phys. Chem. A, 116, 5756–5762, 2012.
Crounse, J. D., Nielsen, L. B., Jørgensen, S., Kjaergaard, H. G.,and Wennberg, P. O.: Autoxidation of organic compounds in theatmosphere, J. Phys. Chem. Lett., 4, 3513–3520, 2013.
Crutzen, P. J.: A discussion of the chemistry of some minor con-stituents in the stratosphere and troposphere, Pure App. Geo-phys., 106–108, 1385–1399, 1973.
Crutzen, P. J. and Zimmermann, P. H.: The changing photochem-istry of the troposphere, Tellus, 43AB, 136–151, 1991.
Deckert, R., Jöckel, P., Grewe, V., Gottschaldt, K.-D., and Hoor,P.: A quasi chemistry-transport model mode for EMAC, Geosci.Model Dev., 4, 195–206, doi:10.5194/gmd-4-195-2011, 2011.
De Laat, A. T. J. and Lelieveld, J.: Diurnal ozone cycle in the marineboundary layer, J. Geophys. Res., 105, 11547–11559, 2000.
De Meij, A., Pozzer, A., Pringle, K. J., Tost, H., and Lelieveld,J.: EMAC model evaluation and analysis of atmospheric aerosolproperties and distribution, Atmos. Res., 114–115, 38–69, 2012.
Ehhalt, D. H., Dorn, H.-P., and Poppe, D.: The chemistry of thehydroxyl radical in the troposphere, Proc. R. Soc. Edinb. B., 97,17–34, 1991.
Elshorbany, Y. F., Crutzen, P. J., Steil, B., Pozzer, A., Tost, H.,and Lelieveld, J.: Global and regional impacts of HONO onthe chemical composition of clouds and aerosols, Atmos. Chem.Phys., 14, 1167–1184, doi:10.5194/acp-14-1167-2014, 2014.
Fuchs, H., Acir, I.-H., Bohn, B., Brauers, T., Dorn, H.-P., Häseler,R., Hofzumahaus, A., Holland, F., Kaminski, M., Li, X., Lu, K.,Lutz, A., Nehr, S., Rohrer, F., Tillmann, R., Wegener, R., andWahner, A.: OH regeneration from methacrolein oxidation in-vestigated in the atmosphere simulation chamber SAPHIR, At-
mos. Chem. Phys., 14, 7895–7908, doi:10.5194/acp-14-7895-2014, 2014.
Granier, C., Bessagnet, B., Bond, T., D’Angiola, A., van der Gon,H. D., Frost, G. J., Heil, A., Kaiser, J. W., Kinne, S., Klimont,Z., Kloster, S., Lamarque, J.-F., Liousse, C., Masui, T., Meleux,F., Mieville, A., Ohara, T., Raut, J.-C., Riahi, K., Schultz, M.G., Smith, S. J., Thompson, A., van Aardenne, J., van der Werf,G. R., and van Vuuren, D. P.: Evolution of anthropogenic andbiomass burning emissions of air pollutants at global and re-gional scales during the 1980–2010 period, Climatic Change,109, 163–190, 2011.
Groß, C. B. M., Dillon, T. J., Schuster, G., Lelieveld, J., and Crow-ley, J. N.: Direct kinetic study of OH and O3 formation in thereaction of CH3C(O)O2 with HO2, J. Phys. Chem. A, 118, 974–985, 2014a.
Groß, C. B. M., Dillon, T. J., and Crowley, J. N.: Pressure dependentOH yields in the reactions of CH3CO and HOCH2CO with O2,Phys. Chem. Chem. Phys., 16, 10990–10998, 2014b.
Gromov, S., Jöckel, P., Sander, R., and Brenninkmeijer, C. A. M.: Akinetic chemistry tagging technique and its application to mod-elling the stable isotopic composition of atmospheric trace gases,Geosci. Model Dev., 3, 337–364, doi:10.5194/gmd-3-337-2010,2010.
Guenther, A. B., Jiang, X., Heald, C. L., Sakulyanontvittaya, T.,Duhl, T., Emmons, L. K., and Wang, X.: The Model of Emissionsof Gases and Aerosols from Nature version 2.1 (MEGAN2.1): anextended and updated framework for modeling biogenic emis-sions, Geosci. Model Dev., 5, 1471–1492, doi:10.5194/gmd-5-1471-2012, 2012.
Houweling, S., Dentener, F., and Lelieveld, J.: The impact of non-methane hydrocarbon compounds on tropospheric photochem-istry, J. Geophys. Res., 103, 10673–10696, 1998.
Jenkin, M. E., Young, J. C., and Rickard, A. R.: The MCMv3.3.1 degradation scheme for isoprene, Atmos. Chem. Phys.,15, 11433–11459, doi:10.5194/acp-15-11433-2015, 2015.
Jöckel, P., Sander, R., Kerkweg, A., Tost, H., and Lelieveld, J.: Tech-nical Note: The Modular Earth Submodel System (MESSy) – anew approach towards Earth System Modeling, Atmos. Chem.Phys., 5, 433–444, doi:10.5194/acp-5-433-2005, 2005.
Jöckel, P., Tost, H., Pozzer, A., Brühl, C., Buchholz, J., Ganzeveld,L., Hoor, P., Kerkweg, A., Lawrence, M. G., Sander, R., Steil,B., Stiller, G., Tanarhte, M., Taraborrelli, D., van Aardenne, J.,and Lelieveld, J.: The atmospheric chemistry general circulationmodel ECHAM5/MESSy1: consistent simulation of ozone fromthe surface to the mesosphere, Atmos. Chem. Phys., 6, 5067–5104, doi:10.5194/acp-6-5067-2006, 2006.
Jöckel, P., Kerkweg, A., Pozzer, A., Sander, R., Tost, H., Riede, H.,Baumgaertner, A., Gromov, S., and Kern, B.: Development cycle2 of the Modular Earth Submodel System (MESSy2), Geosci.Model Dev., 3, 717–752, doi:10.5194/gmd-3-717-2010, 2010.
Kerkweg, A., Sander, R., Tost, H., and Jöckel, P.: Technicalnote: Implementation of prescribed (OFFLEM), calculated (ON-LEM), and pseudo-emissions (TNUDGE) of chemical species inthe Modular Earth Submodel System (MESSy), Atmos. Chem.Phys., 6, 3603–3609, doi:10.5194/acp-6-3603-2006, 2006.
Krol, M. and Lelieveld, J.: Can the variability in tropospheric OHbe deduced from measurements of 1,1,1-trichloroethane(methyl chloroform)?, J. Geophys. Res., 108, 4125,doi:10.1029/2002JD002423, 2003.
Atmos. Chem. Phys., 16, 12477–12493, 2016 www.atmos-chem-phys.net/16/12477/2016/
J. Lelieveld et al.: Global tropospheric hydroxyl distribution, budget and reactivity 12491
Kubistin, D., Harder, H., Martinez, M., Rudolf, M., Sander, R.,Bozem, H., Eerdekens, G., Fischer, H., Gurk, C., Klüpfel, T.,Königstedt, R., Parchatka, U., Schiller, C. L., Stickler, A.,Taraborrelli, D., Williams, J., and Lelieveld, J.: Hydroxyl rad-icals in the tropical troposphere over the Suriname rainforest:comparison of measurements with the box model MECCA, At-mos. Chem. Phys., 10, 9705–9728, doi:10.5194/acp-10-9705-2010, 2010.
Lawrence, M. G., Jöckel, P., and von Kuhlmann, R.: What does theglobal mean OH concentration tell us?, Atmos. Chem. Phys., 1,37–49, doi:10.5194/acp-1-37-2001, 2001.
Lelieveld, J. and Dentener, F. J.: What controls tropospheric ozone?,J. Geophys. Res., 105, 3531–3551, 2000.
Lelieveld, J., Peters, W., Dentener, F. J., and Krol: M. Stability oftropospheric hydroxyl chemistry, J. Geophys. Res., 107, 4715,doi:10.1029/2002JD002272, 2002.
Lelieveld, J., Brühl, C., Jöckel, P., Steil, B., Crutzen, P. J., Fis-cher, H., Giorgetta, M. A., Hoor, P., Lawrence, M. G., Sausen,R., and Tost, H.: Stratospheric dryness: model simulationsand satellite observations, Atmos. Chem. Phys., 7, 1313–1332,doi:10.5194/acp-7-1313-2007, 2007.
Lelieveld, J., Butler, T. M., Crowley, J. N., Dillon, T. J., Fischer,H., Ganzeveld, L., Harder, H., Lawrence, M. G., Martinez, M.,Taraborrelli, D., and Williams, J.: Atmospheric oxidation capac-ity sustained by a forest, Nature, 452, 737–740, 2008.
Lelieveld, J., Hoor, P., Jöckel, P., Pozzer, A., Hadjinicolaou, P.,Cammas, J.-P., and Beirle, S.: Severe ozone air pollution inthe Persian Gulf region, Atmos. Chem. Phys., 9, 1393–1406,doi:10.5194/acp-9-1393-2009, 2009.
Levy II, H.: Normal atmosphere: large radical and formaldehydeconcentrations predicted, Science, 173, 141–143, 1971.
Logan, J. A., Prather, M. J., Wofsy, S. C., and McElroy, M. B.: Tro-pospheric chemistry: A global perspective, J. Geophys. Res., 86,7210–7354, 1981.
Meinshausen, M., Smith, S. J., Calvin, K., Daniel, J. S., Kainuma,M. L. T., Lamarque, J.-F., Matsumoto, K., Montzka, S. A., Raper,S. C. B., Riahi, K., Thomson, A., Velders, G. J. M., and van Vu-uren, D. P. P.: The RCP greenhouse gas concentrations and theirextensions from 1765 to 2300, Climatic Change, 109, 213–241,2011.
Mogensen, D., Gierens, R., Crowley, J. N., Keronen, P., Smolander,S., Sogachev, A., Nölscher, A. C., Zhou, L., Kulmala, M., Tang,M. J., Williams, J., and Boy, M.: Simulations of atmosphericOH, O3 and NO3 reactivities within and above the boreal forest,Atmos. Chem. Phys., 15, 3909–3932, doi:10.5194/acp-15-3909-2015, 2015.
Monks, P. S., Archibald, A. T., Colette, A., Cooper, O., Coyle, M.,Derwent, R., Fowler, D., Granier, C., Law, K. S., Mills, G. E.,Stevenson, D. S., Tarasova, O., Thouret, V., von Schneidemesser,E., Sommariva, R., Wild, O., and Williams, M. L.: Troposphericozone and its precursors from the urban to the global scale fromair quality to short-lived climate forcer, Atmos. Chem. Phys., 15,8889–8973, doi:10.5194/acp-15-8889-2015, 2015.
Montzka, S., Krol, M., Dlugokencky, E., Hall, B., Jöckel, P., andLelieveld, J.: Small inter-annual variability of global atmospherichydroxyl, Science, 331, 67–69, 2011.
Naik, V., Voulgarakis, A., Fiore, A. M., Horowitz, L. W., Lamar-que, J.-F., Lin, M., Prather, M. J., Young, P. J., Bergmann, D.,Cameron-Smith, P. J., Cionni, I., Collins, W. J., Dalsøren, S. B.,Doherty, R., Eyring, V., Faluvegi, G., Folberth, G. A., Josse, B.,Lee, Y. H., MacKenzie, I. A., Nagashima, T., van Noije, T. P. C.,Plummer, D. A., Righi, M., Rumbold, S. T., Skeie, R., Shindell,D. T., Stevenson, D. S., Strode, S., Sudo, K., Szopa, S., and Zeng,G.: Preindustrial to present-day changes in tropospheric hydroxylradical and methane lifetime from the Atmospheric Chemistryand Climate Model Intercomparison Project (ACCMIP), Atmos.Chem. Phys., 13, 5277–5298, doi:10.5194/acp-13-5277-2013,2013.
Nölscher, A. C., Butler, T., Auld, J., Veres, P., Muñoz, A., Tarabor-relli, D., Vereecken, L., Lelieveld, J., and Williams, J.: Using to-tal OH reactivity to assess isoprene photooxidation via measure-ment and model, Atmos. Environ., 89, 453–463, 2014.
Nölscher, A. C., Yanez-Serrano, A. M., Wolff, S., Carioca deAraujo, A., Lavric, J. V., Kesselmeier, J., and Williams, J.:Unexpected seasonality in quantity and composition of Ama-zon rainforest air reactivity, Nature Communications, 7, 10383,doi:10.1038/ncomms10383, 2016.
Patra P. K., Krol, M. C., Montzka, S. A., Arnold, T., Atlas, E. L.,Lintner, B. R., Stephens, B. B., Xiang, B., Elkins, J. W., Fraser,P. J., Ghosh, A., Hintsa, E. J., Hurst, D. F., Ishijima, K., Krum-mel, P. B., Miller, B. R., Miyazaki, K., Moore, F. L., Mühle, J.,O’Doherty, S., Prinn, R. G., Steele, L. P., Takigawa, M., Wang, H.J., Weiss, R. F., Wofsy, S. C., and Young, D.: Observational evi-dence for interhemispheric hydroxyl-radical parity, Nature, 513,219–223, 2014.
Paulot, F., Crounse, J. D., Kjaergaard, H. G., Kürten, A., St. Clair,J. M., Seinfeld, J. H., and Wennberg, P. O.: Unexpected epoxideformation in the gas-phase photooxidation of isoprene, Science,325, 730–733, 2009.
Peeters, J., Müller, J.-F., Stavrakou, T., and Nguyen, V. S.: Hy-droxyl radical Recycling in isoprene oxidation driven by hydro-gen bonding and hydrogen tunneling: The upgraded LIM1 mech-anism, J. Phys. Chem., A, 118, 8625–8643, 2014.
Pozzer, A., Jöckel, P., Tost, H., Sander, R., Ganzeveld, L., Kerk-weg, A., and Lelieveld, J.: Simulating organic species withthe global atmospheric chemistry general circulation modelECHAM5/MESSy1: a comparison of model results with obser-vations, Atmos. Chem. Phys., 7, 2527–2550, doi:10.5194/acp-7-2527-2007, 2007.
Pozzer, A., Pollmann, J., Taraborrelli, D., Jöckel, P., Helmig, D.,Tans, P., Hueber, J., and Lelieveld, J.: Observed and simulatedglobal distribution and budget of atmospheric C2-C5 alkanes,Atmos. Chem. Phys., 10, 4403–4422, doi:10.5194/acp-10-4403-2010, 2010.
Pozzer, A., Jöckel, P., Kern, B., and Haak, H.: The Atmosphere-Ocean General Circulation Model EMAC-MPIOM, Geosci.Model Dev., 4, 771–784, doi:10.5194/gmd-4-771-2011, 2011.
Pozzer, A., de Meij, A., Pringle, K. J., Tost, H., Doering, U. M., vanAardenne, J., and Lelieveld, J.: Distributions and regional bud-gets of aerosols and their precursors simulated with the EMACchemistry-climate model, Atmos. Chem. Phys., 12, 961–987,doi:10.5194/acp-12-961-2012, 2012.
Pringle, K. J., Tost, H., Message, S., Steil, B., Giannadaki, D.,Nenes, A., Fountoukis, C., Stier, P., Vignati, E., and Lelieveld, J.:Description and evaluation of GMXe: a new aerosol submodel
www.atmos-chem-phys.net/16/12477/2016/ Atmos. Chem. Phys., 16, 12477–12493, 2016

12492 J. Lelieveld et al.: Global tropospheric hydroxyl distribution, budget and reactivity
for global simulations (v1), Geosci. Model Dev., 3, 391–412,doi:10.5194/gmd-3-391-2010, 2010.
Pugh, T. A. M., MacKenzie, A. R., Hewitt, C. N., Langford, B.,Edwards, P. M., Furneaux, K. L., Heard, D. E., Hopkins, J. R.,Jones, C. E., Karunaharan, A., Lee, J., Mills, G., Misztal, P.,Moller, S., Monks, P. S., and Whalley, L. K.: Simulating atmo-spheric composition over a South-East Asian tropical rainforest:performance of a chemistry box model, Atmos. Chem. Phys., 10,279–298, doi:10.5194/acp-10-279-2010, 2010.
Ren, X., van Duin, D., Cazorla, M., Chen, S., Mao, J., Zhang, L.,Brune, W. H., Flynn, J. H., Grossberg, N., Lefer, B. L., Rap-penglück, B., Wong, K. W., Tsai, C., Stutz, J., Dibb, J. E., Jobson,T., Luke, W. T., and Kelley, P.: Atmospheric oxidation chemistryand ozone production: Results from SHARP 2009 in Houston,Texas, J. Geophys. Res., 118, 5770–5780, 2013.
Riahi, K., Gruebler, A., and Nakicenovic, N.: Scenarios of longtermsocio-economic and environmental development under climatestabilization, Technol. Forecast. Soc., 74, 887–935, 2007.
Roeckner, E., Brokopf, R., Esch, M., Giorgetta, M., Hagemann, S.,Kornblüh, Manzini, L. E., Schlese, U., and Schulzweida, U.: Sen-sitivity of simulated climate to horizontal and vertical resolutionin the ECHAM5 atmosphere model, J. Climate, 19, 3771–3791,2006.
Rohrer, F. and Berresheim, H.: Strong correlation between levelsof tropospheric hydroxyl radicals and solar ultraviolet radiation,Nature, 442, 184–187, 2006.
Rohrer, F., Lu, K., Hofzumahaus, A., Bohn, B., Brauers, T., Chang,C.-C., Fuchs, H., Häseler, R., Holland, F., Hu, M., Kita, K.,Kondo, Y., Li, X., Lou, S., Oebel, A., Shao, M., Zeng, L., Zhu, T.,Zhang, Y., and Wahner, A.: Maximum efficiency in the hydroxyl-radical-based self-cleansing of the troposphere, Nat. Geosci., 7,559–563, 2014.
Sander, R., Kerkweg, A., Jöckel, P., and Lelieveld, J.: Technicalnote: The new comprehensive atmospheric chemistry moduleMECCA, Atmos. Chem. Phys., 5, 445–450, doi:10.5194/acp-5-445-2005, 2005.
Sander, R., Baumgaertner, A., Gromov, S., Harder, H., Jöckel, P.,Kerkweg, A., Kubistin, D., Regelin, E., Riede, H., Sandu, A.,Taraborrelli, D., Tost, H., and Xie, Z.-Q.: The atmospheric chem-istry box model CAABA/MECCA-3.0, Geosci. Model Dev., 4,373–380, doi:10.5194/gmd-4-373-2011, 2011.
Sander, R., Jöckel, P., Kirner, O., Kunert, A. T., Landgraf, J.,and Pozzer, A.: The photolysis module JVAL-14, compatiblewith the MESSy standard, and the JVal PreProcessor (JVPP),Geosci. Model Dev., 7, 2653–2662, doi:10.5194/gmd-7-2653-2014, 2014.
Schneider, P. and van der A, R. J.: A global single-sensoranalysis of 2002–2011 tropospheric nitrogen dioxide trendsobserved from space, J. Geophys. Res., 117, D16309,doi:10.1029/2012JD017571, 2012.
Spivakovsky, C. M., Logan, J. A., Montzka, S. A., Balkanski, Y. J.,Foreman-Fowler, M., Jones, D. B. A., Horowitz, L. A., Fusco, A.C., Brenninkmeijer, C. A. M., Prather, M. J., Wofsy, S. C., andMcElroy, M. B.: Three-dimensional climatological distributionof tropospheric OH: Update and evaluation, J. Geophys. Res.,105, 8931–8980, 2000.
Stockwell, W. R., Lawson, C. V., Saunders, E., and Goliff, W. S.:A review of tropospheric atmospheric chemistry and gas-phasechemical mechanisms for air quality modeling, Atmosphere, 3,1–32, 2012.
Stone, D., Whalley, L. K., and Heard, D. E.: Tropospheric OHand HO2 radicals: field measurements and model comparisons,Chem. Soc. Rev., 41, 6348–6404, 2012.
Taraborrelli, D., Lawrence, M. G., Butler, T. M., Sander, R., andLelieveld, J.: Mainz Isoprene Mechanism 2 (MIM2): an isopreneoxidation mechanism for regional and global atmospheric mod-elling, Atmos. Chem. Phys., 9, 2751–2777, doi:10.5194/acp-9-2751-2009, 2009.
Taraborrelli, D., Lawrence, M. G., Crowley, J. N., Dillon, T. J.,Gromov, S., Groß, C. B. M., Vereecken, L., and Lelieveld, J.:Hydroxyl radical buffered by isoprene oxidation over tropicalforests, Nat. Geosci., 5, 190–193, 2012.
Tost, H., Jöckel, P., Kerkweg, A., Sander, R., and Lelieveld, J.: Tech-nical note: A new comprehensive SCAVenging submodel forglobal atmospheric chemistry modelling, Atmos. Chem. Phys.,6, 565–574, doi:10.5194/acp-6-565-2006, 2006.
Tost, H., Jöckel, P., Kerkweg, A., Pozzer, A., Sander, R.,and Lelieveld, J.: Global cloud and precipitation chem-istry and wet deposition: tropospheric model simulationswith ECHAM5/MESSy1, Atmos. Chem. Phys., 7, 2733–2757,doi:10.5194/acp-7-2733-2007, 2007a.
Tost, H., Jöckel, P., and Lelieveld, J.: Lightning and convec-tion parameterisations – uncertainties in global modelling, At-mos. Chem. Phys., 7, 4553–4568, doi:10.5194/acp-7-4553-2007,2007b.
Tsimpidi, A. P., Karydis, V. A., Pandis, S. N., and Lelieveld, J.:Global combustion sources of organic aerosols: model compari-son with 84 AMS factor-analysis data sets, Atmos. Chem. Phys.,16, 8939–8962, doi:10.5194/acp-16-8939-2016, 2016.
van Vuuren, D. P., Edmonds, J. A., Kainuma, M., Riahi, K., Thom-son, A. M., Hibbard, K., Hurtt, G. C., Kram, T., Krey, V.,Lamarque, J.-F., Masui, T., Nakicenovic, M. M. N., Smith, S.J., and Rose, S.: The representative concentration pathways: anoverview, Climatic Change, 109, 5–31, 2011.
Vereecken, L. and Francisco, J. S.: Theoretical studies of atmo-spheric reaction mechanisms in the troposphere, Chem. Soc.Rev., 41, 6259–6293, 2012.
Voulgarakis, A., Naik, V., Lamarque, J.-F., Shindell, D. T., Young, P.J., Prather, M. J., Wild, O., Field, R. D., Bergmann, D., Cameron-Smith, P., Cionni, I., Collins, W. J., Dalsøren, S. B., Doherty,R. M., Eyring, V., Faluvegi, G., Folberth, G. A., Horowitz, L.W., Josse, B., MacKenzie, I. A., Nagashima, T., Plummer, D.A., Righi, M., Rumbold, S. T., Stevenson, D. S., Strode, S. A.,Sudo, K., Szopa, S., and Zeng, G.: Analysis of present day andfuture OH and methane lifetime in the ACCMIP simulations,Atmos. Chem. Phys., 13, 2563–2587, doi:10.5194/acp-13-2563-2013, 2013.
Whalley, L. K., Edwards, P. M., Furneaux, K. L., Goddard, A., In-gham, T., Evans, M. J., Stone, D., Hopkins, J. R., Jones, C. E.,Karunaharan, A., Lee, J. D., Lewis, A. C., Monks, P. S., Moller,S. J., and Heard, D. E.: Quantifying the magnitude of a missinghydroxyl radical source in a tropical rainforest, Atmos. Chem.Phys., 11, 7223–7233, doi:10.5194/acp-11-7223-2011, 2011.
Atmos. Chem. Phys., 16, 12477–12493, 2016 www.atmos-chem-phys.net/16/12477/2016/

J. Lelieveld et al.: Global tropospheric hydroxyl distribution, budget and reactivity 12493
Worden, H. M., Deeter, M. N., Frankenberg, C., George, M., Nichi-tiu, F., Worden, J., Aben, I., Bowman, K. W., Clerbaux, C., Co-heur, P. F., de Laat, A. T. J., Detweiler, R., Drummond, J. R.,Edwards, D. P., Gille, J. C., Hurtmans, D., Luo, M., Martínez-Alonso, S., Massie, S., Pfister, G., and Warner, J. X.: Decadalrecord of satellite carbon monoxide observations, Atmos. Chem.Phys., 13, 837–850, doi:10.5194/acp-13-837-2013, 2013.
Yoon, J. and Pozzer, A.: Model-simulated trend of surface carbonmonoxide for the 2001–2010 decade, Atmos. Chem. Phys., 14,10465–10482, doi:10.5194/acp-14-10465-2014, 2014.
www.atmos-chem-phys.net/16/12477/2016/ Atmos. Chem. Phys., 16, 12477–12493, 2016