Global Top 100
67
Global Top 100 Companies by market capitalisation 31 March 2016 update www.pwc.co.uk An IPO Centre publication
-
Upload
pwc-polska -
Category
Business
-
view
1.357 -
download
0
Transcript of Global Top 100
Global Top 100Companies by marketcapitalisation
31 March 2016 update
www.pwc.co.uk
An IPO Centrepublication
PwC
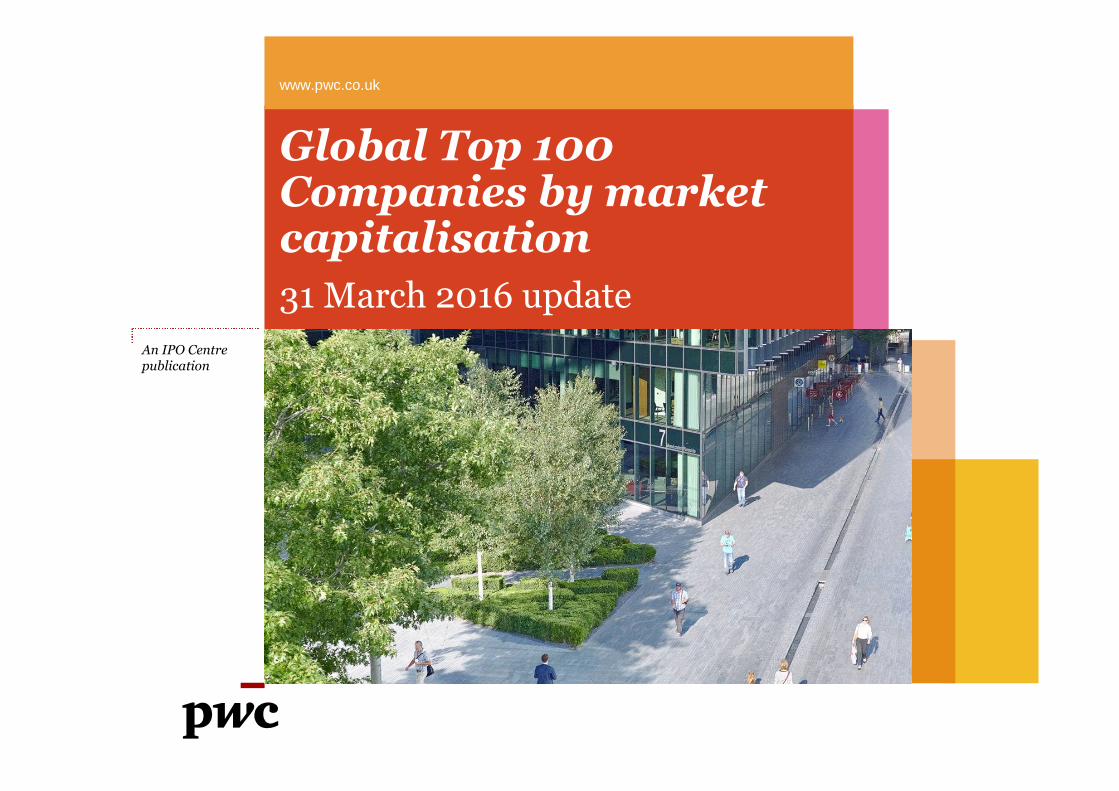
Contents
Section 1
Highlights and trends
Section 2
Year-on-year comparison: 2016 vs. 2015
Section 3
Value distributed to shareholders in calendar year 2015
Section 4
Post-financial crisis comparison: 2016 vs. 2009
3
12
22
27
PwC
Section 1Highlights and trends
Global Top 100Slide 3
PwC
$337 $329$417
$559
$416$469
$725$604
$40 $61 $69 $64 $70 $81 $85 $76
$bn
$200bn
$400bn
$600bn
$800bn
2009 2010 2011 2012 2013 2014 2015 2016
Ma
rk
et
Ca
p($
)Market caps of top and bottom companies
Number 1Number 100
Introduction
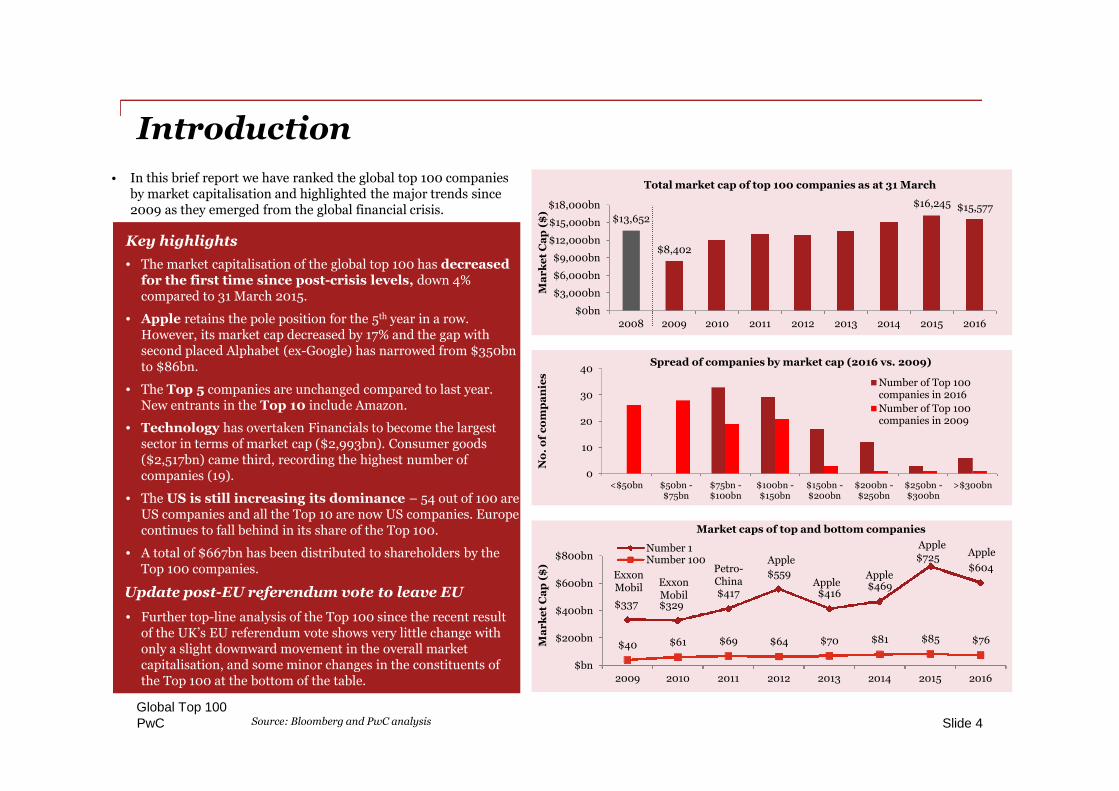
• In this brief report we have ranked the global top 100 companiesby market capitalisation and highlighted the major trends since2009 as they emerged from the global financial crisis.
Global Top 100Slide 4Source: Bloomberg and PwC analysis
Key highlights
• The market capitalisation of the global top 100 has decreasedfor the first time since post-crisis levels, down 4%compared to 31 March 2015.
• Apple retains the pole position for the 5th year in a row.However, its market cap decreased by 17% and the gap withsecond placed Alphabet (ex-Google) has narrowed from $350bnto $86bn.
• The Top 5 companies are unchanged compared to last year.New entrants in the Top 10 include Amazon.
• Technology has overtaken Financials to become the largestsector in terms of market cap ($2,993bn). Consumer goods($2,517bn) came third, recording the highest number ofcompanies (19).
• The US is still increasing its dominance – 54 out of 100 areUS companies and all the Top 10 are now US companies. Europecontinues to fall behind in its share of the Top 100.
• A total of $667bn has been distributed to shareholders by theTop 100 companies.
Update post-EU referendum vote to leave EU
• Further top-line analysis of the Top 100 since the recent resultof the UK’s EU referendum vote shows very little change withonly a slight downward movement in the overall marketcapitalisation, and some minor changes in the constituents ofthe Top 100 at the bottom of the table.
$13,652
$8,402
$16,245 $15,577
$0bn
$3,000bn
$6,000bn
$9,000bn
$12,000bn
$15,000bn
$18,000bn
2008 2009 2010 2011 2012 2013 2014 2015 2016
Ma
rk
et
Ca
p($
)
Total market cap of top 100 companies as at 31 March
0
10
20
30
40
<$50bn $50bn -$75bn
$75bn -$100bn
$100bn -$150bn
$150bn -$200bn
$200bn -$250bn
$250bn -$300bn
>$300bn
No
.o
fc
om
pa
nie
s
Spread of companies by market cap (2016 vs. 2009)
Number of Top 100companies in 2016
Number of Top 100companies in 2009
ExxonMobil
AppleApple
AppleApple
ApplePetro-ChinaExxon
Mobil
PwC
The ranking methodology
Global Top 100Slide 5
Methodology
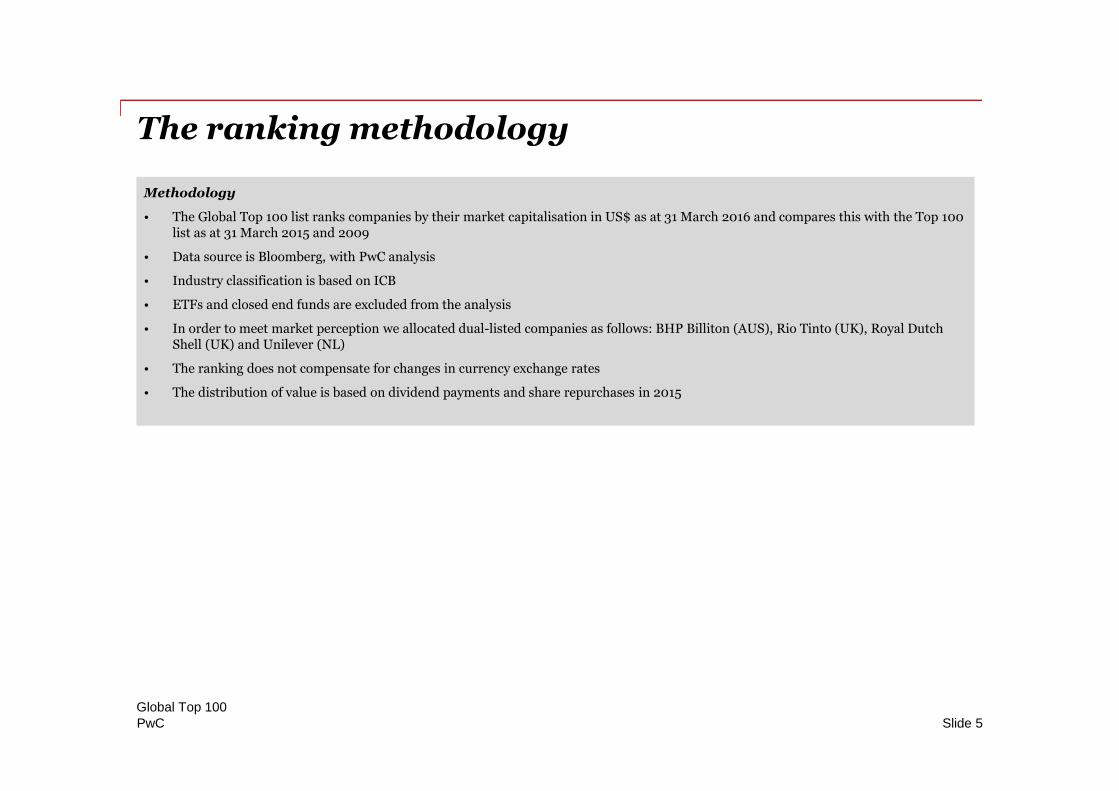
• The Global Top 100 list ranks companies by their market capitalisation in US$ as at 31 March 2016 and compares this with the Top 100list as at 31 March 2015 and 2009
• Data source is Bloomberg, with PwC analysis
• Industry classification is based on ICB
• ETFs and closed end funds are excluded from the analysis
• In order to meet market perception we allocated dual-listed companies as follows: BHP Billiton (AUS), Rio Tinto (UK), Royal DutchShell (UK) and Unilever (NL)
• The ranking does not compensate for changes in currency exchange rates
• The distribution of value is based on dividend payments and share repurchases in 2015
PwC
Total top 100 companies by market capitalisationas at 31 March
Global Top 100Slide 6Source: Bloomberg and PwC analysis
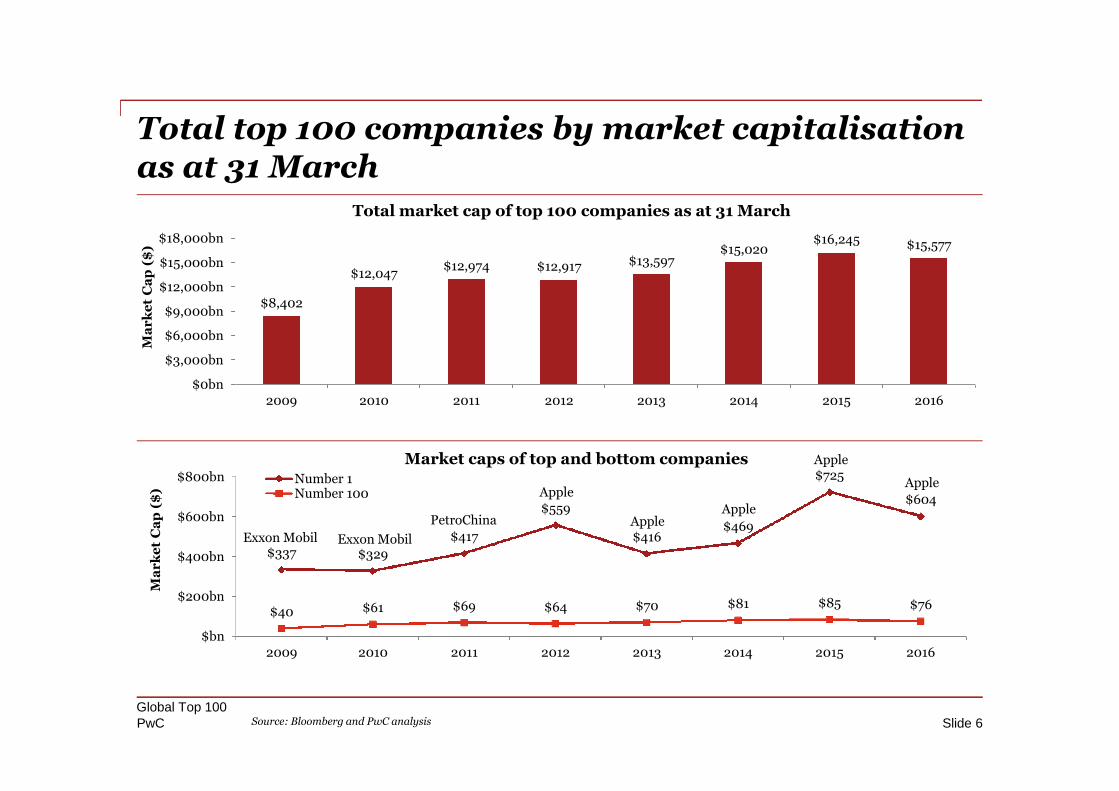
$8,402
$12,047$12,974 $12,917 $13,597
$15,020$16,245 $15,577
$0bn
$3,000bn
$6,000bn
$9,000bn
$12,000bn
$15,000bn
$18,000bn
2009 2010 2011 2012 2013 2014 2015 2016
Ma
rk
et
Ca
p($
)
Total market cap of top 100 companies as at 31 March
$337 $329
$417
$559
$416$469
$725
$604
$40 $61 $69 $64 $70 $81 $85 $76
$bn
$200bn
$400bn
$600bn
$800bn
2009 2010 2011 2012 2013 2014 2015 2016
Ma
rk
et
Ca
p($
)
Market caps of top and bottom companiesNumber 1Number 100
Apple
Apple
PetroChina
Exxon Mobil
Apple
Apple
Apple
Exxon Mobil
PwC
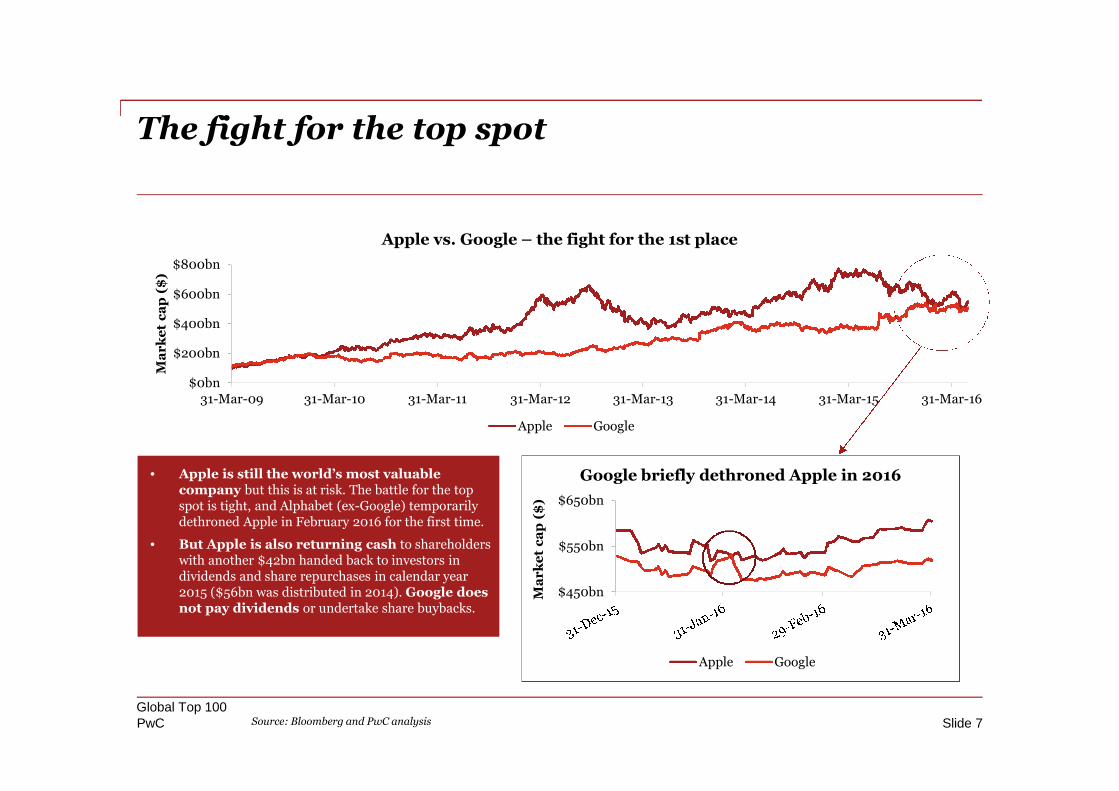
The fight for the top spot
Global Top 100Slide 7Source: Bloomberg and PwC analysis
• Apple is still the world’s most valuablecompany but this is at risk. The battle for the topspot is tight, and Alphabet (ex-Google) temporarilydethroned Apple in February 2016 for the first time.
• But Apple is also returning cash to shareholderswith another $42bn handed back to investors individends and share repurchases in calendar year2015 ($56bn was distributed in 2014). Google doesnot pay dividends or undertake share buybacks.
$0bn
$200bn
$400bn
$600bn
$800bn
31-Mar-09 31-Mar-10 31-Mar-11 31-Mar-12 31-Mar-13 31-Mar-14 31-Mar-15 31-Mar-16
Ma
rk
et
ca
p($
)
Apple vs. Google – the fight for the 1st place
Apple Google
$450bn
$550bn
$650bn
Ma
rk
et
ca
p($
)
Google briefly dethroned Apple in 2016
Apple Google
PwC
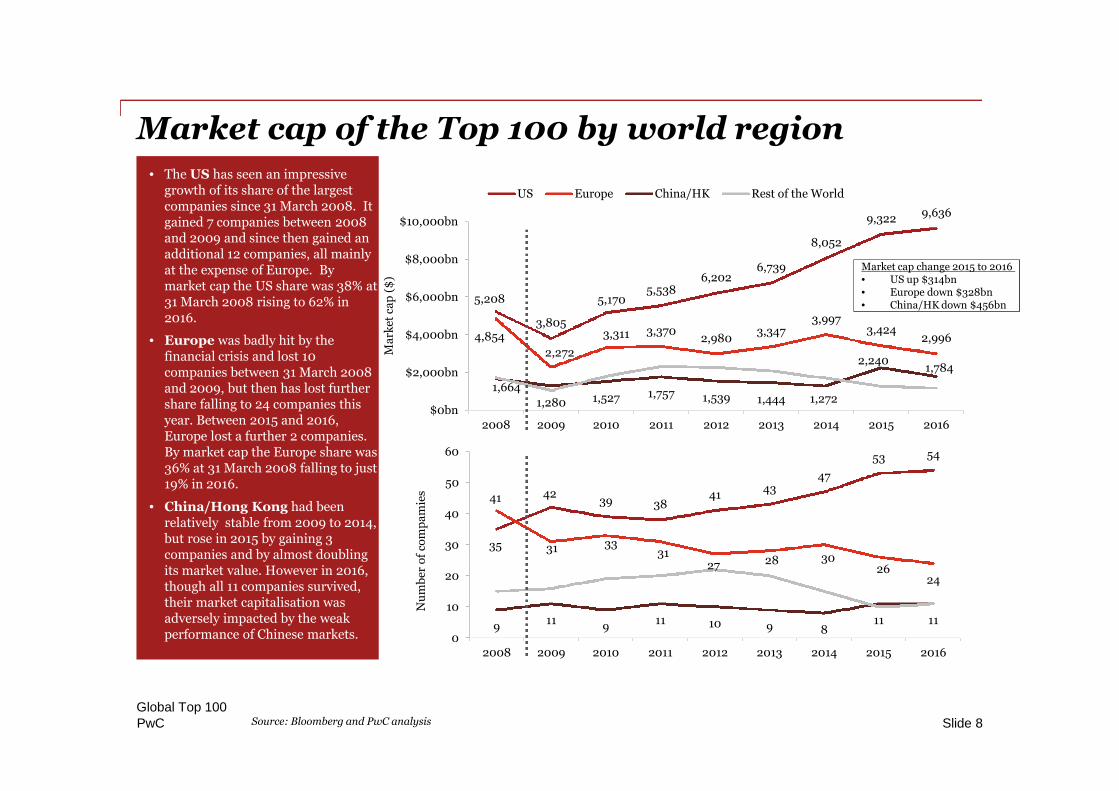
Market cap of the Top 100 by world region
Global Top 100Slide 8
• The US has seen an impressivegrowth of its share of the largestcompanies since 31 March 2008. Itgained 7 companies between 2008and 2009 and since then gained anadditional 12 companies, all mainlyat the expense of Europe. Bymarket cap the US share was 38% at31 March 2008 rising to 62% in2016.
• Europe was badly hit by thefinancial crisis and lost 10companies between 31 March 2008and 2009, but then has lost furthershare falling to 24 companies thisyear. Between 2015 and 2016,Europe lost a further 2 companies.By market cap the Europe share was36% at 31 March 2008 falling to just19% in 2016.
• China/Hong Kong had beenrelatively stable from 2009 to 2014,but rose in 2015 by gaining 3companies and by almost doublingits market value. However in 2016,though all 11 companies survived,their market capitalisation wasadversely impacted by the weakperformance of Chinese markets.
5,208
3,805
5,1705,538
6,2026,739
8,052
9,322 9,636
4,854
2,272
3,311 3,3702,980
3,3473,997
3,4242,996
1,664
1,280 1,527 1,757 1,539 1,444 1,272
2,2401,784
$0bn
$2,000bn
$4,000bn
$6,000bn
$8,000bn
$10,000bn
2008 2009 2010 2011 2012 2013 2014 2015 2016
Ma
rket
cap
($)
US Europe China/HK Rest of the World
35
4239 38
4143
47
53 54
41
31 3331
27 28 3026
24
911
911 10 9 8
11 11
0
10
20
30
40
50
60
2008 2009 2010 2011 2012 2013 2014 2015 2016
Nu
mb
ero
fco
mp
am
ies
Market cap change 2015 to 2016• US up $314bn• Europe down $328bn• China/HK down $456bn
Source: Bloomberg and PwC analysis
PwC
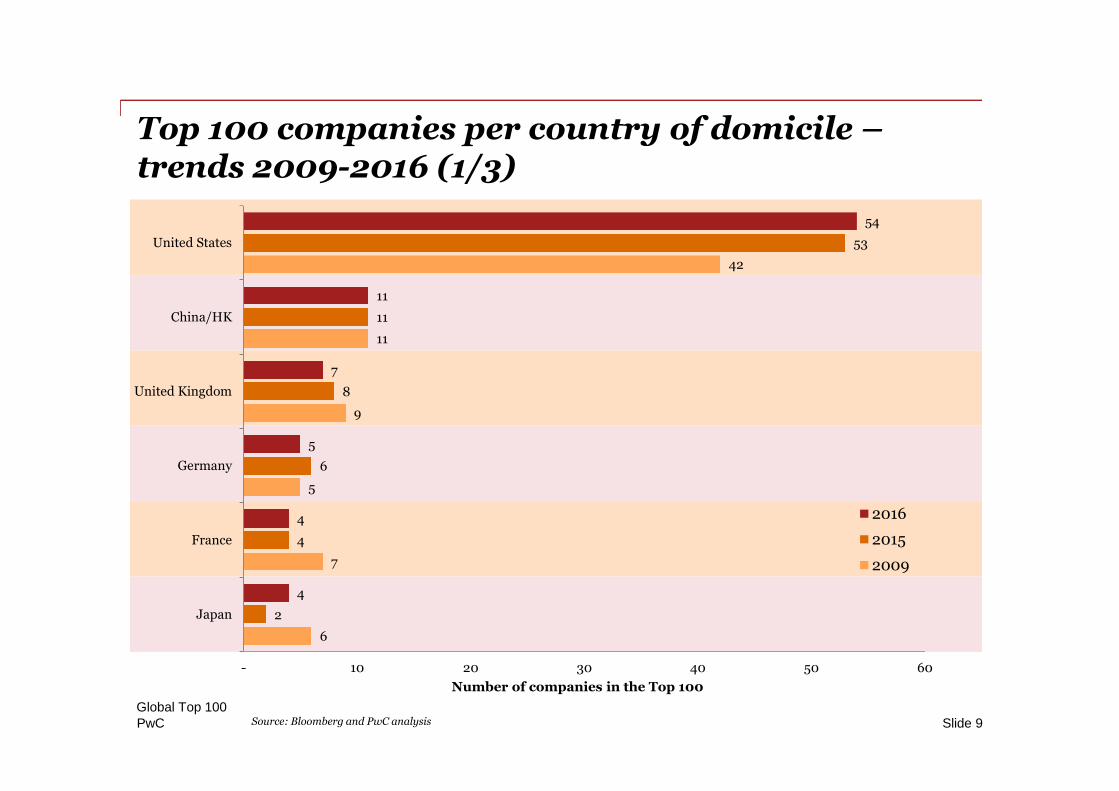
Top 100 companies per country of domicile –trends 2009-2016 (1/3)
Global Top 100Slide 9
6
7
5
9
11
42
2
4
6
8
11
53
4
4
5
7
11
54
- 10 20 30 40 50 60
Japan
France
Germany
United Kingdom
China/HK
United States
Number of companies in the Top 100
2016
2015
2009
Source: Bloomberg and PwC analysis
PwC
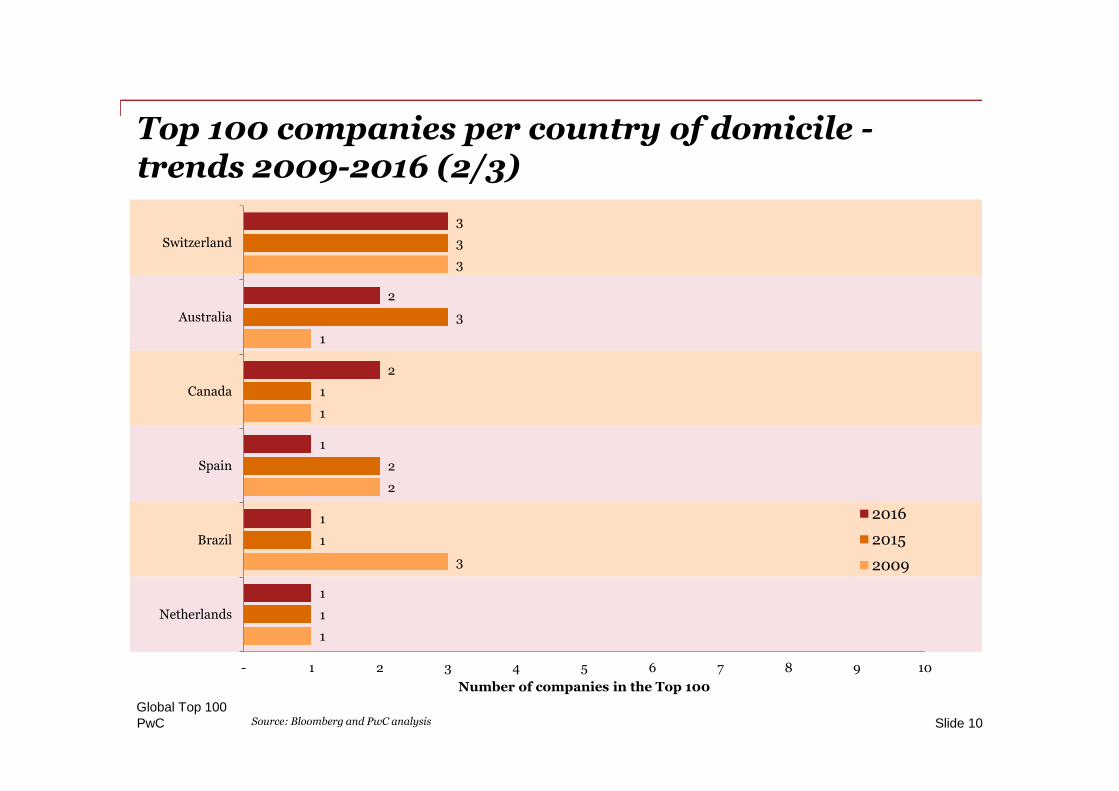
Top 100 companies per country of domicile -trends 2009-2016 (2/3)
Global Top 100Slide 10
1
3
2
1
1
3
1
1
2
1
3
3
1
1
1
2
2
3
- 1 2 3 4 5 6 7 8 9 10
Netherlands
Brazil
Spain
Canada
Australia
Switzerland
Number of companies in the Top 100
2016
2015
2009
Source: Bloomberg and PwC analysis
PwC
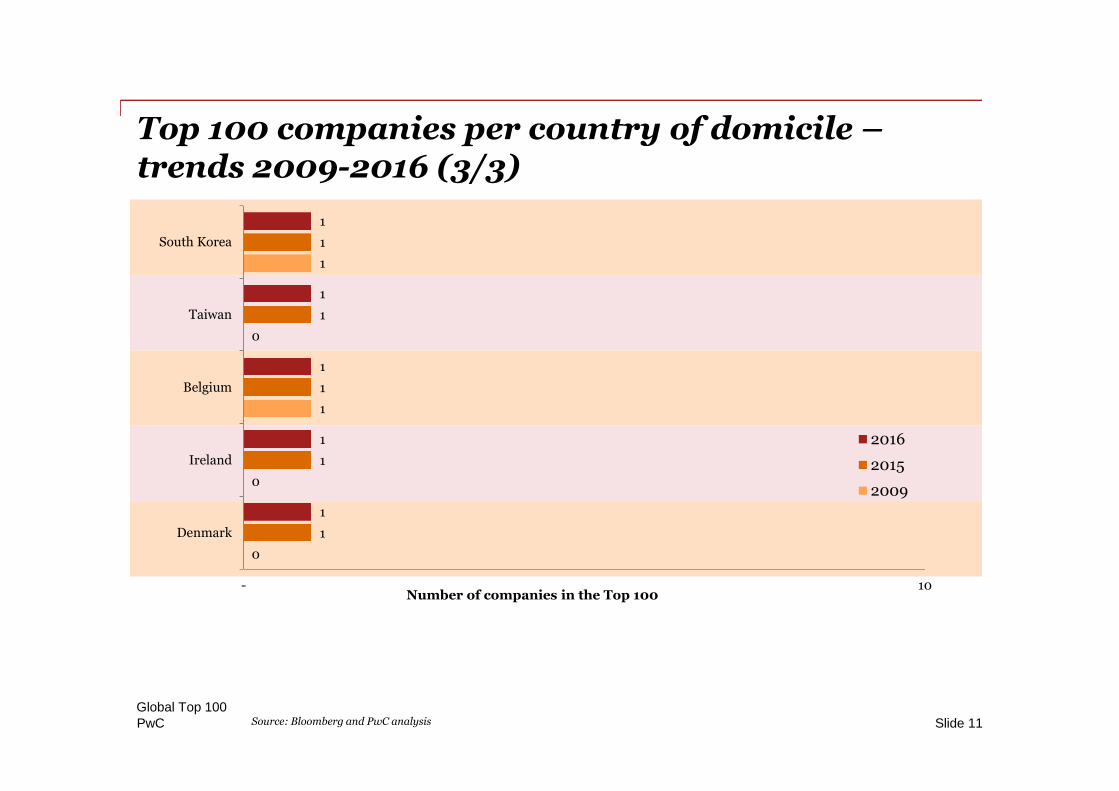
Top 100 companies per country of domicile –trends 2009-2016 (3/3)
Global Top 100Slide 11
0
0
1
0
1
1
1
1
1
1
1
1
1
1
1
- 10
Denmark
Ireland
Belgium
Taiwan
South Korea
Number of companies in the Top 100
2016
2015
2009
Source: Bloomberg and PwC analysis
PwC
Section 2Year-on-year comparison2016 vs. 2015
Global Top 100Slide 12

PwC
The movements
Global Top 100Slide 13
Key highlights
• Top 100 companies market cap decreased by 4% compared to 31 March 2015, the first significant decrease since 2009.
• China, the second largest contributor to the Top 100, is the main driver of the decrease, with a loss of $417bn, reflecting theperformance of Chinese markets this year.
• The decrease is partially offset by the US gaining $314bn reflecting the strong performance of Alphabet (ex-Google), Amazonand Microsoft, along with the acquisition of Heinz by Kraft Foods (the consolidated entity, Kraft-Heinz, having entered the Top100 this year) have fuelled US growth.
• 91 companies from 2015 survived to be in the list at 31 March 2016 – a stable level compared to previous years, demonstratingthe higher resilience of larger companies to market volatility throughout the year.
• There were no IPO direct entries this year.
• The market cap of the most valuable company at 31 March 2015, Apple, decreased by 17% to $604bn. However, the US stillhas the highest combined market capitalisation of national Global Top 100 companies ($9.6trn), a 4% increase since 31 March2015.
• 2016 has not seen much change in the country split compared to 2015: the US dominates with 54 US companies in theGlobal Top 100 (53 in 2015, 42 in 2009). China/HK holds the second position with 11 companies (no change to last year)and the UK comes third with 7 companies (losing one, AstraZeneca).
• The threshold to enter the Top 100 has decreased to $76bn this year, compared to $85bn in March 2015.
Source: Bloomberg and PwC analysis
PwC
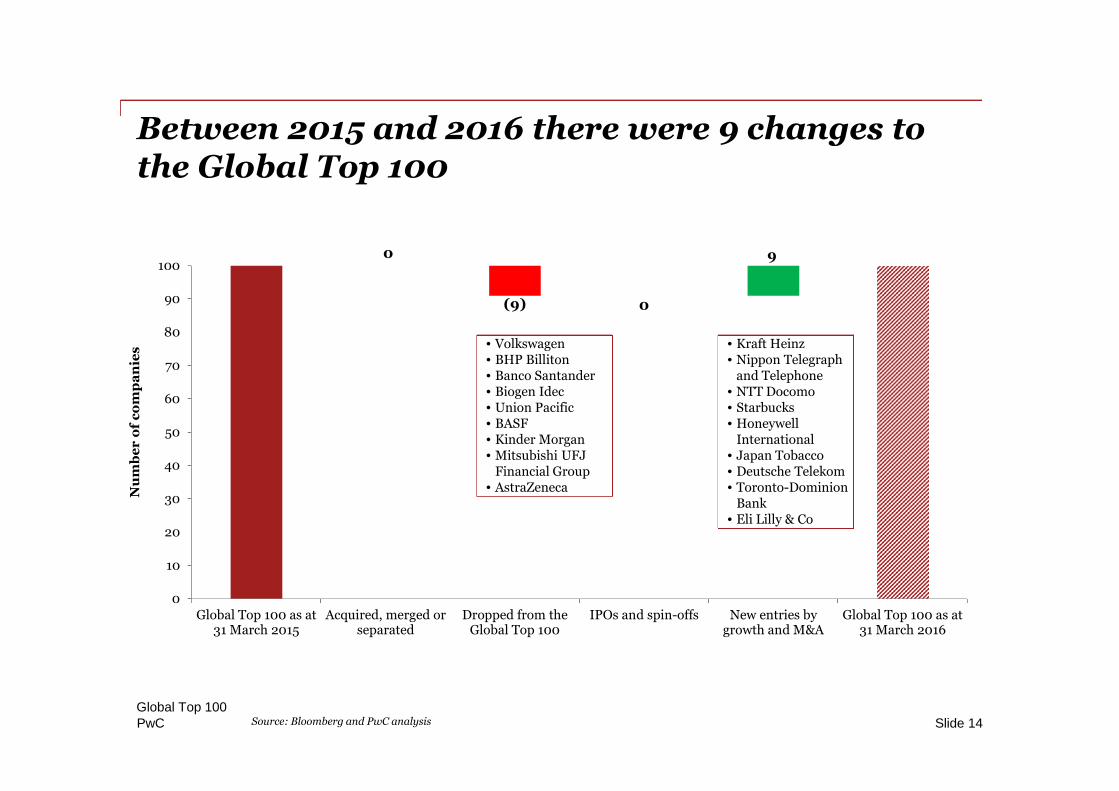
0
(9) 0
9
0
10
20
30
40
50
60
70
80
90
100
Global Top 100 as at31 March 2015
Acquired, merged orseparated
Dropped from theGlobal Top 100
IPOs and spin-offs New entries bygrowth and M&A
Global Top 100 as at31 March 2016
Nu
mb
er
of
co
mp
an
ies
Global Top 100Slide 14
Between 2015 and 2016 there were 9 changes tothe Global Top 100
Source: Bloomberg and PwC analysis
• Volkswagen• BHP Billiton• Banco Santander• Biogen Idec• Union Pacific• BASF• Kinder Morgan• Mitsubishi UFJ
Financial Group• AstraZeneca
• Kraft Heinz• Nippon Telegraph
and Telephone• NTT Docomo• Starbucks• Honeywell
International• Japan Tobacco• Deutsche Telekom• Toronto-Dominion
Bank• Eli Lilly & Co
PwC
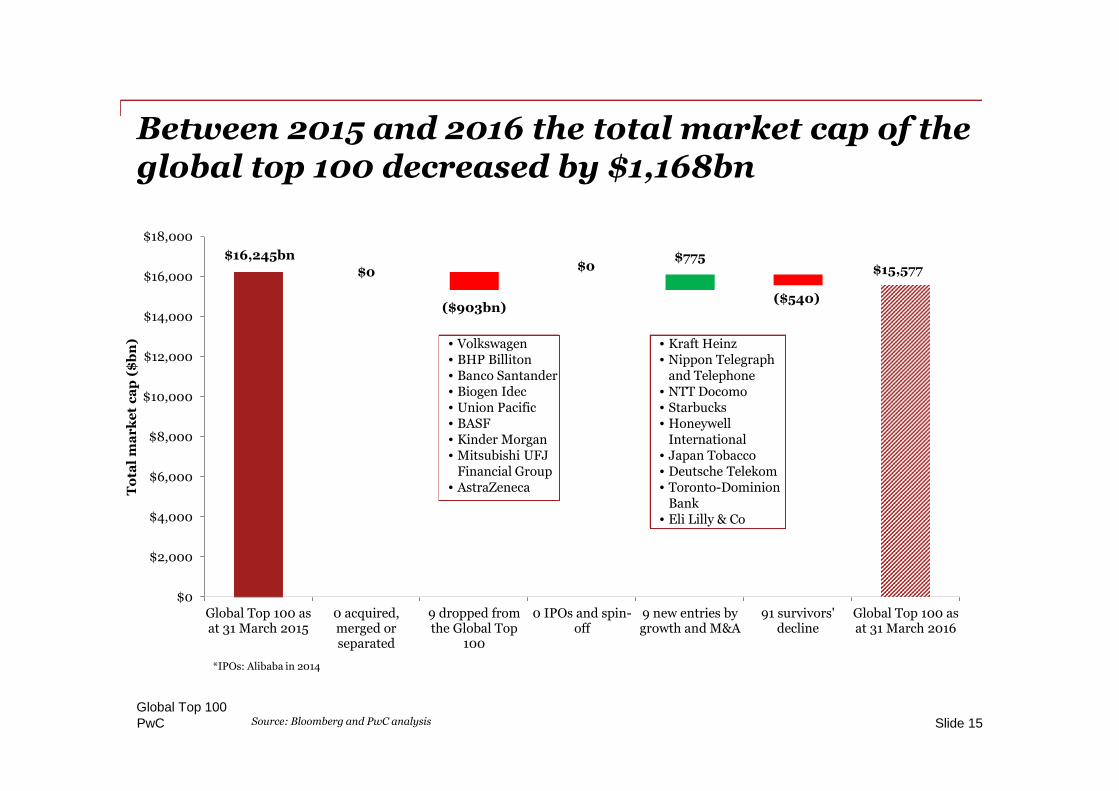
Between 2015 and 2016 the total market cap of theglobal top 100 decreased by $1,168bn
Global Top 100Slide 15
$16,245bn
$0
($903bn)
$0$775
($540)
$15,577
$0
$2,000
$4,000
$6,000
$8,000
$10,000
$12,000
$14,000
$16,000
$18,000
Global Top 100 asat 31 March 2015
0 acquired,merged orseparated
9 dropped fromthe Global Top
100
0 IPOs and spin-off
9 new entries bygrowth and M&A
91 survivors'decline
Global Top 100 asat 31 March 2016
To
tal
ma
rk
et
ca
p($
bn
)
Source: Bloomberg and PwC analysis
*IPOs: Alibaba in 2014
• Volkswagen• BHP Billiton• Banco Santander• Biogen Idec• Union Pacific• BASF• Kinder Morgan• Mitsubishi UFJ
Financial Group• AstraZeneca
• Kraft Heinz• Nippon Telegraph
and Telephone• NTT Docomo• Starbucks• Honeywell
International• Japan Tobacco• Deutsche Telekom• Toronto-Dominion
Bank• Eli Lilly & Co
PwC
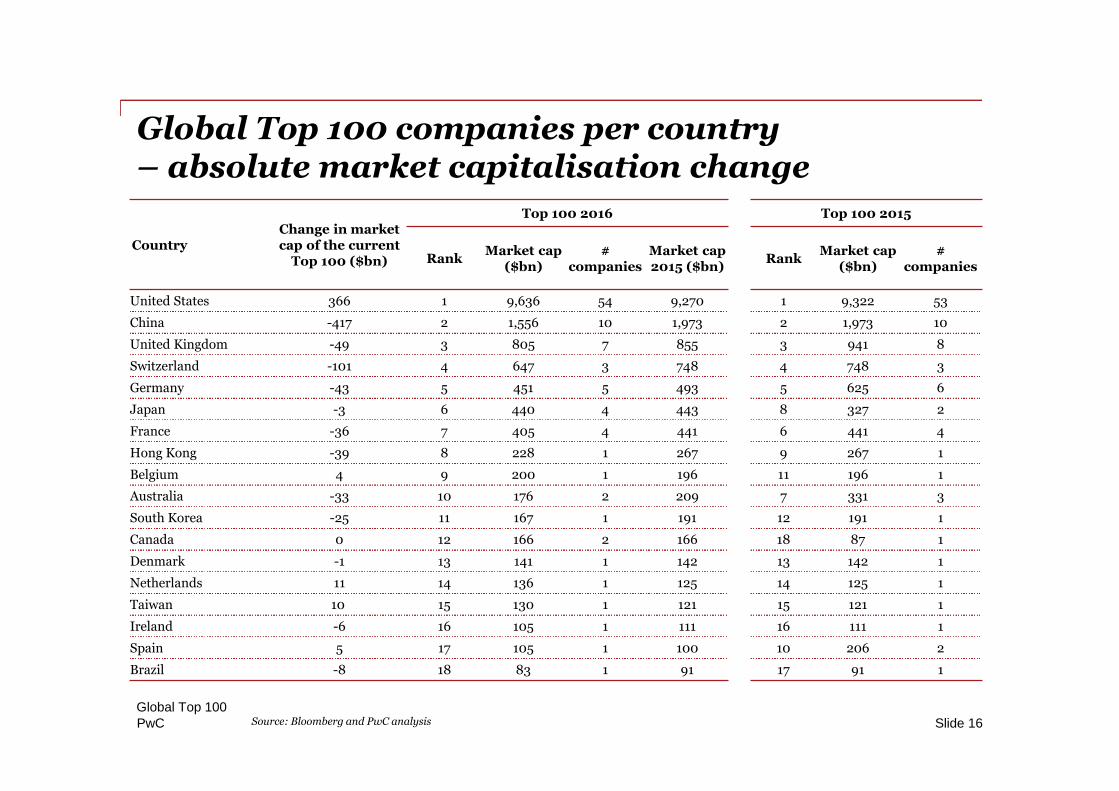
Global Top 100 companies per country– absolute market capitalisation change
Global Top 100Slide 16Source: Bloomberg and PwC analysis
CountryChange in marketcap of the current
Top 100 ($bn)
Top 100 2016 Top 100 2015
RankMarket cap
($bn)#
companiesMarket cap2015 ($bn)
RankMarket cap
($bn)#
companies
United States 366 1 9,636 54 9,270 1 9,322 53
China -417 2 1,556 10 1,973 2 1,973 10
United Kingdom -49 3 805 7 855 3 941 8
Switzerland -101 4 647 3 748 4 748 3
Germany -43 5 451 5 493 5 625 6
Japan -3 6 440 4 443 8 327 2
France -36 7 405 4 441 6 441 4
Hong Kong -39 8 228 1 267 9 267 1
Belgium 4 9 200 1 196 11 196 1
Australia -33 10 176 2 209 7 331 3
South Korea -25 11 167 1 191 12 191 1
Canada 0 12 166 2 166 18 87 1
Denmark -1 13 141 1 142 13 142 1
Netherlands 11 14 136 1 125 14 125 1
Taiwan 10 15 130 1 121 15 121 1
Ireland -6 16 105 1 111 16 111 1
Spain 5 17 105 1 100 10 206 2
Brazil -8 18 83 1 91 17 91 1
PwC
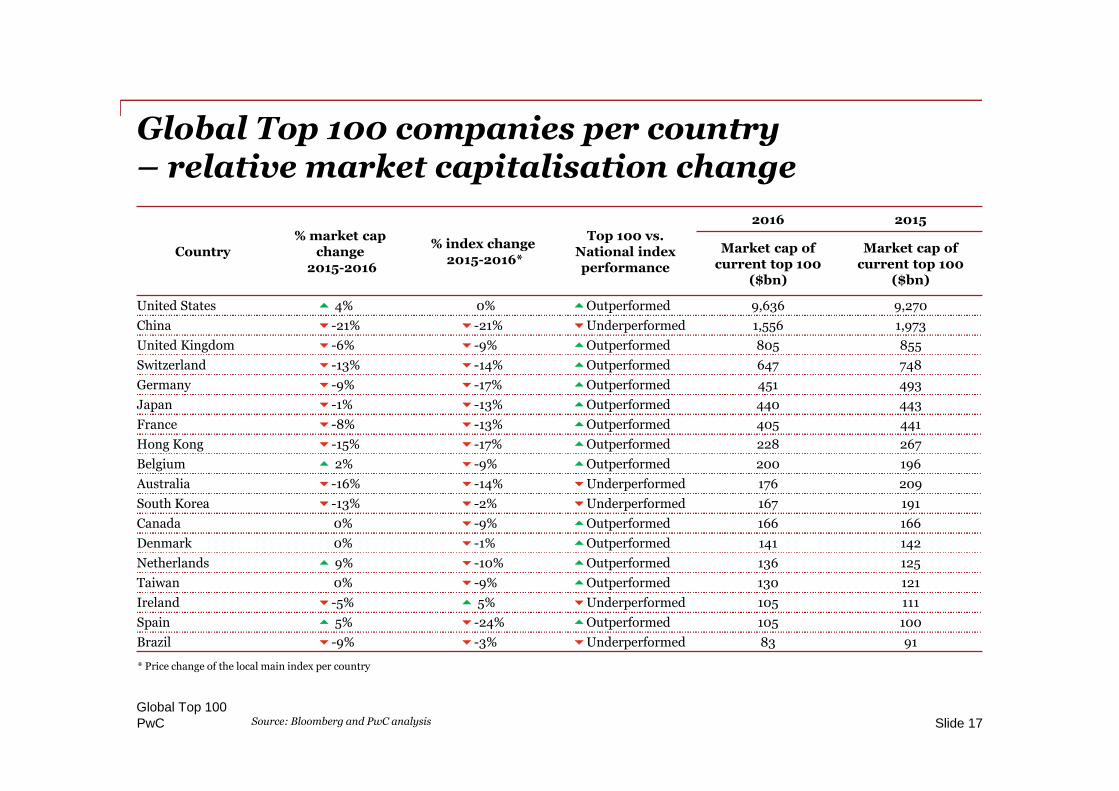
Global Top 100 companies per country– relative market capitalisation change
Global Top 100Slide 17
* Price change of the local main index per country
Source: Bloomberg and PwC analysis
Country% market cap
change2015-2016
% index change2015-2016*
Top 100 vs.National indexperformance
2016 2015
Market cap ofcurrent top 100
($bn)
Market cap ofcurrent top 100
($bn)
United States 4% 0% Outperformed 9,636 9,270
China -21% -21% Underperformed 1,556 1,973
United Kingdom -6% -9% Outperformed 805 855
Switzerland -13% -14% Outperformed 647 748
Germany -9% -17% Outperformed 451 493
Japan -1% -13% Outperformed 440 443
France -8% -13% Outperformed 405 441
Hong Kong -15% -17% Outperformed 228 267
Belgium 2% -9% Outperformed 200 196
Australia -16% -14% Underperformed 176 209
South Korea -13% -2% Underperformed 167 191
Canada 0% -9% Outperformed 166 166
Denmark 0% -1% Outperformed 141 142
Netherlands 9% -10% Outperformed 136 125
Taiwan 0% -9% Outperformed 130 121
Ireland -5% 5% Underperformed 105 111
Spain 5% -24% Outperformed 105 100
Brazil -9% -3% Underperformed 83 91
PwC
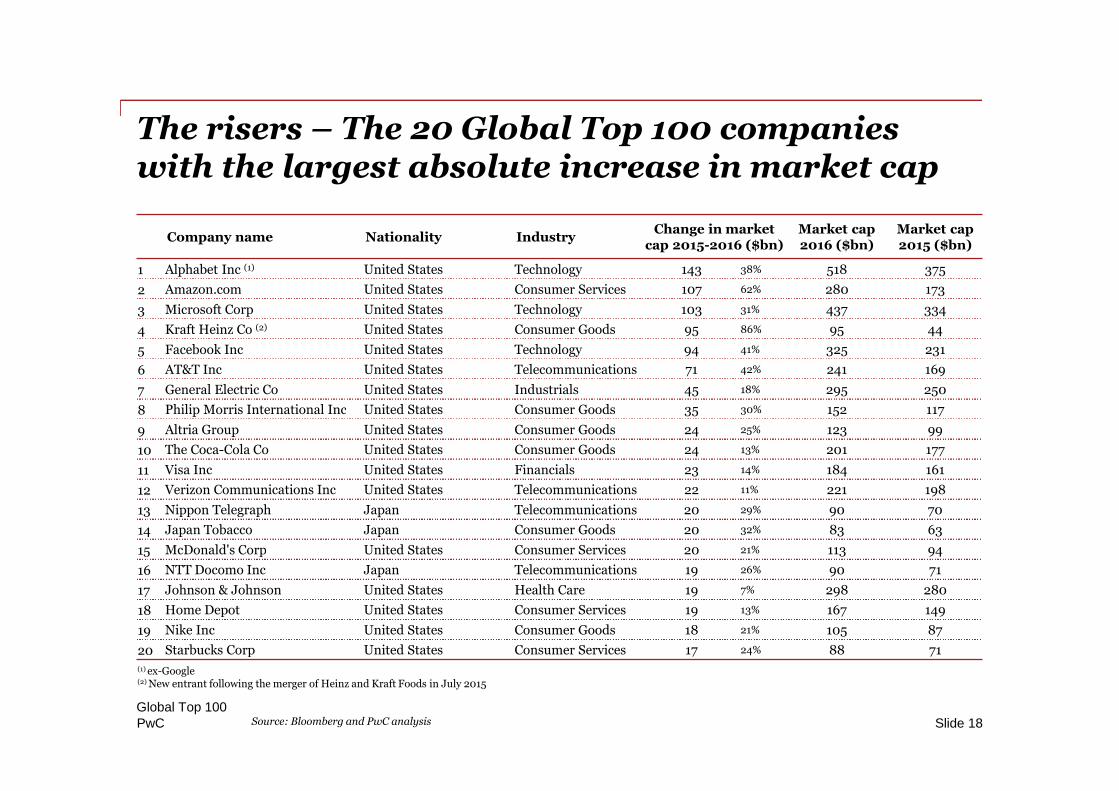
The risers – The 20 Global Top 100 companieswith the largest absolute increase in market cap
Global Top 100Slide 18
Company name Nationality IndustryChange in market
cap 2015-2016 ($bn)Market cap2016 ($bn)
Market cap2015 ($bn)
1 Alphabet Inc (1) United States Technology 143 38% 518 375
2 Amazon.com United States Consumer Services 107 62% 280 173
3 Microsoft Corp United States Technology 103 31% 437 334
4 Kraft Heinz Co (2) United States Consumer Goods 95 86% 95 44
5 Facebook Inc United States Technology 94 41% 325 231
6 AT&T Inc United States Telecommunications 71 42% 241 169
7 General Electric Co United States Industrials 45 18% 295 250
8 Philip Morris International Inc United States Consumer Goods 35 30% 152 117
9 Altria Group United States Consumer Goods 24 25% 123 99
10 The Coca-Cola Co United States Consumer Goods 24 13% 201 177
11 Visa Inc United States Financials 23 14% 184 161
12 Verizon Communications Inc United States Telecommunications 22 11% 221 198
13 Nippon Telegraph Japan Telecommunications 20 29% 90 70
14 Japan Tobacco Japan Consumer Goods 20 32% 83 63
15 McDonald's Corp United States Consumer Services 20 21% 113 94
16 NTT Docomo Inc Japan Telecommunications 19 26% 90 71
17 Johnson & Johnson United States Health Care 19 7% 298 280
18 Home Depot United States Consumer Services 19 13% 167 149
19 Nike Inc United States Consumer Goods 18 21% 105 87
20 Starbucks Corp United States Consumer Services 17 24% 88 71
Source: Bloomberg and PwC analysis
(1) ex-Google(2) New entrant following the merger of Heinz and Kraft Foods in July 2015
PwC
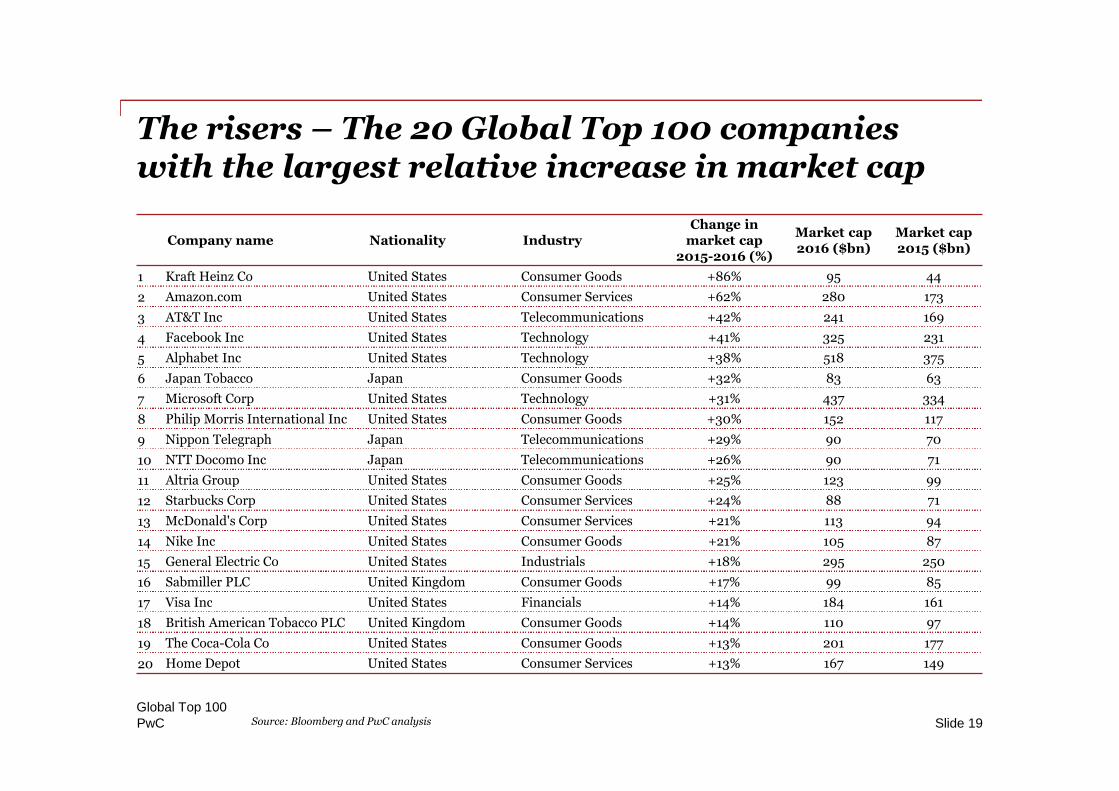
The risers – The 20 Global Top 100 companieswith the largest relative increase in market cap
Global Top 100Slide 19
Company name Nationality IndustryChange in
market cap2015-2016 (%)
Market cap2016 ($bn)
Market cap2015 ($bn)
1 Kraft Heinz Co United States Consumer Goods +86% 95 44
2 Amazon.com United States Consumer Services +62% 280 173
3 AT&T Inc United States Telecommunications +42% 241 169
4 Facebook Inc United States Technology +41% 325 231
5 Alphabet Inc United States Technology +38% 518 375
6 Japan Tobacco Japan Consumer Goods +32% 83 63
7 Microsoft Corp United States Technology +31% 437 334
8 Philip Morris International Inc United States Consumer Goods +30% 152 117
9 Nippon Telegraph Japan Telecommunications +29% 90 70
10 NTT Docomo Inc Japan Telecommunications +26% 90 71
11 Altria Group United States Consumer Goods +25% 123 99
12 Starbucks Corp United States Consumer Services +24% 88 71
13 McDonald's Corp United States Consumer Services +21% 113 94
14 Nike Inc United States Consumer Goods +21% 105 87
15 General Electric Co United States Industrials +18% 295 250
16 Sabmiller PLC United Kingdom Consumer Goods +17% 99 85
17 Visa Inc United States Financials +14% 184 161
18 British American Tobacco PLC United Kingdom Consumer Goods +14% 110 97
19 The Coca-Cola Co United States Consumer Goods +13% 201 177
20 Home Depot United States Consumer Services +13% 167 149
Source: Bloomberg and PwC analysis
PwC
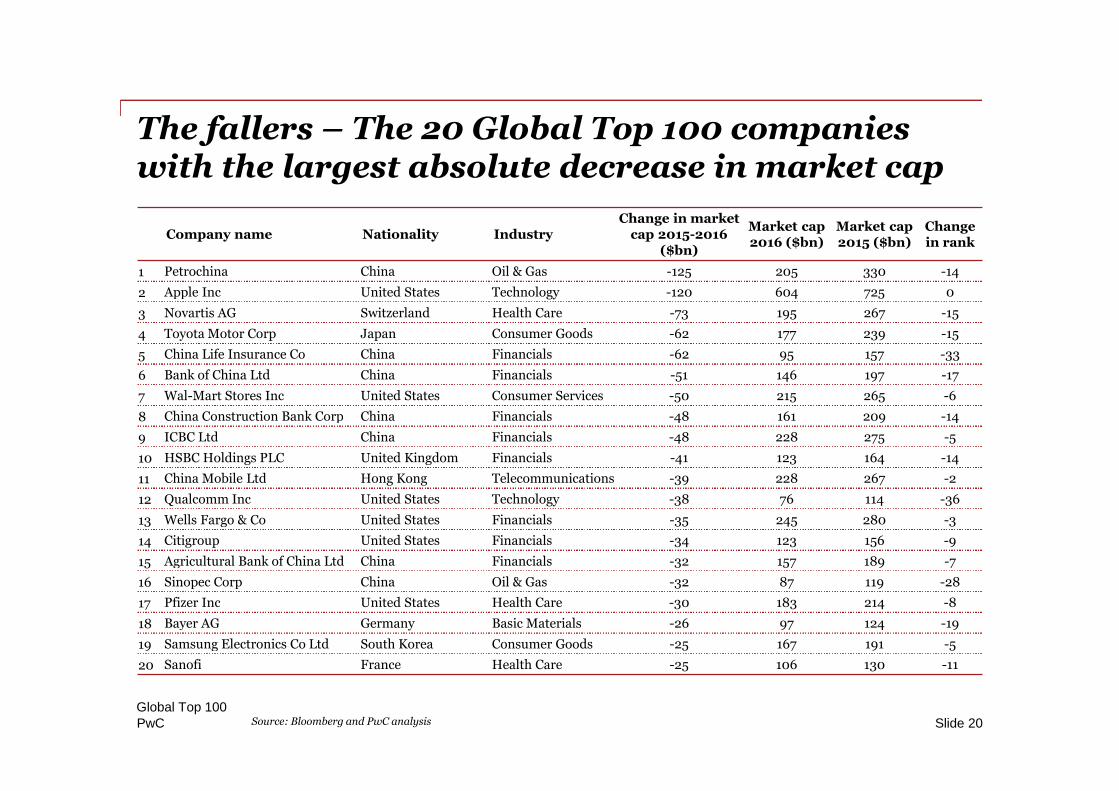
The fallers – The 20 Global Top 100 companieswith the largest absolute decrease in market cap
Global Top 100Slide 20Source: Bloomberg and PwC analysis
Company name Nationality IndustryChange in market
cap 2015-2016($bn)
Market cap2016 ($bn)
Market cap2015 ($bn)
Changein rank
1 Petrochina China Oil & Gas -125 205 330 -14
2 Apple Inc United States Technology -120 604 725 0
3 Novartis AG Switzerland Health Care -73 195 267 -15
4 Toyota Motor Corp Japan Consumer Goods -62 177 239 -15
5 China Life Insurance Co China Financials -62 95 157 -33
6 Bank of China Ltd China Financials -51 146 197 -17
7 Wal-Mart Stores Inc United States Consumer Services -50 215 265 -6
8 China Construction Bank Corp China Financials -48 161 209 -14
9 ICBC Ltd China Financials -48 228 275 -5
10 HSBC Holdings PLC United Kingdom Financials -41 123 164 -14
11 China Mobile Ltd Hong Kong Telecommunications -39 228 267 -2
12 Qualcomm Inc United States Technology -38 76 114 -36
13 Wells Fargo & Co United States Financials -35 245 280 -3
14 Citigroup United States Financials -34 123 156 -9
15 Agricultural Bank of China Ltd China Financials -32 157 189 -7
16 Sinopec Corp China Oil & Gas -32 87 119 -28
17 Pfizer Inc United States Health Care -30 183 214 -8
18 Bayer AG Germany Basic Materials -26 97 124 -19
19 Samsung Electronics Co Ltd South Korea Consumer Goods -25 167 191 -5
20 Sanofi France Health Care -25 106 130 -11
PwC
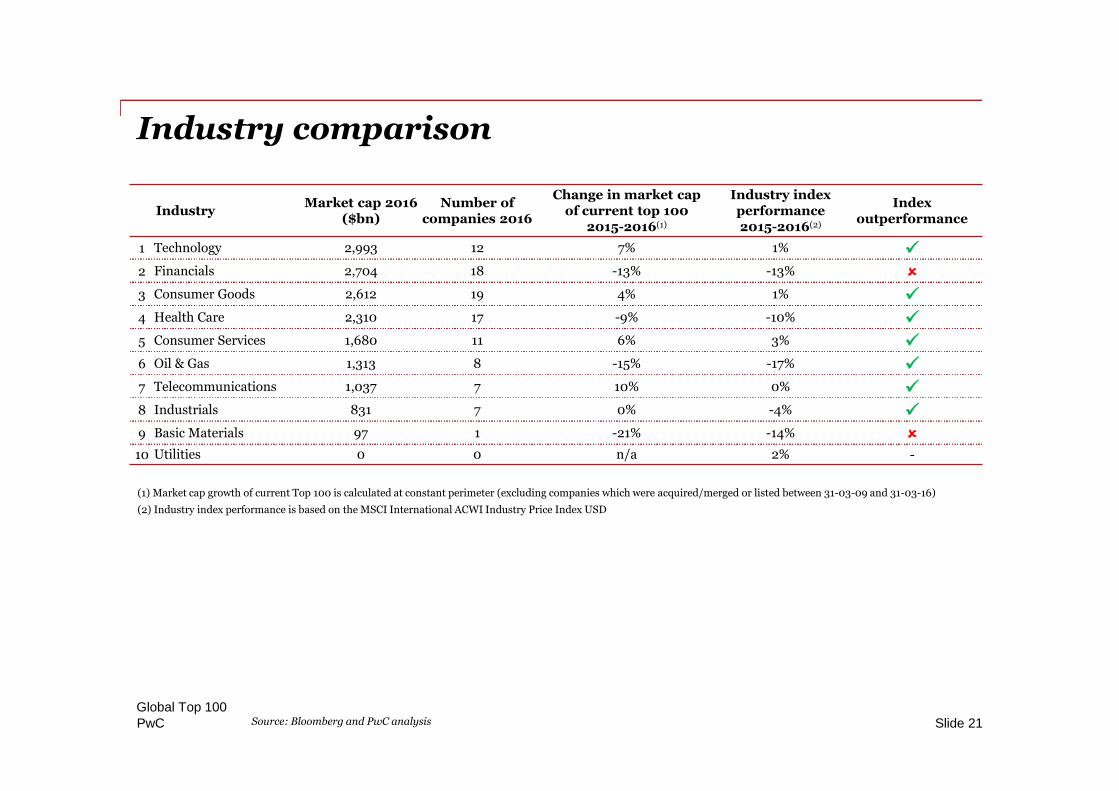
Industry comparison
Global Top 100Slide 21
IndustryMarket cap 2016
($bn)Number of
companies 2016
Change in market capof current top 100
2015-2016(1)
Industry indexperformance2015-2016(2)
Indexoutperformance
1 Technology 2,993 12 7% 1% 2 Financials 2,704 18 -13% -13% 3 Consumer Goods 2,612 19 4% 1% 4 Health Care 2,310 17 -9% -10% 5 Consumer Services 1,680 11 6% 3% 6 Oil & Gas 1,313 8 -15% -17% 7 Telecommunications 1,037 7 10% 0% 8 Industrials 831 7 0% -4% 9 Basic Materials 97 1 -21% -14% 10 Utilities 0 0 n/a 2% -
Source: Bloomberg and PwC analysis
(1) Market cap growth of current Top 100 is calculated at constant perimeter (excluding companies which were acquired/merged or listed between 31-03-09 and 31-03-16)
(2) Industry index performance is based on the MSCI International ACWI Industry Price Index USD
PwC
Section 3Global Top 100 value distributed toshareholders in calendar year 2015
Global Top 100Slide 22
PwC
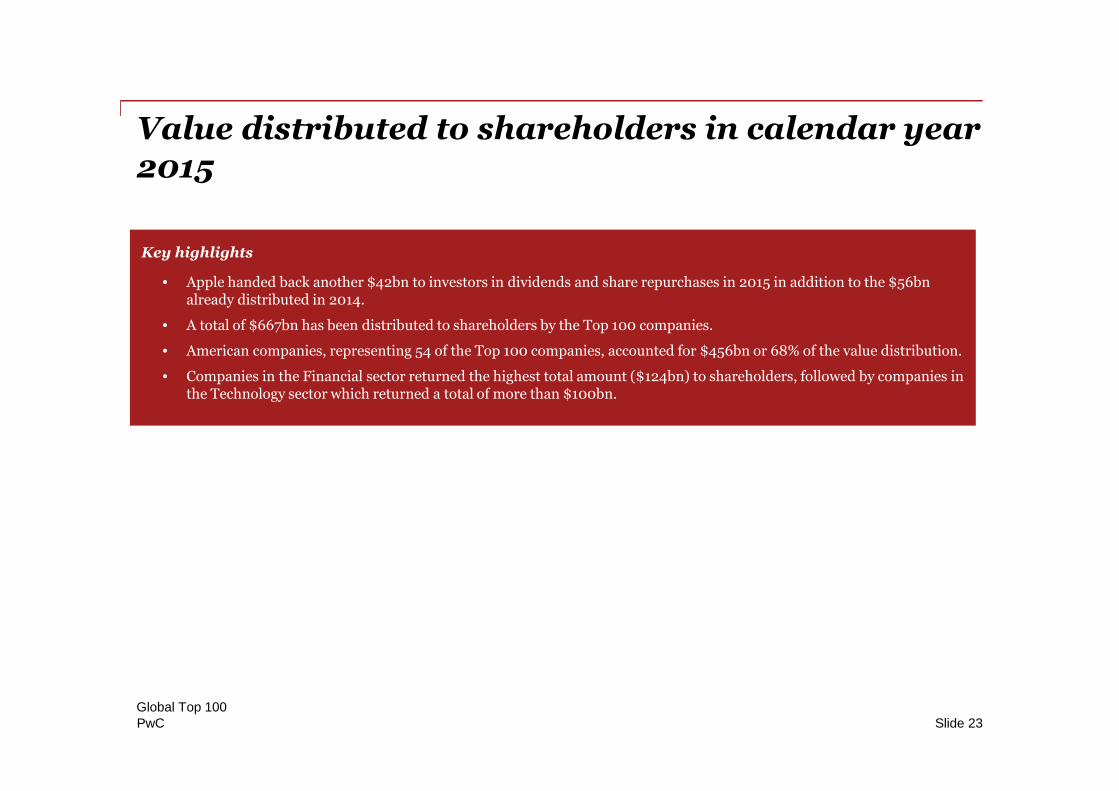
Value distributed to shareholders in calendar year2015
Slide 23
Key highlights
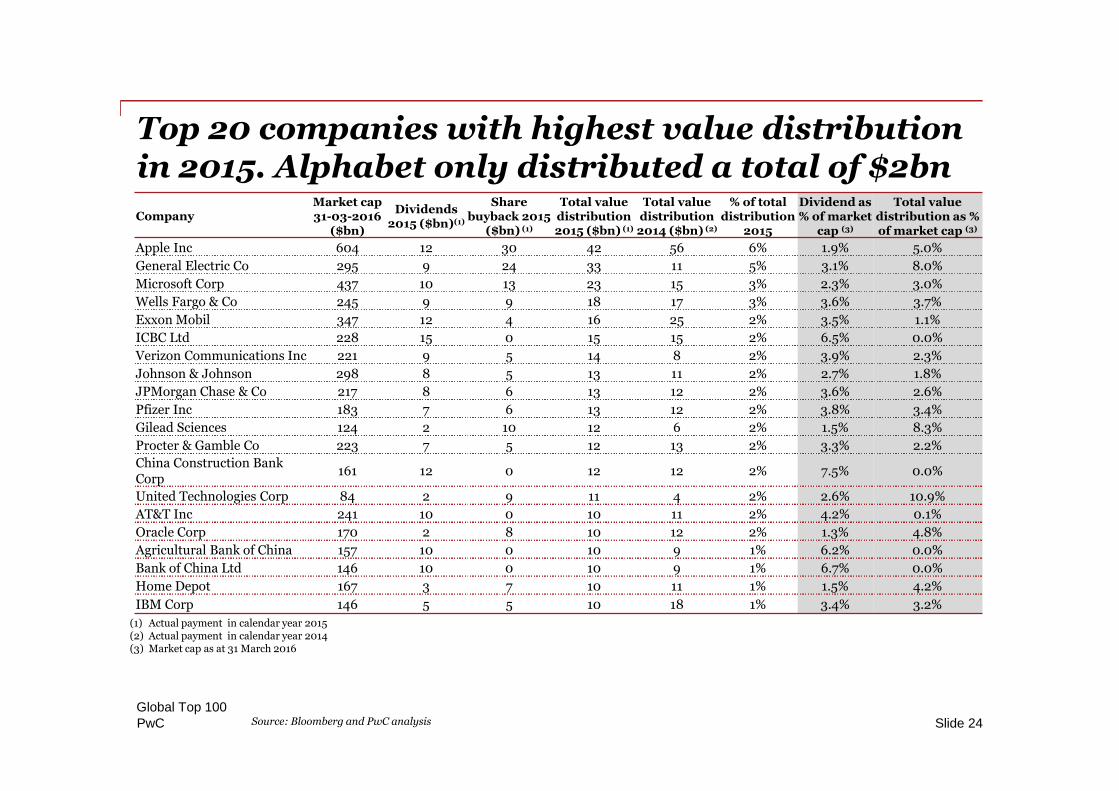
• Apple handed back another $42bn to investors in dividends and share repurchases in 2015 in addition to the $56bnalready distributed in 2014.
• A total of $667bn has been distributed to shareholders by the Top 100 companies.
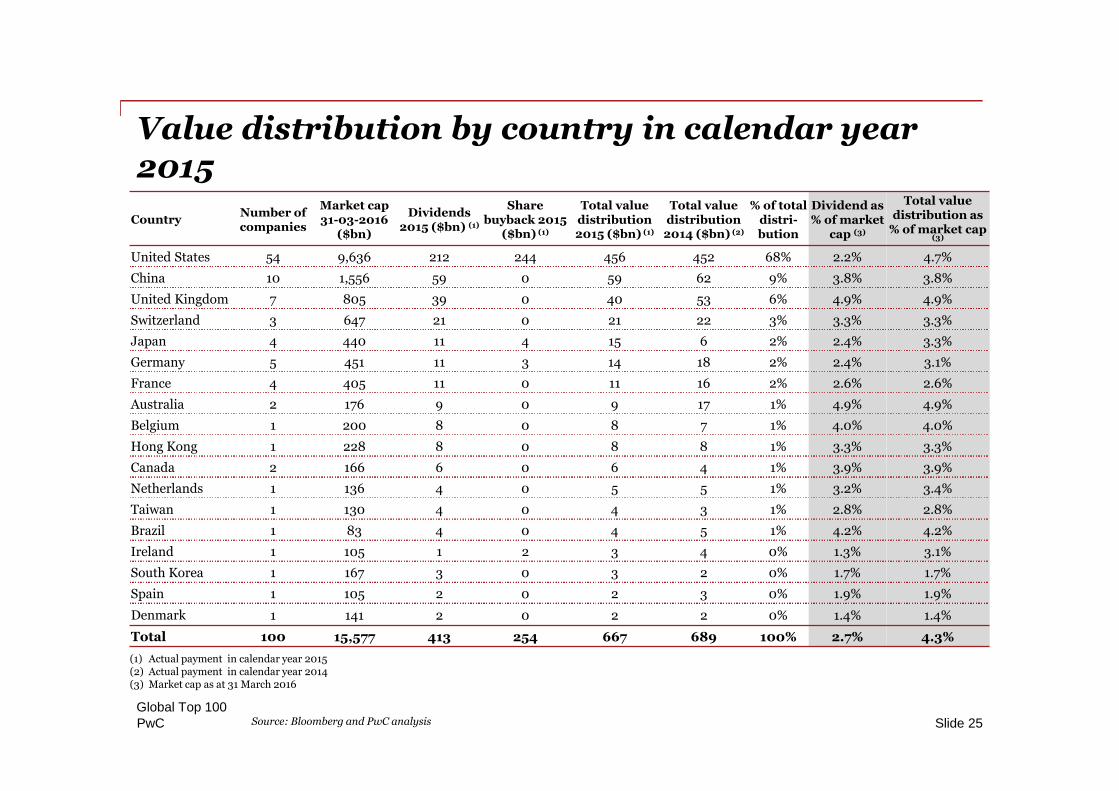
• American companies, representing 54 of the Top 100 companies, accounted for $456bn or 68% of the value distribution.
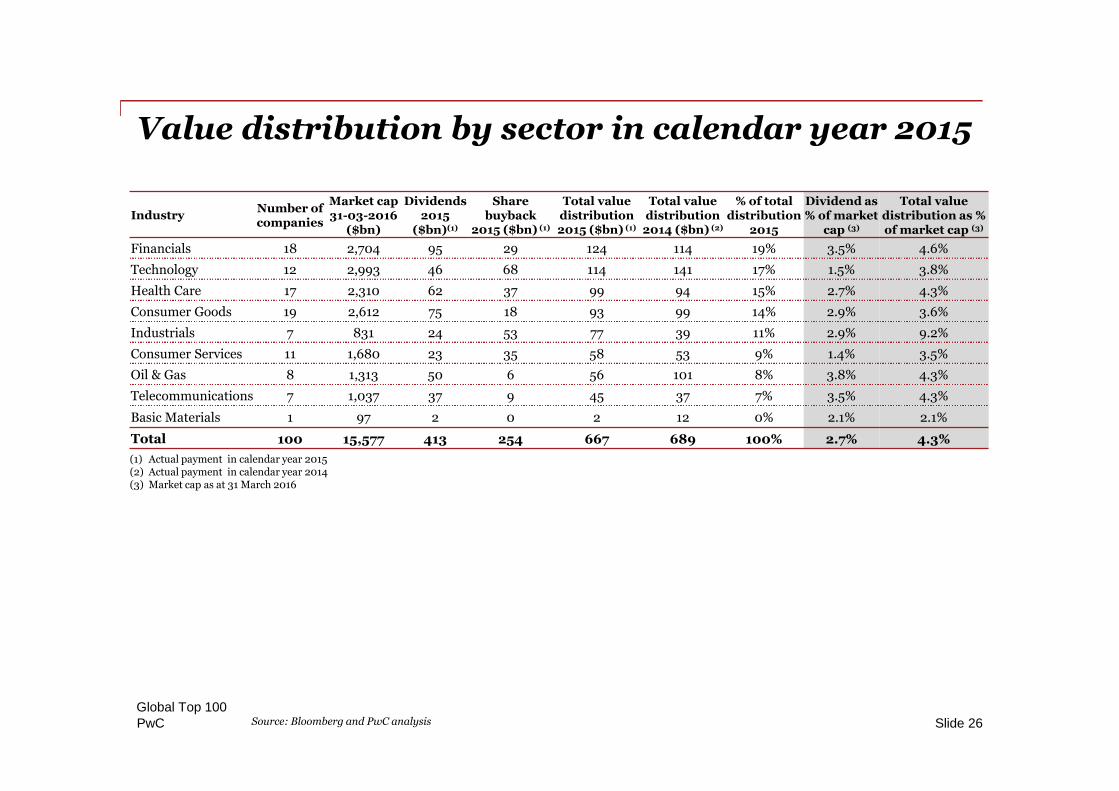
• Companies in the Financial sector returned the highest total amount ($124bn) to shareholders, followed by companies inthe Technology sector which returned a total of more than $100bn.
Global Top 100
PwC
Top 20 companies with highest value distributionin 2015. Alphabet only distributed a total of $2bn
Global Top 100Slide 24Source: Bloomberg and PwC analysis
CompanyMarket cap31-03-2016
($bn)
Dividends2015 ($bn)(1)
Sharebuyback 2015
($bn) (1)
Total valuedistribution2015 ($bn) (1)
Total valuedistribution2014 ($bn) (2)
% of totaldistribution
2015
Dividend as% of market
cap (3)
Total valuedistribution as %of market cap (3)
Apple Inc 604 12 30 42 56 6% 1.9% 5.0%
General Electric Co 295 9 24 33 11 5% 3.1% 8.0%
Microsoft Corp 437 10 13 23 15 3% 2.3% 3.0%
Wells Fargo & Co 245 9 9 18 17 3% 3.6% 3.7%
Exxon Mobil 347 12 4 16 25 2% 3.5% 1.1%
ICBC Ltd 228 15 0 15 15 2% 6.5% 0.0%
Verizon Communications Inc 221 9 5 14 8 2% 3.9% 2.3%
Johnson & Johnson 298 8 5 13 11 2% 2.7% 1.8%
JPMorgan Chase & Co 217 8 6 13 12 2% 3.6% 2.6%
Pfizer Inc 183 7 6 13 12 2% 3.8% 3.4%
Gilead Sciences 124 2 10 12 6 2% 1.5% 8.3%
Procter & Gamble Co 223 7 5 12 13 2% 3.3% 2.2%
China Construction BankCorp
161 12 0 12 12 2% 7.5% 0.0%
United Technologies Corp 84 2 9 11 4 2% 2.6% 10.9%
AT&T Inc 241 10 0 10 11 2% 4.2% 0.1%
Oracle Corp 170 2 8 10 12 2% 1.3% 4.8%
Agricultural Bank of China 157 10 0 10 9 1% 6.2% 0.0%
Bank of China Ltd 146 10 0 10 9 1% 6.7% 0.0%
Home Depot 167 3 7 10 11 1% 1.5% 4.2%
IBM Corp 146 5 5 10 18 1% 3.4% 3.2%
(1) Actual payment in calendar year 2015(2) Actual payment in calendar year 2014(3) Market cap as at 31 March 2016
PwC
Value distribution by country in calendar year2015
Global Top 100Slide 25Source: Bloomberg and PwC analysis
CountryNumber ofcompanies
Market cap31-03-2016
($bn)
Dividends2015 ($bn) (1)
Sharebuyback 2015
($bn) (1)
Total valuedistribution2015 ($bn) (1)
Total valuedistribution2014 ($bn) (2)
% of totaldistri-bution
Dividend as% of market
cap (3)
Total valuedistribution as
% of market cap(3)
United States 54 9,636 212 244 456 452 68% 2.2% 4.7%
China 10 1,556 59 0 59 62 9% 3.8% 3.8%
United Kingdom 7 805 39 0 40 53 6% 4.9% 4.9%
Switzerland 3 647 21 0 21 22 3% 3.3% 3.3%
Japan 4 440 11 4 15 6 2% 2.4% 3.3%
Germany 5 451 11 3 14 18 2% 2.4% 3.1%
France 4 405 11 0 11 16 2% 2.6% 2.6%
Australia 2 176 9 0 9 17 1% 4.9% 4.9%
Belgium 1 200 8 0 8 7 1% 4.0% 4.0%
Hong Kong 1 228 8 0 8 8 1% 3.3% 3.3%
Canada 2 166 6 0 6 4 1% 3.9% 3.9%
Netherlands 1 136 4 0 5 5 1% 3.2% 3.4%
Taiwan 1 130 4 0 4 3 1% 2.8% 2.8%
Brazil 1 83 4 0 4 5 1% 4.2% 4.2%
Ireland 1 105 1 2 3 4 0% 1.3% 3.1%
South Korea 1 167 3 0 3 2 0% 1.7% 1.7%
Spain 1 105 2 0 2 3 0% 1.9% 1.9%
Denmark 1 141 2 0 2 2 0% 1.4% 1.4%
Total 100 15,577 413 254 667 689 100% 2.7% 4.3%
(1) Actual payment in calendar year 2015(2) Actual payment in calendar year 2014(3) Market cap as at 31 March 2016
PwC
Value distribution by sector in calendar year 2015
Global Top 100Slide 26Source: Bloomberg and PwC analysis
IndustryNumber ofcompanies
Market cap31-03-2016
($bn)
Dividends2015
($bn)(1)
Sharebuyback
2015 ($bn) (1)
Total valuedistribution2015 ($bn) (1)
Total valuedistribution2014 ($bn) (2)
% of totaldistribution
2015
Dividend as% of market
cap (3)
Total valuedistribution as %of market cap (3)
Financials 18 2,704 95 29 124 114 19% 3.5% 4.6%
Technology 12 2,993 46 68 114 141 17% 1.5% 3.8%
Health Care 17 2,310 62 37 99 94 15% 2.7% 4.3%
Consumer Goods 19 2,612 75 18 93 99 14% 2.9% 3.6%
Industrials 7 831 24 53 77 39 11% 2.9% 9.2%
Consumer Services 11 1,680 23 35 58 53 9% 1.4% 3.5%
Oil & Gas 8 1,313 50 6 56 101 8% 3.8% 4.3%
Telecommunications 7 1,037 37 9 45 37 7% 3.5% 4.3%
Basic Materials 1 97 2 0 2 12 0% 2.1% 2.1%
Total 100 15,577 413 254 667 689 100% 2.7% 4.3%
(1) Actual payment in calendar year 2015(2) Actual payment in calendar year 2014(3) Market cap as at 31 March 2016
PwC
Section 4Post-financial crisis comparison2016 vs. 2009
1) Key movements
2) The industries – Global Top 100 sorted by sector
3) Country/region comparison
4) Complete ranking
Global Top 100Slide 27
PwC
Section 4Post-financial crisis comparison2016 vs. 2009
1) Key movements
2) The industries – Global Top 100 sorted by sector
3) Country/region comparison
4) Complete ranking
Global Top 100Slide 28
PwC
The movements
Global Top 100Slide 29
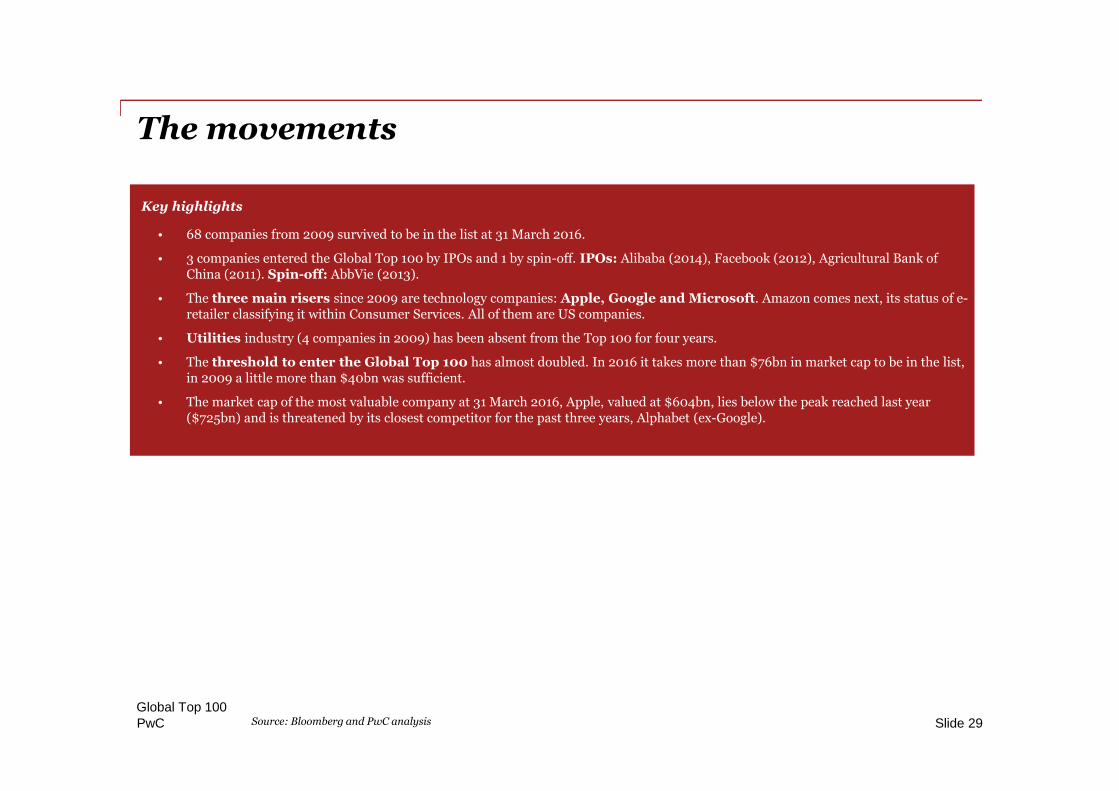
Key highlights
• 68 companies from 2009 survived to be in the list at 31 March 2016.
• 3 companies entered the Global Top 100 by IPOs and 1 by spin-off. IPOs: Alibaba (2014), Facebook (2012), Agricultural Bank ofChina (2011). Spin-off: AbbVie (2013).
• The three main risers since 2009 are technology companies: Apple, Google and Microsoft. Amazon comes next, its status of e-retailer classifying it within Consumer Services. All of them are US companies.
• Utilities industry (4 companies in 2009) has been absent from the Top 100 for four years.
• The threshold to enter the Global Top 100 has almost doubled. In 2016 it takes more than $76bn in market cap to be in the list,in 2009 a little more than $40bn was sufficient.
• The market cap of the most valuable company at 31 March 2016, Apple, valued at $604bn, lies below the peak reached last year($725bn) and is threatened by its closest competitor for the past three years, Alphabet (ex-Google).
Source: Bloomberg and PwC analysis
PwC
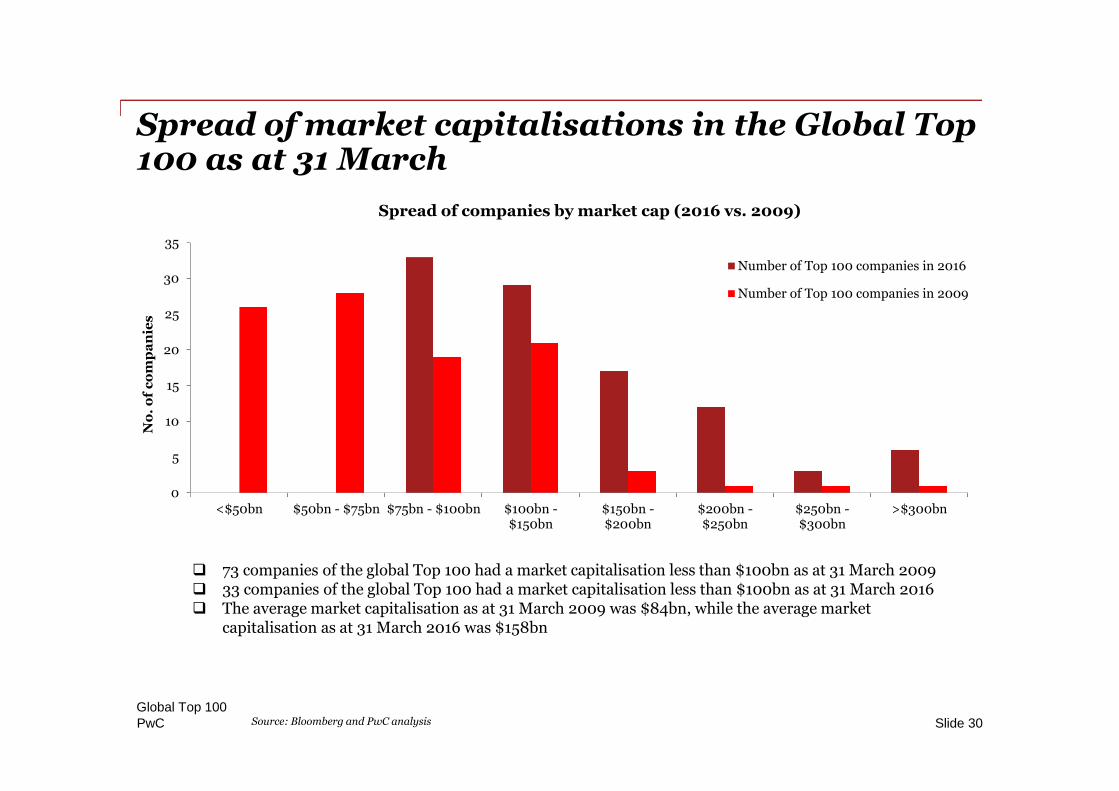
Spread of market capitalisations in the Global Top100 as at 31 March
Global Top 100Slide 30
73 companies of the global Top 100 had a market capitalisation less than $100bn as at 31 March 2009 33 companies of the global Top 100 had a market capitalisation less than $100bn as at 31 March 2016 The average market capitalisation as at 31 March 2009 was $84bn, while the average market
capitalisation as at 31 March 2016 was $158bn
Source: Bloomberg and PwC analysis
0
5
10
15
20
25
30
35
<$50bn $50bn - $75bn $75bn - $100bn $100bn -$150bn
$150bn -$200bn
$200bn -$250bn
$250bn -$300bn
>$300bn
No
.o
fc
om
pa
nie
s
Spread of companies by market cap (2016 vs. 2009)
Number of Top 100 companies in 2016
Number of Top 100 companies in 2009
PwCGlobal Top 100
Slide 31
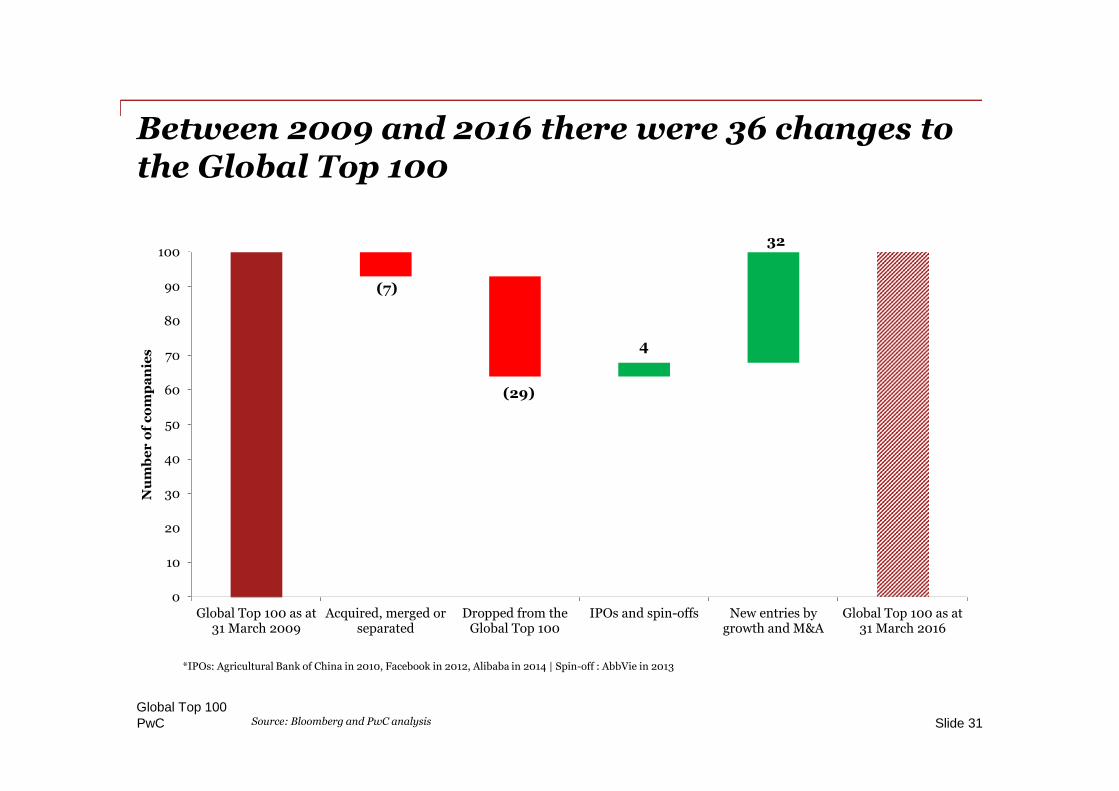
Between 2009 and 2016 there were 36 changes tothe Global Top 100
Source: Bloomberg and PwC analysis
*IPOs: Agricultural Bank of China in 2010, Facebook in 2012, Alibaba in 2014 | Spin-off : AbbVie in 2013
(7)
(29)
4
32
0
10
20
30
40
50
60
70
80
90
100
Global Top 100 as at31 March 2009
Acquired, merged orseparated
Dropped from theGlobal Top 100
IPOs and spin-offs New entries bygrowth and M&A
Global Top 100 as at31 March 2016
Nu
mb
er
of
co
mp
an
ies
PwC
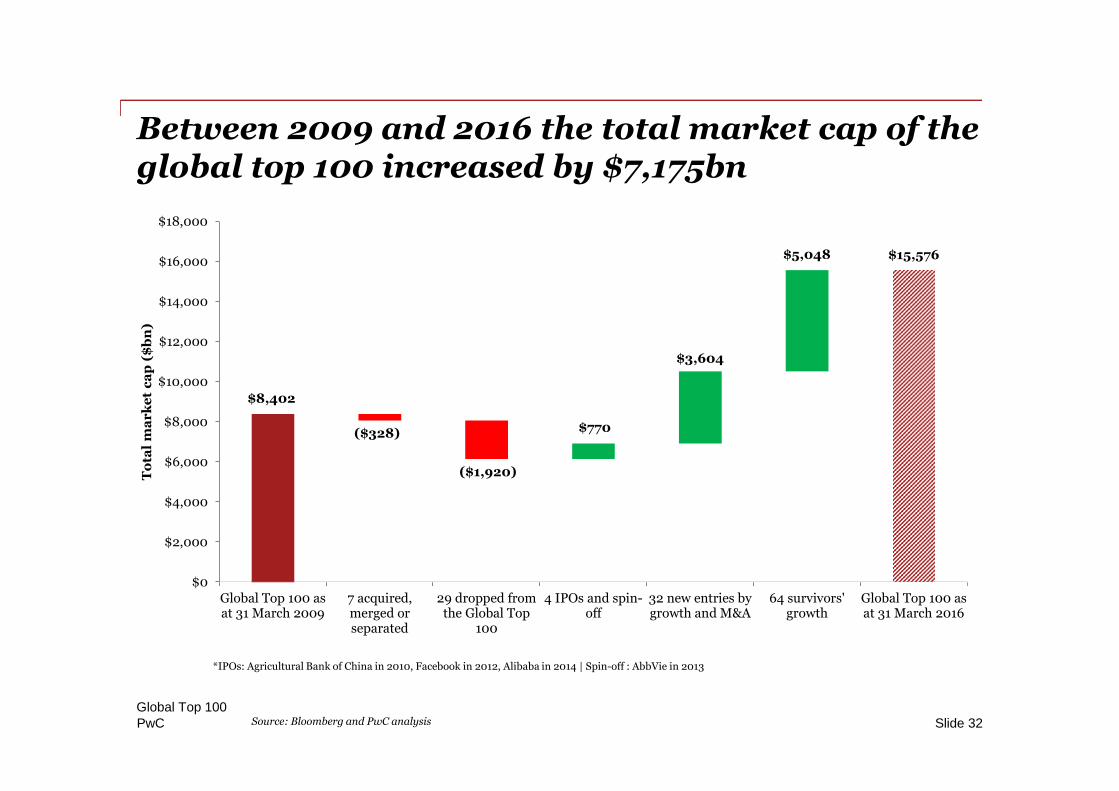
Between 2009 and 2016 the total market cap of theglobal top 100 increased by $7,175bn
Global Top 100Slide 32Source: Bloomberg and PwC analysis
*IPOs: Agricultural Bank of China in 2010, Facebook in 2012, Alibaba in 2014 | Spin-off : AbbVie in 2013
$8,402
($328)
($1,920)
$770
$3,604
$5,048 $15,576
$0
$2,000
$4,000
$6,000
$8,000
$10,000
$12,000
$14,000
$16,000
$18,000
Global Top 100 asat 31 March 2009
7 acquired,merged orseparated
29 dropped fromthe Global Top
100
4 IPOs and spin-off
32 new entries bygrowth and M&A
64 survivors'growth
Global Top 100 asat 31 March 2016
To
tal
ma
rk
et
ca
p($
bn
)
PwC
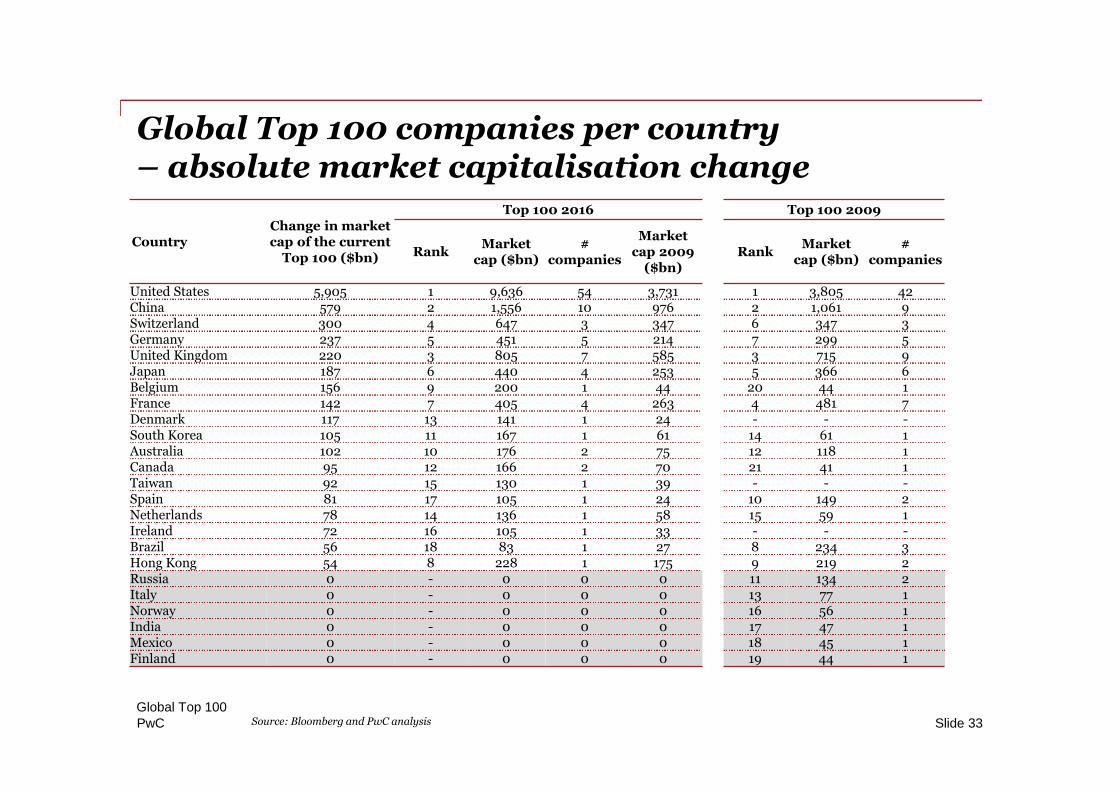
Global Top 100 companies per country– absolute market capitalisation change
Global Top 100Slide 33Source: Bloomberg and PwC analysis
CountryChange in marketcap of the current
Top 100 ($bn)
Top 100 2016 Top 100 2009
RankMarket
cap ($bn)#
companies
Marketcap 2009
($bn)Rank
Marketcap ($bn)
#companies
United States 5,905 1 9,636 54 3,731 1 3,805 42China 579 2 1,556 10 976 2 1,061 9Switzerland 300 4 647 3 347 6 347 3Germany 237 5 451 5 214 7 299 5United Kingdom 220 3 805 7 585 3 715 9Japan 187 6 440 4 253 5 366 6Belgium 156 9 200 1 44 20 44 1France 142 7 405 4 263 4 481 7Denmark 117 13 141 1 24 - - -South Korea 105 11 167 1 61 14 61 1Australia 102 10 176 2 75 12 118 1Canada 95 12 166 2 70 21 41 1Taiwan 92 15 130 1 39 - - -Spain 81 17 105 1 24 10 149 2Netherlands 78 14 136 1 58 15 59 1Ireland 72 16 105 1 33 - - -Brazil 56 18 83 1 27 8 234 3Hong Kong 54 8 228 1 175 9 219 2Russia 0 - 0 0 0 11 134 2Italy 0 - 0 0 0 13 77 1Norway 0 - 0 0 0 16 56 1India 0 - 0 0 0 17 47 1Mexico 0 - 0 0 0 18 45 1Finland 0 - 0 0 0 19 44 1
PwC
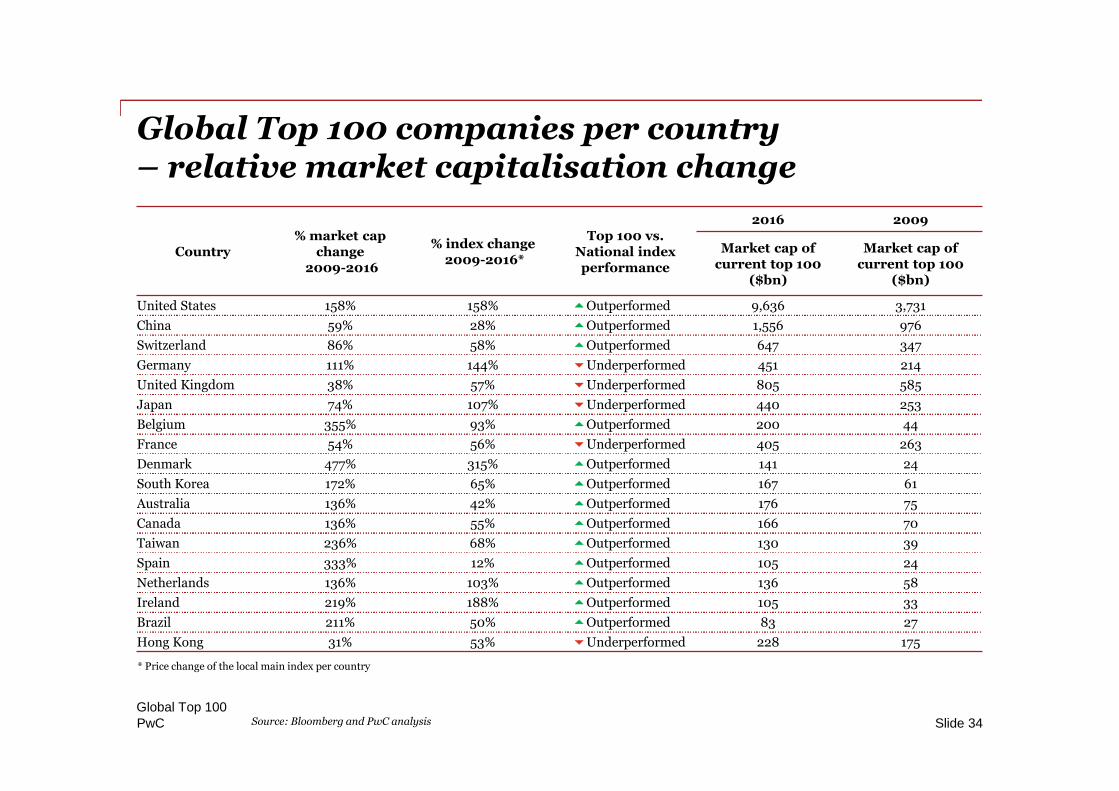
Global Top 100 companies per country– relative market capitalisation change
Global Top 100Slide 34
* Price change of the local main index per country
Source: Bloomberg and PwC analysis
Country% market cap
change2009-2016
% index change2009-2016*
Top 100 vs.National indexperformance
2016 2009
Market cap ofcurrent top 100
($bn)
Market cap ofcurrent top 100
($bn)
United States 158% 158% Outperformed 9,636 3,731
China 59% 28% Outperformed 1,556 976
Switzerland 86% 58% Outperformed 647 347
Germany 111% 144% Underperformed 451 214
United Kingdom 38% 57% Underperformed 805 585
Japan 74% 107% Underperformed 440 253
Belgium 355% 93% Outperformed 200 44
France 54% 56% Underperformed 405 263
Denmark 477% 315% Outperformed 141 24
South Korea 172% 65% Outperformed 167 61
Australia 136% 42% Outperformed 176 75
Canada 136% 55% Outperformed 166 70
Taiwan 236% 68% Outperformed 130 39
Spain 333% 12% Outperformed 105 24
Netherlands 136% 103% Outperformed 136 58
Ireland 219% 188% Outperformed 105 33
Brazil 211% 50% Outperformed 83 27
Hong Kong 31% 53% Underperformed 228 175
PwC
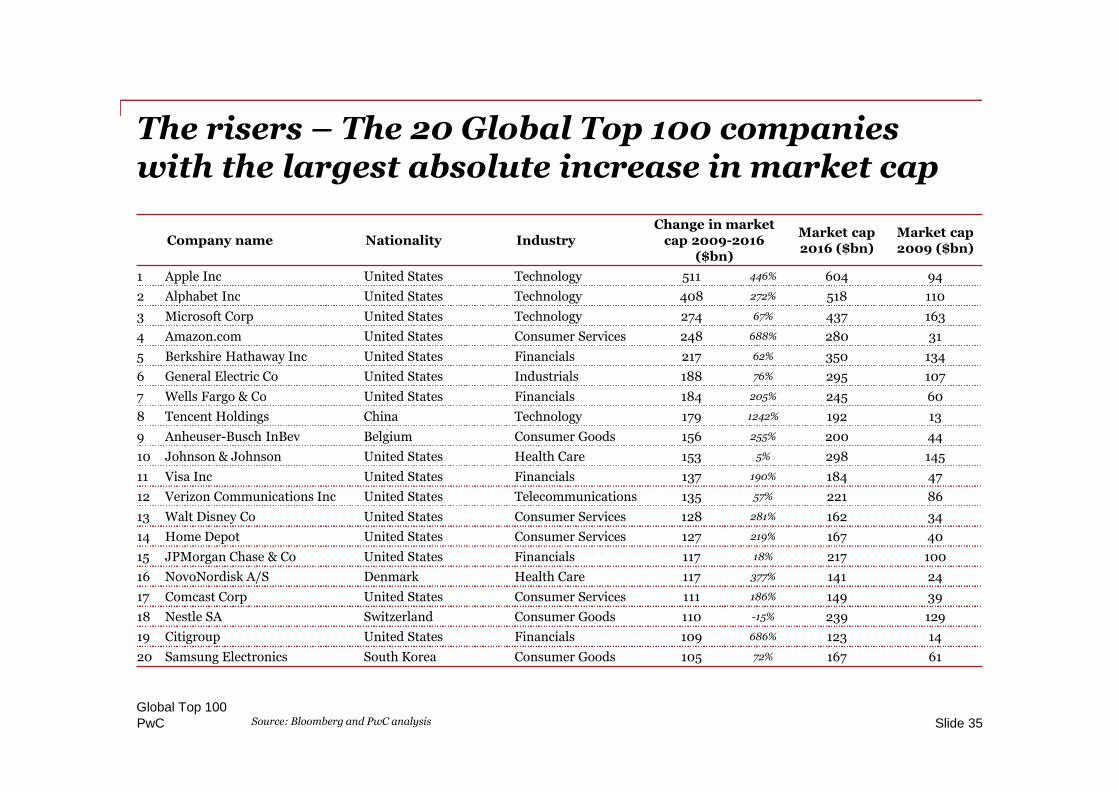
The risers – The 20 Global Top 100 companieswith the largest absolute increase in market cap
Global Top 100Slide 35
Company name Nationality IndustryChange in market
cap 2009-2016($bn)
Market cap2016 ($bn)
Market cap2009 ($bn)
1 Apple Inc United States Technology 511 446% 604 94
2 Alphabet Inc United States Technology 408 272% 518 110
3 Microsoft Corp United States Technology 274 67% 437 163
4 Amazon.com United States Consumer Services 248 688% 280 31
5 Berkshire Hathaway Inc United States Financials 217 62% 350 134
6 General Electric Co United States Industrials 188 76% 295 107
7 Wells Fargo & Co United States Financials 184 205% 245 60
8 Tencent Holdings China Technology 179 1242% 192 13
9 Anheuser-Busch InBev Belgium Consumer Goods 156 255% 200 44
10 Johnson & Johnson United States Health Care 153 5% 298 145
11 Visa Inc United States Financials 137 190% 184 47
12 Verizon Communications Inc United States Telecommunications 135 57% 221 86
13 Walt Disney Co United States Consumer Services 128 281% 162 34
14 Home Depot United States Consumer Services 127 219% 167 40
15 JPMorgan Chase & Co United States Financials 117 18% 217 100
16 NovoNordisk A/S Denmark Health Care 117 377% 141 24
17 Comcast Corp United States Consumer Services 111 186% 149 39
18 Nestle SA Switzerland Consumer Goods 110 -15% 239 129
19 Citigroup United States Financials 109 686% 123 14
20 Samsung Electronics South Korea Consumer Goods 105 72% 167 61
Source: Bloomberg and PwC analysis
PwC
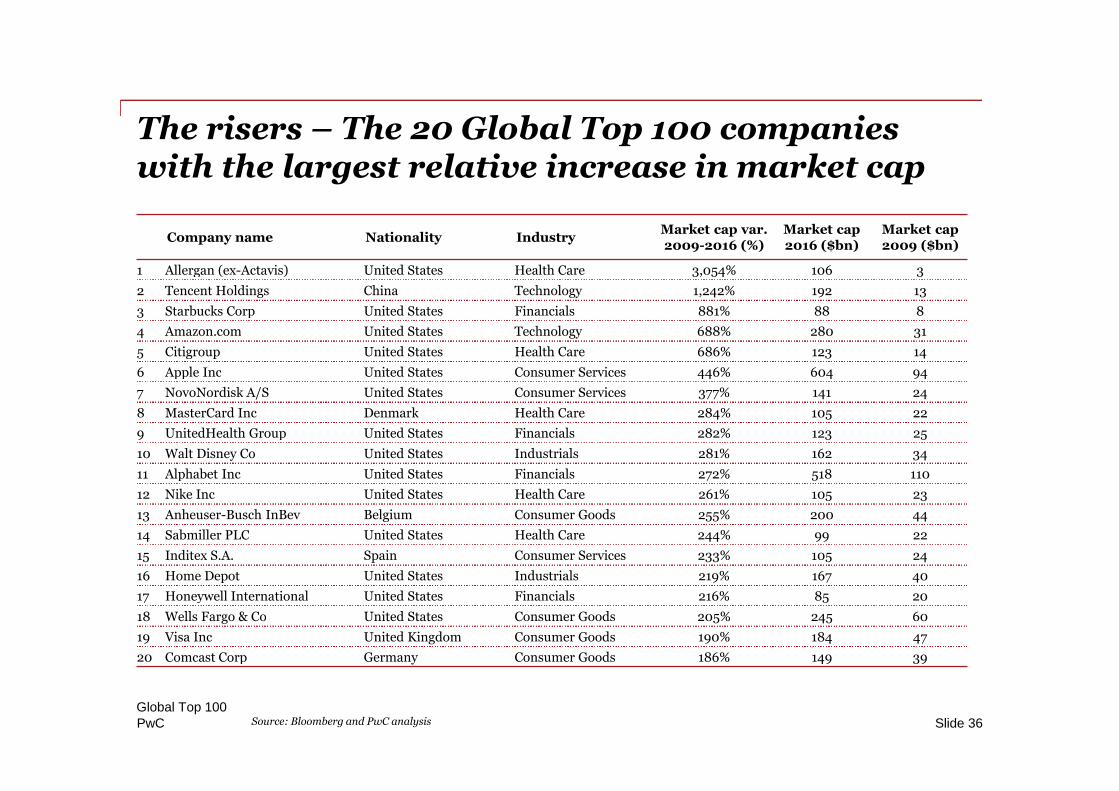
The risers – The 20 Global Top 100 companieswith the largest relative increase in market cap
Global Top 100Slide 36
Company name Nationality IndustryMarket cap var.2009-2016 (%)
Market cap2016 ($bn)
Market cap2009 ($bn)
1 Allergan (ex-Actavis) United States Health Care 3,054% 106 3
2 Tencent Holdings China Technology 1,242% 192 13
3 Starbucks Corp United States Financials 881% 88 8
4 Amazon.com United States Technology 688% 280 31
5 Citigroup United States Health Care 686% 123 14
6 Apple Inc United States Consumer Services 446% 604 94
7 NovoNordisk A/S United States Consumer Services 377% 141 24
8 MasterCard Inc Denmark Health Care 284% 105 22
9 UnitedHealth Group United States Financials 282% 123 25
10 Walt Disney Co United States Industrials 281% 162 34
11 Alphabet Inc United States Financials 272% 518 110
12 Nike Inc United States Health Care 261% 105 23
13 Anheuser-Busch InBev Belgium Consumer Goods 255% 200 44
14 Sabmiller PLC United States Health Care 244% 99 22
15 Inditex S.A. Spain Consumer Services 233% 105 24
16 Home Depot United States Industrials 219% 167 40
17 Honeywell International United States Financials 216% 85 20
18 Wells Fargo & Co United States Consumer Goods 205% 245 60
19 Visa Inc United Kingdom Consumer Goods 190% 184 47
20 Comcast Corp Germany Consumer Goods 186% 149 39
Source: Bloomberg and PwC analysis
PwC
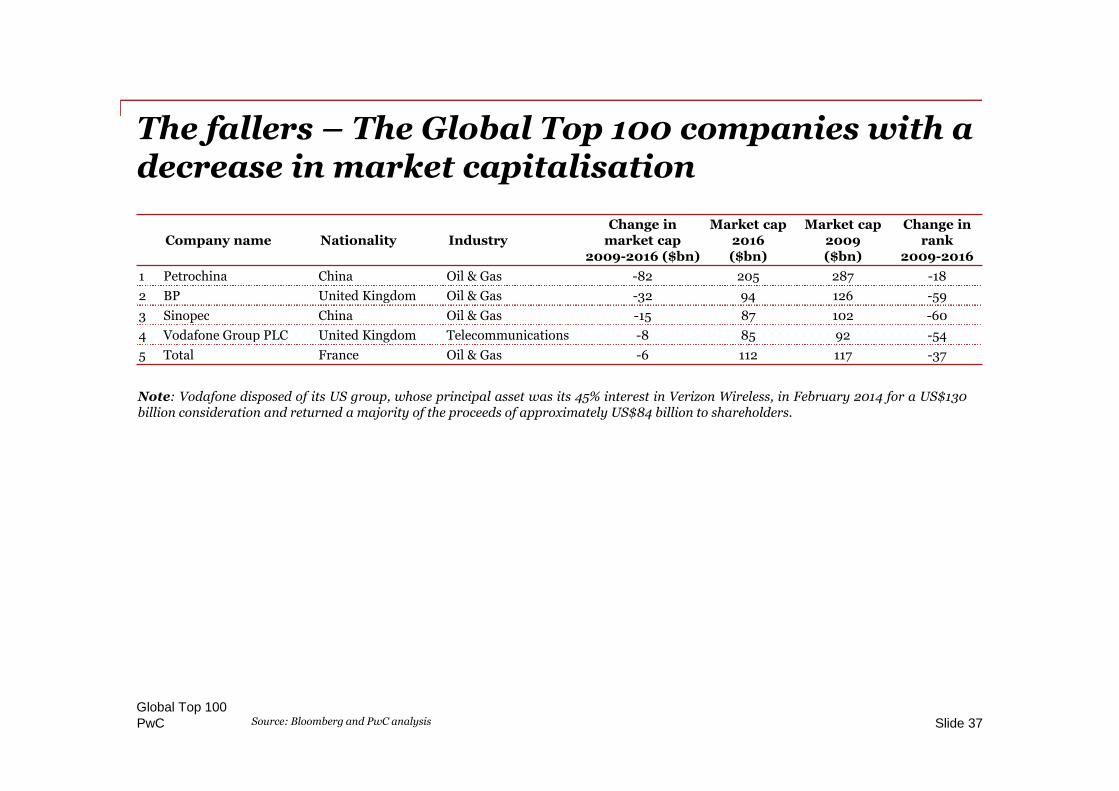
The fallers – The Global Top 100 companies with adecrease in market capitalisation
Global Top 100Slide 37
Company name Nationality IndustryChange in
market cap2009-2016 ($bn)
Market cap2016($bn)
Market cap2009($bn)
Change inrank
2009-2016
1 Petrochina China Oil & Gas -82 205 287 -18
2 BP United Kingdom Oil & Gas -32 94 126 -59
3 Sinopec China Oil & Gas -15 87 102 -60
4 Vodafone Group PLC United Kingdom Telecommunications -8 85 92 -54
5 Total France Oil & Gas -6 112 117 -37
Source: Bloomberg and PwC analysis
Note: Vodafone disposed of its US group, whose principal asset was its 45% interest in Verizon Wireless, in February 2014 for a US$130billion consideration and returned a majority of the proceeds of approximately US$84 billion to shareholders.
PwC
Section 4Post-financial crisis comparison2016 vs. 2009
1) Key movements
2) The industries – Global Top 100 sorted by sector
3) Country/region comparison
4) Complete ranking
Global Top 100Slide 38
PwC
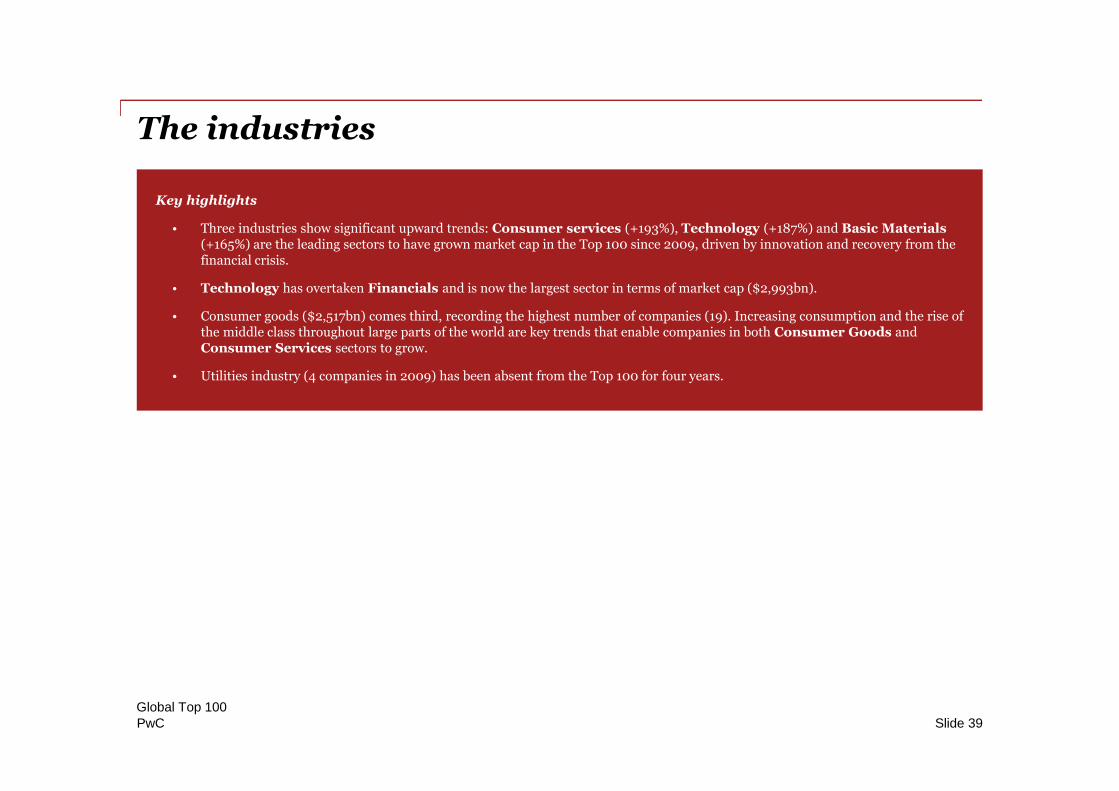
The industries
Key highlights
• Three industries show significant upward trends: Consumer services (+193%), Technology (+187%) and Basic Materials(+165%) are the leading sectors to have grown market cap in the Top 100 since 2009, driven by innovation and recovery from thefinancial crisis.
• Technology has overtaken Financials and is now the largest sector in terms of market cap ($2,993bn).
• Consumer goods ($2,517bn) comes third, recording the highest number of companies (19). Increasing consumption and the rise ofthe middle class throughout large parts of the world are key trends that enable companies in both Consumer Goods andConsumer Services sectors to grow.
• Utilities industry (4 companies in 2009) has been absent from the Top 100 for four years.
Global Top 100Slide 39
PwC
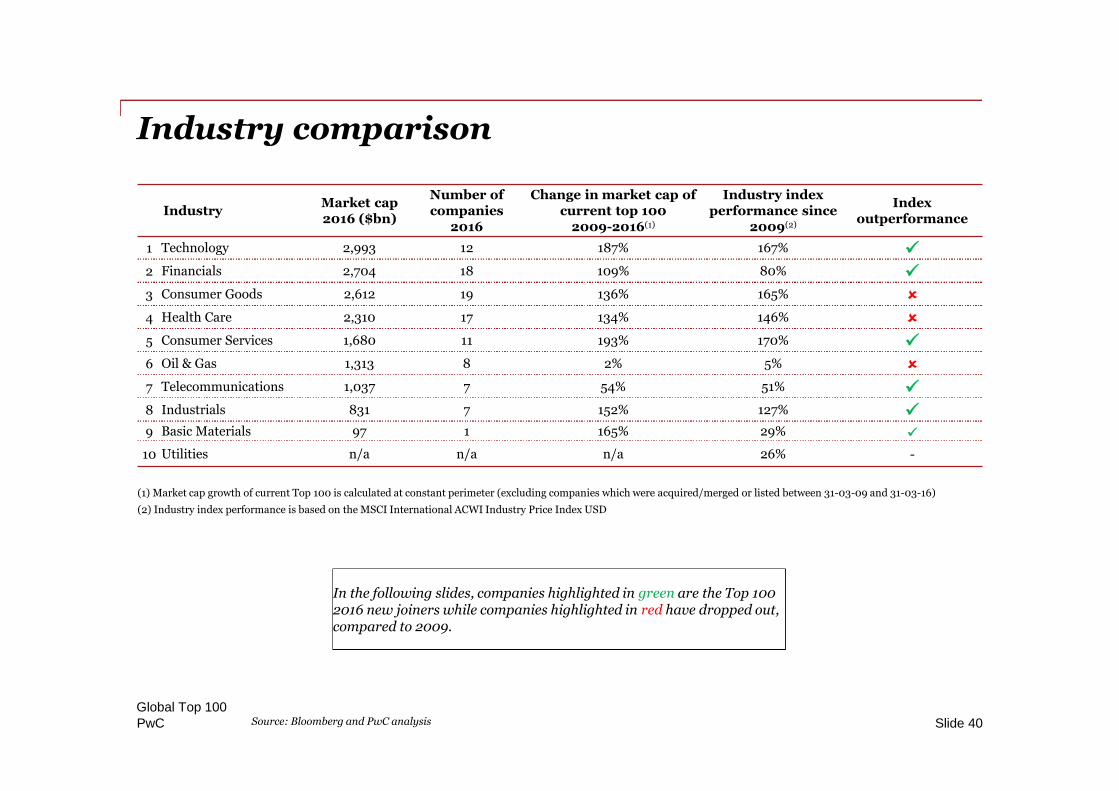
Industry comparison
Global Top 100Slide 40
IndustryMarket cap2016 ($bn)
Number ofcompanies
2016
Change in market cap ofcurrent top 100
2009-2016(1)
Industry indexperformance since
2009(2)
Indexoutperformance
1 Technology 2,993 12 187% 167% 2 Financials 2,704 18 109% 80% 3 Consumer Goods 2,612 19 136% 165% 4 Health Care 2,310 17 134% 146% 5 Consumer Services 1,680 11 193% 170% 6 Oil & Gas 1,313 8 2% 5% 7 Telecommunications 1,037 7 54% 51% 8 Industrials 831 7 152% 127% 9 Basic Materials 97 1 165% 29%
10 Utilities n/a n/a n/a 26% -
(1) Market cap growth of current Top 100 is calculated at constant perimeter (excluding companies which were acquired/merged or listed between 31-03-09 and 31-03-16)
(2) Industry index performance is based on the MSCI International ACWI Industry Price Index USD
Source: Bloomberg and PwC analysis
In the following slides, companies highlighted in green are the Top 1002016 new joiners while companies highlighted in red have dropped out,compared to 2009.
PwC
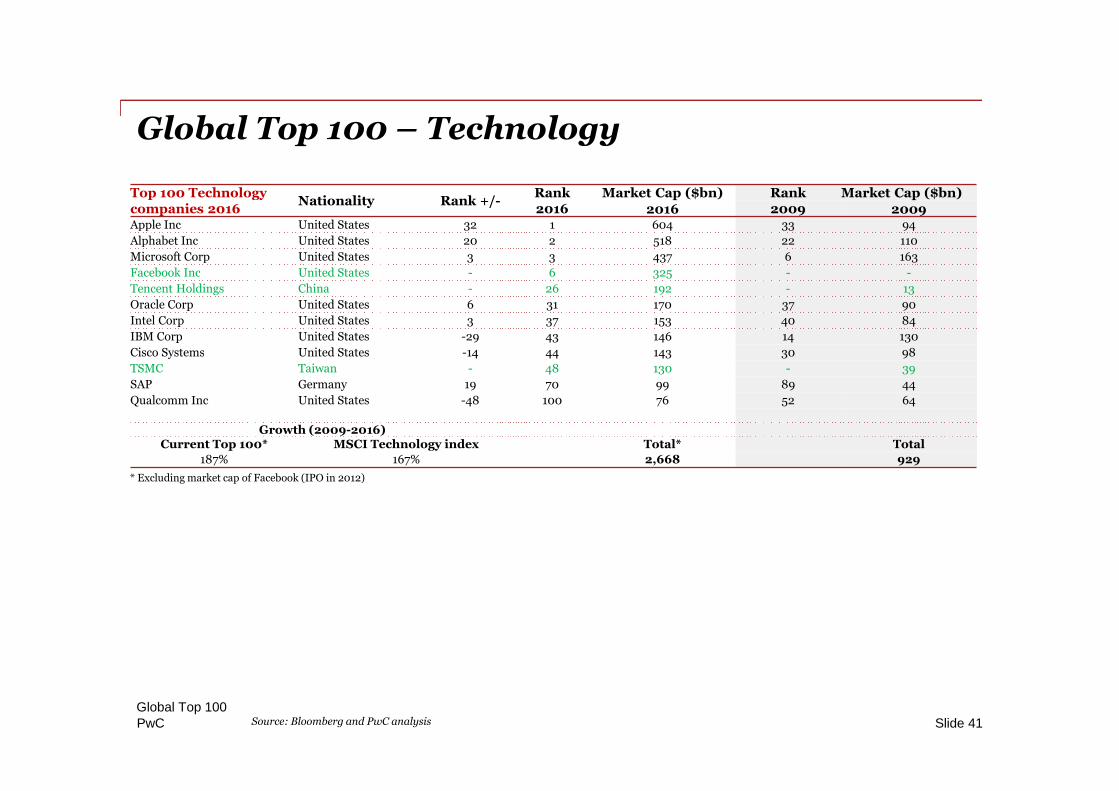
Top 100 Technologycompanies 2016
Nationality Rank +/-Rank Market Cap ($bn) Rank Market Cap ($bn)2016 2016 2009 2009
Apple Inc United States 32 1 604 33 94
Alphabet Inc United States 20 2 518 22 110
Microsoft Corp United States 3 3 437 6 163
Facebook Inc United States - 6 325 - -
Tencent Holdings China - 26 192 - 13
Oracle Corp United States 6 31 170 37 90
Intel Corp United States 3 37 153 40 84
IBM Corp United States -29 43 146 14 130
Cisco Systems United States -14 44 143 30 98
TSMC Taiwan - 48 130 - 39
SAP Germany 19 70 99 89 44
Qualcomm Inc United States -48 100 76 52 64
Growth (2009-2016)Current Top 100* MSCI Technology index Total* Total
187% 167% 2,668 929
Global Top 100 – Technology
Global Top 100Slide 41
* Excluding market cap of Facebook (IPO in 2012)
Source: Bloomberg and PwC analysis
PwC
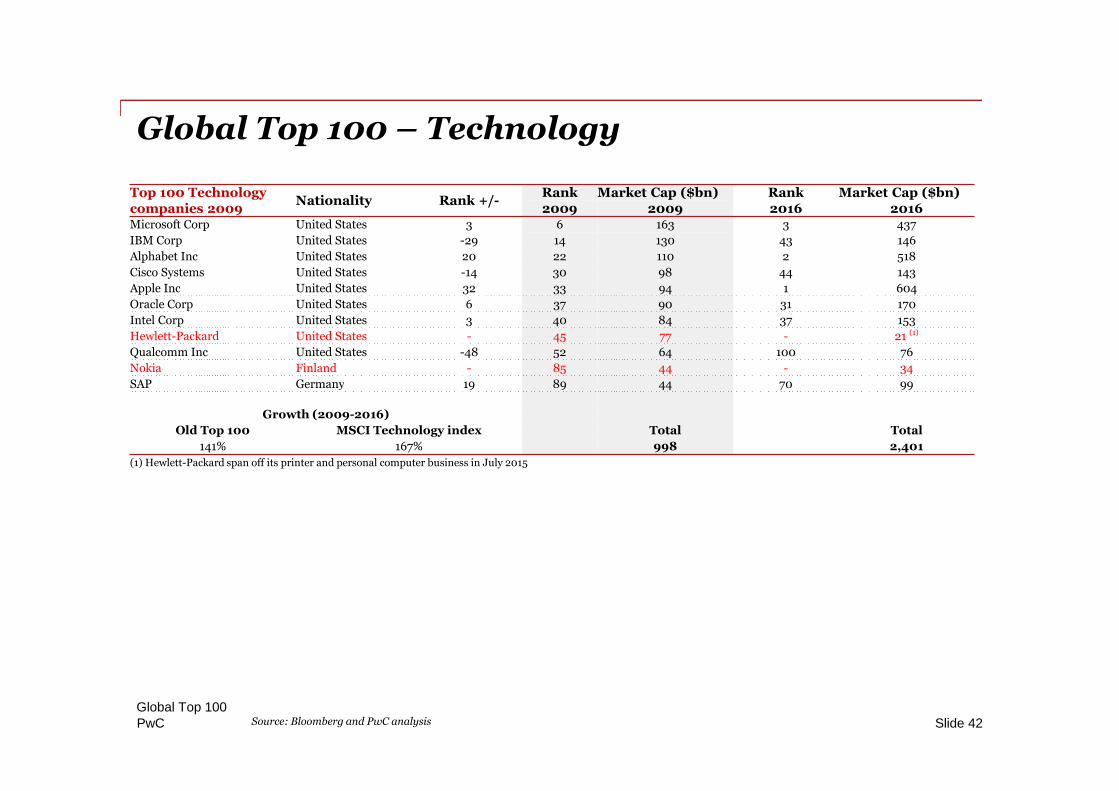
Global Top 100 – Technology
Global Top 100Slide 42Source: Bloomberg and PwC analysis
Top 100 Technologycompanies 2009
Nationality Rank +/-Rank Market Cap ($bn) Rank Market Cap ($bn)2009 2009 2016 2016
Microsoft Corp United States 3 6 163 3 437
IBM Corp United States -29 14 130 43 146
Alphabet Inc United States 20 22 110 2 518
Cisco Systems United States -14 30 98 44 143
Apple Inc United States 32 33 94 1 604
Oracle Corp United States 6 37 90 31 170
Intel Corp United States 3 40 84 37 153
Hewlett-Packard United States - 45 77 - 21 (1)
Qualcomm Inc United States -48 52 64 100 76
Nokia Finland - 85 44 - 34
SAP Germany 19 89 44 70 99
Growth (2009-2016)
Old Top 100 MSCI Technology index Total Total
141% 167% 998 2,401
(1) Hewlett-Packard span off its printer and personal computer business in July 2015
PwC
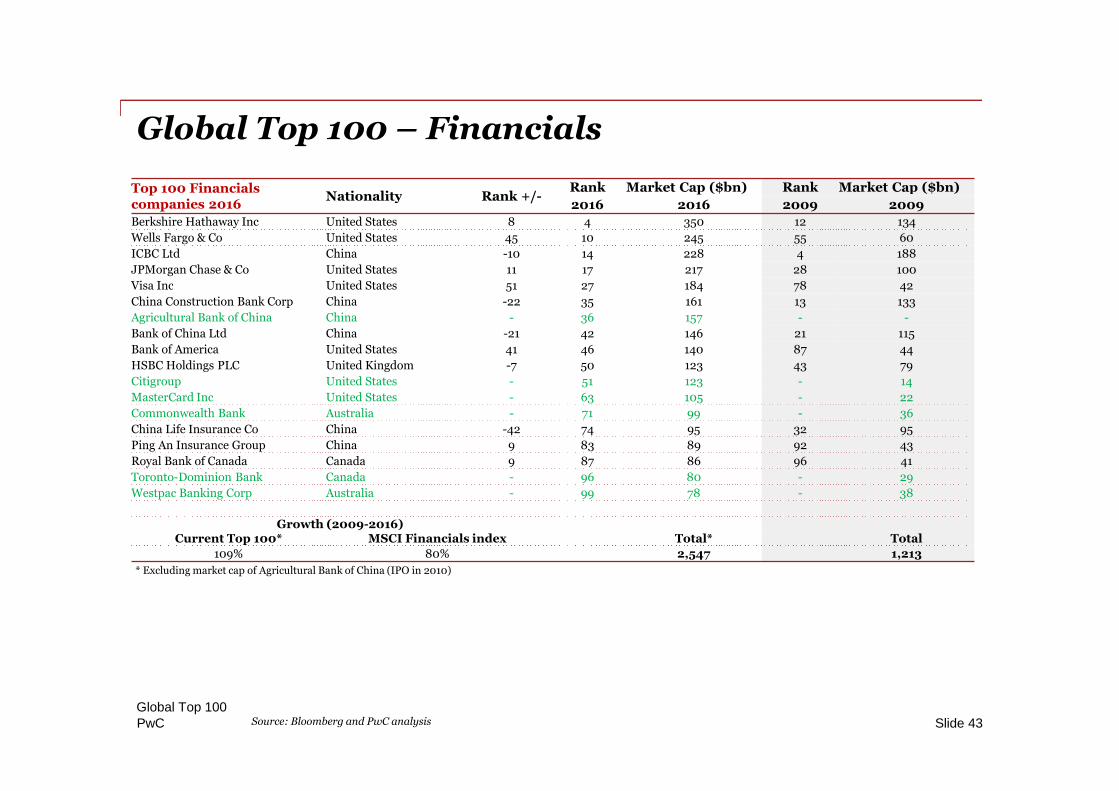
Global Top 100 – Financials
Global Top 100Slide 43
* Excluding market cap of Agricultural Bank of China (IPO in 2010)
Source: Bloomberg and PwC analysis
Top 100 Financialscompanies 2016
Nationality Rank +/-Rank Market Cap ($bn) Rank Market Cap ($bn)
2016 2016 2009 2009
Berkshire Hathaway Inc United States 8 4 350 12 134
Wells Fargo & Co United States 45 10 245 55 60
ICBC Ltd China -10 14 228 4 188
JPMorgan Chase & Co United States 11 17 217 28 100
Visa Inc United States 51 27 184 78 42
China Construction Bank Corp China -22 35 161 13 133
Agricultural Bank of China China - 36 157 - -
Bank of China Ltd China -21 42 146 21 115
Bank of America United States 41 46 140 87 44
HSBC Holdings PLC United Kingdom -7 50 123 43 79
Citigroup United States - 51 123 - 14
MasterCard Inc United States - 63 105 - 22
Commonwealth Bank Australia - 71 99 - 36
China Life Insurance Co China -42 74 95 32 95
Ping An Insurance Group China 9 83 89 92 43
Royal Bank of Canada Canada 9 87 86 96 41
Toronto-Dominion Bank Canada - 96 80 - 29
Westpac Banking Corp Australia - 99 78 - 38
Growth (2009-2016)Current Top 100* MSCI Financials index Total* Total
109% 80% 2,547 1,213
PwC
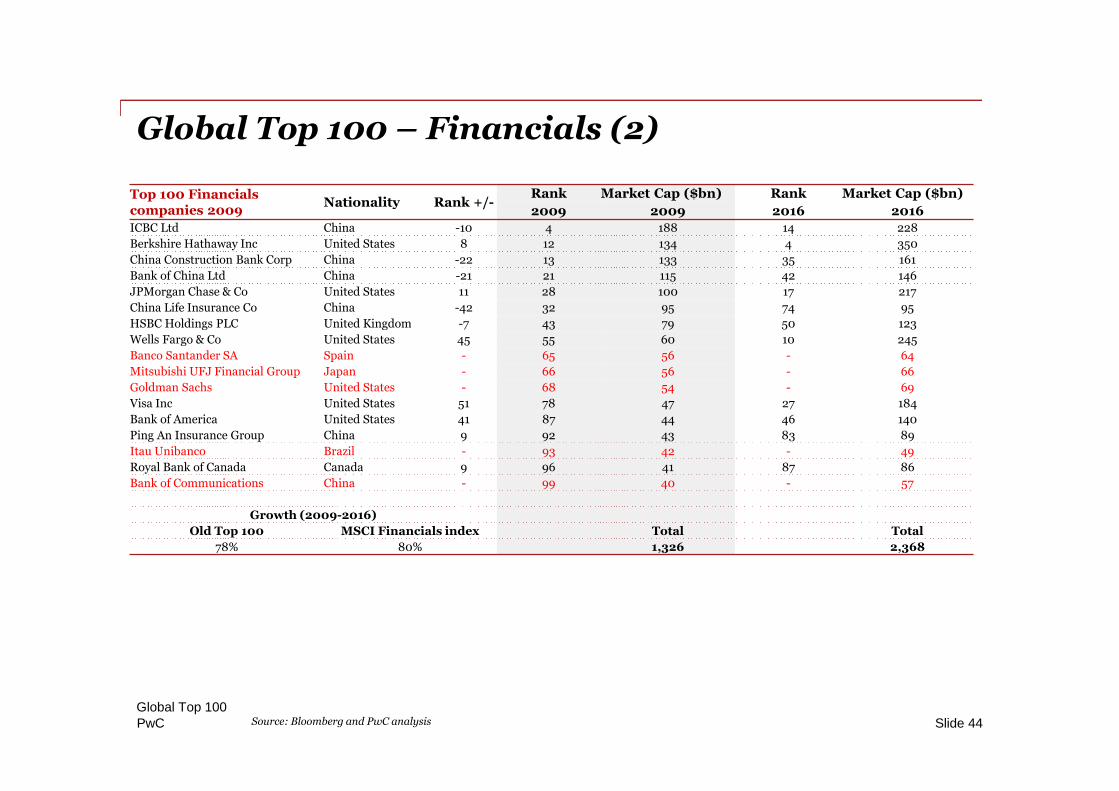
Global Top 100 – Financials (2)
Global Top 100Slide 44Source: Bloomberg and PwC analysis
Top 100 Financialscompanies 2009
Nationality Rank +/-Rank Market Cap ($bn) Rank Market Cap ($bn)
2009 2009 2016 2016ICBC Ltd China -10 4 188 14 228
Berkshire Hathaway Inc United States 8 12 134 4 350
China Construction Bank Corp China -22 13 133 35 161
Bank of China Ltd China -21 21 115 42 146
JPMorgan Chase & Co United States 11 28 100 17 217
China Life Insurance Co China -42 32 95 74 95
HSBC Holdings PLC United Kingdom -7 43 79 50 123
Wells Fargo & Co United States 45 55 60 10 245
Banco Santander SA Spain - 65 56 - 64
Mitsubishi UFJ Financial Group Japan - 66 56 - 66
Goldman Sachs United States - 68 54 - 69
Visa Inc United States 51 78 47 27 184
Bank of America United States 41 87 44 46 140
Ping An Insurance Group China 9 92 43 83 89
Itau Unibanco Brazil - 93 42 - 49
Royal Bank of Canada Canada 9 96 41 87 86
Bank of Communications China - 99 40 - 57
Growth (2009-2016)
Old Top 100 MSCI Financials index Total Total
78% 80% 1,326 2,368
PwC
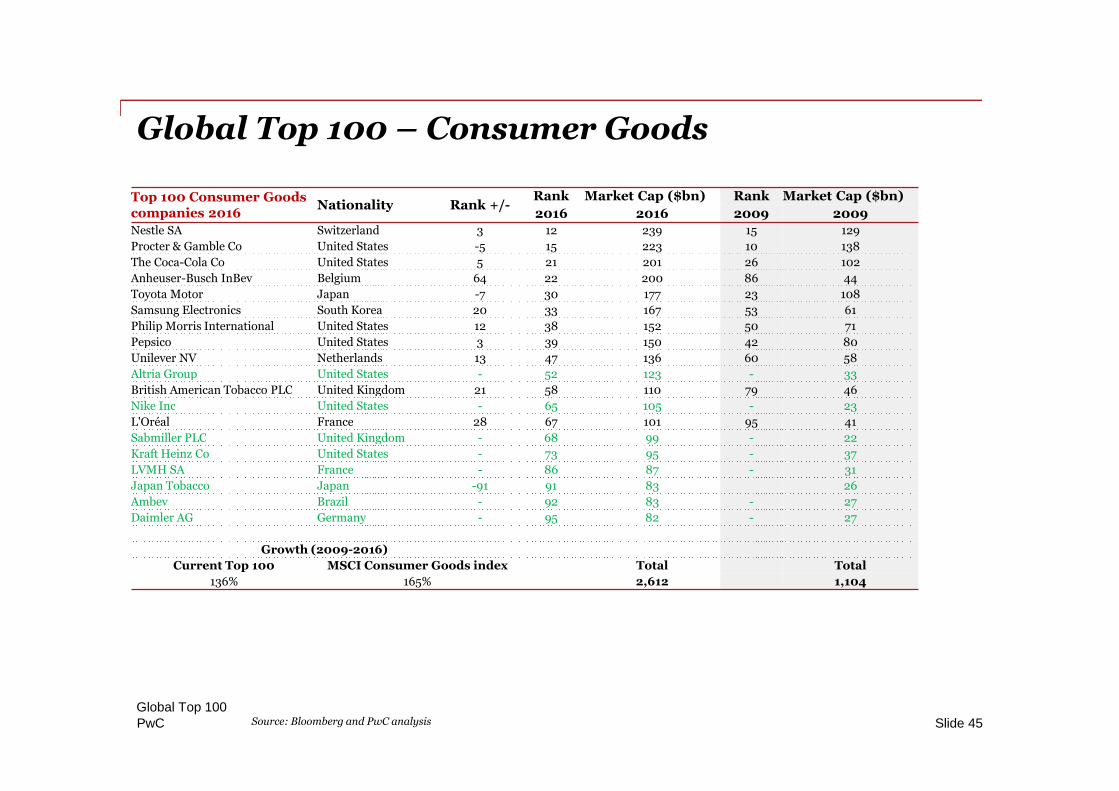
Global Top 100 – Consumer Goods
Global Top 100Slide 45Source: Bloomberg and PwC analysis
Top 100 Consumer Goodscompanies 2016
Nationality Rank +/-Rank Market Cap ($bn) Rank Market Cap ($bn)
2016 2016 2009 2009Nestle SA Switzerland 3 12 239 15 129
Procter & Gamble Co United States -5 15 223 10 138
The Coca-Cola Co United States 5 21 201 26 102
Anheuser-Busch InBev Belgium 64 22 200 86 44
Toyota Motor Japan -7 30 177 23 108
Samsung Electronics South Korea 20 33 167 53 61
Philip Morris International United States 12 38 152 50 71
Pepsico United States 3 39 150 42 80
Unilever NV Netherlands 13 47 136 60 58
Altria Group United States - 52 123 - 33
British American Tobacco PLC United Kingdom 21 58 110 79 46
Nike Inc United States - 65 105 - 23
L'Oréal France 28 67 101 95 41
Sabmiller PLC United Kingdom - 68 99 - 22
Kraft Heinz Co United States - 73 95 - 37
LVMH SA France - 86 87 - 31
Japan Tobacco Japan -91 91 83 26
Ambev Brazil - 92 83 - 27
Daimler AG Germany - 95 82 - 27
Growth (2009-2016)
Current Top 100 MSCI Consumer Goods index Total Total
136% 165% 2,612 1,104
PwC
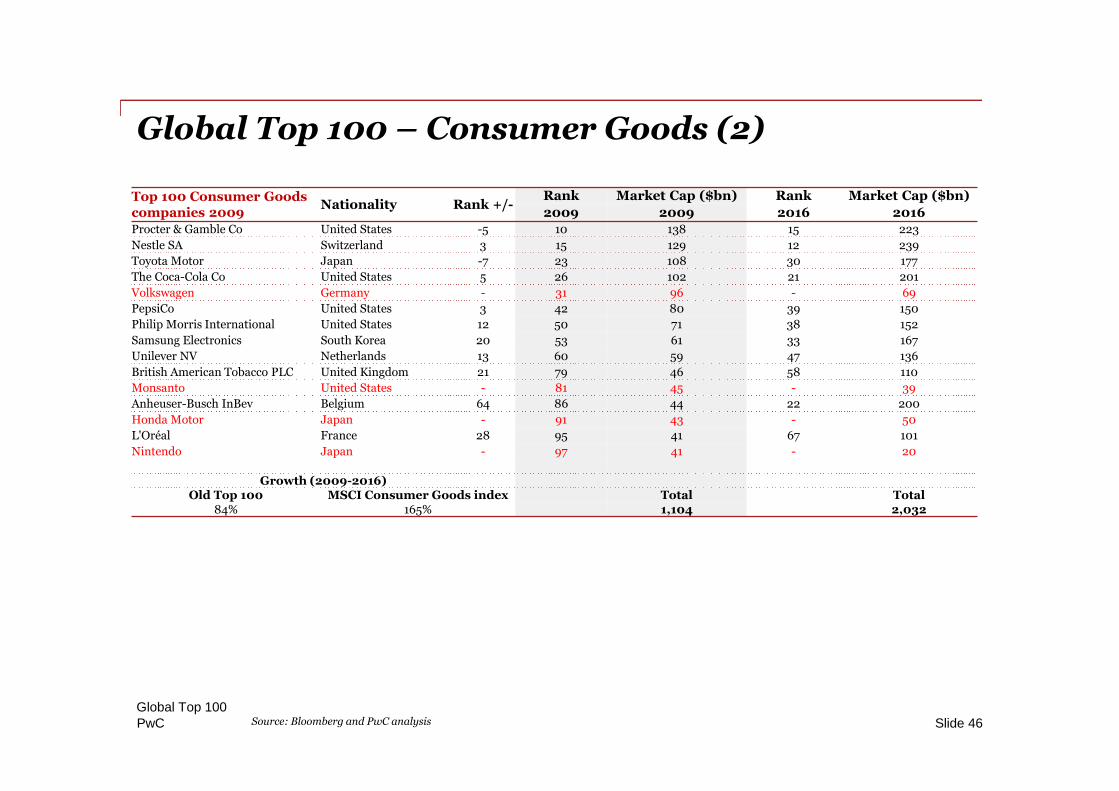
Global Top 100 – Consumer Goods (2)
Global Top 100Slide 46Source: Bloomberg and PwC analysis
Top 100 Consumer Goodscompanies 2009
Nationality Rank +/-Rank Market Cap ($bn) Rank Market Cap ($bn)
2009 2009 2016 2016Procter & Gamble Co United States -5 10 138 15 223
Nestle SA Switzerland 3 15 129 12 239
Toyota Motor Japan -7 23 108 30 177
The Coca-Cola Co United States 5 26 102 21 201
Volkswagen Germany - 31 96 - 69
PepsiCo United States 3 42 80 39 150
Philip Morris International United States 12 50 71 38 152
Samsung Electronics South Korea 20 53 61 33 167
Unilever NV Netherlands 13 60 59 47 136
British American Tobacco PLC United Kingdom 21 79 46 58 110
Monsanto United States - 81 45 - 39
Anheuser-Busch InBev Belgium 64 86 44 22 200
Honda Motor Japan - 91 43 - 50
L'Oréal France 28 95 41 67 101
Nintendo Japan - 97 41 - 20
Growth (2009-2016)Old Top 100 MSCI Consumer Goods index Total Total
84% 165% 1,104 2,032
PwC
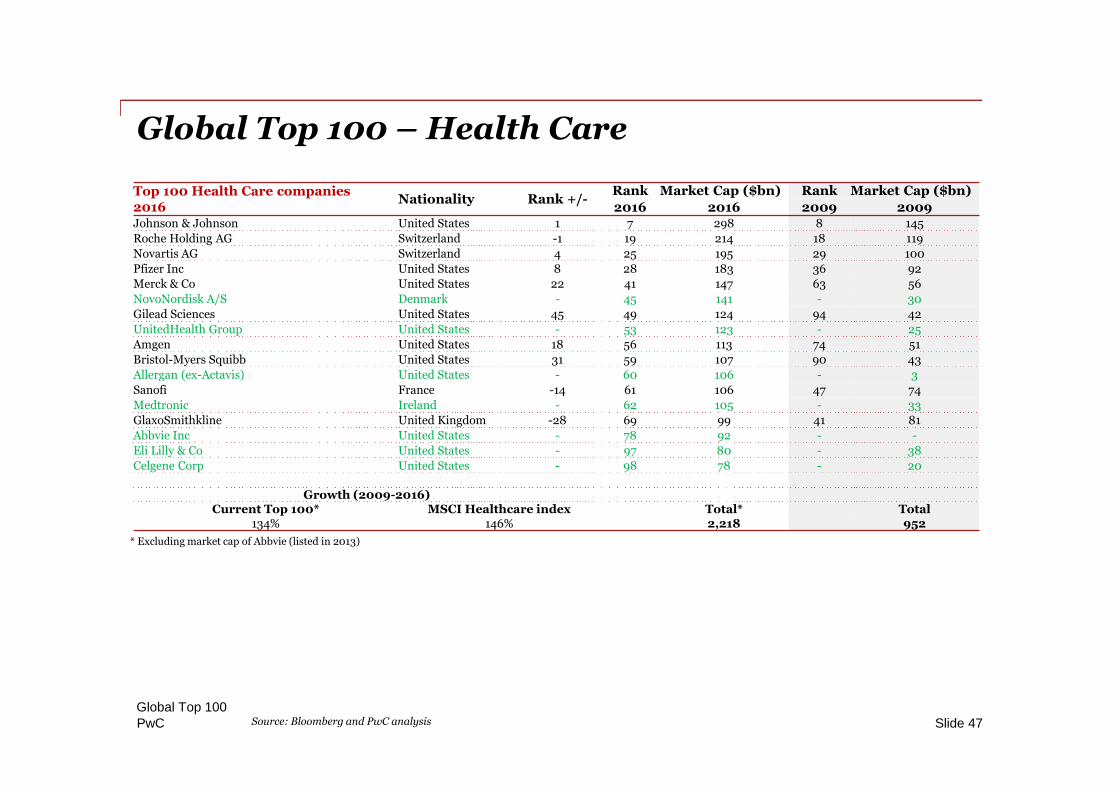
Top 100 Health Care companies2016
Nationality Rank +/-Rank Market Cap ($bn) Rank Market Cap ($bn)
2016 2016 2009 2009Johnson & Johnson United States 1 7 298 8 145
Roche Holding AG Switzerland -1 19 214 18 119
Novartis AG Switzerland 4 25 195 29 100
Pfizer Inc United States 8 28 183 36 92
Merck & Co United States 22 41 147 63 56
NovoNordisk A/S Denmark - 45 141 - 30
Gilead Sciences United States 45 49 124 94 42
UnitedHealth Group United States - 53 123 - 25
Amgen United States 18 56 113 74 51
Bristol-Myers Squibb United States 31 59 107 90 43
Allergan (ex-Actavis) United States - 60 106 - 3
Sanofi France -14 61 106 47 74
Medtronic Ireland - 62 105 - 33
GlaxoSmithkline United Kingdom -28 69 99 41 81
Abbvie Inc United States - 78 92 - -
Eli Lilly & Co United States - 97 80 - 38
Celgene Corp United States - 98 78 - 20
Growth (2009-2016)Current Top 100* MSCI Healthcare index Total* Total
134% 146% 2,218 952
Global Top 100 – Health Care
Global Top 100Slide 47
* Excluding market cap of Abbvie (listed in 2013)
Source: Bloomberg and PwC analysis
PwC
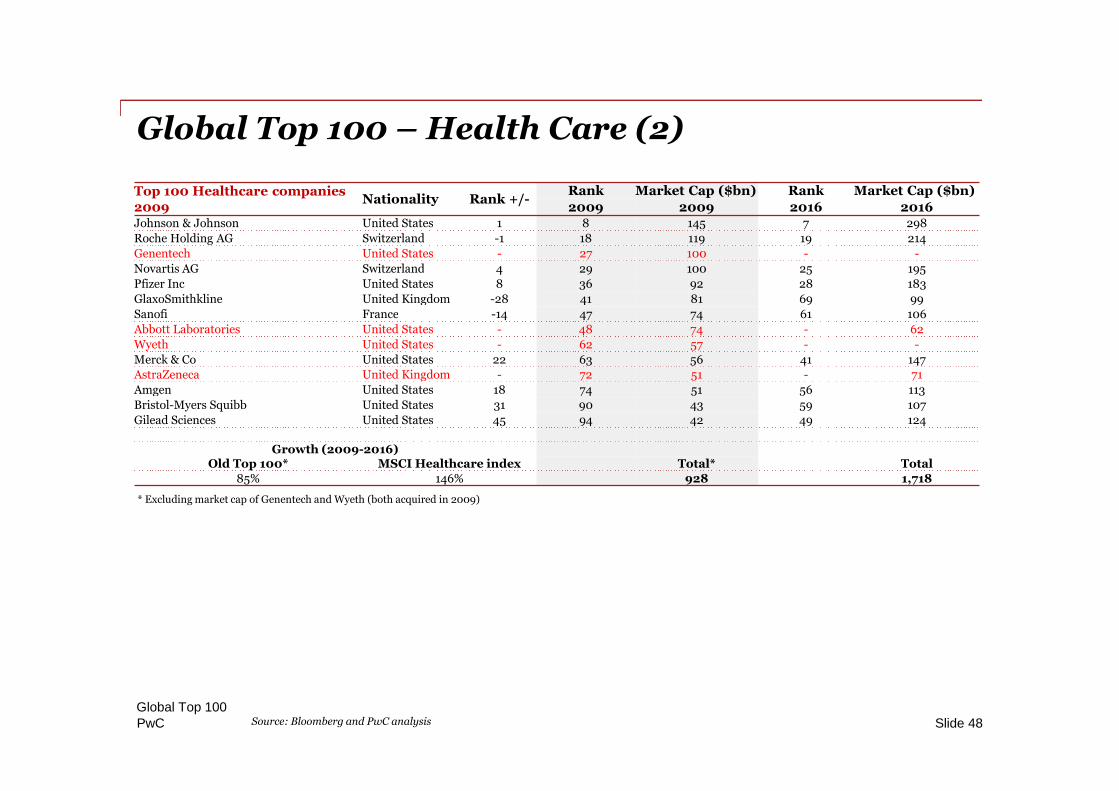
Global Top 100 – Health Care (2)
Global Top 100Slide 48
* Excluding market cap of Genentech and Wyeth (both acquired in 2009)
Source: Bloomberg and PwC analysis
Top 100 Healthcare companies2009
Nationality Rank +/-Rank Market Cap ($bn) Rank Market Cap ($bn)2009 2009 2016 2016
Johnson & Johnson United States 1 8 145 7 298
Roche Holding AG Switzerland -1 18 119 19 214
Genentech United States - 27 100 - -
Novartis AG Switzerland 4 29 100 25 195
Pfizer Inc United States 8 36 92 28 183
GlaxoSmithkline United Kingdom -28 41 81 69 99
Sanofi France -14 47 74 61 106
Abbott Laboratories United States - 48 74 - 62
Wyeth United States - 62 57 - -
Merck & Co United States 22 63 56 41 147
AstraZeneca United Kingdom - 72 51 - 71
Amgen United States 18 74 51 56 113
Bristol-Myers Squibb United States 31 90 43 59 107
Gilead Sciences United States 45 94 42 49 124
Growth (2009-2016)Old Top 100* MSCI Healthcare index Total* Total
85% 146% 928 1,718
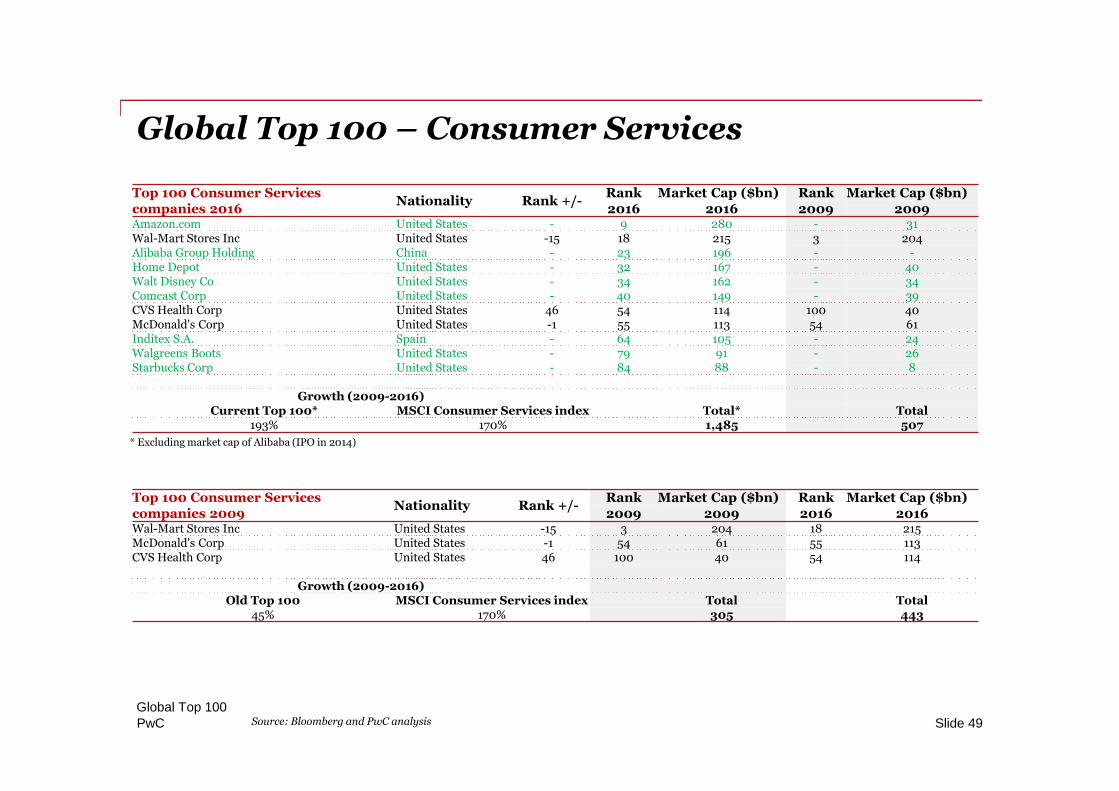
PwC
Top 100 Consumer Servicescompanies 2016
Nationality Rank +/-Rank Market Cap ($bn) Rank Market Cap ($bn)2016 2016 2009 2009
Amazon.com United States - 9 280 - 31Wal-Mart Stores Inc United States -15 18 215 3 204Alibaba Group Holding China - 23 196 - -Home Depot United States - 32 167 - 40Walt Disney Co United States - 34 162 - 34Comcast Corp United States - 40 149 - 39CVS Health Corp United States 46 54 114 100 40McDonald's Corp United States -1 55 113 54 61Inditex S.A. Spain - 64 105 - 24Walgreens Boots United States - 79 91 - 26Starbucks Corp United States - 84 88 - 8
Growth (2009-2016)Current Top 100* MSCI Consumer Services index Total* Total
193% 170% 1,485 507
Global Top 100 – Consumer Services
Global Top 100Slide 49
* Excluding market cap of Alibaba (IPO in 2014)
Source: Bloomberg and PwC analysis
Top 100 Consumer Servicescompanies 2009
Nationality Rank +/-Rank Market Cap ($bn) Rank Market Cap ($bn)2009 2009 2016 2016
Wal-Mart Stores Inc United States -15 3 204 18 215McDonald's Corp United States -1 54 61 55 113CVS Health Corp United States 46 100 40 54 114
Growth (2009-2016)Old Top 100 MSCI Consumer Services index Total Total
45% 170% 305 443
PwC
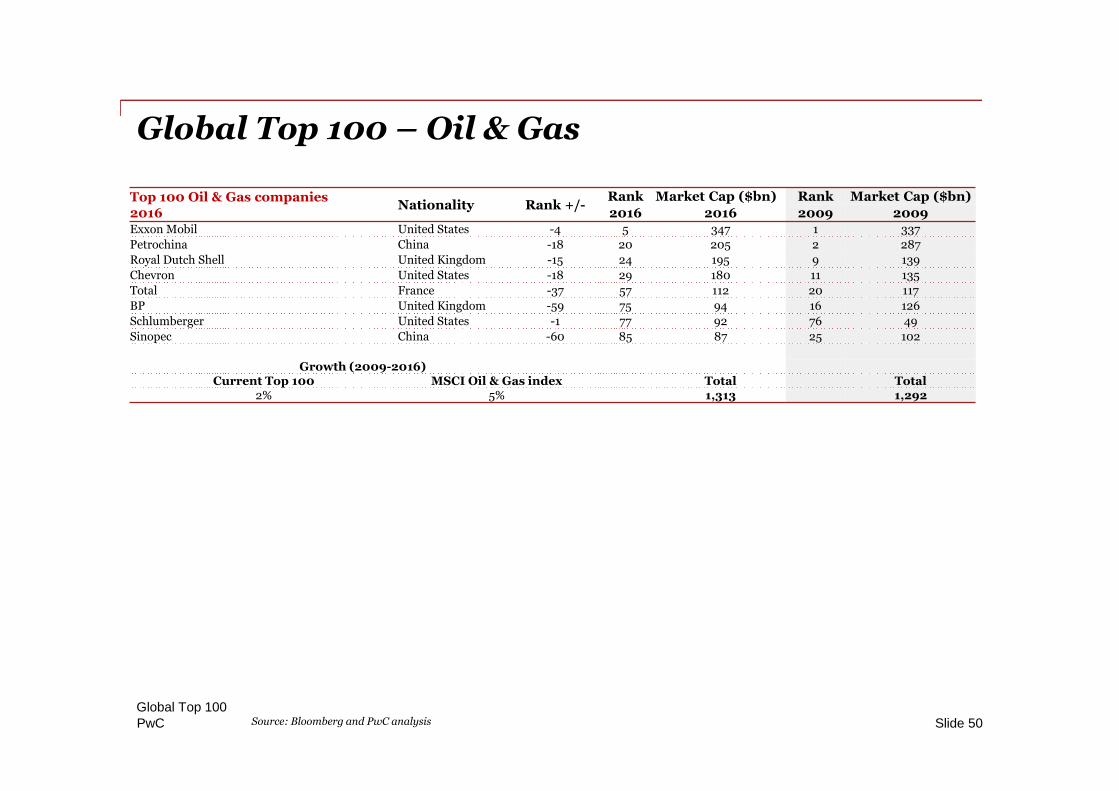
Global Top 100 – Oil & Gas
Global Top 100Slide 50Source: Bloomberg and PwC analysis
Top 100 Oil & Gas companies2016
Nationality Rank +/-Rank Market Cap ($bn) Rank Market Cap ($bn)
2016 2016 2009 2009Exxon Mobil United States -4 5 347 1 337
Petrochina China -18 20 205 2 287
Royal Dutch Shell United Kingdom -15 24 195 9 139
Chevron United States -18 29 180 11 135
Total France -37 57 112 20 117
BP United Kingdom -59 75 94 16 126
Schlumberger United States -1 77 92 76 49
Sinopec China -60 85 87 25 102
Growth (2009-2016)Current Top 100 MSCI Oil & Gas index Total Total
2% 5% 1,313 1,292
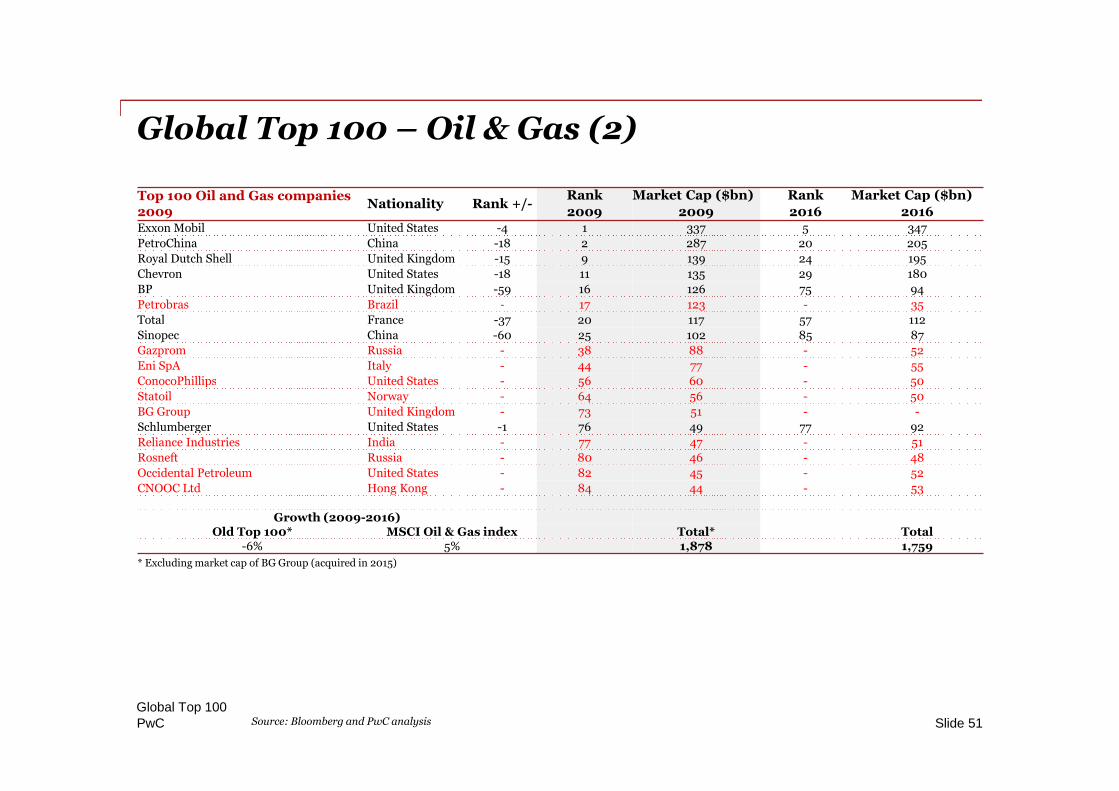
PwC
Top 100 Oil and Gas companies2009
Nationality Rank +/-Rank Market Cap ($bn) Rank Market Cap ($bn)
2009 2009 2016 2016Exxon Mobil United States -4 1 337 5 347
PetroChina China -18 2 287 20 205
Royal Dutch Shell United Kingdom -15 9 139 24 195
Chevron United States -18 11 135 29 180
BP United Kingdom -59 16 126 75 94
Petrobras Brazil - 17 123 - 35
Total France -37 20 117 57 112
Sinopec China -60 25 102 85 87
Gazprom Russia - 38 88 - 52
Eni SpA Italy - 44 77 - 55
ConocoPhillips United States - 56 60 - 50
Statoil Norway - 64 56 - 50
BG Group United Kingdom - 73 51 - -
Schlumberger United States -1 76 49 77 92
Reliance Industries India - 77 47 - 51
Rosneft Russia - 80 46 - 48
Occidental Petroleum United States - 82 45 - 52
CNOOC Ltd Hong Kong - 84 44 - 53
Growth (2009-2016)Old Top 100* MSCI Oil & Gas index Total* Total
-6% 5% 1,878 1,759
Global Top 100 – Oil & Gas (2)
Global Top 100Slide 51Source: Bloomberg and PwC analysis
* Excluding market cap of BG Group (acquired in 2015)
PwC
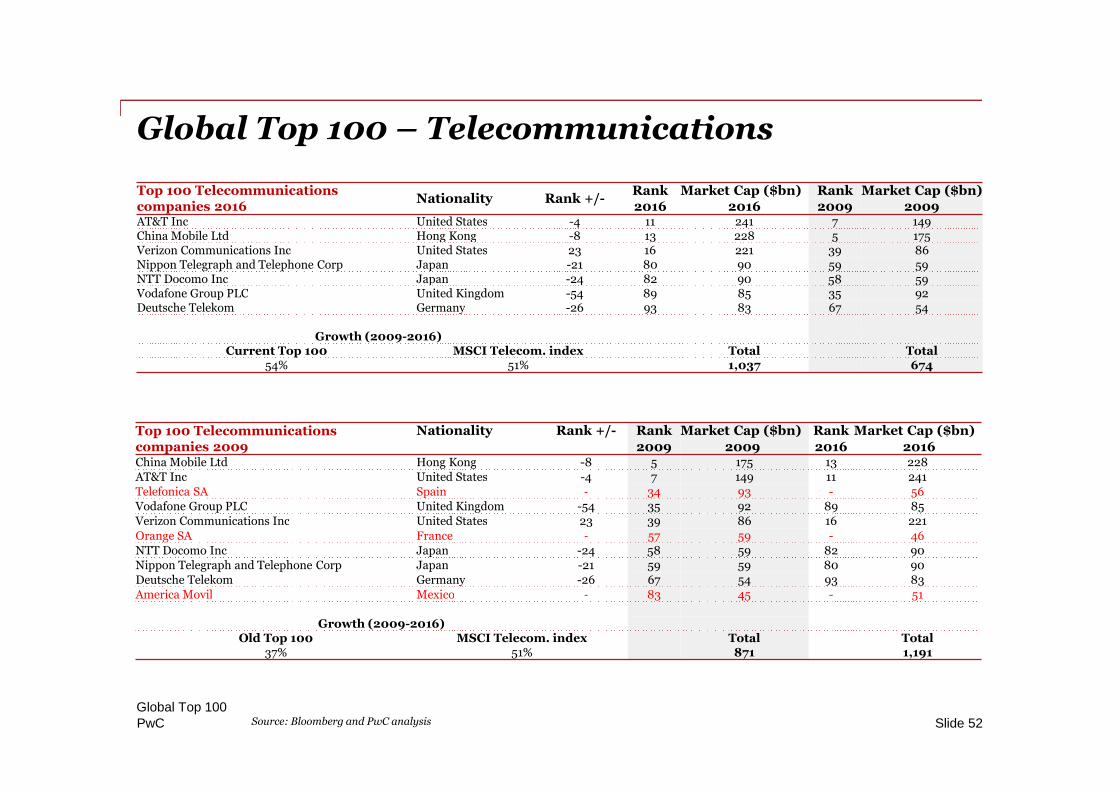
Global Top 100 – Telecommunications
Global Top 100Slide 52Source: Bloomberg and PwC analysis
Top 100 Telecommunicationscompanies 2016
Nationality Rank +/-Rank Market Cap ($bn) Rank Market Cap ($bn)2016 2016 2009 2009
AT&T Inc United States -4 11 241 7 149China Mobile Ltd Hong Kong -8 13 228 5 175Verizon Communications Inc United States 23 16 221 39 86Nippon Telegraph and Telephone Corp Japan -21 80 90 59 59NTT Docomo Inc Japan -24 82 90 58 59Vodafone Group PLC United Kingdom -54 89 85 35 92Deutsche Telekom Germany -26 93 83 67 54
Growth (2009-2016)Current Top 100 MSCI Telecom. index Total Total
54% 51% 1,037 674
Top 100 Telecommunicationscompanies 2009
Nationality Rank +/- Rank Market Cap ($bn) Rank Market Cap ($bn)2009 2009 2016 2016
China Mobile Ltd Hong Kong -8 5 175 13 228AT&T Inc United States -4 7 149 11 241Telefonica SA Spain - 34 93 - 56Vodafone Group PLC United Kingdom -54 35 92 89 85Verizon Communications Inc United States 23 39 86 16 221Orange SA France - 57 59 - 46NTT Docomo Inc Japan -24 58 59 82 90Nippon Telegraph and Telephone Corp Japan -21 59 59 80 90Deutsche Telekom Germany -26 67 54 93 83America Movil Mexico - 83 45 - 51
Growth (2009-2016)Old Top 100 MSCI Telecom. index Total Total
37% 51% 871 1,191
PwC
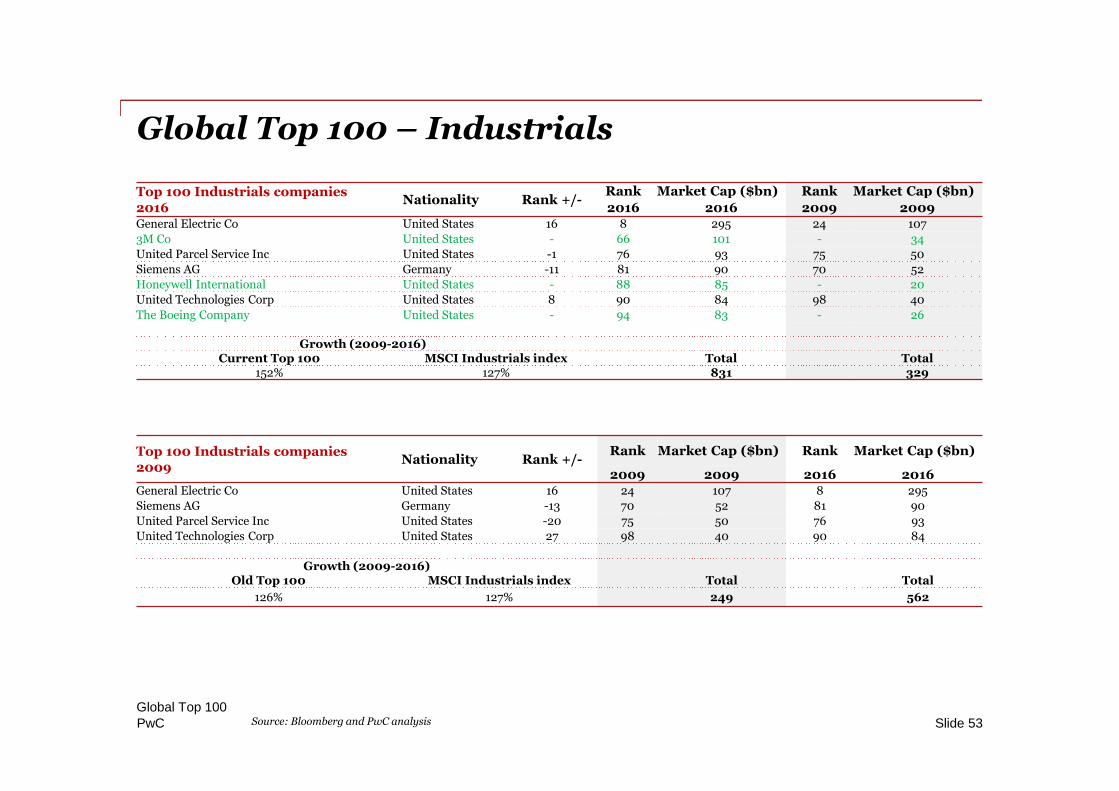
Global Top 100 – Industrials
Global Top 100Slide 53Source: Bloomberg and PwC analysis
Top 100 Industrials companies2016
Nationality Rank +/-Rank Market Cap ($bn) Rank Market Cap ($bn)
2016 2016 2009 2009General Electric Co United States 16 8 295 24 107
3M Co United States - 66 101 - 34
United Parcel Service Inc United States -1 76 93 75 50
Siemens AG Germany -11 81 90 70 52
Honeywell International United States - 88 85 - 20
United Technologies Corp United States 8 90 84 98 40
The Boeing Company United States - 94 83 - 26
Growth (2009-2016)Current Top 100 MSCI Industrials index Total Total
152% 127% 831 329
Top 100 Industrials companies2009
Nationality Rank +/-Rank Market Cap ($bn) Rank Market Cap ($bn)
2009 2009 2016 2016General Electric Co United States 16 24 107 8 295
Siemens AG Germany -13 70 52 81 90
United Parcel Service Inc United States -20 75 50 76 93
United Technologies Corp United States 27 98 40 90 84
Growth (2009-2016)Old Top 100 MSCI Industrials index Total Total
126% 127% 249 562
PwC
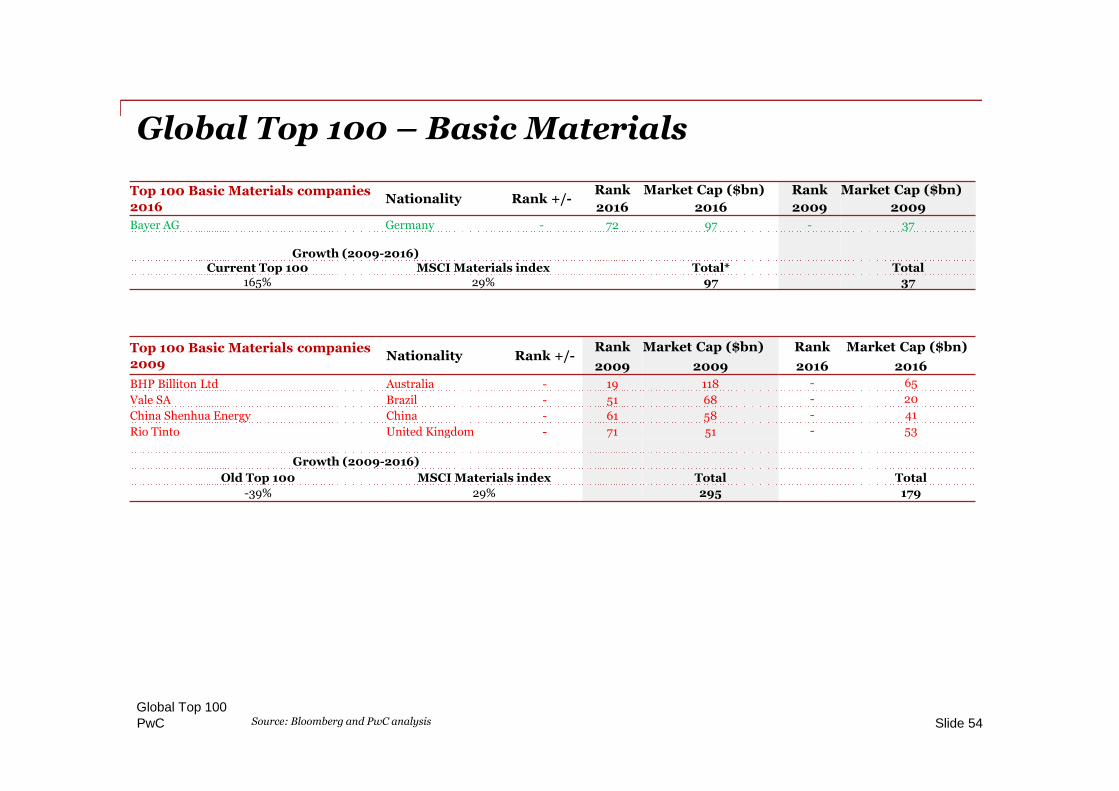
Global Top 100 – Basic Materials
Global Top 100Slide 54Source: Bloomberg and PwC analysis
Top 100 Basic Materials companies2016
Nationality Rank +/-Rank Market Cap ($bn) Rank Market Cap ($bn)
2016 2016 2009 2009
Bayer AG Germany - 72 97 - 37
Growth (2009-2016)Current Top 100 MSCI Materials index Total* Total
165% 29% 97 37
Top 100 Basic Materials companies2009
Nationality Rank +/-Rank Market Cap ($bn) Rank Market Cap ($bn)
2009 2009 2016 2016
BHP Billiton Ltd Australia - 19 118 - 65
Vale SA Brazil - 51 68 - 20
China Shenhua Energy China - 61 58 - 41
Rio Tinto United Kingdom - 71 51 - 53
Growth (2009-2016)
Old Top 100 MSCI Materials index Total Total
-39% 29% 295 179
PwC
Section 4Post-financial crisis comparison2016 vs. 2009
1) Key movements
2) The industries – Global Top 100 sorted by sector
3) Country/region comparison
4) Complete ranking
Global Top 100Slide 55
PwC
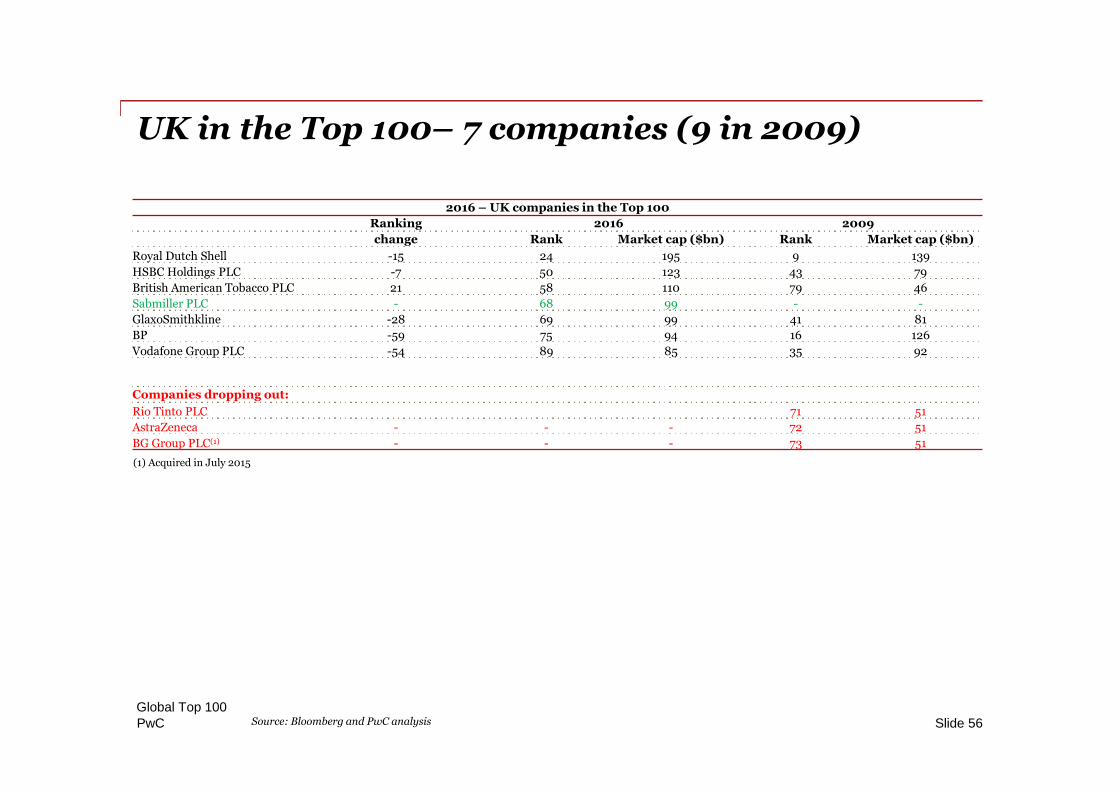
UK in the Top 100– 7 companies (9 in 2009)
Slide 56Global Top 100
2016 – UK companies in the Top 100
Ranking 2016 2009
change Rank Market cap ($bn) Rank Market cap ($bn)
Royal Dutch Shell -15 24 195 9 139
HSBC Holdings PLC -7 50 123 43 79
British American Tobacco PLC 21 58 110 79 46
Sabmiller PLC - 68 99 - -
GlaxoSmithkline -28 69 99 41 81
BP -59 75 94 16 126
Vodafone Group PLC -54 89 85 35 92
Companies dropping out:
Rio Tinto PLC 71 51
AstraZeneca - - - 72 51
BG Group PLC(1) - - - 73 51
Source: Bloomberg and PwC analysis
(1) Acquired in July 2015
PwC
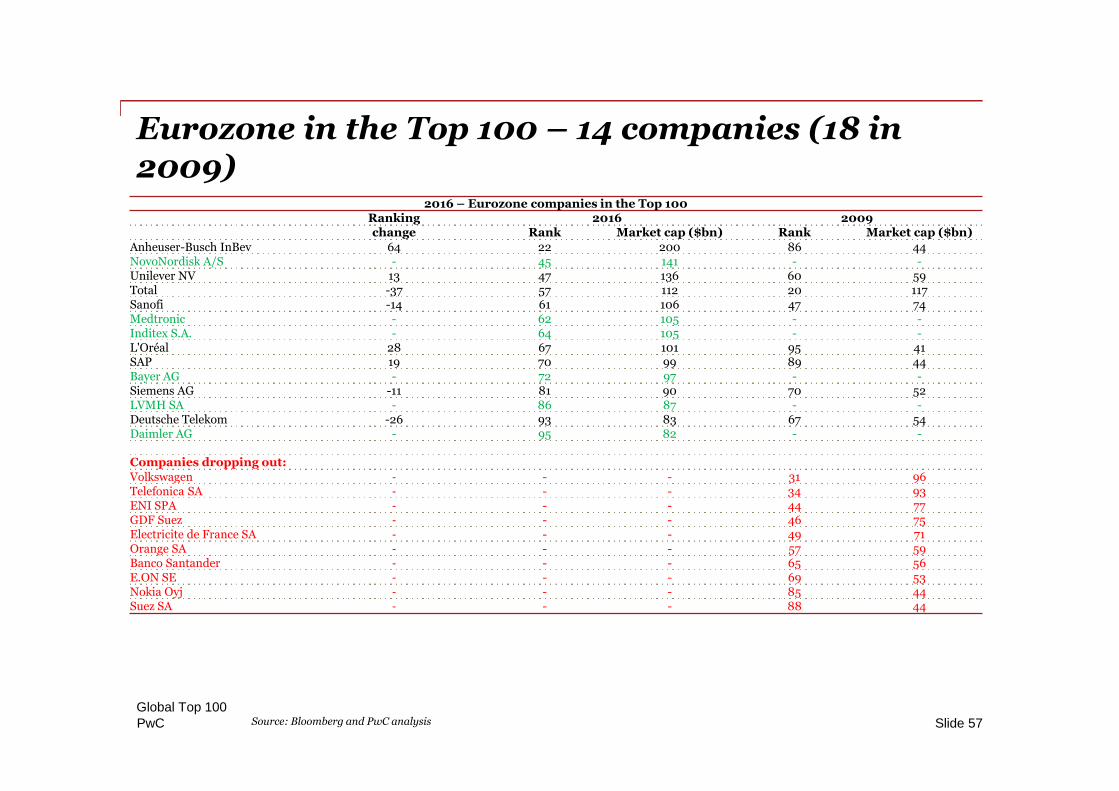
Eurozone in the Top 100 – 14 companies (18 in2009)
Slide 57
2016 – Eurozone companies in the Top 100Ranking 2016 2009change Rank Market cap ($bn) Rank Market cap ($bn)
Anheuser-Busch InBev 64 22 200 86 44NovoNordisk A/S - 45 141 - -Unilever NV 13 47 136 60 59Total -37 57 112 20 117Sanofi -14 61 106 47 74Medtronic - 62 105 - -Inditex S.A. - 64 105 - -L'Oréal 28 67 101 95 41SAP 19 70 99 89 44Bayer AG - 72 97 - -Siemens AG -11 81 90 70 52LVMH SA - 86 87 - -Deutsche Telekom -26 93 83 67 54Daimler AG - 95 82 - -
Companies dropping out:Volkswagen - - - 31 96Telefonica SA - - - 34 93ENI SPA - - - 44 77GDF Suez - - - 46 75Electricite de France SA - - - 49 71Orange SA - - - 57 59Banco Santander - - - 65 56E.ON SE - - - 69 53Nokia Oyj - - - 85 44Suez SA - - - 88 44
Source: Bloomberg and PwC analysis
Global Top 100
PwC
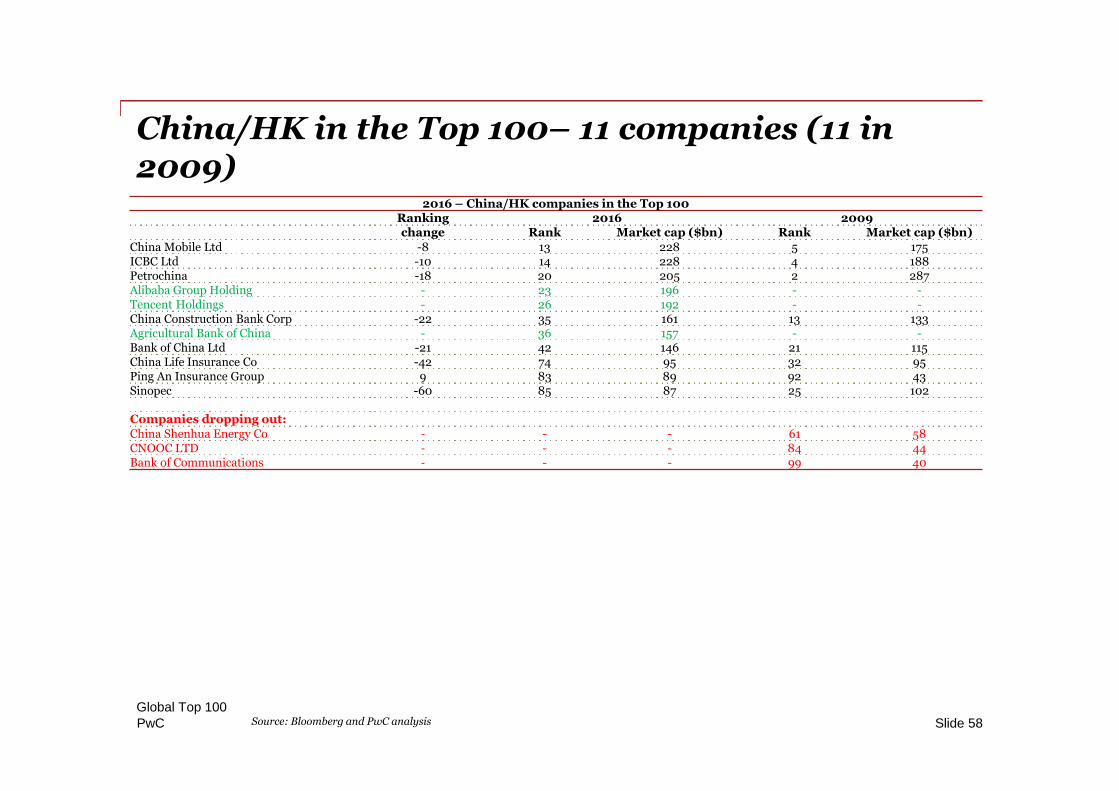
China/HK in the Top 100– 11 companies (11 in2009)
Slide 58
2016 – China/HK companies in the Top 100Ranking 2016 2009change Rank Market cap ($bn) Rank Market cap ($bn)
China Mobile Ltd -8 13 228 5 175ICBC Ltd -10 14 228 4 188Petrochina -18 20 205 2 287Alibaba Group Holding - 23 196 - -Tencent Holdings - 26 192 - -China Construction Bank Corp -22 35 161 13 133Agricultural Bank of China - 36 157 - -Bank of China Ltd -21 42 146 21 115China Life Insurance Co -42 74 95 32 95Ping An Insurance Group 9 83 89 92 43Sinopec -60 85 87 25 102
Companies dropping out:China Shenhua Energy Co - - - 61 58CNOOC LTD - - - 84 44Bank of Communications - - - 99 40
Source: Bloomberg and PwC analysis
Global Top 100
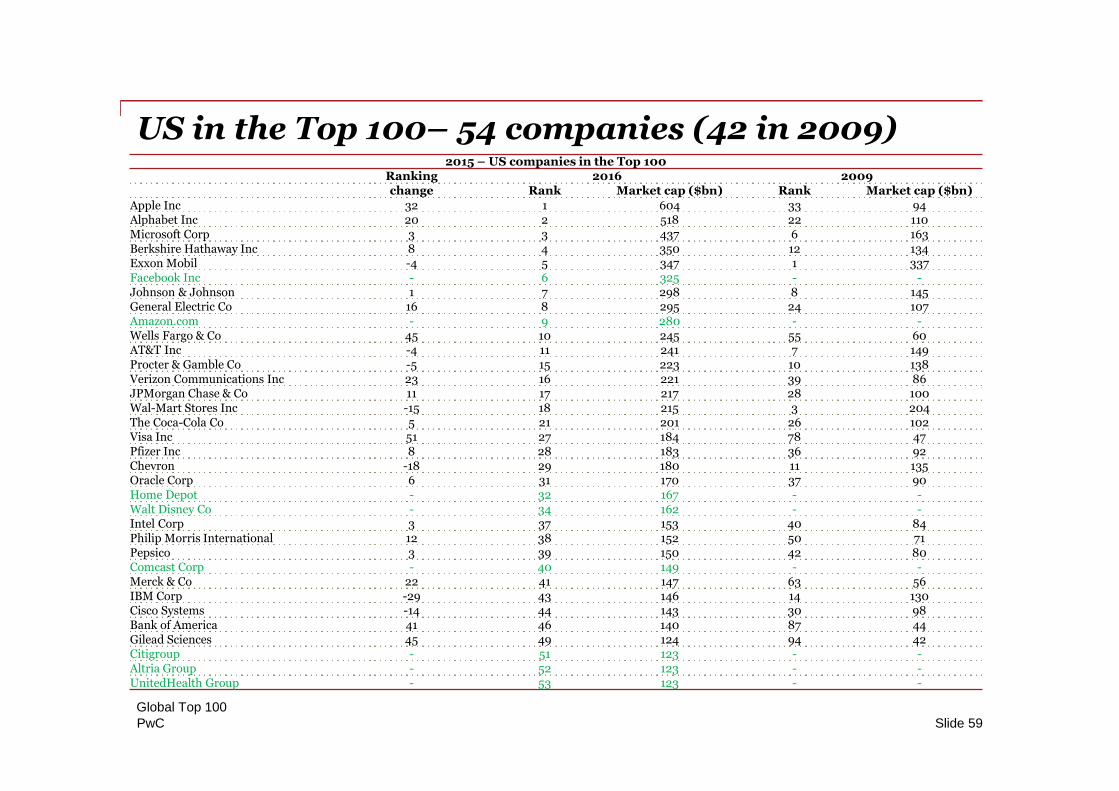
PwC Slide 59
2015 – US companies in the Top 100Ranking 2016 2009change Rank Market cap ($bn) Rank Market cap ($bn)
Apple Inc 32 1 604 33 94Alphabet Inc 20 2 518 22 110Microsoft Corp 3 3 437 6 163Berkshire Hathaway Inc 8 4 350 12 134Exxon Mobil -4 5 347 1 337Facebook Inc - 6 325 - -Johnson & Johnson 1 7 298 8 145General Electric Co 16 8 295 24 107Amazon.com - 9 280 - -Wells Fargo & Co 45 10 245 55 60AT&T Inc -4 11 241 7 149Procter & Gamble Co -5 15 223 10 138Verizon Communications Inc 23 16 221 39 86JPMorgan Chase & Co 11 17 217 28 100Wal-Mart Stores Inc -15 18 215 3 204The Coca-Cola Co 5 21 201 26 102Visa Inc 51 27 184 78 47Pfizer Inc 8 28 183 36 92Chevron -18 29 180 11 135Oracle Corp 6 31 170 37 90Home Depot - 32 167 - -Walt Disney Co - 34 162 - -Intel Corp 3 37 153 40 84Philip Morris International 12 38 152 50 71Pepsico 3 39 150 42 80Comcast Corp - 40 149 - -Merck & Co 22 41 147 63 56IBM Corp -29 43 146 14 130Cisco Systems -14 44 143 30 98Bank of America 41 46 140 87 44Gilead Sciences 45 49 124 94 42Citigroup - 51 123 - -Altria Group - 52 123 - -UnitedHealth Group - 53 123 - -
US in the Top 100– 54 companies (42 in 2009)
Global Top 100
PwC
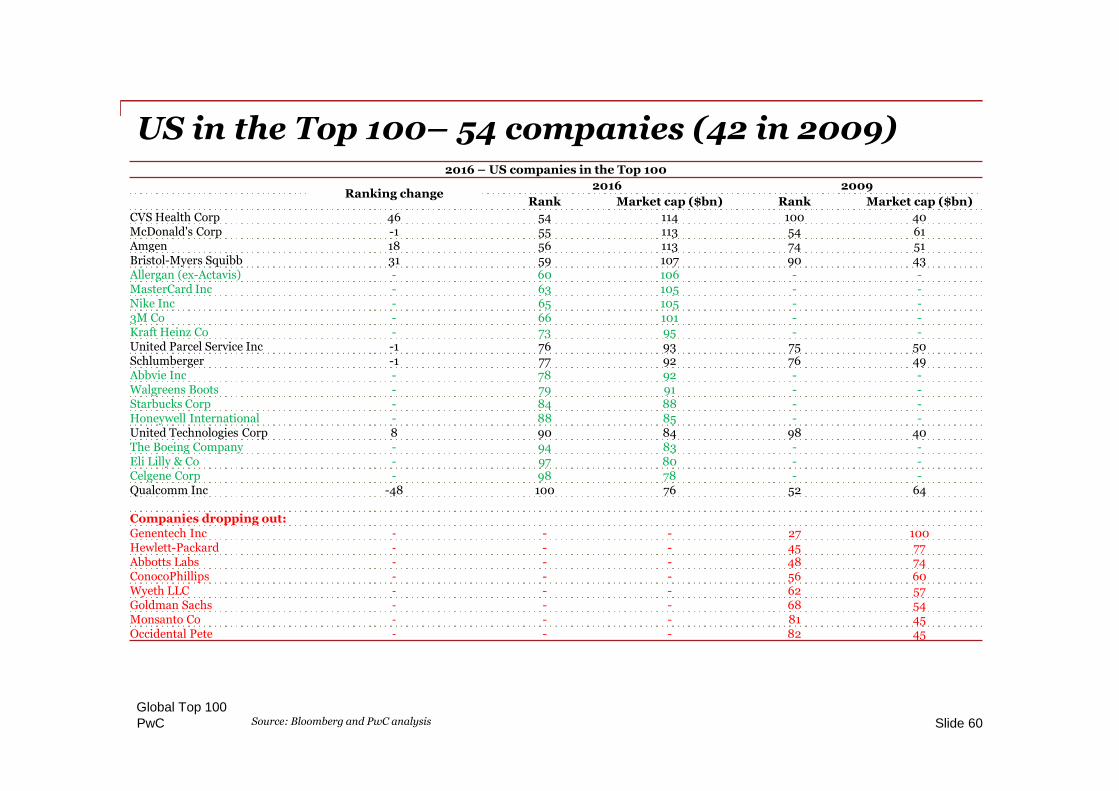
US in the Top 100– 54 companies (42 in 2009)
Slide 60
2016 – US companies in the Top 100
Ranking change2016 2009
Rank Market cap ($bn) Rank Market cap ($bn)
CVS Health Corp 46 54 114 100 40McDonald's Corp -1 55 113 54 61Amgen 18 56 113 74 51Bristol-Myers Squibb 31 59 107 90 43Allergan (ex-Actavis) - 60 106 - -MasterCard Inc - 63 105 - -Nike Inc - 65 105 - -3M Co - 66 101 - -Kraft Heinz Co - 73 95 - -United Parcel Service Inc -1 76 93 75 50Schlumberger -1 77 92 76 49Abbvie Inc - 78 92 - -Walgreens Boots - 79 91 - -Starbucks Corp - 84 88 - -Honeywell International - 88 85 - -United Technologies Corp 8 90 84 98 40The Boeing Company - 94 83 - -Eli Lilly & Co - 97 80 - -Celgene Corp - 98 78 - -Qualcomm Inc -48 100 76 52 64
Companies dropping out:Genentech Inc - - - 27 100Hewlett-Packard - - - 45 77Abbotts Labs - - - 48 74ConocoPhillips - - - 56 60Wyeth LLC - - - 62 57Goldman Sachs - - - 68 54Monsanto Co - - - 81 45Occidental Pete - - - 82 45
Source: Bloomberg and PwC analysis
Global Top 100
PwC
Section 4Post-financial crisis comparison2016 vs. 2009
1) Key movements
2) The industries – Global Top 100 sorted by sector
3) Country/region comparison
4) Complete ranking
Global Top 100Slide 61
PwC
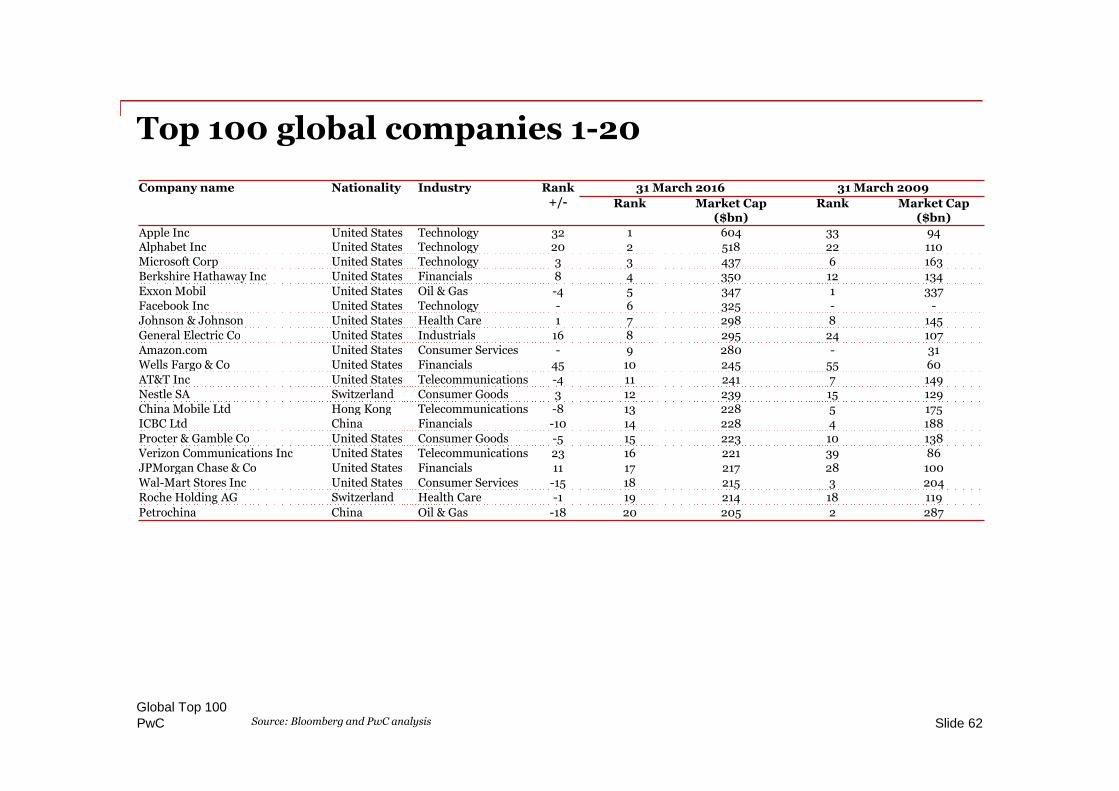
Top 100 global companies 1-20
Slide 62Source: Bloomberg and PwC analysis
Company name Nationality Industry Rank+/-
31 March 2016 31 March 2009
Rank Market Cap($bn)
Rank Market Cap($bn)
Apple Inc United States Technology 32 1 604 33 94Alphabet Inc United States Technology 20 2 518 22 110Microsoft Corp United States Technology 3 3 437 6 163Berkshire Hathaway Inc United States Financials 8 4 350 12 134Exxon Mobil United States Oil & Gas -4 5 347 1 337Facebook Inc United States Technology - 6 325 - -Johnson & Johnson United States Health Care 1 7 298 8 145General Electric Co United States Industrials 16 8 295 24 107Amazon.com United States Consumer Services - 9 280 - 31Wells Fargo & Co United States Financials 45 10 245 55 60AT&T Inc United States Telecommunications -4 11 241 7 149Nestle SA Switzerland Consumer Goods 3 12 239 15 129China Mobile Ltd Hong Kong Telecommunications -8 13 228 5 175ICBC Ltd China Financials -10 14 228 4 188Procter & Gamble Co United States Consumer Goods -5 15 223 10 138Verizon Communications Inc United States Telecommunications 23 16 221 39 86JPMorgan Chase & Co United States Financials 11 17 217 28 100Wal-Mart Stores Inc United States Consumer Services -15 18 215 3 204Roche Holding AG Switzerland Health Care -1 19 214 18 119
Petrochina China Oil & Gas -18 20 205 2 287
Global Top 100

PwC
Top 100 global companies 21-40
Slide 63Source: Bloomberg and PwC analysis
Company name Nationality Industry Rank+/-
31 March 2016 31 March 2009
Rank Market Cap($bn)
Rank Market Cap($bn)
The Coca-Cola Co United States Consumer Goods 5 21 201 26 102Anheuser-Busch InBev Belgium Consumer Goods 64 22 200 86 44Alibaba Group Holding China Consumer Services - 23 196 - -Royal Dutch Shell United KingdomOil & Gas -15 24 195 9 139Novartis AG Switzerland Health Care 4 25 195 29 100Tencent Holdings China Technology - 26 192 - 13Visa Inc United States Financials 51 27 184 78 47Pfizer Inc United States Health Care 8 28 183 36 92Chevron United States Oil & Gas -18 29 180 11 135Toyota Motor Japan Consumer Goods -7 30 177 23 108Oracle Corp United States Technology 6 31 170 37 90Home Depot United States Consumer Services - 32 167 - 40Samsung Electronics South Korea Consumer Goods 20 33 167 53 61Walt Disney Co United States Consumer Services - 34 162 - 34China Construction Bank Corp China Financials -22 35 161 13 133Agricultural Bank of China China Financials - 36 157 - -Intel Corp United States Technology 3 37 153 40 84Philip Morris International United States Consumer Goods 12 38 152 50 71Pepsico United States Consumer Goods 3 39 150 42 80
Comcast Corp United States Consumer Services - 40 149 - 39
Global Top 100
PwC
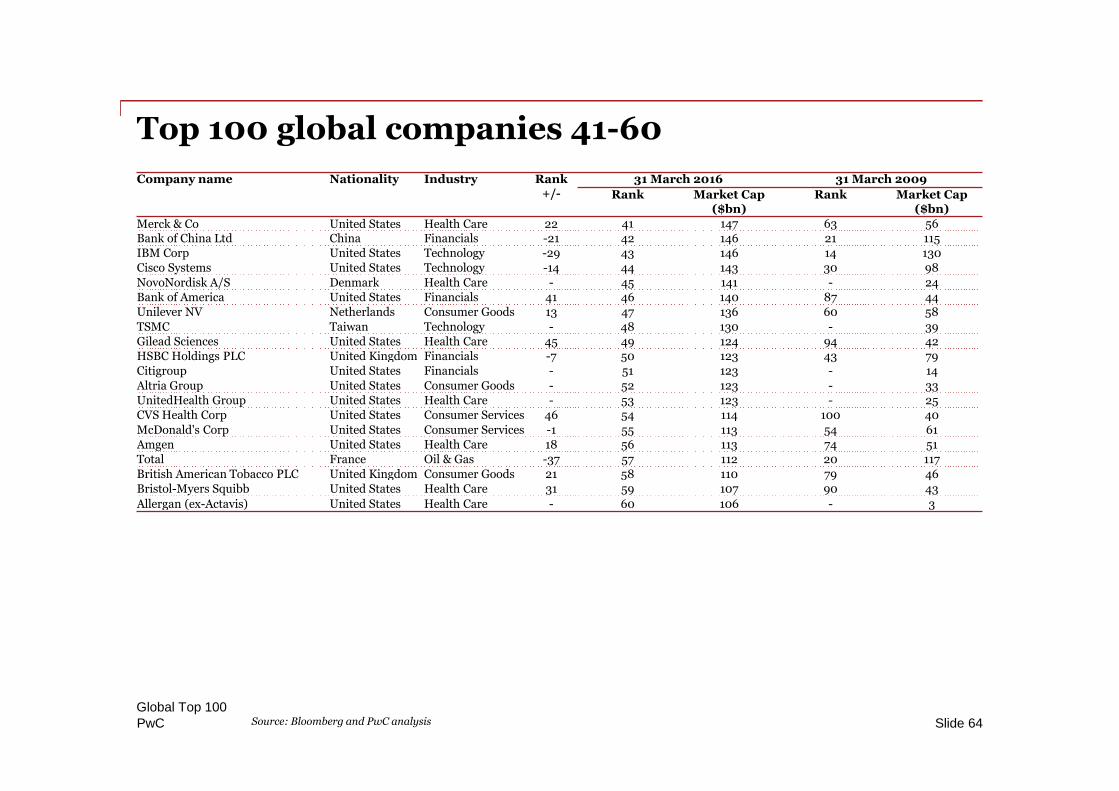
Top 100 global companies 41-60
Slide 64Source: Bloomberg and PwC analysis
Company name Nationality Industry Rank+/-
31 March 2016 31 March 2009
Rank Market Cap($bn)
Rank Market Cap($bn)
Merck & Co United States Health Care 22 41 147 63 56Bank of China Ltd China Financials -21 42 146 21 115IBM Corp United States Technology -29 43 146 14 130Cisco Systems United States Technology -14 44 143 30 98NovoNordisk A/S Denmark Health Care - 45 141 - 24Bank of America United States Financials 41 46 140 87 44Unilever NV Netherlands Consumer Goods 13 47 136 60 58TSMC Taiwan Technology - 48 130 - 39Gilead Sciences United States Health Care 45 49 124 94 42HSBC Holdings PLC United Kingdom Financials -7 50 123 43 79Citigroup United States Financials - 51 123 - 14Altria Group United States Consumer Goods - 52 123 - 33UnitedHealth Group United States Health Care - 53 123 - 25CVS Health Corp United States Consumer Services 46 54 114 100 40McDonald's Corp United States Consumer Services -1 55 113 54 61Amgen United States Health Care 18 56 113 74 51Total France Oil & Gas -37 57 112 20 117British American Tobacco PLC United Kingdom Consumer Goods 21 58 110 79 46Bristol-Myers Squibb United States Health Care 31 59 107 90 43
Allergan (ex-Actavis) United States Health Care - 60 106 - 3
Global Top 100
PwC
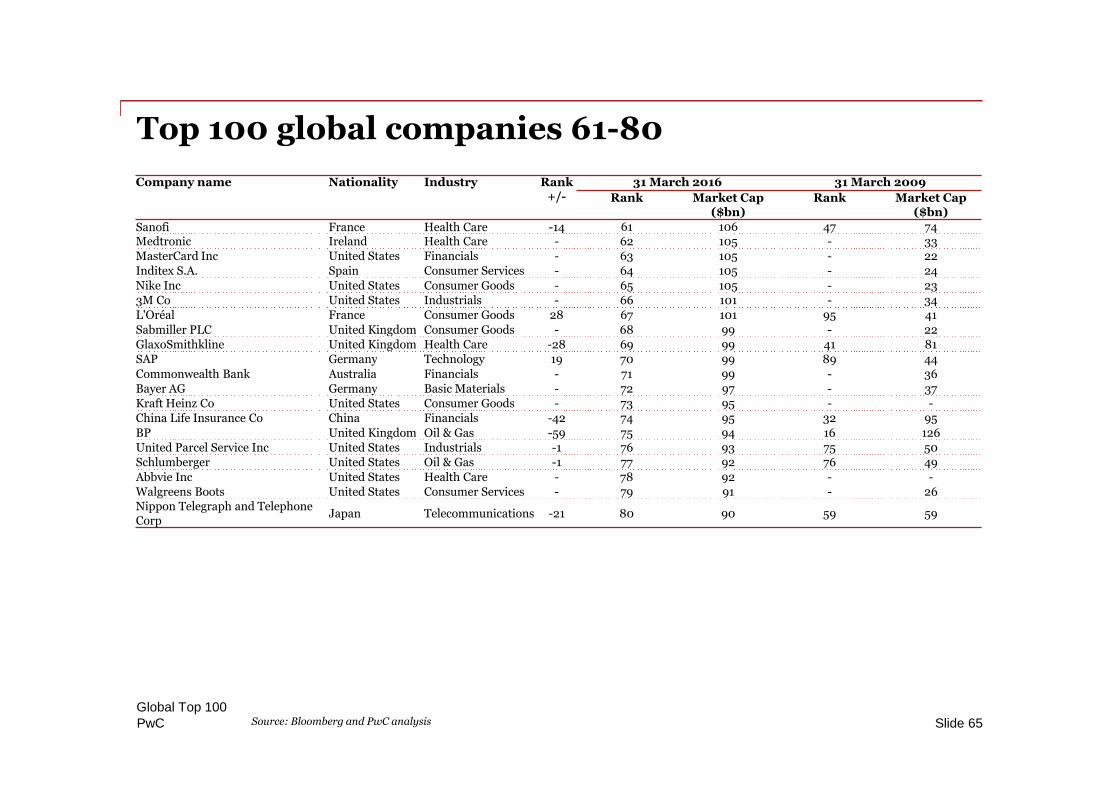
Top 100 global companies 61-80
Slide 65Source: Bloomberg and PwC analysis
Company name Nationality Industry Rank+/-
31 March 2016 31 March 2009
Rank Market Cap($bn)
Rank Market Cap($bn)
Sanofi France Health Care -14 61 106 47 74Medtronic Ireland Health Care - 62 105 - 33MasterCard Inc United States Financials - 63 105 - 22Inditex S.A. Spain Consumer Services - 64 105 - 24Nike Inc United States Consumer Goods - 65 105 - 233M Co United States Industrials - 66 101 - 34L'Oréal France Consumer Goods 28 67 101 95 41Sabmiller PLC United Kingdom Consumer Goods - 68 99 - 22GlaxoSmithkline United Kingdom Health Care -28 69 99 41 81SAP Germany Technology 19 70 99 89 44Commonwealth Bank Australia Financials - 71 99 - 36Bayer AG Germany Basic Materials - 72 97 - 37Kraft Heinz Co United States Consumer Goods - 73 95 - -China Life Insurance Co China Financials -42 74 95 32 95BP United Kingdom Oil & Gas -59 75 94 16 126United Parcel Service Inc United States Industrials -1 76 93 75 50Schlumberger United States Oil & Gas -1 77 92 76 49Abbvie Inc United States Health Care - 78 92 - -Walgreens Boots United States Consumer Services - 79 91 - 26Nippon Telegraph and TelephoneCorp
Japan Telecommunications -21 80 90 59 59
Global Top 100
PwC
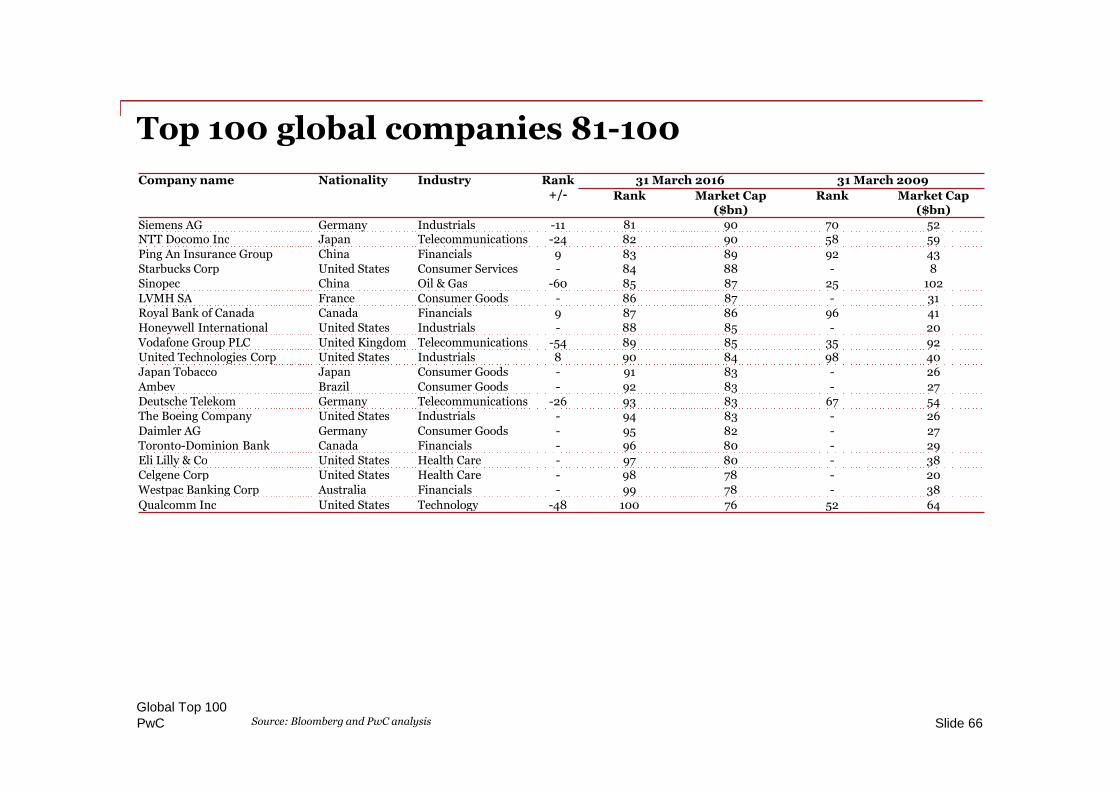
Top 100 global companies 81-100
Slide 66Source: Bloomberg and PwC analysis
Company name Nationality Industry Rank+/-
31 March 2016 31 March 2009
Rank Market Cap($bn)
Rank Market Cap($bn)
Siemens AG Germany Industrials -11 81 90 70 52NTT Docomo Inc Japan Telecommunications -24 82 90 58 59Ping An Insurance Group China Financials 9 83 89 92 43Starbucks Corp United States Consumer Services - 84 88 - 8Sinopec China Oil & Gas -60 85 87 25 102LVMH SA France Consumer Goods - 86 87 - 31Royal Bank of Canada Canada Financials 9 87 86 96 41Honeywell International United States Industrials - 88 85 - 20Vodafone Group PLC United Kingdom Telecommunications -54 89 85 35 92United Technologies Corp United States Industrials 8 90 84 98 40Japan Tobacco Japan Consumer Goods - 91 83 - 26Ambev Brazil Consumer Goods - 92 83 - 27Deutsche Telekom Germany Telecommunications -26 93 83 67 54The Boeing Company United States Industrials - 94 83 - 26Daimler AG Germany Consumer Goods - 95 82 - 27Toronto-Dominion Bank Canada Financials - 96 80 - 29Eli Lilly & Co United States Health Care - 97 80 - 38Celgene Corp United States Health Care - 98 78 - 20Westpac Banking Corp Australia Financials - 99 78 - 38
Qualcomm Inc United States Technology -48 100 76 52 64
Global Top 100
PwC
This publication has been prepared for general guidance on matters of interest only, and does not constitute professional advice. You should not act upon theinformation contained in this publication without obtaining specific professional advice. No representation or warranty (express or implied) is given as to theaccuracy or completeness of the information contained in this publication, and, to the extent permitted by law, PricewaterhouseCoopers LLP, its members,employees and agents do not accept or assume any liability, responsibility or duty of care for any consequences of you or anyone else acting, or refraining toact, in reliance on the information contained in this publication or for any decision based on it.
© 2016 PricewaterhouseCoopers LLP. All rights reserved. In this document, “PwC” refers to PricewaterhouseCoopers LLP (a limited liability partnership in theUnited Kingdom) which is a member firm of PricewaterhouseCoopers International Limited, each member firm of which is a separate legal entity.