Global Technology, Media and Telecom (TMT) M&A Quarterly · Scalar Decisions. Value not disclosed....
20
Global Technology, Media and Telecom (TMT) M&A Quarterly Q1’2019
Transcript of Global Technology, Media and Telecom (TMT) M&A Quarterly · Scalar Decisions. Value not disclosed....
Global Technology, Media and Telecom (TMT) M&A QuarterlyQ1’2019

©2019 KPMG Corporate Finance, a Delaware limited liability company. Member FINRA and SIPC. KPMG CorporateFinance is a subsidiary of KPMG LLP, a Delaware limited liability partnership and the U.S. member firm of the KPMGnetwork of independent member firms affiliated with KPMG International Cooperative (“KPMG International”), a Swiss entity.All rights reserved. NDPPS 640221
2
Selected Recent Transactions (1)
2014-2018 Advisor Rankings(3) # of Deals
1. KPMG(1) 2,260
2. PwC 2,066
3. Ernst & Young LLP 1,426
4. Rothschild & Co. 1,402
5. Deloitte 1,393
6. Houlihan Lokey 1,274
7. BDO 1,100
8. Lazard 922
9. IMAP 854
10. Oaklins 832
Source: Thomson Reuters SDC
(1) Represents the Corporate Finance practices of KPMG International’s network of independent member firms.(2) Using conversion rate as on transaction announcement date.(3) League tables include completed deals which have value between $0 to $500mm and also where deal value is not disclosed.
2018 Advisor Rankings(3) # of Deals
1. KPMG(1) 464
2. PwC 365
3. Deloitte 339
4. Rothschild & Co. 313
5. Houlihan Lokey 261
6. Ernst & Young LLP 235
7. BDO 229
8. Lazard 201
9. Sumitomo Mitsui Financial 184
10. Oaklins 173
Co
mm
un
icat
ion
Tec
hn
olo
gy
and
Ele
ctro
nic
sIT
Ser
vice
s an
d B
PO
Inte
rnet
an
d M
edia
So
ftw
are
2018 TMT Advisor Rankings(3) # of Deals
1. KPMG(1) 70
2. Deloitte 62
3. BDO 53
4. PwC 52
5. Raymond James Financial 51
6. Rothschild & Co. 48
7. Ernst & Young LLP 47
8. Oaklins 46
9. Houlihan Lokey 44
10. Sumitomo Mitsui Financial 38
KPMG CF Sweden
Vitruvian Partners
Value not disclosedDecember 2017
advised Vitruvian Partners on its acquisition of The EasyPark Group
KPMG CF United States
TRS Technologies
Value not disclosedJanuary 2018
advised TRS Technologies, Inc. on its sale to Tayca Corporation
KPMG CF United Kingdom
GCI
$264.2 millionMay 2018
advised GCI on its sale to Mayfair Equity Partners
KPMG CF United States
BCM One
Value not disclosedJanuary 2019
advised BCM One on its sale to Thompson Street Capital Partners
KPMG CF United Kingdom
Ink
Value not disclosedOctober 2018
advised the shareholders of Volanti Media (Holdings) Limited (Ink) on its sale to The
Stagwell Group
KPMG CF Netherlands
TVcN
Value not disclosedJanuary 2019
advised ManpowerGroup Netherlands B.V. on the sale of TVcN B.V. to Opportunity
Partners
KPMG CF Netherlands
ProActiveSoftware
Value not disclosedNovember 2018
advised ProActive Software on its sale to Visma Group
KPMG CF United States & Japan
ReachLocal Japan
Value not disclosedSeptember 2018
advised ReachLocal Japan on its sale to New Horizon Capital
KPMG CF United States
Ubisense
USD 44.8 million(2)
December 2018
advised Ubisense on the sale of its SmartSpace division to Investcorp
Technology Partners
KPMG CF United States
CTM Software
Value not disclosedFebruary 2019
on its sale to MRI Software, a portfolio company of GI Partners and TA Associates
KPMG CF Italy
TA Associates /List Group S.P.A.
Value not disclosedJanuary 2019
advised TA Associates (UK) on their investment in List Group S.P.A.
KPMG CF Canada
Scalar Decisions
Value not disclosedJanuary 2019
advised Scalar Decisions on its sale to CDW Canada Inc.
KPMG CF United States
BeneSys
Value not disclosedOctober 2018
advised BeneSys on its sale from The Riverside Company to Tenex Capital
Management
KPMG CF Finland
NordcloudSolutions Oy
USD 22.7 millionJanuary 2019
advised Nordcloud Solutions Oy on its funding round from new investors
Finnvera plc and OP Yrityspankki Oy
KPMG CF United Kingdom
Mind Tools
Value not disclosedMarch 2019
advised Mind Tools its sale to Emerald Group Publishing Limited
KPMG CF United Kingdom
Flyt
USD 28.5 millionJanuary 2019
advised Flyt Limited on the sale to Just Eat Plc

©2019 KPMG Corporate Finance, a Delaware limited liability company. Member FINRA and SIPC. KPMG CorporateFinance is a subsidiary of KPMG LLP, a Delaware limited liability partnership and the U.S. member firm of the KPMGnetwork of independent member firms affiliated with KPMG International Cooperative (“KPMG International”), a Swiss entity.All rights reserved. NDPPS 640221
3
KPMG CF Transaction Spotlight
Overview: BCM One is a leading managed technology solutions provider offering businesses
a one-stop-shop for any technology needs. KPMG CF acted as the exclusive financial advisor to BCM One in its sale to
Thompson Street Capital Partners, working closely with the management team andshareholders throughout the process, including providing advisory expertise andmanaging the marketing, negotiation, and due diligence phases of the transaction.
Engagement: KPMG CF ran a thorough marketing process to position BCM One to a group of
acquirers who would understand BCM One’s industry and the growth potentialwith the right partner.
KPMG CF ultimately negotiated the sale of BCM One to Thompson Street CapitalPartners, a St Louis-based private equity fund with substantial experience intechnology managed services.
“KPMG CF was a long-term crucial partner to BCM One. We originally got to knowthe team nearly five years ago, and during that time period, before we had evendecided to run a process, they provided sage guidance, thoughtful counsel andtremendous effort. Once we officially kicked off, they were efficient and focused,and brought to the table potential suitors we had never heard of – in the end theyfound us the best potential strategic partner on the best possible terms. I wouldhighly recommend them to any founding team.”
- John Cunningham, Co-Founder & Co-CEO, BCM One
Overview: KPMG Corporate Finance (“KPMG CF”) acted as the exclusive financial advisor to
CTM Software on its sale to MRI Software, a portfolio company of GI Partners and TAAssociates.
CTM Software is a provider of real estate workflow SaaS solutions, enablingresidential real estate agents across Colorado to streamline the real estatetransaction process.
MRI Software LLC provides real estate software applications and hosted solutions.The company’s products offering includes financials suite, commercial suite,residential suite, investment suite, corporate real estate, facilities management,and reporting and analytics.
Engagement: The acquisition expands MRI’s global residential real estate business for sales,
rentals and property management and enhances the company’s capabilities indocument management workflow and electronic signature solutions.
Value not disclosedJanuary 2019
Acted as the lead financial advisor to
Value not disclosedFebruary 2019
Has been acquired by
A portfolio company of
SellerBuyer
Buyer Seller
on its sale to

©2019 KPMG Corporate Finance, a Delaware limited liability company. Member FINRA and SIPC. KPMG CorporateFinance is a subsidiary of KPMG LLP, a Delaware limited liability partnership and the U.S. member firm of the KPMGnetwork of independent member firms affiliated with KPMG International Cooperative (“KPMG International”), a Swiss entity.All rights reserved. NDPPS 640221
4
TMT Country Spotlight: KPMG RussiaKey trends in TMT market in Russia
• M&A deal activity in Russia grew from 552 deals in 2017 to 652 in 2018, representing year-over-year growth of 18%.
• Strategic players continue to aggressively look for new technologies to differentiate their offerings
• We continue to see the emergence of strategic VC funds by the largest Russian companies looking to invest in next generation technologies (e.g. RDIF, MTS, Sistema, Sberbank, Gazprombank).
• Government institutions are working towards building conducive investment environments, by proactively developing investment funds and providing grants for early-stage technology companies (RVC, IIDF, Skolkovo).
Recent Transactions
Assistance to the international investment fund during the planned acquisition of the high
tech start up
FosunDeal Advisory
2018
Acting as a financial adviser for Opportunity to acquire a global provider
of advanced satellite networking solutions
Project Gemini
Ongoing
Deal Advisory
Acting as financial adviser for a merger of three companies in the
gaming segment
Project Andromeda
Ongoing
Deal Advisory
Pre-investment study of Tekhnoserv
VTB
2018
Deal Advisory
Advised shareholders of a leading outsourced contact center service provider in Russia, on sale of the business
VB PartnersDeal Advisory
2018
Advised on potential acquisition of Jolla/Sailfish
Rostelecom
2017
Deal Advisory
Financial and tax due diligence of an
automated cashpoints business
MTS
2017
Deal Advisory
Advised Vympelcom on a potential acquisition of
local internet provider
Vimpel-Communications
2017
Deal Advisory
Financial due diligence of Mail.Ru group
MegaFon
2017
Deal Advisory
US$740 million
Determination of an indicative market value range of 100% equity
stake of one of the largest online marketplaces
SberbankDeal Advisory
2017
Key TMT Team MembersKPMG’s Deal Advisory team has deep local experience in TMT sector
$79.5$100.9
$79.0
$52.0$64.8 $55.3 $51.7
$56.0 $14.4
$11.3
334
333
621
470 482552
652
2012 2013 2014 2015 2016 2017 2018
Mega deals (US$10bn+)Agg. Value (exc. mega-deals)Number of Deals
Maxim FilippovPartner, M&A14+ years of M&A experience
Gurgen AgamianAssociate Director, M&A
Vladimir FomichenkoDirector, Transaction Services (TS)16+ years in TS, integration & audit
Ekaterina KashlyukManager, M&A

©2019 KPMG Corporate Finance, a Delaware limited liability company. Member FINRA and SIPC. KPMG CorporateFinance is a subsidiary of KPMG LLP, a Delaware limited liability partnership and the U.S. member firm of the KPMGnetwork of independent member firms affiliated with KPMG International Cooperative (“KPMG International”), a Swiss entity.All rights reserved. NDPPS 640221
5
• In Q1’19, global TMT M&A transaction volume reached $170B across 2,110 deals, representing year-over-year declines of -40% and -25%, respectively.
• Middle market M&A activity (<$500 million) was also down year-over-year, with aggregate deal valuedown to $38.1 billion in Q1’19 compared to $43.9 billion in Q1’18.
• Despite the year-over-year decline, private equity dry powder remains at an all-time high.Furthermore, strategic buyers continue to pay premium multiples for differentiated technology.Based on the aforementioned, we expect 2019 M&A activity to strengthen for the remainder of theyear.
• The largest Q1’19 deal announced was FIS’ $35B acquisition of Worldpay (EV/LTM revenue multiple:10.9x). Upon closing, this transaction will represent the largest payment deal of all time. Furtherlegacy consolidation is expected in the payments industry due to increased competition from newcloud solutions coming to market.
Global TMT Sector M&A Activity
Sub-sector M&A activity
IT Services and BPO (2)
Internet and Media (3) Software (4)
Sources: Thomson One and other publicly available information.
Notes: We have sourced the sub-sector classifications from Thomson One as below:(1) Communications Technology and Electronics: Computers & Peripherals; Electronics; Semiconductors; Space and Satellites; Telecommunications Equipment;
Telecommunications Services; Wireless; and Other Telecom.(2) IT Services and BPO: Companies/targets with primary industry classification as IT Consulting & Services.(3) Internet and Media: Advertising & Marketing; Broadcasting; Cable; Casinos & Gaming; E-commerce / B2B; Internet and Catalog Retailing; Internet Infrastructure;
Motion Pictures / Audio Visual; Publishing ; and Other Media & Entertainment.(4) Software: Companies/targets with primary industry classification as Internet Software & Services; Software; and Other High Technology.(5) Deal Values are based on transactions with disclosed deal values only.
(Aggregate values in $ billions) (5)
Value # of Deals Value
Q1’19 $46.2 483 $10.2 468
Q1’18
# of Deals
$71.9 618 $10.7 595
Total Deals <$500 mm Deals
Value # of Deals Value
Q1’19 $11.2 416 $6.6 412
Q1’18
# of Deals
$30.2 483 $8.0 473
Total Deals <$500 mm Deals
Value # of Deals Value
Q1’19 $34.2 520 $8.7 506
Q1’18
# of Deals
$147.8 750 $11.9 730
Total Deals <$500 mm Deals
Value # of Deals Value
Q1’19 $78.1 691 $12.5 675
Q1’18
# of Deals
$30.6 926 $13.3 916
Total Deals <$500 mm Deals
Communications Technology and Electronics (1)

©2019 KPMG Corporate Finance, a Delaware limited liability company. Member FINRA and SIPC. KPMG CorporateFinance is a subsidiary of KPMG LLP, a Delaware limited liability partnership and the U.S. member firm of the KPMGnetwork of independent member firms affiliated with KPMG International Cooperative (“KPMG International”), a Swiss entity.All rights reserved. NDPPS 640221
6
$174.1 $208.1
$267.8
$104.7 $107.4 $149.1
$252.3 $280.4 $320.8
$227.1 $200.2 $169.6
2,2672,115
2,233 2,3292,458 2,472 2,435
2,777 2,6782,589
2,556
2,110
0
500
1,000
1,500
2,000
2,500
3,000
3,500
$0.0
$100.0
$200.0
$300.0
$400.0
$500.0
Q2'16 Q3'16 Q4'16 Q1'17 Q2'17 Q3'17 Q4'17 Q1'18 Q2'18 Q3'18 Q4'18 Q1'19
Deal V
olum
eD
eal V
alu
e ($
bn
)
Deal Value ($ bn) Deal Volume
$31.5 $27.2
$35.7 $33.4 $33.9 $39.1 $38.6
$43.9 $41.8 $47.6 $50.0
$38.1
2,2072,063
2,1812,289
2,412 2,430 2,381
2,7142,613
2,545 2,497
2,061
0
500
1,000
1,500
2,000
2,500
3,000
$0.0
$10.0
$20.0
$30.0
$40.0
$50.0
Q2'16 Q3'16 Q4'16 Q1'17 Q2'17 Q3'17 Q4'17 Q1'18 Q2'18 Q3'18 Q4'18 Q1'19
Deal V
olumeD
eal V
alue
($
bn)
Deal Value ($ bn) Deal Volume
88.5% 88.8% 90.6% 89.2% 87.3% 87.2% 88.7% 87.9% 88.4% 87.5% 88.0% 88.5%
11.5% 11.2% 9.4% 10.8% 12.7% 12.8% 11.3% 12.1% 11.6% 12.5% 12.0% 11.5%
0%
20%
40%
60%
80%
100%
Q2'16 Q3'16 Q4'16 Q1'17 Q2'17 Q3'17 Q4'17 Q1'18 Q2'18 Q3'18 Q4'18 Q1'19
Dea
l Vol
ume
(%)
Strategic Buyers Financial Buyers
(1) Based on deals with disclosed deal values only.
Q1’19Change (%) Deal Value # of DealsYoY (39.5)% (24.0%)
QoQ (15.3%) (17.4%)
Global TMT M&A Trend: Q2’16 – Q1’19
Global TMT M&A Trend by Buyer Type: Q2’16 – Q1’19
Global TMT Mid-Market M&A Trend (<$500 mm) (1): Q2’16 – Q1’19
Source: Thomson One

©2019 KPMG Corporate Finance, a Delaware limited liability company. Member FINRA and SIPC. KPMG CorporateFinance is a subsidiary of KPMG LLP, a Delaware limited liability partnership and the U.S. member firm of the KPMGnetwork of independent member firms affiliated with KPMG International Cooperative (“KPMG International”), a Swiss entity.All rights reserved. NDPPS 640221
7
32 32
2725
2018
15 15 15 15
ThomaBravo
Vista EquityPartners
TAAssociates
InsightVenturePartners
ProvidenceEquity
Partners
HgCapital Accel-KKR H.I.G.Capital
The CarlyleGroup
MarlinEquity
Partners
23
13 13
11 1110 10
9 9
6
Accenture Microsoft Dentsu Aegis Alphabet Apple Siemens Ebix Hexagon Oracle Cisco
Note: 1. PE deals include bolt-on acquisitions to existing portfolio companies.Source: 451 Research
Top 10 Active Global TMT Strategic Buyers: TTM Q1’19
Top 10 Active Global TMT Financial Buyers: TTM Q1’19 (1)
Number of acquisitions in the period
Number of acquisitions in the period
©2019 KPMG Corporate Finance, a Delaware limited liability company. Member FINRA and SIPC. KPMG CorporateFinance is a subsidiary of KPMG LLP, a Delaware limited liability partnership and the U.S. member firm of the KPMGnetwork of independent member firms affiliated with KPMG International Cooperative (“KPMG International”), a Swiss entity.All rights reserved. NDPPS 640221
8
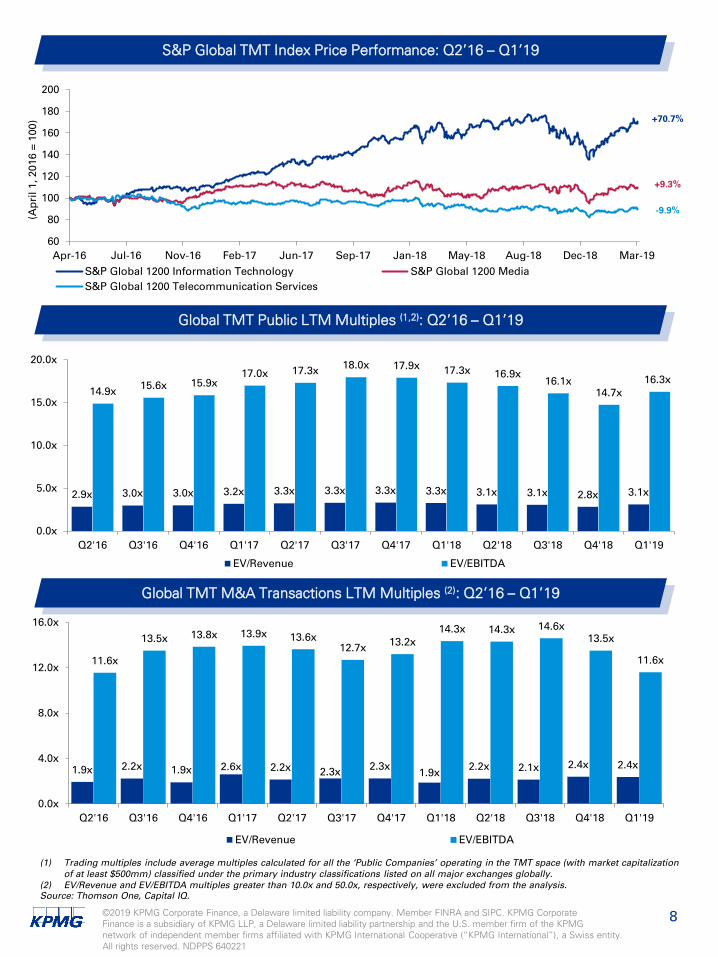
2.9x 3.0x 3.0x 3.2x 3.3x 3.3x 3.3x 3.3x 3.1x 3.1x 2.8x 3.1x
14.9x 15.6x 15.9x17.0x 17.3x 18.0x 17.9x 17.3x 16.9x
16.1x14.7x
16.3x
0.0x
5.0x
10.0x
15.0x
20.0x
Q2'16 Q3'16 Q4'16 Q1'17 Q2'17 Q3'17 Q4'17 Q1'18 Q2'18 Q3'18 Q4'18 Q1'19
EV/Revenue EV/EBITDA
1.9x 2.2x 1.9x 2.6x 2.2x 2.3x 2.3x 1.9x 2.2x 2.1x 2.4x 2.4x
11.6x
13.5x 13.8x 13.9x 13.6x 12.7x 13.2x
14.3x 14.3x 14.6x 13.5x
11.6x
0.0x
4.0x
8.0x
12.0x
16.0x
Q2'16 Q3'16 Q4'16 Q1'17 Q2'17 Q3'17 Q4'17 Q1'18 Q2'18 Q3'18 Q4'18 Q1'19
EV/Revenue EV/EBITDA
60
80
100
120
140
160
180
200
Apr-16 Jul-16 Nov-16 Feb-17 Jun-17 Sep-17 Jan-18 May-18 Aug-18 Dec-18 Mar-19
(Ap
ril 1
, 201
6 =
100)
S&P Global 1200 Information Technology S&P Global 1200 MediaS&P Global 1200 Telecommunication Services
+9.3%
S&P Global TMT Index Price Performance: Q2’16 – Q1’19
Global TMT Public LTM Multiples (1,2): Q2’16 – Q1’19
Global TMT M&A Transactions LTM Multiples (2): Q2’16 – Q1’19
Source: Thomson One, Capital IQ.
(1) Trading multiples include average multiples calculated for all the ‘Public Companies’ operating in the TMT space (with market capitalization of at least $500mm) classified under the primary industry classifications listed on all major exchanges globally.
(2) EV/Revenue and EV/EBITDA multiples greater than 10.0x and 50.0x, respectively, were excluded from the analysis.
+70.7%
-9.9%

©2019 KPMG Corporate Finance, a Delaware limited liability company. Member FINRA and SIPC. KPMG CorporateFinance is a subsidiary of KPMG LLP, a Delaware limited liability partnership and the U.S. member firm of the KPMGnetwork of independent member firms affiliated with KPMG International Cooperative (“KPMG International”), a Swiss entity.All rights reserved. NDPPS 640221
9
Market Data Operating Metrics Valuation Multiples$ value millions, except per share Quarter
EndingSharePrice
% of 52Week High
Market Cap. (1)
EnterpriseValue (2)
Revenue Revenue Growth%LTM
GrossLTM
EBITDA EV / Revenue EV / EBITDA(3)
Company Name LTM 2019E 2020E 2018 – 19E 2019E – 20E Margin% Margin% LTM 2019E 2020E LTM 2019E 2020E
Communication Services
Verizon Dec-18 $59.13 96.0% $244,207 $356,967 $130,863 $132,205 $134,034 0.9% 1.4% 57.8% 40.2% 2.7x 2.7x 2.7x 6.8x 7.3x 7.2x
AT&T Dec-18 $31.36 86.2% $228,445 $412,135 $170,756 $183,918 $184,669 7.4% 0.4% 53.5% 33.4% 2.4x 2.2x 2.2x 7.2x 6.8x 6.8x
China Mobile Dec-18 $10.19 91.2% $208,669 $147,426 $107,132 $112,610 $116,850 3.9% 3.8% 68.0% 37.0% 1.4x 1.3x 1.3x 3.7x 3.4x 3.4x
Deutsche Telekom Dec-18 $16.62 93.3% $78,795 $158,609 $89,441 $87,832 $89,820 2.0% 2.3% 31.5% 28.1% 1.8x 1.8x 1.8x 6.3x 5.8x 5.6x
NTT Dec-18 $42.44 86.3% $81,379 $135,669 $107,988 $106,571 $106,484 NA (0.1%) 51.4% 26.7% 1.3x 1.3x 1.3x 4.7x 4.8x 4.8x
Vodafone Sep-18 $1.82 65.1% $49,548 $87,871 $52,622 $50,840 $51,609 (3.9%) 1.5% 30.0% 26.5% 1.7x 1.7x 1.7x 6.3x 5.4x 5.2x
Orange Dec-18 $16.27 95.1% $43,163 $75,627 $47,379 $46,631 $47,014 (1.2%) 0.8% 38.1% 29.0% 1.6x 1.6x 1.6x 5.5x 5.2x 5.1x
Telefónica Dec-18 $8.38 88.1% $42,975 $106,900 $56,684 $54,327 $55,062 (2.1%) 1.4% 58.9% 30.1% 1.9x 2.0x 1.9x 6.3x 6.1x 5.9x
SingTel Dec-18 $2.23 84.4% $36,388 $43,756 $12,886 $12,848 $13,002 1.5% 1.2% 28.7% 27.3% 3.4x 3.4x 3.4x 12.4x 12.2x 12.2x
Telstra Dec-18 $2.36 97.5% $28,001 $40,800 $18,176 $19,323 $18,872 (2.8%) (2.3%) 45.7% 23.6% 2.2x 2.1x 2.2x 9.5x 6.5x 6.7x
Comm. Services Upper Quartile 94.6% 2.4x 2.2x 2.2x 7.1x 6.7x 6.7x
Comm. Services Median 89.7% 1.8x 1.9x 1.9x 6.3x 5.9x 5.8x
Comm. Services Lower Quartile 86.2% 1.6x 1.6x 1.6x 5.7x 5.2x 5.1x
Communication Technology
Cisco Systems Jan-19 $53.99 99.6% $237,665 $222,940 $50,825 $52,537 $54,478 3.4% 3.7% 62.1% 30.0% 4.4x 4.2x 4.1x 14.6x 11.9x 11.4x
TSMC Dec-18 $7.95 91.6% $206,217 $188,978 $33,697 $33,553 $37,726 (0.4%) 12.4% 48.3% 65.4% 5.6x 5.6x 5.0x 8.6x 8.7x 7.7x
Broadcom Feb-19 $300.71 99.1% $119,035 $151,583 $21,310 $25,063 $26,520 17.3% 5.8% 68.0% 46.6% 7.1x 6.0x 5.7x 15.3x 11.1x 10.3x
Keyence Dec-18 $622.42 96.0% $75,477 $67,753 $5,253 $5,673 $6,571 6.6% 15.8% 82.5% 56.0% NM NM NM 23.1x 21.3x 19.0x
Foxconn (Hon Hai) Dec-18 $2.38 63.7% $33,004 $33,483 $172,944 $169,009 $175,409 0.3% 3.8% 6.3% 3.6% 0.2x 0.2x 0.2x 5.3x 5.5x 5.1x
Nokia Dec-18 $5.69 88.4% $31,915 $28,462 $25,834 $25,829 $26,512 1.0% 2.6% 39.9% 11.9% 1.1x 1.1x 1.1x 9.3x 8.7x 6.9x
Ericsson Dec-18 $9.21 94.2% $30,394 $29,229 $23,725 $23,061 $23,541 (1.5%) 2.1% 35.2% 7.0% 1.2x 1.3x 1.2x 17.7x 10.3x 9.2x
FleetCor Technologies Dec-18 $246.59 99.9% $21,172 $24,960 $2,433 $2,604 $2,851 8.0% 9.5% 80.0% 55.2% NM 9.6x 8.8x 18.6x 16.8x 15.0x
ZTE Dec-18 $4.35 88.6% $17,225 $18,182 $12,433 $14,638 $16,769 13.8% 14.6% 32.9% 5.6% 1.5x 1.2x 1.1x 26.1x 12.1x 10.3x
Citrix Dec-18 $99.66 85.3% $13,128 $13,823 $2,974 $3,085 $3,226 4.1% 4.5% 87.0% 28.1% 4.6x 4.5x 4.3x 16.5x 12.6x 11.8x
Juniper Networks Dec-18 $26.47 85.9% $9,210 $7,838 $4,648 $4,490 $4,648 (4.3%) 3.5% 59.0% 17.1% 1.7x 1.7x 1.7x 9.9x 8.1x 7.5x
Amdocs Dec-18 $54.11 77.0% $7,522 $7,110 $4,009 $4,105 NA 2.5% NA 34.8% 18.4% 1.8x 1.7x NA 9.6x 8.2x NA
Comm. Technology Upper Quartile 96.8% 4.6x 5.1x 4.8x 17.9x 12.2x 11.6x
Comm. Technology Median 90.1% 1.7x 1.7x 2.9x 14.9x 10.7x 10.3x
Comm. Technology Lower Quartile 85.8% 1.3x 1.3x 1.1x 9.5x 8.5x 7.6x
Electronics
Apple Dec-18 $189.95 81.4% $895,667 $923,970 $261,612 $256,777 $272,729 (1.7%) 6.2% 38.2% 30.4% 3.5x 3.6x 3.4x 11.6x 12.3x 11.4x
Samsung Dec-18 $39.26 82.8% $260,609 $191,561 $218,973 $198,175 $213,361 (9.7%) 7.7% 45.7% 34.8% 0.9x 1.0x 0.9x 2.5x 3.6x 3.0x
Sony Dec-18 $41.92 66.6% $52,425 $51,125 $77,290 $77,607 $81,083 (2.8%) 4.5% 28.0% 12.4% 0.7x 0.7x 0.6x 5.4x 4.6x 4.5x
Canon Dec-18 $29.00 81.2% $31,308 $31,932 $36,020 $35,042 $35,437 (3.9%) 1.1% 46.4% 15.5% 0.9x 0.9x 0.9x 5.7x 6.2x 6.3x
Panasonic Dec-18 $8.61 57.9% $20,084 $22,836 $74,311 $73,798 $74,870 (1.2%) 1.5% 28.1% 7.4% 0.3x 0.3x 0.3x 4.1x 3.8x 3.7x
LG Electronics Dec-18 $66.04 66.8% $11,203 $18,844 $55,101 $56,658 $59,733 1.7% 5.4% 24.6% 7.7% 0.3x 0.3x 0.3x 4.5x 4.4x 4.1x
Lenovo Dec-18 $0.90 95.4% $10,806 $13,137 $49,966 $53,000 $53,314 6.1% 0.6% 14.0% 4.1% 0.3x 0.2x 0.2x 6.5x 6.3x 5.7x
Electronics Upper Quartile 82.1% 0.9x 0.9x 0.9x 6.1x 6.3x 6.0x
Electronics Median 81.2% 0.7x 0.7x 0.6x 5.4x 4.6x 4.5x
Electronics Lower Quartile 66.7% 0.3x 0.3x 0.3x 4.3x 4.1x 3.9x
Global TMT Selected Public Comps: Communications Technology & Electronics
Source: Capital IQ. Financials are calendarized to December year-end.(1) Market Data including Market Capitalization amounts are based on closing share prices as of March 31, 2019.(2) Enterprise Value (EV) equals Market Capitalization plus Debt, Preferred Equity, and Minority Interest, minus Cash and Cash Equivalents.(3) EV/EBITDA multiple less than 0 or greater than 50 have been marked Not Meaningful (NM) in the analysis.

©2019 KPMG Corporate Finance, a Delaware limited liability company. Member FINRA and SIPC. KPMG CorporateFinance is a subsidiary of KPMG LLP, a Delaware limited liability partnership and the U.S. member firm of the KPMGnetwork of independent member firms affiliated with KPMG International Cooperative (“KPMG International”), a Swiss entity.All rights reserved. NDPPS 640221
10
Source: 451research.
Announced Date Target Name Target Country Acquirer Name Deal Value
($ mm)EV /
RevenueEV /
EBITDA
27-Mar-2019 Quantenna Communications U.S. ON Semiconductor $1,070 4.2x 121.8x(2)
25-Mar-2019 Inmarsat U.K. Apax / Warburg Pincus / CPPIB / OTPP $3,400 3.8x 7.6x
18-Mar-2019NII Holdings (Nextel Brazil assets) U.S. America Movil $905 1.5x -
13-Mar-2019 Pointer Telocation Israel I.D. Systems $140 1.8x 11.0x
11-Mar-2019 NGINX U.S. F5 Networks $670 25.8x -
11-Mar-2019 Mellanox Technologies U.S. NVIDIA $6,778 6.2x 31.5x
04-Mar-2019 Mist Systems U.S. Juniper Networks $405 - -
27-Feb-2019UPC Switzerland [Liberty Global] Switzerland Sunrise Communications [TDC] $2,600 4.8x 8.5x
26-Feb-2019 Kaleyra Italy GigCapital $192 - -
20-Feb-2019Telefonica (Panama, Costa Rica and Nicaragua operations)
Spain Millicom International Cellular $1,650 2.3x -
19-Feb-2019Altia Systems[Intel Capital, Naya Ventures] U.S. GN Audio [GN Store Nord] $125 - -
12-Feb-2019Hispasat [AbertisInfraestructuras, Atlantia] Spain Red Eléctrica $1,074 4.7x -
11-Feb-2019Endeavor Robotic Holdings [Arlington Capital Partners] U.S. FLIR Systems $385 - -
31-Jan-2019GLOBALFOUNDRIES (Fab 3E assets) [Mubadala] Singapore Vanguard International
Semiconductor $236 - -
30-Jan-2019 Mastodon Design U.S. CACI International $225 - -
28-Jan-2019 Aeryon Labs Canada FLIR Systems $200 - -
25-Jan-2019Telefonica (Guatemala and El Salvador operations) Spain America Movil $648 - 9.7x
22-Jan-2019 Tangible Play U.S. Think & Learn $120 - -
16-Jan-2019 Fiber-Line U.S. PolyOne $120 - -
02-Jan-2019 PCI [Chuan Hup Holdings] Singapore Platinum Equity $194 0.5x 3.6x
04-Jan-2019TomTom (telematics business) Netherlands Bridgestone $1,034 6.5x -
Median 4.2x 9.1x
Global TMT Selected Transactions (1): Communications Technology & Electronics
(1) Top M&A transactions on the basis of disclosed deal value in Q1’19.(2) EV/EBITDA Multiple for Quantenna - ON Semiconductor transaction is excluded as it is an outlier.

©2019 KPMG Corporate Finance, a Delaware limited liability company. Member FINRA and SIPC. KPMG CorporateFinance is a subsidiary of KPMG LLP, a Delaware limited liability partnership and the U.S. member firm of the KPMGnetwork of independent member firms affiliated with KPMG International Cooperative (“KPMG International”), a Swiss entity.All rights reserved. NDPPS 640221
11
Global TMT Selected Public Comps: IT Services and BPO (1/2)
Market Data Operating Metrics Valuation Multiples$ value millions, except per share Quarter
EndingSharePrice
% of 52Week High
Market Cap. (1)
EnterpriseValue (2)
Revenue Revenue Growth%LTM
GrossLTM
EBITDA EV / Revenue EV / EBITDA
Company Name LTM 2019E 2020E 2018 – 19E 2019E – 20E Margin% Margin% LTM 2019E 2020E LTM 2019E 2020E
IT Commercial Services
Accenture Feb-19 $176.02 99.2% $112,271 $108,219 $40,840 $43,793 $46,775 7.9% 6.8% 31.5% 16.3% 2.6x 2.5x 2.3x 16.2x 14.7x 13.6x
Capgemini Dec-18 $121.32 90.2% $19,502 $22,214 $15,110 $15,784 $16,654 4.7% 5.5% 12.1% 12.7% 1.5x 1.4x 1.3x 11.6x 9.6x 9.0x
CGI Group Dec-18 $68.74 99.6% $18,778 $20,153 $8,541 $9,026 $9,243 5.9% 2.4% 30.4% 16.8% 2.4x 2.2x 2.2x 14.0x 12.1x 11.8x
DXC Technology Dec-18 $64.31 61.2% $17,253 $22,672 $23,880 $20,756 $21,162 (4.5%) 2.0% 29.5% 23.1% 0.9x 1.1x 1.1x 4.1x 4.7x 4.5x
Atos Dec-18 $96.52 67.5% $10,340 $15,838 $14,035 $14,903 $15,140 6.1% 1.6% 15.3% 13.4% 1.1x 1.1x 1.0x 8.4x 8.2x 7.2x
Virtusa Dec-18 $53.45 91.2% $1,599 $1,804 $1,202 $1,357 $1,531 13.1% 12.8% 29.1% 7.7% 1.5x 1.3x 1.2x 19.6x 13.9x 10.6x
Perficient Dec-18 $27.39 88.1% $909 $984 $498 $531 $558 7.4% 5.0% 35.8% 12.1% 2.0x 1.9x 1.8x 16.4x 11.8x 10.8x
Unisys Dec-18 $11.67 55.7% $604 $696 $2,825 $2,846 $2,924 1.1% 2.7% 25.2% 9.6% 0.2x 0.2x 0.2x 2.6x 1.6x 1.6x
IT Commercial Svs Upper Quartile 93.2% 2.1x 1.9x 1.9x 16.3x 12.5x 11.1x
IT Commercial Svs Median 89.2% 1.5x 1.4x 1.3x 12.8x 10.7x 9.8x
IT Commercial Svs Lower Quartile 65.9% 1.1x 1.1x 1.1x 7.4x 7.4x 6.5x
Government Consulting
Booz Allen Hamilton Dec-18 $58.14 99.5% $8,144 $9,707 $6,559 $7,019 $7,459 8.0% 6.3% 23.9% 10.2% 1.5x 1.4x 1.3x 14.6x 13.9x 13.0x
Tyler Technologies Dec-18 $204.40 81.0% $7,827 $7,649 $935 $1,090 $1,211 16.2% 11.1% 47.0% 20.5% 8.2x 7.0x 6.3x 39.9x 24.3x 21.5x
Science Applications Feb-19 $76.95 82.5% $4,554 $6,444 $4,659 $6,579 $6,767 41.8% 2.9% 10.0% 7.6% 1.4x 1.0x 1.0x 18.2x 11.8x 11.1x
MAXIMUS Dec-18 $70.98 96.2% $4,528 $4,602 $2,434 $3,063 $3,221 25.5% 5.2% 24.7% 14.3% 1.9x 1.5x 1.4x 13.2x 11.1x 10.4x
CACI International Dec-18 $182.02 90.6% $4,525 $5,510 $4,642 $5,193 $5,549 12.0% 6.9% 33.5% 9.8% 1.2x 1.1x 1.0x 12.1x 11.4x 10.0x
ManTech International Dec-18 $54.02 79.3% $2,148 $2,151 $1,959 $2,113 $2,253 8.1% 6.6% 14.3% 8.4% 1.1x 1.0x 1.0x 13.0x 12.2x 11.2x
ICF International Dec-18 $76.08 92.5% $1,431 $1,620 $1,338 $1,464 $1,528 11.4% 4.3% 35.9% 9.0% 1.2x 1.1x 1.1x 13.4x 11.7x 10.8x
Govt. Consulting Upper Quartile 94.3% 1.7x 1.4x 1.4x 16.4x 13.0x 12.1x
Govt. Consulting Median 90.6% 1.4x 1.1x 1.1x 13.4x 11.8x 11.1x
Govt. Consulting Lower Quartile 81.7% 1.2x 1.0x 1.0x 13.1x 11.6x 10.6x
Offshore ConsultingTata Consultancy Services Dec-18 $28.89 87.9% $108,407 $101,942 $20,191 $22,685 $24,973 12.0% 10.1% 43.5% 27.1% 5.0x 4.5x 4.1x 18.6x 17.1x 15.5x
Infosys Dec-18 $10.74 96.3% $46,547 $42,774 $11,545 $12,731 $13,759 12.2% 8.1% 34.3% 26.1% 3.7x 3.4x 3.1x 14.2x 13.5x 12.4x
Cognizant Dec-18 $72.45 86.9% $41,666 $37,900 $16,125 $17,352 $18,767 7.7% 8.2% 39.0% 20.6% 2.4x 2.2x 2.0x 11.4x 10.1x 9.3x
Wipro Dec-18 $3.68 85.8% $22,082 $18,476 $8,239 $8,820 $9,002 6.9% 2.1% 29.6% 18.2% 2.2x 2.1x 2.1x 12.3x 10.3x 10.3x
HCL Technologies Dec-18 $15.70 96.7% $21,287 $21,010 $8,393 $9,472 $10,544 13.7% 11.3% 35.0% 23.2% 2.5x 2.2x 2.0x 10.8x 9.3x 8.4x
Tech Mahindra Dec-18 $11.20 92.4% $9,933 $8,878 $4,871 $5,327 $5,656 9.4% 6.2% 35.2% 17.8% 1.8x 1.7x 1.6x 10.3x 9.2x 8.9x
MphasiS Dec-18 $14.27 77.4% $2,658 $2,492 $1,070 $1,222 $1,403 13.8% 14.8% 43.6% 17.4% 2.3x 2.0x 1.8x 13.4x 11.4x 10.1x
Mindtree Dec-18 $13.63 79.8% $2,239 $2,098 $955 $1,095 $1,220 14.4% 11.4% 32.0% 15.3% 2.2x 1.9x 1.7x 14.4x 12.6x 11.5x
Hexaware Technologies Dec-18 $4.98 61.9% $1,484 $1,366 $668 $787 $887 17.6% 12.6% 23.5% 15.6% 2.0x 1.7x 1.5x 13.1x 11.0x 9.7x
Offshore Consulting Upper Quartile 92.4% 2.5x 2.2x 2.1x 14.2x 12.6x 11.5x
Offshore Consulting Median 86.9% 2.3x 2.1x 2.0x 13.1x 11.0x 10.1x
Offshore Consulting Lower Quartile 79.8% 2.2x 1.9x 1.7x 11.4x 10.1x 9.3x
Source: Capital IQ. Financials are calendarized to December year-end.(1) Market Data including Market Capitalization amounts are based on closing share prices as of March 31, 2019.(2) Enterprise Value (EV) equals Market Capitalization plus Debt, Preferred Equity, and Minority Interest, minus Cash and Cash Equivalents.(3) EV/EBITDA multiple less than 0 or greater than 50 have been marked Not Meaningful (NM) in the analysis.
©2019 KPMG Corporate Finance, a Delaware limited liability company. Member FINRA and SIPC. KPMG CorporateFinance is a subsidiary of KPMG LLP, a Delaware limited liability partnership and the U.S. member firm of the KPMGnetwork of independent member firms affiliated with KPMG International Cooperative (“KPMG International”), a Swiss entity.All rights reserved. NDPPS 640221
12
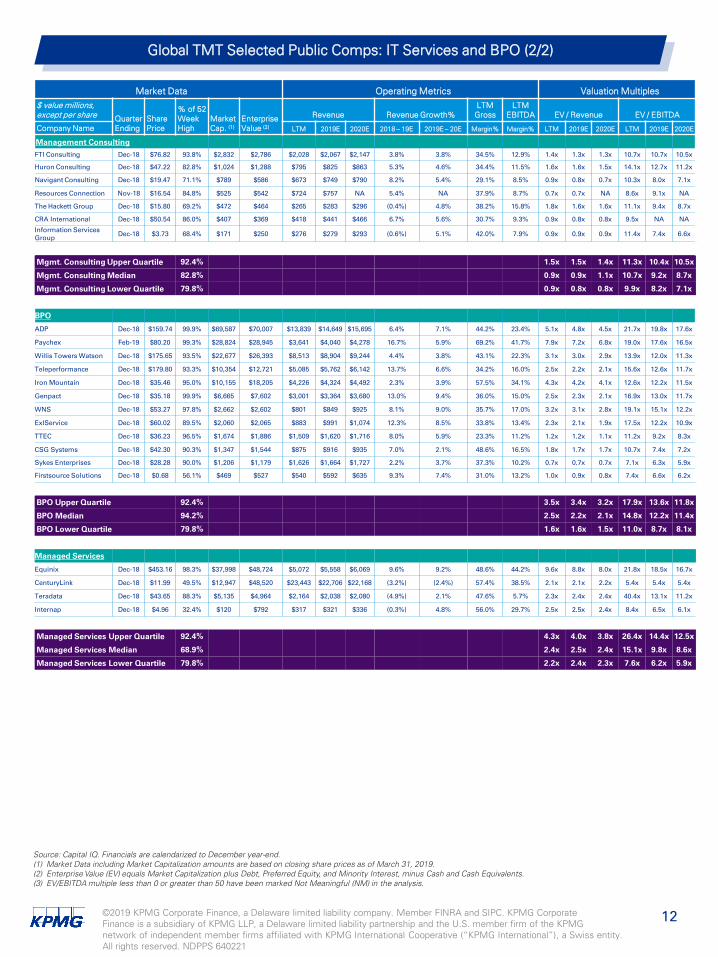
Global TMT Selected Public Comps: IT Services and BPO (2/2)
Market Data Operating Metrics Valuation Multiples$ value millions, except per share Quarter
EndingSharePrice
% of 52Week High
Market Cap. (1)
EnterpriseValue (2)
Revenue Revenue Growth%LTM
GrossLTM
EBITDA EV / Revenue EV / EBITDA
Company Name LTM 2019E 2020E 2018 – 19E 2019E – 20E Margin% Margin% LTM 2019E 2020E LTM 2019E 2020E
Management ConsultingFTI Consulting Dec-18 $76.82 93.8% $2,832 $2,786 $2,028 $2,067 $2,147 3.8% 3.8% 34.5% 12.9% 1.4x 1.3x 1.3x 10.7x 10.7x 10.5x
Huron Consulting Dec-18 $47.22 82.8% $1,024 $1,288 $795 $825 $863 5.3% 4.6% 34.4% 11.5% 1.6x 1.6x 1.5x 14.1x 12.7x 11.2x
Navigant Consulting Dec-18 $19.47 71.1% $789 $586 $673 $749 $790 8.2% 5.4% 29.1% 8.5% 0.9x 0.8x 0.7x 10.3x 8.0x 7.1x
Resources Connection Nov-18 $16.54 84.8% $525 $542 $724 $757 NA 5.4% NA 37.9% 8.7% 0.7x 0.7x NA 8.6x 9.1x NA
The Hackett Group Dec-18 $15.80 69.2% $472 $464 $265 $283 $296 (0.4%) 4.8% 38.2% 15.8% 1.8x 1.6x 1.6x 11.1x 9.4x 8.7x
CRA International Dec-18 $50.54 86.0% $407 $369 $418 $441 $466 6.7% 5.6% 30.7% 9.3% 0.9x 0.8x 0.8x 9.5x NA NA
Information Services Group Dec-18 $3.73 68.4% $171 $250 $276 $279 $293 (0.6%) 5.1% 42.0% 7.9% 0.9x 0.9x 0.9x 11.4x 7.4x 6.6x
Mgmt. Consulting Upper Quartile 92.4% 1.5x 1.5x 1.4x 11.3x 10.4x 10.5x
Mgmt. Consulting Median 82.8% 0.9x 0.9x 1.1x 10.7x 9.2x 8.7x
Mgmt. Consulting Lower Quartile 79.8% 0.9x 0.8x 0.8x 9.9x 8.2x 7.1x
BPO
ADP Dec-18 $159.74 99.9% $69,587 $70,007 $13,839 $14,649 $15,695 6.4% 7.1% 44.2% 23.4% 5.1x 4.8x 4.5x 21.7x 19.8x 17.6x
Paychex Feb-19 $80.20 99.3% $28,824 $28,945 $3,641 $4,040 $4,278 16.7% 5.9% 69.2% 41.7% 7.9x 7.2x 6.8x 19.0x 17.6x 16.5x
Willis Towers Watson Dec-18 $175.65 93.5% $22,677 $26,393 $8,513 $8,904 $9,244 4.4% 3.8% 43.1% 22.3% 3.1x 3.0x 2.9x 13.9x 12.0x 11.3x
Teleperformance Dec-18 $179.80 93.3% $10,354 $12,721 $5,085 $5,762 $6,142 13.7% 6.6% 34.2% 16.0% 2.5x 2.2x 2.1x 15.6x 12.6x 11.7x
Iron Mountain Dec-18 $35.46 95.0% $10,155 $18,205 $4,226 $4,324 $4,492 2.3% 3.9% 57.5% 34.1% 4.3x 4.2x 4.1x 12.6x 12.2x 11.5x
Genpact Dec-18 $35.18 99.9% $6,665 $7,602 $3,001 $3,364 $3,680 13.0% 9.4% 36.0% 15.0% 2.5x 2.3x 2.1x 16.9x 13.0x 11.7x
WNS Dec-18 $53.27 97.8% $2,662 $2,602 $801 $849 $925 8.1% 9.0% 35.7% 17.0% 3.2x 3.1x 2.8x 19.1x 15.1x 12.2x
ExlService Dec-18 $60.02 89.5% $2,060 $2,065 $883 $991 $1,074 12.3% 8.5% 33.8% 13.4% 2.3x 2.1x 1.9x 17.5x 12.2x 10.9x
TTEC Dec-18 $36.23 96.5% $1,674 $1,886 $1,509 $1,620 $1,716 8.0% 5.9% 23.3% 11.2% 1.2x 1.2x 1.1x 11.2x 9.2x 8.3x
CSG Systems Dec-18 $42.30 90.3% $1,347 $1,544 $875 $916 $935 7.0% 2.1% 48.6% 16.5% 1.8x 1.7x 1.7x 10.7x 7.4x 7.2x
Sykes Enterprises Dec-18 $28.28 90.0% $1,206 $1,179 $1,626 $1,664 $1,727 2.2% 3.7% 37.3% 10.2% 0.7x 0.7x 0.7x 7.1x 6.3x 5.9x
Firstsource Solutions Dec-18 $0.68 56.1% $469 $527 $540 $592 $635 9.3% 7.4% 31.0% 13.2% 1.0x 0.9x 0.8x 7.4x 6.6x 6.2x
BPO Upper Quartile 92.4% 3.5x 3.4x 3.2x 17.9x 13.6x 11.8x
BPO Median 94.2% 2.5x 2.2x 2.1x 14.8x 12.2x 11.4x
BPO Lower Quartile 79.8% 1.6x 1.6x 1.5x 11.0x 8.7x 8.1x
Managed Services
Equinix Dec-18 $453.16 98.3% $37,998 $48,724 $5,072 $5,558 $6,069 9.6% 9.2% 48.6% 44.2% 9.6x 8.8x 8.0x 21.8x 18.5x 16.7x
CenturyLink Dec-18 $11.99 49.5% $12,947 $48,520 $23,443 $22,706 $22,168 (3.2%) (2.4%) 57.4% 38.5% 2.1x 2.1x 2.2x 5.4x 5.4x 5.4x
Teradata Dec-18 $43.65 88.3% $5,135 $4,964 $2,164 $2,038 $2,080 (4.9%) 2.1% 47.6% 5.7% 2.3x 2.4x 2.4x 40.4x 13.1x 11.2x
Internap Dec-18 $4.96 32.4% $120 $792 $317 $321 $336 (0.3%) 4.8% 56.0% 29.7% 2.5x 2.5x 2.4x 8.4x 6.5x 6.1x
Managed Services Upper Quartile 92.4% 4.3x 4.0x 3.8x 26.4x 14.4x 12.5x
Managed Services Median 68.9% 2.4x 2.5x 2.4x 15.1x 9.8x 8.6x
Managed Services Lower Quartile 79.8% 2.2x 2.4x 2.3x 7.6x 6.2x 5.9x
Source: Capital IQ. Financials are calendarized to December year-end.(1) Market Data including Market Capitalization amounts are based on closing share prices as of March 31, 2019.(2) Enterprise Value (EV) equals Market Capitalization plus Debt, Preferred Equity, and Minority Interest, minus Cash and Cash Equivalents.(3) EV/EBITDA multiple less than 0 or greater than 50 have been marked Not Meaningful (NM) in the analysis.

©2019 KPMG Corporate Finance, a Delaware limited liability company. Member FINRA and SIPC. KPMG CorporateFinance is a subsidiary of KPMG LLP, a Delaware limited liability partnership and the U.S. member firm of the KPMGnetwork of independent member firms affiliated with KPMG International Cooperative (“KPMG International”), a Swiss entity.All rights reserved. NDPPS 640221
13
Global TMT Selected Transactions (1): IT Services and BPO
Source: 451research.
Announced Date Target Name Target Country Acquirer Name Deal Value
($ mm)EV /
RevenueEV /
EBITDA
31-Mar-2019MG LLC [Clayton DubilierRice] U.S. Willis Towers Watson $1,200 - -
27-Mar-2019Defaqto [Independent Research Group, RegulusTopco]
U.K. The SimplyBiz Group $99 5.5x 13.4x
19-Mar-2019 1st Global U.S. Blucora $180 1.0x -
11-Mar-2019 Acando Sweden CGI Group $451 1.5x 14.4x
07-Mar-2019 Azuqua U.S. Okta $53 - -
01-Mar-2019Kforce Government Solutions U.S. ManTech International $115 1.2x -
28-Feb-2019 Speedpay [Western Union] U.S. ACI Worldwide $750 2.1x -
27-Feb-2019Wipro (Workday and Cornerstone OnDemandbusiness)
India Alight Solutions $100 - -
27-Feb-2019Cogeco Peer 1 [CogecoCommunications] Canada Digital Colony Management $547 - -
08-Feb-2019 Earthport U.K. Visa $299 6.7x -
30-Jan-2019LGS Innovations [Madison Dearborn Partners / CoVant] U.S. CACI International $750 - -
17-Jan-2019 Avanxo Colombia Globant $49 - -
17-Jan-2019 Discovery Benefits U.S. WEX $425 4.3x -
16-Jan-2019 First Data U.S. Fiserv $22,000 4.0x 13.3x
15-Jan-2019 The Sage Group U.K. iSolved HCM [Accel-KKR Company] $94 1.9x -
07-Jan-2019 Luxoft Holding Switzerland DXC Technology $2,006 2.1x 13.7x
Median 2.1x 13.6x
(1) Top M&A transactions on the basis of disclosed deal value in Q1’19.

©2019 KPMG Corporate Finance, a Delaware limited liability company. Member FINRA and SIPC. KPMG CorporateFinance is a subsidiary of KPMG LLP, a Delaware limited liability partnership and the U.S. member firm of the KPMGnetwork of independent member firms affiliated with KPMG International Cooperative (“KPMG International”), a Swiss entity.All rights reserved. NDPPS 640221
14
Global TMT Selected Public Comps: Internet and Media
Source: Capital IQ. Financials are calendarized to December year-end.(1) Market Data including Market Capitalization amounts are based on closing share prices as of March 31, 2019.(2) Enterprise Value (EV) equals Market Capitalization plus Debt, Preferred Equity, and Minority Interest, minus Cash and Cash Equivalents.(3) EV/EBITDA multiple less than 0 or greater than 50 have been marked Not Meaningful (NM) in the analysis.
Market Data Operating Metrics Valuation Multiples$ value millions, except per share Quarter
EndingSharePrice
% of 52Week High
Market Cap. (1)
EnterpriseValue (2)
Revenue Revenue Growth%LTM
GrossLTM
EBITDA EV / Revenue EV / EBITDA(3)
Company Name LTM 2019E 2020E 2018 – 19E 2019E – 20E Margin% Margin% LTM 2019E 2020E LTM 2019E 2020E
Internet
Amazon.com Dec-18 $1,780.75 86.8% $874,710 $882,749 $232,887 $275,096 $324,864 18.3% 18.1% 40.2% 11.9% 3.8x 3.2x 2.7x 31.8x 20.9x 16.2x
Alphabet Dec-18 $1,176.89 91.1% $816,907 $711,779 $136,819 $163,541 $190,186 19.8% 16.3% 56.5% 29.5% 5.2x 4.4x 3.7x 17.6x 12.1x 10.5x
Facebook Dec-18 $166.69 76.2% $475,732 $435,118 $55,838 $68,946 $83,349 24.6% 20.9% 83.2% 52.3% 7.8x 6.3x 5.2x 14.9x 11.9x 9.8x
Alibaba Dec-18 $182.45 86.2% $472,943 $478,104 $50,203 $69,838 $96,275 38.6% 37.9% 47.8% 25.8% 9.5x 6.8x 5.0x 36.9x 22.2x 16.8x
Tencent Dec-18 $45.99 83.6% $434,834 $441,373 $45,465 $59,894 $76,176 32.1% 27.2% 45.5% 36.1% 9.7x 7.4x 5.8x 26.9x 22.0x 17.4x
Baidu Dec-18 $164.85 58.0% $57,593 $48,614 $15,103 $17,784 $20,664 19.1% 16.2% 50.2% 32.1% 3.2x 2.7x 2.4x 10.0x 14.0x 10.0x
eBay Dec-18 $37.14 86.4% $33,979 $38,305 $10,746 $10,856 $11,560 1.2% 6.5% 77.8% 28.0% 3.6x 3.5x 3.3x 12.8x 10.2x 9.6x
Twitter Dec-18 $32.88 68.8% $25,140 $21,651 $3,042 $3,484 $3,979 16.1% 14.2% 68.3% 25.4% 7.1x 6.2x 5.4x 28.1x 17.0x 14.4x
Snap Dec-18 $11.02 69.1% $14,558 $13,296 $1,180 $1,546 $1,997 32.4% 29.1% 32.3% (97.1%) NM 8.6x 6.7x NM NM NM
Etsy Dec-18 $67.22 91.6% $8,037 $7,695 $604 $792 $972 32.4% 22.7% 68.4% 16.2% NM 9.7x 7.9x NM 39.2x 29.6x
Internet Upper Quartile 86.7% 8.2x 7.2x 5.7x 29.0x 22.0x 16.8x
Internet Median 84.9% 6.2x 6.3x 5.1x 22.3x 17.0x 14.4x
Internet Lower Quartile 70.9% 3.7x 3.7x 3.4x 14.4x 12.1x 10.0x
Media
Walt Disney Dec-18 $111.03 92.4% $199,590 $221,001 $59,386 $74,970 $82,528 26.4% 10.1% 44.4% 29.4% 3.7x 2.9x 2.7x 12.7x 11.4x 9.5x
Comcast Dec-18 $39.98 98.7% $180,948 $291,082 $94,507 $112,095 $117,901 19.0% 5.2% 68.6% 31.8% 3.1x 2.6x 2.5x 9.7x 8.5x 8.0x
Fox Corp. Dec-18 $36.71 88.0% $22,779 $20,946 $10,981 $11,376 $12,571 NA 10.5% 34.4% 22.7% 1.9x 1.8x 1.7x 8.4x 8.6x 7.1x
CBS Dec-18 $47.53 79.8% $17,729 $27,559 $14,514 $15,624 $16,304 6.8% 4.3% 37.2% 21.5% 1.9x 1.8x 1.7x 8.8x 8.0x 7.3x
News Corp. Dec-18 $12.44 74.7% $7,291 $8,497 $9,937 $10,208 $10,292 2.8% 0.8% 45.3% 10.7% 0.9x 0.8x 0.8x 8.0x 6.6x 6.1x
REA Group Dec-18 $53.03 79.4% $6,985 $7,163 $660 $679 $752 10.8% 10.8% 73.3% 51.1% NM NM 9.5x 21.2x 18.2x 15.9x
Lagardère Dec-18 $25.72 85.5% $3,340 $4,884 $8,310 $8,379 $8,646 1.7% 3.2% 100.0% 9.4% 0.6x 0.6x 0.6x 6.2x 6.4x 5.7x
DMGT Sep-18 $8.41 82.7% $2,978 $2,673 $1,861 $1,804 $1,812 0.4% 0.4% 38.6% 10.7% 1.4x 1.5x 1.5x 13.5x 10.8x 10.4x
Singapore Press Nov-18 $1.78 82.5% $2,870 $4,436 $708 $728 $720 2.9% (1.0%) 49.2% 32.1% 6.3x 6.1x 6.2x 19.5x 18.9x 19.2x
Media Upper Quartile 88.0% 3.2x 2.7x 2.7x 13.5x 11.4x 10.4x
Media Median 82.7% 1.9x 1.8x 1.7x 9.7x 8.6x 8.0x
Media Lower Quartile 79.8% 1.3x 1.3x 1.5x 8.4x 8.0x 7.1x
Information Services
S&P Global Dec-18 $210.55 96.9% $51,812 $55,215 $6,258 $6,536 $6,945 3.3% 6.3% 72.8% 50.6% 8.8x 8.4x 7.9x 17.4x 16.7x 15.6x
Moody's Dec-18 $181.09 96.3% $34,192 $38,252 $4,443 $4,662 $4,954 3.3% 6.3% 72.0% 47.5% 8.6x 8.2x 7.7x 18.1x 17.1x 15.9x
Thomson Reuters Dec-18 $59.16 99.2% $29,649 $30,282 $5,501 $5,941 $6,195 7.7% 4.3% 27.4% 19.6% 5.5x 5.1x 4.9x 28.1x 21.0x 16.3x
Experian Sep-18 $27.07 98.9% $24,394 $27,828 $4,819 $5,031 $5,508 3.9% 9.5% 42.3% 30.5% 5.8x 5.5x 5.1x 18.9x 16.2x 14.5x
Pearson Dec-18 $10.89 81.2% $8,474 $8,761 $5,262 $5,094 $5,198 (5.7%) 2.1% 52.9% 13.2% 1.7x 1.7x 1.7x 12.6x 9.1x 8.5x
Information Services Upper Quartile 98.9% 8.6x 8.2x 7.7x 18.9x 17.1x 15.9x
Information Services Median 96.9% 5.8x 5.5x 5.1x 18.1x 16.7x 15.6x
Information Services Lower Quartile 96.3% 5.5x 5.1x 4.9x 17.4x 16.2x 14.5x

©2019 KPMG Corporate Finance, a Delaware limited liability company. Member FINRA and SIPC. KPMG CorporateFinance is a subsidiary of KPMG LLP, a Delaware limited liability partnership and the U.S. member firm of the KPMGnetwork of independent member firms affiliated with KPMG International Cooperative (“KPMG International”), a Swiss entity.All rights reserved. NDPPS 640221
15
Global TMT Selected Transactions (1): Internet and Media
Announced Date Target Name Target Country Acquirer Name Deal Value
($ mm)EV /
RevenueEV /
EBITDA
26-Mar-2019 Careem U.A.E. Uber Technologies $3,100 - -
25-Mar-2019 Espial Group Canada Enghouse Systems $42 0.9x -
25-Mar-2019 Dynamic Yield Israel McDonald's $300 - -
21-Mar-2019 Zoosk Inc. U.S. Spark Networks $255 - -
20-Mar-2019 Nexstar Media (8 stations) U.S. EW Scripps $580 2.2x 10.4x
20-Mar-2019 Nexstar Media (11 stations) U.S. TEGNA $740 - -
19-Mar-2019 Qwikcilver Solutions India Pine Labs $110 - -
15-Mar-2019 Future Today U.S. Cinedigm Digital Cinema $60 2.5x -
11-Mar-2019 Yatra Online India Ebix $336 2.0x -
07-Mar-2019 HotelTonight U.S. Airbnb $465 - -
06-Mar-2019 Turnitin U.S. Advance Publications $1,750 - -
05-Mar-2019 Usabilla Netherlands SurveyMonkey $80 - -
04-Mar-2019Zomato Media(Food delivery business in the U.A.E.)
India Delivery Hero $172 - -
01-Mar-2019 MoNa Mobile Nations U.S. Future plc $60 3.7x 7.3x
15-Feb-2019 Scout24 Germany Hellman & Friedman/The Blackstone Group $5,539 - -
05-Feb-2019 Netyear Group Japan NTT Data $54 1.0x -
04-Feb-2019 RhythmOne U.S. Taptica International $176 0.5x -
01-Feb-2019 Adjarabet [City Loft] Georgia Paddy Power Betfair $132 1.7x 5.2x
24-Jan-2019Akazoo [Toscafund Asset Management / PentaCapital]
U.K. Modern Media Acquisition $400 3.4x 35.2x
23-Jan-2019 Allegorithmic France Adobe $105 - -
22-Jan-2019 Pluto Inc. U.S. Viacom $340 3.1x -
14-Jan-2019Clarivate Analytics [ONEX Corporation/ Baring Private Equity Asia]
U.S. Churchill Capital $4,200 - -
08-Jan-2019 Yospace Technologies U.K. The RTL Group [Bertelsmann] $33 - -
03-Jan-2019 Falcon.io Denmark Cision $126 4.7x -
02-Jan-2019 Weizmann Forex India Ebix $49 - -
Median 2.2x 8.8x
Source: 451research.
(1) Top M&A transactions on the basis of disclosed deal value in Q1’19.

©2019 KPMG Corporate Finance, a Delaware limited liability company. Member FINRA and SIPC. KPMG CorporateFinance is a subsidiary of KPMG LLP, a Delaware limited liability partnership and the U.S. member firm of the KPMGnetwork of independent member firms affiliated with KPMG International Cooperative (“KPMG International”), a Swiss entity.All rights reserved. NDPPS 640221
16
Global TMT Selected Public Comps: Software (1/2)
Market Data Operating Metrics Valuation Multiples$ value millions, except per share Quarter
EndingSharePrice
% of 52Week High
Market Cap. (1)
EnterpriseValue (2)
Revenue Revenue Growth%LTM
GrossLTM
EBITDA EV / Revenue EV / EBITDA(3)
Company Name LTM 2019E 2020E 2018 – 19E 2019E – 20E Margin% Margin% LTM 2019E 2020E LTM 2019E 2020E
Diversified SoftwareMicrosoft Dec-18 $117.94 97.6% $904,861 $862,671 $118,459 $129,963 $142,806 9.7% 9.9% 65.1% 41.9% 7.3x 6.6x 6.0x 17.4x 15.5x 13.6x
Alphabet Dec-18 $1,176.89 91.1% $816,907 $711,779 $136,819 $163,541 $190,186 19.8% 16.3% 56.5% 29.5% 5.2x 4.4x 3.7x 17.6x 12.1x 10.5x
Cisco Systems Jan-19 $53.99 99.6% $237,665 $222,940 $50,825 $52,537 $54,478 3.4% 3.7% 62.1% 30.0% 4.4x 4.2x 4.1x 14.6x 11.9x 11.4x
Oracle Feb-19 $53.71 98.8% $183,562 $200,421 $39,831 $39,689 $40,617 (0.2%) 2.3% 79.6% 41.0% 5.0x 5.0x 4.9x 12.3x 10.8x 10.4x
SAP Dec-18 $115.49 94.9% $137,852 $140,540 $28,288 $30,336 $32,709 8.0% 7.8% 69.8% 27.4% 5.0x 4.6x 4.3x 18.1x 13.3x 12.0x
Adobe Systems Mar-19 $266.49 96.0% $130,034 $130,944 $9,552 $11,170 $13,157 24.1% 17.8% 86.0% 34.0% 13.7x 11.7x 10.0x 40.3x 26.0x 21.5x
IBM Dec-18 $141.10 87.1% $125,560 $159,580 $79,591 $78,283 $78,376 (1.7%) 0.1% 46.4% 21.0% 2.0x 2.0x 2.0x 9.5x 8.6x 8.4x
Salesforce.com Jan-19 $158.37 94.8% $122,103 $121,128 $13,282 $16,062 $19,209 21.3% 19.6% 74.0% 11.5% 9.1x 7.5x 6.3x 79.5x 30.1x 24.7x
Diversified Software Upper Quartile 97.9% 7.7x 6.9x 6.1x 23.7x 18.2x 15.6x
Diversified Software Median 95.5% 5.1x 4.8x 4.6x 17.5x 12.7x 11.7x
Diversified Software Lower Quartile 93.9% 4.8x 4.3x 4.0x 14.0x 11.6x 10.5x
Large-Cap SaaS (> $5B Market Cap)
Salesforce.com Jan-19 $158.37 94.8% $122,103 $121,128 $13,282 $16,062 $19,209 21.3% 19.6% 74.0% 11.5% 9.1x 7.5x 6.3x 79.5x 30.1x 24.7x
ServiceNow Dec-18 $246.49 97.9% $44,491 $43,655 $2,609 $3,428 $4,392 31.3% 28.1% 76.1% 4.1% 16.7x 12.7x 9.9x NM 46.9x 34.9x
Workday Jan-19 $192.85 96.4% $42,813 $42,239 $2,822 $3,555 $4,360 26.5% 22.6% 70.4% (8.5%) 15.0x 11.9x 9.7x NM 62.4x 46.4x
Atlassian Dec-18 $112.39 97.0% $26,918 $26,110 $1,030 $1,358 $1,708 32.7% 25.8% 82.1% 2.8% 25.3x 19.2x 15.3x NM 76.1x 60.4x
Shopify Dec-18 $206.62 98.6% $22,968 $20,989 $1,073 $1,490 $1,963 41.0% 31.7% 55.6% (6.4%) 19.6x 14.1x 10.7x NM NM NM
Veeva Systems Jan-19 $126.86 98.5% $18,576 $17,485 $862 $1,031 $1,219 20.3% 18.2% 71.6% 27.5% 20.3x 17.0x 14.3x 73.8x 45.5x 37.9x
Twilio Dec-18 $129.18 95.0% $15,964 $15,653 $650 $1,075 $1,428 70.5% 32.9% 53.7% (14.1%) 24.1x 14.6x 11.0x NM NM NM
Tableau Software Dec-18 $127.28 93.0% $10,957 $9,935 $1,155 $1,367 $1,627 39.6% 19.0% 87.7% (4.7%) 8.6x 7.3x 6.1x NM 46.0x 34.0x
The Ultimate Software Group Dec-18 $330.13 90.2% $10,459 $10,309 $1,141 $1,366 $1,633 20.2% 19.6% 62.1% 10.8% 9.0x 7.5x 6.3x 83.8x 31.9x 25.8x
Okta Jan-19 $82.73 94.3% $9,284 $8,992 $399 $534 $699 36.4% 30.8% 71.6% (29.1%) 22.5x 16.8x 12.9x NM NM NM
Zendesk Dec-18 $85.00 98.7% $9,211 $9,242 $599 $803 $1,040 35.6% 29.6% 69.7% (17.3%) 15.4x 11.5x 8.9x NM NM 89.6x
Dropbox Dec-18 $21.80 50.1% $8,966 $8,043 $1,392 $1,639 $1,881 18.3% 14.8% 71.6% (23.5%) 5.8x 4.9x 4.3x NM 21.9x 17.5x
DocuSign Jan-19 $51.84 75.8% $8,808 $8,478 $701 $914 $1,134 31.5% 24.1% 72.8% (55.8%) 12.1x 9.3x 7.5x NM NM 63.0x
RingCentral Dec-18 $107.80 96.5% $8,758 $8,558 $674 $855 $1,055 28.3% 23.4% 76.7% 1.4% 12.7x 10.0x 8.1x NM 79.9x 60.6x
HubSpot Dec-18 $166.21 92.3% $6,843 $6,570 $513 $652 $805 28.7% 23.5% 80.4% (6.9%) 12.8x 10.1x 8.2x NM 83.6x 58.1x
Proofpoint Dec-18 $121.43 93.2% $6,721 $6,489 $717 $873 $1,056 22.8% 21.0% 71.9% (3.9%) 9.1x 7.4x 6.1x NM 49.0x 36.5x
Elastic N.V. Jan-19 $79.87 79.5% $5,854 $5,547 $241 $340 $452 41.6% 32.8% 71.7% (33.9%) 23.1x 16.3x 12.3x NM NM NM
Wix.com Ltd. Dec-18 $120.83 96.0% $5,842 $5,477 $604 $760 $934 26.3% 22.9% 79.0% (3.2%) 9.1x 7.2x 5.9x NM 36.7x 29.1x
New Relic Dec-18 $98.70 86.0% $5,661 $5,342 $446 $568 $713 28.6% 25.6% 83.8% (1.1%) 12.0x 9.4x 7.5x NM 65.1x 46.1x
Coupa Software Jan-19 $90.98 91.0% $5,554 $5,407 $260 $328 $411 29.3% 25.4% 67.9% (14.7%) 20.8x 16.5x 13.1x NM NM NM
Pivotal Software Feb-19 $20.85 66.7% $5,547 $4,846 $657 $803 $986 21.9% 22.8% 63.4% (19.3%) 7.4x 6.0x 4.9x NM NM NM
RealPage Dec-18 $60.69 91.6% $5,539 $5,908 $869 $992 $1,101 13.7% 11.0% 62.2% 16.2% 6.8x 6.0x 5.4x 42.0x 21.0x 18.0x
Alteryx Dec-18 $83.87 97.9% $5,182 $5,026 $254 $350 $461 73.6% 31.9% 91.0% 13.5% 19.8x 14.4x 10.9x NM NM 87.0x
Large-Cap SaaS Upper Quartile 96.7% 20.0x 14.5x 10.9x 80.6x 64.4x 60.4x
Large-Cap SaaS Median 94.3% 12.8x 10.1x 8.2x 76.6x 46.5x 37.9x
Large-Cap SaaS Lower Quartile 90.6% 9.1x 7.5x 6.2x 65.9x 33.1x 29.1x
Source: Capital IQ. Financials are calendarized to December year-end.(1) Market Data including Market Capitalization amounts are based on closing share prices as of March 31, 2019.(2) Enterprise Value (EV) equals Market Capitalization plus Debt, Preferred Equity, and Minority Interest, minus Cash and Cash Equivalents.(3) EV/EBITDA multiple less than 0 or greater than 100 have been marked Not Meaningful (NM) in the analysis.

©2019 KPMG Corporate Finance, a Delaware limited liability company. Member FINRA and SIPC. KPMG CorporateFinance is a subsidiary of KPMG LLP, a Delaware limited liability partnership and the U.S. member firm of the KPMGnetwork of independent member firms affiliated with KPMG International Cooperative (“KPMG International”), a Swiss entity.All rights reserved. NDPPS 640221
17
Global TMT Selected Public Comps: Software (2/2)
Market Data Operating Metrics Valuation Multiples$ value millions, except per share Quarter
EndingSharePrice
% of 52Week High
Market Cap. (1)
EnterpriseValue (2)
Revenue Revenue Growth%LTM
GrossLTM
EBITDA EV / Revenue EV / EBITDA(3)
Company Name LTM 2019E 2020E 2018 – 19E 2019E – 20E Margin% Margin% LTM 2019E 2020E LTM 2019E 2020E
Mid-Cap SaaS (< $5B Market Cap)
Xero Limited Sep-18 $34.54 92.5% $4,833 $5,072 $315 $465 $590 33.6% 27.0% 82.5% (1.2%) 16.1x 10.9x 8.6x NM 55.4x 36.3x
Paylocity Dec-18 $89.19 96.4% $4,720 $4,616 $418 $504 $604 21.3% 20.0% 63.8% 10.4% 11.0x 9.2x 7.6x NM 31.8x 25.5x
Medidata Solutions Dec-18 $73.24 82.4% $4,419 $4,272 $636 $739 $851 16.1% 15.1% 75.0% 13.5% 6.7x 5.8x 5.0x 49.7x 23.6x 19.7x
Smartsheet Jan-19 $40.79 83.2% $4,282 $4,075 $178 $255 $348 45.7% 36.3% 81.0% (26.7%) 22.9x 15.9x 11.7x NM NM NM
2U Dec-18 $70.85 71.9% $4,119 $3,668 $412 $548 $719 33.1% 31.3% 78.0% (3.3%) 8.9x 6.7x 5.1x NM NM NM
LogMeIn Dec-18 $80.10 65.1% $4,072 $4,124 $1,204 $1,255 $1,320 4.3% 5.1% 76.7% 29.4% 3.4x 3.3x 3.1x 11.7x 10.1x 10.5x
Ellie Mae Dec-18 $98.69 84.4% $3,459 $3,156 $480 $510 $554 6.5% 8.6% 58.4% 11.8% 6.6x 6.2x 5.7x 55.6x 21.7x 19.2x
Qualys Dec-18 $82.74 84.2% $3,258 $2,971 $279 $322 $375 15.4% 16.5% 76.3% 28.4% 10.7x 9.2x 7.9x 37.5x 23.9x 20.0x
Cornerstone OnDemand Dec-18 $54.78 91.0% $3,238 $3,184 $538 $564 $641 6.4% 13.7% 73.2% 2.5% 5.9x 5.6x 5.0x NM 26.3x 19.8x
Five9 Dec-18 $52.83 91.3% $3,130 $3,046 $258 $301 $353 19.4% 17.3% 59.6% 6.9% 11.8x 10.1x 8.6x NM 60.6x 47.3x
Q2 Holdings Dec-18 $69.26 96.2% $3,018 $3,024 $241 $308 $377 27.9% 22.5% 49.5% (6.7%) 12.5x 9.8x 8.0x NM NM 77.0x
Mimecast Dec-18 $47.35 91.7% $2,861 $2,893 $322 $398 $484 24.8% 21.7% 73.1% 8.0% 9.0x 7.3x 6.0x NM 43.0x 34.3x
Box Jan-19 $19.31 64.8% $2,787 $2,682 $608 $702 $814 15.3% 16.0% 71.5% (14.5%) 4.4x 3.8x 3.3x NM 57.6x 33.3x
AppFolio Dec-18 $79.40 86.8% $2,692 $2,651 $190 $252 $312 34.4% 23.6% 61.9% 12.9% 13.9x 10.5x 8.5x NM 50.6x 37.8x
BlackLine Dec-18 $46.32 79.7% $2,549 $2,421 $228 $278 $338 22.3% 21.9% 77.7% (4.8%) 10.6x 8.7x 7.2x NM NM 74.0x
Cloudera Jan-19 $10.94 48.8% $2,942 $2,462 $480 $845 $1,030 7.9% 21.9% 71.6% (32.0%) 5.1x 2.9x 2.4x NM NM 15.7x
Everbridge Dec-18 $75.01 98.4% $2,461 $2,450 $147 $196 $245 33.6% 25.1% 68.2% (24.0%) 16.7x 12.5x 10.0x NM NM NM
Rapid7 Dec-18 $50.61 96.2% $2,428 $2,344 $244 $309 $375 27.4% 21.6% 70.9% (16.8%) 9.6x 7.6x 6.2x NM NM 76.3x
Yext Jan-19 $21.86 80.4% $2,388 $2,245 $228 $299 $388 31.3% 29.9% 74.9% (30.2%) 9.8x 7.5x 5.8x NM NM NM
Pluralsight Dec-18 $31.74 82.7% $2,362 $2,291 $232 $312 $412 35.3% 32.2% 73.0% (43.8%) 9.9x 7.3x 5.6x NM NM NM
SVMK Dec-18 $18.21 91.1% $2,306 $2,462 $254 $294 $347 16.4% 18.3% 69.3% (39.1%) 9.7x 8.4x 7.1x NM 47.5x 38.8x
Workiva Dec-18 $50.70 98.7% $2,246 $2,166 $244 $284 $328 16.9% 15.7% 73.0% (14.9%) 8.9x 7.6x 6.6x NM NM NM
Zuora Jan-19 $20.03 53.0% $2,173 $2,011 $235 $292 $365 24.7% 24.9% 50.4% (28.5%) 8.5x 6.9x 5.5x NM NM NM
SPS Commerce Dec-18 $106.06 93.6% $1,884 $1,705 $248 $275 $300 11.3% 9.3% 67.1% 15.9% 6.9x 6.2x 5.7x 43.3x 26.8x 22.9x
LivePerson Dec-18 $29.02 95.8% $1,855 $1,789 $250 $288 $343 15.6% 19.0% 75.0% 1.0% 7.2x 6.2x 5.2x NM NM 61.6x
Instructure Dec-18 $47.12 95.8% $1,687 $1,534 $210 $257 $312 23.0% 21.3% 70.5% (18.6%) 7.3x 6.0x 4.9x NM NM NM
Benefitfocus Dec-18 $49.52 81.6% $1,587 $1,634 $259 $305 $356 18.6% 16.7% 50.0% (10.8%) 6.3x 5.4x 4.6x NM 89.9x 48.0x
Talend Dec-18 $50.57 68.8% $1,533 $1,500 $204 $249 $305 21.6% 22.8% 75.8% (17.8%) 7.3x 6.0x 4.9x NM NM NM
Domo Jan-19 $40.33 85.7% $1,062 $982 $142 $174 $214 23.4% 23.3% 65.2% (95.0%) 6.9x 5.7x 4.6x NM NM NM
Carbon Black Dec-18 $13.95 39.9% $987 $827 $210 $243 $287 16.4% 18.4% 78.2% (30.2%) 3.9x 3.4x 2.9x NM NM NM
MobileIron Dec-18 $5.47 95.8% $584 $479 $193 $211 $231 9.0% 9.2% 81.9% (20.0%) 2.5x 2.3x 2.1x NM NM NA
Castlight Health Dec-18 $3.75 63.0% $538 $466 $156 $156 $177 0.6% 13.9% 61.5% (21.1%) 3.0x 3.0x 2.6x NM 54.5x 27.2x
Xero Limited Sep-18 $34.54 92.5% $4,833 $5,072 $315 $465 $590 33.6% 27.0% 82.5% (1.2%) 16.1x 10.9x 8.6x NM 55.4x 36.3x
Mid-Cap SaaS Upper Quartile 94.2% 10.6x 8.8x 7.3x 49.7x 55.0x 47.4x
Mid-Cap SaaS Median 85.0% 8.7x 6.8x 5.6x 43.3x 43.0x 33.8x
Mid-Cap SaaS Lower Quartile 77.8% 6.5x 5.7x 4.8x 37.5x 25.1x 19.9x
Source: Capital IQ. Financials are calendarized to December year-end.(1) Market Data including Market Capitalization amounts are based on closing share prices as of March 31, 2019.(2) Enterprise Value (EV) equals Market Capitalization plus Debt, Preferred Equity, and Minority Interest, minus Cash and Cash Equivalents.(3) EV/EBITDA multiple less than 0 or greater than 100 have been marked Not Meaningful (NM) in the analysis.

©2019 KPMG Corporate Finance, a Delaware limited liability company. Member FINRA and SIPC. KPMG CorporateFinance is a subsidiary of KPMG LLP, a Delaware limited liability partnership and the U.S. member firm of the KPMGnetwork of independent member firms affiliated with KPMG International Cooperative (“KPMG International”), a Swiss entity.All rights reserved. NDPPS 640221
18
Global TMT Selected Transactions (1): Software
Source: 451research.
Announced Date Target Name Target Country Acquirer Name Deal Value
($ mm)EV /
RevenueEV /
EBITDA
28-Mar-2019 Ipswitch U.S. Progress Software $225 3.0x -
22-Mar-2019 eFront SAS [BridgepointCapital] France BlackRock $1,300 9.3x -
19-Mar-2019 Magnitude Software [Audax] U.S. 3i Group $340 - -
18-Mar-2019 Worldpay U.S. Fidelity National Information Services $35,500 10.9x 16.9x
18-Mar-2019 AgileCraft U.S. Atlassian $166 - -
18-Mar-2019 Foundry Visionmongers[HgCapital] U.K. Roper Technologies $545 - -
14-Mar-2019 PIEtech U.S. Envestnet $500 - -
11-Mar-2019 Voalte U.S. Hill-Rom Holdings $180 4.5x -
10-Mar-2019 Figure Eight U.S. Appen $175 - -
21-Feb-2019 Attunity U.S. QlikTech [Thoma Bravo] $560 6.4x 60.4x
12-Feb-2019 Ellie Mae U.S. Thoma Bravo $3,700 7.5x 58.8x
11-Feb-2019 Solium Capital Canada Morgan Stanley Private Equity $828 7.0x 74.5x
04-Feb-2019 Ultimate Software Group U.S. Hellman & Friedman-led PE Consortium $11,000 9.9x 89.6x
01-Feb-2019 MicroPact [Arlington Capital Partners] U.S. Tyler Technologies $185 2.6x -
28-Jan-2019 HelloSign U.S. Dropbox $230 19.2x -
28-Jan-2019 Management Systems Resources Canada Descartes Systems Group $250 - -
23-Jan-2019 TrendKite U.S. Cision $225 8.9x -
22-Jan-2019 Repay Holdings[Corsair Capital] U.S. Thunder Bridge Acquisition $600 4.6x -
22-Jan-2019 Prisma Medios de Pago Argentina Advent International $724 - -
22-Jan-2019 Rogue Wave Software [Audax Group] U.S. Perforce Software [Clearlake
Capital Group] $480 4.0x 9.6x
14-Jan-2019
QuickBase(Private placement)[Welsh, Carson, Anderson & Stowe]
U.S. Vista Equity Partners Management $1,100 8.8x 20.0x
07-Jan-2019 VaaS International Holdings U.S. Motorola Solutions $445 - -
Median 7.3x 58.8x
(1) Top M&A transactions on the basis of disclosed deal value in Q1’19.

©2019 KPMG Corporate Finance, a Delaware limited liability company. Member FINRA and SIPC. KPMG CorporateFinance is a subsidiary of KPMG LLP, a Delaware limited liability partnership and the U.S. member firm of the KPMGnetwork of independent member firms affiliated with KPMG International Cooperative (“KPMG International”), a Swiss entity.All rights reserved. NDPPS 640221
19
Global TMT Coverage TeamGlobal Coverage. Industry Knowledge. Middle-Market Focus.
The Corporate Finance practices of KPMG International’s network of independent member firms (KPMG) have been ranked collectively as the number one global mid-market advisor based on total deal volume announced from 2014 to 2018, according to Thomson Reuters SDC. KPMG firms operate in 155 countries with over 2,600 professionals who are able to meet the needs of clients across the globe.
Global
U.S. and Canada
Cyrus LamManaging DirectorNew York, U.S.T: +1-212-872-5540E: [email protected]
JP DittyManaging DirectorSanta Clara, U.S.T: +1-408-367-3826E: [email protected]
Mihir JobaliaManaging DirectorSanta Clara, U.S.T: +1-408-367-2850E: [email protected]
Neil C BlairManaging DirectorToronto, CanadaT: +1-416-777-8657E: [email protected]
Joseph RadeckiManaging DirectorChicago, U.S.T: +1-312-665-4401E: [email protected]
Roderick H MoonManaging DirectorNew York, U.S.T: +1-212-954-5834E: [email protected]
David R CreamerManaging DirectorSanta Clara, U.S.T: +1-408-367-5764E: [email protected]
Patrick CoadyPartnerOttawa, CanadaT: +1-613-212-2841E: [email protected]
Alexander M AldenManaging DirectorSan Francisco, U.S.T: +1-415-963-5511E: [email protected]
Hillel SchusterPartnerTel Aviv, IsraelT: +972-3-684-8000 E: [email protected]
Maurizio NitratiPartnerRome, ItalyT: +39-06-809-711E: [email protected]
Amir ShaniPrincipalTel Aviv, IsraelT: +972-3-684-8661E: [email protected]
Mark ZuidemaPartnerAmsterdam, NetherlandsT: +31-206-568-276E:[email protected]
Robert VartevanianPartnerMoscow, RussiaT: +7-495-937-4444 (x11777)E:[email protected]
Paolo MascarettiPartnerMilan, ItalyT: +39-02-676-431E: [email protected]
Khalid BakkaliPartnerAmsterdam, NetherlandsT: +31-206-567-507E: [email protected]
João Sousa LealPartnerLisbon, PortugalT: +351-210-110-049E: [email protected]
Michele ConnollyPartnerDublin, IrelandT: +35-314-101-546E: [email protected]
Maximilian Peter FianiPartnerMilan, ItalyT: +39-02-676-431E: [email protected]
Michael JiangPartnerBeijing, ChinaT: +86-108-508-7077E: [email protected]
Jayant KumaarPartnerNew Delhi, IndiaT: +91-124-334-5115E: [email protected]
Takeshi MoriyaPartnerTokyo, JapanT: +81-335-485-171E:[email protected]
Eric LauPartnerHong KongT: +85-229-132-576E: [email protected]
Sung-Won ParkPartnerSeoul, South KoreaT: +82-221-127-090E:[email protected]
Sumit PunwaniPartnerSingaporeT: +65-621-32-922E: [email protected]
Jesse C.S. ChenPartnerTaipei, TaiwanT: +886281016666 (x13372)E: [email protected]
Philip NgPartnerShenzhen, ChinaT: +86-755-254-73-308E: [email protected]
Takeo TakanashiPartnerTokyo, JapanT: +81-335-485-178E:[email protected]
Latin America
Luis MottaPartnerSão Paulo, BrazilT: +55-113-940-8314E: [email protected]
Saul VillaPartnerMexico City, MexicoT: +52-555-246-8449E: [email protected]
Jorn De NevePartnerBrussels, BelgiumT: +32-2-708-4778E: [email protected]
Eric Bots-BjerreDirectorCopenhagen, DenmarkT: +45-24-84-42-01E: [email protected]
Mark WyattPartnerParis, FranceT: +33-155-689-300E: [email protected]
Tom NymanPartnerHelsinki, FinlandT: +358-207-603-372E: [email protected]
Guillaume CauchoixPartnerParis, FranceT: +33-155-688-611E: [email protected]
Florian FreiPartnerFrankfurt/Main, Germany T: +49-699-587-2834 E: [email protected]
Harri RasanenPartnerHelsinki, FinlandT: +358-207-603-215E: [email protected]
EMEA
Asia Pacific
Nigel RousePartnerStockholm, SwedenT: +46-8-723-9706E: [email protected]
Bjorn HallinPartnerStockholm, SwedenT: +46-070-548-9626E: [email protected]
Brendan LarsenPartnerBrisbane, AustraliaT: +61-7-3233-9373E: [email protected]
Christian MayoPartnerLeeds, U.K.T: +44-113-231-3179E: [email protected]
David J ElmsPartnerLondon, U.K.T: +44-20-731-18568E: [email protected]
Peter TurnerPartnerMelbourne, AustraliaT: +61-3-9288-6022E: [email protected]
Eloy Serrano BufalaPartnerMadrid, SpainT: +34-91-456-3870E: [email protected]
Patrick KerlerPartnerZürich, SwitzerlandT: +41-58-249-42-02E: [email protected]
Graham PearceU.K. Head TMTLeeds, U.K.T: +44-113-231-3855E: [email protected]

©2019 KPMG Corporate Finance, a Delaware limited liability company. Member FINRA and SIPC. KPMG CorporateFinance is a subsidiary of KPMG LLP, a Delaware limited liability partnership and the U.S. member firm of the KPMGnetwork of independent member firms affiliated with KPMG International Cooperative (“KPMG International”), a Swiss entity.All rights reserved. NDPPS 640221
Important NoticeThe information contained herein is of a general nature and is not intended toaddress the circumstances of any particular individual or entity. Although weendeavor to provide accurate and timely information, there can be no guaranteethat such information is accurate as of the date it is received or that it will continueto be accurate in the future. No one should act upon such information withoutappropriate professional advice after a thorough examination of the particularsituation. The information contained in this communication may not berepresentative of the experience of other clients and does not constitute arecommendation, offer, or solicitation to buy, sell or hold any security of any issuer.Past performance does not guarantee future results.